LabView programming 練習 - 國立台灣大學...
69
1 Virtual Instrumentation With LabVIEW LabView programming 練習 工綜六樓計算機室電腦 LabView 8.0 (目前最新版Labview 2010) Interactive guide to LabView 請自行前往使用。
Transcript of LabView programming 練習 - 國立台灣大學...
1
Virtual Instrumentation With LabVIEW
LabView programming 練習
工綜六樓計算機室電腦
LabView 8.0 (目前最新版Labview 2010)
Interactive guide to LabView
請自行前往使用。

2
LabVIEW 試用
http://www.ni.com/trylabview/zht/
•下載試用版:
OR
‧網路導覽與試用:
OR•購買LabVIEW學生版
Course Goals
•Understand the components of a Virtual Instrument•Introduce LabVIEW and common LabVIEW functions•Build a simple data acquisition application•Create a subroutine in LabVIEW•Work with Arrays, Clusters, and Structures•Learn About Printing & Documentation Features•Develop in Basic Programming Architectures
3
Section I
Introduction to the Labview
Basic concepts and terms
Section I
•LabVIEW terms•Components of a LabVIEW application•LabVIEW programming tools•Creating an application in LabVIEW
4
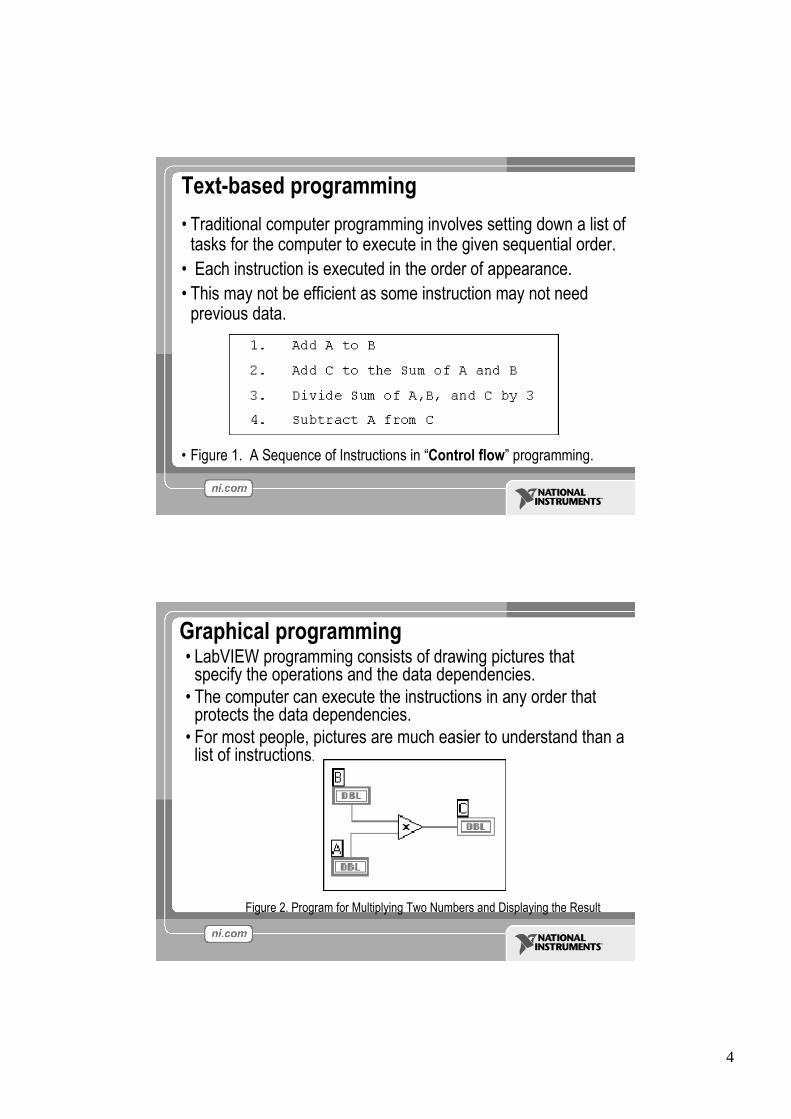
Text-based programming
•Traditional computer programming involves setting down a list oftasks for the computer to execute in the given sequential order.
•Each instruction is executed in the order of appearance.•This may not be efficient as some instruction may not need
previous data.
•Figure 1. A Sequence of Instructions in “Control flow”programming.
Graphical programming•LabVIEW programming consists of drawing pictures that
specify the operations and the data dependencies.•The computer can execute the instructions in any order that
protects the data dependencies.•For most people, pictures are much easier to understand than a
list of instructions.
Figure 2. Program for Multiplying Two Numbers and Displaying the Result
5
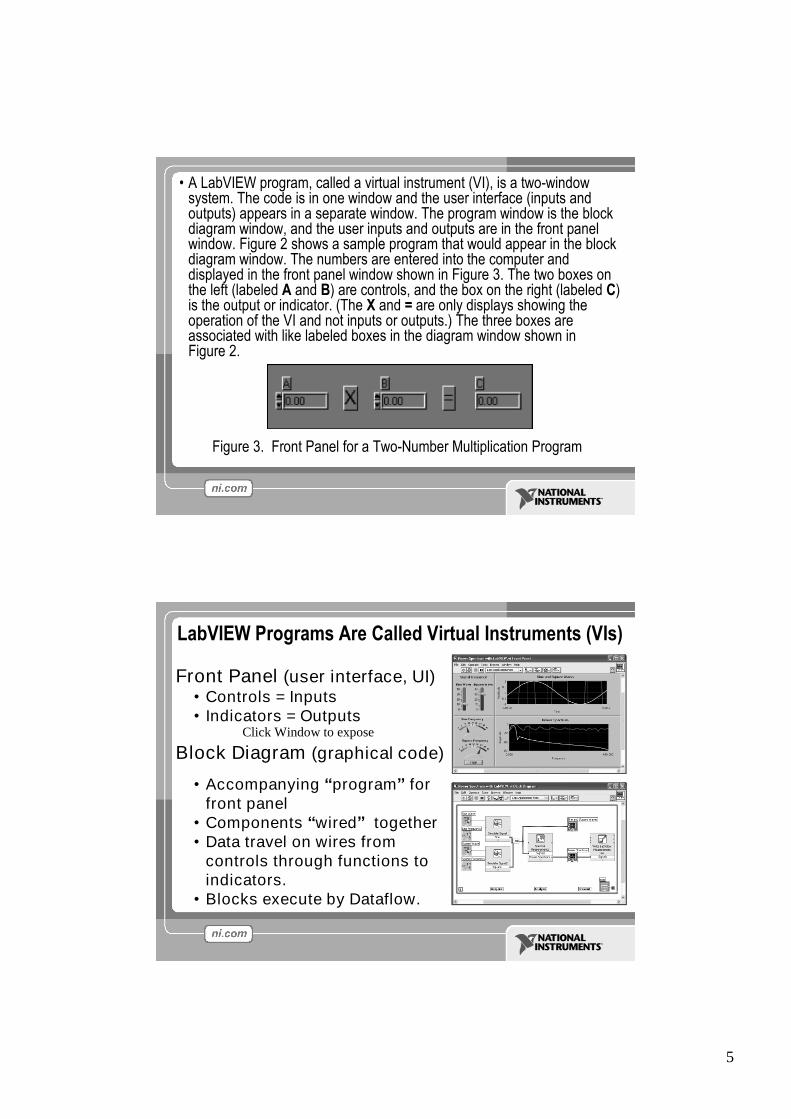
•A LabVIEW program, called a virtual instrument (VI), is a two-windowsystem. The code is in one window and the user interface (inputs andoutputs) appears in a separate window. The program window is the blockdiagram window, and the user inputs and outputs are in the front panelwindow. Figure 2 shows a sample program that would appear in the blockdiagram window. The numbers are entered into the computer anddisplayed in the front panel window shown in Figure 3. The two boxes onthe left (labeled A and B) are controls, and the box on the right (labeled C)is the output or indicator. (The X and = are only displays showing theoperation of the VI and not inputs or outputs.) The three boxes areassociated with like labeled boxes in the diagram window shown inFigure 2.
Figure 3. Front Panel for a Two-Number Multiplication Program
Front Panel (user interface, UI)•Controls = Inputs•Indicators = Outputs
Block Diagram (graphical code)
•Accompanying “program”forfront panel
•Components “wired”together•Data travel on wires from
controls through functions toindicators.
•Blocks execute by Dataflow.
LabVIEW Programs Are Called Virtual Instruments (VIs)
Click Window to expose
6
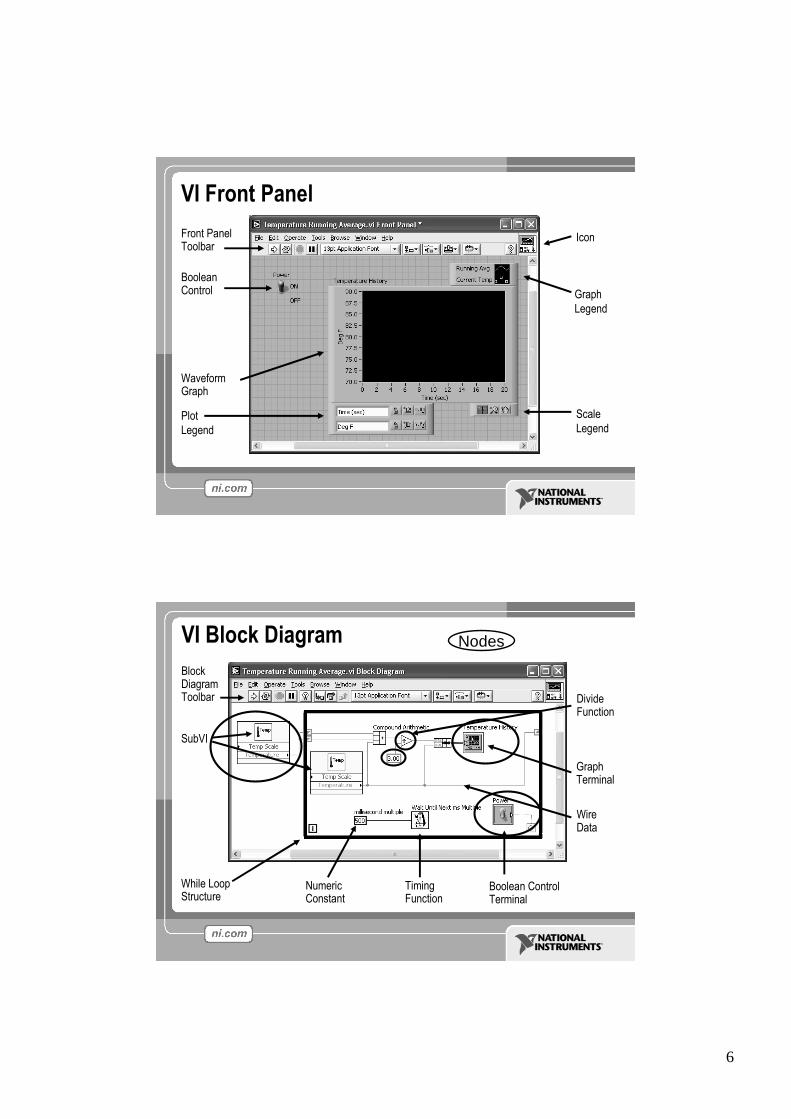
VI Front PanelFront PanelToolbar
GraphLegend
BooleanControl
WaveformGraph
Icon
PlotLegend
ScaleLegend
VI Block Diagram
WireData
GraphTerminal
SubVI
While LoopStructure
BlockDiagramToolbar Divide
Function
NumericConstant
TimingFunction
Boolean ControlTerminal
Nodes

7
VI Block Diagram
WireData
GraphTerminal
SubVI
While LoopStructure
BlockDiagramToolbar Divide
Function
NumericConstant
TimingFunction
Boolean ControlTerminal
wires
Connection lines represent data types

8
Data types
VI Block Diagram Terminals: links between blockdiagram and the front panel
Indicatorterminals
Controlterminals
9
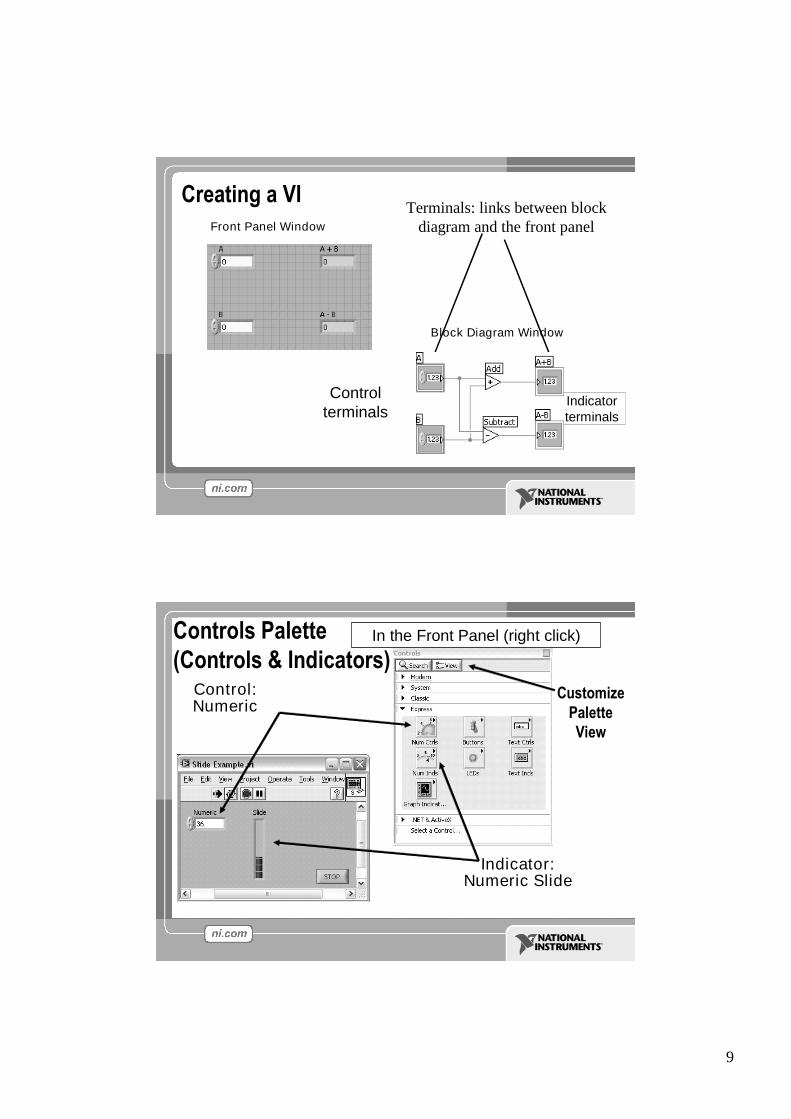
Block Diagram Window
Front Panel Window
Creating a VITerminals: links between block
diagram and the front panel
Indicatorterminals
Controlterminals
Controls Palette(Controls & Indicators)
(Place items on the Front Panel Window)
Indicator:Numeric Slide
Control:Numeric
CustomizePaletteView
In the Front Panel (right click)
10
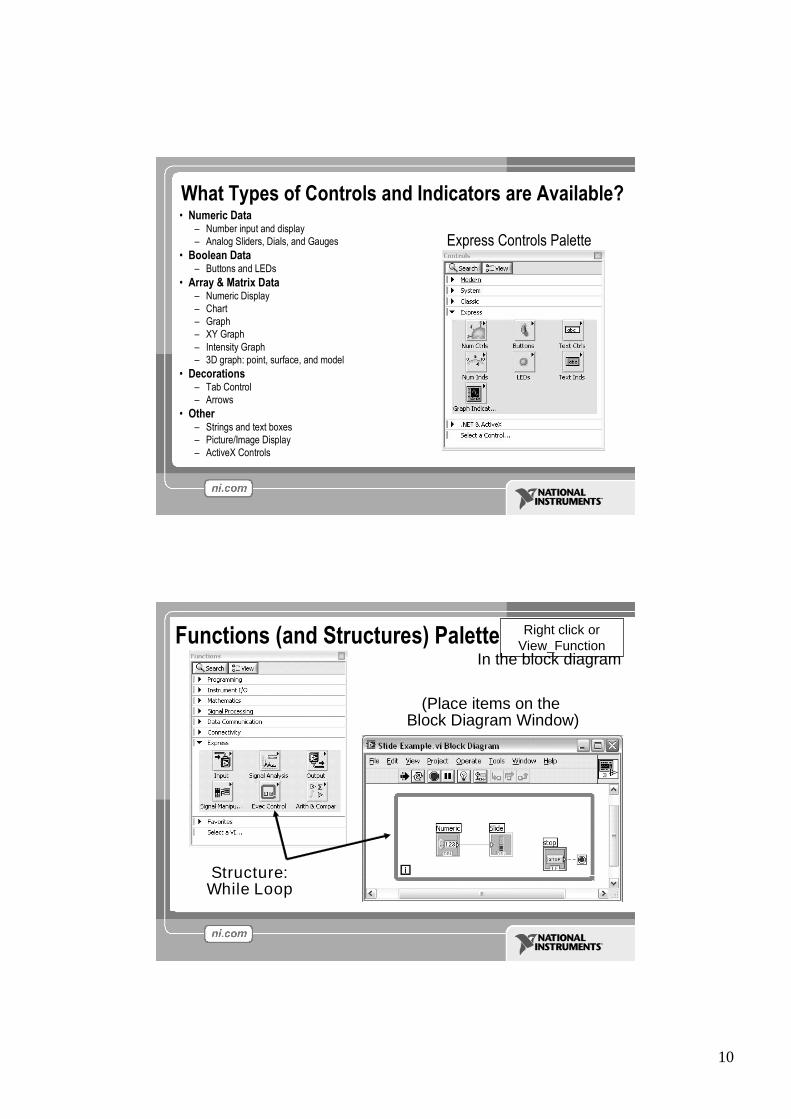
What Types of Controls and Indicators are Available?•Numeric Data
–Number input and display–Analog Sliders, Dials, and Gauges
•Boolean Data–Buttons and LEDs
•Array & Matrix Data–Numeric Display–Chart–Graph–XY Graph– Intensity Graph–3D graph: point, surface, and model
•Decorations–Tab Control–Arrows
•Other–Strings and text boxes–Picture/Image Display–ActiveX Controls
Express Controls Palette
Functions (and Structures) Palette
(Place items on theBlock Diagram Window)
Structure:While Loop
In the block diagram
Right click orView_Function
11
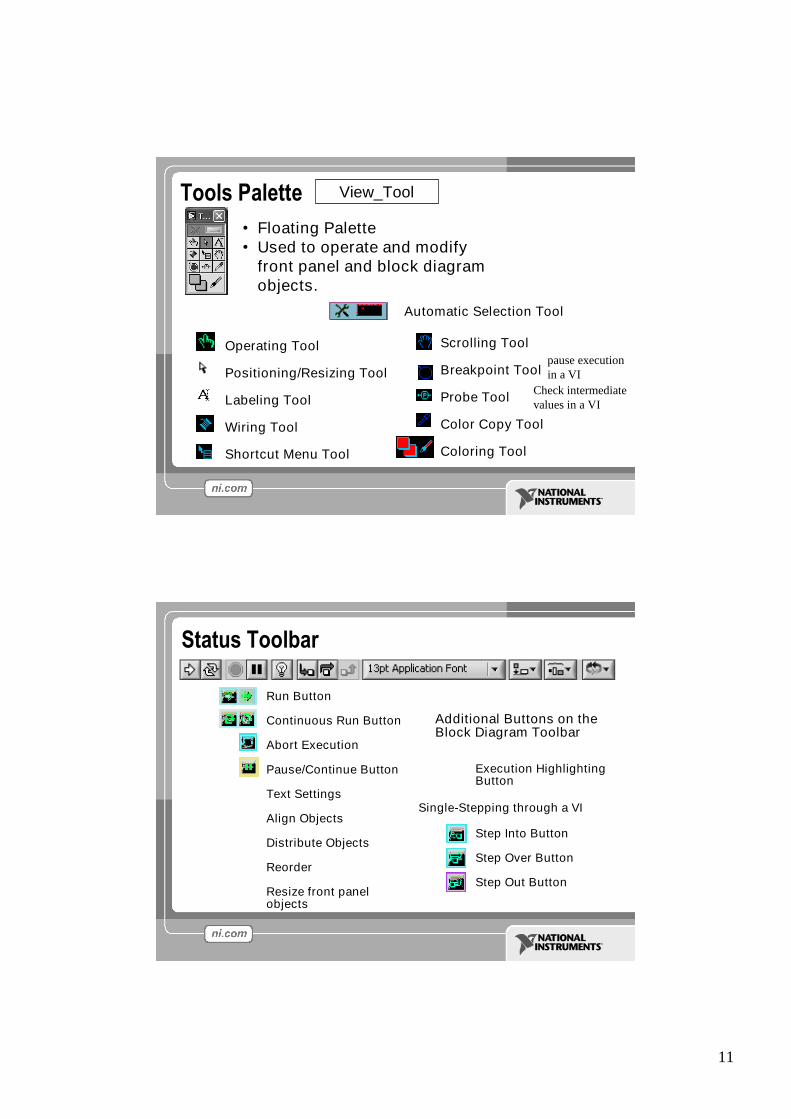
Operating Tool
Positioning/Resizing Tool
Labeling Tool
Wiring Tool
Shortcut Menu Tool
•Floating Palette•Used to operate and modify
front panel and block diagramobjects.
Scrolling Tool
Breakpoint Tool
Probe Tool
Color Copy Tool
Coloring Tool
Tools Palette
Automatic Selection Tool
View_Tool
pause executionin a VI
Check intermediatevalues in a VI
Run Button
Continuous Run Button
Abort Execution
Pause/Continue Button
Text Settings
Align Objects
Distribute Objects
Reorder
Resize front panelobjects
Additional Buttons on theBlock Diagram Toolbar
Status Toolbar
Step Into Button
Step Over Button
Step Out Button
Execution HighlightingButton
Single-Stepping through a VI
12
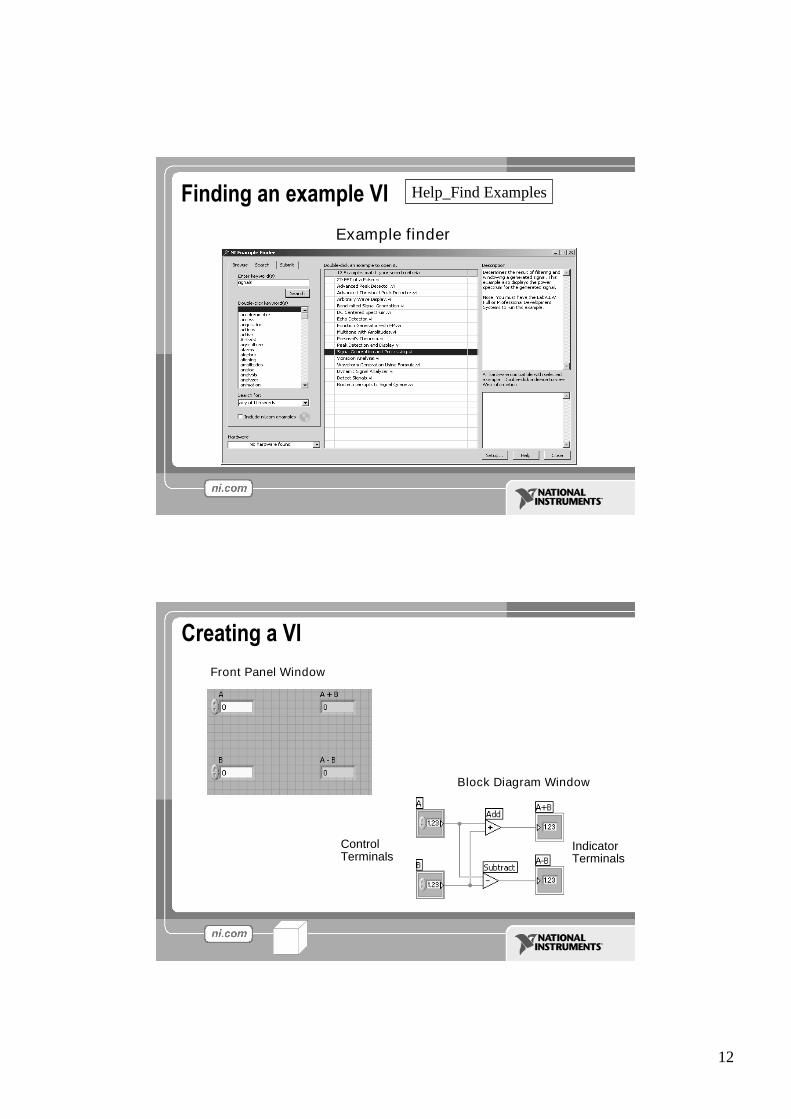
Finding an example VI
Example finder
Help_Find Examples
ControlTerminals
Block Diagram Window
Front Panel Window
IndicatorTerminals
Creating a VI

13
Creating a VI –Block Diagram
Wiring Tips –Block DiagramWiring “Hot Spot”
Clean Up WiringUse AutomaticWire Routing
Click To Select Wires
14
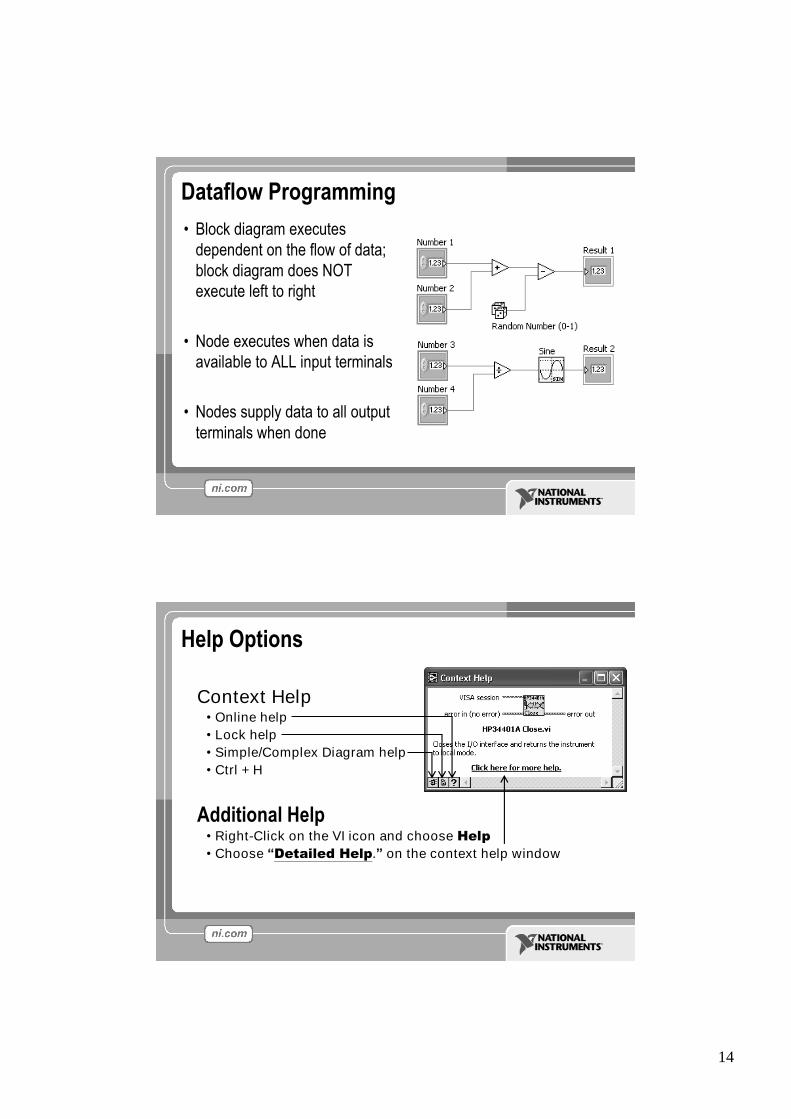
•Block diagram executesdependent on the flow of data;block diagram does NOTexecute left to right
•Node executes when data isavailable to ALL input terminals
•Nodes supply data to all outputterminals when done
Dataflow Programming
Help Options
Context Help•Online help•Lock help•Simple/Complex Diagram help•Ctrl + H
Additional Help•Right-Click on the VI icon and choose Help•Choose “Detailed Help.”on the context help window

15
Exercise 1 - Convert °C to °F
1
Debugging Techniques•Finding Errors
•Execution Highlighting
•Probe
Click on broken Run buttonWindow showing error appears
Click on Execution Highlighting button; dataflow is animated using bubbles. Values aredisplayed on wires.
Right-click on wire to display probe and itshows data as it flows through wire segment
You can also select Probe tool from Toolspalette and click on wire
16
Section IISub VI
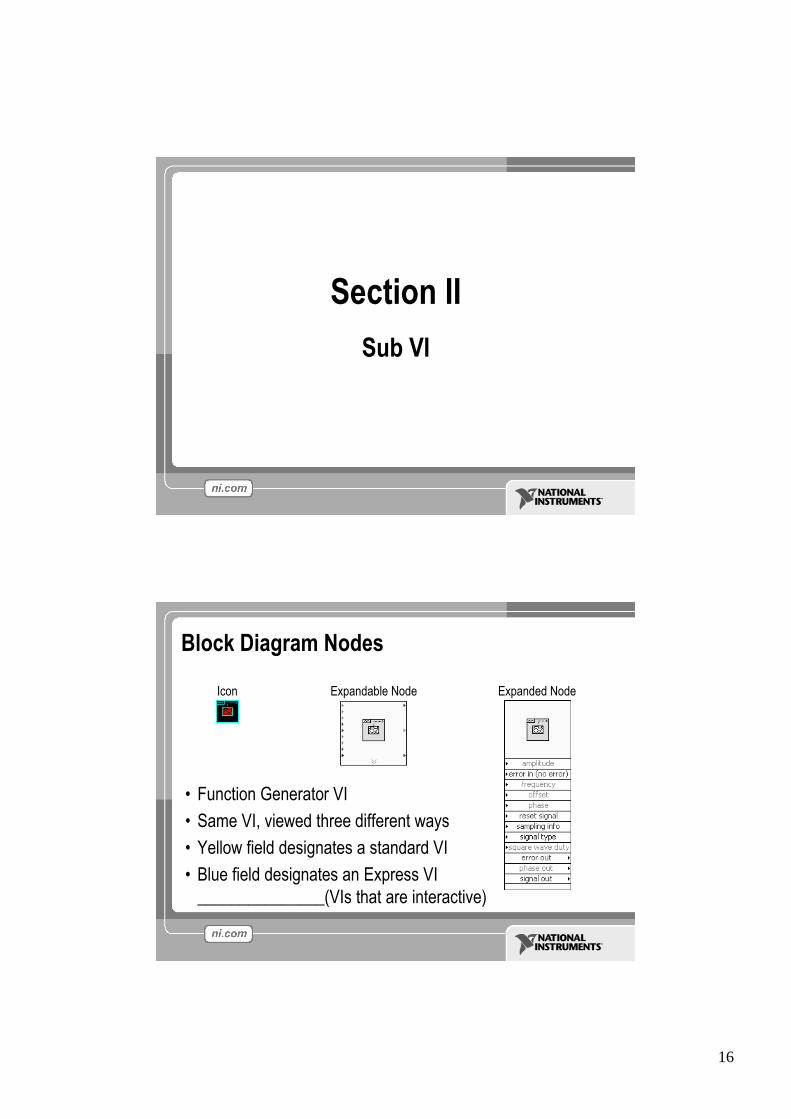
Block Diagram Nodes
Icon Expandable Node Expanded Node
•Function Generator VI•Same VI, viewed three different ways•Yellow field designates a standard VI•Blue field designates an Express VI
_______________(VIs that are interactive)

17
Section II –SubVIs
•What is a subVI?•Making an icon and
connector for a subVI•Using a VI as a subVI
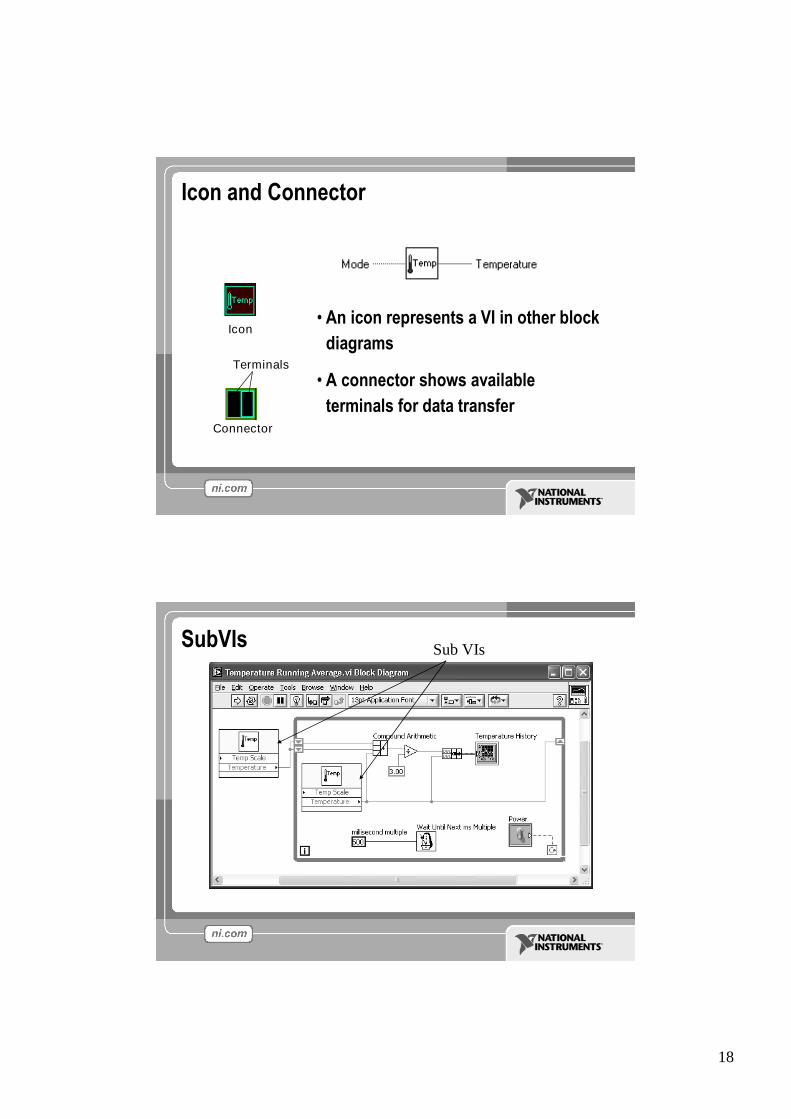
SubVIs•A SubVI is a VI that can be used within another VI•Similar to a subroutine•Advantages–Modular–Easier to debug–Don’t have to recreate code–Require less memory
18
Icon and Connector
•An icon represents a VI in other blockdiagrams
•A connector shows availableterminals for data transfer
Icon
Connector
Terminals
SubVIs Sub VIs

19
Steps to Create a SubVI
•Create the Icon•Create the Connector•Assign Terminals•Save the VI•Insert the VI into a Top Level VI
2
Create the Icon
•Right-click on the icon in theblock diagram or front panel
20
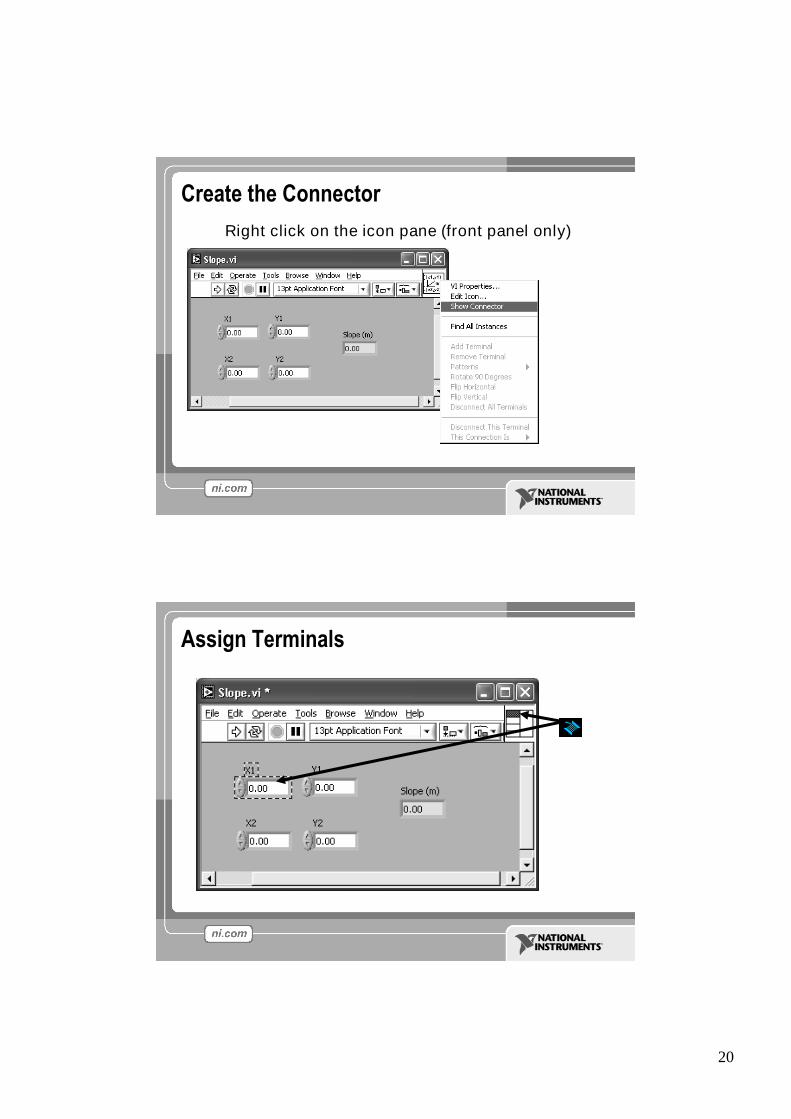
Create the ConnectorRight click on the icon pane (front panel only)
Assign Terminals
21
Save The VI
•Choose an Easy to Remember Location•Organize by Functionality–Save Similar VIs into one directory (e.g. Math Utilities)
•Organize by Application–Save all VIs Used for a Specific Application into one
directory or library file (e.g. Lab 1 –Frequency Response)•Library Files (.llbs) combine many VI’s into a single file, ideal for
transferring entire applications across computers
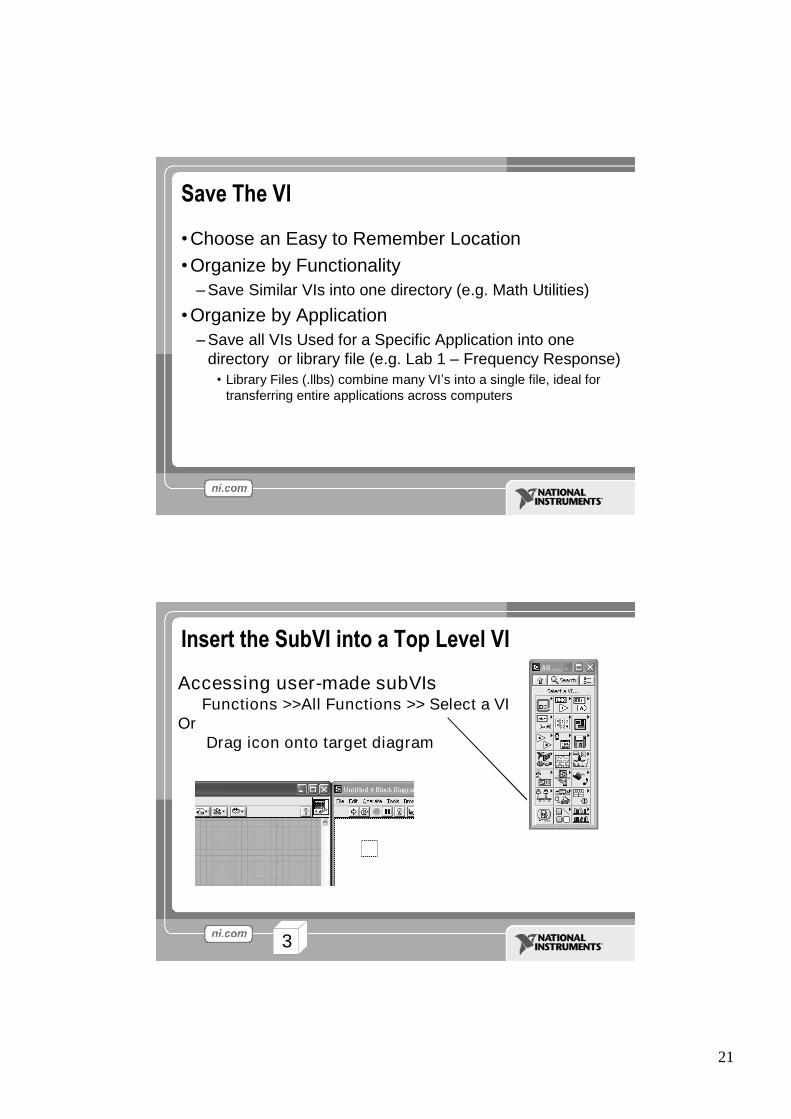
Insert the SubVI into a Top Level VI
Accessing user-made subVIsFunctions >>All Functions >> Select a VI
OrDrag icon onto target diagram
3

22
Tips for Working in LabVIEW
•Keystroke Shortcuts–<Ctrl-H> –Activate/Deactivate Context Help Window–<Ctrl-B> –Remove Broken Wires From Block Diagram–<Ctrl-E> –Toggle Between Front Panel and Block
Diagram–<Ctrl-Z> –Undo (Also in Edit Menu)
•Tools » Options…–Set Preferences in LabVIEW•VI Properties –Configure VI Appearance,Documentation, etc.
Section IIILoops and Charts
23
Section III –Loops and Charts
•While Loop•For Loop•Charts•Multiplots
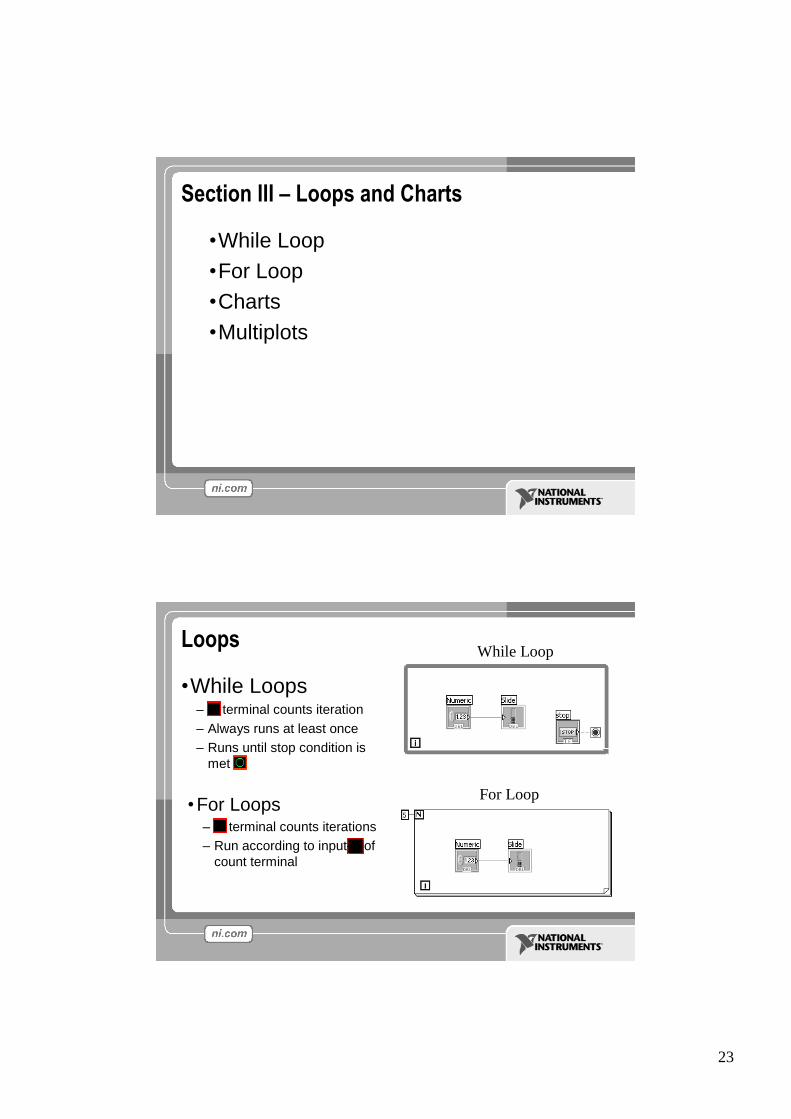
Loops
•While Loops–i terminal counts iteration–Always runs at least once–Runs until stop condition is
met
•For Loops–i terminal counts iterations–Run according to input N of
count terminal
While Loop
For Loop

24
Drawing a Loop1. Select the loop structure
2. Enclose code to be repeated
3. Drop or drag additional nodes and then wireDrawing a Loop
4
3 Types of Functions (from the Functions Palette)Express VIs, VIs and Functions
Express VIs: interactive VIs with configurable dialog page (blue border)

25
3 Types of Functions (from the Functions Palette)Express VIs, VIs and Functions
Standard VIs: consisting of a front panel and a block diagrammodularized VIs customized by wiring (customizable)
3 Types of Functions (from the Functions Palette)Express VIs, VIs and Functions
Functions: fundamental operating elements of LabVIEW; no front panel orblock diagram (yellow)

26
What Types of Functions are Available?•Input and Output
–Signal and Data Simulation–Acquire and Generate Real Signals with DAQ–Instrument I/O Assistant (Serial & GPIB)–ActiveX for communication with other programs
•Analysis–Signal Processing–Statistics–Advanced Math and Formulas–Continuous Time Solver
•Storage–File I/O
Express Functions Palette
Searching for Controls, VIs, and Functions
•Palettes are filled with hundredsof VIs
•Press the search button to index theall VIs for text searching
•Click and drag an item from thesearch window to the block diagram
•Double-click an item to open theowning palette

27
Shift Registers in Loops
Use shift registers with For Loops and While Loopsto transfer values from one loop iteration to thenext. Shift registers are similar to static variables intext-based programming languages.
right click on loop borderAdd Shift register
5
Charts
Waveform chart•special numeric indicator that
can display a history of values•Chart updates with each
individual point it receivesFront panel»Functions»Express»Graph
Indicators»Chart

28
Wiring Data into Charts
Single Plot Charts Multiplot Charts
Signal manipul. inExpress/functiion
Exercise 3 –Using Charts
6 7

29
Section IVArrays and File I/O
Section IV –Arrays & File I/O•Build arrays manually•Have LabVIEW build arrays automatically•Write to a spreadsheet file•Read from a spreadsheet file

30
Creating an Array (Step 1 of 2)From the Controls»Modern»Array, Matrix, andCluster subpalette, select the Array icon.
Drop it on the Front Panel.
Create an Array (Step 2 of 2)1. Place an Array Shell.2. Insert datatype into the shell (e.g. Numeric Control).

31
Creating an Array with a Loop•Loops accumulate arrays at their boundaries•Pulling a wire through a loop boundary creates an input tunnel
While Loop default no autoindexingFor Loop default with autoindexing
8
Creating 2D Arrays
9 9-1

32
File I/O
•File I/O –Allows recording or reading data in a file.
•LabVIEW creates or uses the following file formats:
–Binary: underlying file format of all other fileformats
–ASCII: regular text files
–LVM: LabVIEW measurement data file
–TDM: created for National Instruments products
High Level File I/O Functions
•Easy to use•High Level of abstraction
Writing to LVM file Reading from LVM file

33
Write LabVIEW Measurement File•Includes the open, write, close and error handling functions•Handles formatting the string with either a tab or comma
delimiter•Merge Signals function is used to combine data into the
dynamic data type
10
File I/O Programming Model –Under the hood
Open/Create/
Replace File
Readand/or
Write to File
CloseFile
Check forErrors

34
Spreadsheet Formatting
•Spreadsheet files are ASCII files with a certainformatting–Usually tabs between columns and end of line constants
between rows–LabVIEW includes VIs that perform this formatting or a string
can be concatenated
10-1
Section VArray Functions & Graphs
35
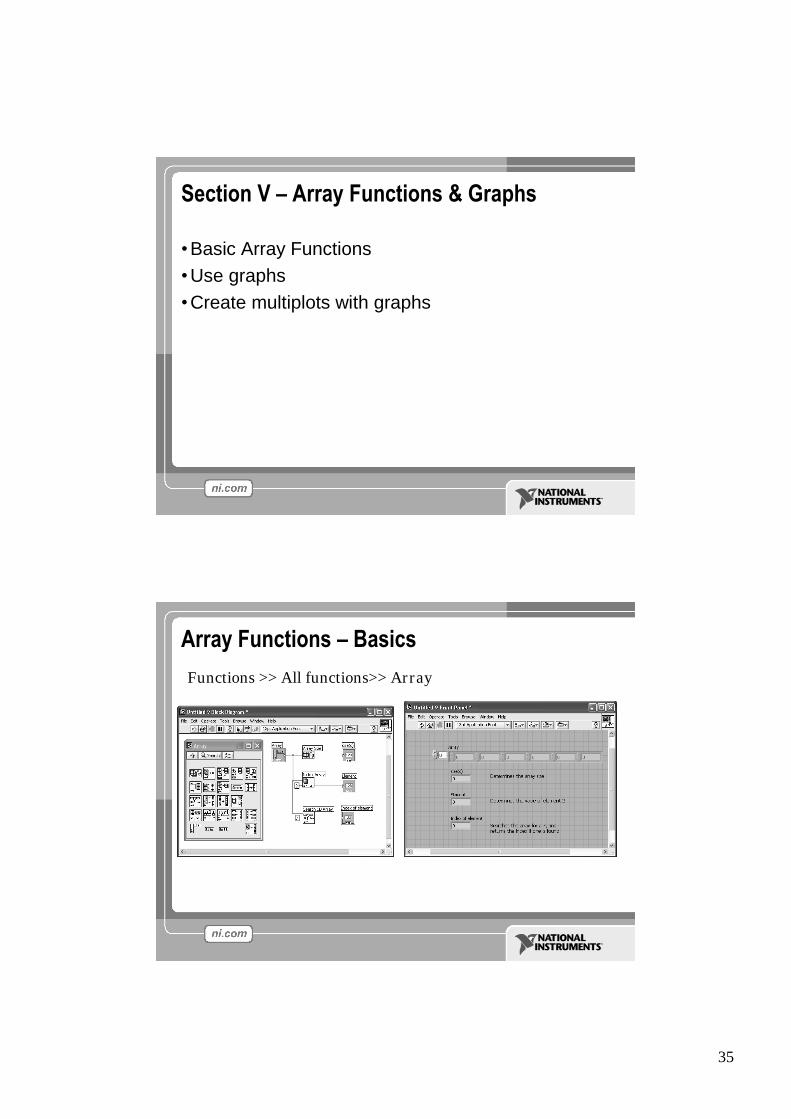
Section V –Array Functions & Graphs
•Basic Array Functions•Use graphs•Create multiplots with graphs
Array Functions –BasicsFunctions >> All functions>> Array
36
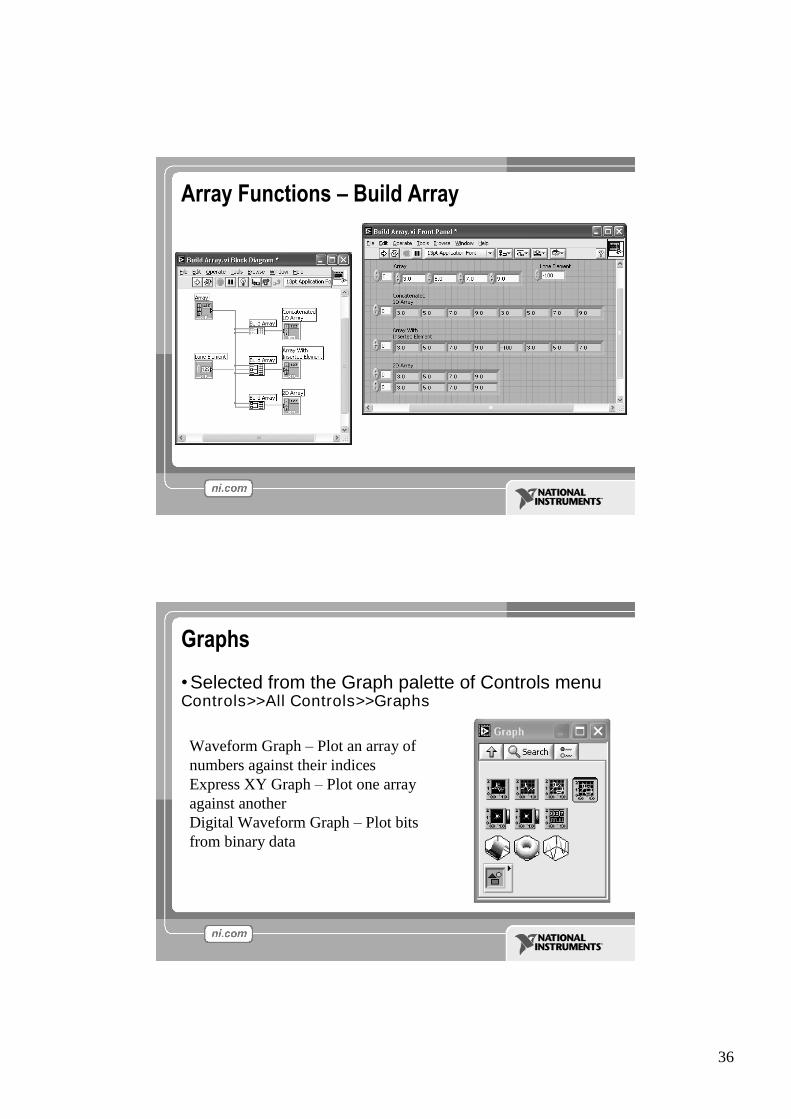
Array Functions –Build Array
Graphs
•Selected from the Graph palette of Controls menuControls>>All Controls>>Graphs
Waveform Graph –Plot an array ofnumbers against their indicesExpress XY Graph –Plot one arrayagainst anotherDigital Waveform Graph –Plot bitsfrom binary data
37
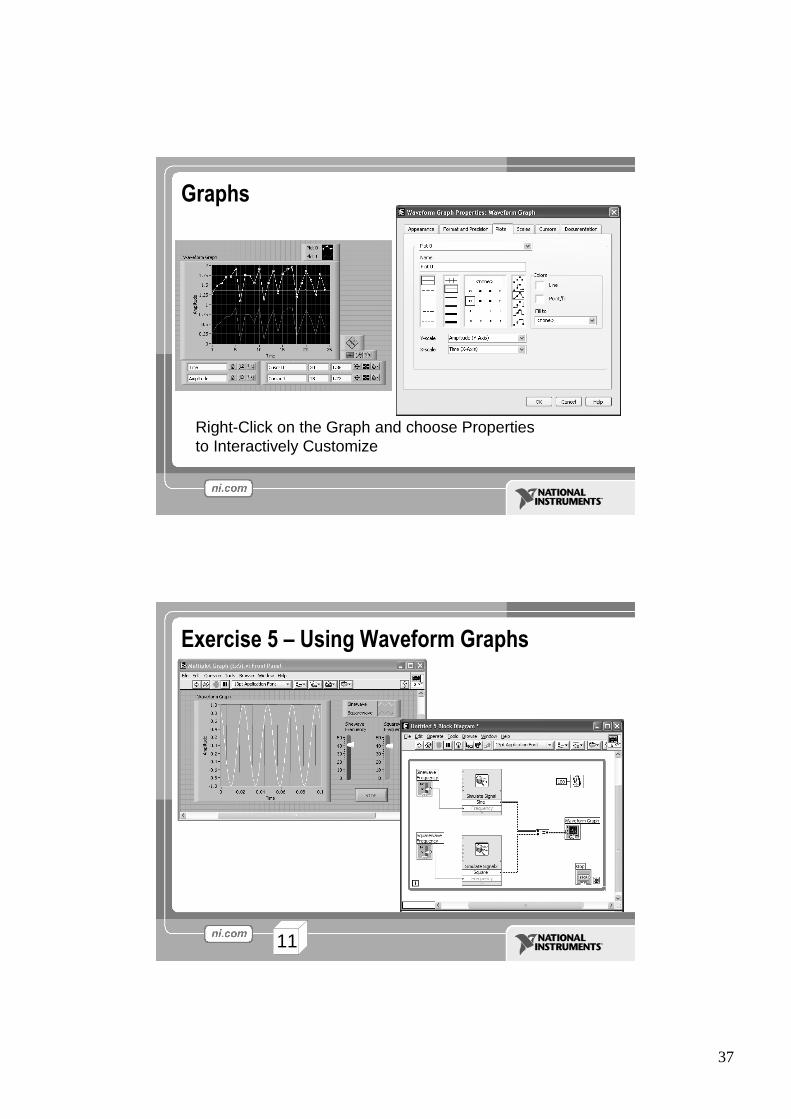
Graphs
Right-Click on the Graph and choose Propertiesto Interactively Customize
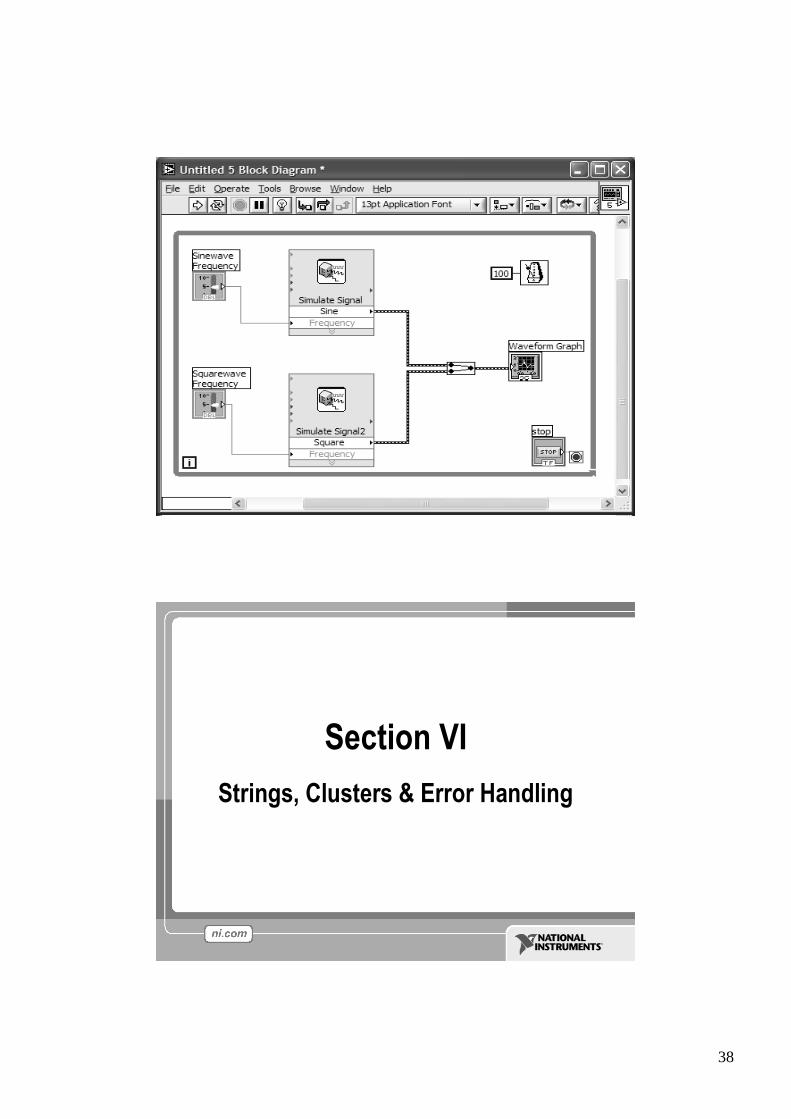
Exercise 5 –Using Waveform Graphs
11
38
Section VIStrings, Clusters & Error Handling

39
Section VI –Strings, Clusters, & Error Handling
•Strings•Creating Clusters•Cluster Functions•Error I/O
Strings
•A string is a sequence of displayable or nondisplayablecharacters (ASCII)
•Many uses –displaying messages, instrument control, fileI/O
•String control/indicator is in the Controls »Text Control orText Indicator

40
Clusters
•Data structure that groups data together
•Data may be of different types
•Analogous to struct in C
•Elements must be either all controls or all indicators
•Thought of as wires bundled into a cable
Creating a Cluster
1. Select a Cluster shell
Controls >> All Controls >> Array & Cluster
2. Place objects inside the shell
41
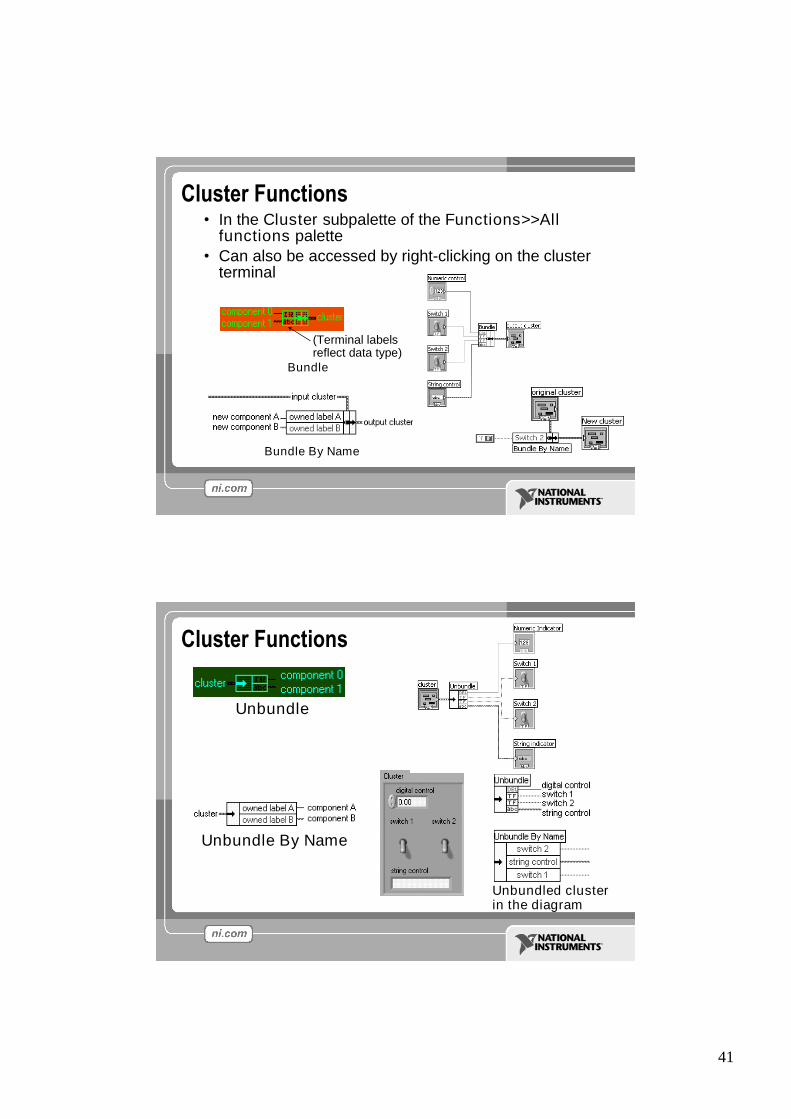
Cluster Functions•In the Cluster subpalette of the Functions>>All
functions palette•Can also be accessed by right-clicking on the cluster
terminal
Bundle
(Terminal labelsreflect data type)
Bundle By Name
Cluster Functions
Unbundle
Unbundle By Name
Unbundled clusterin the diagram
42
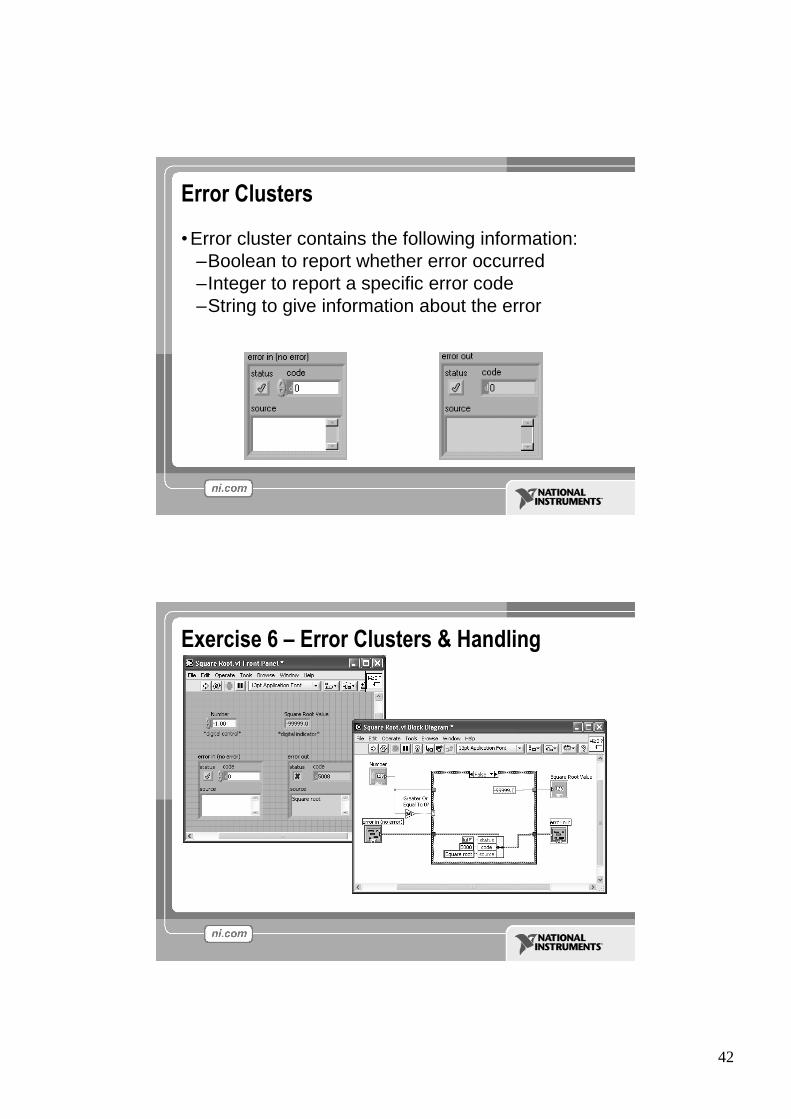
Error Clusters
•Error cluster contains the following information:–Boolean to report whether error occurred–Integer to report a specific error code–String to give information about the error
Exercise 6 –Error Clusters & Handling

43
Error Handling Techniques
•Error information is passed from one subVI to the next•If an error occurs in one subVI, all subsequent subVIs are
not executed in the usual manner•Error Clusters contain all error conditions•Automatic Error Handling
error clusters
Section VIICase & Sequence Structure
Formula Nodes

44
How Do I Make Decisions in LabVIEW?1. Case Structures (/Programming/Structure)
2. Select(/Programming/comparison)(a) (b)
(c)
Case Structures•In the Structures subpalette of Functions palette•Enclose nodes or drag them inside the structure•Stacked like a deck of cards, only one case visible
Functions >> Execution control
45
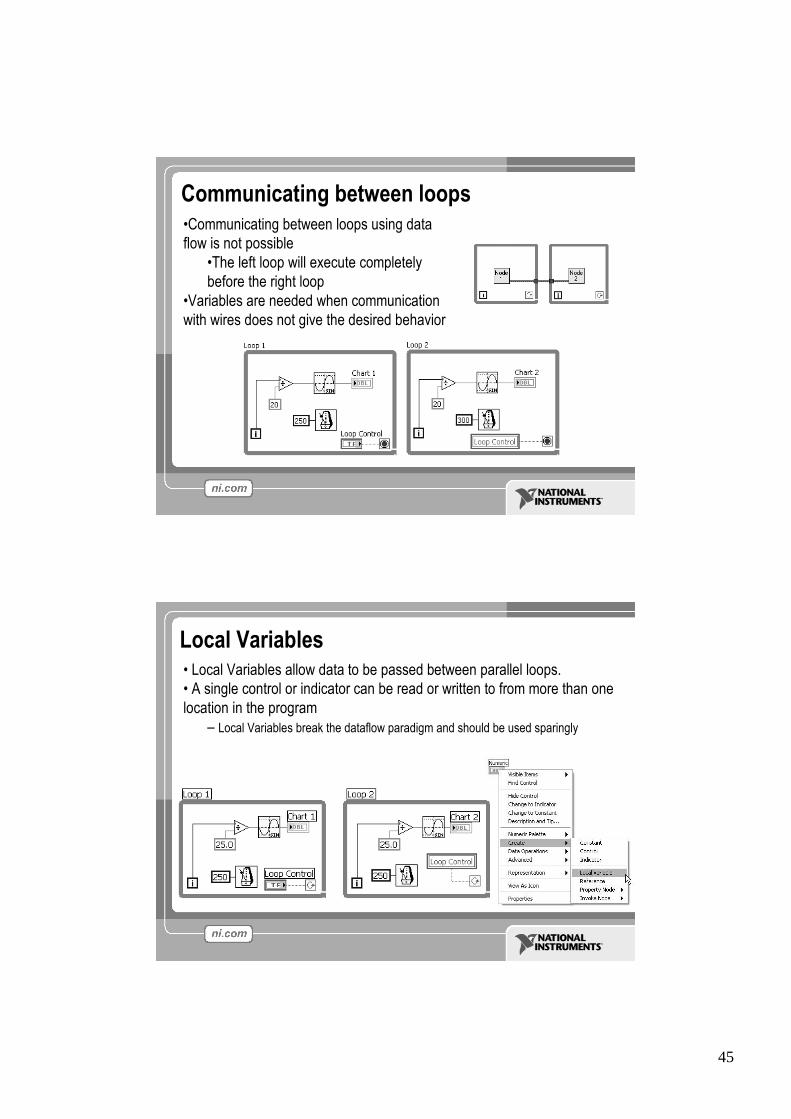
Communicating between loops•Communicating between loops using dataflow is not possible
•The left loop will execute completelybefore the right loop
•Variables are needed when communicationwith wires does not give the desired behavior
Local Variables•Local Variables allow data to be passed between parallel loops.•A single control or indicator can be read or written to from more than onelocation in the program
–Local Variables break the dataflow paradigm and should be used sparingly

46
Sequence Structures
•In the Execution Control subpalette of Functions palette•Executes diagrams sequentially•Right-click to add new frame
Formula Nodes•In the Structures subpalette•Implement complicated equations•Variables created at border by “add input”or “add output”•every assigned variable (left of equation) must have an output
terminal on the formula node.•Variable names are case sensitive•Each statement must terminate with a semicolon (;)
Note semicolon
47
Section VIIIPrinting & Documentation
Section VIII –Printing & Documentation
•Print From File Menu to Printer, HTML, Rich Text File•Programmatically Print Graphs or Front Panel Images•Document VIs in VI Properties » Documentation Dialog•Add Comments Using Free Labels on Front Panel &Block Diagram
48
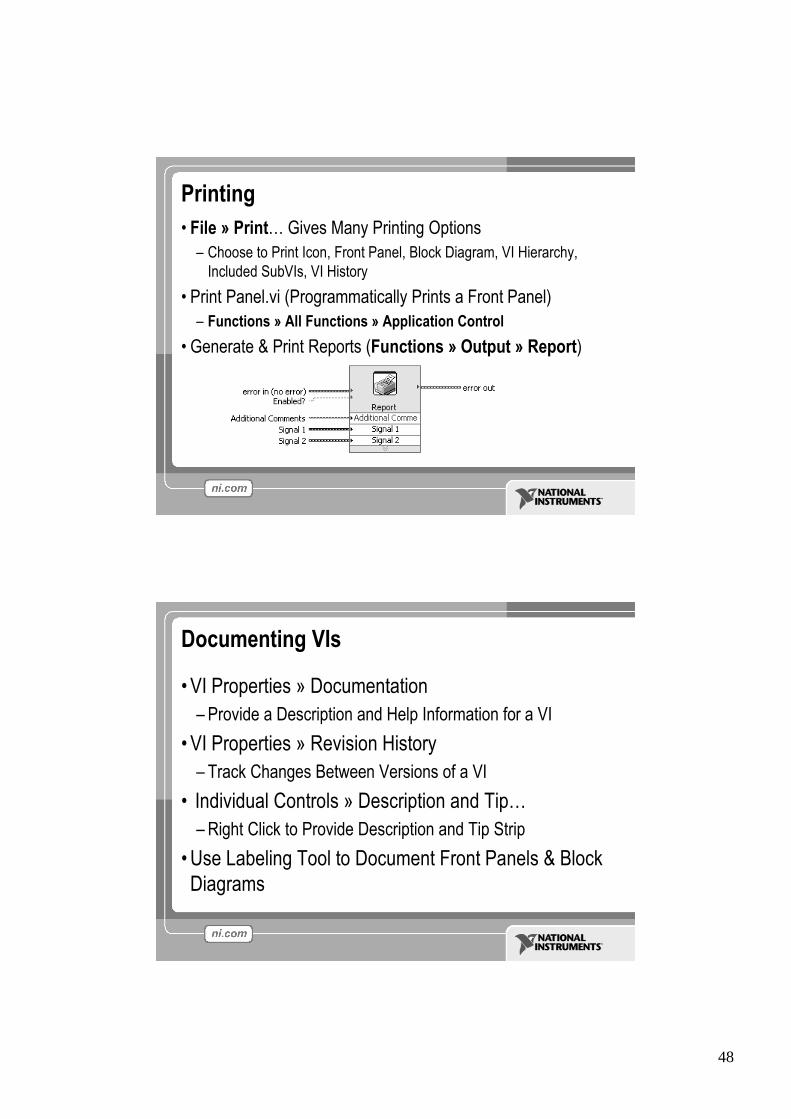
Printing•File » Print…Gives Many Printing Options–Choose to Print Icon, Front Panel, Block Diagram, VI Hierarchy,
Included SubVIs, VI History
•Print Panel.vi (Programmatically Prints a Front Panel)–Functions » All Functions » Application Control
•Generate & Print Reports (Functions » Output » Report)
Documenting VIs
•VI Properties » Documentation–Provide a Description and Help Information for a VI
•VI Properties » Revision History–Track Changes Between Versions of a VI
•Individual Controls » Description and Tip…–Right Click to Provide Description and Tip Strip
•Use Labeling Tool to Document Front Panels & BlockDiagrams
49
Section IXBasic Programming Architecture
Section IX –Basic Programming Architecture
•Simple VI Architecture•General VI Architecture•State Machine Architecture
50
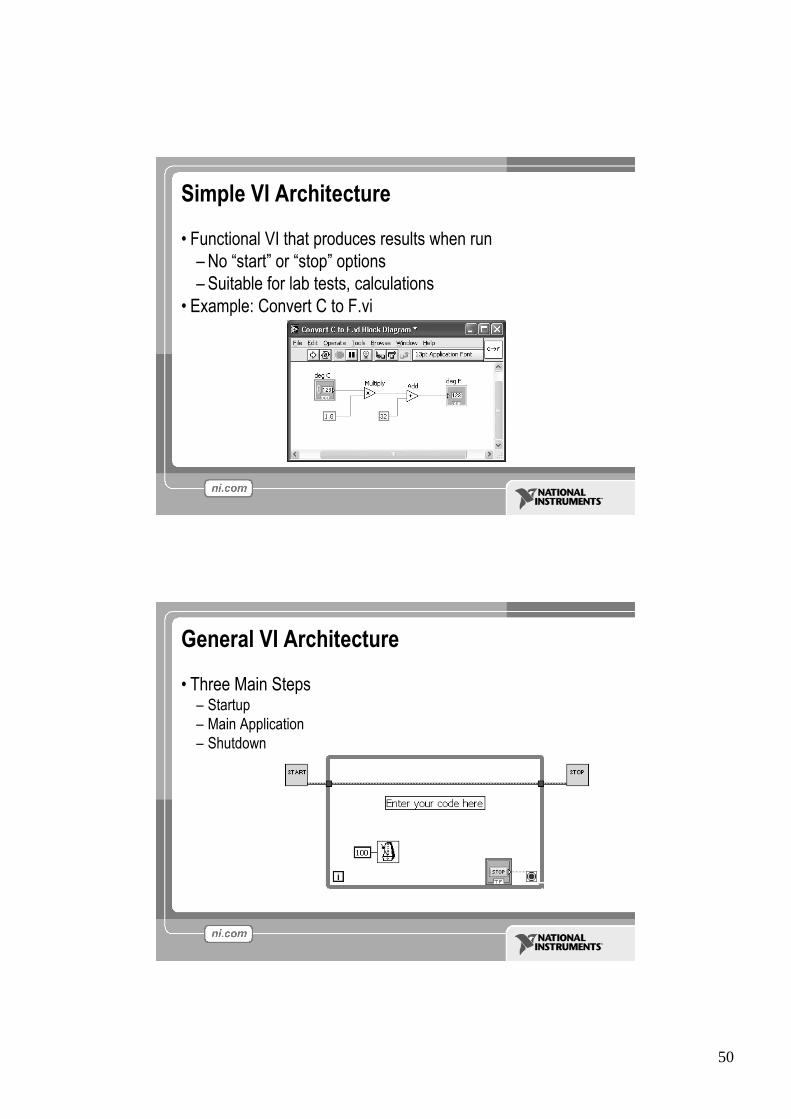
Simple VI Architecture
•Functional VI that produces results when run–No “start”or “stop”options–Suitable for lab tests, calculations
•Example: Convert C to F.vi
General VI Architecture
•Three Main Steps–Startup–Main Application–Shutdown

51
State Machine Architecture
•Advantages–Can go from any state from any other–Easy to modify and debug
•Disadvantages–Can lose events if two occur at the
same time
States:0: Startup1: Idle2: Event 13: Event 24: Shutdown
Exercise 7 –Simple State Machine

52
Section XData Acquisition
Measuring with your computerAnalog and Digital
53
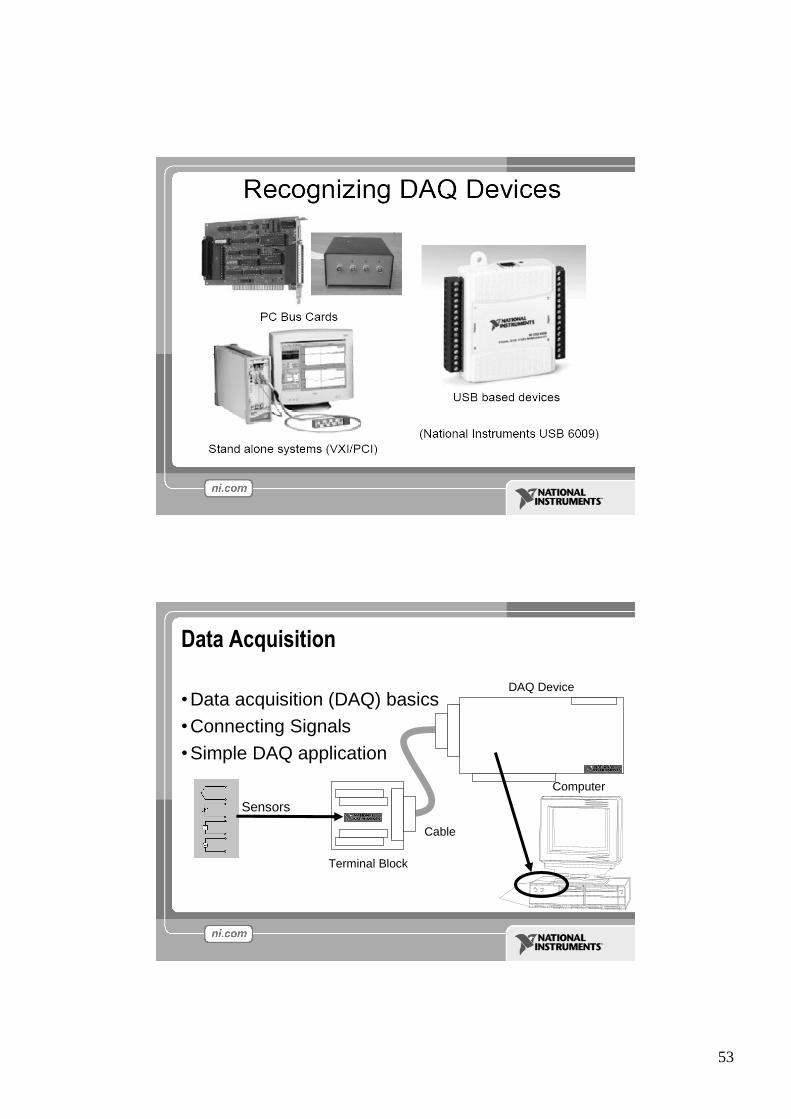
Data Acquisition
•Data acquisition (DAQ) basics•Connecting Signals•Simple DAQ application
Computer
DAQ Device
Terminal Block
Cable
Sensors
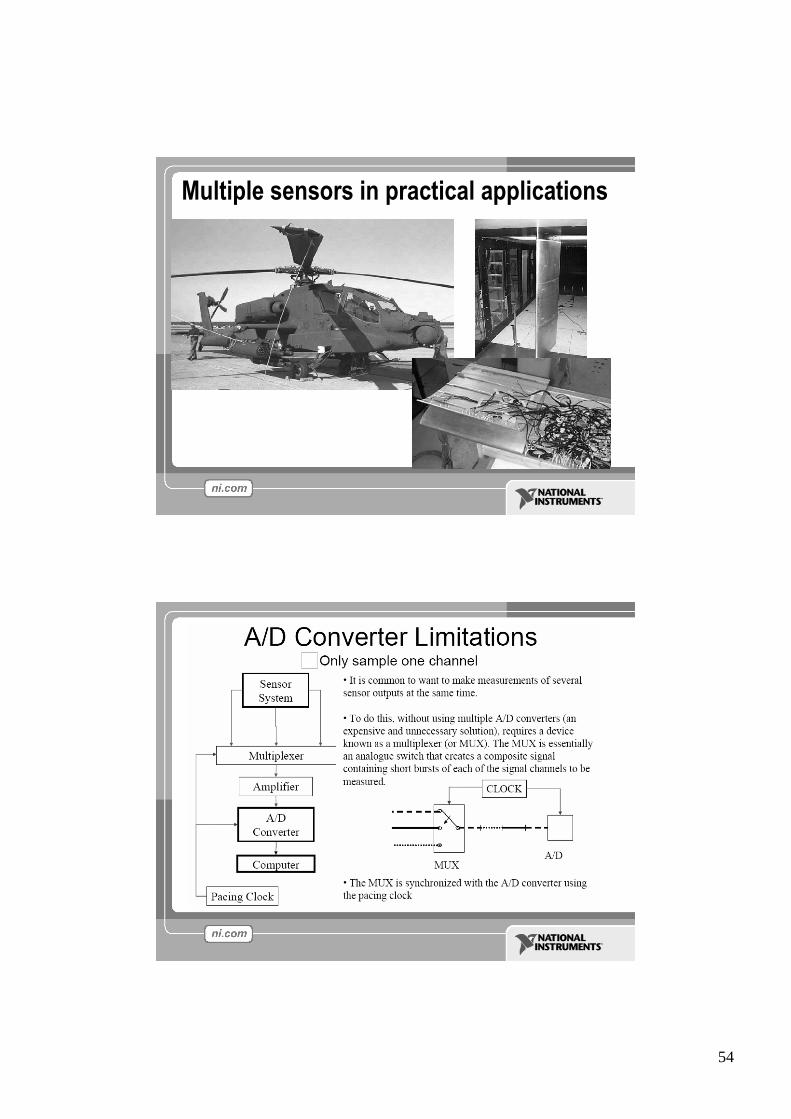
54
Multiple sensors in practical applications
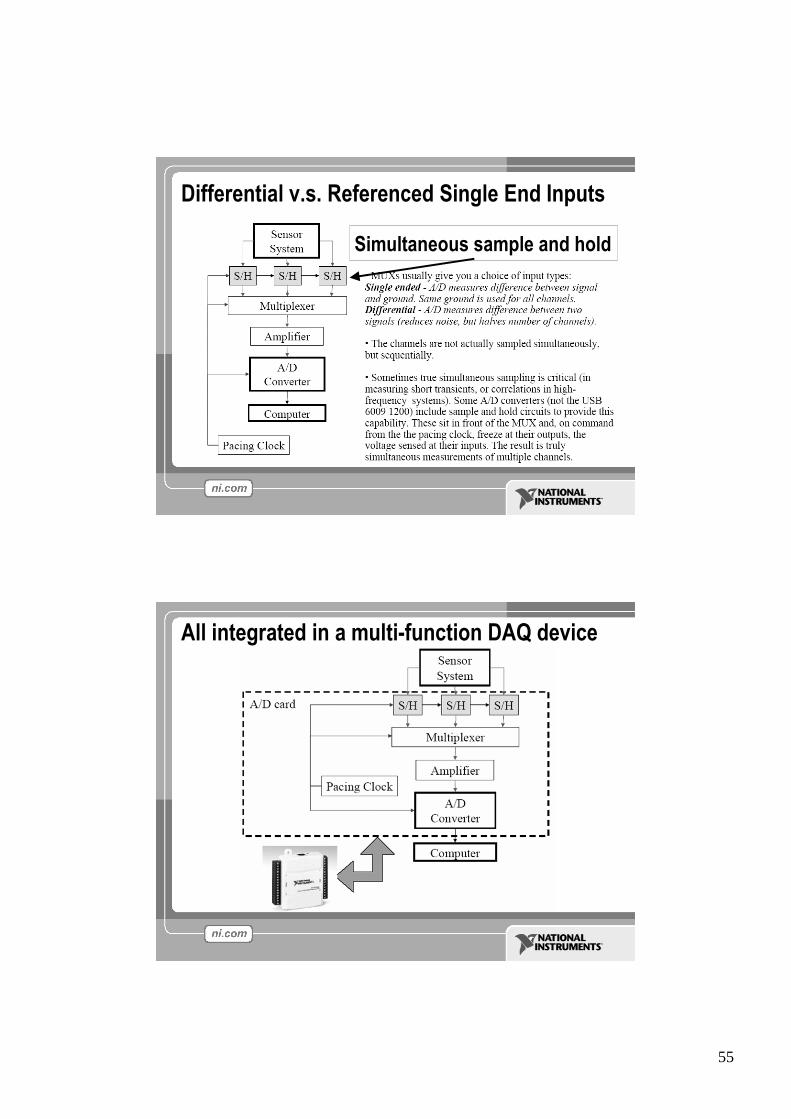
55
Differential v.s. Referenced Single End Inputs
Simultaneous sample and hold
All integrated in a multi-function DAQ device
56
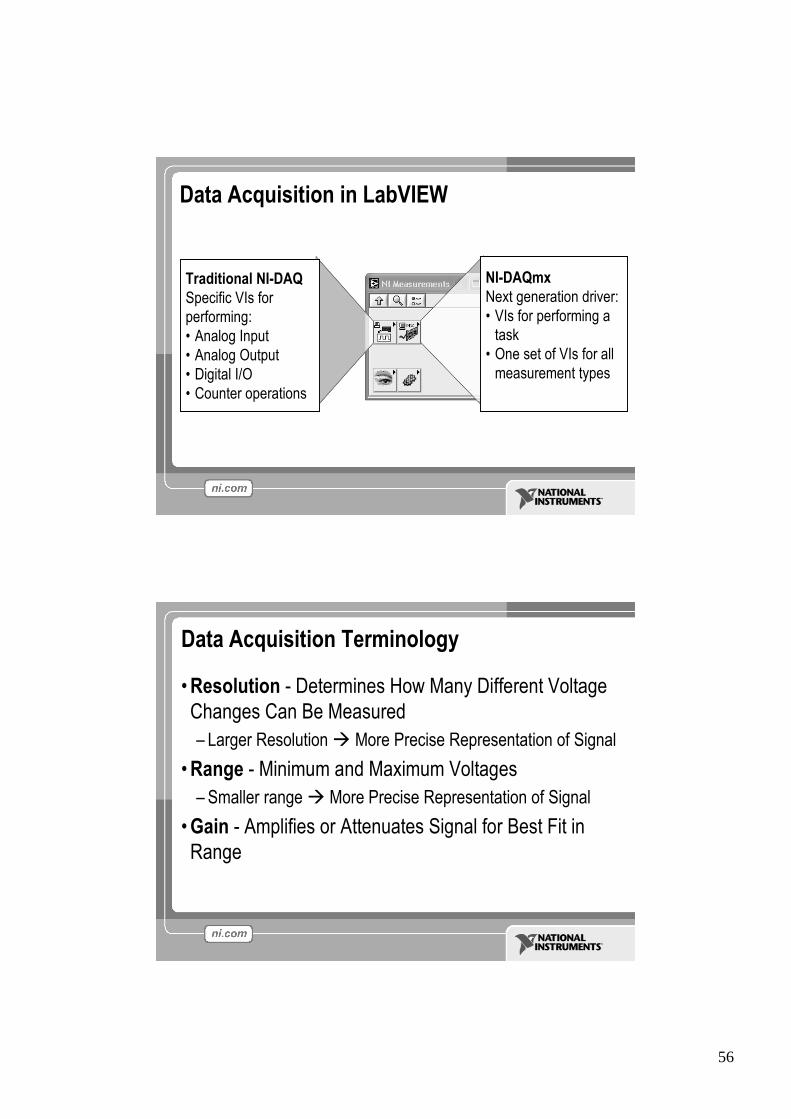
Data Acquisition in LabVIEW
Traditional NI-DAQSpecific VIs forperforming:•Analog Input•Analog Output•Digital I/O•Counter operations
NI-DAQmxNext generation driver:•VIs for performing a
task•One set of VIs for all
measurement types
Data Acquisition Terminology
•Resolution - Determines How Many Different VoltageChanges Can Be Measured–Larger Resolution More Precise Representation of Signal
•Range - Minimum and Maximum Voltages–Smaller range More Precise Representation of Signal
•Gain - Amplifies or Attenuates Signal for Best Fit inRange
57
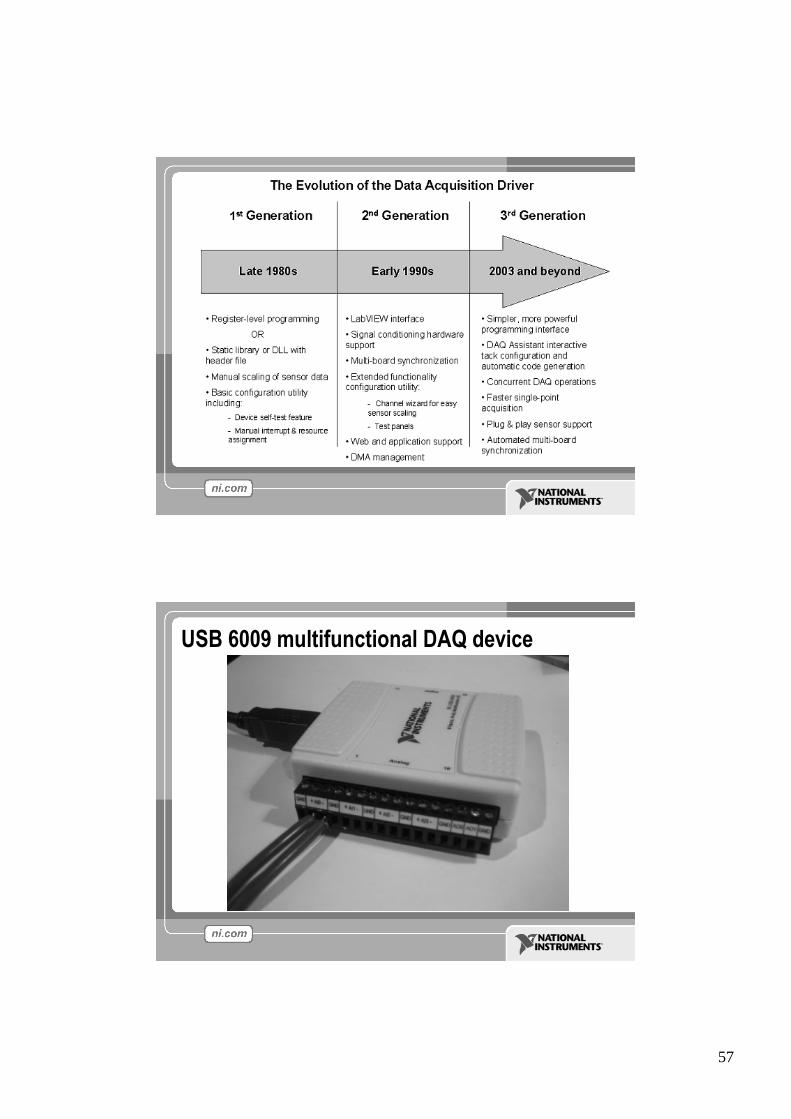
USB 6009 multifunctional DAQ device
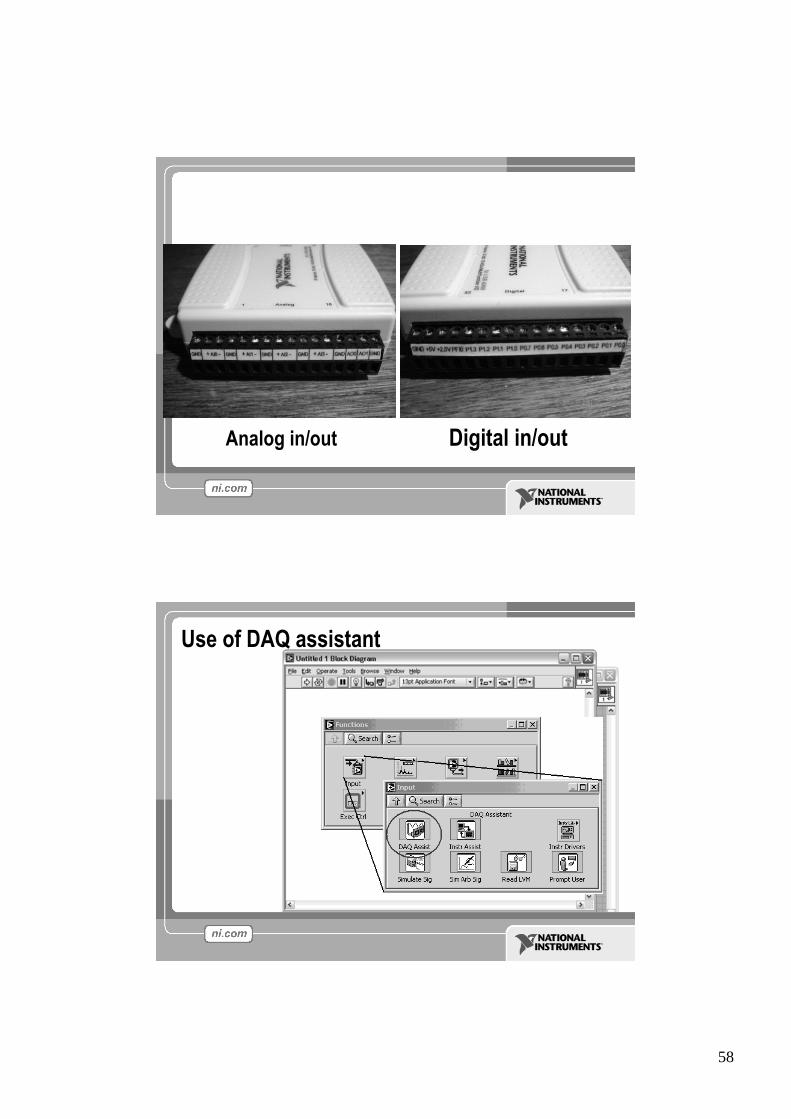
58
Analog in/out Digital in/out
Use of DAQ assistant

59
Defining your task
Configuring your task (analog input)

60
Appointing Channels to acquire from
Physical channels versus Global channels

61
Configuring your analoginput task
Pressing OK willgenerate all the LabViewcode automatically.
USB 6009is a low
cost device

62
A typical DAQ VI using traditional programming
With DAQ assistant, the whole VI can be as simple as:
63
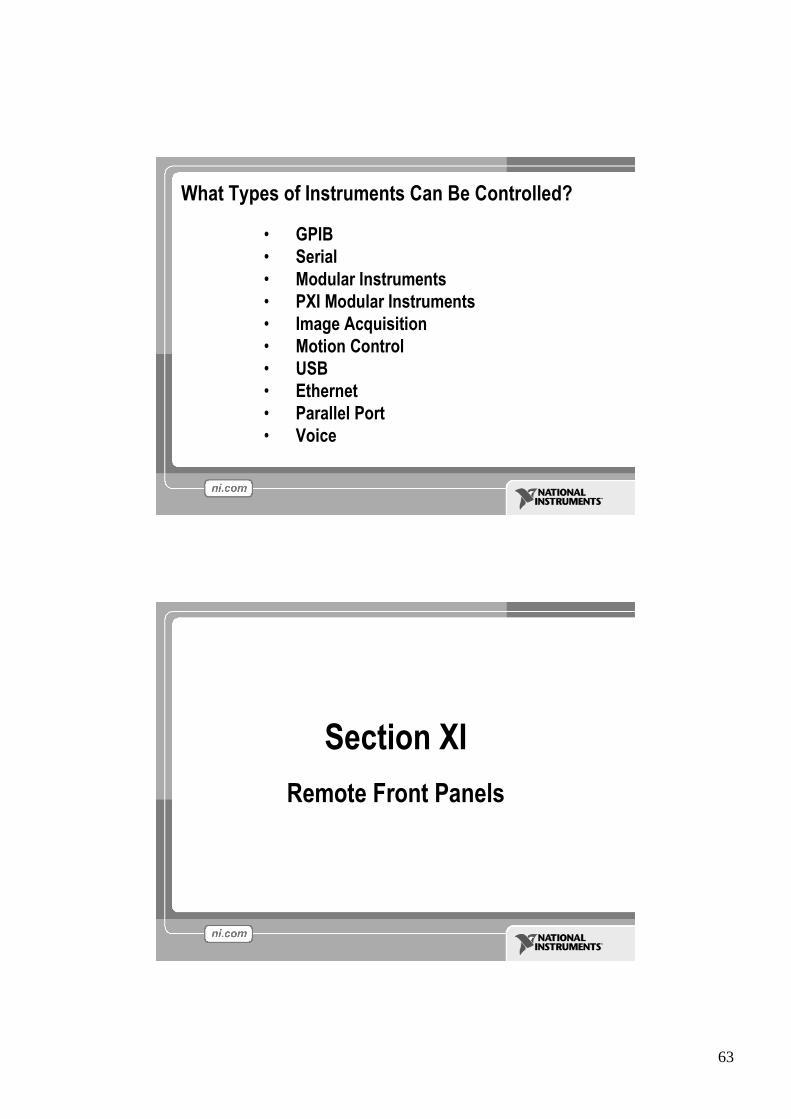
What Types of Instruments Can Be Controlled?
• GPIB• Serial• Modular Instruments• PXI Modular Instruments• Image Acquisition• Motion Control• USB• Ethernet• Parallel Port• Voice
Section XIRemote Front Panels

64
Section XI –Remote Front Panels
•View & Control LabVIEW Front Panels from a WebBrowser•Requires no programming•Remote clients see “live”front panel updates•Multiple clients can view the same panelsimultaneously•Only one client can control the front panel at a time
Remote Panel Web Publishing Tool•Tools » Web Publishing Tool…
•Click Save to Diskand VI is embeddedinto an HTML file
•After file is saved, itcan be reopened andcustomized in anyHTML editor

65
Remote Front Panels - Resources
•NI Developer Zone(zone.ni.com)–Search for Remote Front
Panel–Tutorials & Instructions Are
Available for Download–Information on
Incorporating WebCameras into RemotePanel Applications
Section XII –Large Program Development andAdditional Topics
A. Navigation WindowB. LabVIEW ProjectC. Shared VariableD. Additional topics
– Property Nodes– Local Variables– Global Variables– DataSocket– Binary File I/O
66
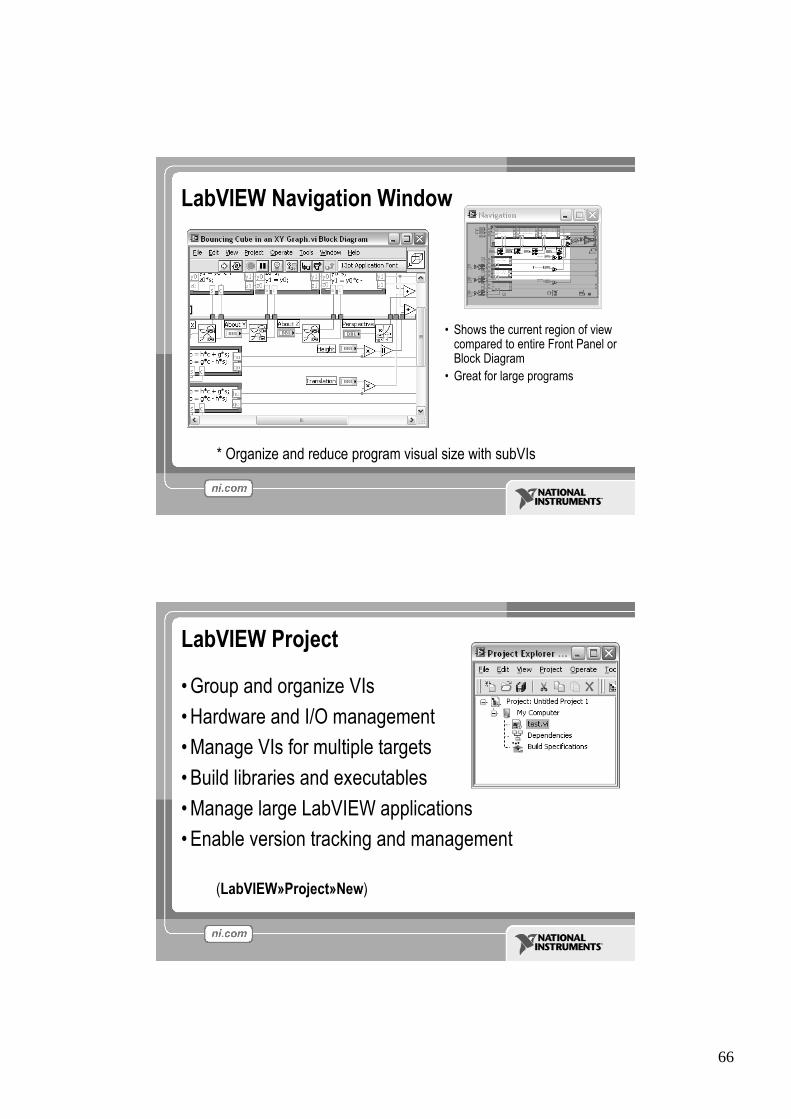
•Shows the current region of viewcompared to entire Front Panel orBlock Diagram
•Great for large programs
LabVIEW Navigation Window
* Organize and reduce program visual size with subVIs
LabVIEW Project
•Group and organize VIs•Hardware and I/O management•Manage VIs for multiple targets•Build libraries and executables•Manage large LabVIEW applications•Enable version tracking and management
(LabVIEW»Project»New)

67
Shared Variables
•Shared Variables are used to send data between VIs.•Variable Types:–Single Process: share the data among VIs on the local computer.–Network-published: communicate between VIs, remote
computers, and hardware through the Shared Variable Engine.
•Shared Variable must exist within a project library.•Shared Variable must be deployed to be available to other projects
and remote computers.
Additional topics
–Property Nodes–Local Variables–Global Variables–DataSocket–Binary File I/O

68
Additional Resources•NI Academic Web & Student Corner
–http://www.ni.com/academic
•Connexions: Full LabVIEW Training Course– www.cnx.rice.edu–Or search for “LabVIEW basics”
•LabVIEW Certification–LabVIEW Fundamentals Exam (free on www.ni.com/academic)
–Certified LabVIEW Associate Developer Exam (industry recognized certification )
•Get your own copy of LabVIEW Student Edition–www.ni.com/academic By Robert H Bishop.
Published by Prentice Hall.
Updated for
LabVIEW 8
The LabVIEW Certification Program
Certified LabVIEWDeveloper
Certified LabVIEW AssociateDeveloper
CertifiedLabVIEWArchitect
Architect•Mastery of LabVIEW•Expert in large application development•Skilled in leading project teams
Developer•Advanced LabVIEW knowledge
and application developmentexperience
•Project management skills
Associate Developer•Proficiency in navigating
LabVIEW environment•Some applicationdevelopment experience
Fundamentals Exam•Pre-Certification Skills Test Free On-Line Fundamentals Exam

69
Your Next Step…
Take the free LabVIEW Fundamentals Exam atni.com/academic
Your first step to become LabVIEW Certified!