Kobe University Repository : Kernel7 1Department of Clinical Pharmacy and Education, Graduate School...
39
Kobe University Repository : Kernel タイトル Title Population pharmacokinetics and pharmacodynamics of mycophenolic acid using the prospective data in patients undergoing hematopoietic stem cell transplantation 著者 Author(s) Yoshimura, Kazuaki / Yano, Ikuko / Yamamoto, Takashi / Kawanishi, Misaki / Isomoto, Yui / Yonezawa, Atsushi / Kondo, Tadakazu / Takaori- Kondo, Akifumi / Matsubara, Kazuo 掲載誌・巻号・ページ Citation Bone Marrow Transplantation,53(1):44-51 刊行日 Issue date 2018-01 資源タイプ Resource Type Journal Article / 学術雑誌論文 版区分 Resource Version author 権利 Rights © 2017, Springer Nature DOI 10.1038/bmt.2017.213 JaLCDOI URL http://www.lib.kobe-u.ac.jp/handle_kernel/90004835 PDF issue: 2020-11-06
Transcript of Kobe University Repository : Kernel7 1Department of Clinical Pharmacy and Education, Graduate School...

Kobe University Repository : Kernel
タイトルTit le
Populat ion pharmacokinet ics and pharmacodynamics of mycophenolicacid using the prospect ive data in pat ients undergoing hematopoiet icstem cell t ransplantat ion
著者Author(s)
Yoshimura, Kazuaki / Yano, Ikuko / Yamamoto, Takashi / Kawanishi,Misaki / Isomoto, Yui / Yonezawa, Atsushi / Kondo, Tadakazu / Takaori-Kondo, Akifumi / Matsubara, Kazuo
掲載誌・巻号・ページCitat ion Bone Marrow Transplantat ion,53(1):44-51
刊行日Issue date 2018-01
資源タイプResource Type Journal Art icle / 学術雑誌論文
版区分Resource Version author
権利Rights © 2017, Springer Nature
DOI 10.1038/bmt.2017.213
JaLCDOI
URL http://www.lib.kobe-u.ac.jp/handle_kernel/90004835
PDF issue: 2020-11-06

1
Population pharmacokinetics and pharmacodynamics of mycophenolic acid using prospective data in 1
patients undergoing hematopoietic stem cell transplantation 2
3
Kazuaki Yoshimura1,2, Ikuko Yano1,2,3, Takashi Yamamoto2, Misaki Kawanishi1,2, Yui Isomoto2, Atsushi 4
Yonezawa1,2, Tadakazu Kondo4, Akifumi Takaori-Kondo4, and Kazuo Matsubara2 5
6
1Department of Clinical Pharmacy and Education, Graduate School of Pharmaceutical Science, Kyoto 7
University, Sakyo-ku, Kyoto 606-8501, Japan. 8
2Department of Clinical Pharmacology and Therapeutics, Kyoto University Hospital, Sakyo-ku, Kyoto 9
606-8507, Japan. 10
3Department of Pharmacy, Kobe University Hospital, Chuo-ku, Kobe 650-0017, Japan. 11
4Department of Hematology and Oncology, Graduate School of Medicine, Kyoto University, Sakyo-ku, 12
Kyoto 606-8507, Japan 13
14
Running heading: 15
Population analysis of mycophenolic acid 16
2
17
Conflict of interest: The authors declare no conflict of interest. 18
19
This study was supported in part by JSPS KAKENHI Grant Number JP25460210. 20
21
Corresponding Author: Ikuko Yano, PhD 22
Department of Pharmacy, Kobe University Hospital, 23
Chuo-ku, Kobe 650-0017, Japan 24
Tel.: +81-78-382-6641 25
Fax: +81-78-382-6676 26
E-mail Address: [email protected] 27
28
29
30

3
Abstract 31
Mycophenolate mofetil (MMF), a prodrug of mycophenolic acid (MPA), is used to suppress 32
graft-versus-host disease in patients undergoing hematopoietic stem cell transplantation (HCT). The 33
purpose of this study was to construct a population pharmacokinetic and pharmacodynamic model in 34
HCT patients for individualized MPA therapy. Blood samples were obtained from 49 HCT patients after 35
starting MMF therapy. Population pharmacokinetic and pharmacodynamic parameters were obtained 36
using the program NONMEM. MPA was described via a 1-compartment model with a first order 37
elimination, and 30.9% of MPA glucuronide (MPAG) was found in the enterohepatic circulation. 38
Inosine-5’-monophosphate dehydrogenase (IMPDH) activity was modeled as a maximal inhibitory model 39
with a half-maximal inhibitory concentration (IC50) of 3.59 µg/mL against MPA concentrations. 40
Simulations based on the obtained pharmacokinetic and pharmacodynamic parameters revealed that 41
decreased creatinine clearance increases the MPAG concentration followed by an increased MPA 42
concentration; therefore, IMPDH activity decreases. Diarrhea decreases the enterohepatic circulation of 43
MPAG and consequently reduces MPA concentration. The IC50 for MPA exhibited a positive association 44
with C-reactive protein. Dosage adjustment based on plasma MPA concentration is required especially 45
for patients with renal dysfunction and/or diarrhea. 46
4
Introduction 47
Mycophenolate mofetil (MMF) is clinically used to suppress graft-versus-host disease (GVHD) in 48
patients undergoing hematopoietic stem cell transplantation (HCT) and acute rejection after solid organ 49
transplantation1,2. Mycophenolic acid (MPA), an active form of MMF, is metabolized by 50
glucuronosyltransferases in the liver. MPA glucuronide (MPAG) and MPA acyl glucuronide (AcMPAG) 51
are primarily produced by UGT1A9 and 2B7, respectively 3. While MPAG is an inactive metabolite, 52
AcMPAG exhibits pharmacological activity in vitro and is potentially responsible for the toxicity of MPA 53
4. The majority of MPA metabolites are eliminated via the urine and partial elimination also occurs in the 54
bile mediated by multidrug resistance associated protein 2 (MRP2) followed by the entero-hepatic 55
recirculation 5. 56
The pharmacokinetics (PK) of MPA exhibits a large inter- and intra-individual variability, and it is 57
recommended that the area under the concentration-time curve (AUC) of MPA be monitored for 58
individualized therapy in solid organ transplant recipients6, 7. Recently, Arai et al. 8 proposed that MPA 59
drug monitoring was necessary for the effective prophylaxis of acute GVHD undergoing cord blood stem 60
cell transplantation (CBT). However, information regarding the optimal dose of MMF or the target range 61
for MPA concentrations in HCT patients is limited 9. 62
5
MPA selectively inhibits inosine-5’-monophosphate dehydrogenase (IMPDH) and suppresses the 63
proliferation of B and T lymphocytes 10. IMPDH exists as two isoforms derived from different genes 11, 12, 64
and recombinant proteins of IMPDH2 is 4.8-fold more sensitive to MPA than IMPDH113. The area under 65
the effect curve (AUEC) of IMPDH activity on day 21 after HCT was reportedly associated with both 66
non-relapse and overall mortality 14. Therefore, the measurement of IMPDH activity in peripheral blood 67
mononuclear cells (PBMCs) in addition to monitoring the AUC of MPA is considered to be an effective 68
predictor of the clinical outcome of MPA therapy. 69
The PK of MPA is influenced by serum albumin, renal dysfunction, total bilirubin, age, 70
co-administration with cyclosporine, and dose 15-19. In addition, the incidence of acute rejection in the first 71
year post-transplantation was significantly lower in carriers of SNPs for IMPDH1 -106 G>A and 125 72
G>A compared with the respective wild-type individuals20. The SNP for IMPDH2 3757 T>C was 73
associated with a significantly higher IMPDH activity following the MMF intake, despite of no difference 74
in the MPA exposure between groups21. The SNP for MRP2 -24C>T was associated with a significantly 75
higher dose-corrected MPA trough levels at later time points after transplantation22. The SNP for 76
UGT2B7 -842G>A resulted in a significantly higher AUC of AcMPAG at 1 and 3 months 77
post-transplantation in patients with renal transplantation23. 78

6
In this study, the effects of the patient characteristics including previously proven genetic 79
polymorphisms were examined using a population PK and pharmacodynamics (PD) analysis. Effects of 80
covariates were quantitatively evaluated by the simulation to examine the clinical significance of these 81
covariates. 82
83
Subjects and Methods 84
Study design 85
A total of 49 adult Japanese HCT patients between March 2013 and August 2016 were included in 86
the study. Acute GVHD prophylaxis comprised tacrolimus (PrografTM, Astellas Pharma Inc., Tokyo, 87
Japan) and MMF (CellceptTM, Chugai Pharmaceutical Co., Ltd., Tokyo, Japan) in CBT, plus short-term 88
methotrexate (MethotrexateTM, Pfizer Japan Inc., Tokyo, Japan) in bone marrow transplant (BMT) or 89
peripheral blood stem cell transplantation (PBT). MMF was orally administered at 10 mg/kg every 8 h 90
(30 mg/kg/day), and was initiated on day −1 after CBT or on day 7 after BMT and PBT, except in one 91
patient administered 15 mg/kg every 12 h. No potentially interacting drugs including cyclosporine or 92
foods with MPA were co-administered. 93
Pre-transplant recipient DNA was used to determine UGT2B7 −842C>T (rs7439366) and MRP2 94
−24C>T (rs717620) genotypes. Approximately five weeks after MMF administration commenced, 95
7
post-transplant donor DNA as well as pre-transplant recipient DNA were used to determine IMPDH1 −96
106G>A (rs2278294), IMPDH1 125G>A (rs2278293), and IMPDH2 3757T>C (rs11706052) genotypes. 97
Blood samples were collected immediately before, 1, 2, 4, and 8 h after the first and third weeks after 98
MMF administration commenced, plus blood sampling at 12 h after MMF administration in one patient 99
administered 15 mg/kg every 12 h. This clinical study was approved by the Ethics Committee of Kyoto 100
University Graduate School and Faculty of Medicine and Kyoto University Hospital. Written informed 101
consent was obtained from all patients included in the study. 102
103
Analytical methods 104
Total plasma concentrations of MPA, MPAG, and AcMPAG were analyzed using LC-MS/MS 105
according to the previously reported method 24. The lower limits of quantification (LLOQ) were 0.05, 0.2, 106
and 0.02 µg/mL for MPA, MPAG, and AcMPAG, respectively. PBMC samples were used to measure the 107
IMPDH activity according to the previous method 24. The IMPDH activity was calculated based on the 108
XMP produced, which was normalized to the intracellular AMP. The LLOQ were 50 nM for both XMP 109
and AMP. The data for AMP under the LLOQ were excluded from the analysis due to extremely low 110
white blood cell counts after the transplantation. 111
112
Population PK/PD analysis 113
8
A population PK analysis was conducted using NONMEM. The overview of the basic PK/PD 114
model for MPA is shown in Fig. 1. Since only the oral data were available, the relative bioavailability (F) 115
of MPA was assumed to be 1. The model was parameterized using clearances for MPA, MPAG, and 116
AcMPAG (CLMPA, CLMPAG, and CLAcMPAG), as well as the volume of distribution for MPA, MPAG, and 117
AcMPAG (VMPA, VMPAG, and VAcMPAG). It was assumed that MPA was metabolized to MPAG and 118
AcMPAG by a first-order process, in which 99 % and 1 % of MPA was converted to MPAG and 119
AcMPAG, respectively, because the ratio of AUC0–8 for MPAG to AcMPAG was approximately 99:1 in 120
this study. The enterohepatic circulation (EHC) was tested as a first-order process (KEHC) from the central 121
compartment of each metabolite to the gastrointestinal tract. For the comparison, 2-compartment model 122
with EHC, and the lag time and the transit compartment models in the absorption process were tested 25. 123
Additionally, EHC modeling by presuming a hypothetical gall bladder compartment was tested 26, 27. 124
Interindividual and interoccasion variability (IIV and IOV) in the PK/PD parameters were 125
modeled using an exponential error model 28. The estimation for the IOV was as follows: occasions 1 and 126
2 pertained to one and three weeks after MMF administration commenced, respectively. The influence of 127
each covariate on the population mean parameters was evaluated by the stepwise forward inclusion and 128
backward elimination method, and significance levels were 1 % and 0.1 % (6.63 and 10.8 with freedom 129
9
of 1 assuming a chi-square distribution), respectively. The tested covariates for the PK parameters 130
included body weight, gender, stem cell source, age, aspartate aminotransferase, serum albumin, total 131
bilirubin, creatinine clearance (CLCR), dose of MMF, diarrhea, and investigated genotypes for MRP2 and 132
UGT2B7 of recipient. Diarrhea was defined as the occurrence of loose, muddy or watery stool, or more 133
than five times per a day of fecal frequency in case of not recording the fecal condition. 134
Continuous variables were normalized by each population median using the following power 135
function model: 136
θ θ 137
(1) 138
where θi is the individual model-predicted PK parameter (e.g. CLMPA) for an individual with covariate 139
value of COVi. θpop represents the population mean for the parameter θ, COVmed represents the population 140
median of the covariate, and θcov represents the covariate effect. For dichotomous variables, the value of 141
COVi is typically set to 0 for the normal classification and 1 for the other classifications in each 142
individual as follows: 143
θ θ θ (2) 144
----

10
After the final population PK model was obtained, the relationship between the MPA 145
concentrations and IMPDH activity was explored graphically and modeled using a direct sigmoid 146
inhibitory maximum effect model as followed: 147
E E 1,
(3) 148
where E0, IC50,MPA, and represent baseline of IMPDH activity, half-maximal inhibitory MPA 149
concentration, and the Hill coefficient to be estimated 29, and CMPA represents the MPA concentration. To 150
investigate the effect of the AcMPAG concentration on IMPDH activity, an additional inhibitory effect 151
model was tested 30. The tested covariates for the PD parameters included the stem cell source, 152
reduced-intensity conditioning, gender, age, serum albumin, C-reactive protein (CRP), and investigated 153
genotypes (IMPDH1 and 2) of donor or recipient. In the value of CRP was under the LLOQ (<0.2 154
mg/mL), this value was converted to 0.1 due to the difficulty of the calculation. Goodness-of-fit and 155
prediction-corrected visual predictive check plots were used for internal validation 31. For 156
prediction-corrected visual predictive check plots, the final PK/PD model was used to simulate original 157
data sets at 1000 times compared with the observed data. 158
159
Simulation study 160

11
The effects of statistically significant covariates on the PK/PD of MPA were evaluated by the 161
simulation using the final population parameters. The dose was fixed to 500 mg every 8 h for all 162
simulations. In the simulation for the effect of each covariate, other covariates were fixed to the median 163
value of each covariate and without diarrhea. The AUC0–8 or AUEC0–8 were calculated using the linear 164
trapezoidal method. 165
166
Results 167
Patient characteristics 168
The patient characteristics and the distribution of each genotype before and five weeks after the 169
transplantation are summarized in Table 1. All of the observed genotype distributions were consistent 170
with Hardy-Weinberg equilibrium. 171
172
Population PK modeling 173
In total, 522 concentration data for MPA, MPAG, and AcMPAG, respectively, were analyzed. Five 174
samples with MPA concentrations under the LLOQ were replaced with half of the LLOQ 32, and included 175
in the analysis. 2-compartment model improved the model fitting compared with 1-compartment model 176
12
without EHC. However, after an inclusion of EHC process, 2-compartment model did not improve the 177
model fitting compared with 1-compartment model (∆OBJ = −8.12), and a terminal elimination rate 178
constant was not correctly estimated. Therefore, the PK of MPA was finally described by 1-compartment 179
model with first order absorption and elimination, and was affected by the EHC of MPAG. An inclusion 180
of the absorption lag-time did not improve the model fitting. Transit compartment model was not adopted 181
owing to the high computational intensity required, although the model fit was significantly improved. 182
Although the inclusion of EHC of AcMPAG in the model brought a statistically significant model 183
improvement, CLAcMPAG was not correctly estimated. Therefore, the model including the EHC of only 184
MPAG was selected. EHC modeling by presuming a hypothetical gall bladder compartment did not 185
improve the model fitting compared with first-order EHC model. The simultaneous inclusion of IOVs for 186
Ka, F, KEHC, CLMPAG, and CLAcMPAG significantly improved the model fitting (∆OBJ = −721). The final 187
PK parameters and its relative standard error (RSE) are presented in Table 2. Figure 2 shows the 188
inter-occasional parameters for one and three weeks after MMF administration commenced. 189
After the evaluation of each covariate, the serum albumin revealed a significant negative association 190
with CLMPA and VMPA. CLCR exhibited a significant positive relationship with both CLMPAG and CLAcMPAG, 191
and KEHC in the patients showing diarrhea was 0.375-fold lower than that without diarrhea (Table 2). An 192
13
inclusion of IIV was tested for all the MPA PK parameters and an exclusion of IIV was tested after 193
inclusion of IOV. After all, IIVs on VMPA and F were retained in the final model, and shrinkage values of 194
them were 27.6% and 16.8%, respectively. The ratio for the EHC of MPAG was estimated to be 30.9% 195
(EHC (%) = KEHC/(KEHC + CLMPAG/VMPAG) × 100) in patients with CLCR of 112 mL/min without diarrhea. 196
197
PD modeling 198
A total of 460 IMPDH activity data from 49 patients were used for the PD model building following 199
the PK modeling process. The 62 IMPDH activity data were excluded due to AMP under the LLOQ. The 200
IMPDH activity was described with the inhibitory Emax model using the MPA concentrations. The Hill 201
coefficient was fixed to 1 by the statistical selection (∆OBJ = −3.00). The additive inhibitory effect 202
model for AcMPAG did not significantly improve the model fitting. An inclusion of IOV on E0 203
significantly improved the model fitting (∆OBJ = −200). The value of IC50 for MPA revealed a positive 204
association with CRP (∆OBJ = −11.4). No polymorphisms were identified as significant covariates in 205
the PK/PD model. The final PD parameters with RSE are shown in Table 2. The IIV for IC50 was 81.2%, 206
and its shrinkage was 29.7%. The goodness-of-fit and prediction-corrected visual predictive check 207
14
demonstrated that the population PK/PD model accurately predicted the observed MPA and its 208
metabolites concentrations, as well as IMPDH activity (Figs. 3 and 4). 209
210
Simulation study 211
A total of 1,000 data sets in each group were simulated under the several renal functions with or 212
without diarrhea (Fig. 5). The AUC0-8 of MPAG and AcMPAG significantly increased according to the 213
decreased CLCR compared with those for 120 mL/min. The AUC0-8 of MPA also significantly increased 214
according to the decreased CLCR. The AUEC0-8 of IMPDH significantly decreased from 339 to 215 215
µmol·h·sec− 1·mol AMP− 1 with a decrease in CLCR from 120 to 10 mL/min; however, a large 216
interindividual variability was noted. In addition, the diarrhea significantly decreased the AUC0-8 of both 217
MPA and AcMPAG in every CLCR, but did not affect the AUC0-8 of MPAG. The AUEC0-8 of IMPDH 218
with diarrhea was significantly higher than that without diarrhea in the case of CLCR under 60 mL/min. 219
The AUC0-8 of MPA significantly decreased with a reduction in serum albumin, although the 220
AUEC0–8 of IMPDH did not significantly change (Fig. 6). At a MPA concentration of 3.59 µg/mL, which 221
is equal to the population mean of IC50 in the case of CRP of 1.2 mg/dL, the IMPDH activity is 1.34-fold 222
15
higher in patients with CRP of 10 mg/dL, compared with that for CRP of 1.2 mg/dL. The AUEC0-8 of 223
IMPDH also significantly increases as the CRP rises. 224
225
Discussion 226
Patients undergoing HCT generally have intestinal mucosal damage due to a myeloablative or 227
reduced intensity conditioning regimen prior to HCT 33. Indeed, MPA concentrations in HCT patients are 228
generally lower than those of organ transplant patients despite an equivalent dose of MMF 34. In addition, 229
leukopenia and co-administered antibiotics induce the destruction of intestinal flora, leading to diarrhea. 230
The diarrhea decreased the reabsorption of MPA in the gastro-intestinal tract, and consequently decreased 231
the MPA concentration. In this study, IMPDH activity in CLCR under 60 mL/min with diarrhea was 232
significantly higher compared to those in the same CLCR without diarrhea in the same MPA dosing, 233
secondary to the PK changes. 234
In the early phase after transplantation, HCT patients suffer from renal impairment due to 235
thrombotic microangiopathy, which is an adverse effect caused by calcineurin inhibitors and high-dose 236
chemotherapy 35. Since MPA metabolites are excreted into the urine, the clearance of MPA metabolites 237
have been reported to decrease in association with lower renal function 14, 36. In the simulation using the 238
16
final PK/PD parameters, MPA concentration will be increased with a decreased CLCR, due to the 239
enhanced EHC of MPAG. Moreover, the IMPDH activity in CLCR under 30 mL/min was significantly 240
lower than that in 120 mL/min. Therefore, particular attention regarding extra-immunosuppression in 241
response to MPA is needed for patients with severe renal dysfunction. 242
The target range of MPA exposure may be influenced by changes in serum albumin, since the free 243
fraction of MPA was 1–2% 37. In the PD analysis, we speculated that the serum albumin had a significant 244
effect on the IC50 value of MPA due to the changed unbound fraction of MPA; however, we were unable 245
to conclusively demonstrate this effect due to a large inter- and intra-individual variability in IMPDH 246
activity. Therefore, changes in the serum albumin in clinical situations might not have a significant effect 247
on IMPDH activity, although it can affect the PK of MPA. 248
Interestingly, CRP exhibited a positive association with the IC50 for MPA. Patients undergoing HCT 249
suffered from various symptoms caused by an infection and/or the excessive production of inflammatory 250
cytokines on the days around the engraftment 38, 39. Indeed, the median of CRP in one week after starting 251
the MMF therapy (3.0 mg/dL) was significantly higher than that in three weeks after the therapy (0.8 252
mg/dL). Moreover, IMPDH1 is constitutively expressed in normal leukocytes, whereas IMPDH2 is 253
up-regulated in neoplastic and replicating cells40, 41. These findings suggest the reasons why CRP 254
17
exhibited a positive association with the IC50 for MPA. Whether the elevated CRP value reflects infection 255
or excessive production of inflammatory cytokines remains to be examined. 256
The simultaneous inclusion of IIVs and IOVs for PK/PD parameters significantly improved the 257
model fitting. HCT patients have single or multiple damages due to the conditioning regimen, infection or 258
excessive production of inflammatory cytokines33, 38, 39, 42. In addition, the recovery rate of organic and 259
hematopoietic functions following HCT showed a large variability. Therefore, the IIV and IOV in the 260
PK/PD of MPA in HCT patients should be large. 261
The present study included some limitations. The PK of MPA is usually expressed as 262
2-compartment model, and/or sometimes includes more sophisticated models 26, 27. In this study, the 263
model fitting was not improved by using any sophisticated models. The examined model largely depends 264
on the experimental design, and we would like to pick up clinical significant covariates on the PK of 265
MPA in a routine clinical care as shown in the previous our study 8. Additionally, although our population 266
size was modest, the estimated parameters, such as the ratio of EHC of MPAG or the IC50 for MPA, were 267
similar to those of previous reports 14. Therefore, the constructed PK/PD model for MPA was considered 268
to be appropriate. The effects of covariates extracted in the present study should be examined by 269
2-compartment model using more rich sampling data in a future. 270

18
In conclusion, we successfully constructed a population PK/PD model of MPA in patients 271
undergoing HCT. Renal dysfunction, diarrhea, and CRP are clinically significant factors affecting the PD 272
of MPA in the same dosing regimen. Dosage adjustment based on plasma MPA concentration is required 273
especially for patients with renal dysfunction and/or diarrhea. 274
275
Acknowledgments: The authors would like to thank Ms. Machiko Kaneyoshi for her assistant with 276
blood sampling. 277
278
References 279
1. Kaufman DB, Shapiro R, Lucey MR, Cherikh WS, Bustami RT, Dyke DB. Immunosuppression: 280
practice and trends. Am J Transplant 2004; 4: 38-53. 281
2. Minagawa K, Yamamori M, Katayama Y, Matsui T. Mycophenolate mofetil: fully utilizing its 282
benefits for GvHD prophylaxis. Int J Hematol 2012; 96: 10-25. 283
3. Dupuis R, Yuen A, Innocenti F. The influence of UGT polymorphisms as biomarkers in solid 284
organ transplantation. Clinica Chimica Acta 2012; 413: 1318-1325. 285
19
4. Wieland E, Shipkova M, Schellhaas U, Schutz E, Niedmann PD, Armstrong VW et al. Induction 286
of cytokine release by the acyl glucuronide of mycophenolic acid: a link to side effects? Clin 287
Biochem 2000; 33: 107-113. 288
5. Patel CG, Ogasawara K, Akhlaghi F. Mycophenolic acid glucuronide is transported by 289
multidrug resistance-associated protein 2 and this transport is not inhibited by cyclosporine, 290
tacrolimus or sirolimus. Xenobiotica 2013; 43: 229-235. 291
6. van Gelder T, Hilbrands LB, Vanrenterghem Y, Weimar W, de Fijter JW, Squifflet JP et al. A 292
randomized double-blind, multicenter plasma concentration controlled study of the safety and 293
efficacy of oral mycophenolate mofetil for the prevention of acute rejection after kidney 294
transplantation. Transplantation 1999; 68: 261-266. 295
7. Staatz CE, Tett SE. Clinical pharmacokinetics and pharmacodynamics of mycophenolate in solid 296
organ transplant recipients. Clin Pharmacokinet 2007; 46: 13-58. 297
8. Arai Y, Kondo T, Kitano T, Hishizawa M, Yamashita K, Kadowaki N et al. Monitoring 298
mycophenolate mofetil is necessary for the effective prophylaxis of acute GVHD after cord 299
blood transplantation. Bone Marrow Transplant 2015; 50: 312-314. 300

20
9. Wakahashi K, Yamamori M, Minagawa K, Ishii S, Nishikawa S, Shimoyama M et al. 301
Pharmacokinetics-based optimal dose prediction of donor source-dependent response to 302
mycophenolate mofetil in unrelated hematopoietic cell transplantation. Int J Hematol 2011; 94: 303
193-202. 304
10. Allison AC, Eugui EM. Mycophenolate mofetil and its mechanisms of action. 305
Immunopharmacology 2000; 47: 85-118. 306
11. Collart FR, Huberman E. Cloning and sequence-analysis of the human and chinese-hamster 307
inosine-5'-monophosphate dehydrogenase cdnas. J Biol Chem 1988; 263: 15769-15772. 308
12. Natsumeda Y, Ohno S, Kawasaki H, Konno Y, Weber G, Suzuki K. Two distinct cDNAs for 309
human IMP dehydrogenase. J Biol Chem 1990; 265: 5292-5295. 310
13. Carr SF, Papp E, Wu JC, Natsumeda Y. Characterization of human type-I and Type-II IMP 311
dehydrogenases. J Biol Chem 1993; 268: 27286-27290. 312
14. Li H, Mager DE, Sandmaier BM, Storer BE, Boeckh MJ, Bemer MJ et al. Pharmacokinetic and 313
pharmacodynamic analysis of inosine monophosphate dehydrogenase activity in hematopoietic 314
cell transplantation recipients treated with mycophenolate mofetil. Biol Blood Marrow 315
Transplant 2014; 20: 1121-1129. 316
21
15. de Winter BCM, Mathot RAA, Sombogaard F, Vulto AG, van Gelder T. Nonlinear relationship 317
between mycophenolate mofetil dose and mycophenolic acid exposure: implications for 318
therapeutic drug monitoring. Clin J Am Soc Nephrol 2011; 6: 656-663. 319
16. Frymoyer A, Verotta D, Jacobson PA, Long-Boyle J. Population pharmacokinetics of unbound 320
mycophenolic acid in adult allogeneic hematopoietic cell transplantation: effect of 321
pharmacogenetic factors. Br J Clin Pharmacol 2013; 75: 463-475. 322
17. Li H, Mager DE, Sandmaier BM, Maloney DG, Bemer MJ, McCune JS. Population 323
pharmacokinetics and dose optimization of mycophenolic acid in HCT recipients receiving oral 324
mycophenolate mofetil. J Clin Pharmacol 2013; 53: 393-402. 325
18. Barau C, Furlan V, Debray D, Taburet AM, Barrail-Tran A. Population pharmacokinetics of 326
mycophenolic acid and dose optimization with limited sampling strategy in liver transplant 327
children. Br J Clin Pharmacol 2012; 74: 515-524. 328
19. Kim H, Long-Boyle J, Rydholm N, Orchard PJ, Tolar J, Smith AR et al. Population 329
pharmacokinetics of unbound mycophenolic acid in pediatric and young adult patients 330
undergoing allogeneic hematopoietic cell transplantation. J Clin Pharmacol 2012; 52: 331
1665-1675. 332

22
20. Wang J, Yang JW, Zeevi A, Webber SA, Girnita DM, Selby R et al. IMPDH1 gene 333
polymorphisms and association with acute rejection in renal transplant patients. Clin Pharmacol 334
Ther 2008; 83: 711-717. 335
21. Sombogaard F, van Schaik RHN, Mathot RA, Budde K, van der Werf M, Vulto AG et al. 336
Interpatient variability in IMPDH activity in MMF-treated renal transplant patients is correlated 337
with IMPDH type II 3757T > C polymorphism. Pharmacogenet Genom 2009; 19: 626-634. 338
22. Naesens M, Kuypers DR, Verbeke K, Vanrenterghem Y. Multidrug resistance protein 2 genetic 339
polymorphisms influence mycophenolic acid exposure in renal allograft recipients. 340
Transplantation 2006; 82: 1074-1084. 341
23. Djebli N, Picard N, Rerolle JP, Le Meur Y, Marquet P. Influence of the UGT2B7 promoter 342
region and exon 2 polymorphisms and comedications on acyl-MPAG production in vitro and in 343
adult renal transplant patients. Pharmacogenet Genom 2007; 17: 321-330. 344
24. Kawanishi M, Yano I, Yoshimura K, Yamamoto T, Hashi S, Masuda S et al. Sensitive and 345
validated LC-MS/MS methods to evaluate mycophenolic acid pharmacokinetics and 346
pharmacodynamics in hematopoietic stem cell transplant patients. Biomed Chromatogr 2015; 347
29: 1309-1316. 348

23
25. Savic RM, Jonker DM, Kerbusch T, Karlsson MO. Implementation of a transit compartment 349
model for describing drug absorption in pharmacokinetic studies. J Pharmacokinet Pharacodyn 350
2007; 34: 711-726. 351
26. Jiao Z, Ding JJ, Shen J, Liang HQ, Zhong LJ, Wang Y et al. Population pharmacokinetic 352
modelling for enterohepatic circulation of mycophenolic acid in healthy Chinese and the 353
influence of polymorphisms in UGT1A9. Br J Clin Pharmacol 2008; 65: 893-907. 354
27. Funaki T. Enterohepatic circulation model for population pharmacokinetic analysis. J Pharm 355
Pharmacol 1999; 51: 1143-1148. 356
28. Karlsson MO, Sheiner LB. The importance of modeling interoccasion variability in population 357
pharmacokinetic analyses. J Pharmacokinet Biopharm 1993; 21: 735-750. 358
29. Yoshimura K, Yano I, Kawanishi M, Nakagawa S, Yonezawa A, Matsubara K. 359
Pharmacokinetics and pharmacodynamics of mycophenolic acid in Nagase analbuminemic rats: 360
Evaluation of protein binding effects using the modeling and simulation approach. Drug Metab 361
Pharmacoket 2015; 30: 441-448. 362
24
30. Upton RN, Mould DR. Basic concepts in population modeling, simulation, and model-based 363
drug development: part 3-introduction to pharmacodynamic modeling methods. CPT 364
Pharmacometrics Syst Pharmacol 2014; 3: e88. 365
31. Bergstrand M, Hooker AC, Wallin JE, Karlsson MO. Prediction-corrected visual predictive 366
checks for diagnosing nonlinear mixed-effects models. AAPS J 2011; 13: 143-151. 367
32. Beal SL. Ways to fit a PK model with some data below the quantification limit. J Pharmacokinet 368
Pharmacodyn 2001; 28: 481-504. 369
33. Chaudhry HM, Bruce AJ, Wolf RC, Litzow MR, Hogan WJ, Patnaik MS et al. The Incidence and 370
Severity of Oral Mucositis among Allogeneic Hematopoietic Stem Cell Transplantation Patients: 371
A Systematic Review. Biol Blood Marrow Transplant 2016; 22: 605-616. 372
34. van Hest RM, Doorduijn JK, de Winter BC, Cornelissen JJ, Vulto AG, Oellerich M et al. 373
Pharmacokinetics of mycophenolate mofetil in hematopoietic stem cell transplant recipients. 374
Ther Drug Monit 2007; 29: 353-360. 375
35. Kemmner S, Verbeek M, Heemann U. Renal dysfunction following bone marrow transplantation. 376
J Nephrol. 2017; 30: 201-209. 377
25
36. Sam WJ, Akhlaghi F, Rosenbaum SE. Population pharmacokinetics of mycophenolic acid and 378
its 2 glucuronidated metabolites in kidney transplant recipients. J Clin Pharmacol 2009; 49: 379
185-195. 380
37. Nowak I, Shaw LM. Mycophenolic-acid binding to human serum-albumin - characterization and 381
relation to pharmacodynamics. Clin Chem 1995; 41: 1011-1017. 382
38. Cornell RF, Hari P, Drobyski WR. Engraftment syndrome after autologous stem cell 383
transplantation: an update unifying the definition and management approach. Biol Blood Marrow 384
Transplant 2015; 21: 2061-2068 385
39. Sahin U, Toprak SK, Atilla PA, Atilla E, Demirer T. An overview of infectious complications 386
after allogeneic hematopoietic stem cell transplantation. J Infect Chemother 2016; 22: 505-514 387
40. Nagai M, Natsumeda Y, Weber G. Proliferation-linked regulation of type-II IMP dehydrogenase 388
gene in human normal lymphocytes and HL-60 leukemic-cells. Cancer Res 1992; 52: 258-261. 389
41. Nagai M, Natsumeda Y, Konno Y, Hoffman R, Irino S, Weber G. Selective up-regulation of 390
type-II Inosine 5'-monophosphate dehydrogenase messenger RNA expression in human 391
leukemias. Cancer Res 1991; 51: 3886-3890. 392

26
42. Uchida N, Wake A, Nakano N, Ishiwata K, Takagi S, Tsuji M et al. Mycophenolate and 393
tacrolimus for graft-versus-host disease prophylaxis for elderly after cord blood transplantation: 394
a matched pair comparison with tacrolimus alone. Transplantation. 2011; 92: 366-371. 395
396
27
Figure legends 397
Fig. 1 Overview of the basic pharmacokinetic and pharmacodynamic model characterizing mycophenolic 398
acid (MPA), MPA glucuronide (MPAG), MPA acylglucuronide (AcMPAG), and 399
inosine-5’-monophosphate dehydrogenase (IMPDH). GI, gastrointestinal tract; Ka, first-order absorption 400
rate constant; CLMPA, clearance of MPA; CLMPAG, clearance of MPAG; CLAcMPAG, clearance of 401
AcMPAG; VMPA, volume of distribution of MPA; VMPAG, volume of distribution of MPAG; VAcMPAG, 402
volume of distribution of AcMPAG; KEHC, first-order rate constant of enterohepatic circulation; FM1, 403
fraction of MPA converted to MPAG. 404
405
Fig. 2 Interoccasional pharmacokinetic and pharmacodynamic parameters between one and three weeks 406
after initiation of mycophenolate mofetil (MMF) therapy. (A) The first-order absorption rate constant 407
(Ka); (B) relative bioavailability (F); (C) clearance of MPAG (CLMPAG); (D) clearance of AcMPAG 408
(CLAcMPAG); (E) first-order rate constant for the enterohepatic circulation (KEHC); (F) baseline IMPDH 409
activity (E0). 410
411
28
Fig. 3 Goodness-of-fit plots of the observed versus population predictions (A-D) or individual predictions 412
(E-H) using the final model. (A and E) MPA concentrations; (B and F) MPAG concentrations; (C and G) 413
AcMPAG concentrations; (D and H) IMPDH activity. Each dotted line denotes the line of identity. 414
415
Fig. 4 Prediction corrected visual predictive check plots. All open circles represent the observed 416
concentrations or IMPDH activities (prediction corrected). (A-D) one week after initiation of MMF 417
therapy; (E-H) three weeks after initiation of MMF therapy. The solid line represents the median of the 418
observed data. The dotted line represents the observed 5th and 95th percentiles. The shaded area denotes 419
the simulation-based 95% confidence interval for the median or the 5th and 95th percentiles. 420
421
Fig. 5 Simulation for the effects of creatinine clearance (CLCR) and diarrhea on the pharmacokinetics and 422
pharmacodynamics of MPA in typical patients based on the final population model. (A) AUC0-8 of MPA; 423
(B) AUC0-8 of MPAG; (C) AUC0-8 of AcMPAG; (D) AUEC0–8 of IMPDH activity. The dose of MMF 424
was fixed to 500 mg every 8 h. Each box plot represents the 5th percentile, lower quartile, median, upper 425
quartile, and 95th percentile values obtained from 1000 simulated data sets. *; p < 0.05; ***; p < 0.001, 426
significantly different from the group with a CLCR of 120 mL/min by the Kruskal-waillis test following 427
29
by the Dunn test. †; p < 0.05;†††; p < 0.001, significantly different from the same CLCR without diarrhea 428
by the Kruskal-waillis test following by the Dunn test. 429
430
Fig. 6 Simulation for the effects of serum albumin (A and B) and C-reactive protein (CRP) (C and D) on 431
the pharmacokinetics and pharmacodynamics of MPA in typical patients based on the final population 432
model. The dose of MMF was fixed to 500 mg every 8 h. (A) AUC0-8 of MPA; (B) AUEC0-8 of IMPDH 433
activity; (C) the relationship between the MPA plasma concentration and IMPDH activity. The dotted, 434
thin, and thick lines represent 0.1, 1.2, and 10 mg/dL of CRP, respectively. The vertical line represents 435
the MPA concentration of 3.59 µg/mL (the population mean of IC50 in the case of CRP 1.2 mg/dL); (D) 436
AUEC0-8 of IMPDH activity. Each box plot represents the 5th percentile, lower quartile, median, upper 437
quartile, and 95th percentile values obtained from 1000 simulated data sets. ***; p < 0.001, significantly 438
different from the group of 4.2 mg/dL of serum albumin by the Kruskal-waillis test following by the 439
Dunn test. †††; p < 0.001, significantly different from the group of 0.1 mg/dL of CRP by the 440
Kruskal-waillis test following by the Dunn test. 441

Fig. 1
MPACentralVMPA
MPAGCentralVMPAG
AcMPAGCentralVAcMPAG
GI
IMPDH
Ka
KEHC
FM1×CLMPA
(1-FM1)×CLMPACLMPAG
CLAcMPAG
DOSE
!
! !

Fig. 2
1 week 3 week0
2
4
6
Ka (h
-1)
1 week 3 week0.0
0.5
1.0
1.5
2.0
2.5
F
1 week 3 week0
1
2
3
4
5
CL M
PAG
(L/h
)
1 week 3 week0
200
400
600
800
1000
E 0(µ
mol·s
ec-1·m
ol A
MP-1
)
1 week 3 week0
2
4
6
8
CL Ac
MPA
G (L
/h)
(A) (B) (C)
(D) (E)
1 week 3 week0.0
0.1
0.2
0.3
0.4K EH
C (h
-1)
(F)
O>-------;Q
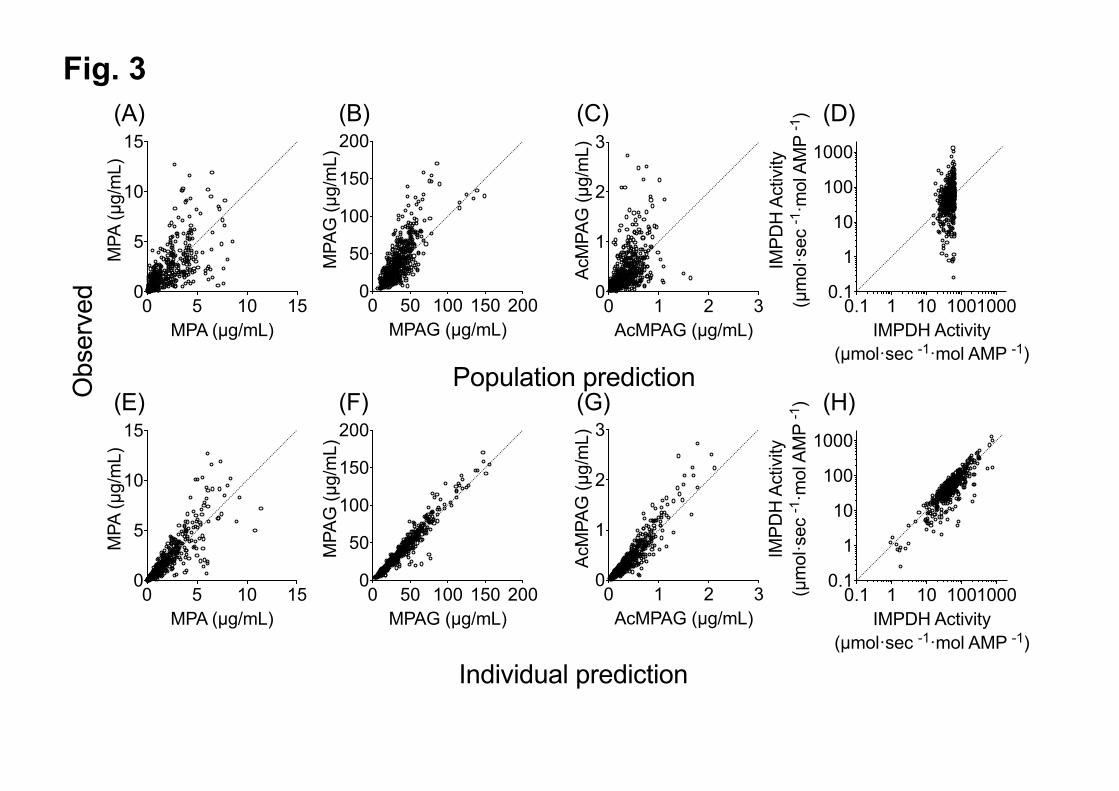
Fig. 3
0 5 10 150
5
10
15
MPA (µg/mL)
MPA
(µg/
mL)
0 5 10 150
5
10
15
MPA (µg/mL)
MPA
(µg/
mL)
0 50 100 150 2000
50
100
150
200
MPAG (µg/mL)M
PAG
(µg/
mL)
0 50 100 150 2000
50
100
150
200
MPAG (µg/mL)
MPA
G (µ
g/m
L)0 1 2 3
0
1
2
3
AcMPAG (µg/mL)
AcM
PAG
(µg/
mL)
0.1 1 10 10010000.1
1
10
100
1000
IMPDH Activity(µmol·sec -1·mol AMP -1)
IMPD
H A
ctiv
ity(µ
mol·s
ec -1·m
ol A
MP
-1)
0.1 1 10 10010000.1
1
10
100
1000
IMPDH Activity(µmol·sec -1·mol AMP -1)
IMPD
H A
ctiv
ity(µ
mol·s
ec -1·m
ol A
MP
-1)
Population prediction
Individual prediction
0 1 2 30
1
2
3
AcMPAG (µg/mL)
AcM
PAG
(µg/
mL)
Obs
erve
d(A) (B) (C) (D)
(E) (F) (G) (H)
0
0 0
8 0
80 0
0
0 0
0
,t, 00
0
o0
0
0 0
0
0
o0
0 O 00
8 0
0 00 o 0
0 000
0 0
o oo oo//./ 0 0 .. •····
00 O.·/
OO O O O •.•.• ·•··
'\,o0 ... •· ... •· 0
'i, ./ '// .. •·············t .......... 80
.. / Oo"
... •··············· 0
J./
~: 0.vi
.9-·!1···, 0 8 o./ 0 o
o .. l) o ..... Q90
.. •················ 0

Fig. 4
0 4 8 120
5
10
15
20
MPA
(µg/
mL)
0 4 8 120
50
100
150
MPA
G (µ
g/m
L)
0 4 8 120
1
2
3
4
5
AcM
PAG
(µg/
mL)
0 4 8 120
5
10
15
20
MPA
(µg/
mL)
0 4 8 120
50
100
150
MPA
G (µ
g/m
L)
0 4 8 120
1
2
3
4
5
AcM
PAG
(µg/
mL)
0 4 8 121
10
100
1000
IMPD
H a
ctiv
ity(µ
mol·s
ec -1·m
ol A
MP
-1)
(A) (B) (C) (D)
(E) (F) (G) (H)
Time after dosing (h)
0 4 8 121
10
100
1000
IMPD
H a
ctiv
ity(µ
mol·s
ec -1·m
ol A
MP
-1)
0 0 0
0
0 @
0
0
0
"'- 0
0 0
8 --,,_ __ .., _______ _
!l ! J..r-;~ ;-~ -J § 0 §
------s ·----%-----------------0----0 0 0
8
0 0 0
0 0
0
0
G/,--'\,,, 0
0
• 0 0
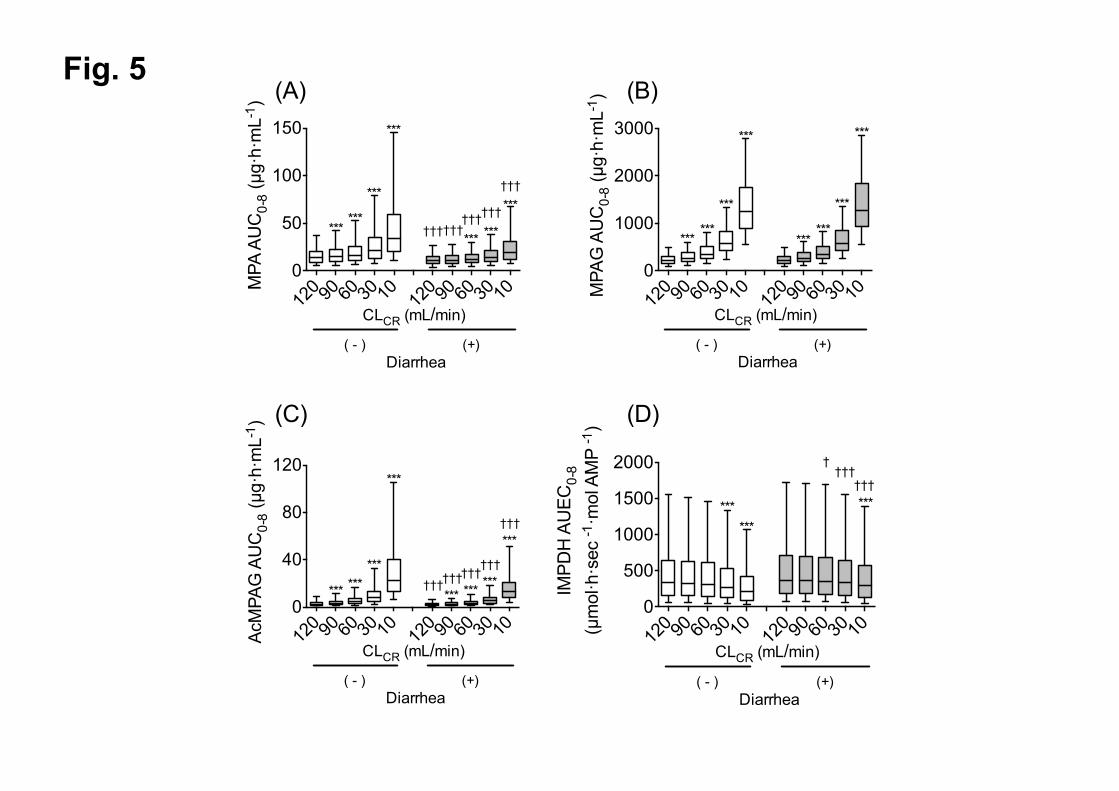
Fig. 5
120 90 60 30 10 12
0 90 60 30 100
50
100
150
CLCR (mL/min)
MPA
AU
C0-
8 (µ
g·h·
mL-1
)
Diarrhea( - ) (+)
***
******
***
†††
***
*** ***
†††
†††††††††
120 90 60 30 10 12
0 90 60 30 100
40
80
120
CLCR (mL/min)
AcM
PAG
AU
C0-
8 (µ
g·h·
mL-1
)
*********
***
Diarrhea( - ) (+)
*********
***†††
††††††††††††
120 90 60 30 10 12
0 90 60 30 100
1000
2000
3000
CLCR (mL/min)
MPA
G A
UC
0-8
(µg·
h·m
L-1)
***
******
***
Diarrhea( - ) (+)
***
******
***
120 90 60 30 10 12
0 90 60 30 100
500
1000
1500
2000
CLCR (mL/min)
IMPD
H A
UEC
0-8
(µm
ol·h·s
ec -1·m
ol A
MP
-1)
******
††††††
†
Diarrhea( - ) (+)
***
(A) (B)
(C) (D)
ffl-t
t{I]
----
---i
t-IT
:J--
----
--
t-IT
:J--
----
--
i-(I
J---
----
---
~
~
t-C
CJ-
----
----
t-
CC
J---
----
--
t-C
CJ-
----
----
t-
IT:J
----
----
i-
[IJ-
----
----
-
l{]]--
-i
fil--
1 t{
[}--
--i
t{I]
----
----
t
~
l{Il--
l t{I
l--1
l{Il-
t l[}
---i
ID--
----
-,
t[}-i
1{[1--
1 @
--,
t-{I
]---
--i
~
t[}-i
1{[1--
1 @
--,
t-{I
]---
--i
~

Fig. 6
4.2 3.2 2.20
10
20
30
40
Albumin (g/dL)
MPA
AU
C0-
8 (µ
g·h·
mL-1
)
***
***
0 4 8 120
20
40
60
80
MPA concentration (µg/mL)
IMPD
H A
ctiv
ity(µ
mol·s
ec -1·m
ol A
MP
-1) 0.1
1.210
4.2 3.2 2.20
500
1000
1500
2000
Albumin (g/dL)
IMPD
H A
UEC
0-8
(µm
ol·h·s
ec -1·m
ol A
MP
-1)
0.1 1.2 100
500
1000
1500
2000
CRP (mg/dL)
IMPD
H A
UEC
0-8
(µm
ol·h·s
ec -1·m
ol A
MP
-1) †††
†††
(A) (B)
(C) (D)
··• ................................ .
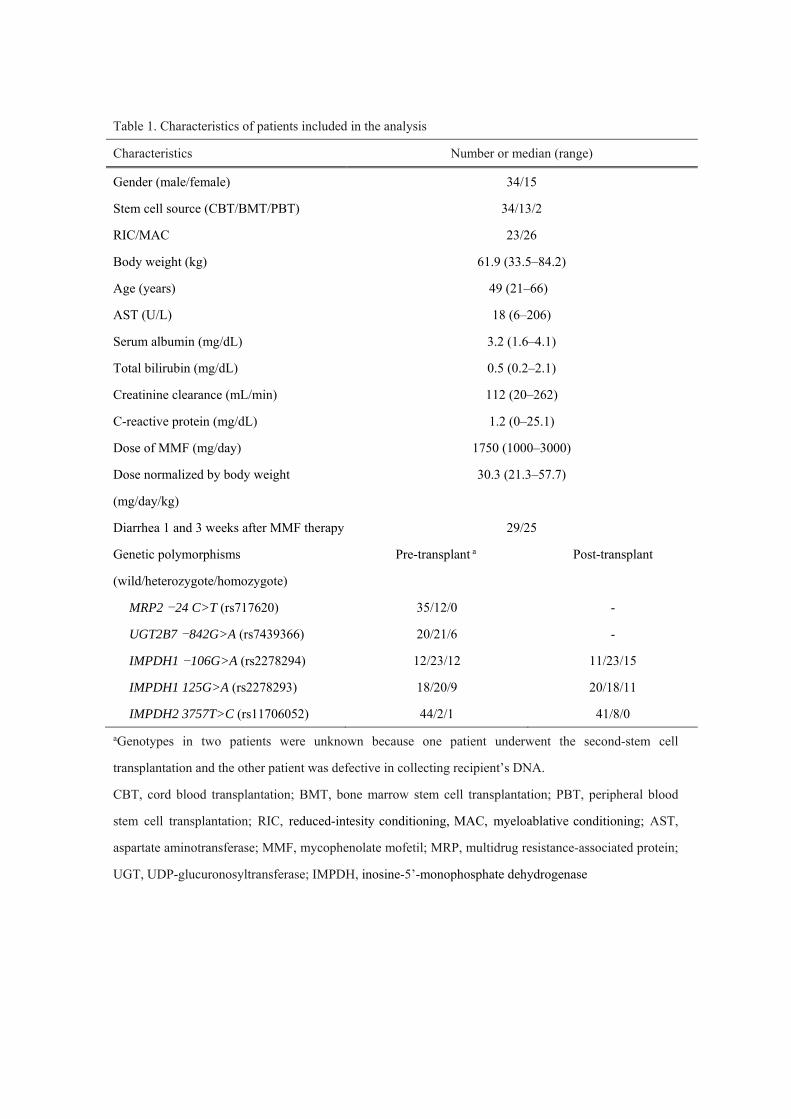
Table 1. Characteristics of patients included in the analysis
Characteristics Number or median (range)
Gender (male/female) 34/15
Stem cell source (CBT/BMT/PBT) 34/13/2
RIC/MAC 23/26
Body weight (kg) 61.9 (33.5–84.2)
Age (years) 49 (21–66)
AST (U/L) 18 (6–206)
Serum albumin (mg/dL) 3.2 (1.6–4.1)
Total bilirubin (mg/dL) 0.5 (0.2–2.1)
Creatinine clearance (mL/min) 112 (20–262)
C-reactive protein (mg/dL) 1.2 (0–25.1)
Dose of MMF (mg/day) 1750 (1000–3000)
Dose normalized by body weight
(mg/day/kg)
30.3 (21.3–57.7)
Diarrhea 1 and 3 weeks after MMF therapy 29/25
Genetic polymorphisms
(wild/heterozygote/homozygote)
Pre-transplant a Post-transplant
MRP2 −24 C>T (rs717620) 35/12/0 -
UGT2B7 −842G>A (rs7439366) 20/21/6 -
IMPDH1 −106G>A (rs2278294) 12/23/12 11/23/15
IMPDH1 125G>A (rs2278293) 18/20/9 20/18/11
IMPDH2 3757T>C (rs11706052) 44/2/1 41/8/0
aGenotypes in two patients were unknown because one patient underwent the second-stem cell
transplantation and the other patient was defective in collecting recipient’s DNA.
CBT, cord blood transplantation; BMT, bone marrow stem cell transplantation; PBT, peripheral blood
stem cell transplantation; RIC, reduced-intesity conditioning, MAC, myeloablative conditioning; AST,
aspartate aminotransferase; MMF, mycophenolate mofetil; MRP, multidrug resistance-associated protein;
UGT, UDP-glucuronosyltransferase; IMPDH, inosine-5’-monophosphate dehydrogenase

Table 2. Final population pharmacokinetic and pharmacodynamic parameters of MPA
Parameters Mean RSE (%)
Pharmacokinetic parameters
Ka (h−1) 1.18 39.5
F 1 FIX -
θCL,MPA (L/h) 44.5 17.0
θV,MPA (L) 41.5 17.3
θCL,MPAG (L/h) 2.46 14.8
VMPAG (L) 17.3 17.1
θK,EHC (h-1) 0.0635 23.8
θCL,AcMPAG (L/h) 3.17 16.7
VAcMPAG (L) 5.50 15.7
Covariates
Diarrhea on KEHC 0.375 30.7
CLCR on CLMPAG 0.730 69.7
CLCR on CLAcMPAG 0.537 17.0
ALB on VMPA −3.71 29.4
ALB on CLMPA −1.02 43.2
Interindividual variability (IIV; %)
VMPA 56.9 38.3
F 84.9 6.06
Interoccasional variability (IOV; %)
Ka 97.9 24.6
F 19.1 47.7
CLMPAG 33.0 22.7
KEHC 91.2 21.9
CLAcMPAG 42.0 23.8
Residual variability (proportional error; %)
MPA concentration 40.9 12.4
MPAG concentration 18.8 10.5
AcMPAG concentration 31.4 6.53
Pharmacodynamic parameters
E0 (µmol·h·sec−1·mol AMP−1) 65.5 10.4

θIC50 (µg/mL) 3.59 20.3
Covariates
CRP on IC50 0.338 47.3
Interindividual variability (IIV, %)
IC50 81.2 45.3
Interoccasional variability (IOV, %)
E0 85.8 27.4
Residual variability (proportional error; %)
IMPDH activity 46.6 3.73
Ka, first-order absorption rate constant; F, relative bioavailability; CLMPA, clearance of MPA; VMPA,
volume of distribution of MPA; CLMPAG, clearance of MPAG; VMPAG, volume of distribution of MPAG;
KEHC, first-order rate constant of enterohepatic circulation; CLAcMPAG, clearance of AcMPAG; VAcMPAG,
volume of distribution of AcMPAG; CLCR, creatinine clearance; ALB, serum albumin concentration; E0,
baseline of IMPDH activity; IC50, half-maximal inhibitory concentration; CRP, C-reactive protein.
The final pharmacokinetic and pharmacodynamic models were described as followed: CL
θ , .
. ; V θ , . . , CL θ , . ,
K θ , 0.375 , CL θ , . , and IC θ
.. ; COV is set to 0 for patients without diarrhea and 1 for patients with diarrhea.