KARST AqUIFER AVERAGE CATCHMENT AREA … · email: [email protected] 5 University...
11
KARST AQUIFER AVERAGE CATCHMENT AREA ASSESSMENT THROUGH MONTHLY WATER BALANCE EQUATION WITH LIMITED METEOROLOGICAL DATA SET: APPLICATION TO GRZA SPRING IN EASTERN SERBIA OCENA POVPREčNEGA PRISPEVNEGA ZALEDJA V KRAšKEM VODONOSNIKU Z ENAčBO MESEčNE VODNE BILANCE Z OMEJENIMI METEOROLOšKIMI PODATKI: UPORABA NA PRIMERU IZVIRA GRZA V VZHODNI SRBIJI Vesna Ristić VAKANJAC 1 , Stevan PROHASKA 2 , Dušan POLOMčIĆ 3 , Borislava BLAGOJEVIĆ 4 & Boris VAKANJAC 5 Povzetek UDK 556.33:551.44(497.11) Vesna Ristić Vakanjac, Stevan Prohaska, Dušan Polomčić, Borislava Blagojević & Boris Vakanjac: Ocena povprečnega prispevnega zaledja v kraškem vodonosniku z enačbo mesečne vodne bilance z omejenimi meteorološkimi podatki: Uporaba na primeru izvira Grza v vzhodni Srbiji Ob pomanjkanju podrobnih raziskav kraških prispevnih za- ledij, se ob izračunih razpoložljivih zalog podtalnice in eleme- ntov enačbe vodne bilance, pogosto odraža topografska ve- likost prispevne površine, in ne dejanska, aktivna (podzemne) velikost vodonosnika. V primeru krasa se te ocene lahko zelo razlikujejo. Prispevek se ukvarja s problemom izračuna povprečne velikosti prispevnega zaledja v razmerah, ko so meteorološki podatki omejeni na padavine in temperature, in ko so podatki o pretokih razpoložljivi za daljše obdobje. Predlagana metodologija je bila uporabljena, popravljena in preizkušena na 15 izvirih v Srbiji. Rezultati dobljeni z mode- lom se razlikujejo od hidrogeoloških raziskovalnih rezultatov za 20%. Eden od proučevanih izvirov je izvir Grza, ki izvira iz kraških formacij Kučaj in Beljanica (Karpato-Balkanski lok vzhodne Srbije). V tem prispevku smo na primeru izvira Grza prikazali aplikacijo modela in potrebne izboljšave za napredek iz grafoanalitičnega v analitičen model. Povprečna velikost prispevnega zaledja je povezana s parametrom modela, ki zmanjšuje potencial dejanske evapotranspiracije na mesečni osnovi. Z modelom lahko ocenimo tako velikost prispevnega zaledja, kot tudi dejansko evapotranspiracijo in dinamično prostornino skladiščenja podzemne vode. Ključne besede: kras, podtalnica, prispevno zaledje, vodna bi- lanca, grafoanalitična metoda. 1 University of Belgrade, Faculty of Mining and Geology, 11000 Belgrade, Djušina Street 7, Serbia, e-mail: [email protected] 2 Institute for the development of water resources “Jaroslav černi” 11226 Belgrade, Jaroslava černog street 80, Serbia, e-mail: [email protected] 3 University of Belgrade, Faculty of Mining and Geology, 11000 Belgrade, Djušina Street 7, Serbia, e-mail: [email protected], tel. +381-11-3219-235 (Corresponding author) 4 University of Niš, Faculty of Civil Engineering and Architecture, 18000 Niš, Aleksandra Medvedeva 14, Serbia, e-mail: [email protected] 5 University Singidunum, Futura Faculty of Applied Ecology, 11000 Belgrade, Lazarevački drum 13-15, Serbia, e-mail: [email protected] Received/Prejeto: 18.01.2012 COBISS: 1.01 ACTA CARSOLOGICA 42/1, 109−119, POSTOJNA 2013 Abstract UDC 556.33:551.44(497.11) Vesna Ristić Vakanjac, Stevan Prohaska, Dušan Polomčić, Borislava Blagojević & Boris Vakanjac: Karst aquifer average catchment area assessment through monthly water balance equation with limited meteorological data set: Application to Grza spring in Eastern Serbia In the absence of detailed exploration of karstic catchments, the calculation of available reserves and elements of the water balance equation frequently reflect the topographic size of the catchment area, and not the actual, active (underground) size. e two differ largely where karst is concerned. e paper deals with the problem of average catchment area size estimation in the situation when meteorological data are limited to precipi- tation and temperature, but discharge records are available for long period. Proposed methodology was applied to, calibrated, and validated on 15 karst springs in Serbia. Results obtained with the model differ up to 20% from hydrogeological explora- tion results. One of investigated springs is Grza karst spring, which belongs to the karstic formation of Kučaj and Beljanica (the Carpatho-Balkanide Arch of Eastern Serbia). In this paper, we used the Grza Spring to show model application and neces- sary improvements to progress from graphoanalytical to ana- lytical model. e average catchment area is linked to the mod- el parameter that reduces potential to real evapotranspiration on monthly bases. e model potential lies in the possibility to determine not only catchment area, but real evapotranspira- tion and dynamic volume of the porous - karst groundwater storage as well. Key words: karst, groundwater, catchment area, water balance, graphoanalytical method.
-
Upload
trinhtuyen -
Category
Documents
-
view
220 -
download
5
Transcript of KARST AqUIFER AVERAGE CATCHMENT AREA … · email: [email protected] 5 University...

KARST AqUIFER AVERAGE CATCHMENT AREA ASSESSMENT THROUGH MONTHLy wATER BALANCE EqUATION wITH
LIMITED METEOROLOGICAL DATA SET: APPLICATION TO GRZA SPRING IN EASTERN SERBIA
OCENA POVPREčNEGA PRISPEVNEGA ZALEDJA V KRAšKEM VODONOSNIKU Z ENAčBO MESEčNE VODNE BILANCE Z
OMEJENIMI METEOROLOšKIMI PODATKI: UPORABA NA PRIMERU IZVIRA GRZA V VZHODNI SRBIJI
Vesna Ristić VAKANJAC1, Stevan PROHASKA2, Dušan POLOMčIĆ3, Borislava BLAGOJEVIĆ4 & Boris VAKANJAC5
Povzetek UDK 556.33:551.44(497.11)Vesna Ristić Vakanjac, Stevan Prohaska, Dušan Polomčić, Borislava Blagojević & Boris Vakanjac: Ocena povprečnega prispevnega zaledja v kraškem vodonosniku z enačbo mesečne vodne bilance z omejenimi meteorološkimi podatki: Uporaba na primeru izvira Grza v vzhodni SrbijiOb pomanjkanju podrobnih raziskav kraških prispevnih zaledij, se ob izračunih razpoložljivih zalog podtalnice in elementov enačbe vodne bilance, pogosto odraža topografska velikost prispevne površine, in ne dejanska, aktivna (podzemne) velikost vodonosnika. V primeru krasa se te ocene lahko zelo ra zlikujejo. Prispevek se ukvarja s problemom izračuna povprečne velikosti prispevnega zaledja v razmerah, ko so meteorološki podatki omejeni na padavine in temperature, in ko so podatki o pretokih razpoložljivi za daljše obdobje. Predlagana metodologija je bila uporabljena, popravljena in preizkušena na 15 izvirih v Srbiji. Rezultati dobljeni z modelom se razlikujejo od hidrogeoloških raziskovalnih rezultatov za 20%. Eden od proučevanih izvirov je izvir Grza, ki izvira iz kraških formacij Kučaj in Beljanica (KarpatoBalkanski lok vzhodne Srbije). V tem prispevku smo na primeru izvira Grza prikazali aplikacijo modela in potrebne izboljšave za napredek iz grafoanalitičnega v analitičen model. Povprečna velikost prispevnega zaledja je povezana s parametrom modela, ki zmanjšuje potencial dejanske evapotranspiracije na mesečni osnovi. Z modelom lahko ocenimo tako velikost prispevnega zaledja, kot tudi dejansko evapotranspiracijo in dinamično prostornino skladiščenja podzemne vode.Ključne besede: kras, podtalnica, prispevno zaledje, vodna bilanca, grafoanalitična metoda.
1 University of Belgrade, Faculty of Mining and Geology, 11000 Belgrade, Djušina Street 7, Serbia, email: [email protected]
2 Institute for the development of water resources “Jaroslav černi” 11226 Belgrade, Jaroslava černog street 80, Serbia, email: [email protected]
3 University of Belgrade, Faculty of Mining and Geology, 11000 Belgrade, Djušina Street 7, Serbia, email: [email protected], tel. +381113219235 (Corresponding author)
4 University of Niš, Faculty of Civil Engineering and Architecture, 18000 Niš, Aleksandra Medvedeva 14, Serbia, email: [email protected]
5 University Singidunum, Futura Faculty of Applied Ecology, 11000 Belgrade, Lazarevački drum 1315, Serbia, email: [email protected]
Received/Prejeto: 18.01.2012
COBISS: 1.01
ACTA CARSOLOGICA 42/1, 109−119, POSTOJNA 2013
Abstract UDC 556.33:551.44(497.11)Vesna Ristić Vakanjac, Stevan Prohaska, Dušan Polomčić, Borislava Blagojević & Boris Vakanjac: Karst aquifer average catchment area assessment through monthly water balance equation with limited meteorological data set: Application to Grza spring in Eastern Serbia In the absence of detailed exploration of karstic catchments, the calculation of available reserves and elements of the water balance equation frequently reflect the topographic size of the catchment area, and not the actual, active (underground) size. The two differ largely where karst is concerned. The paper deals with the problem of average catchment area size estimation in the situation when meteorological data are limited to precipitation and temperature, but discharge records are available for long period. Proposed methodology was applied to, calibrated, and validated on 15 karst springs in Serbia. Results obtained with the model differ up to 20% from hydrogeological exploration results. One of investigated springs is Grza karst spring, which belongs to the karstic formation of Kučaj and Beljanica (the CarpathoBalkanide Arch of Eastern Serbia). In this paper, we used the Grza Spring to show model application and necessary improvements to progress from graphoanalytical to analytical model. The average catchment area is linked to the model parameter that reduces potential to real evapotranspiration on monthly bases. The model potential lies in the possibility to determine not only catchment area, but real evapotranspiration and dynamic volume of the porous karst groundwater storage as well.Key words: karst, groundwater, catchment area, water balance, graphoanalytical method.

ACTA CARSOLOGICA 42/1 – 2013110
water resources in karst terrains are becoming increasingly important source for drinking water supply. In terms of quality these are high category waters, thus treatment costs are low. This is due to the ability of karst massif to accumulate certain amount of water and subsequently discharge through karst springs (white 2002). In most cases, karst massifs are forming significant dynamic and static water reserves, available for water supply during long dry periods (Bakalowicz 2005; Ford & williams 2007). These reserves are usualy estimated from water balance equation where karstic catchment area plays an important role. Poorly defined catchment area poses a problem in karst aquifer water balacing and direct result is miscalculation of water balance elements (Bonacci 1999; Bonacci et al., 2006). Additional problem is variable catchment area during dry and wet years (Ford & williams 2007, Ravbar et al. 2011), as well as groundwater piracy and bifurcation in the karst (Goldscheider et al. 2008). For these reasons, detailed and costly hydrogeological explorations are required to define size of catchment area as realistically as possible.
In the situation when exploration data are limited, hydrological approach is the only option. Groundwater
hydrograph method (Bonacci 1987) is one of the hydrologic approach representatives. The method uses the minimization of difference between simulated and observed hydrographs by varying the catchment area size. Other methods include empirical expressions for runoff deficit calculations and regional formulae (Bonacci 1987, 1999; Bonacci & Magdalenić 1993), or regional precipitation and evapotranspiration maps (Petrič 2002).
Methodology explained in section 2 of this paper is based on water balance and it uses the minimization of difference between initial and final water volume of karstic spring aquifer by varying the catchment area size. Methodology is explained in more detail in comparison to the prior publication (Stevanović et al. 2010), and case study is shown in the third and fourth part. The paper aim is the revision of previous approach. Therefore, Section 5 is dedicated to the discussion of achieved results and description of methodology weaknesses, which ends up in the form of Conclusion with directions for necessary additional research.
INTRODUCTION
METHODOLOGy
If the karstic formation is viewed as a system which transforms incoming precipitation into karst spring discharge, then the input into the system can be represented by precipitation which reaches the entire catchment area of the karst spring (Fiorillo & Doglioni 2010). Therefore, we use model for karst aquifer catchment area assessment based on general water balance equation in monthly time steps:
where pij is precipitation total [mm]; hij is spring discharge mean [mm]; Eij is the total real evapotranspiration (RET) [mm]; vij is the volume of water [mm] in the analyzed karst aquifer during the jth month; and dij is the change in water reserves in the karstic formation during the jth month of the ith year [mm]. For this form of equation (1), hij is directly dependent on karst aquifer catchment area f [km2]. This defines spatial condition for water balance application. In order to satisfy temporal condition, we use cyclicity of spring discharge process to define reference period in which the initial and
final volume of water in the analyzed karst aquifer are approximately the same:
where 0 and K stand for the beginning and end of the reference period, respectively.
water formation process in the karstic massif is stochastic in nature. This means that there is a certain stochastic rule of alternating rainy (wet) and dry periods, as well as years. For reliable estimation of water balance elements at least one full discharge cycle is required. A cycle includes one dry period and one wet period. As a cycle indicator, we use the following form of cumulative standardized mean annual discharge (Qi [m3/s]):
where: zi is standardized variable; Qi is mean annual
discharge [m3/s]; Qmean is mean discharge in the studied period [m3/s]; and sQ is standard deviation of the mean annual discharge series [m3/s].
VESNA RISTIĆ VAKANJAC, STEVAN PROHASKA, DUšAN POLOMčIĆ, BORISLAVA BLAGOJEVIĆ & BORIS VAKANJAC

ACTA CARSOLOGICA 42/1 – 2013 111
when z(t) (3) is plotted as a function of time (t), negative z values produce downward tendencies indicating presence of dry years, while positive (upward tendencies) indicate presence of wet years. The z(t) plot assists with the selection of the reference period.
In the absence of full meteorological variables data set in the reference period, we estimate daily RET assuming its nonlinear distribution after the day with precipitation:
where: t = 0, 1, 2, 3 ..., m represent days following each rainy day (τ=0); Θ is model parameter (0<Θ<1). we obtain daily pEt using slightly modified Thornthwait method (Thornthwait 1948):
where Nij is the total monthly insolation [h]; tijk is
the average daily temperature [oC] of the kth day; Ii the annual heat index; and α is a function of the annual heat index. The annual heat index is obtained using average monthly temperatures, from the following equation:
and parameter α is obtained from the polynomial
function:
we summarize daily RET in each month of the reference period to estimate Eij, for different values of model parameter Θ and calculate spring discharge monthly mean (qij) from daily mean discharge record (Qijk). Than, we start volume calculation from water balance equation (1) for the reference period in monthly time steps for each value of model parameter Θ in the form:
where Eij is a function of Θ, and hij of F. For each Θ we gradually approach the solution of equation (1) by varying value of F, until boundary condition (2) is satisfied. The goal of this optimizing procedure is to obtain graphical form of the relation Θ = f(f), represented by thick solid line on Fig.1.
we obtain the actual catchment area by extending linear tendency at extreme sections of the plot Θ = f(f) (dashed lines on Fig .1), constructing crossing angle median (straight solid line on Fig.1) and finding crossing point (Θ, f) of angle median and dependence Θ = f(f). while F is average catchment area sought, Θ is the optimal model parameter value. with this value, we recalculate water balance and obtain its real components.
with real components of water balance we estimate the dynamic volume (∆v) as the difference between the maximum (vmax) and minimum (vmin) volume of water in the karst aquifer in the reference period:
fig. 1: Obtaining actual catchment area by constructing Θ = f(f) (curved solid line), linear extensions to the ends of Θ = f(f) – dashed lines, and extensions’ crossing angle median (straight solid line).
STUDy AREA AND INPUT DATA
HyDROGEOLOGICAL PROPERTIES AND DESCRIPTION OF THE GRZA SPRING
CATCHMENT AREA
The Grza Spring drains parts of the Kučaj karstic massif (CarpathoBalkanide Arch) (Fig. 2).
The catchment area of the Grza Spring generally consists of a carbonate rock formation, with occasional fissured rocks (Cvijić 1895). There are several semipervious parts of the terrain, which constitute a virtual barrier for karst groundwater flow (Stevanović 1991) (Fig. 3).
KARST AqUIFER AVERAGE CATCHMENT AREA ASSESSMENT THROUGH MONTHLy wATER BALANCE EqUATION ...

ACTA CARSOLOGICA 42/1 – 2013112
riod lasting up to 120 days (August November), and the second in winter months (DecemberFebruary) due to low temperatures at high altetudes that contributes to detention of ice and snow. The minimum discharge of the spring is 15 l/s, but it can increase to as much as 2000 l/s or more (9.4 m3/s observed on May 9th 1989, see Fig. 5). The spring has not been captured.
INPUT DATAThere were two available sources of input data: 1) Official raingauge and weather station records from Hydrometeorological Service of Republic of Serbia, and 2) Discharge records from the Public Utility Company of Paraćin from the year 1961 to 2000.
Based on discharge records for Grza spring, mean annual discharge is calculated, standardized, and cumulative standardized mean annual discharge plotted (3). From the Z(t) plot shown on Fig. 6 we conclude that period under consideration indicates one full cycle: the end of dry years in the previous cycle (19611965), the entire wet phase of the next cycle (19661986) and the initial dry phase of the next cycle (19872000). Therefore, we consider 19612000 to be the reference period for water balancing of Grza spring catchment area.
Locations of raingauge and weather stations in the vicinity of Grza spring are shown in Fig. 2. Although sited 40 km to the Northeast from Grza spring, weather
fig. 2: Geographical location of the karst spring Grza. Legend: 1. hydrological station, 2. Raingauge, 3. Weather station, 4. Rivers and streams, 5. Karst terrain
The Grza Spring drains a large portion of the Bele Vode karstic plain. Its elevation is 420 m. The location of the spring is the lowest hypsometric point of the area, where limestones appear on the ground surface (this location is the lowest point of contact between the karst and nonkarst) (Djurović 1998; Krešić 1988). The higest point in the surface catchment area is 1049 m. The spring is connected to an Urgonian limestone/Permian sandstone interface and constitutes a cluster of groundwater sources (Marković 1954). This is a gravity type spring and the source zone displaces vertically by as much as 5 m, depending on the groundwater level in the karst aquifer. The left arm of the source emerges at the bottom of a short karstified dale, with large limestone blocks in the riverbed. The right arm is formed from cavernous channels and in lower level is in developed limestone blocks that mask the primary source (Fig 4). During highwater events, colour tracer tests have shown a link between the Velika Brezovica sinkhole and the Grza Spring (Dragišić et al. 1990) (Fig. 3).
Fig. 5 is selected to show three specific annual extreme discharges that occure at Grza spring. The first maxima occures in MarchApril due to snowmelt. The second one in the period of intensive spring and early summer rains, while the third, least intensive, in December due to winter precipitation. There are two distinct minima. The first occures in the discharge recession pe
VESNA RISTIĆ VAKANJAC, STEVAN PROHASKA, DUšAN POLOMčIĆ, BORISLAVA BLAGOJEVIĆ & BORIS VAKANJAC

ACTA CARSOLOGICA 42/1 – 2013 113
station Crni Vrh has been included in research because of being the closest station which reflects the precipitation and temperature regime at altitudes higher than 500 m, thus corresponding to hypsometric situation in the studied catchment.
fig. 3: hydrogeological map of the Grza Spring vicinity (Ristić 2007). Legend: 1. Alluvium, 2. talus, 3. proluvial deposit, 4. marl, 5. marl, 6. Limestone and conglomerate, 7. massive and thick-bedded limestone, 8. bedding limestone, 9. Limestone and dolomitic limestone, 10. massive and reef limestone, 11. Limestone with chert, 12. Clastites and limestone, 13. Sandstone and limestone, 14. Sandstone, limestone and marl, 15. Red permian sandstone, 16. Sandstone, silt and conglomerate, 17. Sandstone, lydite and argilloschist, 18. Normal geologi-cal boundary, 19. tectonic-erozion boundary, 20. magmatic body boundary, 21. Sinking anticline axis 22. fault, 23. front of thrust, 24. Spring, 25. Sinkhole, 26. Underground watershed, 27. Aquifer flow direction, determined, 28. Connection between sinkhole and karst spring, determined, 29. Unconfined/alluvial aquifer, 30. Karst aquifer, 31. fracture aquifer, 32. Area without aquifers.
Table 1 shows the degree of dependence of mean annual discharge from annual precipitation sum, and mean monthly discharge from monthly precipitation sum, measured by Pearson’s correlation coefficient for
KARST AqUIFER AVERAGE CATCHMENT AREA ASSESSMENT THROUGH MONTHLy wATER BALANCE EqUATION ...

ACTA CARSOLOGICA 42/1 – 2013114
fig. 4 Cross-sectional sketch of the Grza Spring (milojević, 1975)
fig. 5 hydrograph of karst spring Grza for 1989 year
fig. 6: Cumulative standardized mean annual discharge plot z(t) for the spring of Grza.
VESNA RISTIĆ VAKANJAC, STEVAN PROHASKA, DUšAN POLOMčIĆ, BORISLAVA BLAGOJEVIĆ & BORIS VAKANJAC

ACTA CARSOLOGICA 42/1 – 2013 115
Grza spring discharges and precipitation gauged at four stations.
Notwithstanding the results shown in Table 1, we used Crni Vrh precipitation data as input data for the
model. Grza catchment altitude ranges from 420 to 1049 m, while Ćuprija altiĆuprija altiuprija altitude is 123 m, and Crni Vrh is at 1027 m. Mean air temperature in Ćuprija for the reference period was 11oC, while it was 8.7oC at Crni Vrh. we do not differentiate precipitation between rain
and snow, because available records did not provide the distinction.
Fig. 7 shows discharge distribution chart by maximum, mean and minimum monthly discharges for the
19612000 period. Mean discharge for the reference period is 0.374 m3/s.
table 1: Coefficients of correlation (r) between precipitation and discharge data series, and stan-dard error of estimate for correlation coefficients (Sr).
Raingauge/weather station(altitude)
Annual data series Monthly data series
r Sr r Sr
Donja Mutnica (230 m.a.s.l.) 0.502 0.14 0.326 0.04Izvor (230 m.a.s.l.) 0.462 0.14 0.343 0.04Crni Vrh (1027 m.a.s.l.) 0.385 0.15 0.287 0.04Ćuprija (123 m.a.s.l.) 0.579 0.13 0.315 0.04
fig. 7: Characteristic monthly dis-charges of the Grza Spring during the 1961-2000 period (m3/s).
RESULTS
GRZA SPRING CATCHMENT AREAFor each of the model parameter values Θ = 0.01, 0.1, 0.2, ..., 0.8, 0.9, 0.95 and 0.99, we calibrated potential catchment area in equation (8) for each month in the reference period at once, with respect to boundary condition (2), and obtained plot Θ = f(f) (Fig. 8). we estimated Grza spring actual catchment area to 37.8 km2, and found optimal value of model parameter Θ = 0.87.
wATER BALANCE ELEMENTSAnnual values of the main hydrometeorological parameters for Grza spring are shown in Table 2 for the reference period. Precipitation totals and mean discharges were observed, while evapotranspiration annual totals
are calculated based on optimal value of model parameter Θ.
Table 3 shows water balance elements and other characteristics of interest, obtained for the reference period based on optimal value of model parameter q = 0.87, and for two naighbouring values: q = 0.86 and 0.88. These elements are: mean annual precipitation total P [mm], mean annual evapotranspiration total E [mm], mean discharge estimated with respect to catchment area h [mm] and observed qmean [m3/s], achieved water balance estimation accuracy in the form of volume difference (2) both in [mm] and [106 m3], mean discharge yield q [l/s/km2], discharge volume w [106 m3], and discharge coefficient j (j = h/P).
KARST AqUIFER AVERAGE CATCHMENT AREA ASSESSMENT THROUGH MONTHLy wATER BALANCE EqUATION ...

ACTA CARSOLOGICA 42/1 – 2013116
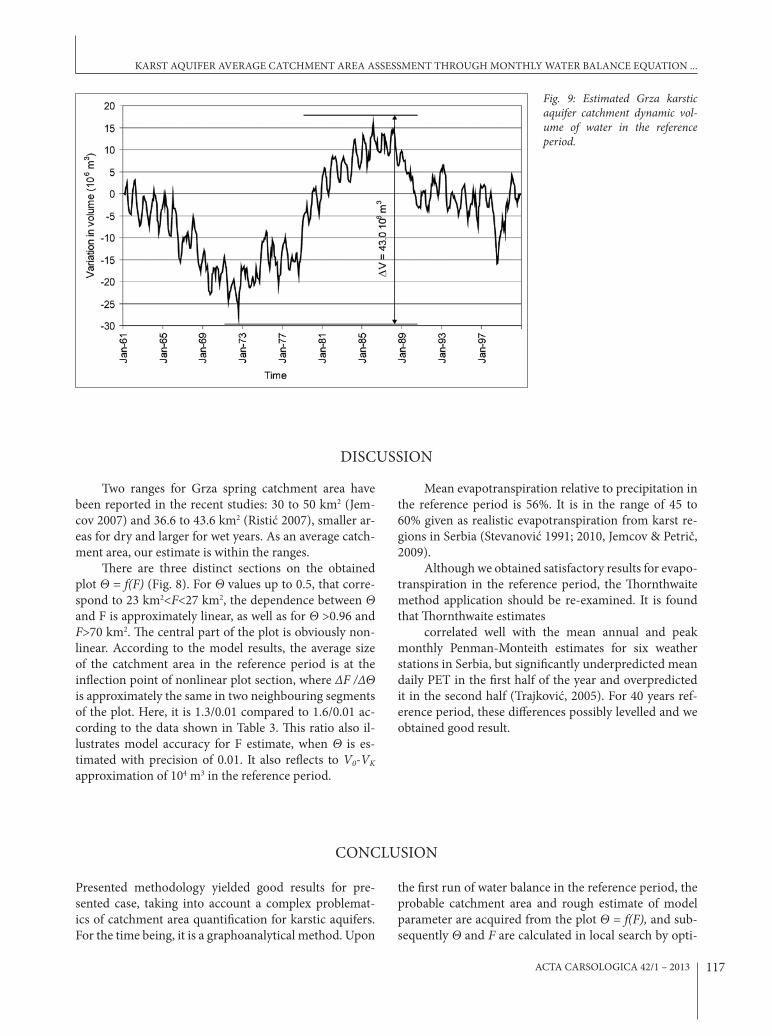
DyNAMIC VOLUMEUsing estimated monthly volumes we obtain the dynamic volume (∆V) as the difference between the maximum (Vmax) and minimum (Vmin) volume of water in the karst aquifer in the reference period, as shown in Fig. 9.
fig. 8: Estimates of actual catch-ment area (f) and optimal model parameter (Q) value for Grza spring from Q = f(f).
table 2. Observed precipitation totals (Crni vrh) and mean discharges (Grza spring), and estimated evapotranspiration totals from the model in the reference period shown by year.
Year P [mm]
E [mm]
Q [m3/s] Year P
[mm]E
[mm]Q
[m3/s] Year P [mm]
E [mm]
Q [m3/s]
1961 581 344 0.300 1975 816 559 0.396 1989 799 323 0.7801962 661 321 0.503 1976 730 388 0.396 1990 497 257 0.3851963 735 427 0.307 1977 803 472 0.434 1991 655 334 0.3261964 650 437 0.326 1978 676 358 0.316 1992 669 330 0.2951965 656 365 0.366 1979 874 421 0.235 1993 464 420 0.2381966 660 535 0.385 1980 1013 474 0.511 1994 615 480 0.2231967 639 331 0.287 1981 775 408 0.253 1995 742 458 0.3501968 531 467 0.304 1982 556 382 0.245 1996 817 353 0.4241969 776 447 0.480 1983 573 450 0.215 1997 768 423 0.4691970 1003 482 0.613 1984 589 369 0.167 1998 736 443 0.6311971 638 444 0.326 1985 815 429 0.298 1999 1047 395 0.4271972 827 471 0.327 1986 648 361 0.441 2000 504 295 0.3421973 562 402 0.259 1987 691 220 0.438
mean 710 400 0.374 1974 968 399 0.410 1988 647 319 0.537
table 3: Water balance elements for Grza spring in the period 1961-2000. Adopted elements obtained for Q = 0.87 are given in bold type.
Q F P E h V0-VK Qmean q W j[-] [km2] [mm] [mm] [mm] [mm] [106 m3] [m3/s] [l/s/km2] [106 m3] [-]
0.86 36.5710
388 323 -1 -0.0520.374
10.2 11.8 0.460.87 37.8 400 311 -1 -0.045 9.9 11.8 0.440.88 39.4 412 299 -1 -0.049 9.5 11.8 0.42
VESNA RISTIĆ VAKANJAC, STEVAN PROHASKA, DUšAN POLOMčIĆ, BORISLAVA BLAGOJEVIĆ & BORIS VAKANJAC
ACTA CARSOLOGICA 42/1 – 2013 117
fig. 9: Estimated Grza karstic aquifer catchment dynamic vol-ume of water in the reference period.
DISCUSSION
Two ranges for Grza spring catchment area have been reported in the recent studies: 30 to 50 km2 (Jemcov 2007) and 36.6 to 43.6 km2 (Ristić 2007), smaller areas for dry and larger for wet years. As an average catchment area, our estimate is within the ranges.
There are three distinct sections on the obtained plot Θ = f(f) (Fig. 8). For Θ values up to 0.5, that correspond to 23 km2<f<27 km2, the dependence between Θ and F is approximately linear, as well as for Θ >0.96 and f>70 km2. The central part of the plot is obviously nonlinear. According to the model results, the average size of the catchment area in the reference period is at the inflection point of nonlinear plot section, where ∆f /∆Θ is approximately the same in two neighbouring segments of the plot. Here, it is 1.3/0.01 compared to 1.6/0.01 according to the data shown in Table 3. This ratio also illustrates model accuracy for F estimate, when Θ is estimated with precision of 0.01. It also reflects to v0-vK approximation of 104 m3 in the reference period.
Mean evapotranspiration relative to precipitation in the reference period is 56%. It is in the range of 45 to 60% given as realistic evapotranspiration from karst regions in Serbia (Stevanović 1991; 2010, Jemcov & Petrič, 2009).
Although we obtained satisfactory results for evapotranspiration in the reference period, the Thornthwaite method application should be reexamined. It is found that Thornthwaite estimates
correlated well with the mean annual and peak monthly PenmanMonteith estimates for six weather stations in Serbia, but significantly underpredicted mean daily PET in the first half of the year and overpredicted it in the second half (Trajković, 2005). For 40 years reference period, these differences possibly levelled and we obtained good result.
CONCLUSION
Presented methodology yielded good results for presented case, taking into account a complex problematics of catchment area quantification for karstic aquifers. For the time being, it is a graphoanalytical method. Upon
the first run of water balance in the reference period, the probable catchment area and rough estimate of model parameter are acquired from the plot Θ = f(f), and subsequently Θ and f are calculated in local search by opti
KARST AqUIFER AVERAGE CATCHMENT AREA ASSESSMENT THROUGH MONTHLy wATER BALANCE EqUATION ...

ACTA CARSOLOGICA 42/1 – 2013118
mization for a range of values in the naighbourhood of rough estimates.
Since the model is based on water balance equation, it holds potential to resolve three key unknowns in the analysis of karst aquifers: (1) the size of the active catchment area from which the water flows to and is stored in the karst aquifer for many years, (2) estimate real evapotranspiration, and (3) obtain the size of the dynamic volume of the underground reservoir.
In the current form, model has been applied on 15 explored karst springs in Serbia. Results obtained for all studied karst springs follow parameters obtained from exploration data, and catchment area stands out as the the best model output. The worst estimate of catchment area differs 20% from detailed hydrogeological and speleological investigation results. However, model has two major weaknesses: lack of analytical form, particularly for Θ = f(f), and application of the Thornthwhite method for RET estimation. These weaknesses need to be resolved together.
In the future investigations we will concentrate on different methods for PET and RET estimation, especcialy those that do not require numerous input data that are not available at many weather stations. Instead of point precipitation data, we will use arial precipitation estimates, wherever raingauge records have acceptable record lengths and data gaps that could be filled. with more reliable precipitation input and estimates of RET, we would try to obtain analytical form for nonlinear section of Θ = f(f) relation, and its inflection point that would yield direct solution of model parameter and catchment area value. There are also indications that nonlinear section of Θ = f(f) points out to the range of catchment area in the reference period.
Despite the lack of a theoretical foundation for model parameter q, this method makes it possible to obtain values of karst aquifier catchment area that are approximately correct to serve as an indicator of water balance in the likely situation when area is not explored enough, and meteorological data are limited to precipitation and temperature only.
ACKNOwLEDGEMENT
The research presented in the paper is funded from the Republic of Serbia Ministry of Education and Science resources within scientific project no. 37005 ‘Assessment of Climate Change Impact on Serbian water Resources’. we would like to thank the personnel of the HydroMete
orological Service of Republic of Serbia and the Paraćin Public Utility Company for providing the data required for this research, and to three anonymous reviewers for their comments and suggestions that significantly improved the paper.
REFERENCES
Bakalowicz, M., 2005: Karst groundwater: a challenge for new resources. Hydrogeology Journal 13 (1), 148–160.
Bonacci, O., 1987: Karst hydrology, with special reference to the dinaric karst.- Springer Verlag. pp. 184, Berlin, Heidelberg.
Bonacci, O., Magdalenić, A., 1993.: The catchment area of the Sv. Ivan Karst spring in Istra (Croatia). Ground water, 31(5), 767–773.
Bonacci, O., 1999: water Circulation in Karst and Determination of Catchment Areas: Example of the River Zrmanja. Hydrological Sciences Journal des Sciences Hydrologiques, 44(3), 373–386.
Bonacci, O., Jukić, D., & I. Ljubenkov, 2006: Definition of catchment area in karst: case of the river Krcic and Krka, Croatia. Hydrological Sciences Journal des Sciences Hydrologiques, 51(4), 682–699.
Cvijić, J., 1895: Caves and Underground Hydrography of Eastern Serbia. Voice of the Serbian Royal Academy, Belgrade, 1101 (printed in Serbian).
Dragišić, V., Miladinović, B., Vukičević, R. & S. Grbović, 1990: Some New Results of Aquifer Flow Tracing in Eastern Serbian Karst. Serbian Geological Society Proceedings for year 1990, Belgrade, 119–125, (printed in Serbian).
VESNA RISTIĆ VAKANJAC, STEVAN PROHASKA, DUšAN POLOMčIĆ, BORISLAVA BLAGOJEVIĆ & BORIS VAKANJAC

ACTA CARSOLOGICA 42/1 – 2013 119
Djurović, P., 1998: Speleological Atlas of Serbia.- Serbian Academy of Sciences and Arts, Jovan Cvijic Geographical Institute, Serbian Nature Conservation Institute, University of Belgrade, Faculties of Geography and Biology, special editions, Volume 52, Belgrade, pp. 328, (printed in Serbian) .
Ford, D.C., williams, P.w., 2007: Karst hydrogeology and geomorphology.- wiley, Chichester, USA, pp. 578.
Fiorillo, F., Doglioni, A., 2010: The relations between karst spring discharge and rainfall by crosscorrelation analysis (Campania, southern Italy). Hydrogeology Journal, Vol 18 (8), 1881–1895.
Goldscheider, N., Meiman, J. & C. Smart, 2008: Tracer tests in karst hydrogeology and speleology. International Journal of Speleology 37 (1), 27–40.
Jemcov, I., 2007: water supply potential and optimal exploration capacity of karst aquifer system. Environmental Geology, Vol. 51 (5), 767–773.
Jemcov, I., Petrič M., 2009: Measured precipitation vs. effective infiltration and their influence on the assessment of karst systems based on results of the time series analysis. Journal of Hydrology 379, 304–314.
Krešić, N., 1988: Yugoslav Karst and Caves Science Books, Belgrade , pp. 149, (printed in Serbian).
Marković, J., 1954: Relief of Crnica and Grza catchment area. Geographic institute "Jovan Cvijić" of the Serbian Academy of sciences and arts, 19–83 (printed in Serbian).
Milojević, N., 1975: Hydrogeology of the Grze Spring. Faculty of Mining and Geology Proceedings, Volume 18, 117–137, Belgrade, (printed in Serbian).
Petrič, M., 2002: Characteristics of rechargedischarge relations in karst aquifer, Institut za raziskovanje krasa ZRC SAZU, Založba ZRC, PostojnaLjubljana.
Petrič, M., 2002: Characteristics of recharge-discharge relations in karst aquifer. Založba ZRC, pp. 154, PostojnaLjubljana.
Ravbar N., Engelhardt I. & N. Goldscheider, 2011: Anomalous behaviour of specific electrical conductivity at a karst spring induced by variable catchment boundaries: the case of the Podstenjšek spring. Slovenia. Hydrological Processes, Vol 25 (13), 2130–2140.
Ristić, V., 2007: development of Simulation model for Es-timation of Karst Spring daily discharges - PhD Thesis. University of Belgrade, Faculty of Mining and Geology, Belgrade, pp. 319 (printed in Serbian).
Stevanović, Z., 1991: hydrogeology of the Carpatho-bal-kanide Karst in Eastern Serbia and its Water Supply potential.- University of Belgrade, Faculty of Mining and Geology, Belgrade, pp. 245, (printed in Serbian).
Stevanović, Z., Milanović, S. & V. Ristić Vakanjac, 2010: Supportive Methods for Assessing Effective Porosity and Regulating Karst Aquifes, Acta Carsologica, Slovenia, ISSN 05836050, Volume 39, number 2, 301–312.
Thornthwaite C. w., 1948: An Approach to a Rational Classification of Climates, Geographical Review, Vol. 38, No. 1, 55–94.
Trajković S., 2005: TemperatureBased Approaches for Estimating Reference Evapotranspiration. Journal of Irrigation and Drainage Engineering, Vol. 131, No. 4, July/August 2005, 316–323.
white w., 2002: Karst hydrology: recent developments and open questions, Engineering Geology 65 (2002), 85–105.
KARST AqUIFER AVERAGE CATCHMENT AREA ASSESSMENT THROUGH MONTHLy wATER BALANCE EqUATION ...