K-Pop Idol Industryxs3d.kaist.ac.kr/Lab Activity/2014 summer lab seminar/Idol Industry... ·...
37
K-Pop Idol Industry 20100663 Minhyung Lee
Transcript of K-Pop Idol Industryxs3d.kaist.ac.kr/Lab Activity/2014 summer lab seminar/Idol Industry... ·...

K-Pop Idol Industry 20100663 Minhyung Lee

1. K-Pop Idol History 2. Idol Industry Factor
3. Regression Analysis
4. Result & Interpretation
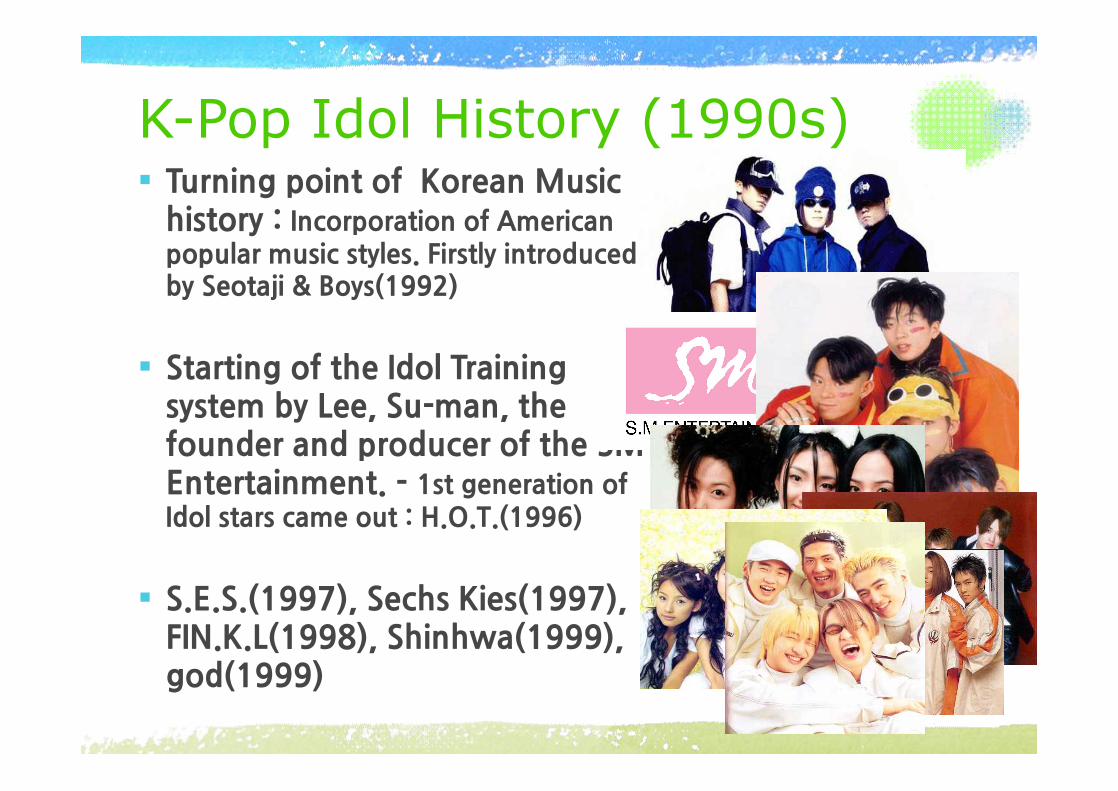
K-Pop Idol History (1990s)§ Turning�point�of��Korean�Music�
history�: Incorporation�of�American�popular�music�styles. Firstly�introduced�by�Seotaji�&�Boys(1992)
§ Starting�of�the�Idol�Training�system�by�Lee,�Su-man,�the�founder�and�producer�of�the�SM�Entertainment.�-�1st�generation�of�Idol�stars�came�out�:�H.O.T.(1996)
§ S.E.S.(1997),�Sechs�Kies(1997),�FIN.K.L(1998),�Shinhwa(1999),�god(1999)
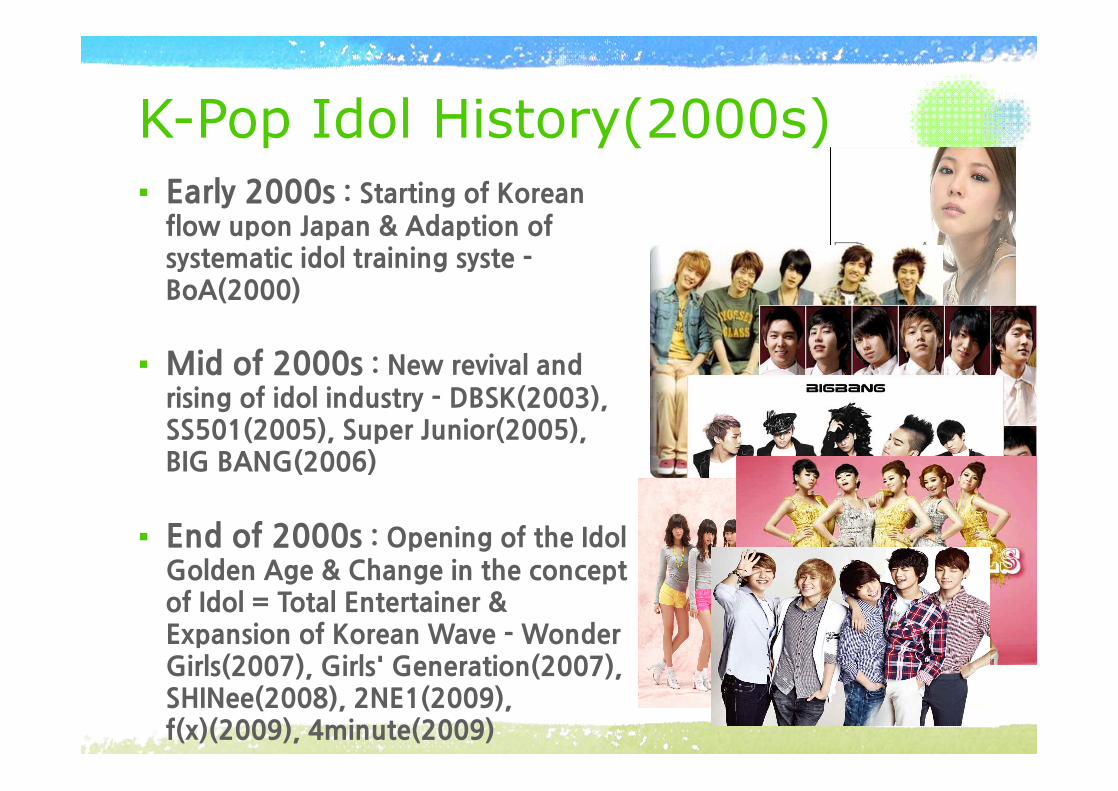
K-Pop Idol History(2000s)§ Early�2000s�:�Starting�of�Korean�
flow�upon�Japan�&�Adaption�of�systematic�idol�training�syste�-�BoA(2000)
§ Mid�of�2000s�:�New�revival�and�rising�of�idol�industry�- DBSK(2003),�SS501(2005),�Super�Junior(2005),��BIG�BANG(2006)
§ End�of�2000s�:�Opening�of�the�Idol�Golden�Age�&�Change�in�the�concept�of�Idol�=�Total�Entertainer�&�Expansion�of�Korean�Wave�-�Wonder�Girls(2007),�Girls'�Generation(2007),�SHINee(2008),�2NE1(2009),�f(x)(2009),�4minute(2009)�
K-pop Idols' Golden Age - 2010s
§ More�than�two�hundreds�of�idol�groups
§ Expansion�of�K-Pop�to�foreign�countries.
§ Korean�Wave�&�Globally�big�Fan�culture
§ Considered�as�one�step�to�be�a�star
§ Foreign�Market�is�the�main�part�of�their�profit
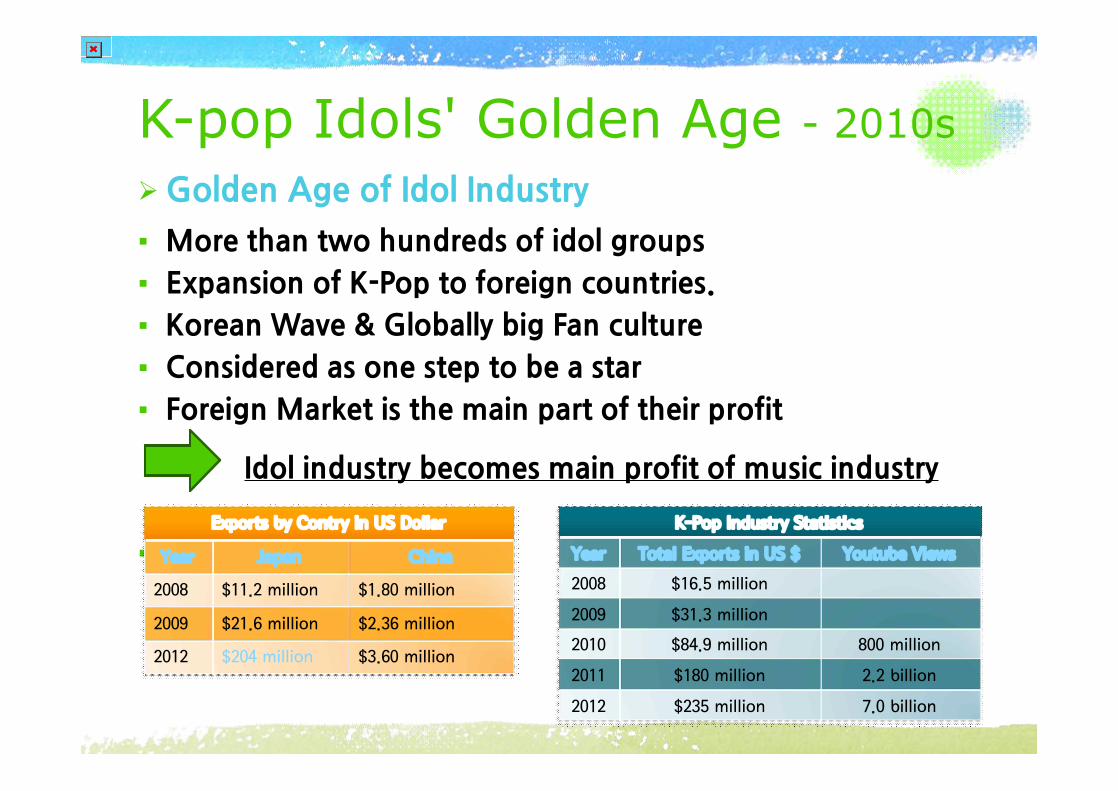
§ �.....K-Pop�Industry�Statistics
Year Total�Exports�in�US�$ Youtube�Views
2008 $16.5�million
2009 $31.3�million
2010 $84.9�million 800�million
2011 $180�million 2.2�billion
2012 $235�million 7.0�billion
Exports�by�Contry�in�US�Dollar
Year Japan China
2008 $11.2�million $1.80�million
2009 $21.6�million $2.36�million
2012 $204�million $3.60�million
Ø Golden�Age�of�Idol�Industry�
Idol�industry�becomes�main�profit�of�music�industry��

Costs for 5-member Idol GroupMontly�Fixed�Cost Cost�for�Releasing�New�Album
Rent�of�Dorm $1,000 Composition�Cost $12,000
Dance�Room $1,000 Recording�Master $8,000
Food�&�Snack $3,000 Photography $3,000
Dance�Lesson $2,000 Album�Jacket�Design $4,000
Vocal�Lesson $3,000 Costume�Design $20,000
Acting�Lesson $2,000 Music�Video�Recording $50,000
Beauty�&�Cosmetics,�Plastic�Surgery
$10,000 Promotion $100,000
Director�Casting $3,000 Hair�&�Make-up $5,000
Staff�wage $15,000 Dance�Creation $6,000
Back�Dancer�Wage $7,000
Sum $40,000 Etc $215,000
v More�than�$400,000�to�train�groups�and�release�one�album�in�6�months��
K-pop Idols' Golden Age - 2010s
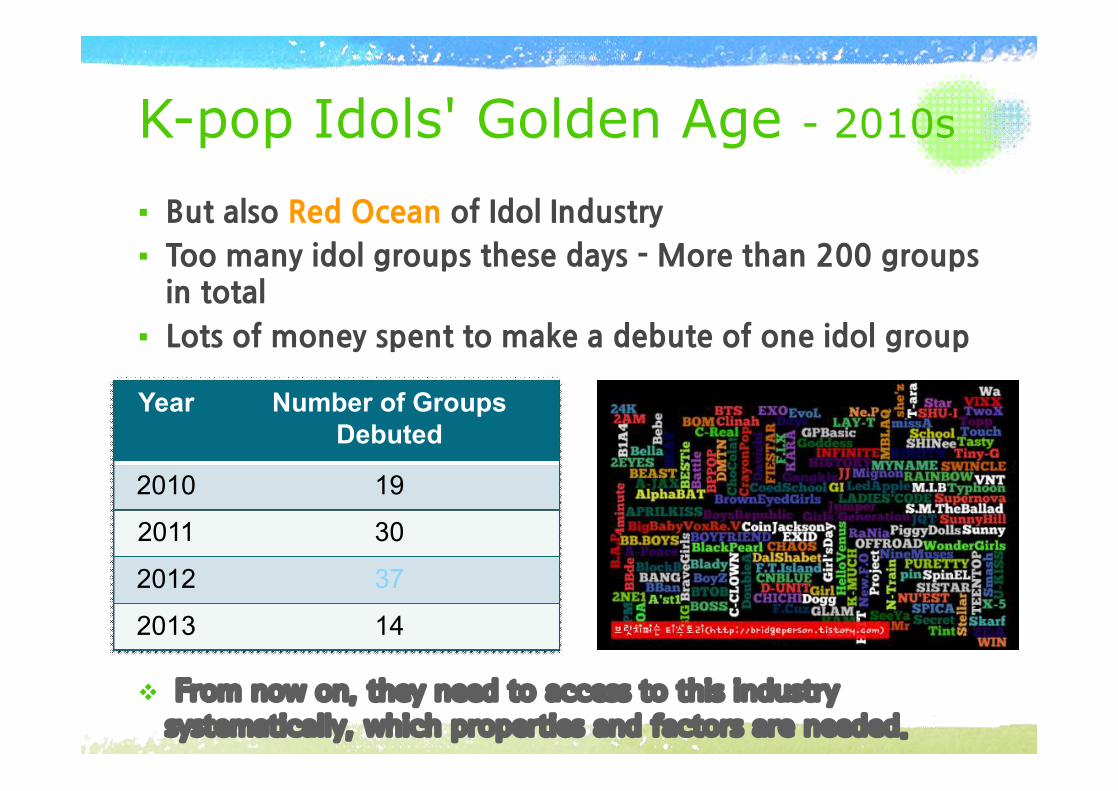
§ But�also�Red�Ocean�of�Idol�Industry
§ Too�many�idol�groups�these�days�-�More�than�200�groups�in�total
§ Lots�of�money�spent�to�make�a�debute�of�one�idol�group�
Year Number of Groups Debuted
2010 19
2011 30
2012 37
2013 14
v �From�now�on,�they�need�to�access�to�this�industry�systematically,�which�properties�and�factors�are�needed.�

1. K-Pop Idol History
2. Idol Industry Factor3. Regression Analysis
4. Result & Interpretation

K-pop Idols' Revenue
1.Streaming�Music�File��(MP3�File)
2. �Album�Sales
3.Concert�/�Musical�Performances
4.MV�Advertisements
5. Individual�Acts�(ex.�Drama�/�Movie�/�Musical)
6. International�Events

Factors related to Idol Industry
�Outer�result�of�Idol�groups
§ �Sales�amount�of�Music�albums
§ �Online�Download�Sales
§ �Number�of�View�of�Music�Videos�on�Youtube
§ Pretty,�Handsome�face�&�Skinny�body�-�TV,�Movie,�CF
§ Good�Singing�Skills�-�Basic�skill�for�singer,�Musical�Act
§ Gorgeous�Dancing�Skills�-�Basic�skill�for�k-pop�star�-�Basic�skill�for�k-pop�star
§ Number�of�Members
Ø Internal factor of Each Idol Groups
Data Collection§ Music�sales�amount�&�online�
download�from�Gaon�Chart,�
Korean�Bill-board
§ Number�of�Views�from�
Youtube
§ Dance�Level�from�WAWA�
Dance�academy
§ Information�about�each�
groups�from�Naver
§ Appearance�and�Popularity�
from�Survey
Data Collection Album Sales & Online Download Sales
§ Album�Sales�Amount�from�Album�Chart�of�Gaon�Chart
§ Music�Files�Salen�Amount�from�Download�Chart�in�Gaon�Chart
§ Some�Music�Files�didn't�have�the�data�on�the�Top�100�Download�Chart,�even�though�that�albums�were�on�the�Top�100�Album�Chart
§ I�divided�the�download�sales�amount�by�100,000,�so�that�the�scores�of�download�amount�of�all�groups�can�be�put�between�0�and�5.
Sales�Data
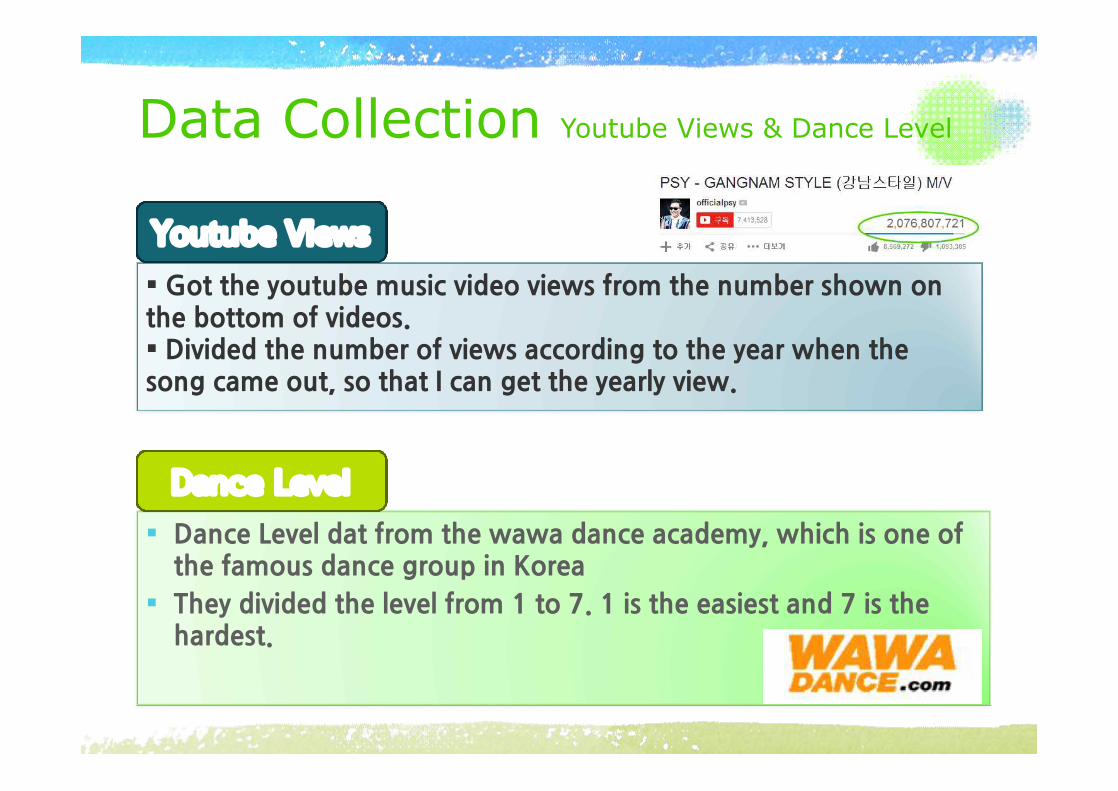
Data Collection Youtube Views & Dance Level
§ Dance�Level�dat�from�the�wawa�dance�academy,�which�is�one�of�the�famous�dance�group�in�Korea
§ They�divided�the�level�from�1�to�7.�1�is�the�easiest�and�7�is�the�hardest.
§�Got�the�youtube�music�video�views�from�the�number�shown�on�the�bottom�of�videos.�§�Divided�the�number�of�views�according�to�the�year�when�the�song�came�out,�so�that�I can�get�the�yearly�view.
Dance�Level
Youtube�Views

Data Collection Appearance & Popularity
§�For�Popularity�data,�I�got�the�data�of�each�group�from�the�survey.§�Popularity�score�is�from�1�to�10.�10�is�the�most�popular�group.§�For�equality,�I�divided�the�score�according�to�each�groups'�debute�year,�because�usually�the�old�groups�have�more�popularity.
§ For�appearance�data,�I�got�the�data�of�each�members�in�one�group�and�divided�the�sum�of�the�scores�by�the�number�of�members,�so�that�I could�get�the�average�appearance�data.
§ Apperance�score�is�from�1�to�5.�5�is�the�most�gorgeous�looking
Appearance
Popularity

Data
1. K-Pop Idol History
2. Idol Industry Factor
3. Regression Analysis4. Result & Interpretation
Regression Model 1(Album Sales Amount)
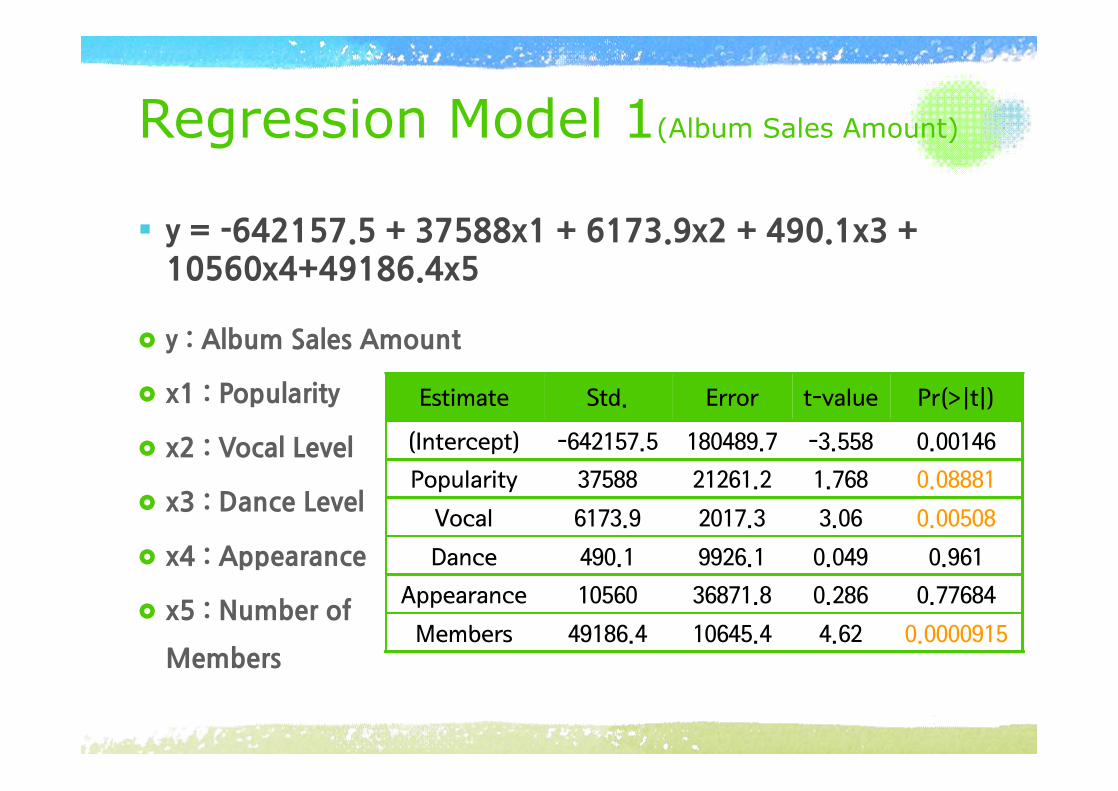
§ y�=�-642157.5�+�37588x1�+�6173.9x2�+�490.1x3�+�10560x4+49186.4x5
£ y�:�Album�Sales�Amount
£ x1�:�Popularity
£ x2�:�Vocal�Level
£ x3�:�Dance�Level
£ x4�:�Appearance
£ x5�:�Number�of�
Members
Estimate Std. Error t-value Pr(>|t|)
(Intercept) -642157.5 180489.7 -3.558 0.00146
Popularity 37588 21261.2 1.768 0.08881
Vocal 6173.9 2017.3 3.06 0.00508
Dance 490.1 9926.1 0.049 0.961
Appearance 10560 36871.8 0.286 0.77684
Members 49186.4 10645.4 4.62 0.0000915
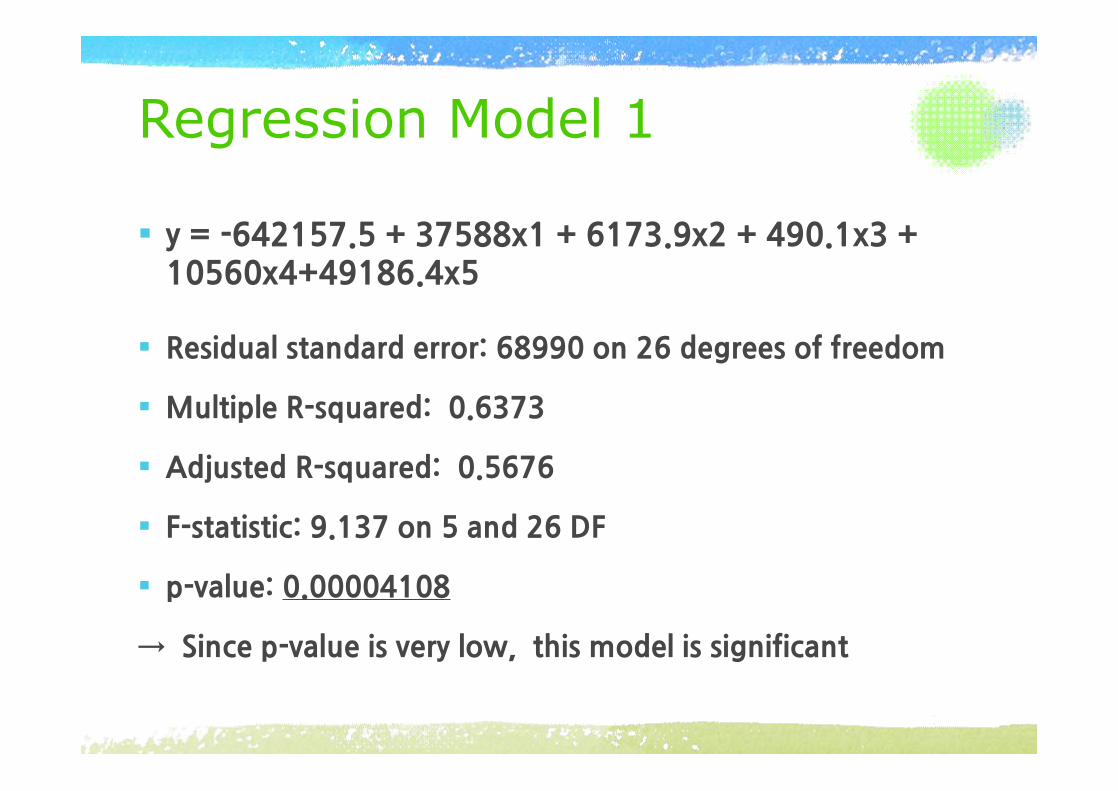
Regression Model 1
§ Residual�standard�error:�68990�on�26�degrees�of�freedom
§ Multiple�R-squared:��0.6373
§ Adjusted�R-squared:��0.5676�
§ F-statistic:�9.137�on�5�and�26�DF
§ p-value:�0.00004108 ���
→��Since�p-value�is�very�low,��this�model�is�significant
§ y�=�-642157.5�+�37588x1�+�6173.9x2�+�490.1x3�+�10560x4+49186.4x5
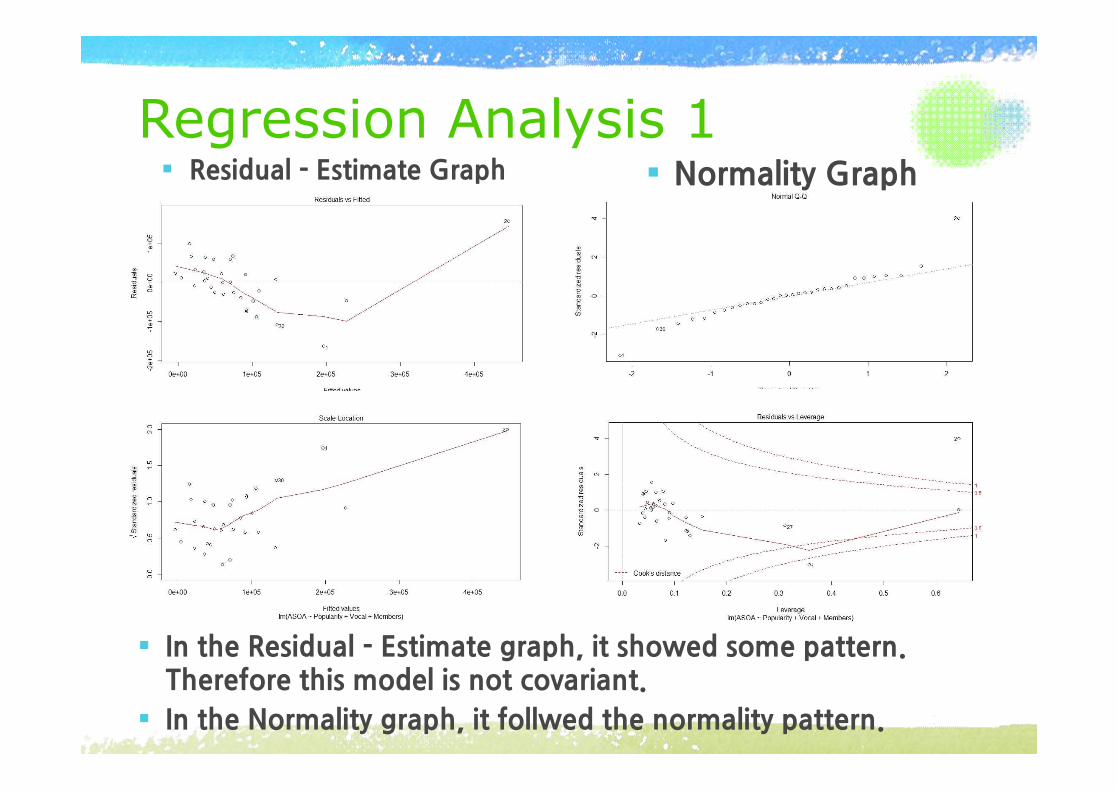
Regression Analysis 1
§ In�the�Residual�-�Estimate�graph,�it�showed�some�pattern.�Therefore�this�model�is�not�covariant.
§ In�the�Normality�graph,�it�follwed�the�normality�pattern.
§ Residual�-�Estimate�Graph § Normality�Graph
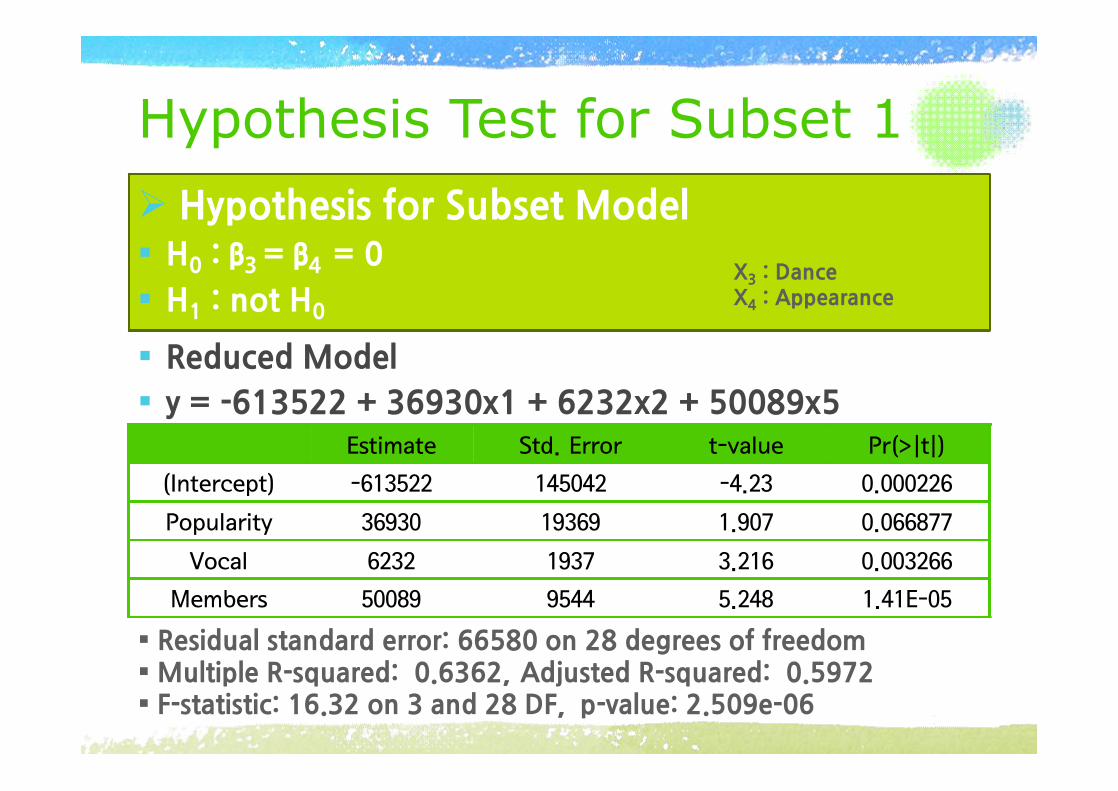
Hypothesis Test for Subset 1 Ø�Hypothesis�for�Subset�Model§ H0�:�β3�=�β4��=�0�
§ H1�:�not�H0
X3�:�DanceX4�:�Appearance
Estimate Std.�Error t-value Pr(>|t|)
(Intercept) -613522 145042 -4.23 0.000226
Popularity 36930 19369 1.907 0.066877
Vocal 6232 1937 3.216 0.003266
Members 50089 9544 5.248 1.41E-05
§�Residual�standard�error:�66580�on�28�degrees�of�freedom�§�Multiple�R-squared:��0.6362, Adjusted�R-squared:��0.5972�§�F-statistic:�16.32�on�3�and�28�DF,��p-value:�2.509e-06
§ Reduced�Model
§ y�=�-613522�+�36930x1�+�6232x2�+�50089x5

Hypothesis Test Result 1
Ø Result§ y�=�-613522�+�36930x1�+�6232x2�+�50089x5
§F�=�{(124140000000��123746958742)�/�2}�/�
(123746958742/26)�=�0.04129
§0.04129�<�F�0.95(2, 26)�=��3.37,�so�H0 is�not�rejected�
§As�a�result, Reduced�Model�is�more�adequate.
Ø�Hypothesis�for�Subset�Model§ H0�:�β3�=�β4��=�0�
§ H1�:�not�H0
X3�:�DanceX4�:�Appearance
Regression Model 2 (Online Download Sales)
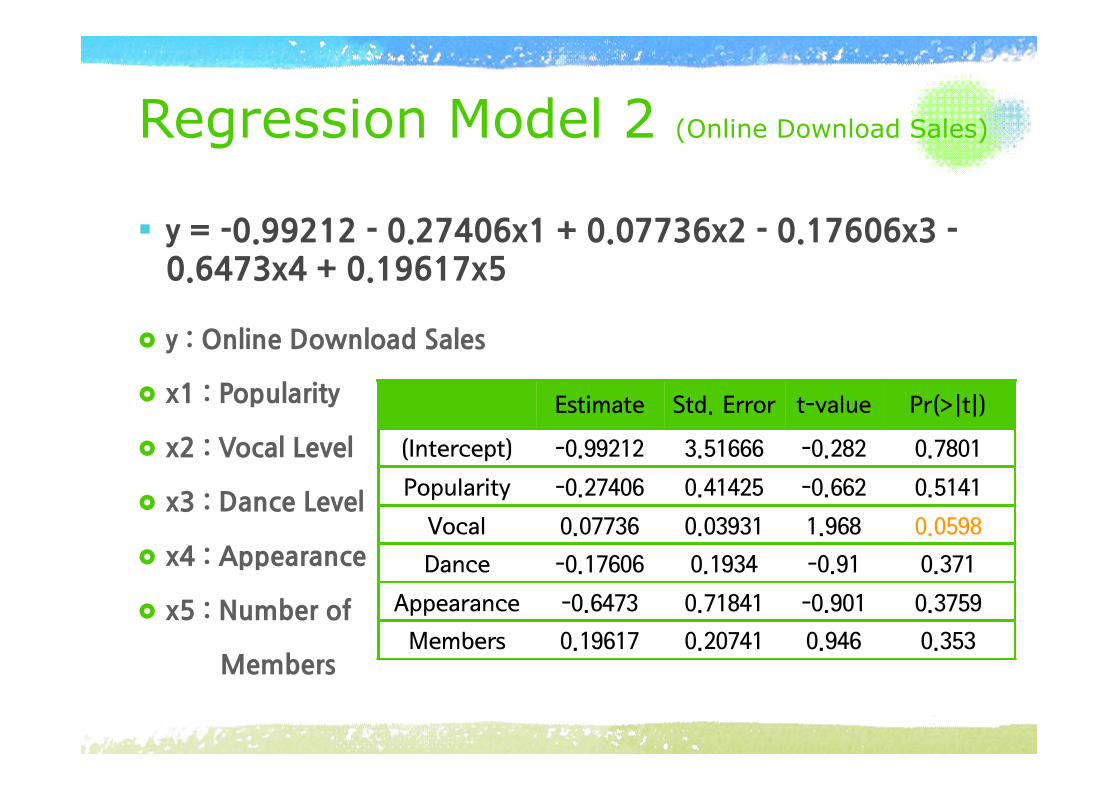
§ y�=�-0.99212�-�0.27406x1�+�0.07736x2�-�0.17606x3�-�0.6473x4�+�0.19617x5
£ y�:�Online�Download�Sales
£ x1�:�Popularity
£ x2�:�Vocal�Level
£ x3�:�Dance�Level
£ x4�:�Appearance
£ x5�:�Number�of�
�����������Members
Estimate Std.�Error t-value Pr(>|t|)
(Intercept) -0.99212 3.51666 -0.282 0.7801
Popularity -0.27406 0.41425 -0.662 0.5141
Vocal 0.07736 0.03931 1.968 0.0598
Dance -0.17606 0.1934 -0.91 0.371
Appearance -0.6473 0.71841 -0.901 0.3759
Members 0.19617 0.20741 0.946 0.353
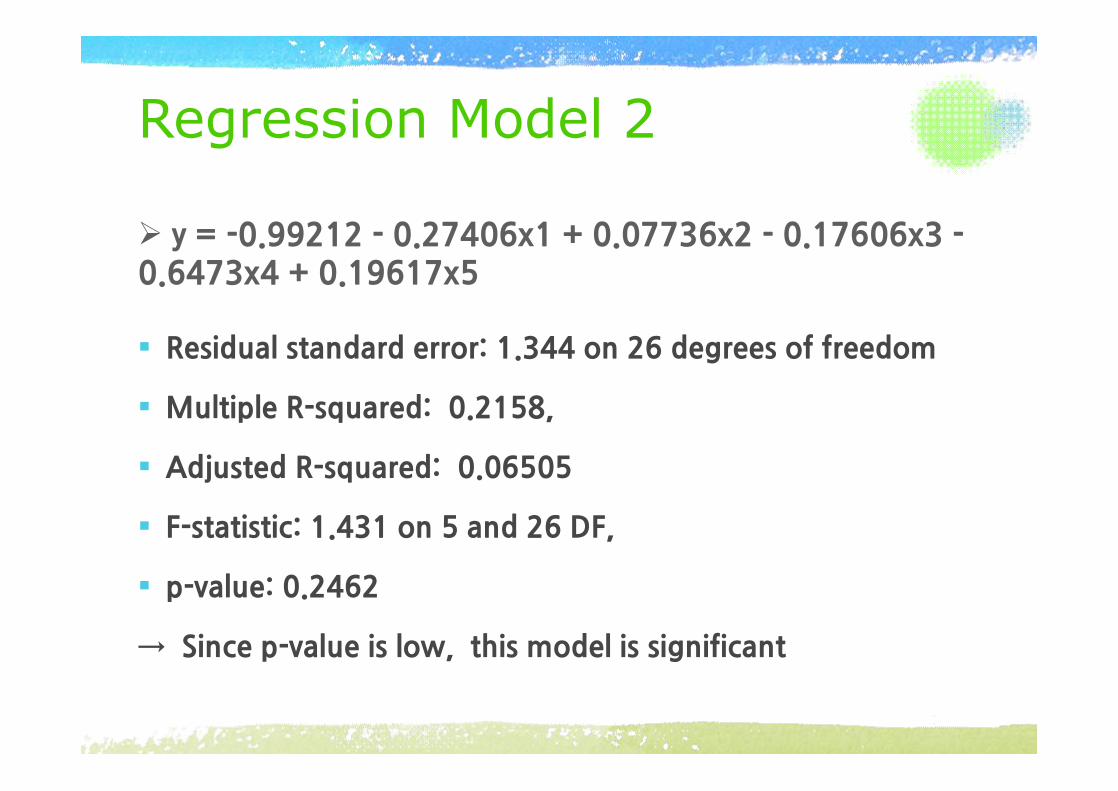
Regression Model 2
§ Residual�standard�error:�1.344�on�26�degrees�of�freedom
§ Multiple�R-squared:��0.2158,
§ Adjusted�R-squared:��0.06505�
§ F-statistic:�1.431�on�5�and�26�DF,�
§ p-value:�0.2462
→��Since�p-value�is�low,��this�model�is�significant
�y�=�-0.99212�-�0.27406x1�+�0.07736x2�-�0.17606x3�-�0.6473x4�+�0.19617x5

Regression Analysis 2
§ In�the�Residual�-�Estimate�graph,�it�showed�some�pattern.�Therefore�this�model�is�not�covariant.
§ In�the�Normality�graph,�it�slightly�follwed�the�normality�pattern.
§ Normality�Graph§ Residual�-�Estimate�Graph
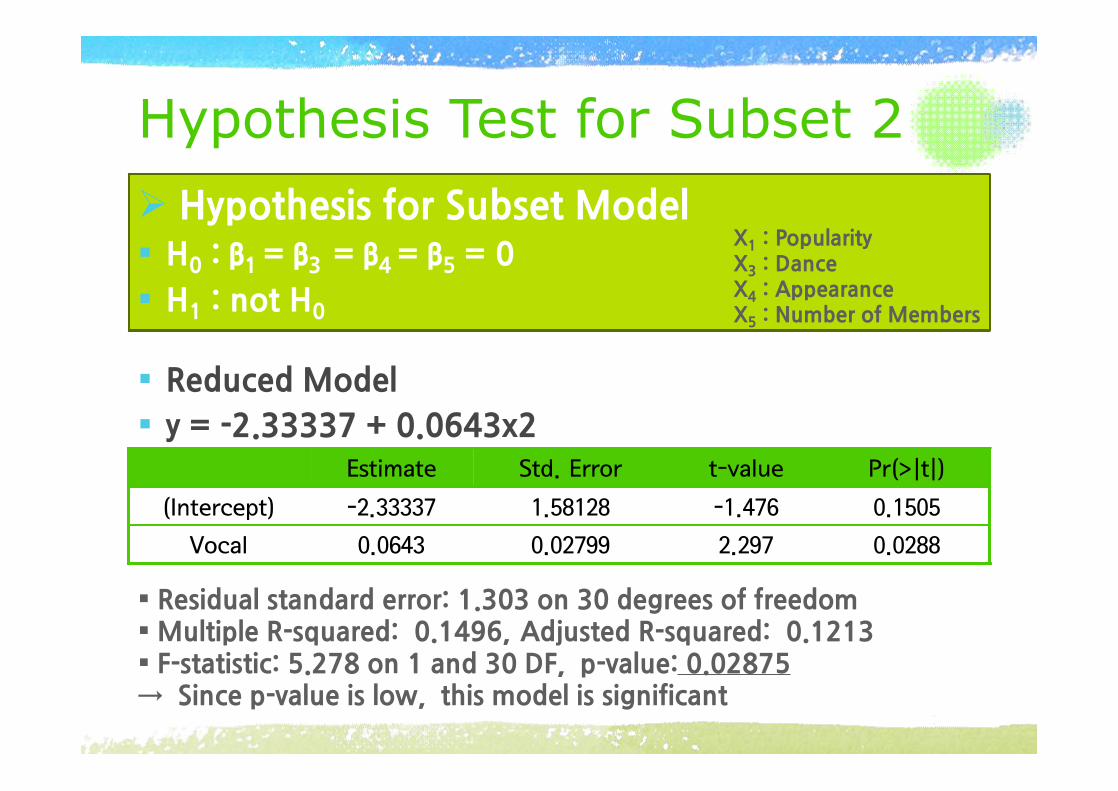
Hypothesis Test for Subset 2 Ø�Hypothesis�for�Subset�Model§ H0�:�β1�=�β3��=�β4�=�β5�=�0�
§ H1�:�not�H0
X1�:�PopularityX3�:�DanceX4�:�AppearanceX5�:�Number�of�Members
Estimate Std.�Error t-value Pr(>|t|)
(Intercept) -2.33337 1.58128 -1.476 0.1505
Vocal 0.0643 0.02799 2.297 0.0288
§�Residual�standard�error:�1.303�on�30�degrees�of�freedom�§�Multiple�R-squared:��0.1496, Adjusted�R-squared:��0.1213�§�F-statistic:�5.278�on�1�and�30�DF,��p-value:�0.02875→��Since�p-value�is�low,��this�model�is�significant
§ Reduced�Model
§ y�=�-2.33337�+�0.0643x2�
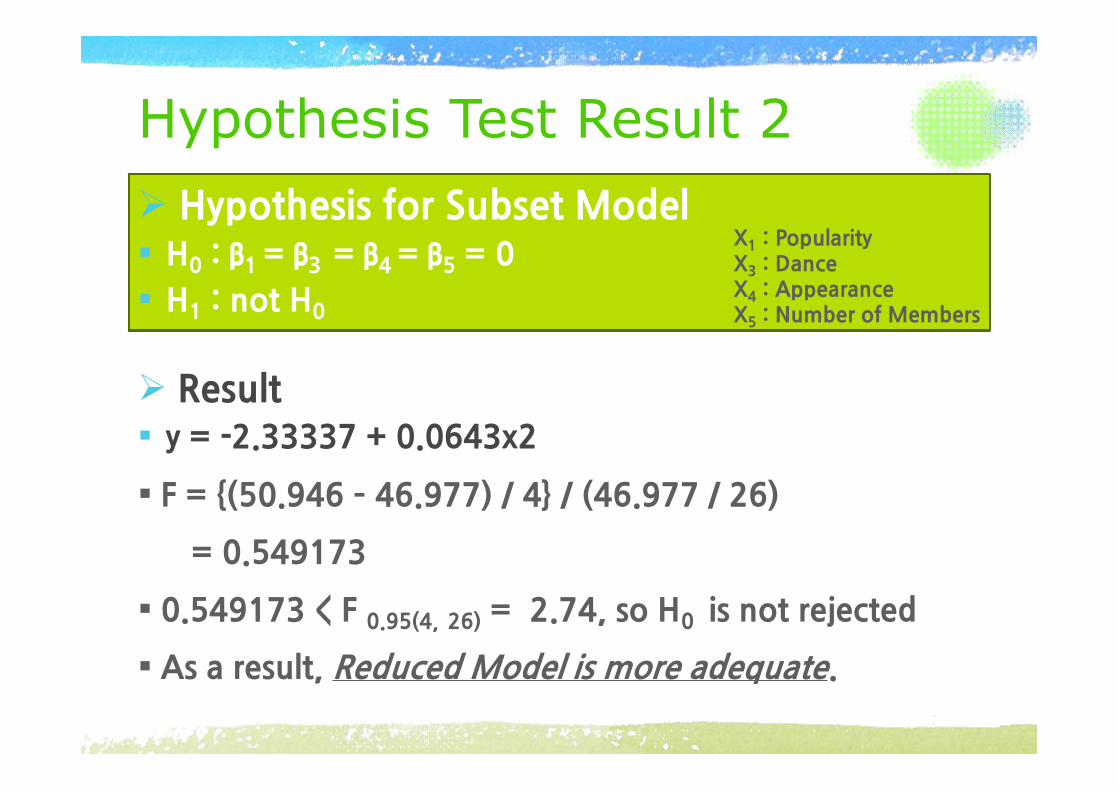
Hypothesis Test Result 2
Ø�Result�§ y�=�-2.33337�+�0.0643x2�
§�F�=�{(50.946��46.977)�/�4}�/�(46.977�/�26)�
������=�0.549173
§�0.549173�<�F�0.95(4, 26)�=��2.74,�so�H0 is�not�rejected�
§�As�a�result, Reduced�Model�is�more�adequate.
Ø�Hypothesis�for�Subset�Model§ H0�:�β1�=�β3��=�β4�=�β5�=�0�
§ H1�:�not�H0
X1�:�PopularityX3�:�DanceX4�:�AppearanceX5�:�Number�of�Members
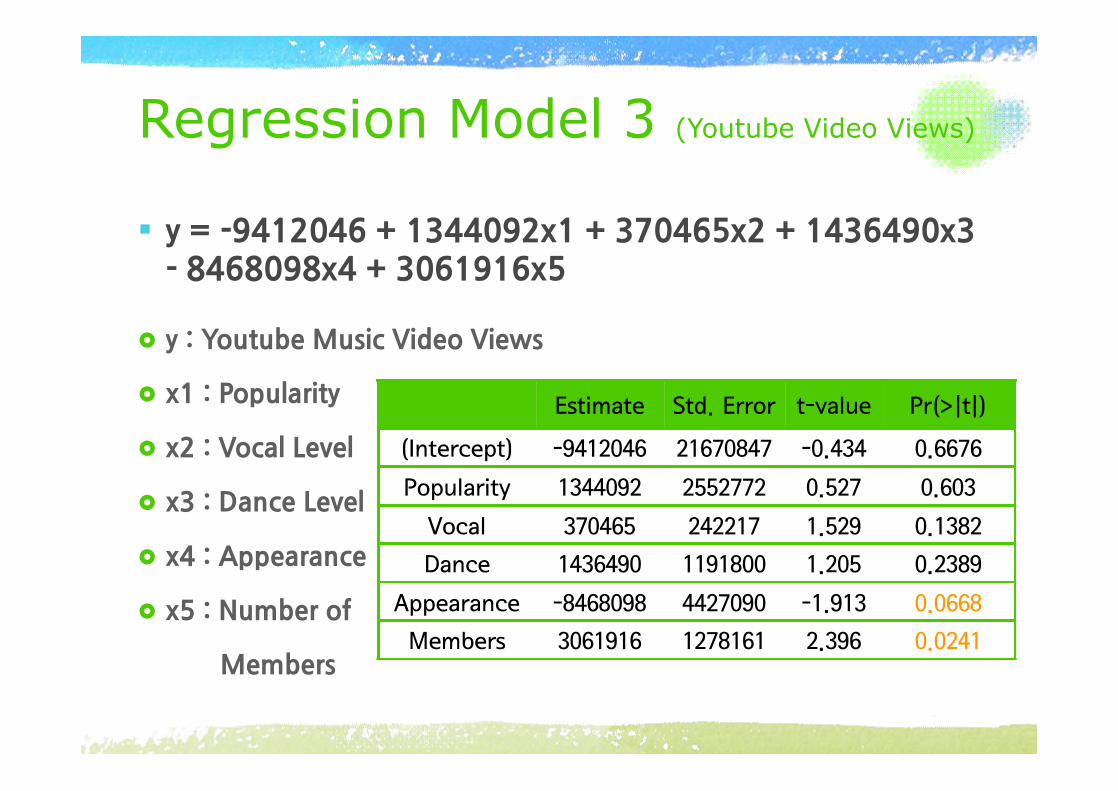
Regression Model 3 (Youtube Video Views)
§ y�=�-9412046�+�1344092x1�+�370465x2�+�1436490x3�-�8468098x4�+�3061916x5
£ y�:�Youtube�Music�Video�Views
£ x1�:�Popularity
£ x2�:�Vocal�Level
£ x3�:�Dance�Level
£ x4�:�Appearance
£ x5�:�Number�of�
�����������Members
Estimate Std.�Error t-value Pr(>|t|)
(Intercept) -9412046 21670847 -0.434 0.6676
Popularity 1344092 2552772 0.527 0.603
Vocal 370465 242217 1.529 0.1382
Dance 1436490 1191800 1.205 0.2389
Appearance -8468098 4427090 -1.913 0.0668
Members 3061916 1278161 2.396 0.0241

Regression Model 3
§ Residual�standard�error:�8283000�on�26�degrees�of�freedom
§ Multiple�R-squared:��0.4114
§ Adjusted�R-squared:��0.2982�
§ F-statistic:�3.635�on�5�and�26�DF,��p-value:�0.0126
→��Since�p-value�is�low,��this�model�is�significant
�y�=�-9412046�+�1344092x1�+�370465x2�+�1436490x3�-�8468098x4�+�3061916x5
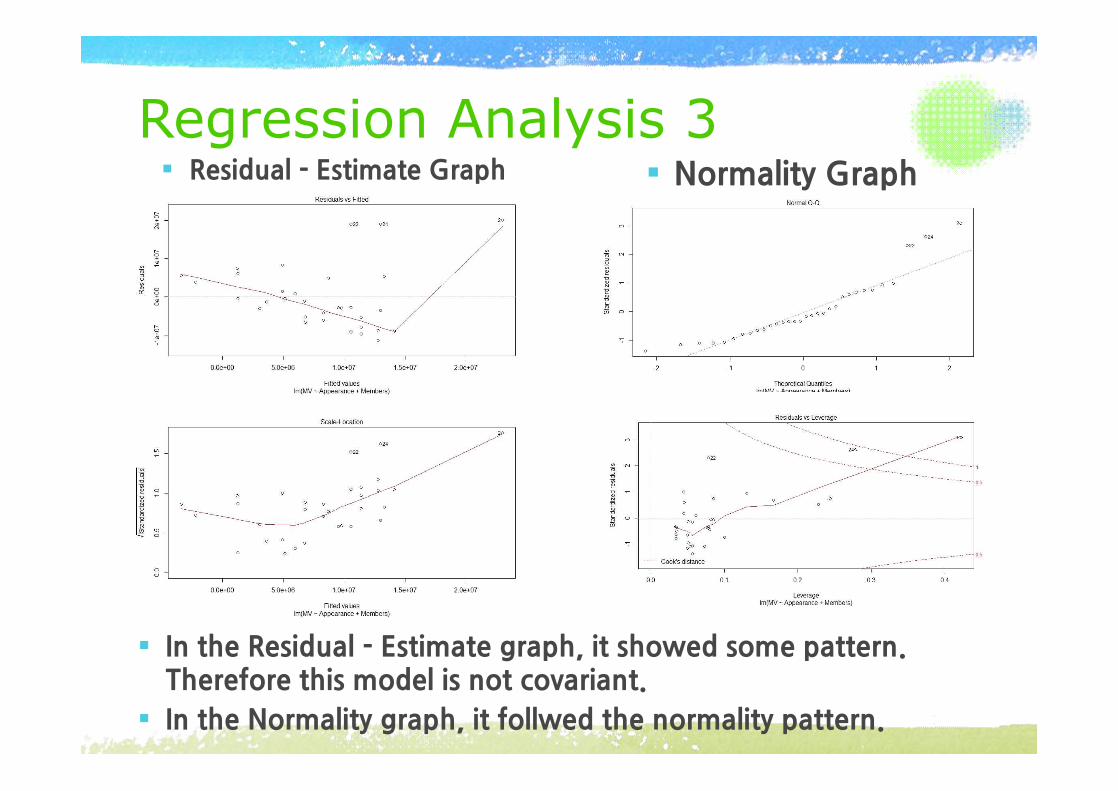
Regression Analysis 3
§ In�the�Residual�-�Estimate�graph,�it�showed�some�pattern.�Therefore�this�model�is�not�covariant.
§ In�the�Normality�graph,�it�follwed�the�normality�pattern.
§ Normality�Graph§ Residual�-�Estimate�Graph
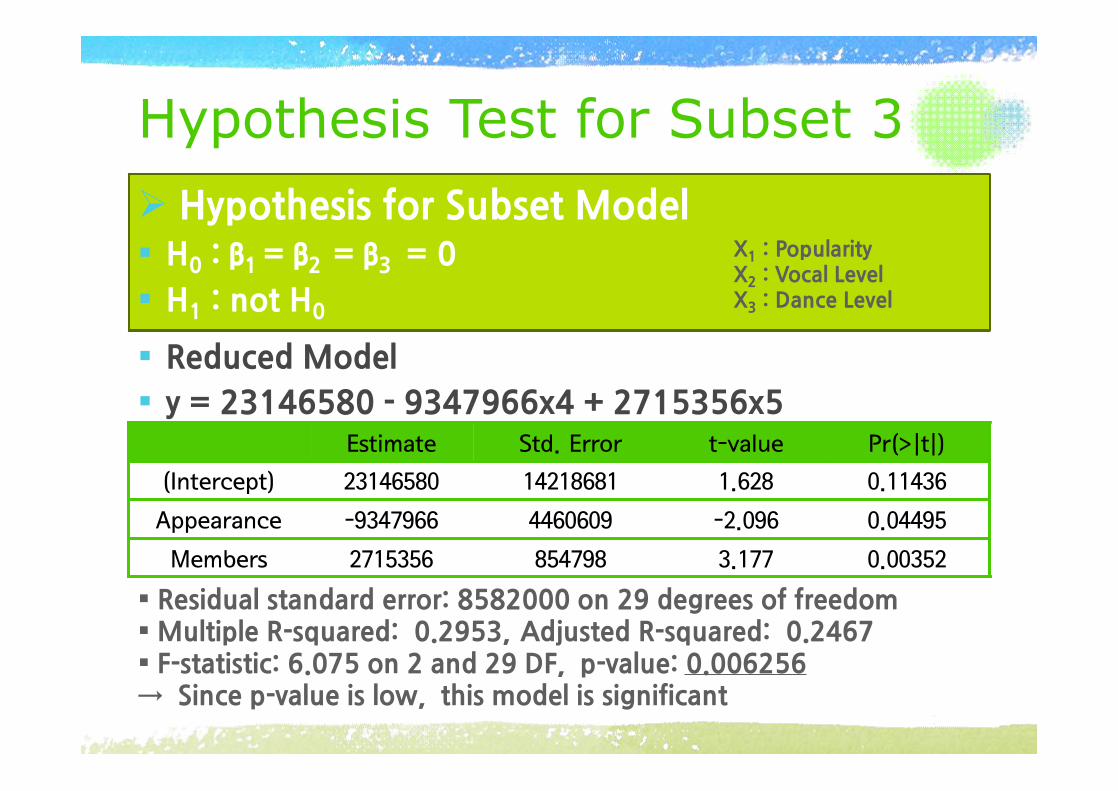
Hypothesis Test for Subset 3 Ø�Hypothesis�for�Subset�Model§ H0�:�β1�=�β2��=�β3��=�0�
§ H1�:�not�H0
X1�:�PopularityX2�:�Vocal�LevelX3�:�Dance�Level
Estimate Std.�Error t-value Pr(>|t|)
(Intercept) 23146580 14218681 1.628 0.11436
Appearance -9347966 4460609 -2.096 0.04495
Members 2715356 854798 3.177 0.00352
§�Residual�standard�error:�8582000�on�29�degrees�of�freedom§�Multiple�R-squared:��0.2953, Adjusted�R-squared:��0.2467�§�F-statistic:�6.075�on�2�and�29�DF,��p-value:�0.006256→��Since�p-value�is�low,��this�model�is�significant
§ Reduced�Model
§ y�=�23146580�-�9347966x4�+�2715356x5�

Hypothesis Test Result 3
Ø Result�§ y�=�23146580�-�9347966x4�+�2715356x5�
§�F�=�{(2136000000000000��1783900000000000)�/�3}�/�������������������������������������������
(1783900000000000�/�26)�=�1.710597
§�1.710597�<�F�0.95(3, 26)�=��2.98,�so�H0 is�not�rejected�
§�As�a�result, Reduced�Model�is�more�adequate.
Ø�Hypothesis�for�Subset�Model§ H0�:�β1�=�β2��=�β3��=�0�
§ H1�:�not�H0
X1�:�PopularityX2�:�Vocal�LevelX3�:�Dance�Level
1. K-Pop Idol History
2. Idol Industry Factor
3. Regression Analysis
4. Result & Interpretation

Result Analysis§ Reduced�Model�1�(Album�Sales�Amount)§ y�=�-613522�+�36930x1�+�6232x2�+�50089x5§�Residual�standard�error:�66580�on�28�degrees�of�freedom�§�Multiple�R-squared:��0.6362, Adjusted�R-squared:��0.5972�§�p-value:�2.509e-06,�������������������������No�covariance�&�Normality
§ Reduced�Model�2�(Online�Download�Sales)§ y�=�-2.33337�+�0.0643x2§�Residual�standard�error:�1.303�on�30�degrees�of�freedom�§�Multiple�R-squared:��0.1496, Adjusted�R-squared:��0.1213�§�p-value:�0.02875����������������������������No�covariance�&�Weak�Normality
§ Reduced�Model�(Youtube�Music�Video�View)§ y�=�23146580�-�9347966x4�+�2715356x5�§�Residual�standard�error:�8582000�on�29�degrees�of�freedom§�Multiple�R-squared:��0.2953, Adjusted�R-squared:��0.2467�§�p-value:�0.006256����������������������������������������No�covariance�&�Normality
Most�Significant
Model�1�has�the�biggest�R-squared�and�the�smallest�p-valueTherefore,�Model�1�is�the�most�significant
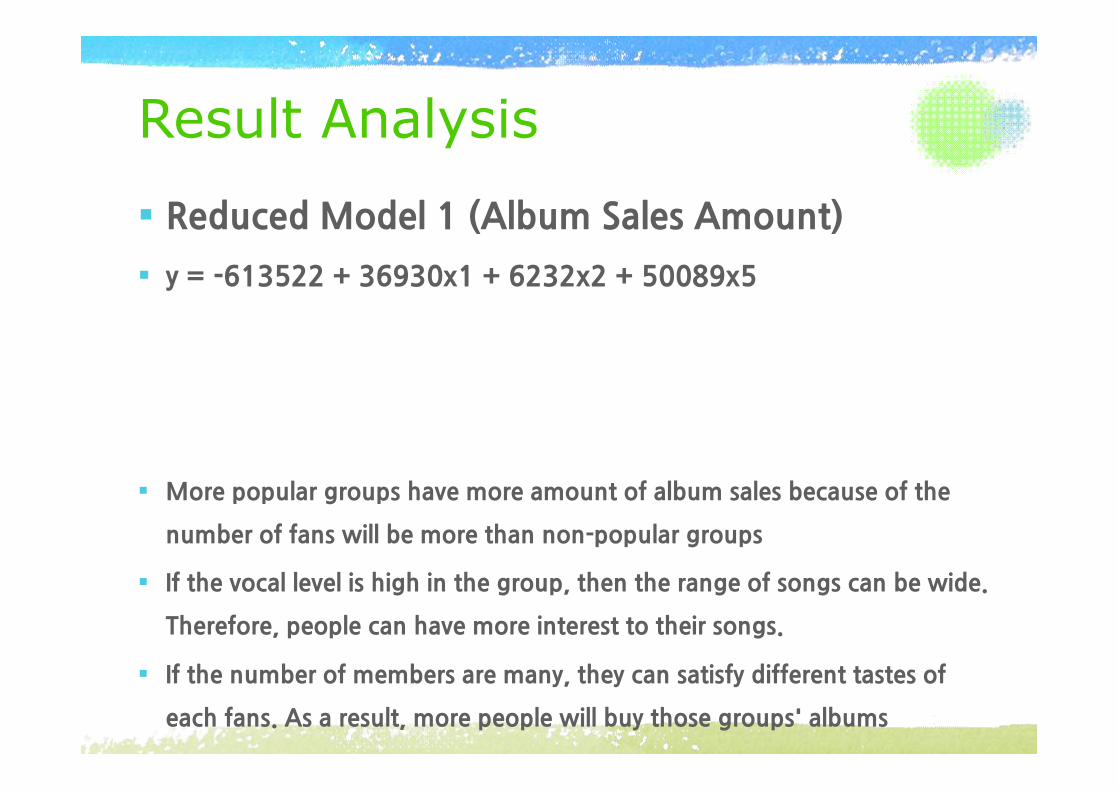
Result Analysis§ Reduced�Model�1�(Album�Sales�Amount)
§ y�=�-613522�+�36930x1�+�6232x2�+�50089x5
Popularity VocalLevel
#�of�Members
§ More�popular�groups�have�more�amount�of�album�sales�because�of�the�
number�of�fans�will�be�more�than�non-popular�groups
§ If�the�vocal�level�is�high�in�the�group,�then�the�range�of�songs�can�be�wide.�
Therefore,�people�can�have�more�interest�to�their�songs.
§ If�the�number�of�members�are�many,�they�can�satisfy�different�tastes�of�
each�fans.�As�a�result,�more�people�will�buy�those�groups'�albums
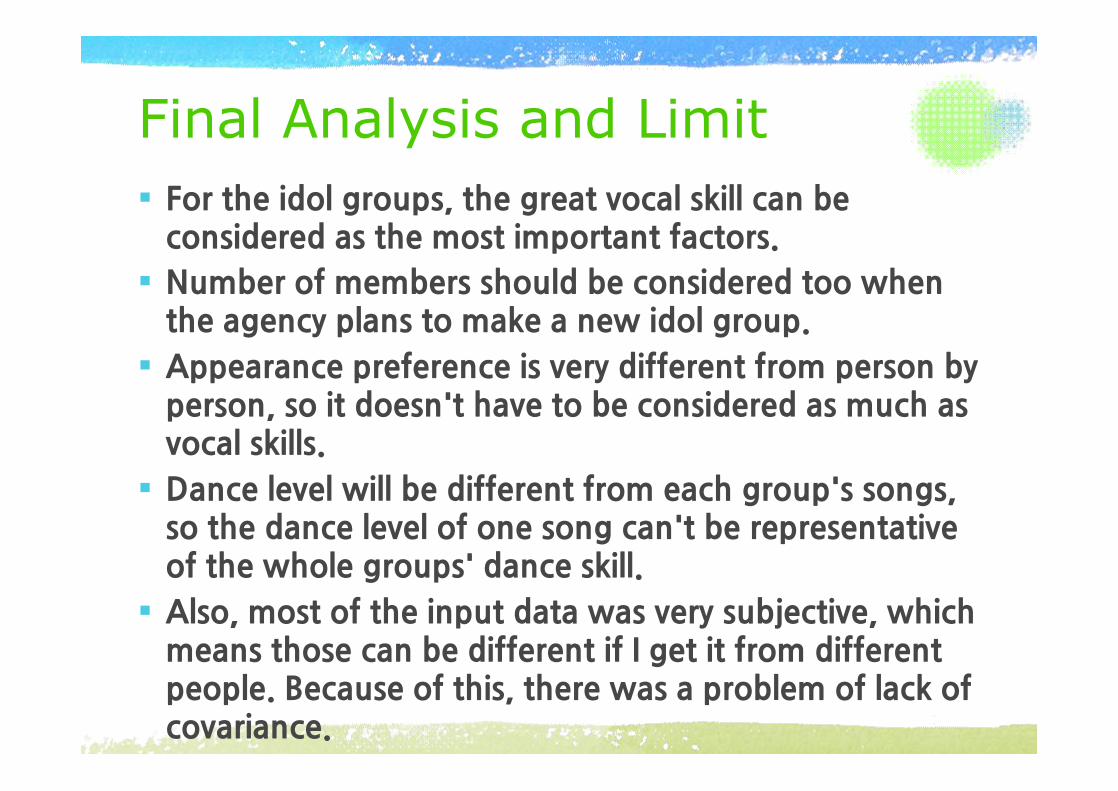
Final Analysis and Limit§ For�the�idol�groups,�the�great�vocal�skill�can�be�
considered�as�the�most�important�factors.
§ Number�of�members�should�be�considered�too�when�the�agency�plans�to�make�a�new�idol�group.
§ Appearance�preference�is�very�different�from�person�by�person,�so�it�doesn't�have�to�be�considered�as�much�as�vocal�skills.
§ Dance�level�will�be�different�from�each�group's�songs,�so�the�dance�level�of�one�song�can't�be�representative�of�the�whole�groups'�dance�skill.
§ Also,�most�of�the�input�data�was�very�subjective,�which�means�those�can�be�different�if�I�get�it�from�different�people.�Because�of�this,�there�was�a�problem�of�lack�of�covariance.

References§ http://www.gaonchart.co.kr/chart/download.php?f_type=y
ear§ http://www.gaonchart.co.kr/chart/album.php?f_type=year§ http://lam01.tistory.com/277§ http://blog.naver.com/PostView.nhn?blogId=bluecheck9&l
ogNo=70124216973§ http://wawadance.com/§ http://www.youtube.com/channel/UCsEonk9fs_9jmtw9Pw
ER9yg

Thank You