June Investor Meetings - PNM Resources · June Investor Meetings June 2015. ... Statements made in...
49
June Investor Meetings June 2015
Transcript of June Investor Meetings - PNM Resources · June Investor Meetings June 2015. ... Statements made in...

June Investor Meetings
June 2015

Contact Information and Safe Harbor Statement
2
Investor Relations Contact Information
Jimmie Blotter, Director, Investor Relations Lisa Goodman, Manager, Investor RelationsU.S. 1‐505‐241‐2227 U.S. 1‐505‐241‐[email protected] [email protected]
Safe Harbor StatementStatements made in this presentation that relate to future events or PNM Resources’ (“PNMR”), Public Service Company of New Mexico’s (“PNM”), or Texas‐New Mexico Power Company’s (“TNMP”) (collectively, the “Company”) expectations, projections, estimates, intentions, goals, targets, and strategies are made pursuant to the Private Securities Litigation Reform Act of 1995.Readers are cautioned that all forward‐looking statements are based upon current expectations and estimates. PNMR, PNM, and TNMP assume no obligation to update this information. Because actual results may differ materially from those expressed or implied by these forward‐looking statements, PNMR, PNM, and TNMP caution readers not to place undue reliance on these statements. PNMR's, PNM's, and TNMP's business, financial condition, cash flow, and operating results are influenced by many factors, which are often beyond their control, that can cause actual results to differ from those expressed or implied by theforward‐looking statements. For a discussion of risk factors and other important factors affecting forward‐looking statements, please see the Company’s Form 10‐K and 10‐Q filings with the Securities and Exchange Commission, which factors are specifically incorporated by reference herein.
Non‐GAAP Financial MeasuresFor an explanation of the non‐GAAP financial measures that appear on certain slides in this presentation (ongoing earnings and ongoing earnings per diluted share), as well as a reconciliation to GAAP measures, please refer to the Company’s website as follows: http://www.pnmresources.com/investors/results.cfm

Strategic Overview
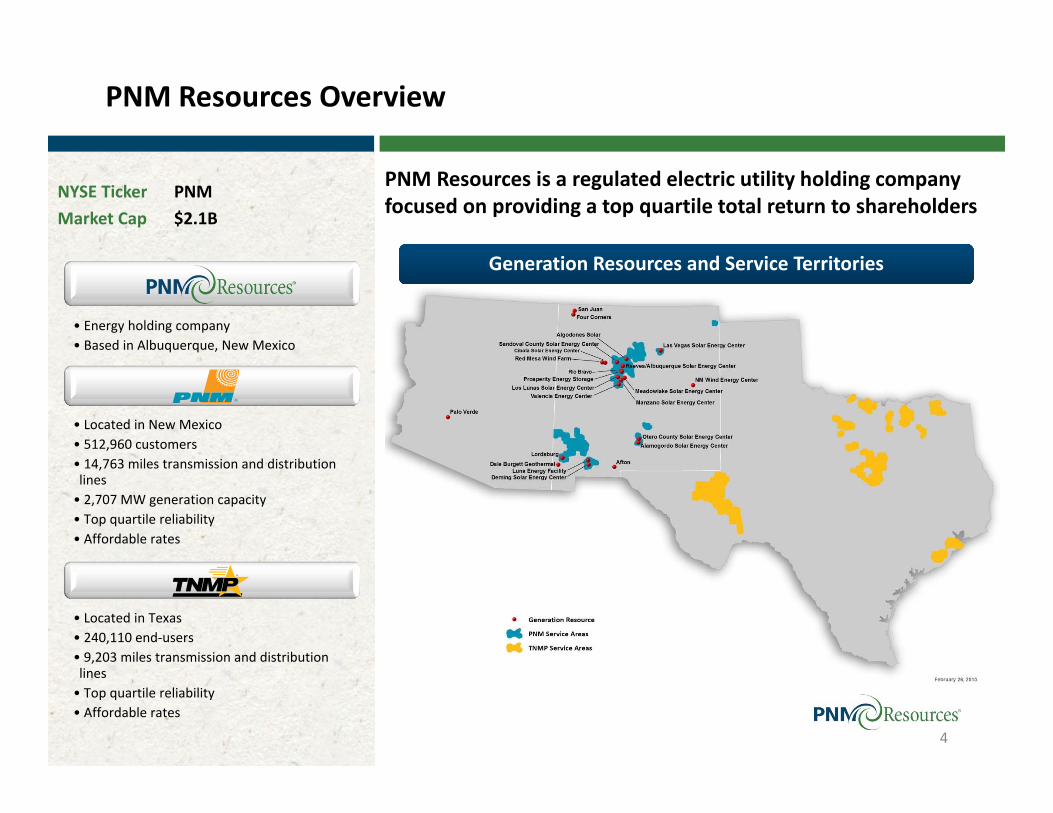
NYSE Ticker PNMMarket Cap $2.1B
PNM Resources Overview
• Energy holding company• Based in Albuquerque, New Mexico
• Located in New Mexico• 512,960 customers• 14,763 miles transmission and distribution lines• 2,707 MW generation capacity• Top quartile reliability• Affordable rates
• Located in Texas• 240,110 end‐users• 9,203 miles transmission and distribution lines• Top quartile reliability• Affordable rates
PNM Resources is a regulated electric utility holding company focused on providing a top quartile total return to shareholders
Generation Resources and Service Territories
4
Delivering on Strategic Goals
5
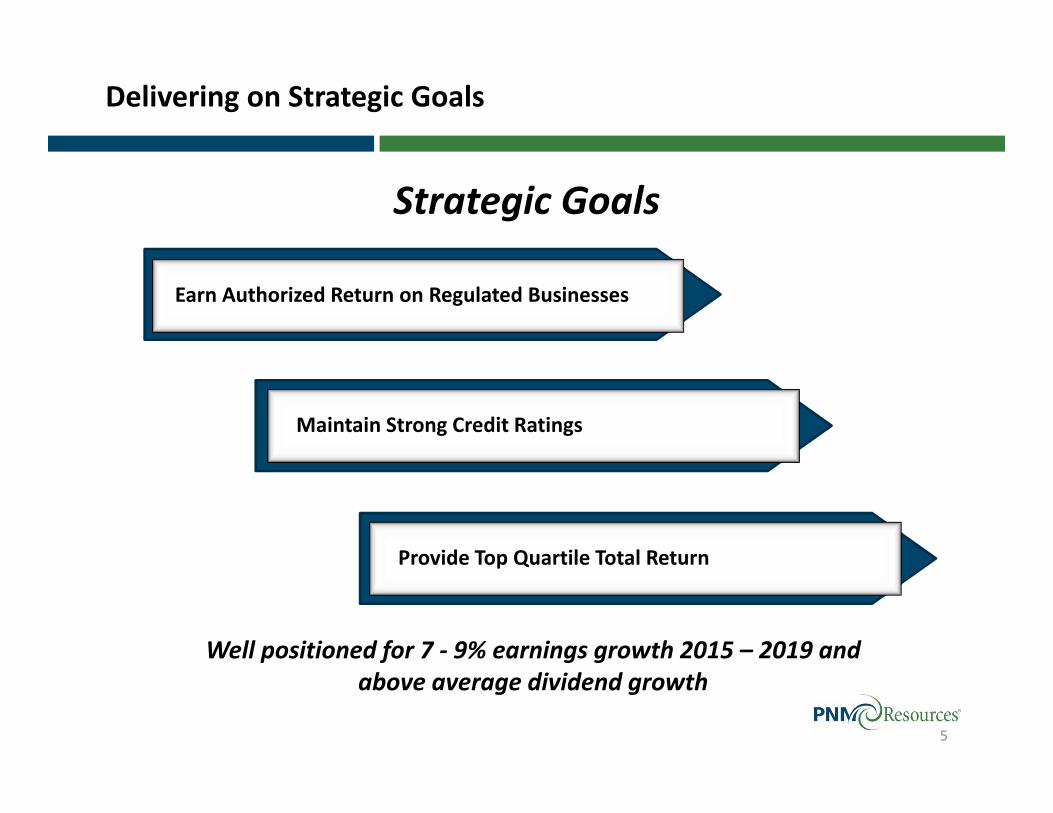
Strategic Goals
Earn Authorized Return on Regulated Businesses
Maintain Strong Credit Ratings
Provide Top Quartile Total Return
Well positioned for 7 ‐ 9% earnings growth 2015 – 2019 and above average dividend growth
Invest in the Business
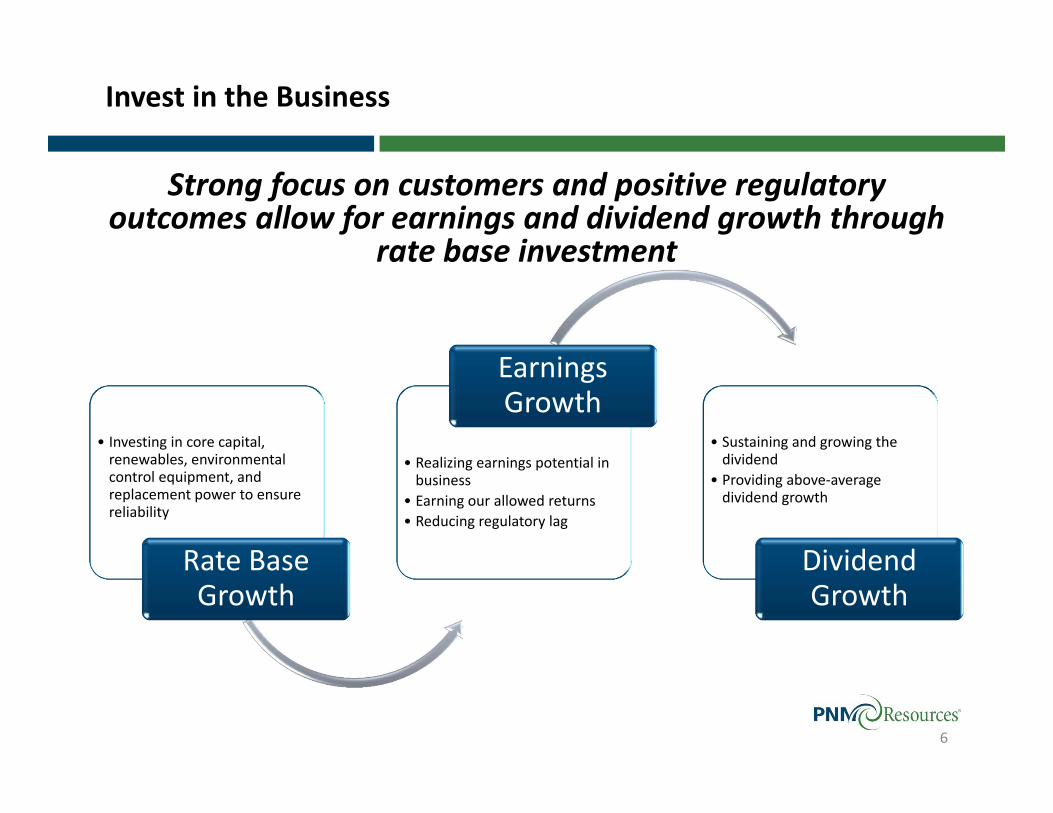
• Investing in core capital, renewables, environmental control equipment, and replacement power to ensure reliability
Rate Base Growth
• Realizing earnings potential in business
• Earning our allowed returns• Reducing regulatory lag
Earnings Growth
• Sustaining and growing the dividend
• Providing above‐average dividend growth
Dividend Growth
6
Strong focus on customers and positive regulatory outcomes allow for earnings and dividend growth through
rate base investment

5‐Year Capital Forecast
7
2015 – 2019 Total Capital Plan: $2.2B PNM 2014‐2019 Rate Base CAGR: 5 ‐7%(1)
TNMP 2014‐2019 Rate Base CAGR: 5 ‐7%
(1)Includes the addition of PV3 to rate base, which does not have associated capital spending.(2)Includes the potential additional 65 MW ownership of San Juan Unit 4.Beginning in 2016, depreciation rates reflect the full rate change included in the previously filed 2016 future test year general rate caseAmounts may not add due to rounding
$209
$313 $265
$116 $96
$134
$89
$70
$65 $121
$79
$43
$121 $93
$93
$106
$105
$33
$20
$16
$15
$17
2015 2016 2017 2018 2019
(In millions)
PNM Generation PNM T&D PNM Renewables TNMP Corporate/Other Depreciation
$577
$515
$444
$302
$382
Palo Verde Unit 3
added to rate base
(2)
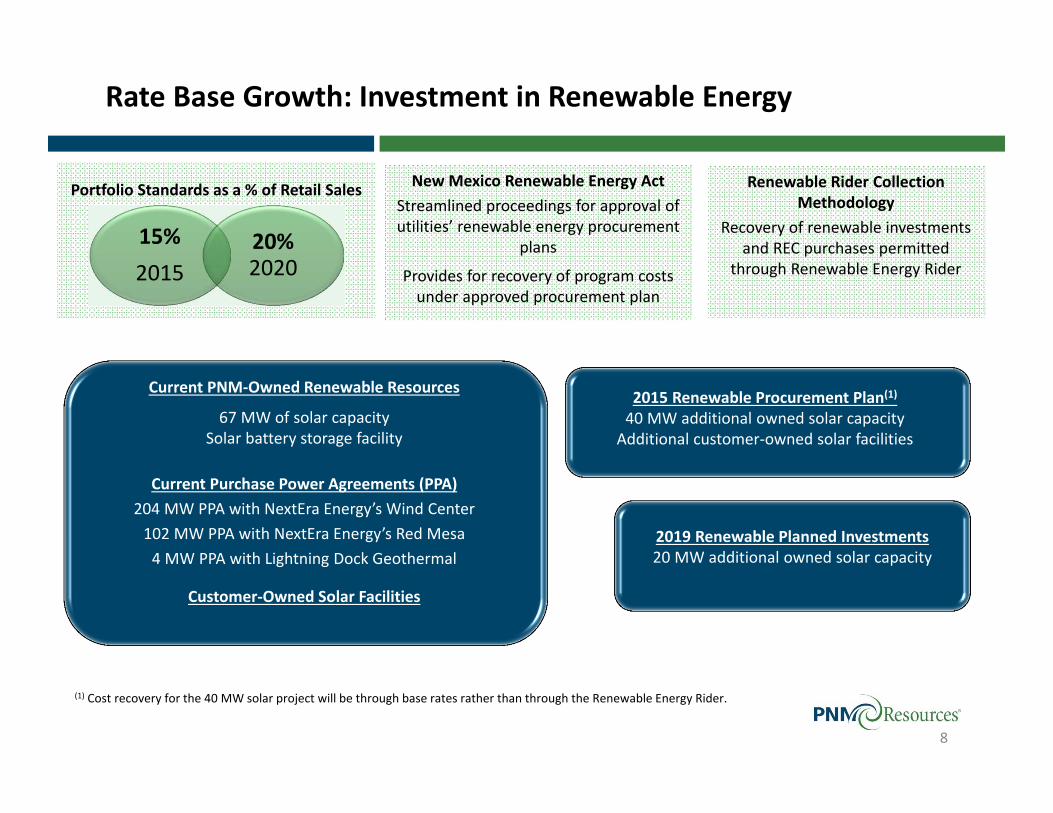
Portfolio Standards as a % of Retail Sales
15%2015
20% 2020
8
Rate Base Growth: Investment in Renewable Energy
Renewable Rider Collection Methodology
Recovery of renewable investments and REC purchases permitted
through Renewable Energy Rider
New Mexico Renewable Energy ActStreamlined proceedings for approval of utilities’ renewable energy procurement
plans
Provides for recovery of program costs under approved procurement plan
Current PNM‐Owned Renewable Resources
67 MW of solar capacitySolar battery storage facility
Current Purchase Power Agreements (PPA)204 MW PPA with NextEra Energy’s Wind Center102 MW PPA with NextEra Energy’s Red Mesa4 MW PPA with Lightning Dock Geothermal
Customer‐Owned Solar Facilities
(1) Cost recovery for the 40 MW solar project will be through base rates rather than through the Renewable Energy Rider.
2019 Renewable Planned Investments20 MW additional owned solar capacity
2015 Renewable Procurement Plan(1)40 MW additional owned solar capacityAdditional customer‐owned solar facilities

Rate Base Growth: BART Regulatory Process Update
9
BART: Best Available Retrofit TechnologySNCR: Selective Non‐Catalytic ReductionCCN: Certificate of Convenience and Necessity
Additional 132 MWof San Juan Unit 4
Denial of CCN with ability to re‐file when coal supply and participant restructuring agreements are final
Approval of CCN at $26M
Palo Verde Unit 3 Approval of CCN at $1,650/kW Approval of CCN at book value (~$1,071/kW)
San Juan Units 2 & 3
Approval of retirement and recovery of half of the
undepreciated investment, estimated to be ~$115M
Conditional approval of retirement and recovery of half of the undepreciated investment,
estimated to be ~$128M
BART Component Settlement TermsHearing Examiner Recommendation
SNCR Technology Deferred approval to general rate case
Requests affirmative proof of prudence of balanced draft in
general rate case
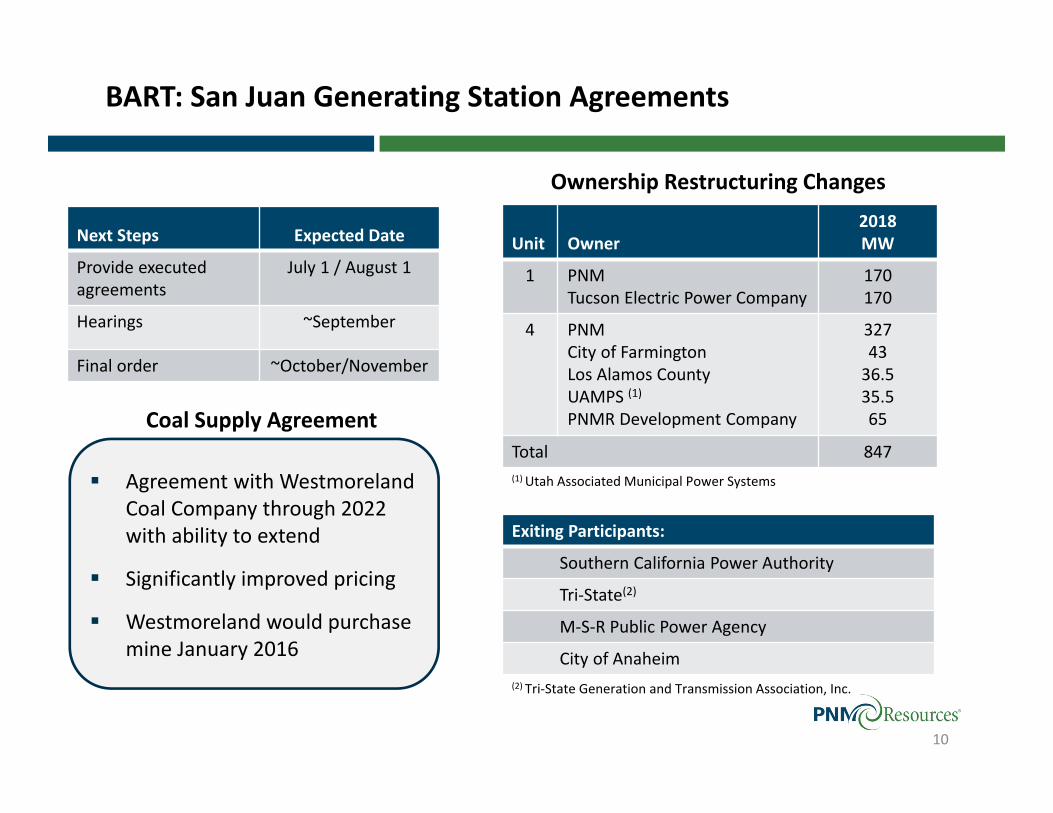
BART: San Juan Generating Station Agreements
10
Ownership Restructuring Changes
Unit Owner2018MW
1 PNMTucson Electric Power Company
170170
4 PNMCity of FarmingtonLos Alamos CountyUAMPS (1)PNMR Development Company
3274336.535.565
Total 847(1) Utah Associated Municipal Power Systems Agreement with Westmoreland
Coal Company through 2022 with ability to extend
Significantly improved pricing
Westmoreland would purchase mine January 2016
Coal Supply Agreement
Exiting Participants:
Southern California Power Authority
Tri‐State(2)
M‐S‐R Public Power Agency
City of Anaheim(2) Tri‐State Generation and Transmission Association, Inc.
Next Steps Expected Date
Provide executed agreements
July 1 / August 1
Hearings ~September
Final order ~October/November

Earnings Growth
11
Targeted earnings growth continues the progress made to date and seeks to maximize the earnings potential of the business
$1.31 $1.41 $1.49 $1.50
$1.62
2012 2013 2014 2015E 2016E 2017E 2018E 2019EOngoing EPS
7% ‐ 9% Earnings Growth
2015 ‐ 2019
2012 – 2014 actual results represent ongoing earnings per diluted share2015E represents the ongoing earnings guidance range of $1.50 ‐ $1.62 per diluted share

Earnings Growth: 2016 Potential Earnings Power
12
(1) 2016 Earnings Potential assumes the previously filed 2016 future test year general rate case, effective January 1, 2016.(2) Implementation of the 2016 future test year general rate case between July and October 2016 could decrease earnings in 2016.(3) PNM FERC is made up of both Transmission and Wholesale Generation business; transmission represents about 75% of rate base. Earnings reflect FERC formula
rate methodology, which uses prior year average rate base and assumes mid‐year rate increases. Earnings Potential assumes returns of 5% ‐ 6%.(4) Earnings Potential assumes a 2016 forward market price of $37/MWh. A price of $43/MWh is required to break even in 2016. (5) Consists primarily of Palo Verde Nuclear Decommissioning Trust gains and losses, AFUDC, refined coal, certain incentive compensation and pension‐related costs
associated with the sale of PNM Gas.(6) TNMP EPS includes $0.02 of CTC, which is fully amortized in 2020.(7) PNM Resources’ $119M 9.25% debt was retired May 15, 2015.
This table is not intended to represent a forward‐looking projection of 2016 earnings guidance.
Allowed Return /
Equity Ratio
2015 Guidance Mid Point 2016 Earnings Potential
Avg Rate Base Return EPS Avg Rate
Base Growth EPS
PNM Retail 10% / 50% $2.0 B 8.4% $1.02 $2.4 B $0.47 $1.49(1)
PNM Retail‐Timing(2) ($0.35)‐($0.21) ($0.35)‐($0.21)
PNM Renewables 10% / 50% $105 M 10.0% $0.07 $100 M ($0.01) $0.06
PNM FERC (3) 9‐10% / 50% $235 M 5.5% $0.08 $235 M ($0.01)‐$0.01 $0.07‐$0.09
PV3 (4) ($0.01) ($0.04) ($0.05)
Items not in rates (5) $0.02 ($0.06)‐($0.03) ($0.04)‐($0.01)
Total PNM $2.3 B $1.18 $2.7 B $0.00 ‐ $0.19 $1.18 ‐ $1.37
TNMP (6) 10.125% / 45% $680 M 10.125% $0.46 $750 M ($0.01) $0.45
Corporate/Other(7) ($0.08) $0.00‐$0.02 ($0.08)‐($0.06)
Total PNM Resources $3.0 B $1.56 $3.5 B ($0.01) ‐ $0.20 $1.55 ‐ $1.76(2)

Earnings Growth: 2019 Potential Earnings Power
13
2016 Earnings Potential 2019 Earnings Potential
Avg Rate Base EPS Avg Rate Base Growth EPS
PNM Retail $2.4 B $1.49(1) $2.6 B $0.11 $1.60
Rate Case Timing(2) ($0.35)‐($0.21) $0.35 ‐ $0.21 $0.00
PNM Renewables $100 M $0.06 $85 M ($0.01) $0.05
PNM FERC (3) $235 M $0.07‐$0.09 $270 M $0.01 $0.08‐$0.10
PV3 (4) ($0.05) Included in PNM Retail $0.05 Included in PNM Retail
Items not in rates (5) ($0.04)‐($0.01) $0.03 ($0.01)‐$0.02
Total PNM $2.7 B $1.18 ‐ $1.37 $2.9 B $0.54 ‐ $0.40 $1.72 ‐ $1.77
TNMP (6) $750 M $0.45 $890 M $0.09 $0.54
Corporate/Other ($0.08)‐($0.06) $0.02 ($0.06)‐($0.04)(7)
Total PNM Resources $3.5 B $1.55 ‐ $1.76(2) $3.8 B $0.65 ‐ $0.51 $2.20 ‐ $2.27
(1) 2016 Earnings Potential assumes the previously filed 2016 future test year general rate case, effective January 1, 2016. (2) Implementation of the 2016 future test year general rate case between July and October 2016 could decrease earnings in 2016.(3) PNM FERC is made up of both Transmission and Wholesale Generation business. Transmission represents about 75% of rate base and is recovered through
formula rates.(4) PV 3 included in PNM rates starting in 2018.(5) Consists primarily of Palo Verde Nuclear Decommissioning Trust gains and losses, AFUDC, refined coal, certain incentive compensation and pension‐related costs
associated with the sale of PNM Gas.(6) TNMP Earnings Potential includes refinancing $172M of 9.5% debt and $0.01 of CTC in 2019.(7) Does not include potential additional 65 MW ownership of San Juan Unit 4 of approximately ($0.02) – ($0.03).
This table is not intended to represent a forward‐looking projection of 2016 or 2019 earnings guidance.

Dividend Growth: Continued Dividend Increases
The annual common stock dividend raised by 8% in December 2014 to $0.80 per share
Expect above industry average dividend growth while targeting the 50% ‐ 60% payout ratio range
The Board will continue to evaluate the dividend on an annual basis, considering:• Sustainability and growth• Capital planning• Industry standards
Next dividend review in December 2015
Dividend rate: $0.80 (1)
Payout ratio:51% (2)
Dividend yield:3.0% (3)
Dividend rate: $0.80 (1)
Payout ratio:51% (2)
Dividend yield:3.0% (3)
(1) Indicated annual rate(2) Assumes mid‐point of the 2015 guidance range (3) Based on 5/28/15 stock price of $26.75
$0.58$0.66
$0.74 $0.80
Feb'12 Feb'13 Dec'13 Dec'14
14%increase
12%increase
8%increase
14
16%increase
PNM Overview

PNM: Recent Accomplishments
Progressing regulatory environment Retail Renewable Rider implemented in August of 2012 with
rates reset annually• 2014 revenue was $33 M; 2015 expected revenue is ~$45M
Filed settlement on FERC Transmission formula rate case with 10% ROE• Rates in effect subject to refund
Operational highlights• 2014 reliability measure best in 7 years• Customer satisfaction metrics reflect significant 5‐year gains
Increasing credit ratings• Credit ratings raised by Moody’s to Baa2 with a positive
outlook and S&P to BBB with a positive outlook
16

PNM Load Growth and Economic Conditions
17
Regulated Retail Energy Sales (weather‐normalized)
6.2%(1)5.5%(2)
Unemployment Rate
NM U.S.
Positive Economic Indicators Recent announcements of more than
1,000 new jobs Gross receipts tax increasing in
Albuquerque Metro Single sales factor state tax reform
(1) U.S. Bureau of Labor Statistics, April 2015(2) U.S. Bureau of Labor Statistics, May 2015
PNM Average Customer Growth
Q1 2015 0.7%
2015 Forecast 0.5%
PNM
% of FY 2014 Sales
Q1 2015 vs. Q1 2014
Residential 39% 2.0%
Commercial 47% (4.0%)
Industrial 12% (2.9%)
Total Retail (1.3%)
2015 Load Forecast: (2%) – 0%

PNM Rates Continue to Compare Favorably in the U.S.
18PNM rates reflect current rates. All others reflect U.S. Energy Information Administration's Forecasted Residential Rate increases through 2014.
0.0%
0.5%
1.0%
1.5%
2.0%
2.5%
3.0%
3.5%
4.0%
4.5%
UT
CO WA IL DC NH
MN CA WY
ME
PNM MA NJ
WI
OR RI VT IA ID
NM AK VA MI
NE
MT SD PA CT ND
MD KS NY IN MO AZ OH DE NV OK TX WV AR FL KY GA HI NC LA TN SC MS AL
Est. Av
erage 20
14 Residen
tial Electric
Bill
Es.t 20
13 M
edian Hou
seho
ld In
come
Residential Electric Affordability Estimate by State (Including PNM)US Average Indicated by Dashed Line
Sources: EIA Form 826, US Census Bureau, and PNM Data
US Average: 2.62%
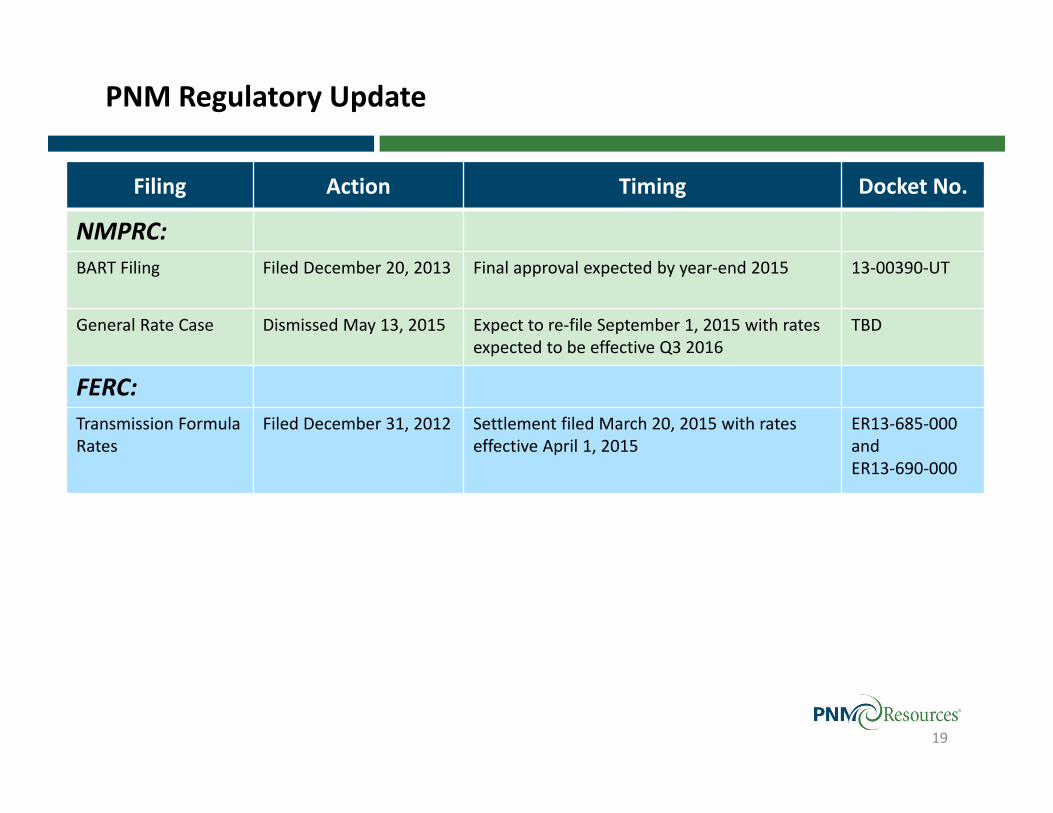
PNM Regulatory Update
19
Filing Action Timing Docket No.
NMPRC:BART Filing Filed December 20, 2013 Final approval expected by year‐end 2015 13‐00390‐UT
General Rate Case Dismissed May 13, 2015 Expect to re‐file September 1, 2015 with rates expected to be effective Q3 2016
TBD
FERC:Transmission Formula Rates
Filed December 31, 2012 Settlement filed March 20, 2015 with rates effective April 1, 2015
ER13‐685‐000 and ER13‐690‐000
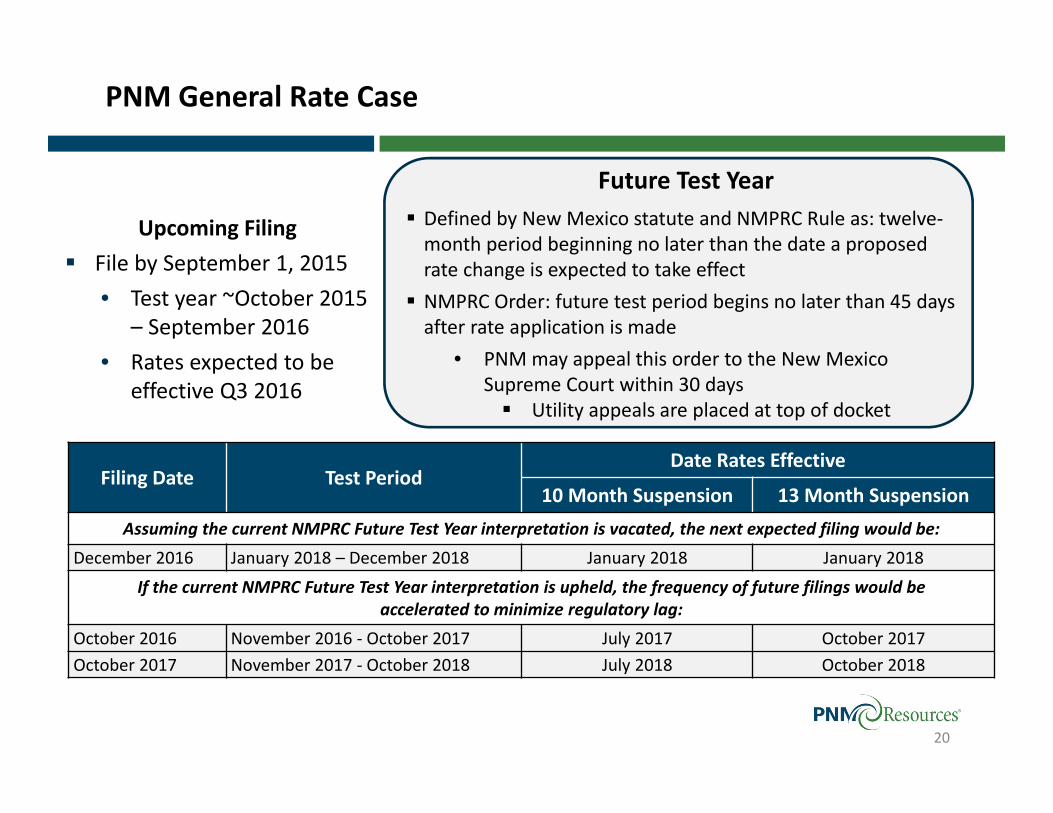
PNM General Rate Case
20
Filing Date Test PeriodDate Rates Effective
10 Month Suspension 13 Month SuspensionAssuming the current NMPRC Future Test Year interpretation is vacated, the next expected filing would be:
December 2016 January 2018 – December 2018 January 2018 January 2018
If the current NMPRC Future Test Year interpretation is upheld, the frequency of future filings would be accelerated to minimize regulatory lag:
October 2016 November 2016 ‐ October 2017 July 2017 October 2017October 2017 November 2017 ‐ October 2018 July 2018 October 2018
Upcoming Filing File by September 1, 2015
• Test year ~October 2015 – September 2016
• Rates expected to be effective Q3 2016
Future Test Year Defined by New Mexico statute and NMPRC Rule as: twelve‐month period beginning no later than the date a proposed rate change is expected to take effect NMPRC Order: future test period begins no later than 45 days after rate application is made
• PNM may appeal this order to the New Mexico Supreme Court within 30 days Utility appeals are placed at top of docket
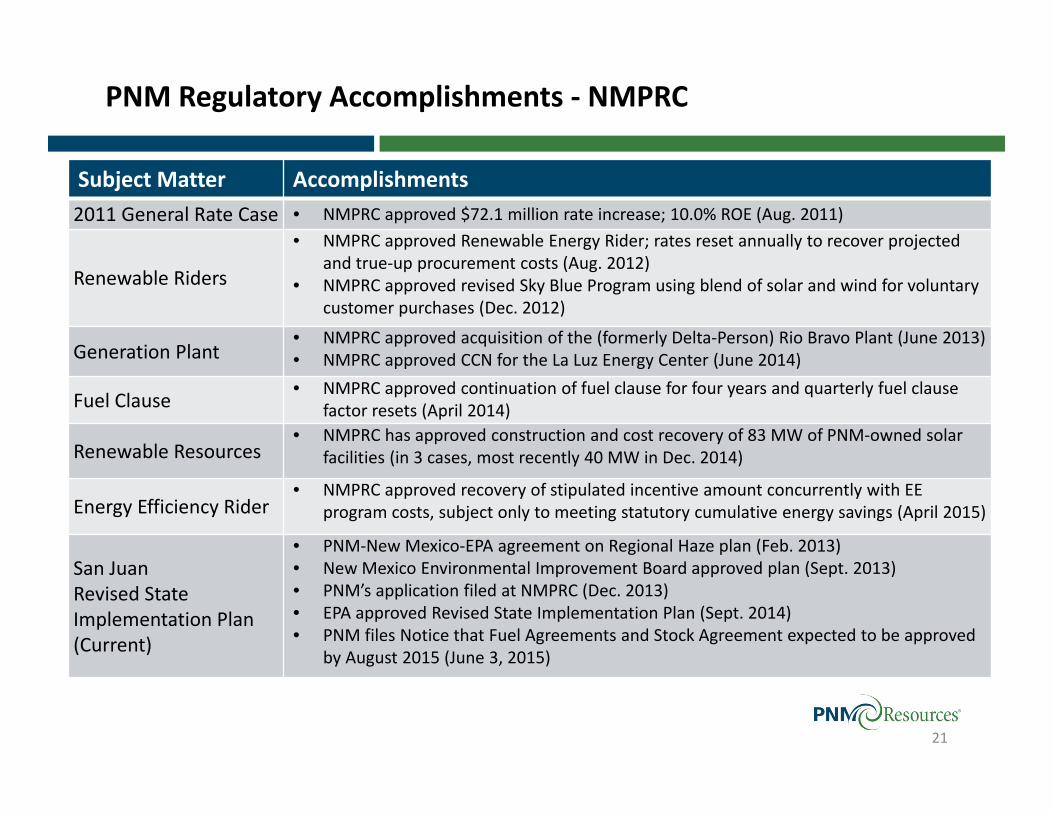
PNM Regulatory Accomplishments ‐ NMPRC
Subject Matter Accomplishments2011 General Rate Case • NMPRC approved $72.1 million rate increase; 10.0% ROE (Aug. 2011)
Renewable Riders
• NMPRC approved Renewable Energy Rider; rates reset annually to recover projected and true‐up procurement costs (Aug. 2012)
• NMPRC approved revised Sky Blue Program using blend of solar and wind for voluntary customer purchases (Dec. 2012)
Generation Plant• NMPRC approved acquisition of the (formerly Delta‐Person) Rio Bravo Plant (June 2013)• NMPRC approved CCN for the La Luz Energy Center (June 2014)
Fuel Clause • NMPRC approved continuation of fuel clause for four years and quarterly fuel clause factor resets (April 2014)
Renewable Resources• NMPRC has approved construction and cost recovery of 83 MW of PNM‐owned solar
facilities (in 3 cases, most recently 40 MW in Dec. 2014)
Energy Efficiency Rider• NMPRC approved recovery of stipulated incentive amount concurrently with EE
program costs, subject only to meeting statutory cumulative energy savings (April 2015)
San Juan Revised State Implementation Plan (Current)
• PNM‐New Mexico‐EPA agreement on Regional Haze plan (Feb. 2013)• New Mexico Environmental Improvement Board approved plan (Sept. 2013)• PNM’s application filed at NMPRC (Dec. 2013)• EPA approved Revised State Implementation Plan (Sept. 2014)• PNM files Notice that Fuel Agreements and Stock Agreement expected to be approved
by August 2015 (June 3, 2015)
21

PNM Regulatory Accomplishments ‐ FERC
22
Subject Matter Accomplishments2010 Transmission Rate Case
• Settlement filed (July 2012)• FERC approved Settlement (Jan. 2013)
Generation Rate Case• Application filed to serve Navopache Electric Cooperative (Sept. 2011)• Settlement filed; imputed ROE is 10.0% (Dec. 2012)• FERC approved Settlement (April 2013)
2012 TransmissionRate Case (Current)
• Application filed (Dec. 2012)• Settlement filed; imputed ROE is 10.0% (March 2015)• FERC approval of Settlement is currently pending; rates implemented, subject to refund

Continue to earn allowed return• Minimize regulatory lag through timely rate case filings• Synchronize revenues and expenses• Use future test year
Continue to maintain strong investment grade credit metrics
Continue to control costs
23
PNM: Pathway to Continued Success

TNMP Overview

TNMP: Recent Accomplishments
TCOS and DCOS filings provide the ability to recover transmission and distribution cost of service investments on a timely basis
• TNMP’s latest TCOS filing requesting additional revenue of $4.4M was approved with rates effective March 16, 2015
Energy efficiency program costs collected through Energy Efficiency Cost Recovery Factor
• TNMP has achieved performance bonuses each year since 2010
Smart meter rider approval led to implementation of $12M surcharge collected 2011‐2023
Credit ratings increased by Moody’s to A2 with a positive outlook and S&P to A‐ with a positive outlook
2014 reliability measure best in 10 years25
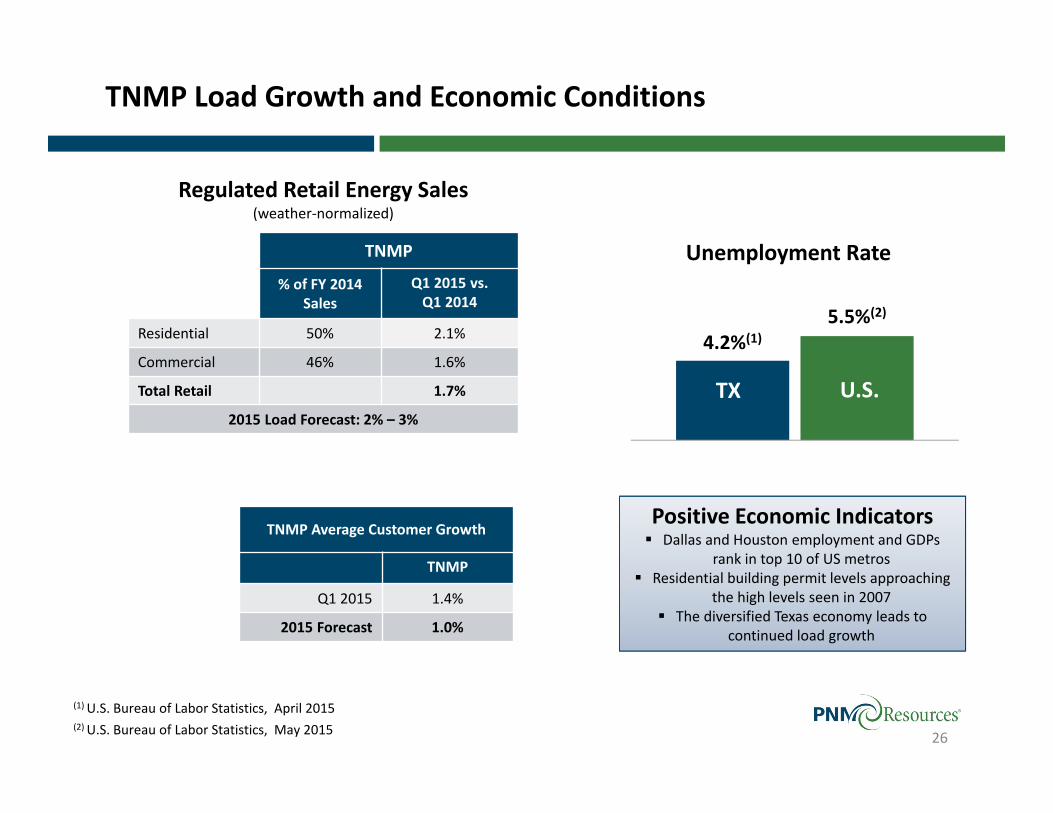
4.2%(1)5.5%(2)
Unemployment Rate
TX U.S.
TNMP Load Growth and Economic Conditions
26
Regulated Retail Energy Sales(weather‐normalized)
Positive Economic Indicators Dallas and Houston employment and GDPs
rank in top 10 of US metros Residential building permit levels approaching
the high levels seen in 2007 The diversified Texas economy leads to
continued load growth
(1) U.S. Bureau of Labor Statistics, April 2015(2) U.S. Bureau of Labor Statistics, May 2015
TNMP
% of FY 2014 Sales
Q1 2015 vs. Q1 2014
Residential 50% 2.1%
Commercial 46% 1.6%
Total Retail 1.7%
2015 Load Forecast: 2% – 3%
TNMP Average Customer Growth
TNMP
Q1 2015 1.4%
2015 Forecast 1.0%

TNMP Regulatory Update
27
Filing Action Timing Docket No.
TNMP TCOS Approved March 16, 2015
Rates effective March 16, 2015 44340
TNMP TCOS Expected to file July 2015
Rates expected to be effective September 2015
TBD
TNMP: Pathway to Continued Success
Continue to earn allowed rate of return through timely execution of transmission cost of service and general rate case filings
Invest in the business Continue to maintain strong investment grade credit metrics Continue to control costs
28

Financial Overview

Q1 2015 Financial Summary
30
$0.18
$0.21 $0.03 $0.01 ($0.01)
Q1 2014 Q1 2015
Ongoing EPS
PNM
TNMP Corporate
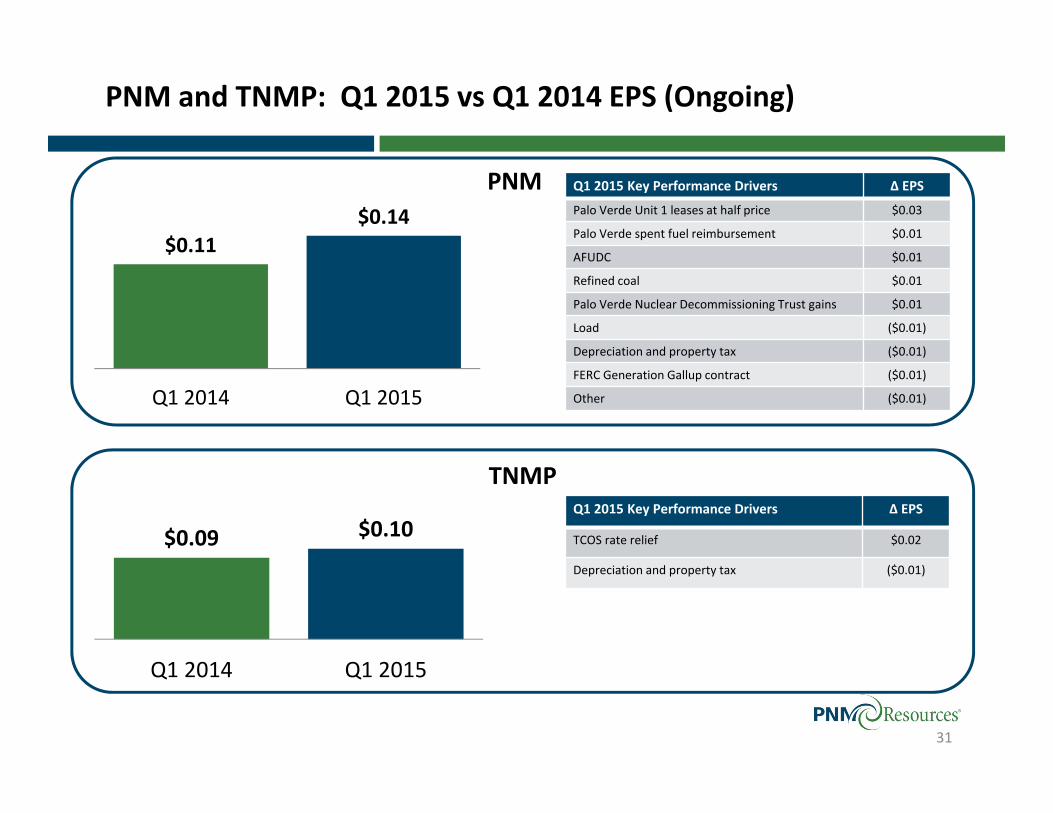
PNM and TNMP: Q1 2015 vs Q1 2014 EPS (Ongoing)
$0.11$0.14
Q1 2014 Q1 2015
31
$0.09 $0.10
Q1 2014 Q1 2015
PNM
TNMP
Q1 2015 Key Performance Drivers ∆ EPS
Palo Verde Unit 1 leases at half price $0.03
Palo Verde spent fuel reimbursement $0.01
AFUDC $0.01
Refined coal $0.01
Palo Verde Nuclear Decommissioning Trust gains $0.01
Load ($0.01)
Depreciation and property tax ($0.01)
FERC Generation Gallup contract ($0.01)
Other ($0.01)
Q1 2015 Key Performance Drivers ∆ EPS
TCOS rate relief $0.02
Depreciation and property tax ($0.01)
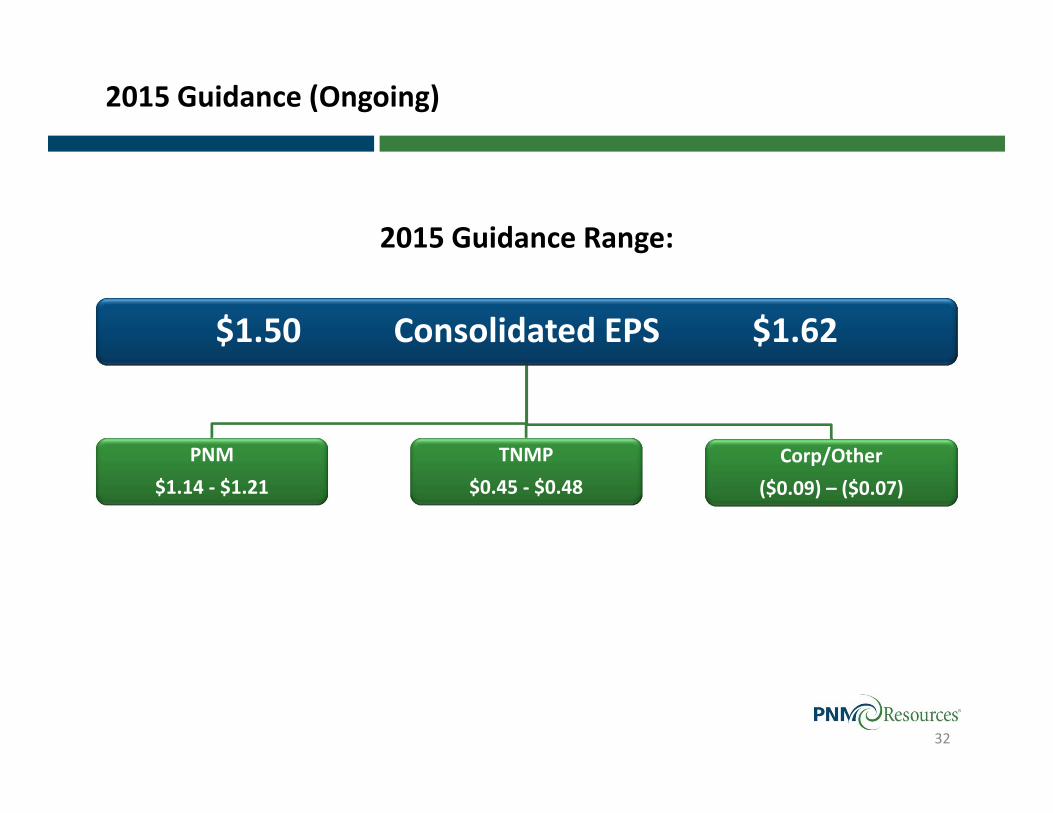
2015 Guidance (Ongoing)
32
2015 Guidance Range:
$1.50 Consolidated EPS $1.62
PNM$1.14 ‐ $1.21
TNMP$0.45 ‐ $0.48
Corp/Other($0.09) – ($0.07)
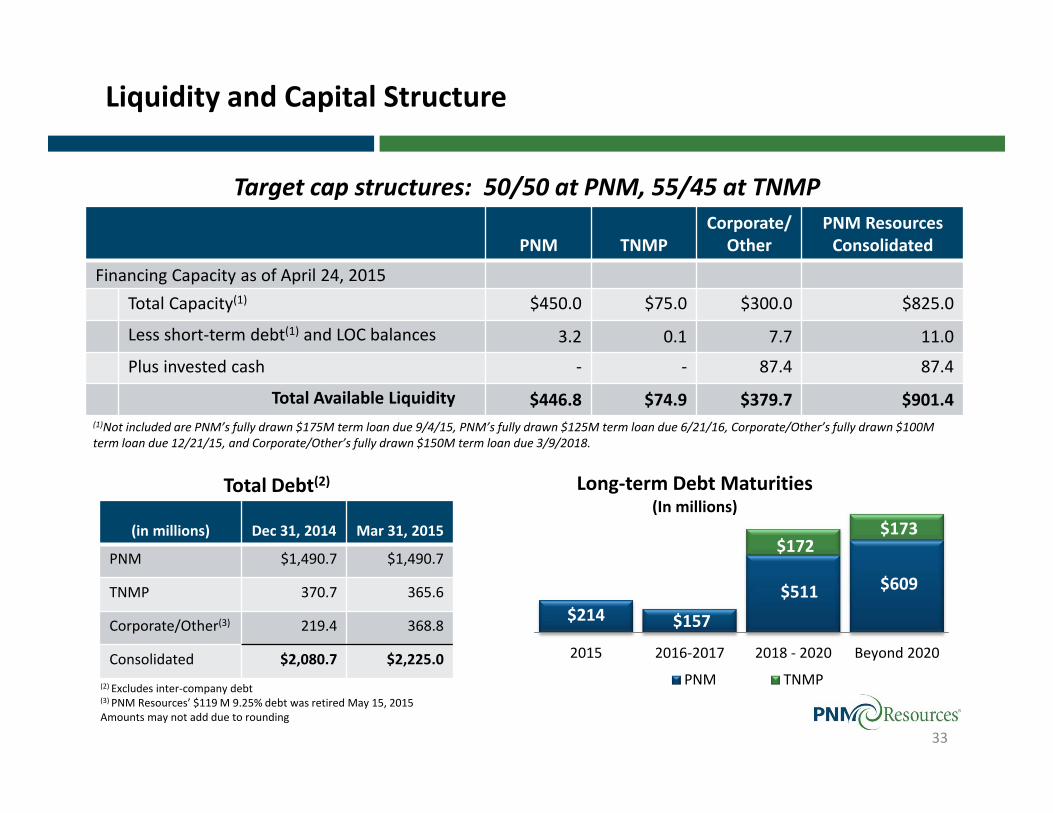
Liquidity and Capital Structure
PNM TNMPCorporate/
OtherPNM Resources Consolidated
Financing Capacity as of April 24, 2015Total Capacity(1) $450.0 $75.0 $300.0 $825.0
Less short‐term debt(1) and LOC balances 3.2 0.1 7.7 11.0
Plus invested cash ‐ ‐ 87.4 87.4
Total Available Liquidity $446.8 $74.9 $379.7 $901.4
Target cap structures: 50/50 at PNM, 55/45 at TNMP
(1)Not included are PNM’s fully drawn $175M term loan due 9/4/15, PNM’s fully drawn $125M term loan due 6/21/16, Corporate/Other’s fully drawn $100M term loan due 12/21/15, and Corporate/Other’s fully drawn $150M term loan due 3/9/2018.
33
(in millions) Dec 31, 2014 Mar 31, 2015
PNM $1,490.7 $1,490.7
TNMP 370.7 365.6
Corporate/Other(3) 219.4 368.8
Consolidated $2,080.7 $2,225.0
Total Debt(2)
$214 $157
$511 $609
$172 $173
2015 2016‐2017 2018 ‐ 2020 Beyond 2020
Long‐term Debt Maturities(In millions)
PNM TNMP(2) Excludes inter‐company debt(3) PNM Resources’ $119 M 9.25% debt was retired May 15, 2015Amounts may not add due to rounding

Debt Ratings
34
Debt Ratings
Moody’s
2008 2014PNM Resources(1) Ba2 Baa3
PNM(1) Baa3 Baa2
TNMP Baa3(1) A2(2)
Outlook Negative Positive
S&P
2008 2015PNM Resources(1) BB‐ BBB‐
PNM(1) BB+ BBB
TNMP BB+(1) A‐(2)
Outlook Negative Positive
(1) Senior unsecured(2) Senior secured
Rate relief, cost control, and tax benefits keep FFO to Debt solidly in Moody’s Baa investment grade target range of 13% to 22%
19% 19%17%
13%
22%
2013 2014 2015E
PNM Resources FFO to Debt

PNM Resources Summary
Continued earnings and dividend growth make PNM Resources an attractive investment
Potential earnings growth of 7% ‐ 9% through 2019
Expected rate base CAGR of 5% ‐ 7% through 2019
Potential investments beyond 2018: • Renewable resources• Transmission investments• Grid enhancements• Purchase remaining 114 MWs of Palo Verde leases
Continued above industry‐average dividend growth• Option to increase target payout ratio range after heightened capital spending is complete
35

Appendix
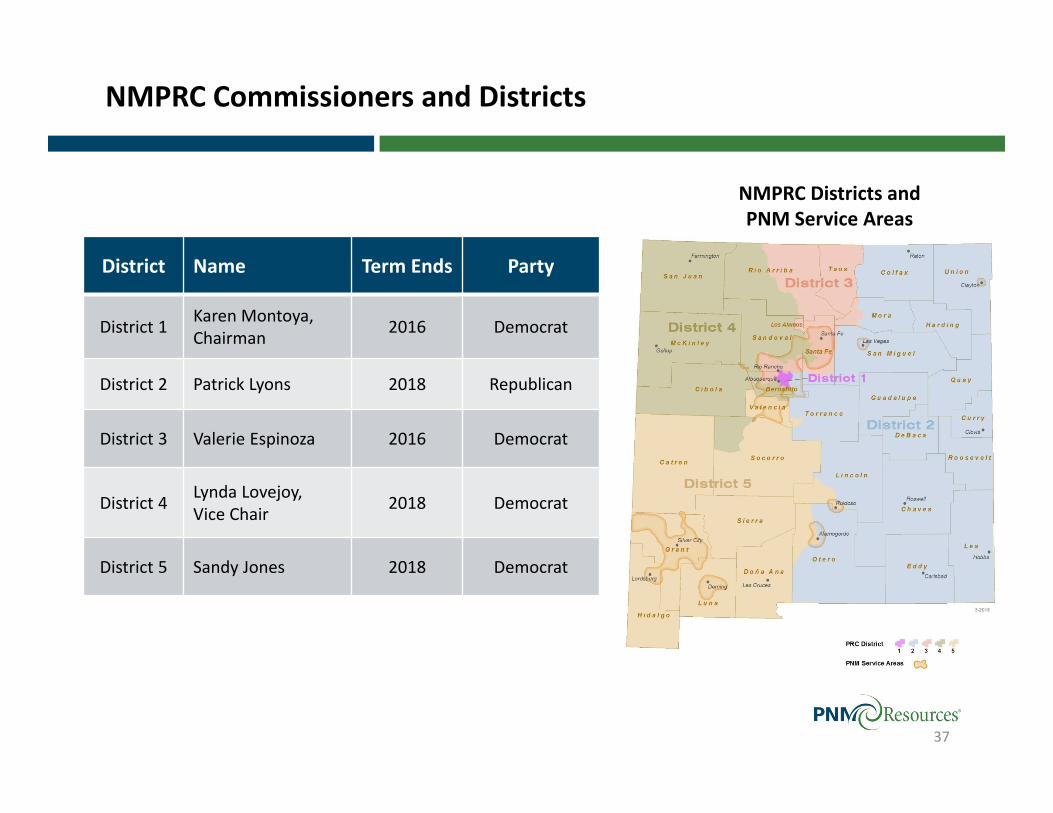
NMPRC Commissioners and Districts
37
District Name Term Ends Party
District 1 Karen Montoya, Chairman 2016 Democrat
District 2 Patrick Lyons 2018 Republican
District 3 Valerie Espinoza 2016 Democrat
District 4 Lynda Lovejoy, Vice Chair 2018 Democrat
District 5 Sandy Jones 2018 Democrat
NMPRC Districts and PNM Service Areas
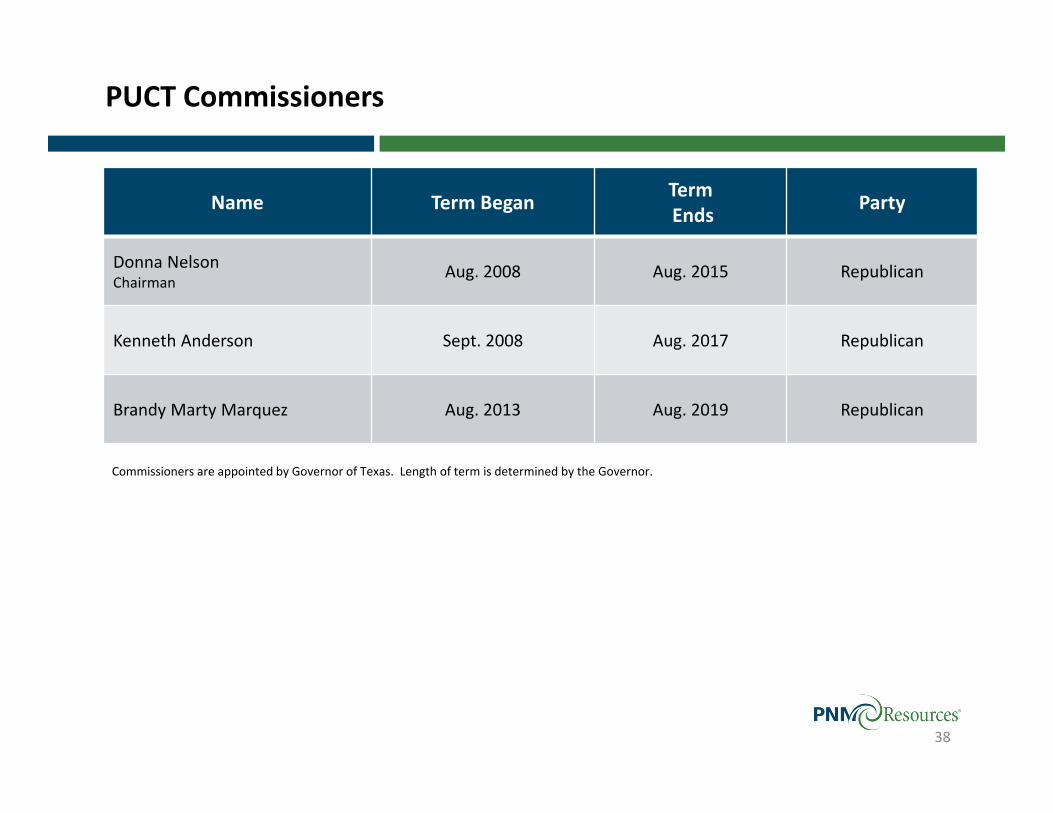
PUCT Commissioners
38
Commissioners are appointed by Governor of Texas. Length of term is determined by the Governor.
Name Term Began TermEnds Party
Donna NelsonChairman
Aug. 2008 Aug. 2015 Republican
Kenneth Anderson Sept. 2008 Aug. 2017 Republican
Brandy Marty Marquez Aug. 2013 Aug. 2019 Republican
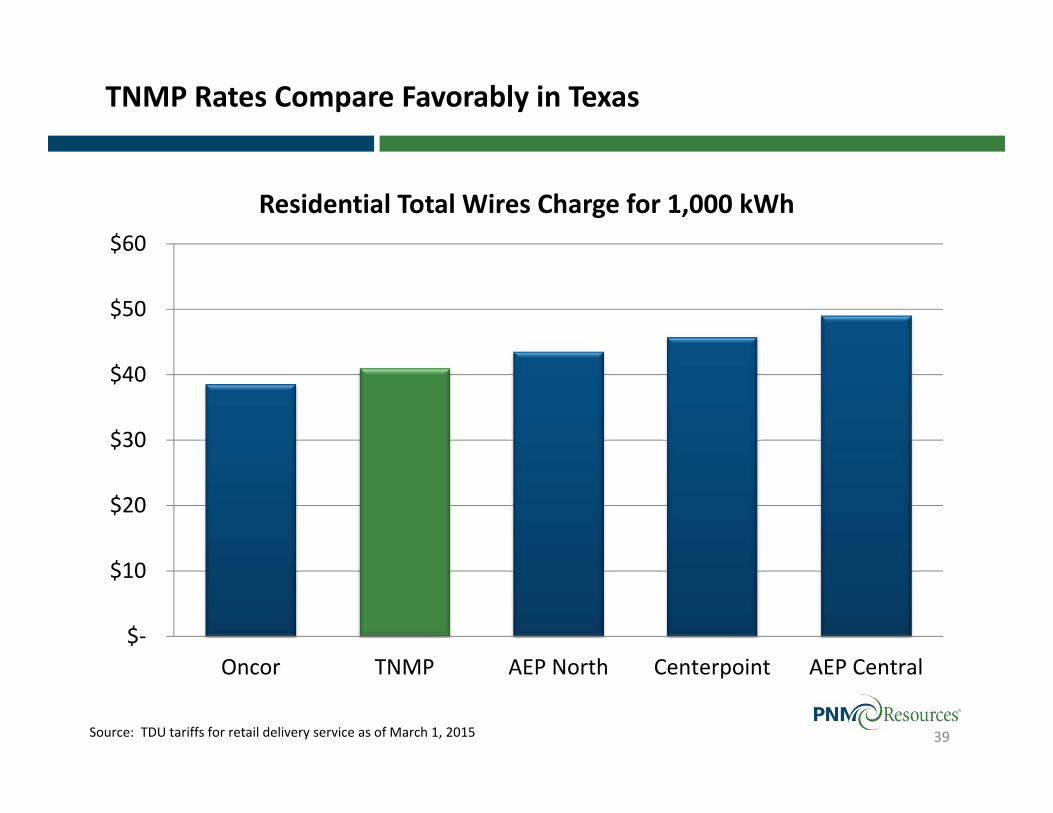
TNMP Rates Compare Favorably in Texas
$‐
$10
$20
$30
$40
$50
$60
Oncor TNMP AEP North Centerpoint AEP Central
Residential Total Wires Charge for 1,000 kWh
Source: TDU tariffs for retail delivery service as of March 1, 2015 39
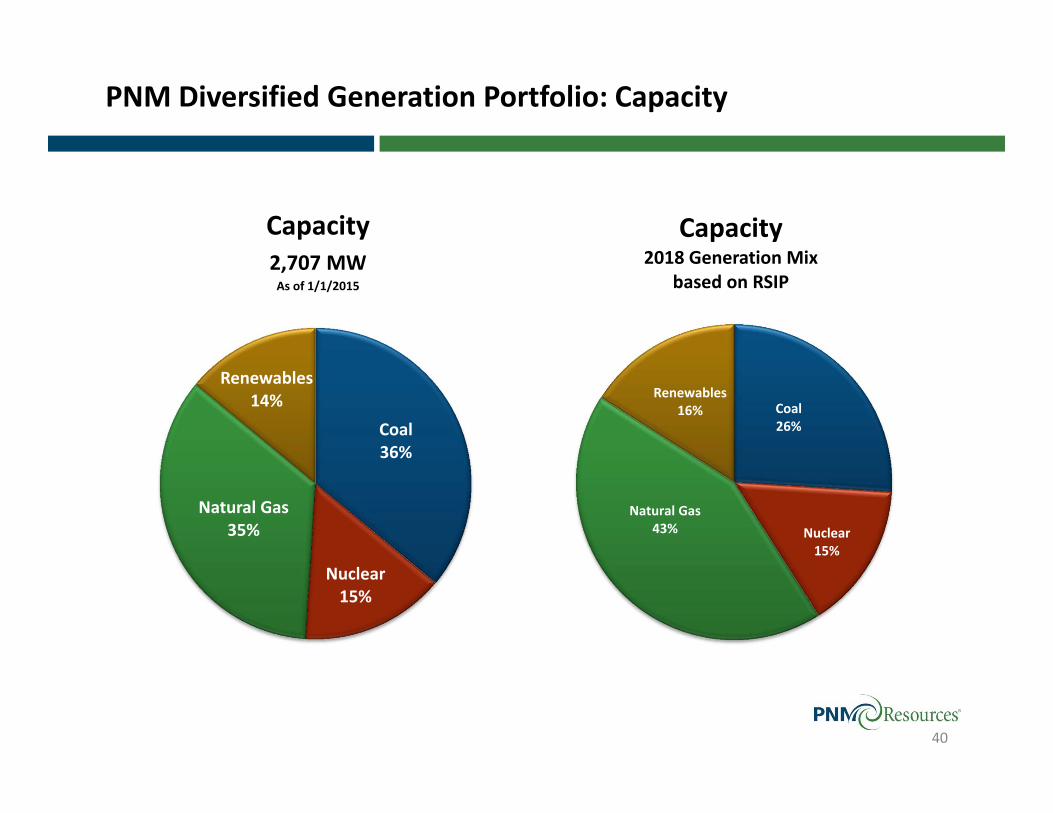
Coal 26%
Nuclear15%
Natural Gas43%
Renewables16%
Capacity2018 Generation Mix
based on RSIP
Coal 36%
Nuclear15%
Natural Gas35%
Renewables14%
Capacity2,707 MWAs of 1/1/2015
PNM Diversified Generation Portfolio: Capacity
40
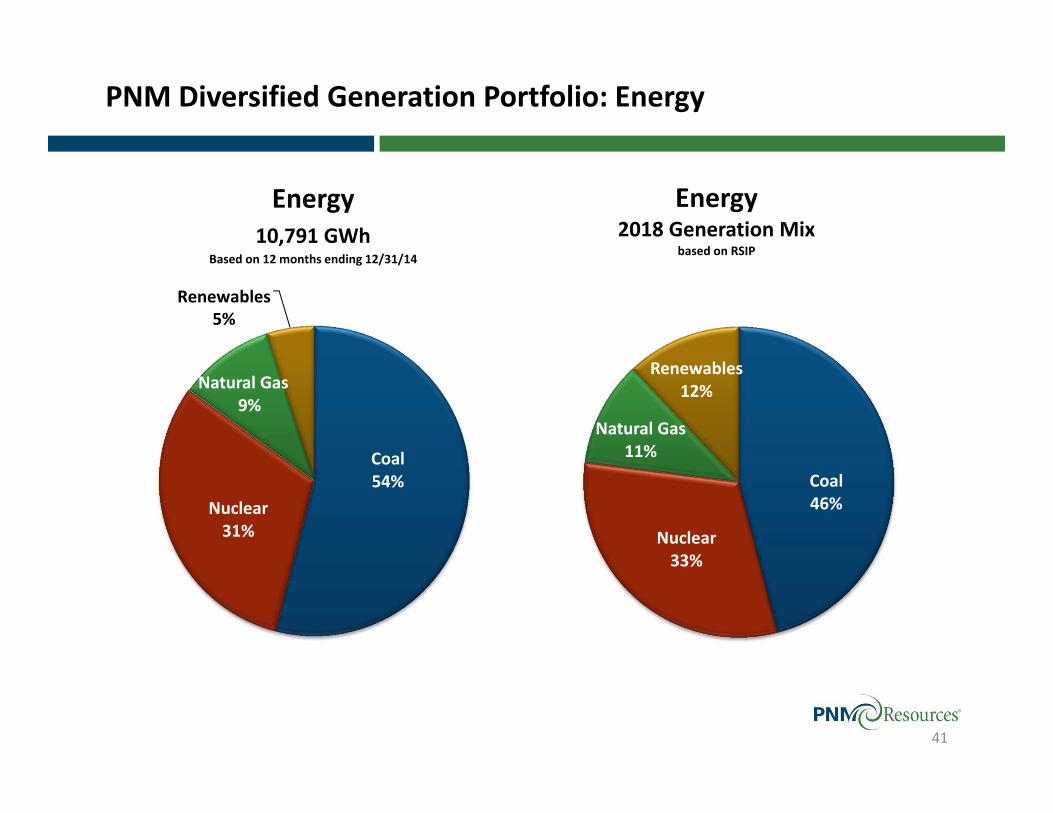
PNM Diversified Generation Portfolio: Energy
41
Coal 54%
Nuclear31%
Natural Gas9%
Renewables5%
Energy10,791 GWh
Based on 12 months ending 12/31/14
Renewables 5%
Coal 46%
Nuclear33%
Natural Gas11%
Renewables12%
Energy2018 Generation Mix
based on RSIP
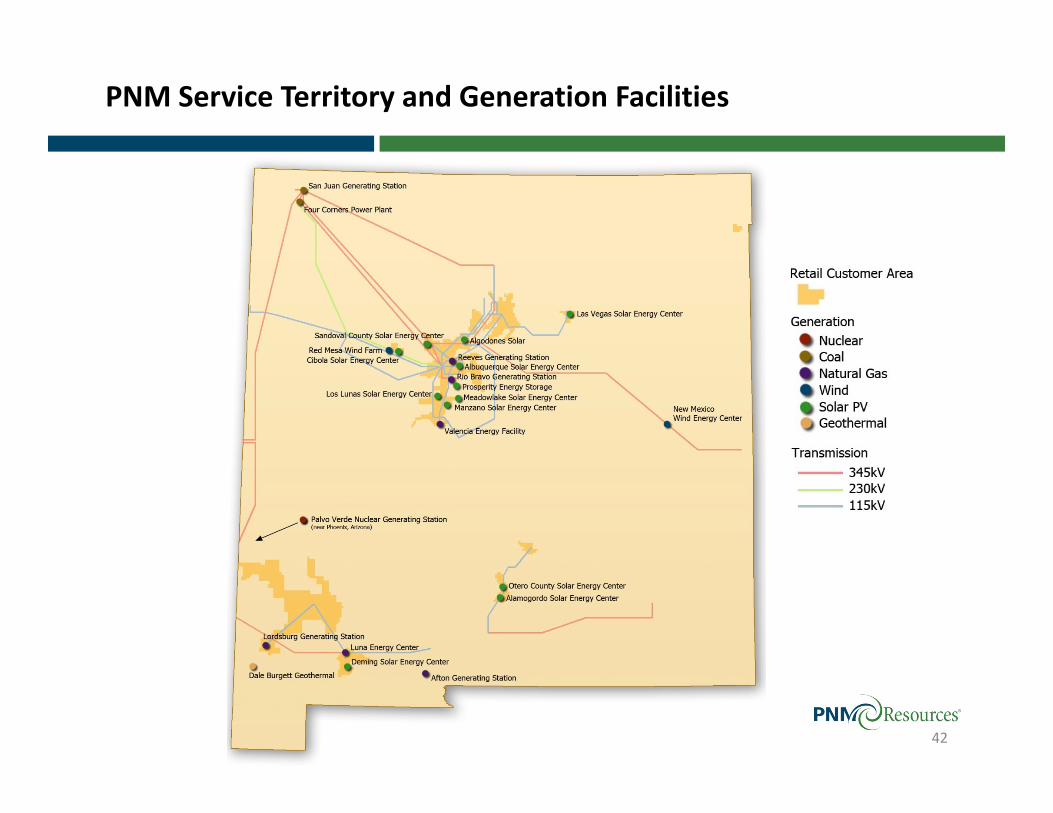
PNM Service Territory and Generation Facilities
42
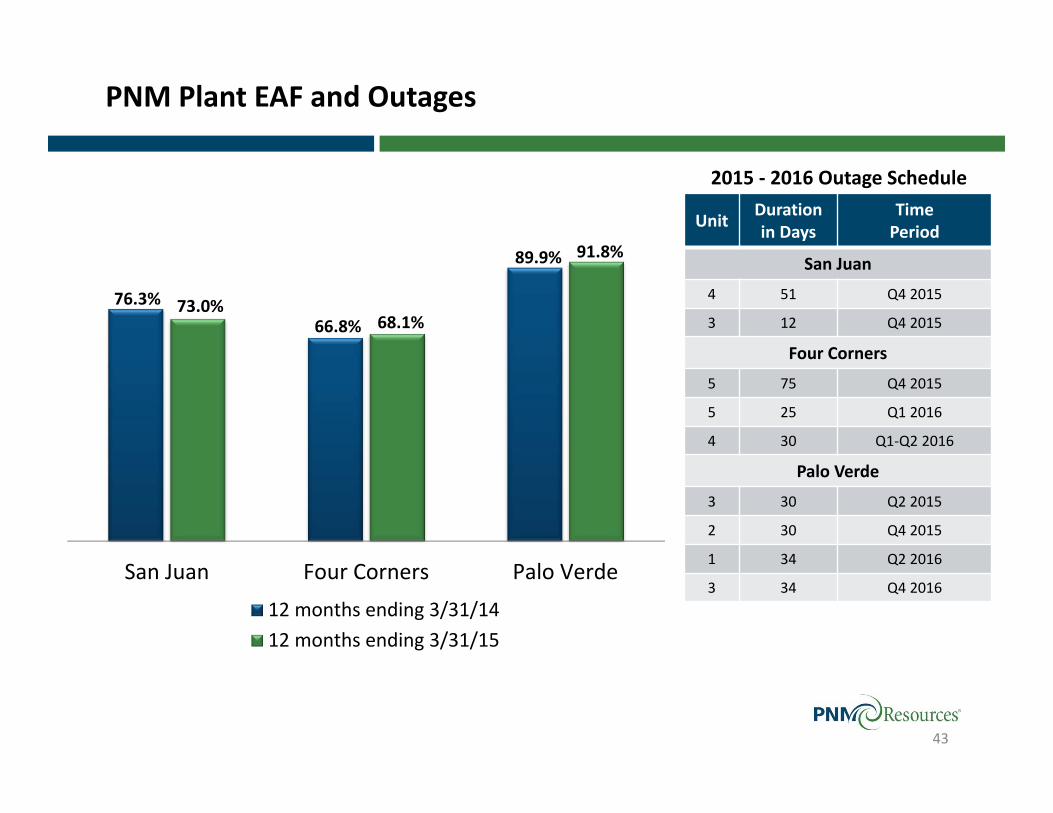
PNM Plant EAF and Outages
43
2015 ‐ 2016 Outage Schedule
76.3%66.8%
89.9%
73.0%68.1%
91.8%
San Juan Four Corners Palo Verde12 months ending 3/31/1412 months ending 3/31/15
Unit Duration in Days
Time Period
San Juan
4 51 Q4 2015
3 12 Q4 2015
Four Corners
5 75 Q4 2015
5 25 Q1 2016
4 30 Q1‐Q2 2016
Palo Verde
3 30 Q2 2015
2 30 Q4 2015
1 34 Q2 2016
3 34 Q4 2016
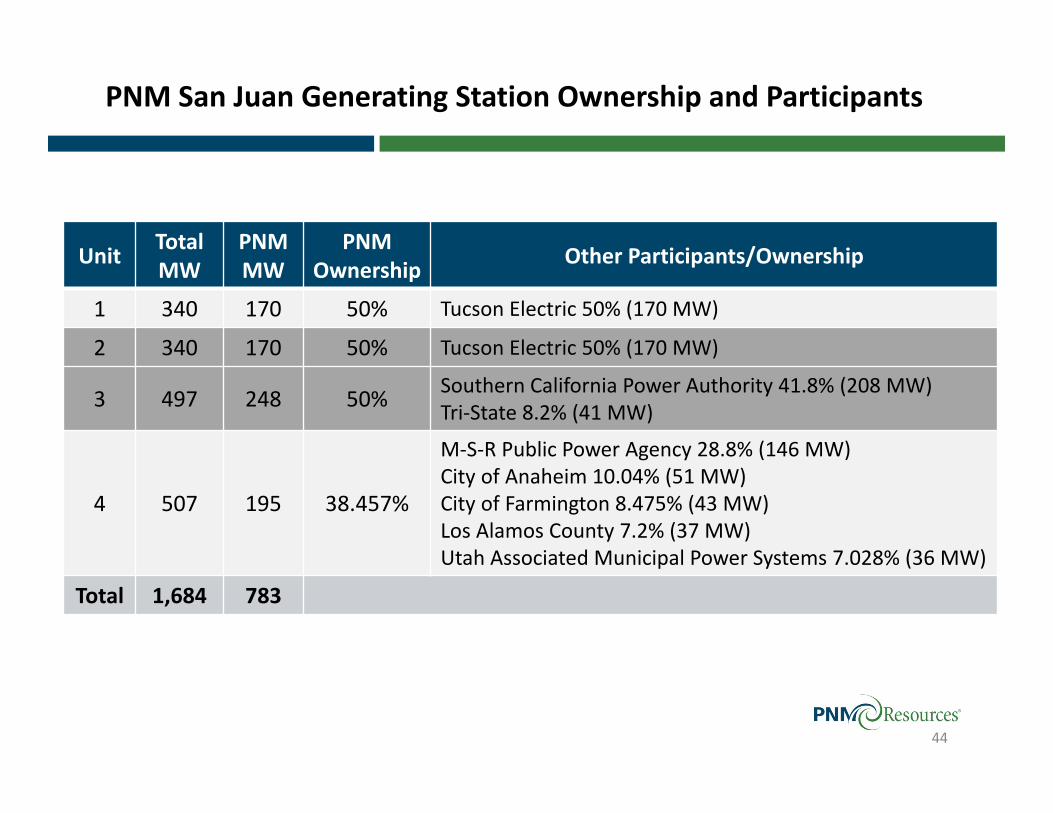
PNM San Juan Generating Station Ownership and Participants
Unit TotalMW
PNM MW
PNM Ownership Other Participants/Ownership
1 340 170 50% Tucson Electric 50% (170 MW)
2 340 170 50% Tucson Electric 50% (170 MW)
3 497 248 50% Southern California Power Authority 41.8% (208 MW)Tri‐State 8.2% (41 MW)
4 507 195 38.457%
M‐S‐R Public Power Agency 28.8% (146 MW)City of Anaheim 10.04% (51 MW)City of Farmington 8.475% (43 MW)Los Alamos County 7.2% (37 MW)Utah Associated Municipal Power Systems 7.028% (36 MW)
Total 1,684 783
44
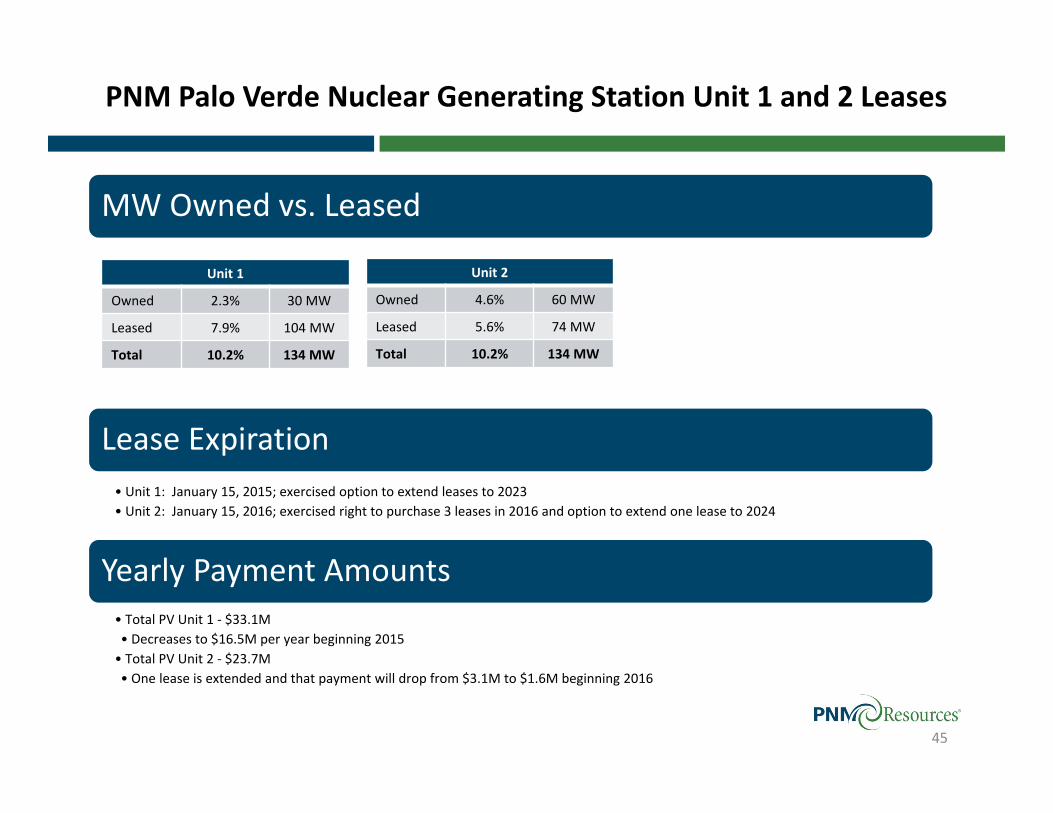
MW Owned vs. Leased
Lease Expiration• Unit 1: January 15, 2015; exercised option to extend leases to 2023• Unit 2: January 15, 2016; exercised right to purchase 3 leases in 2016 and option to extend one lease to 2024
Yearly Payment Amounts• Total PV Unit 1 ‐ $33.1M• Decreases to $16.5M per year beginning 2015• Total PV Unit 2 ‐ $23.7M• One lease is extended and that payment will drop from $3.1M to $1.6M beginning 2016
Unit 1
Owned 2.3% 30 MW
Leased 7.9% 104 MW
Total 10.2% 134 MW
Unit 2
Owned 4.6% 60 MW
Leased 5.6% 74 MW
Total 10.2% 134 MW
45
PNM Palo Verde Nuclear Generating Station Unit 1 and 2 Leases
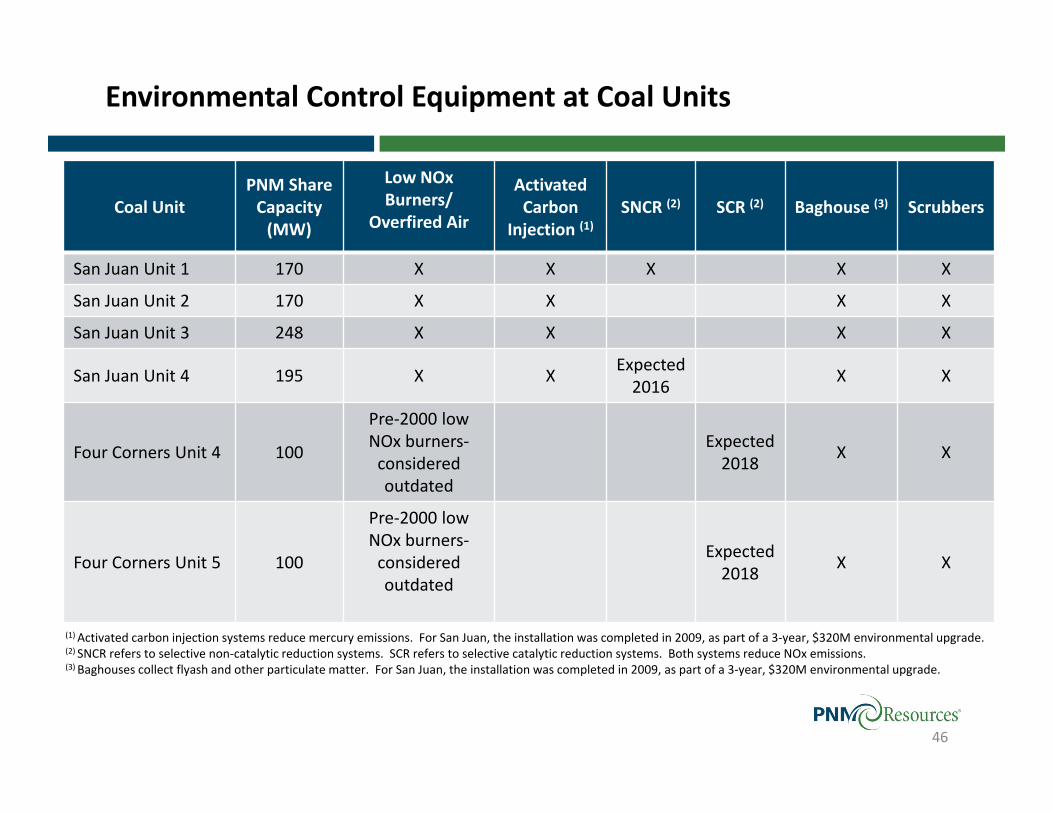
Coal UnitPNM Share Capacity (MW)
Low NOx Burners/
Overfired Air
Activated Carbon
Injection (1)SNCR (2) SCR (2) Baghouse (3) Scrubbers
San Juan Unit 1 170 X X X X X
San Juan Unit 2 170 X X X X
San Juan Unit 3 248 X X X X
San Juan Unit 4 195 X X Expected2016 X X
Four Corners Unit 4 100
Pre‐2000 low NOx burners‐considered outdated
Expected 2018 X X
Four Corners Unit 5 100
Pre‐2000 low NOx burners‐considered outdated
Expected 2018 X X
(1) Activated carbon injection systems reduce mercury emissions. For San Juan, the installation was completed in 2009, as part of a 3‐year, $320M environmental upgrade.(2) SNCR refers to selective non‐catalytic reduction systems. SCR refers to selective catalytic reduction systems. Both systems reduce NOx emissions.(3) Baghouses collect flyash and other particulate matter. For San Juan, the installation was completed in 2009, as part of a 3‐year, $320M environmental upgrade.
46
Environmental Control Equipment at Coal Units
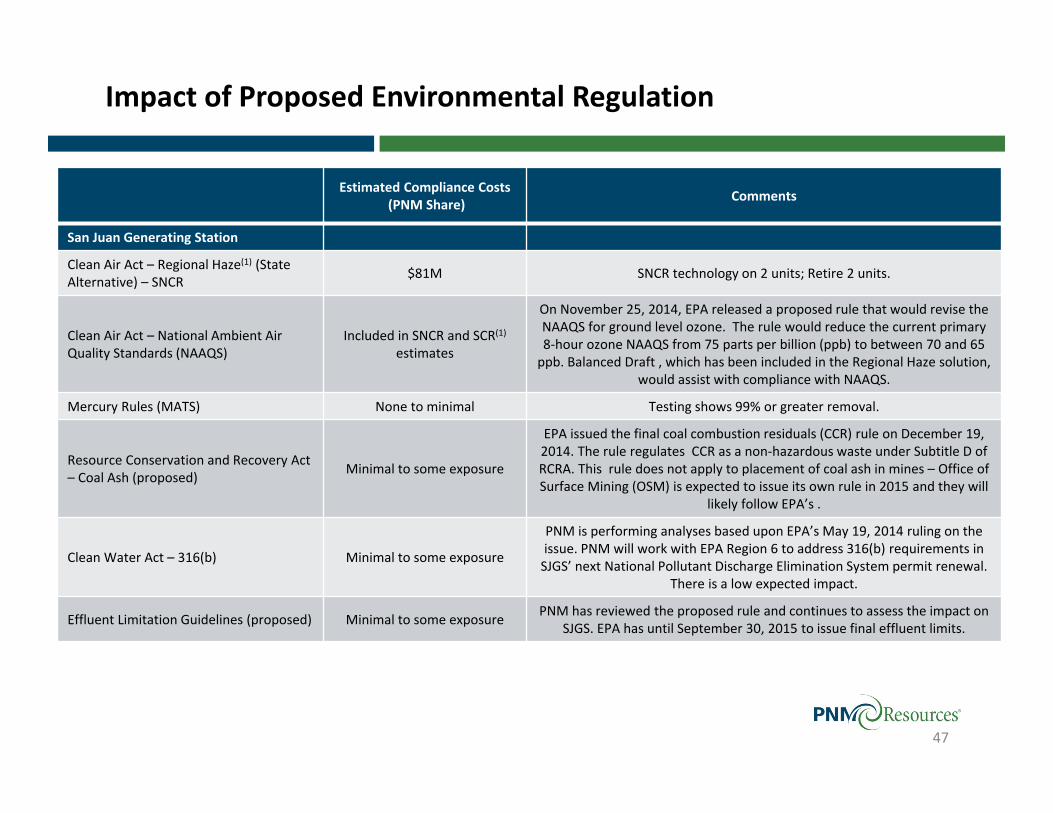
Estimated Compliance Costs(PNM Share) Comments
San Juan Generating Station
Clean Air Act – Regional Haze(1) (StateAlternative) – SNCR $81M SNCR technology on 2 units; Retire 2 units.
Clean Air Act – National Ambient Air Quality Standards (NAAQS)
Included in SNCR and SCR(1)estimates
On November 25, 2014, EPA released a proposed rule that would revise the NAAQS for ground level ozone. The rule would reduce the current primary 8‐hour ozone NAAQS from 75 parts per billion (ppb) to between 70 and 65 ppb. Balanced Draft , which has been included in the Regional Haze solution,
would assist with compliance with NAAQS.
Mercury Rules (MATS) None to minimal Testing shows 99% or greater removal.
Resource Conservation and Recovery Act – Coal Ash (proposed) Minimal to some exposure
EPA issued the final coal combustion residuals (CCR) rule on December 19, 2014. The rule regulates CCR as a non‐hazardous waste under Subtitle D of RCRA. This rule does not apply to placement of coal ash in mines – Office of Surface Mining (OSM) is expected to issue its own rule in 2015 and they will
likely follow EPA’s .
Clean Water Act – 316(b) Minimal to some exposure
PNM is performing analyses based upon EPA’s May 19, 2014 ruling on the issue. PNM will work with EPA Region 6 to address 316(b) requirements in SJGS’ next National Pollutant Discharge Elimination System permit renewal.
There is a low expected impact.
Effluent Limitation Guidelines (proposed) Minimal to some exposure PNM has reviewed the proposed rule and continues to assess the impact on SJGS. EPA has until September 30, 2015 to issue final effluent limits.
Impact of Proposed Environmental Regulation
47
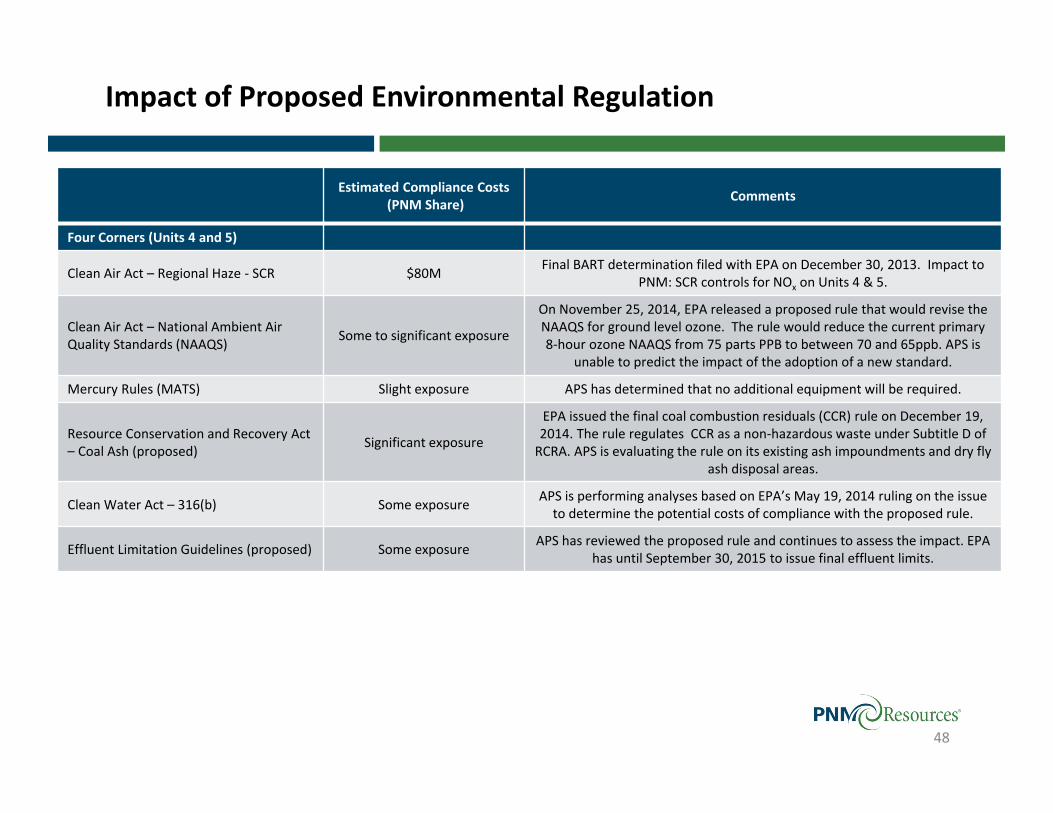
Estimated Compliance Costs(PNM Share) Comments
Four Corners (Units 4 and 5)
Clean Air Act – Regional Haze ‐ SCR $80M Final BART determination filed with EPA on December 30, 2013. Impact to PNM: SCR controls for NOx on Units 4 & 5.
Clean Air Act – National Ambient Air Quality Standards (NAAQS) Some to significant exposure
On November 25, 2014, EPA released a proposed rule that would revise the NAAQS for ground level ozone. The rule would reduce the current primary 8‐hour ozone NAAQS from 75 parts PPB to between 70 and 65ppb. APS is
unable to predict the impact of the adoption of a new standard.
Mercury Rules (MATS) Slight exposure APS has determined that no additional equipment will be required.
Resource Conservation and Recovery Act – Coal Ash (proposed) Significant exposure
EPA issued the final coal combustion residuals (CCR) rule on December 19, 2014. The rule regulates CCR as a non‐hazardous waste under Subtitle D of RCRA. APS is evaluating the rule on its existing ash impoundments and dry fly
ash disposal areas.
Clean Water Act – 316(b) Some exposure APS is performing analyses based on EPA’s May 19, 2014 ruling on the issue to determine the potential costs of compliance with the proposed rule.
Effluent Limitation Guidelines (proposed) Some exposure APS has reviewed the proposed rule and continues to assess the impact. EPA has until September 30, 2015 to issue final effluent limits.
Impact of Proposed Environmental Regulation
48

EPA’s Proposed Clean Power Plan
Requires each state to develop and implement a state plan to reduce its CO2emissions rate to meet state‐specific standards based on 2012 average emissions rates for all affected fossil‐fueled units in the state.
• Issued under the authority of section 111(d) of the Clean Air Act (CAA).
Results in a two‐phased program:• Interim emission rate goal for “phased‐in” period of 2020‐2029.
New Mexico’s required interim reduction of emissions from 2012 will be 30%.
• Final emissions rate goal must be achieved in 2030 and beyond. New Mexico’s required final reduction of emissions from 2012
will be 34%.
State goals are based upon 4 building blocks that include:• Increase in heat rate efficiency by 6% at fossil fuel power plants• Switch to lower emitting combined cycle plants‐ to operate up to 70%• Add more RE (assumed 21% RPS for NM)• Add more EE (all states increase annual EE savings by 10.5% by 2030)
A supplemental proposal for regulating power plants in Indian County under section 111(d) was published on 11/04/14. The proposal sets emission reduction goals based upon building block 1 (heat rate improvements) and building block 4 (a small improvement in demand‐side energy efficiency).
10 New Mexico Facilities AffectedCoal Plants
San Juan (PNM)
Escalante (Tri‐State)
Natural Gas Combined Cycle Plants
Afton (PNM)
Luna (PNM)
Bluffview (City of Farmington)
Hobbs (Xcel)
Oil and Gas Steam Plants
Reeves (PNM)
Cunningham (Xcel)
Rio Grande (El Paso)
Maddox (Xcel)
The goal of the plan is an estimated 30% reduction in CO2emissions from the U.S. electric power sector in 2030,
relative to 2005 levels.
49