JSW Steel Ltd. - India Infolinecontent.indiainfoline.com/wc/research/researchreports/JSWSteel... ·...
17
Sector: Metals & Mining Sector view: Neutral Sensex: 27,126 52 Week h/l (Rs): 1,365 / 805 Market cap (Rscr) : 25,135 6m Avg vol (‘000Nos): 606 Bloomberg code: JSTL IN BSE code: 500,228 NSE code: JSWSTEEL FV (Rs): 10 Price as on December 18, 2014 Company rating grid Low High 1 2 3 4 5 Earnings Growth Cash Flow B/S Strength Valuation appeal Risk Share price trend 0 50 100 150 Dec‐13 Jun‐14 Dec‐14 JSWSTEEL Sensex Share holding pattern (%) Mar‐14 Jun‐14 Sep‐14 Promoter 38.5 38.5 39.3 Insti 23.3 24.6 24.1 Others 38.3 36.9 36.6 Rating: BUY Target: Rs1,332 CMP: Rs1,040 Upside: 28.1% JSW Steel Ltd. Company Report December 19, 2014 This report is published by IIFL ‘India Private Clients’ research desk. IIFL has other business units with independent research teams separated by 'Chinese walls' catering to different sets of customers having varying objectives, risk profiles, investment horizon, etc. The views and opinions expressed in this document may at times be contrary in terms of rating, target prices, estimates and views on sectors and markets. Change in Estimates Rating Target Research Analyst: Tarang Bhanushali [email protected] Earnings growth to remain strong JSW Steel has corrected sharply over the last three months due to rising concerns over dumping of Chinese steel, subdued domestic demand and decreasing domestic iron ore production. We believe that the correction in the stock is overdone and we expect the scenario to improve in FY16. The sharp correction in global iron ore prices has helped the company to switch to imported iron ore over domestic purchase. Landed cost of imported iron ore at JSW’s Dolvi and Salem plant is quite lower than the landed cost of iron ore from NMDC. The depreciation of the rupee would reduce the pressure of imports from China and Ukraine. We believe domestic demand would pick up from FY16 as revival in the domestic economy gains steam, which in turn will lead to an increase in infrastructure spending. We expect JSW’s bottomline to double over FY14‐17 on account of (1) increased output from Dolvi (2) substitution of expensive domestic ore with cheaper imports (3) cost rationalization exercise at Dolvi (4) superior product mix. Valuations at 4.9x FY16E EV/EBIDTA appear cheap compared to the global steel players trading at 5.7x. We upgrade our recommendation from Accumulate to BUY with a revised price target of Rs1,332. Steel prices globally have been under pressure over the last three months as cheap exports from China and Ukraine flooded the markets. Steel prices, which had managed to hold ground in H1 2014 even after the sharp correction in raw material prices, were under pressure due to strengthening of the dollar. Exports from China and Ukraine also rose as their currencies weakened against the dollar. Even after the price correction over the last three months, Chinese export HRC prices have declined 14% yoy YTD 2014 against a decline of 49% for iron ore and 25% for coking coal. Steel spreads which expanded sharply in Q1 FY14 have been under pressure due to excess capacity in the system and slowing demand growth in China. Exports from China in the first 11 months of 2014 jumped 46.8% yoy to 84mn tons as demand fell 1.4% yoy. Domestic steel prices too have been in the correction phase over the last six months due to pressure from cheaper imports from China and subdued domestic demand. We expect prices to decline further from current levels and then stabilize as domestic demand recovers in FY16. Financial summary Y/e 31 Mar (Rs m) FY14 FY15E FY16E FY17E Revenues 512,196 546,549 581,726 649,738 yoy growth (%) 34.0 6.7 6.4 11.7 Operating profit 91,655 106,810 121,208 132,005 OPM (%) 17.9 19.5 20.8 20.3 Pre‐exceptional PAT 21,647 27,012 34,928 42,852 Reported PAT 4,519 27,012 34,928 42,852 yoy growth (%) 62.5 24.8 29.3 22.7 EPS (Rs) 89.6 111.7 144.5 177.3 P/E (x) 11.6 9.3 7.2 5.9 EV/EBITDA (x) 6.5 5.7 4.9 4.4 Debt/Equity (x) 1.7 1.6 1.3 1.1 RoE (%) 11.2 12.0 13.8 14.9 RoCE (%) 12.0 12.0 13.5 14.8 Source: Company, India Infoline Research
Transcript of JSW Steel Ltd. - India Infolinecontent.indiainfoline.com/wc/research/researchreports/JSWSteel... ·...

Sector: Metals & Mining
Sector view: Neutral
Sensex: 27,126
52 Week h/l (Rs): 1,365 / 805
Market cap (Rscr) : 25,135
6m Avg vol (‘000Nos): 606
Bloomberg code: JSTL IN
BSE code: 500,228
NSE code: JSWSTEEL
FV (Rs): 10
Price as on December 18, 2014
Company rating grid
Low High
1 2 3 4 5
Earnings Growth
Cash Flow
B/S Strength
Valuation appeal
Risk
Share price trend
0
50
100
150
Dec‐13 Jun‐14 Dec‐14
JSWSTEEL Sensex
Share holding pattern (%) Mar‐14 Jun‐14 Sep‐14
Promoter 38.5 38.5 39.3
Insti 23.3 24.6 24.1
Others 38.3 36.9 36.6
Rating: BUYTarget: Rs1,332
CMP: Rs1,040
Upside: 28.1%
JSW Steel Ltd.
Company Report
December 19, 2014
This report is published by IIFL ‘India Private Clients’ research desk. IIFL has other business units with independent research teams separated by 'Chinese walls' catering to different sets of customers having varying objectives, risk profiles, investment horizon, etc. The views and opinions expressed in this document may at times be contrary in terms of rating, target prices, estimates and views on sectors and markets.
Change in Estimates Rating Target
Research Analyst: Tarang Bhanushali
Earnings growth to remain strong JSW Steel has corrected sharply over the last three months due to rising concerns over dumping of Chinese steel, subdued domestic demand and decreasing domestic iron ore production. We believe that the correction in the stock is overdone and we expect the scenario to improve in FY16. The sharp correction in global iron ore prices has helped the company to switch to imported iron ore over domestic purchase. Landed cost of imported iron ore at JSW’s Dolvi and Salem plant is quite lower than the landed cost of iron ore from NMDC. The depreciation of the rupee would reduce the pressure of imports from China and Ukraine. We believe domestic demand would pick up from FY16 as revival in the domestic economy gains steam, which in turn will lead to an increase in infrastructure spending. We expect JSW’s bottomline to double over FY14‐17 on account of (1) increased output from Dolvi (2) substitution of expensive domestic ore with cheaper imports (3) cost rationalization exercise at Dolvi (4) superior product mix. Valuations at 4.9x FY16E EV/EBIDTA appear cheap compared to the global steel players trading at 5.7x. We upgrade our recommendation from Accumulate to BUY with a revised price target of Rs1,332.
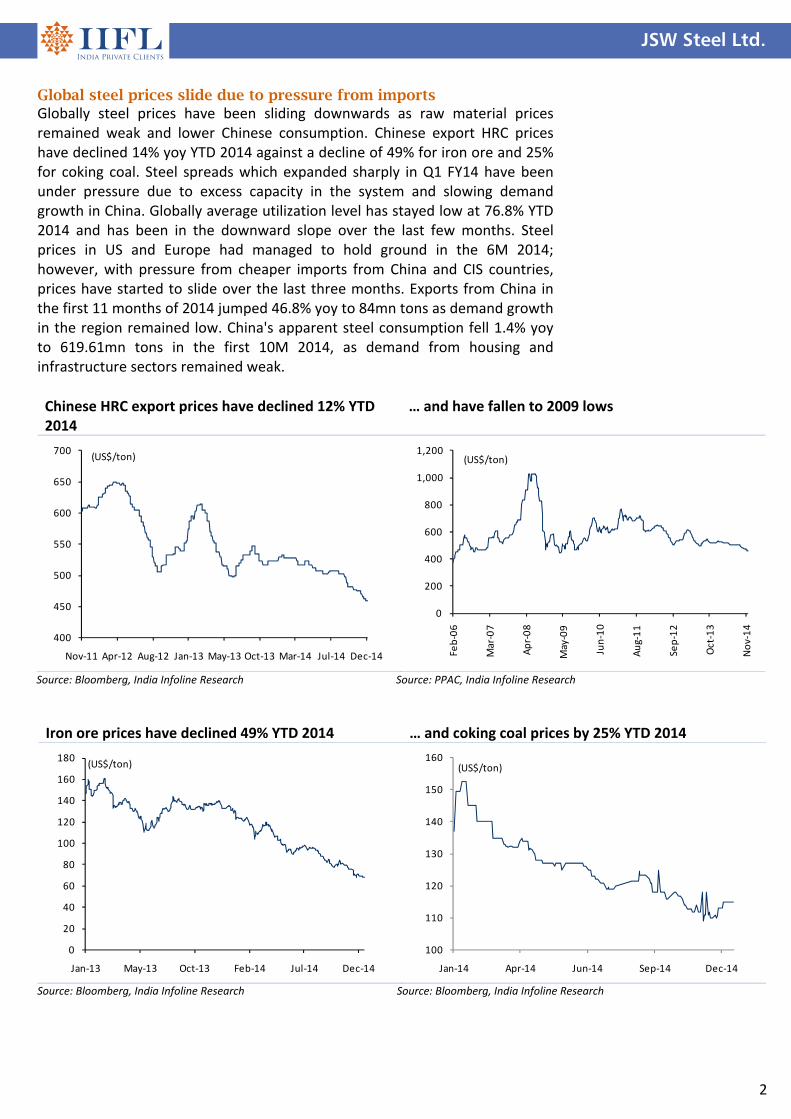
Steel prices globally have been under pressure over the last three months as cheap exports from China and Ukraine flooded the markets. Steel prices, which had managed to hold ground in H1 2014 even after the sharp correction in raw material prices, were under pressure due to strengthening of the dollar. Exports from China and Ukraine also rose as their currencies weakened against the dollar. Even after the price correction over the last three months, Chinese export HRC prices have declined 14% yoy YTD 2014 against a decline of 49% for iron ore and 25% for coking coal. Steel spreads which expanded sharply in Q1 FY14 have been under pressure due to excess capacity in the system and slowing demand growth in China. Exports from China in the first 11 months of 2014 jumped 46.8% yoy to 84mn tons as demand fell 1.4% yoy. Domestic steel prices too have been in the correction phase over the last six months due to pressure from cheaper imports from China and subdued domestic demand. We expect prices to decline further from current levels and then stabilize as domestic demand recovers in FY16.
Financial summary Y/e 31 Mar (Rs m) FY14 FY15E FY16E FY17E
Revenues 512,196 546,549 581,726 649,738
yoy growth (%) 34.0 6.7 6.4 11.7
Operating profit 91,655 106,810 121,208 132,005
OPM (%) 17.9 19.5 20.8 20.3
Pre‐exceptional PAT 21,647 27,012 34,928 42,852
Reported PAT 4,519 27,012 34,928 42,852
yoy growth (%) 62.5 24.8 29.3 22.7
EPS (Rs) 89.6 111.7 144.5 177.3
P/E (x) 11.6 9.3 7.2 5.9
EV/EBITDA (x) 6.5 5.7 4.9 4.4
Debt/Equity (x) 1.7 1.6 1.3 1.1
RoE (%) 11.2 12.0 13.8 14.9
RoCE (%) 12.0 12.0 13.5 14.8 Source: Company, India Infoline Research
JSW Steel Ltd.
2
Chinese HRC export prices have declined 12% YTD 2014
… and have fallen to 2009 lows
400
450
500
550
600
650
700
Nov‐11 Apr‐12 Aug‐12 Jan‐13 May‐13 Oct‐13 Mar‐14 Jul‐14 Dec‐14
(US$/ton)
0
200
400
600
800
1,000
1,200Feb‐06
Mar‐07
Apr‐08
May‐09
Jun‐10
Aug‐11
Sep‐12
Oct‐13
Nov‐14
(US$/ton)
Source: Bloomberg, India Infoline Research Source: PPAC, India Infoline Research
Iron ore prices have declined 49% YTD 2014 … and coking coal prices by 25% YTD 2014
0
20
40
60
80
100
120
140
160
180
Jan‐13 May‐13 Oct‐13 Feb‐14 Jul‐14 Dec‐14
(US$/ton)
100
110
120
130
140
150
160
Jan‐14 Apr‐14 Jun‐14 Sep‐14 Dec‐14
(US$/ton)
Source: Bloomberg, India Infoline Research Source: Bloomberg, India Infoline Research
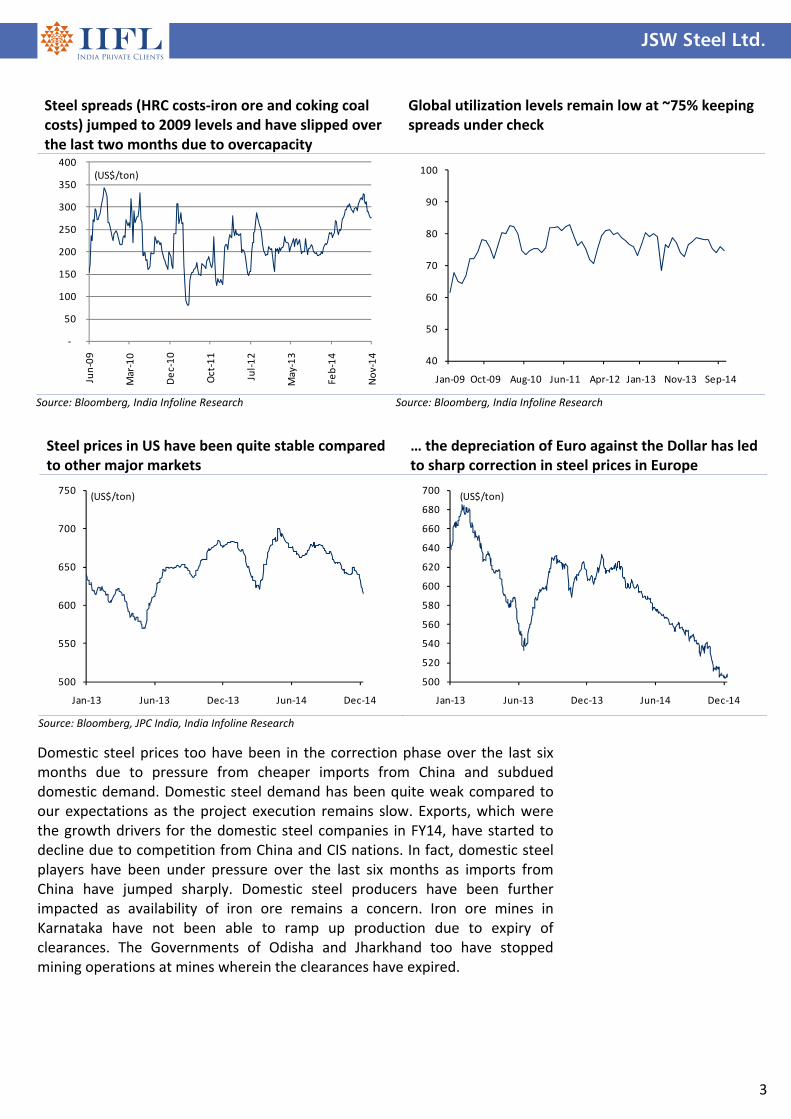
Global steel prices slide due to pressure from imports Globally steel prices have been sliding downwards as raw material prices remained weak and lower Chinese consumption. Chinese export HRC prices have declined 14% yoy YTD 2014 against a decline of 49% for iron ore and 25% for coking coal. Steel spreads which expanded sharply in Q1 FY14 have been under pressure due to excess capacity in the system and slowing demand growth in China. Globally average utilization level has stayed low at 76.8% YTD 2014 and has been in the downward slope over the last few months. Steel prices in US and Europe had managed to hold ground in the 6M 2014; however, with pressure from cheaper imports from China and CIS countries, prices have started to slide over the last three months. Exports from China in the first 11 months of 2014 jumped 46.8% yoy to 84mn tons as demand growth in the region remained low. China's apparent steel consumption fell 1.4% yoy to 619.61mn tons in the first 10M 2014, as demand from housing and infrastructure sectors remained weak.
JSW Steel Ltd.
3
Steel spreads (HRC costs‐iron ore and coking coal costs) jumped to 2009 levels and have slipped over the last two months due to overcapacity
Global utilization levels remain low at ~75% keeping spreads under check
‐
50
100
150
200
250
300
350
400
Jun‐09
Mar‐10
Dec‐10
Oct‐11
Jul‐12
May‐13
Feb‐14
Nov‐14
(US$/ton)
40
50
60
70
80
90
100
Jan‐09 Oct‐09 Aug‐10 Jun‐11 Apr‐12 Jan‐13 Nov‐13 Sep‐14
Source: Bloomberg, India Infoline Research Source: Bloomberg, India Infoline Research
Steel prices in US have been quite stable compared to other major markets
… the depreciation of Euro against the Dollar has led to sharp correction in steel prices in Europe
500
550
600
650
700
750
Jan‐13 Jun‐13 Dec‐13 Jun‐14 Dec‐14
(US$/ton)
500
520
540
560
580
600
620
640
660
680
700
Jan‐13 Jun‐13 Dec‐13 Jun‐14 Dec‐14
(US$/ton)
Source: Bloomberg, JPC India, India Infoline Research
Domestic steel prices too have been in the correction phase over the last six months due to pressure from cheaper imports from China and subdued domestic demand. Domestic steel demand has been quite weak compared to our expectations as the project execution remains slow. Exports, which were the growth drivers for the domestic steel companies in FY14, have started to decline due to competition from China and CIS nations. In fact, domestic steel players have been under pressure over the last six months as imports from China have jumped sharply. Domestic steel producers have been further impacted as availability of iron ore remains a concern. Iron ore mines in Karnataka have not been able to ramp up production due to expiry of clearances. The Governments of Odisha and Jharkhand too have stopped mining operations at mines wherein the clearances have expired.
JSW Steel Ltd.
4
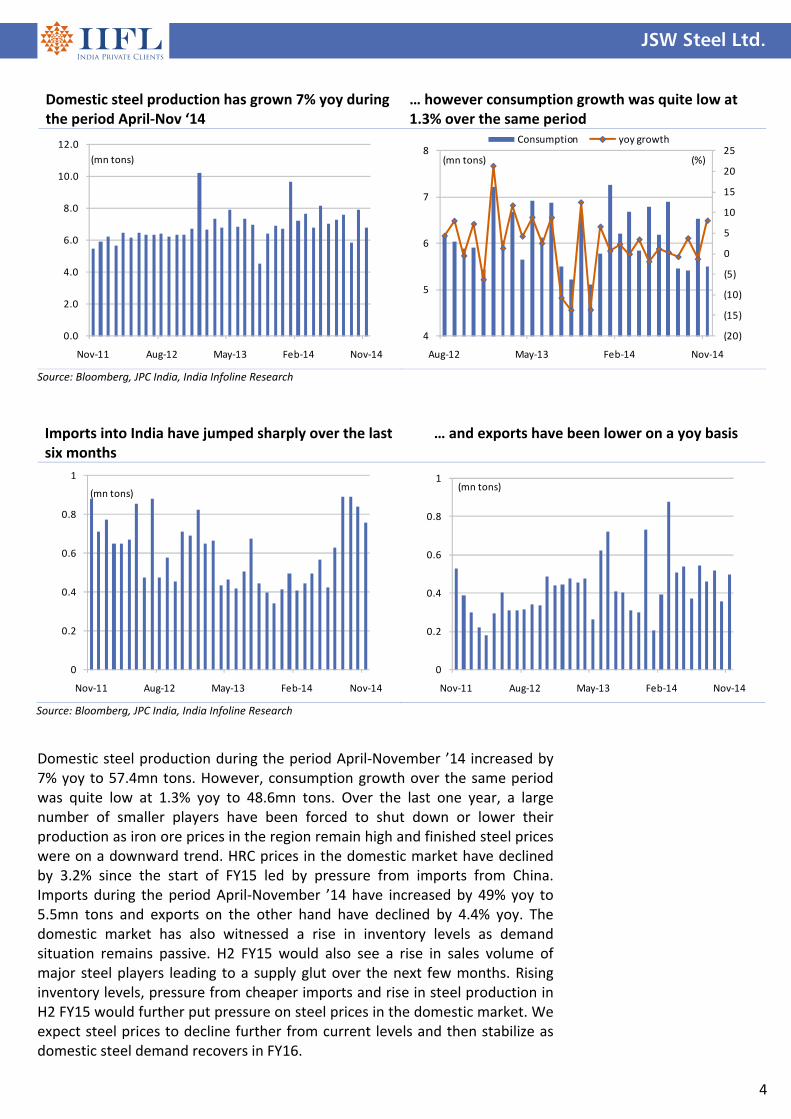
Imports into India have jumped sharply over the last six months
… and exports have been lower on a yoy basis
0
0.2
0.4
0.6
0.8
1
Nov‐11 Aug‐12 May‐13 Feb‐14 Nov‐14
(mn tons)
0
0.2
0.4
0.6
0.8
1
Nov‐11 Aug‐12 May‐13 Feb‐14 Nov‐14
(mn tons)
Source: Bloomberg, JPC India, India Infoline Research
Domestic steel production has grown 7% yoy during the period April‐Nov ‘14
… however consumption growth was quite low at 1.3% over the same period
0.0
2.0
4.0
6.0
8.0
10.0
12.0
Nov‐11 Aug‐12 May‐13 Feb‐14 Nov‐14
(mn tons)
(20)
(15)
(10)
(5)
0
5
10
15
20
25
4
5
6
7
8
Aug‐12 May‐13 Feb‐14 Nov‐14
(%)(mn tons)
Consumption yoy growth
Source: Bloomberg, JPC India, India Infoline Research
Domestic steel production during the period April‐November ’14 increased by 7% yoy to 57.4mn tons. However, consumption growth over the same period was quite low at 1.3% yoy to 48.6mn tons. Over the last one year, a large number of smaller players have been forced to shut down or lower their production as iron ore prices in the region remain high and finished steel prices were on a downward trend. HRC prices in the domestic market have declined by 3.2% since the start of FY15 led by pressure from imports from China. Imports during the period April‐November ’14 have increased by 49% yoy to 5.5mn tons and exports on the other hand have declined by 4.4% yoy. The domestic market has also witnessed a rise in inventory levels as demand situation remains passive. H2 FY15 would also see a rise in sales volume of major steel players leading to a supply glut over the next few months. Rising inventory levels, pressure from cheaper imports and rise in steel production in H2 FY15 would further put pressure on steel prices in the domestic market. We expect steel prices to decline further from current levels and then stabilize as domestic steel demand recovers in FY16.

JSW Steel Ltd.
5
Iron ore prices have declined 49% YTD 2014 … however, domestic NMDC iron ore fine prices have stayed higher yoy
0
20
40
60
80
100
120
140
160
180
Jan‐13 May‐13 Oct‐13 Feb‐14 Jul‐14 Dec‐14
(US$/ton)
2,000
2,200
2,400
2,600
2,800
3,000
3,200
3,400
Oct‐12 Feb‐13 Jun‐13 Oct‐13 Mar‐14 Jul‐14 Nov‐14
(Rs/ton)
Source: Bloomberg, JPC India, India Infoline Research
Imported iron ore more cost effective than NMDC ore for coastal plants Domestic iron ore prices have stayed high over the last one year even though global iron ore prices have corrected sharply. During 2014, global iron ore prices have fallen by 49% to US$68/ton, its weakest since 2009 against a rise of 9% for NMDC iron ore fines (Ex‐mine). If we include the increase in royalty rates during the year, ex‐mine NMDC iron ore fine prices have increased by 13.9% during the same period. During 2014, domestic iron ore prices have been strong due to the reduced availability on account of regulatory restrictions on mining. Iron ore output in Odisha and Jharkhand has been hampered after the State Government asked all mines to shut down if their clearances had expired. Mines in Goa that were operating under deemed extension or had their clearances expired were cancelled by the apex court. Output from Karnataka has not ramped up as few important mines were closed due to expiry of forest clearances.
The Supreme Court in May ‘14 ordered temporary closure of around 26 mainstream mines in Odisha due to non‐renewal of leases. These mines were under the category of 'deemed second or subsequent renewal'. However, the government allowed eight mines of TATA steel, Odisha Mining Corporation and SAIL to operate through an express order, stipulating certain conditions including furnishing of environment and forest clearances within three months, which was extended to 15th November 2014. The closures stemmed from a July 18 notification of the Union ministry of mines, to limit deemed extension of mining leases without execution of renewal lease deeds. The amendment provides two years for execution of the renewal lease deed after expiry of the lease, for the first renewal. The same window is not available for second and subsequent renewals. The court has, however, directed the state government to renew the lease license and issue required clearances within six months. Post the ban, ore production in Odisha would drop to 30‐35mn tons from 72mn tons in FY14.
JSW Steel Ltd.
6
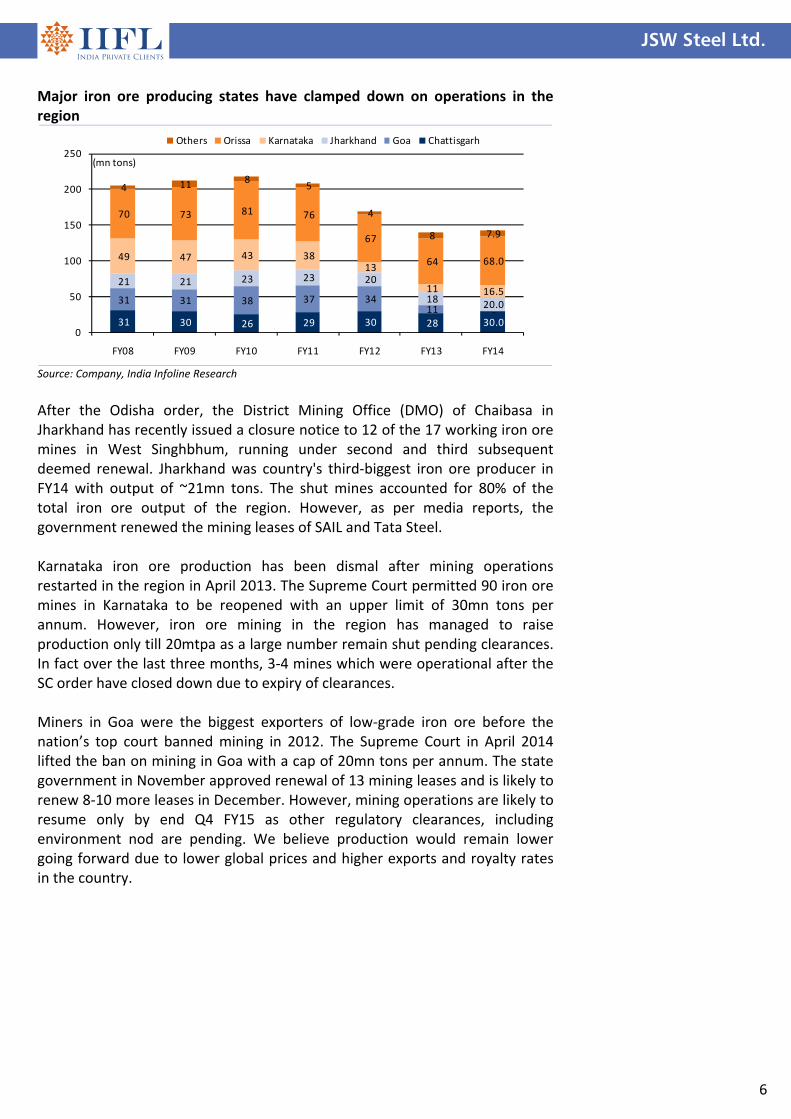
Major iron ore producing states have clamped down on operations in the region
31 30 26 29 30 28 30.0
31 31 38 37 34 11 ‐
21 21 23 23 20
18 20.0
49 47 43 38 13
11 16.5
70 73 81 76
67
64 68.0
4 11 8 5
4
8 7.9
0
50
100
150
200
250
FY08 FY09 FY10 FY11 FY12 FY13 FY14
(mn tons)
Others Orissa Karnataka Jharkhand Goa Chattisgarh
Source: Company, India Infoline Research
After the Odisha order, the District Mining Office (DMO) of Chaibasa in Jharkhand has recently issued a closure notice to 12 of the 17 working iron ore mines in West Singhbhum, running under second and third subsequent deemed renewal. Jharkhand was country's third‐biggest iron ore producer in FY14 with output of ~21mn tons. The shut mines accounted for 80% of the total iron ore output of the region. However, as per media reports, the government renewed the mining leases of SAIL and Tata Steel. Karnataka iron ore production has been dismal after mining operations restarted in the region in April 2013. The Supreme Court permitted 90 iron ore mines in Karnataka to be reopened with an upper limit of 30mn tons per annum. However, iron ore mining in the region has managed to raise production only till 20mtpa as a large number remain shut pending clearances. In fact over the last three months, 3‐4 mines which were operational after the SC order have closed down due to expiry of clearances. Miners in Goa were the biggest exporters of low‐grade iron ore before the nation’s top court banned mining in 2012. The Supreme Court in April 2014 lifted the ban on mining in Goa with a cap of 20mn tons per annum. The state government in November approved renewal of 13 mining leases and is likely to renew 8‐10 more leases in December. However, mining operations are likely to resume only by end Q4 FY15 as other regulatory clearances, including environment nod are pending. We believe production would remain lower going forward due to lower global prices and higher exports and royalty rates in the country.

JSW Steel Ltd.
7
Landed cost of NMDC ore from Bailadila (Rs/ton) Lumps Fines
NMDC base price ‐ December 14 4,300 3,060
Royalty @ 15% 645 459
Other taxes 5,044 3,589
Rail Freight to Vizag port 1,000 1,000
Port charges 125 125
Freight cost from Vizag to Hazira 700 700
Landed cost at Western ports 6,869 5,414
Landed cost of imported iron ore at Western ports Lumps Fines
CFR India (US$/ton) 75 69
Import Duty @ 2.5% 1.9 1.7
Rupee Estimate (US$/ton) 62 62
Landed cost @ Indian Ports (Rs/ton) 4,766 4,385 Source: Company, India Infoline Research
Source: Company, India Infoline Research
Mine closures due to the above reasons have led to record shortages of iron ore and will turn India into a net importer of the material in FY15. In the first seven months of FY15, India's iron ore imports rose to a record 6.76mn tons. The industry believes Indian steel makers are expected to buy ~11‐13mn tons of iron ore from overseas in FY15, almost triple the quantity imported in FY14. The rise in imports is also due to price advantage port‐based plants have over NMDC ore. We have analyzed landed cost of iron ore for port based plants for companies like JSW Steel. We believe that companies near the ports would find it more economical to consume imported iron ore over ore from NMDC. The sharp fall in global iron ore prices has increased the gap between imported and domestic iron ore prices.
Auction of ‘C’ Category mines to reduce overhang Supreme Court in 2013 had classified iron ore mines in Karnataka under three categories and the ones where large‐scale violation of mining rules had taken place were placed in the ‘C’ category. The Court had ordered cancellation of leases for 51 Category ‘C’ mines and asked the State Government to re‐allot through an open and transparent process. The Karnataka Government plans to auction these mines for end‐users only (pig iron, sponge iron and steel plant). The State Government has submitted a proposal to the Supreme Court, through the CEC, to auction 15 ‘C’ category mines. In the initial phase the Government would auction six mines between December ’14 and January ’15 after an approval from the Supreme Court. The remaining nine mines would be auctioned during April‐May 2015. Auctioning of the coal mines would also setup base for the auction of other natural resources and would also quicken the process. We believe, the auction of mines is likely to benefit ‘end‐users’ in the state like JSW Steel & Kalyani Steel, which do not have captive iron ore mines and depend on e‐auction of iron ore for their raw material requirements. As new mining leases are unlikely to be given out in the state in the near future, auction of mines could give steel mills a big opportunity to acquire the natural resource. As per JSW management, out of 51 Iron ore mines, the company has examined 16 mines and doesn’t find the rest to economically viable. We expect the company to bag a major share of auctioned mines during the year, providing it raw material security.

JSW Steel Ltd.
8
Expansion at Vijaynagar to be operational after environmental clearance
Share of long products of total capacity to rise over the next two years
14.1 14.1
15.8 15.8
17.8
1.7
2
0
2
4
6
8
10
12
14
16
18
20
FY14 Ispat Expansion
FY15 Vijaynagar FY16
(mtpa)
0
5
10
15
20
25
30
35
40
FY10 FY11 FY12 FY13 FY14 FY15E FY16E FY17E
(%)
Source: Company, India Infoline Research Source: Company, India Infoline Research
Expansion projects at lower costs JSW Steel, over the last three years, has managed to expand its steel making capacities from 7.8mtpa in FY11 to 14.1mtpa via acquisitions and brownfield projects. The company further acquired Welspun Maxsteel in FY15 which has a 0.9mtpa DRI capacity. After successfully turning around operations in Ispat, the company plans to enhance its steel making capacity initially to 5mtpa from the current 3.3mtpa with an investment of Rs33bn. The cost of expansion at Ispat is quite low at US$325/ton against a cost of US$1,100‐1,200/ton for a Greenfield steel plant. The Dolvi expansion is predominantly long products, to reduce the share of flat products of overall portfolio. The brownfield expansion at Dolvi includes modification of blast furnace, debottlenecking of SMS & HSM to enhance the capacity, new sinter plant 2.5mtpa, new billet caster of 1.5mtpa and bar mill of 1.4mtpa. The company expects the expansion to be completed by September ’15. The expansion will increase JSW Steel’s steelmaking capacity to 16mtpa.
The company has also planned a debottlenecking exercise at Vijaynagar with a capex of Rs7.2bn. This exercise would increase the hot metal capacity from blast furnace I from 0.9mtpa to 1.7mtpa. JSW is also setting up a 1.2mtpa Steel Making Shop (SMS) at Vijaynagar, raising the steel making capacity by 2mtpa. JSW would source 1.2mtpa of DRI through a sourcing arrangement with the promoter entity and would convert that into finished steel. The two exercises would increase the overall steelmaking capacity to 18mtpa by end‐FY16. This expansion is subject to statutory clearances and would be a low cost expansion. JSW Steel management has outlined an ambitious project to double its steel making capacity at Vijaynagar to 20mtpa by 2022 and be the single site largest steel unit in world. In its first step to achieve the above, JSW plans to setup world’s largest blast furnace with a size of 5,500 cu.m. This would result in a capacity addition of ~5mtpa and will require an investment of Rs25bn. We believe in the near term the company would focus on brownfield expansions which can be achieved at lower costs.
JSW Steel Ltd.
9
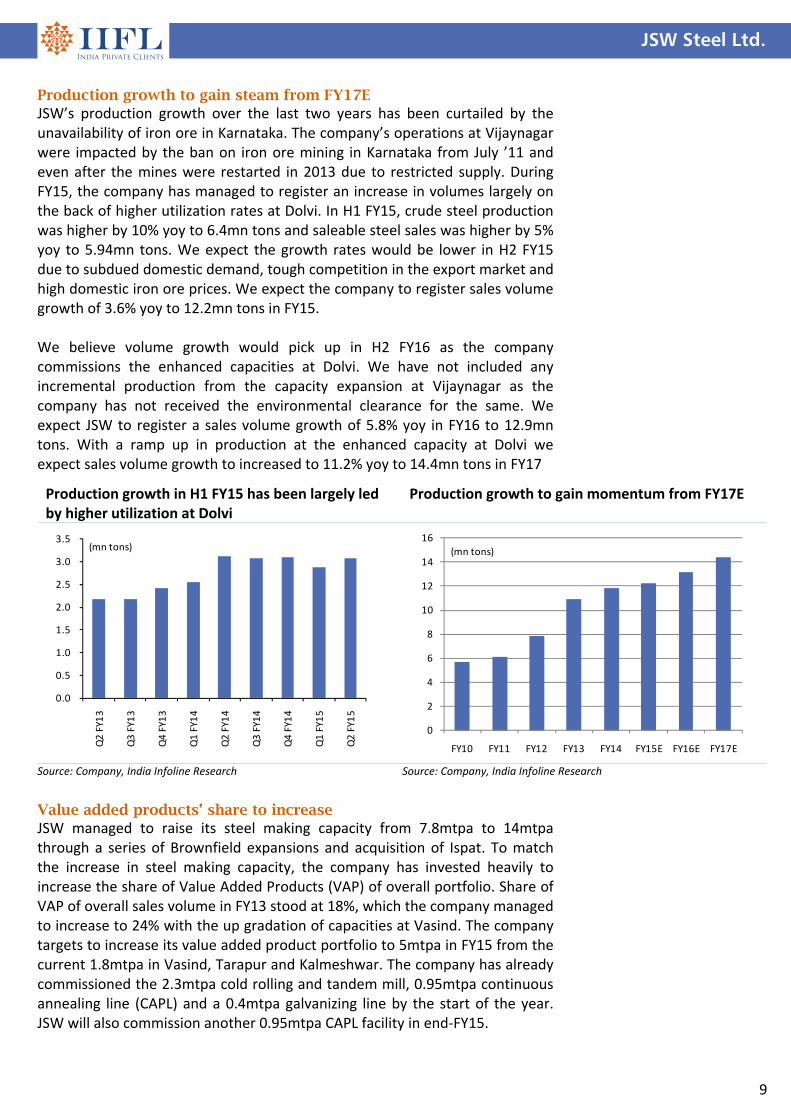
Production growth in H1 FY15 has been largely led by higher utilization at Dolvi
Production growth to gain momentum from FY17E
0.0
0.5
1.0
1.5
2.0
2.5
3.0
3.5
Q2 FY13
Q3 FY13
Q4 FY13
Q1 FY14
Q2 FY14
Q3 FY14
Q4 FY14
Q1 FY15
Q2 FY15
(mn tons)
0
2
4
6
8
10
12
14
16
FY10 FY11 FY12 FY13 FY14 FY15E FY16E FY17E
(mn tons)
Source: Company, India Infoline Research Source: Company, India Infoline Research
Production growth to gain steam from FY17E JSW’s production growth over the last two years has been curtailed by the unavailability of iron ore in Karnataka. The company’s operations at Vijaynagar were impacted by the ban on iron ore mining in Karnataka from July ’11 and even after the mines were restarted in 2013 due to restricted supply. During FY15, the company has managed to register an increase in volumes largely on the back of higher utilization rates at Dolvi. In H1 FY15, crude steel production was higher by 10% yoy to 6.4mn tons and saleable steel sales was higher by 5% yoy to 5.94mn tons. We expect the growth rates would be lower in H2 FY15 due to subdued domestic demand, tough competition in the export market and high domestic iron ore prices. We expect the company to register sales volume growth of 3.6% yoy to 12.2mn tons in FY15. We believe volume growth would pick up in H2 FY16 as the company commissions the enhanced capacities at Dolvi. We have not included any incremental production from the capacity expansion at Vijaynagar as the company has not received the environmental clearance for the same. We expect JSW to register a sales volume growth of 5.8% yoy in FY16 to 12.9mn tons. With a ramp up in production at the enhanced capacity at Dolvi we expect sales volume growth to increased to 11.2% yoy to 14.4mn tons in FY17
Value added products’ share to increase JSW managed to raise its steel making capacity from 7.8mtpa to 14mtpa through a series of Brownfield expansions and acquisition of Ispat. To match the increase in steel making capacity, the company has invested heavily to increase the share of Value Added Products (VAP) of overall portfolio. Share of VAP of overall sales volume in FY13 stood at 18%, which the company managed to increase to 24% with the up gradation of capacities at Vasind. The company targets to increase its value added product portfolio to 5mtpa in FY15 from the current 1.8mtpa in Vasind, Tarapur and Kalmeshwar. The company has already commissioned the 2.3mtpa cold rolling and tandem mill, 0.95mtpa continuous annealing line (CAPL) and a 0.4mtpa galvanizing line by the start of the year. JSW will also commission another 0.95mtpa CAPL facility in end‐FY15.
JSW Steel Ltd.
10
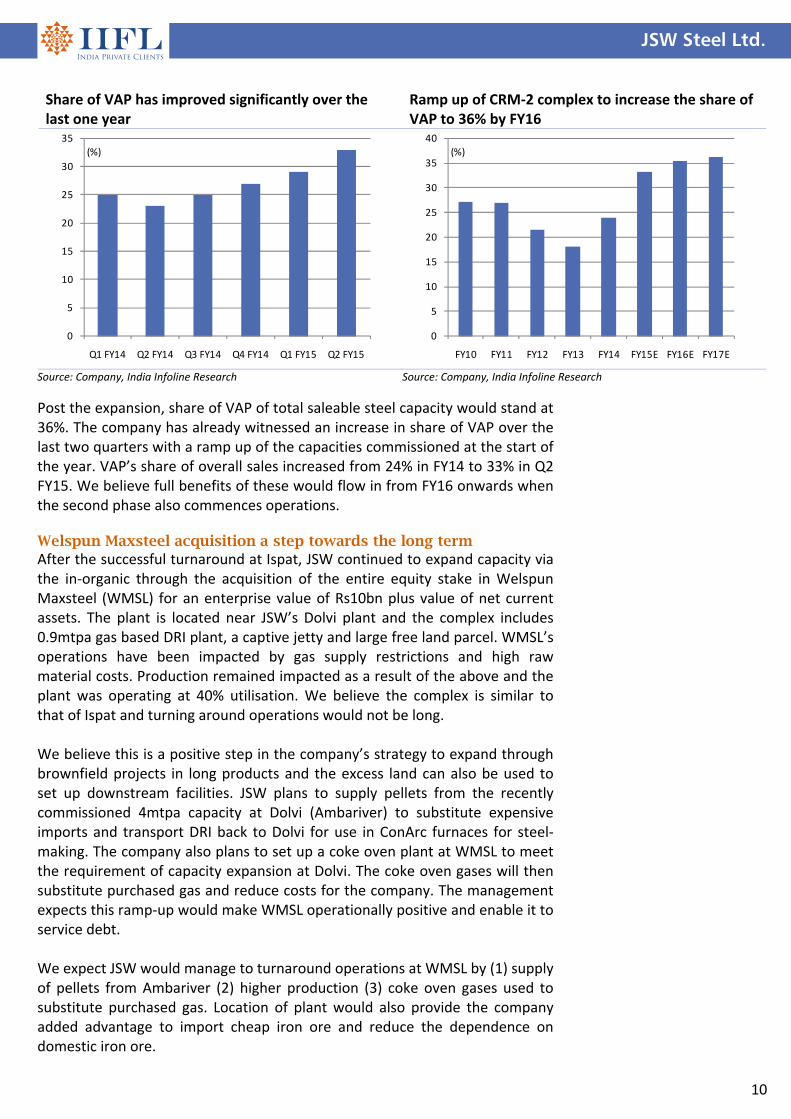
Share of VAP has improved significantly over the last one year
Ramp up of CRM‐2 complex to increase the share of VAP to 36% by FY16
0
5
10
15
20
25
30
35
Q1 FY14 Q2 FY14 Q3 FY14 Q4 FY14 Q1 FY15 Q2 FY15
(%)
0
5
10
15
20
25
30
35
40
FY10 FY11 FY12 FY13 FY14 FY15E FY16E FY17E
(%)
Source: Company, India Infoline Research Source: Company, India Infoline Research
Post the expansion, share of VAP of total saleable steel capacity would stand at 36%. The company has already witnessed an increase in share of VAP over the last two quarters with a ramp up of the capacities commissioned at the start of the year. VAP’s share of overall sales increased from 24% in FY14 to 33% in Q2 FY15. We believe full benefits of these would flow in from FY16 onwards when the second phase also commences operations. Welspun Maxsteel acquisition a step towards the long term After the successful turnaround at Ispat, JSW continued to expand capacity via the in‐organic through the acquisition of the entire equity stake in Welspun Maxsteel (WMSL) for an enterprise value of Rs10bn plus value of net current assets. The plant is located near JSW’s Dolvi plant and the complex includes 0.9mtpa gas based DRI plant, a captive jetty and large free land parcel. WMSL’s operations have been impacted by gas supply restrictions and high raw material costs. Production remained impacted as a result of the above and the plant was operating at 40% utilisation. We believe the complex is similar to that of Ispat and turning around operations would not be long. We believe this is a positive step in the company’s strategy to expand through brownfield projects in long products and the excess land can also be used to set up downstream facilities. JSW plans to supply pellets from the recently commissioned 4mtpa capacity at Dolvi (Ambariver) to substitute expensive imports and transport DRI back to Dolvi for use in ConArc furnaces for steel‐making. The company also plans to set up a coke oven plant at WMSL to meet the requirement of capacity expansion at Dolvi. The coke oven gases will then substitute purchased gas and reduce costs for the company. The management expects this ramp‐up would make WMSL operationally positive and enable it to service debt. We expect JSW would manage to turnaround operations at WMSL by (1) supply of pellets from Ambariver (2) higher production (3) coke oven gases used to substitute purchased gas. Location of plant would also provide the company added advantage to import cheap iron ore and reduce the dependence on domestic iron ore.

JSW Steel Ltd.
11
Iron ore scenario to improve; worst is behind Over the last three years, JSW Steel amongst the large steel manufacturers has been impacted the most due to the various clampdowns by the Central and the State governments on iron ore mining in the country. The mining ban in Karnataka and restricted output post the resumption has led to higher costs for the company. We believe that the worst is behind for the company in case of availability of iron ore and the costs involved in it. We estimate that the company’s iron ore availability and cost would improve due to higher output from Karnataka mines, lower imported costs and auctioning of ‘C’ grade mines in Karnataka. Improving product mix coupled with ramp up of backward integration capacities to offset the impact of lower steel prices JSW has managed to increase its EBIDTA/ton since the start of FY14 led by higher exports, superior product mix, cost reduction initiatives at Dolvi and lower coking coal prices. We believe the benefits of above except higher exports would continue over the next two years. The commissioning the VAP capacities over the last one year would reduce the impact of a decline in steel prices in the country. Share of VAP products at the standalone entity is expected to jump with a ramp up in production from the new CRM‐II complex. The CRM‐2 complex has capacities like 2.3mtpa PLTCM, 0.95mtpa CAL‐1 and 0.4mtpa CGL. The capacities were commissioned in a phased manner which started with PLTCM in October ‘13, CGL in March ‘14 and CAL–1 in April ’14. Phase‐2 of the CRM‐2 plant consisting of 0.95mtpa CAL‐2 is targeted to be commissioned during H1 FY16. The impact of a decline in steel prices would be offset by an increase of VAP products. We expect blended realisations to increase by 2% yoy in FY15 and remain flat in FY16 against a decline of 2.5% yoy in FY15 and 3% yoy in FY16 for domestic HRC steel prices. Iron ore prices which have stayed higher for the company despite a sharp correction in global iron ore prices are expected to decline from FY16. The decline in prices would be largely due to easing of iron ore availability in Karnataka, increase in share of cheap iron ore imports and price cuts to be announced by NMDC. We also believe auctioning of ‘C’ grade mines in Karnataka would further reduce the costs for the company. Coking coal prices too are expected to remain low in the near term due to the excess capacity and subdued demand from China. JSW has managed to increase its margins at its Dolvi units on the back of increase in consumption of internal pellets, reduced power costs, reducing freight costs and VAT benefits. We believe that further improvement would be witnessed from H2 FY15 as the backward integration steps yield results. JSW would witness cost improvement with the commissioning of the 4mtpa pellet plant, 1mtpa coke oven batteries and 55MW blast furnace gas based power plant.
JSW Steel Ltd.
12
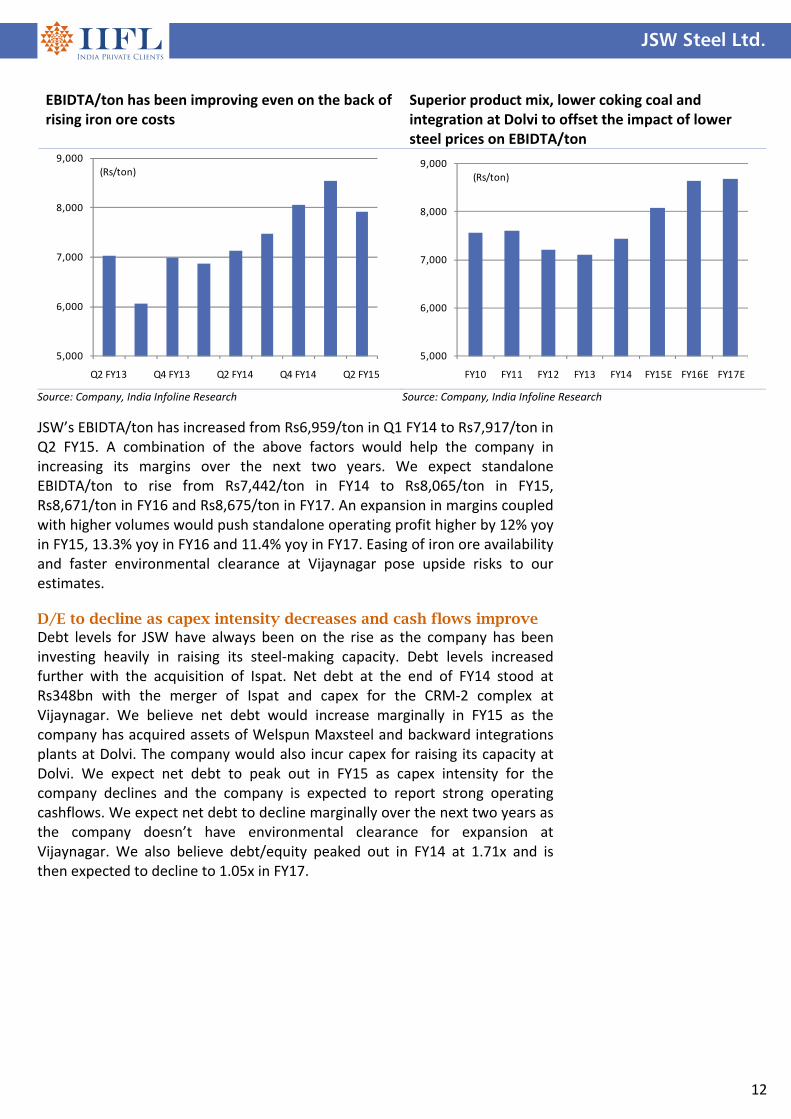
EBIDTA/ton has been improving even on the back of rising iron ore costs
Superior product mix, lower coking coal and integration at Dolvi to offset the impact of lower steel prices on EBIDTA/ton
5,000
6,000
7,000
8,000
9,000
Q2 FY13 Q4 FY13 Q2 FY14 Q4 FY14 Q2 FY15
(Rs/ton)
5,000
6,000
7,000
8,000
9,000
FY10 FY11 FY12 FY13 FY14 FY15E FY16E FY17E
(Rs/ton)
Source: Company, India Infoline Research Source: Company, India Infoline Research
JSW’s EBIDTA/ton has increased from Rs6,959/ton in Q1 FY14 to Rs7,917/ton in Q2 FY15. A combination of the above factors would help the company in increasing its margins over the next two years. We expect standalone EBIDTA/ton to rise from Rs7,442/ton in FY14 to Rs8,065/ton in FY15, Rs8,671/ton in FY16 and Rs8,675/ton in FY17. An expansion in margins coupled with higher volumes would push standalone operating profit higher by 12% yoy in FY15, 13.3% yoy in FY16 and 11.4% yoy in FY17. Easing of iron ore availability and faster environmental clearance at Vijaynagar pose upside risks to our estimates. D/E to decline as capex intensity decreases and cash flows improve Debt levels for JSW have always been on the rise as the company has been investing heavily in raising its steel‐making capacity. Debt levels increased further with the acquisition of Ispat. Net debt at the end of FY14 stood at Rs348bn with the merger of Ispat and capex for the CRM‐2 complex at Vijaynagar. We believe net debt would increase marginally in FY15 as the company has acquired assets of Welspun Maxsteel and backward integrations plants at Dolvi. The company would also incur capex for raising its capacity at Dolvi. We expect net debt to peak out in FY15 as capex intensity for the company declines and the company is expected to report strong operating cashflows. We expect net debt to decline marginally over the next two years as the company doesn’t have environmental clearance for expansion at Vijaynagar. We also believe debt/equity peaked out in FY14 at 1.71x and is then expected to decline to 1.05x in FY17.

JSW Steel Ltd.
13
Revenue growth to remain in single digits in FY15E and FY16E
Margin expansion coupled with volume growth to push operating profit higher by 12.9% CAGR over FY14‐17E
0
5
10
15
20
25
30
35
40
45
0
100
200
300
400
500
600
700
FY10 FY11 FY12 FY13 FY14 FY15E FY16E FY17E
(%)(Rs bn)
Revenue yoy Chng
0
5
10
15
20
25
0
20
40
60
80
100
120
140
FY10 FY11 FY12 FY13 FY14 FY15E FY16E FY17E
(%)(Rs bn)
Operating profit OPM
Source: Company, India Infoline Research Source: Company, India Infoline Research
PAT to double over FY14‐17E D/E peaked out in FY14
(30)
(20)
(10)
0
10
20
30
40
50
60
70
0
5
10
15
20
25
30
35
40
45
FY10 FY11 FY12 FY13 FY14 FY15E FY16E FY17E
(%)
(Rs bn)
PAT yoy growth
0.0
0.2
0.4
0.6
0.8
1.0
1.2
1.4
1.6
1.8
2.0
‐
50
100
150
200
250
300
350
400
FY10 FY11 FY12 FY13 FY14 FY15E FY16E FY17E
(x)(Rs bn)
Net Debt Net Debt/Equity
Source: Company, India Infoline Research Source: Company, India Infoline Research
Financials: PAT to double over FY14-17E Revenue growth for JSW Steel would remain in single digits in FY15 and FY16 as we expect (1) steel prices to remain under pressure (2) steel volume growth curtailed by tight iron ore market and subdued domestic demand (3) lower contribution from subsidiaries like Chile and US. We estimate topline to increase by 6.4% in FY16 and then to gain momentum to 11.7% led by ramp up of production from the enhanced capacity at Dolvi. Operating profit growth is expected to remain strong led by higher volumes and margin expansion. Operating profit in FY15 is expected to increase by 16.5% yoy to Rs106.8bn and then to increase further by 13.5% yoy to Rs121bn in FY16 and Rs132bn (+8.9% yoy) in FY17.

JSW Steel Ltd.
14
Valuations attractive; Upgrade to BUY JSW Steel has corrected sharply over the last three months due to rising concerns over dumping of Chinese steel, subdued domestic demand and decreasing domestic iron ore production. We believe that the correction in the stock is overdone and we expect the scenario to normalize in FY16. The sharp correction in global iron ore prices has helped the company to switch to imported iron ore over domestic purchase. Landed cost of imported iron ore at JSW’s Dolvi and Salem plant is quite lower than the landed cost of iron ore from NMDC. The depreciation of the rupee would reduce the pressure of imports from China and Ukraine. We believe domestic demand would pick up from FY16 as we expect the revival in the domestic economy to gain steam, in turn leading to an increase in infrastructure spending. We expect JSW’s bottomline to double over FY14‐17 on account of (1) increased output from Dolvi (2) substitution of expensive domestic ore with cheaper imports (3) cost rationalization exercise at Dolvi (4) superior product mix. Valuations at 4.9x FY16E EV/EBIDTA appear cheap compared to the global steel players trading at 5.7x. We upgrade our recommendation from Accumulate to BUY with a revised price target of Rs1,332. Trading lower than its average 1yr forward EV/EBIDTA
0
1
2
3
4
5
6
7
8
9
Dec‐09
Jun‐10
Dec‐10
Jun‐11
Dec‐11
Jun‐12
Dec‐12
Jun‐13
Dec‐13
Jun‐14
Dec‐14
EV/EBIDTA (x) Average EV/EBIDTA (x)
Source: Company, India Infoline Research

JSW Steel Ltd.
15
Financials Income statement Y/e 31 Mar (Rs m) FY14 FY15E FY16E FY17E
Revenue 512,196 546,549 581,726 649,738
Operating profit 91,655 106,810 121,208 132,005
Depreciation (31,826) (34,735) (36,173) (35,807)
Interest expense (30,479) (33,252) (34,616) (34,173)
Other income 858 901 946 993
Profit before tax 30,208 39,724 51,365 63,018
Taxes (9,201) (12,712) (16,437) (20,166)
Minorities and other 640 ‐ ‐ ‐
Adj. profit 21,647 27,012 34,928 42,852
Exceptional items (17,128) ‐ ‐ ‐
Net profit 4,519 27,012 34,928 42,852
Balance sheet Y/e 31 Mar (Rs m) FY14 FY15E FY16E FY17E
Equity capital 2,417 2,417 2,417 2,417
Preference capital 7,644 7,644 7,644 7,644
Reserves 209,322 232,879 264,351 303,749
Net worth 219,383 242,940 274,413 313,810
Minority interest 1,670 1,670 1,670 1,670
Debt 347,621 362,621 347,621 327,621
Deferred tax liab (net) 21,234 21,234 21,234 21,234
Total liabilities 589,909 628,466 644,938 664,336
Fixed assets 548,838 585,106 598,933 608,126
Intangible assets 15,619 15,619 15,619 15,619
Investments 6,627 6,627 6,627 6,627
Net working capital 12,195 12,629 13,066 21,655
Inventories 81,551 87,021 92,622 103,450
Sundry debtors 22,924 24,462 26,036 29,080
Other current assets 94,209 96,093 98,015 109,475
Sundry creditors (126,094) (134,551) (143,211) (159,954)
Other current liabilities (60,397) (60,397) (60,397) (60,397)
Cash 6,630 8,484 10,693 12,308
Total assets 589,909 628,466 644,938 664,336
Cash flow statement Y/e 31 Mar (Rs m) FY14 FY15E FY16E FY17E
Profit before tax 30,208 39,724 51,365 63,018
Depreciation 31,826 34,735 36,173 35,807
Tax paid (9,201) (12,712) (16,437) (20,166)
Working capital ∆ (30,786) (434) (437) (8,589)
Operating cashflow 22,047 61,313 70,664 70,071
Capital expenditure (190,136) (71,003) (50,000) (45,000)
Free cash flow (168,089) (9,690) 20,664 25,071
Equity raised 39,740 ‐ ‐ ‐
Investments 10,872 ‐ ‐ ‐
Debt financing/ disposal
139,015 15,000 (15,000) (20,000)
Dividends paid (3,167) (3,455) (3,455) (3,455)
Other items (28,275) ‐ ‐ ‐
Net ∆ in cash (9,904) 1,855 2,208 1,615
Key ratios Y/e 31 Mar FY14 FY15E FY16E FY17E
Growth matrix (%)
Revenue growth 34.0 6.7 6.4 11.7
Op profit growth 40.9 16.5 13.5 8.9
EBIT growth 40.0 20.3 17.8 13.0
Net profit growth 62.5 24.8 29.3 22.7
Profitability ratios (%)
OPM 17.9 19.5 20.8 20.3
EBIT margin 11.8 13.4 14.8 15.0
Net profit margin 4.2 4.9 6.0 6.6
RoCE 12.0 12.0 13.5 14.8
RoNW 11.2 12.0 13.8 14.9
RoA 3.2 3.4 4.2 4.9
Per share ratios
EPS 89.6 111.7 144.5 177.3
DPS 11.0 12.0 12.0 12.0
Cash EPS 221.2 255.4 294.1 325.4
BVPS 876.0 973.4 1,103.6 1,266.6
Valuation ratios (x)
P/E 11.6 9.3 7.2 5.9
P/CEPS 4.7 4.1 3.5 3.2
P/B 1.2 1.1 0.9 0.8
EV/EBIDTA 6.5 5.7 4.9 4.4
Payout (%)
Dividend payout 14.6 12.8 9.9 8.1
Tax payout 30.5 32.0 32.0 32.0
Liquidity ratios
Debtor days 16 16 16 16
Inventory days 58 58 58 58
Creditor days 90 90 90 90
Du‐pont analysis Y/e 31 Mar (Rs m) FY14 FY15E FY16E FY17E
Tax burden (x) 0.71 0.67 0.67 0.68
Interest burden (x) 0.50 0.54 0.60 0.65
EBIT margin (x) 0.12 0.13 0.15 0.15
Asset turnover (x) 0.76 0.68 0.70 0.75
Financial leverage (x) 3.53 3.58 3.33 3.03
RoE (%) 11.2 12.0 13.8 14.9

‘Best Broker of the Year’ – by Zee Business for contribution to brokingNirmal Jain, Chairman, IIFL, received the award for The Best Broker of the Year (for contribution to broking in India) at India's Best Market Analyst Awards 2014 organised by the Zee Business in Mumbai. The award was presented by the guest of Honour Amit Shah, president of the Bharatiya Janata Party and Piyush Goel, Minister of state with independent charge for power, coal new and renewable energy.
'Best Equity Broker of the Year' – Bloomberg UTV, 2011IIFL was awarded the 'Best Equity Broker of the Year' at the recently held Bloomberg UTV Financial Leadership Award, 2011. The award presented by the Hon'ble Finance Minister of India, Shri Pranab Mukherjee. The Bloomberg UTV Financial Leadership Awards acknowledge the extraordinary contribution of India's financial leaders and visionaries from January 2010 to January 2011.
'Best Broker in India' – Finance Asia, 2011IIFL has been awarded the 'Best Broker in India' by Finance Asia. The award is the result of Finance Asia's annual quest for the best financial services firms across Asia, which culminated in the Country Awards 2011
Other awards
2012BEST BROKING HOUSE WITH
GLOBAL PRESENCE
2009, 2012 & 2013BEST MARKET
ANALYSTBEST BROKERAGE,
INDIAMOST IMPROVED,
INDIABEST BROKER,
INDIA
2009FASTEST GROWING
LARGE BROKING HOUSE
Recommendation parameters for fundamental reports: Buy – Absolute return of over +15%
Accumulate – Absolute return between 0% to +15%
Reduce – Absolute return between 0% to ‐10%
Sell – Absolute return below ‐10% Call Failure ‐ In case of a Buy report, if the stock falls 20% below the recommended price on a closing basis, unless otherwise specified by the analyst; or, in case of a Sell report, if the stock rises 20% above the recommended price on a closing basis, unless otherwise specified by the analyst
India Infoline Group (hereinafter referred as IIFL) is engaged in diversified financial services business including equity broking, DP services, merchant banking, portfolio management services, distribution of Mutual Fund, insurance products and other investment products and also loans and finance business. India Infoline Ltd (“hereinafter referred as IIL”) is a part of the IIFL and is a member of the National Stock Exchange of India Limited (“NSE”) and the BSE Limited (“BSE”). IIL is also a Depository Participant registered with NSDL & CDSL, a SEBI registered merchant banker and a SEBI registered portfolio manager. IIL is a large broking house catering to retail, HNI and institutional clients. It operates through its branches and authorised persons and sub‐brokers spread across the country and the clients are provided online trading through internet and offline trading through branches and Customer Care. Terms & Conditions and Other Disclosures:‐ a) This research report (“Report”) is for the personal information of the authorised recipient(s) and is not for public distribution and should not be
reproduced or redistributed to any other person or in any form. without IIL’s prior permission. The information provided in the Report is from publicly available data, which we believe, are reliable. While reasonable endeavors have been made to present reliable data in the Report so far as it relates to current and historical information, but IIL does not guarantee the accuracy or completeness of the data in the Report. Accordingly, IIL or any of its connected persons including its directors or subsidiaries or associates or employees shall not be in any way responsible for any loss or damage that may arise to any person from any inadvertent error in the information contained, views and opinions expressed in this publication.
b) Past performance should not be taken as an indication or guarantee of future performance, and no representation or warranty, express or implied, is made regarding future performance. Information, opinions and estimates contained in this report reflect a judgment of its original date of publication by IIFL and are subject to change without notice. The price, value of and income from any of the securities or financial instruments mentioned in this report can fall as well as rise. The value of securities and financial instruments is subject to exchange rate fluctuation that may have a positive or adverse effect on the price or income of such securities or financial instruments.
c) The Report also includes analysis and views of our research team. The Report is purely for information purposes and does not construe to be investment recommendation/advice or an offer or solicitation of an offer to buy/sell any securities. The opinions expressed in the Report are our current opinions as of the date of the Report and may be subject to change from time to time without notice. IIL or any persons connected with it do not accept any liability arising from the use of this document.
d) Investors should not solely rely on the information contained in this Report and must make investment decisions based on their own investment objectives, judgment, risk profile and financial position. The recipients of this Report may take professional advice before acting on this information.
e) IIL has other business segments / divisions with independent research teams separated by 'chinese walls' catering to different sets of customers having varying objectives, risk profiles, investment horizon, etc and therefore, may at times have, different and contrary views on stocks, sectors and markets.
f) This report is not directed or intended for distribution to, or use by, any person or entity who is a citizen or resident of or located in any locality, state, country or other jurisdiction, where such distribution, publication, availability or use would be contrary to local law, regulation or which would subject IIL and its affiliates to any registration or licensing requirement within such jurisdiction. The securities described herein may or may not be eligible for sale in all jurisdictions or to certain category of investors. Persons in whose possession this Report may come are required to inform themselves of and to observe such restrictions.
g) As IIL alongwith its associates, are engaged in various financial services business and so might have financial, business or other interests in other entities including the subject company(ies) mentioned in this Report. However, IIL encourages independence in preparation of research report and strives to minimize conflict in preparation of research report. IIL and its associates did not receive any compensation or other benefits from the subject company(ies) mentioned in the Report or from a third party in connection with preparation of the Report. Accordingly, IIL and its associates do not have any material conflict of interest at the time of publication of this Report.
h) As IIL and its associates are engaged in various financial services business, it might have:‐
(a) received any compensation (except in connection with the preparation of this Report) from the subject company in the past twelve months; (b) managed or co‐managed public offering of securities for the subject company in the past twelve months; (c) received any compensation for investment banking or merchant banking or brokerage services from the subject company in the past twelve months; (d) received any compensation for products or services other than investment banking or merchant banking or brokerage services from the subject company in the past twelve months; (e) engaged in market making activity for the subject company.
i) IIL and its associates collectively does not have (in their proprietary position) 1% or more of the equity securities of the subject company mentioned in the report as of the last day of the month preceding the publication of the research report.
j) The Research Analyst engaged in preparation of this Report or his/her relative:‐
(a) do not have financial interests in the subject company(ies) mentioned in this report; (b) do not own 1% or more of the equity securities of the subject company mentioned in the report as of the last day of the month preceding the publication of the research report; (c) does not have any other material conflict of interest at the time of publication of the research report.
k) The Research Analyst engaged in preparation of this Report:‐
(a) has not received any compensation from the subject company in the past twelve months; (b) has not managed or co‐managed public offering of securities for the subject company in the past twelve months; (c) has not received any compensation for investment banking or merchant banking or brokerage services from the subject company in the past twelve months; (d) has not received any compensation for products or services other than investment banking or merchant banking or brokerage services from the subject company in the past twelve months; (e) has not received any compensation or other benefits from the subject company or third party in connection with the research report; (f) has not served as an officer, director or employee of the subject company; (g) is not engaged in market making activity for the subject company.
We submit that no material disciplinary action has been taken on IIL by any regulatory authority impacting Equity Research Analysis.
Published in 2014. © India Infoline Ltd 2014 IIFL, IIFL Centre, Kamala City, Senapati Bapat Marg, Lower Parel (W), Mumbai 400 013. For Research related queries, write to: Amar Ambani, Head of Research at [email protected] For Sales and Account related information, write to customer care: [email protected] or call on 91‐22 4007 1000


![STEEL [Eng] Steel Code Check 14](https://static.fdocument.pub/doc/165x107/577c7e6b1a28abe054a10fdf/steel-eng-steel-code-check-14.jpg)