

J.P. Morgan 研究報告-Nothing but net 2014 global internet
325
www.jpmorganmarkets.com Global Equity Research 09 January 2014 Nothing But Net 2014 Global Internet Investment Guide US Internet Doug Anmuth AC (1-212) 622-6571 [email protected] Bloomberg JPMA ANMUTH <GO> J.P. Morgan Securities LLC Kaizad Gotla, CFA AC (1-212) 622-6436 [email protected] J.P. Morgan Securities LLC Bo Nam (1-212) 622-5032 [email protected] J.P. Morgan Securities LLC Diana R Kluger, CFA (1-212) 622-4539 [email protected] J.P. Morgan Securities LLC China Internet Alex Yao AC (852) 2800 8535 [email protected] J.P. Morgan Securities (Asia Pacific) Limited Korea Internet and Telco Stanley Yang AC (82-2) 758-5712 [email protected] J.P. Morgan Securities (Far East) Ltd, Seoul Branch Japan Games, Internet, Leisure Haruka Mori AC (81-3) 6736-8632 [email protected] JPMorgan Securities Japan Co., Ltd. Europe Media & Internet Nicolas J Dubourg AC (44-20) 7134-5226 [email protected] J.P. Morgan Securities plc CEEMEA Media & Telecoms Alexei Gogolev AC (7-495) 967-1029 [email protected] J.P. Morgan Bank International LLC Latin American Telecommunications / Media / Technology Andre Baggio, CFA AC * (55-11) 4950-3427 [email protected] Banco J.P. Morgan S.A. * Registered/qualified as a research analyst under NYSE/FINRA rules. See page 321 for analyst certification and important disclosures, including non-US analyst disclosures. J.P. Morgan does and seeks to do business with companies covered in its research reports. As a result, investors should be aware that the firm may have a conflict of interest that could affect the objectivity of this report. Investors should consider this report as only a single factor in making their investment decision.
-
Upload
chen-terry -
Category
Internet
-
view
602 -
download
35
Transcript of J.P. Morgan 研究報告-Nothing but net 2014 global internet

www.jpmorganmarkets.com
Global Equity Research09 January 2014
Nothing But Net2014 Global Internet Investment Guide
US Internet
Doug Anmuth AC
(1-212) 622-6571
[email protected] JPMA ANMUTH <GO>J.P. Morgan Securities LLC
Kaizad Gotla, CFA AC
(1-212) [email protected]. Morgan Securities LLC
Bo Nam
(1-212) [email protected]. Morgan Securities LLC
Diana R Kluger, CFA
(1-212) [email protected]. Morgan Securities LLC
China Internet
Alex YaoAC
(852) 2800 [email protected]. Morgan Securities (Asia Pacific) Limited
Korea Internet and Telco
Stanley Yang AC
(82-2) [email protected]. Morgan Securities (Far East) Ltd, Seoul Branch
Japan Games, Internet, Leisure
Haruka MoriAC
(81-3) [email protected] Securities Japan Co., Ltd.
Europe Media & Internet
Nicolas J DubourgAC
(44-20) [email protected]. Morgan Securities plc
CEEMEA Media & Telecoms
Alexei GogolevAC
(7-495) [email protected]. Morgan Bank International LLC
Latin American Telecommunications / Media / Technology
Andre Baggio, CFA AC *
(55-11) [email protected] J.P. Morgan S.A.
* Registered/qualified as a research analyst under NYSE/FINRA rules.See page 321 for analyst certification and important disclosures, including non-US analyst disclosures.J.P. Morgan does and seeks to do business with companies covered in its research reports. As a result, investors should be aware thatthe firm may have a conflict of interest that could affect the objectivity of this report. Investors should consider this report as only a single factor in making their investment decision.
2
Global Equity Research09 January 2014
Doug Anmuth(1-212) [email protected]
January 9, 2014
Dear Investors and Internet Followers,
2013 was a strong year for equity markets overall, and an even better year for Internet stocks. U.S. Internet stocks in our coverage universe appreciated by a market cap-weighted average of 78% vs. the S&P 500 up 30%, while global Internet names covered by J.P. Morgan increased 84% during the year. Broad-based strength was evident across online subscription, advertising, and commerce models given the backdrop of powerful secular trends and an improving macro environment.
We believe those underlying dynamics should continue in 2014, and mobile will become an even bigger driver of Internet models. As we think back through some of the major shifts in the consumer Internet era, including the move from dial-up to broadband and changes in how people consume content, none is more significant than the adoption of mobile devices. comScore data suggests that U.S. mobile usage time initially surpassed that of the desktop in mid-2013, and that directional trend should continue globally going forward. We think 2014 is a year in which the gap tightens between mobile usage and mobile conversions and revenue, turning mobile into a greater tailwind across our global Internet coverage universe.
The Internet sector is extremely dynamic and we believe innovation is stronger than ever driven by the combined viral effects of social and mobile, along with the broad access to computing infrastructure in the cloud as exemplified by Amazon’s AWS. Leading Internet platforms such as Google, Amazon, Facebook, Tencent, and Apple continue to thrive, but we are also seeing powerful ecosystems created by LinkedIn and Twitter, along with other social, commerce, and communications platforms. We are focused on a number of key trends in the U.S. in 2014 including: 1) Mobile conversions and revenue tightening the gap with mobile usage; 2) Native and News Feed advertising becoming the dominant format for mobile ad monetization; 3) Cross-device tracking and attribution becoming critical for marketers and publishers alike; 4) Traditional media measurement tools to help accelerate the shift of traditional media dollars online; 5) Advances in Last Mile eCommerce to drive online penetration in key retail categories; 6) Cloud-based services gaining significant scale; and 7) Continued blurring of the lines among online travel participants. On a global basis, many of the key themes outlined by our Internet team in other geographies relate to mobile and how it is driving gaming, commerce, and advertising.
From an investment perspective, we recognize that most of our companies trade at materially higher levels than they did a year ago, and we remain selective based on asset quality, growth, valuation, and other factors. But we also believe it is still early in the mobile Internet—considerable share gain opportunities remain across our global coverage universe and innovation will continue to drive disruptive technologies.
We hope our global outlook report is helpful in your investment process in 2014 and we look forward to working with you in the year ahead.
Sincerely,
Doug Anmuth (U.S.) Alex Yao (China)
Stanley Yang (Korea) Haruka Mori (Japan)
Nicolas Dubourg (Europe) Alexei Gogolev (Russia) Andre Baggio (Latin America)
3
Global Equity Research09 January 2014
Doug Anmuth(1-212) [email protected]
Table of ContentsGlobal Comp Sheet............................................................................ 6
Global Internet Top Picks................................................................... 8
U.S. Sector Outlook ....................................................................... 12
U.S. Internet Themes for 2014 ......................................................... 12
Revenue and Conversions to Tighten the Gap with Strong Mobile Usage .............................................................................................. 12
Native Ads to Drive Mobile Ad Monetization..................................... 20
Cross-Device Advertising and Attribution Becoming Critical............. 22
Traditional Media Measurement Tools to Drive Traditional Media Dollars Online .................................................................................. 25
Last Mile Drives Further Online/Offline Retail Convergence............. 28
Cloud-Based Services Gaining Scale............................................... 34
Blurring of the Lines in Online Travel ............................................... 37
U.S. Company Outlooks ................................................................ 39
Google ............................................................................................. 39
Amazon.com.................................................................................... 44
Facebook......................................................................................... 49
eBay, Inc.......................................................................................... 54
Priceline.com ................................................................................... 59
Yahoo Inc......................................................................................... 63
Twitter, Inc. ...................................................................................... 65
LinkedIn Corp................................................................................... 70
Netflix Inc......................................................................................... 75
TripAdvisor, Inc. ............................................................................... 80
Expedia, Inc. .................................................................................... 85
Groupon........................................................................................... 90
Pandora Media Inc........................................................................... 95
Yelp Inc.......................................................................................... 101
HomeAway Inc............................................................................... 105
Zynga Inc....................................................................................... 110
Criteo ............................................................................................. 114
OpenTable Inc ............................................................................... 118
Bankrate Inc................................................................................... 122
Trulia Inc. ....................................................................................... 126
Chegg, Inc. .................................................................................... 130
4
Global Equity Research09 January 2014
Doug Anmuth(1-212) [email protected]
QuinStreet, Inc. .............................................................................. 135
ReachLocal.................................................................................... 139
CafePress, Inc. .............................................................................. 143
LatAm Company Outlooks .......................................................... 147
MercadoLibre, Inc. ......................................................................... 147
China Sector Outlook .................................................................. 150
Early movers to approach return stage........................................... 151
Mobile game monetization to drive mobile traffic platforms’ earnings growth in 2014 ............................................................................... 154
Large mobile platforms attempting to shape new eco-system and user behavior......................................................................................... 158
Uncertainty in 2014 video outlook .................................................. 160
Continued growth of online-to-offline business; room for cooperation with big mobile platforms................................................................ 163
Online travel remains highly competitive ........................................ 165
China Company Outlooks ........................................................... 167
Tencent.......................................................................................... 167
Qihoo 360 Technology Co. Ltd....................................................... 171
YY Inc ............................................................................................ 175
Baidu.com...................................................................................... 179
Sina Corp....................................................................................... 183
SouFun Holdings Ltd...................................................................... 187
Phoenix New Media Ltd ................................................................. 191
Vipshop.......................................................................................... 195
Forgame Holdings Ltd.................................................................... 199
Sohu.Com...................................................................................... 203
NetEase......................................................................................... 207
Youku Tudou Inc............................................................................ 211
Ctrip.com International, Ltd ............................................................ 215
Sungy Mobile Limited..................................................................... 219
Dangdang ...................................................................................... 223
Korea Sector Outlook .................................................................. 227
The paradigm shift from PC to mobile to accelerate in 2014 on the world-fast LTE network upgrade .................................................... 228
Mobile game: Highly competitive + short product life cycle Power shift from developers to platforms .................................................. 229
Leading PC game developers to enjoy ‘The survival takes it all’ trend on subdued competition ................................................................. 231
5
Global Equity Research09 January 2014
Doug Anmuth(1-212) [email protected]
Paradigm shift into messaging apps............................................... 233
Naver’s social networking business goes global market................. 236
Korea Company Outlooks ........................................................... 237
Naver ............................................................................................. 237
NCSoft ........................................................................................... 240
Daum............................................................................................. 243
WeMade Entertainment ................................................................. 246
NHN Entertainment........................................................................ 250
Gamevil.......................................................................................... 253
Japan Sector Outlook .................................................................. 257
Smartphones Are Changing the World........................................... 258
E-commerce: Five factors likely to accelerate shift toward e-commerce...................................................................................................... 262
Smartphone-driven growth creating good conditions for online advertising ..................................................................................... 264
Japan Company Outlooks........................................................... 266
Yahoo Japan (4689)....................................................................... 266
ASKUL (2678)................................................................................ 270
Rakuten (4755) .............................................................................. 274
Gurunavi (2440)............................................................................. 278
Kakaku.com (2371)........................................................................ 282
CyberAgent (4751)......................................................................... 286
DeNA (2432).................................................................................. 290
Gree (3632) ................................................................................... 293
Europe Sector Outlook ................................................................ 296
W. European online usage: plenty still to come.............................. 299
Mobile: a major growth driver beginning to make its mark.............. 301
Online Advertising: structural shift to online still gaining speed....... 305
Russia Sector Outlook................................................................. 307
Russian Internet Themes ............................................................... 308
Russia Company Outlooks.......................................................... 313
Mail.ru Group ................................................................................. 313
Yandex........................................................................................... 317
The authors acknowledge the contribution to this report of Pranav Goel of J.P. Morgan India Private Limited and Binbin Ding of J.P. Morgan Securities Asia Pacific Limited.
6
Global Equity Research09 January 2014
Doug Anmuth(1-212) [email protected]
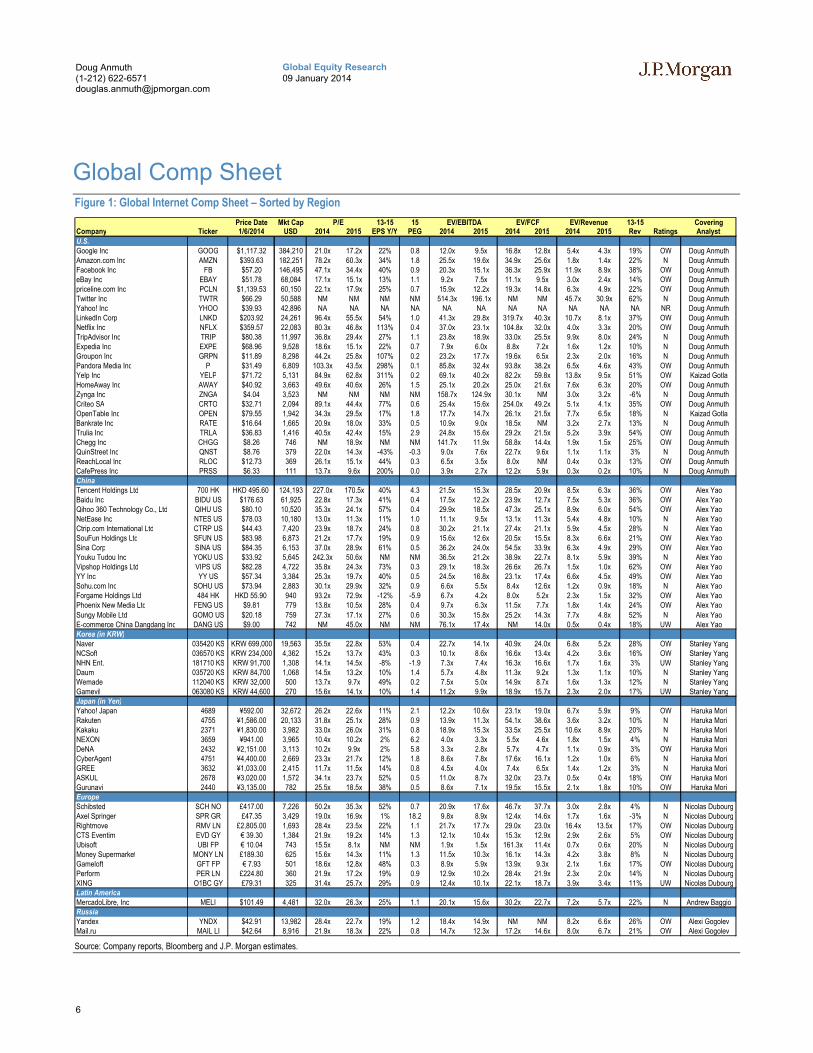
Global Comp SheetFigure 1: Global Internet Comp Sheet – Sorted by Region
Price Date Mkt Cap 13-15 15 13-15 CoveringCompany Ticker 1/6/2014 USD 2014 2015 EPS Y/Y PEG 2014 2015 2014 2015 2014 2015 Rev Ratings Analyst
U.S.Google Inc GOOG $1,117.32 384,210 21.0x 17.2x 22% 0.8 12.0x 9.5x 16.8x 12.8x 5.4x 4.3x 19% OW Doug AnmuthAmazon.com Inc AMZN $393.63 182,251 78.2x 60.3x 34% 1.8 25.5x 19.6x 34.9x 25.6x 1.8x 1.4x 22% N Doug AnmuthFacebook Inc FB $57.20 146,495 47.1x 34.4x 40% 0.9 20.3x 15.1x 36.3x 25.9x 11.9x 8.9x 38% OW Doug AnmutheBay Inc EBAY $51.78 68,084 17.1x 15.1x 13% 1.1 9.2x 7.5x 11.1x 9.5x 3.0x 2.4x 14% OW Doug Anmuthpriceline.com Inc PCLN $1,139.53 60,150 22.1x 17.9x 25% 0.7 15.9x 12.2x 19.3x 14.8x 6.3x 4.9x 22% OW Doug AnmuthTwitter Inc TWTR $66.29 50,588 NM NM NM NM 514.3x 196.1x NM NM 45.7x 30.9x 62% N Doug AnmuthYahoo! Inc YHOO $39.93 42,896 NA NA NA NA NA NA NA NA NA NA NA NR Doug AnmuthLinkedIn Corp LNKD $203.92 24,261 96.4x 55.5x 54% 1.0 41.3x 29.8x 319.7x 40.3x 10.7x 8.1x 37% OW Doug AnmuthNetflix Inc NFLX $359.57 22,083 80.3x 46.8x 113% 0.4 37.0x 23.1x 104.8x 32.0x 4.0x 3.3x 20% OW Doug AnmuthTripAdvisor Inc TRIP $80.38 11,997 36.8x 29.4x 27% 1.1 23.8x 18.9x 33.0x 25.5x 9.9x 8.0x 24% N Doug AnmuthExpedia Inc EXPE $68.96 9,528 18.6x 15.1x 22% 0.7 7.9x 6.0x 8.8x 7.2x 1.6x 1.2x 10% N Doug AnmuthGroupon Inc GRPN $11.89 8,298 44.2x 25.8x 107% 0.2 23.2x 17.7x 19.6x 6.5x 2.3x 2.0x 16% N Doug AnmuthPandora Media Inc P $31.49 6,809 103.3x 43.5x 298% 0.1 85.8x 32.4x 93.8x 38.2x 6.5x 4.6x 43% OW Doug AnmuthYelp Inc YELP $71.72 5,131 84.9x 62.8x 311% 0.2 69.1x 40.2x 82.2x 59.8x 13.8x 9.5x 51% OW Kaizad GotlaHomeAway Inc AWAY $40.92 3,663 49.6x 40.6x 26% 1.5 25.1x 20.2x 25.0x 21.6x 7.6x 6.3x 20% OW Doug AnmuthZynga Inc ZNGA $4.04 3,523 NM NM NM NM 158.7x 124.9x 30.1x NM 3.0x 3.2x -6% N Doug AnmuthCriteo SA CRTO $32.71 2,094 89.1x 44.4x 77% 0.6 25.4x 15.6x 254.0x 49.2x 5.1x 4.1x 35% OW Doug AnmuthOpenTable Inc OPEN $79.55 1,942 34.3x 29.5x 17% 1.8 17.7x 14.7x 26.1x 21.5x 7.7x 6.5x 18% N Kaizad GotlaBankrate Inc RATE $16.64 1,665 20.9x 18.0x 33% 0.5 10.9x 9.0x 18.5x NM 3.2x 2.7x 13% N Doug AnmuthTrulia Inc TRLA $36.83 1,416 40.5x 42.4x 15% 2.9 24.8x 15.6x 29.2x 21.5x 5.2x 3.9x 54% OW Doug AnmuthChegg Inc CHGG $8.26 746 NM 18.9x NM NM 141.7x 11.9x 58.8x 14.4x 1.9x 1.5x 25% OW Doug AnmuthQuinStreet Inc QNST $8.76 379 22.0x 14.3x -43% -0.3 9.0x 7.6x 22.7x 9.6x 1.1x 1.1x 3% N Doug AnmuthReachLocal Inc RLOC $12.73 369 26.1x 15.1x 44% 0.3 6.5x 3.5x 8.0x NM 0.4x 0.3x 13% OW Doug AnmuthCafePress Inc PRSS $6.33 111 13.7x 9.6x 200% 0.0 3.9x 2.7x 12.2x 5.9x 0.3x 0.2x 10% N Doug AnmuthChinaTencent Holdings Ltd 700 HK HKD 495.60 124,193 227.0x 170.5x 40% 4.3 21.5x 15.3x 28.5x 20.9x 8.5x 6.3x 36% OW Alex YaoBaidu Inc BIDU US $176.63 61,925 22.8x 17.3x 41% 0.4 17.5x 12.2x 23.9x 12.7x 7.5x 5.3x 36% OW Alex YaoQihoo 360 Technology Co., Ltd QIHU US $80.10 10,520 35.3x 24.1x 57% 0.4 29.9x 18.5x 47.3x 25.1x 8.9x 6.0x 54% OW Alex YaoNetEase Inc NTES US $78.03 10,180 13.0x 11.3x 11% 1.0 11.1x 9.5x 13.1x 11.3x 5.4x 4.8x 10% N Alex YaoCtrip.com International Ltd CTRP US $44.43 7,420 23.9x 18.7x 24% 0.8 30.2x 21.1x 27.4x 21.1x 5.9x 4.5x 28% N Alex YaoSouFun Holdings Ltd SFUN US $83.98 6,873 21.2x 17.7x 19% 0.9 15.6x 12.6x 20.5x 15.5x 8.3x 6.6x 21% OW Alex YaoSina Corp SINA US $84.35 6,153 37.0x 28.9x 61% 0.5 36.2x 24.0x 54.5x 33.9x 6.3x 4.9x 29% OW Alex YaoYouku Tudou Inc YOKU US $33.92 5,645 242.3x 50.6x NM NM 36.5x 21.2x 38.9x 22.7x 8.1x 5.9x 39% N Alex YaoVipshop Holdings Ltd VIPS US $82.28 4,722 35.8x 24.3x 73% 0.3 29.1x 18.3x 26.6x 26.7x 1.5x 1.0x 62% OW Alex YaoYY Inc YY US $57.34 3,384 25.3x 19.7x 40% 0.5 24.5x 16.8x 23.1x 17.4x 6.6x 4.5x 49% OW Alex YaoSohu.com Inc SOHU US $73.94 2,883 30.1x 29.9x 32% 0.9 6.6x 5.5x 8.4x 12.6x 1.2x 0.9x 18% N Alex YaoForgame Holdings Ltd 484 HK HKD 55.90 940 93.2x 72.9x -12% -5.9 6.7x 4.2x 8.0x 5.2x 2.3x 1.5x 32% OW Alex YaoPhoenix New Media Ltd FENG US $9.81 779 13.8x 10.5x 28% 0.4 9.7x 6.3x 11.5x 7.7x 1.8x 1.4x 24% OW Alex Yao
Sungy Mobile Ltd GOMO US $20.18 759 27.3x 17.1x 27% 0.6 30.3x 15.8x 25.2x 14.3x 7.7x 4.8x 52% N Alex YaoE-commerce China Dangdang Inc DANG US $9.00 742 NM 45.0x NM NM 76.1x 17.4x NM 14.0x 0.5x 0.4x 18% UW Alex YaoKorea (in KRW)Naver 035420 KS KRW 699,000 19,563 35.5x 22.8x 53% 0.4 22.7x 14.1x 40.9x 24.0x 6.8x 5.2x 28% OW Stanley YangNCSoft 036570 KS KRW 234,000 4,362 15.2x 13.7x 43% 0.3 10.1x 8.6x 16.6x 13.4x 4.2x 3.6x 16% OW Stanley YangNHN Ent. 181710 KS KRW 91,700 1,308 14.1x 14.5x -8% -1.9 7.3x 7.4x 16.3x 16.6x 1.7x 1.6x 3% UW Stanley YangDaum 035720 KS KRW 84,700 1,068 14.5x 13.2x 10% 1.4 5.7x 4.8x 11.3x 9.2x 1.3x 1.1x 10% N Stanley YangWemade 112040 KS KRW 32,000 500 13.7x 9.7x 49% 0.2 7.5x 5.0x 14.9x 8.7x 1.6x 1.3x 12% N Stanley YangGamevil 063080 KS KRW 44,600 270 15.6x 14.1x 10% 1.4 11.2x 9.9x 18.9x 15.7x 2.3x 2.0x 17% UW Stanley YangJapan (in Yen)Yahoo! Japan 4689 ¥592.00 32,672 26.2x 22.6x 11% 2.1 12.2x 10.6x 23.1x 19.0x 6.7x 5.9x 9% OW Haruka MoriRakuten 4755 ¥1,586.00 20,133 31.8x 25.1x 28% 0.9 13.9x 11.3x 54.1x 38.6x 3.6x 3.2x 10% N Haruka MoriKakaku 2371 ¥1,830.00 3,982 33.0x 26.0x 31% 0.8 18.9x 15.3x 33.5x 25.5x 10.6x 8.9x 20% N Haruka MoriNEXON 3659 ¥941.00 3,965 10.4x 10.2x 2% 6.2 4.0x 3.3x 5.5x 4.6x 1.8x 1.5x 4% N Haruka MoriDeNA 2432 ¥2,151.00 3,113 10.2x 9.9x 2% 5.8 3.3x 2.8x 5.7x 4.7x 1.1x 0.9x 3% OW Haruka MoriCyberAgent 4751 ¥4,400.00 2,669 23.3x 21.7x 12% 1.8 8.6x 7.8x 17.6x 16.1x 1.2x 1.0x 6% N Haruka MoriGREE 3632 ¥1,033.00 2,415 11.7x 11.5x 14% 0.8 4.5x 4.0x 7.4x 6.5x 1.4x 1.2x 3% N Haruka MoriASKUL 2678 ¥3,020.00 1,572 34.1x 23.7x 52% 0.5 11.0x 8.7x 32.0x 23.7x 0.5x 0.4x 18% OW Haruka MoriGurunavi 2440 ¥3,135.00 782 25.5x 18.5x 38% 0.5 8.6x 7.1x 19.5x 15.5x 2.1x 1.8x 10% OW Haruka MoriEuropeSchibsted SCH NO £417.00 7,226 50.2x 35.3x 52% 0.7 20.9x 17.6x 46.7x 37.7x 3.0x 2.8x 4% N Nicolas DubourgAxel Springer SPR GR £47.35 3,429 19.0x 16.9x 1% 18.2 9.8x 8.9x 12.4x 14.6x 1.7x 1.6x -3% N Nicolas DubourgRightmove RMV LN £2,805.00 1,693 28.4x 23.5x 22% 1.1 21.7x 17.7x 29.0x 23.0x 16.4x 13.5x 17% OW Nicolas DubourgCTS Eventim EVD GY € 39.30 1,384 21.9x 19.2x 14% 1.3 12.1x 10.4x 15.3x 12.9x 2.9x 2.6x 5% OW Nicolas DubourgUbisoft UBI FP € 10.04 743 15.5x 8.1x NM NM 1.9x 1.5x 161.3x 11.4x 0.7x 0.6x 20% N Nicolas DubourgMoney Supermarket MONY LN £189.30 625 15.6x 14.3x 11% 1.3 11.5x 10.3x 16.1x 14.3x 4.2x 3.8x 8% N Nicolas DubourgGameloft GFT FP € 7.93 501 18.6x 12.8x 48% 0.3 8.9x 5.9x 13.9x 9.3x 2.1x 1.6x 17% OW Nicolas DubourgPerform PER LN £224.80 360 21.9x 17.2x 19% 0.9 12.9x 10.2x 28.4x 21.9x 2.3x 2.0x 14% N Nicolas DubourgXING O1BC GY £79.31 325 31.4x 25.7x 29% 0.9 12.4x 10.1x 22.1x 18.7x 3.9x 3.4x 11% UW Nicolas DubourgLatin AmericaMercadoLibre, Inc MELI $101.49 4,481 32.0x 26.3x 25% 1.1 20.1x 15.6x 30.2x 22.7x 7.2x 5.7x 22% N Andrew BaggioRussiaYandex YNDX $42.91 13,982 28.4x 22.7x 19% 1.2 18.4x 14.9x NM NM 8.2x 6.6x 26% OW Alexi GogolevMail.ru MAIL LI $42.64 8,916 21.9x 18.3x 22% 0.8 14.7x 12.3x 17.2x 14.6x 8.0x 6.7x 21% OW Alexi Gogolev
EV/RevenueEV/EBITDAP/E EV/FCF
Source: Company reports, Bloomberg and J.P. Morgan estimates.
7
Global Equity Research09 January 2014
Doug Anmuth(1-212) [email protected]
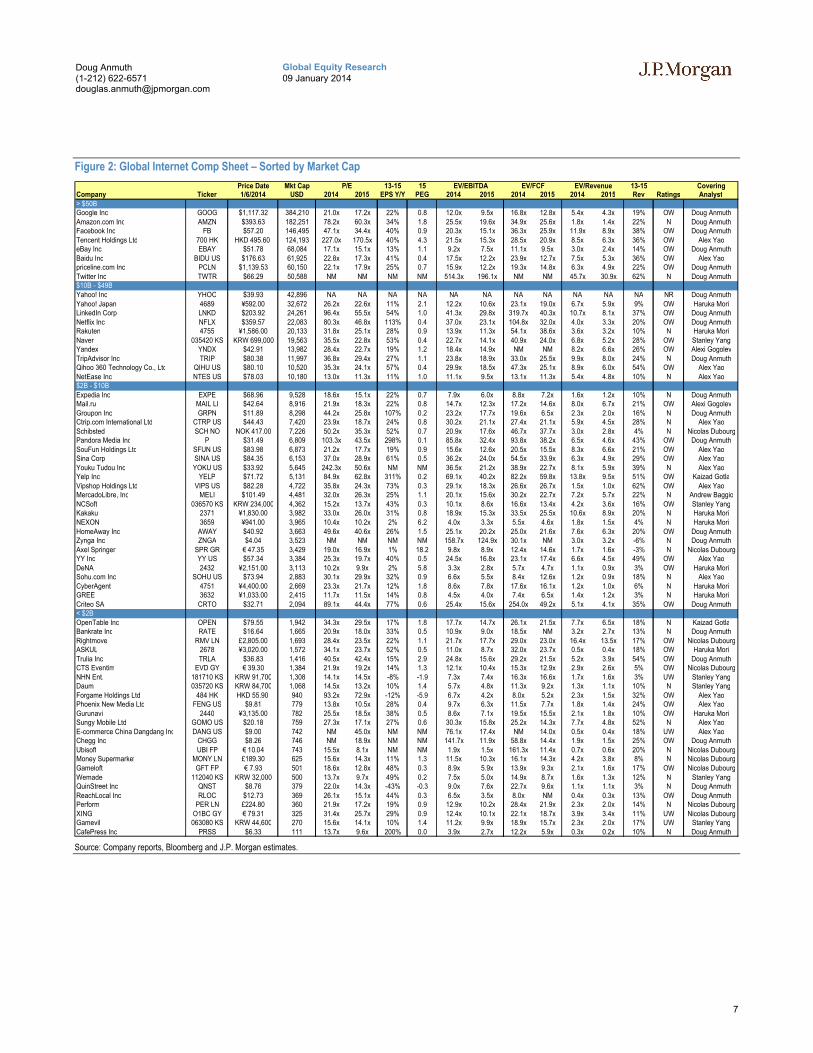
Figure 2: Global Internet Comp Sheet – Sorted by Market Cap
Price Date Mkt Cap 13-15 15 13-15 CoveringCompany Ticker 1/6/2014 USD 2014 2015 EPS Y/Y PEG 2014 2015 2014 2015 2014 2015 Rev Ratings Analyst> $50BGoogle Inc GOOG $1,117.32 384,210 21.0x 17.2x 22% 0.8 12.0x 9.5x 16.8x 12.8x 5.4x 4.3x 19% OW Doug AnmuthAmazon.com Inc AMZN $393.63 182,251 78.2x 60.3x 34% 1.8 25.5x 19.6x 34.9x 25.6x 1.8x 1.4x 22% N Doug AnmuthFacebook Inc FB $57.20 146,495 47.1x 34.4x 40% 0.9 20.3x 15.1x 36.3x 25.9x 11.9x 8.9x 38% OW Doug AnmuthTencent Holdings Ltd 700 HK HKD 495.60 124,193 227.0x 170.5x 40% 4.3 21.5x 15.3x 28.5x 20.9x 8.5x 6.3x 36% OW Alex YaoeBay Inc EBAY $51.78 68,084 17.1x 15.1x 13% 1.1 9.2x 7.5x 11.1x 9.5x 3.0x 2.4x 14% OW Doug AnmuthBaidu Inc BIDU US $176.63 61,925 22.8x 17.3x 41% 0.4 17.5x 12.2x 23.9x 12.7x 7.5x 5.3x 36% OW Alex Yaopriceline.com Inc PCLN $1,139.53 60,150 22.1x 17.9x 25% 0.7 15.9x 12.2x 19.3x 14.8x 6.3x 4.9x 22% OW Doug AnmuthTwitter Inc TWTR $66.29 50,588 NM NM NM NM 514.3x 196.1x NM NM 45.7x 30.9x 62% N Doug Anmuth$10B - $49BYahoo! Inc YHOO $39.93 42,896 NA NA NA NA NA NA NA NA NA NA NA NR Doug AnmuthYahoo! Japan 4689 ¥592.00 32,672 26.2x 22.6x 11% 2.1 12.2x 10.6x 23.1x 19.0x 6.7x 5.9x 9% OW Haruka MoriLinkedIn Corp LNKD $203.92 24,261 96.4x 55.5x 54% 1.0 41.3x 29.8x 319.7x 40.3x 10.7x 8.1x 37% OW Doug AnmuthNetflix Inc NFLX $359.57 22,083 80.3x 46.8x 113% 0.4 37.0x 23.1x 104.8x 32.0x 4.0x 3.3x 20% OW Doug AnmuthRakuten 4755 ¥1,586.00 20,133 31.8x 25.1x 28% 0.9 13.9x 11.3x 54.1x 38.6x 3.6x 3.2x 10% N Haruka MoriNaver 035420 KS KRW 699,000 19,563 35.5x 22.8x 53% 0.4 22.7x 14.1x 40.9x 24.0x 6.8x 5.2x 28% OW Stanley YangYandex YNDX $42.91 13,982 28.4x 22.7x 19% 1.2 18.4x 14.9x NM NM 8.2x 6.6x 26% OW Alexi GogolevTripAdvisor Inc TRIP $80.38 11,997 36.8x 29.4x 27% 1.1 23.8x 18.9x 33.0x 25.5x 9.9x 8.0x 24% N Doug AnmuthQihoo 360 Technology Co., Ltd QIHU US $80.10 10,520 35.3x 24.1x 57% 0.4 29.9x 18.5x 47.3x 25.1x 8.9x 6.0x 54% OW Alex YaoNetEase Inc NTES US $78.03 10,180 13.0x 11.3x 11% 1.0 11.1x 9.5x 13.1x 11.3x 5.4x 4.8x 10% N Alex Yao$2B - $10BExpedia Inc EXPE $68.96 9,528 18.6x 15.1x 22% 0.7 7.9x 6.0x 8.8x 7.2x 1.6x 1.2x 10% N Doug AnmuthMail.ru MAIL LI $42.64 8,916 21.9x 18.3x 22% 0.8 14.7x 12.3x 17.2x 14.6x 8.0x 6.7x 21% OW Alexi GogolevGroupon Inc GRPN $11.89 8,298 44.2x 25.8x 107% 0.2 23.2x 17.7x 19.6x 6.5x 2.3x 2.0x 16% N Doug AnmuthCtrip.com International Ltd CTRP US $44.43 7,420 23.9x 18.7x 24% 0.8 30.2x 21.1x 27.4x 21.1x 5.9x 4.5x 28% N Alex YaoSchibsted SCH NO NOK 417.00 7,226 50.2x 35.3x 52% 0.7 20.9x 17.6x 46.7x 37.7x 3.0x 2.8x 4% N Nicolas DubourgPandora Media Inc P $31.49 6,809 103.3x 43.5x 298% 0.1 85.8x 32.4x 93.8x 38.2x 6.5x 4.6x 43% OW Doug AnmuthSouFun Holdings Ltd SFUN US $83.98 6,873 21.2x 17.7x 19% 0.9 15.6x 12.6x 20.5x 15.5x 8.3x 6.6x 21% OW Alex YaoSina Corp SINA US $84.35 6,153 37.0x 28.9x 61% 0.5 36.2x 24.0x 54.5x 33.9x 6.3x 4.9x 29% OW Alex YaoYouku Tudou Inc YOKU US $33.92 5,645 242.3x 50.6x NM NM 36.5x 21.2x 38.9x 22.7x 8.1x 5.9x 39% N Alex YaoYelp Inc YELP $71.72 5,131 84.9x 62.8x 311% 0.2 69.1x 40.2x 82.2x 59.8x 13.8x 9.5x 51% OW Kaizad GotlaVipshop Holdings Ltd VIPS US $82.28 4,722 35.8x 24.3x 73% 0.3 29.1x 18.3x 26.6x 26.7x 1.5x 1.0x 62% OW Alex YaoMercadoLibre, Inc MELI $101.49 4,481 32.0x 26.3x 25% 1.1 20.1x 15.6x 30.2x 22.7x 7.2x 5.7x 22% N Andrew BaggioNCSoft 036570 KS KRW 234,000 4,362 15.2x 13.7x 43% 0.3 10.1x 8.6x 16.6x 13.4x 4.2x 3.6x 16% OW Stanley YangKakaku 2371 ¥1,830.00 3,982 33.0x 26.0x 31% 0.8 18.9x 15.3x 33.5x 25.5x 10.6x 8.9x 20% N Haruka MoriNEXON 3659 ¥941.00 3,965 10.4x 10.2x 2% 6.2 4.0x 3.3x 5.5x 4.6x 1.8x 1.5x 4% N Haruka MoriHomeAway Inc AWAY $40.92 3,663 49.6x 40.6x 26% 1.5 25.1x 20.2x 25.0x 21.6x 7.6x 6.3x 20% OW Doug AnmuthZynga Inc ZNGA $4.04 3,523 NM NM NM NM 158.7x 124.9x 30.1x NM 3.0x 3.2x -6% N Doug AnmuthAxel Springer SPR GR € 47.35 3,429 19.0x 16.9x 1% 18.2 9.8x 8.9x 12.4x 14.6x 1.7x 1.6x -3% N Nicolas DubourgYY Inc YY US $57.34 3,384 25.3x 19.7x 40% 0.5 24.5x 16.8x 23.1x 17.4x 6.6x 4.5x 49% OW Alex YaoDeNA 2432 ¥2,151.00 3,113 10.2x 9.9x 2% 5.8 3.3x 2.8x 5.7x 4.7x 1.1x 0.9x 3% OW Haruka MoriSohu.com Inc SOHU US $73.94 2,883 30.1x 29.9x 32% 0.9 6.6x 5.5x 8.4x 12.6x 1.2x 0.9x 18% N Alex YaoCyberAgent 4751 ¥4,400.00 2,669 23.3x 21.7x 12% 1.8 8.6x 7.8x 17.6x 16.1x 1.2x 1.0x 6% N Haruka MoriGREE 3632 ¥1,033.00 2,415 11.7x 11.5x 14% 0.8 4.5x 4.0x 7.4x 6.5x 1.4x 1.2x 3% N Haruka MoriCriteo SA CRTO $32.71 2,094 89.1x 44.4x 77% 0.6 25.4x 15.6x 254.0x 49.2x 5.1x 4.1x 35% OW Doug Anmuth< $2BOpenTable Inc OPEN $79.55 1,942 34.3x 29.5x 17% 1.8 17.7x 14.7x 26.1x 21.5x 7.7x 6.5x 18% N Kaizad GotlaBankrate Inc RATE $16.64 1,665 20.9x 18.0x 33% 0.5 10.9x 9.0x 18.5x NM 3.2x 2.7x 13% N Doug AnmuthRightmove RMV LN £2,805.00 1,693 28.4x 23.5x 22% 1.1 21.7x 17.7x 29.0x 23.0x 16.4x 13.5x 17% OW Nicolas DubourgASKUL 2678 ¥3,020.00 1,572 34.1x 23.7x 52% 0.5 11.0x 8.7x 32.0x 23.7x 0.5x 0.4x 18% OW Haruka MoriTrulia Inc TRLA $36.83 1,416 40.5x 42.4x 15% 2.9 24.8x 15.6x 29.2x 21.5x 5.2x 3.9x 54% OW Doug AnmuthCTS Eventim EVD GY € 39.30 1,384 21.9x 19.2x 14% 1.3 12.1x 10.4x 15.3x 12.9x 2.9x 2.6x 5% OW Nicolas DubourgNHN Ent. 181710 KS KRW 91,700 1,308 14.1x 14.5x -8% -1.9 7.3x 7.4x 16.3x 16.6x 1.7x 1.6x 3% UW Stanley YangDaum 035720 KS KRW 84,700 1,068 14.5x 13.2x 10% 1.4 5.7x 4.8x 11.3x 9.2x 1.3x 1.1x 10% N Stanley YangForgame Holdings Ltd 484 HK HKD 55.90 940 93.2x 72.9x -12% -5.9 6.7x 4.2x 8.0x 5.2x 2.3x 1.5x 32% OW Alex YaoPhoenix New Media Ltd FENG US $9.81 779 13.8x 10.5x 28% 0.4 9.7x 6.3x 11.5x 7.7x 1.8x 1.4x 24% OW Alex YaoGurunavi 2440 ¥3,135.00 782 25.5x 18.5x 38% 0.5 8.6x 7.1x 19.5x 15.5x 2.1x 1.8x 10% OW Haruka MoriSungy Mobile Ltd GOMO US $20.18 759 27.3x 17.1x 27% 0.6 30.3x 15.8x 25.2x 14.3x 7.7x 4.8x 52% N Alex YaoE-commerce China Dangdang Inc DANG US $9.00 742 NM 45.0x NM NM 76.1x 17.4x NM 14.0x 0.5x 0.4x 18% UW Alex YaoChegg Inc CHGG $8.26 746 NM 18.9x NM NM 141.7x 11.9x 58.8x 14.4x 1.9x 1.5x 25% OW Doug AnmuthUbisoft UBI FP € 10.04 743 15.5x 8.1x NM NM 1.9x 1.5x 161.3x 11.4x 0.7x 0.6x 20% N Nicolas DubourgMoney Supermarket MONY LN £189.30 625 15.6x 14.3x 11% 1.3 11.5x 10.3x 16.1x 14.3x 4.2x 3.8x 8% N Nicolas DubourgGameloft GFT FP € 7.93 501 18.6x 12.8x 48% 0.3 8.9x 5.9x 13.9x 9.3x 2.1x 1.6x 17% OW Nicolas DubourgWemade 112040 KS KRW 32,000 500 13.7x 9.7x 49% 0.2 7.5x 5.0x 14.9x 8.7x 1.6x 1.3x 12% N Stanley YangQuinStreet Inc QNST $8.76 379 22.0x 14.3x -43% -0.3 9.0x 7.6x 22.7x 9.6x 1.1x 1.1x 3% N Doug AnmuthReachLocal Inc RLOC $12.73 369 26.1x 15.1x 44% 0.3 6.5x 3.5x 8.0x NM 0.4x 0.3x 13% OW Doug AnmuthPerform PER LN £224.80 360 21.9x 17.2x 19% 0.9 12.9x 10.2x 28.4x 21.9x 2.3x 2.0x 14% N Nicolas DubourgXING O1BC GY € 79.31 325 31.4x 25.7x 29% 0.9 12.4x 10.1x 22.1x 18.7x 3.9x 3.4x 11% UW Nicolas DubourgGamevil 063080 KS KRW 44,600 270 15.6x 14.1x 10% 1.4 11.2x 9.9x 18.9x 15.7x 2.3x 2.0x 17% UW Stanley YangCafePress Inc PRSS $6.33 111 13.7x 9.6x 200% 0.0 3.9x 2.7x 12.2x 5.9x 0.3x 0.2x 10% N Doug Anmuth
EV/FCF EV/RevenueEV/EBITDAP/E
Source: Company reports, Bloomberg and J.P. Morgan estimates.
8
Global Equity Research09 January 2014
Doug Anmuth(1-212) [email protected]
Global Internet Top Picks
U.S.
Facebook: Overweight, $62 PT. Facebook remains a top pick into 2014 as we believe it is still early in monetizing the company’s base of 1.2B users globally. Facebook’s mobile advertising should surpass desktop in 4Q13 and we expect mobile to account for 63% of total ad revenue in 2014. We believe advertiser demand and ads quality should more than offset slower increases in ad load, thereby driving higher relevancy and click-through rates and ultimately greater quality over time. We think Instagram and auto-play video ads could also drive upside to our and Street estimates. We note that our 2014 PF EPS estimate for Facebook is currently 7% above consensus and our 2015 estimate is 12% ahead.
Google: Overweight, $1,305 PT. We believe Google’s strong position in both mobile and video should drive continued share gains in online advertising, and Google remains focused on product innovation and disruptive technologies. As users become more comfortable and savvy transacting through mobile devices and Google delivers more efficient and better-targeted ads through initiatives such as Estimated Total Conversions and Enhanced Campaigns, we expect mobile to become a bigger tailwind for the company in upcoming quarters. We are also increasingly optimistic on YouTube now that the company is utilizing Nielsen’s Online Campaign Ratings (OCR) tags. Our ad industry discussions suggest that TV ad buyers would like to spend more money online and we believe familiar measurement methodology through OCR will help to accelerate this shift. We remain optimistic on Google growing traction with PLAs into 2014 and the potential for Network Sites to rebound from a heavily self-inflicted slowdown in 2013. We expect Google to continue to deliver strong growth off a large base and we believe the combination of growth and stability in the business model, still-reasonable valuation (17.2x 2015E PF EPS), and significant cash on the balance sheet (~15% of the market cap) help make Google a strong play in 2014.
LinkedIn: Overweight, $275 PT. We believe LinkedIn is well positioned to benefit from the secular shift toward enterprise hiring, expanded field sales efforts, and new products. We would be buyers of the recent weakness in LinkedIn as we remain optimistic on Talent Solutions growth driven by deeper enterprise penetration, a pricing increase impacting half of all subscribers in 2014, and potential for stabilization in international markets. We also expect accelerating Marketing Solutions growth in 2014 as LinkedIn laps tougher comps after 1Q and Sponsored Updates should benefit from significant dollars moving toward Newsfeed and Native ads. It remains early for Sales Navigator, but we believe the product will be extended more towards corporates this year. We believe LinkedIn remains focused on product innovation and engagement and we would take advantage of recent weakness in the shares.
Pandora: Overweight, $35 PT. Pandora is our top SMid-cap pick as we continue to view the stock as a compelling pure play on mobile and believe the company is at an inflection point on monetization. We highlight recent listener metrics and app download trends, which represent solid continued growth in hours, users, and market share despite a heightened competitive environment. We also highlight recent updates to Pandora’s auto strategy, including achieving 4M unique native auto
9
Global Equity Research09 January 2014
Doug Anmuth(1-212) [email protected]
activations and introducing in-car targeted advertising. We believe Pandora’s monetization and profitability will improve going forward as: 1) Pandora’s 8.6% market share of total US radio should continue to ramp; 2) radio buy-side platform integration should remove friction from the buying process and attract more ad spend; 3) increased audience segmentation and auto-focused campaigns should help support increasing CPMs; 4) Pandora continues to build out its local sales force (now in 29 of top 40 markets); and 5) cost-control policies including the limit to mobileskips should help curb content costs in place of the 40-hour mobile cap, enabling greater leverage in content acquisition.
China
Tencent: Overweight, HK$580 PT. We maintain our Overweight rating on Tencent with a Dec-14 PT of HK$580. We believe Tencent is a dominant leader in China’s gaming market and it is expected to capture a 48% market share in China’s total gaming market in 2014. On PC side, we expect Tencent’s revenue growth to be driven by continued high-quality hit content (e.g., Blade & Soul and Asura) over the next 2-3 years. On mobile side, Tencent is well positioned across the entire mobile games value chain including development, publishing and distribution. Such positioning allows Tencent to capture a significant portion of value created in China’s mobile gaming market. We estimate Tencent will generate RMB8.2bn mobile gaming revenue in 2014. In the long run, we expect Tencent will obtain more market share in mobile gaming market than in PC gaming market, given its stronger mobile distribution power, Weixin’s high-end user base and fast game genre expansion on mobile.
Qihoo: Overweight, US$98 PT. We maintain our Overweight rting on Qihoo with a Dec-14 PT of US$98. We view Qihoo as one of the key beneficiaries in the fast-growing mobile gaming market in China over the next two years, due to its wide exposure to mobile users (over 400m monthly active users on mobile) and strong distribution power on mobile (over 45m daily average distribution volume from 360 Mobile Assistant). We estimate Qihoo will capture 12% of China’s mobile gaming market in 2014. Qihoo should generate RMB1.8bn revenue from such a market share. Meanwhile, we expect Qihoo to quickly ramp up monetization of its search traffic in 2014, which is currently significantly under-monetized (1.6% revenue share vs. over 20% traffic share).
YY: Overweight, US$67 PT. We maintain our Overweight rating on YY with a Dec-14 PT of US$67. YY has established a large social-oriented user base on the back of its technology strengths in rich-media-based group communications on a real-time basis. Such an advantage is highly scalable to other internet activities which require online group voice/video communications, e.g., online recruiting and online education. Meanwhile, with sizable organic traffic, YY is able to cross-sell other internet content/services (e.g., online gaming) to users. We expect YY’s growth in 2014 to be primarily driven by 1) continued strong growth of YY Music, 2) PC game licensing, and 3) mobile games development and publishing.
10
Global Equity Research09 January 2014
Doug Anmuth(1-212) [email protected]
Korea
Naver: Overweight, W770,000 PT. Internet traffic is highly concentrated in the dominant portal, Naver, in Korea. We are positive on the potential monetization upside of Naver’s mobile ad business. We also believe the potential monetization upside of Naver’s global social networking business has yet to be fully captured by the market due to the time lag between subscriber growth and monetization.
NCsoft: Overweight, W300,000 PT. We like the company’s leading global position in the captive hardcore MMORPG market on significantly subdued competition (a few survivors take all). The upcoming launches of GW2 in China and Wild Star in the US/EU are expected to serve as additional share price catalysts, in addition to B&S’s current strong traction in China.
Japan
Yahoo Japan: Overweight, ¥600 PT. Following the shift to an advertising income model, we expect the stock to gradually start pricing in the medium-term potential for e-commerce as investors confirm that growth in the number of store openings boosts product numbers, increases customer pulling power, and expands sales value. However, we expect smartphone advertising and YDN to drive stable growth for core advertising sales for the foreseeable future, and think the stock is very attractive from a risk/reward perspective.
Askul: Overweight, ¥3,700 PT. While valuations look demanding and the share price appears to have risen on investor expectations, we think LOHACO will gradually start to benefit from Yahoo Japan’s initiatives (which will step up from early 2014) as faster growth in e-commerce provides a tailwind. Specifically, we note 1) benefits in terms of attracting customers, 2) the use of big data, and 3) growth in logistics volumes. We focus on this stock because we think it could be major beneficiary of Yahoo Japan’s new e-commerce strategy.
Europe
Gameloft: Overweight, €9.50 PT. We are Overweight on Gameloft with target price of €9.50. Gameloft is one of the leading developers of games for digital platforms such as mobile phones, smartphones and tablets and, in our view, an ideal play on soaring mobile device sales along with freemium games across the globe. The future for the online game industry looks bright: the number of smartphone subscriptions is set to triple to 5.6bn by 2019, with APAC reaching 4.7bn. Within mobile use, gaming is the 3rd most popular activity (6h per month, source: Ericsson mobility report, November). And Gameloft is likely to be a key beneficiary due to 1) unparalleled mobile exposure: games on smartphones and tablets made up 69% of Gameloft’s revenues in Q313 (mobile 98% of Q2 in total), 2) great geographical exposure: LatAm and APAC already made up 36% of revenues in Q3, 3) focus on freemium: sales of virtual goods and advertising within games accounted for 80% of Gameloft’s Q3 smartphone revenues, offering access to gamers at lower price points and recurring revenues from a given game, 4) limited single-game risk: no game contributes over 10% of revenues, so Gameloft is not dependent on one hit. On our estimates, +17% revenues CAGR’13-’15 translates into +37% EBITDA CAGR even as, we assume c.60% of adj. operating costs are fixed (i.e. growing at c.7% p.a. to FY15), with the remainder growing in line with sales. Gameloft stopped hiring in August 2012 (having significantly built up its game developing capacity) and signaled that up to 80% of costs are fixed. H113 results/FY13 guidance then
11
Global Equity Research09 January 2014
Doug Anmuth(1-212) [email protected]
confirmed operating leverage is kicking in. Gameloft may further boost profitability as it reduces its annual slate to 15-20 games by 2014 (vs. FY13’s 22) and focuses on evolving successful games. Gameloft shares are trading on 12.8x 2013EEV/EBITDA which we see as attractive given Gameloft’s 13E-15E EBITDA CAGR of +37%. We leave our estimates unchanged and our EBIT estimate is +10% ahead of BBG consensus in ‘14.
Moneysupermarket: Overweight, 211p PT. We are OW the leader in UK online price comparison (from N) as i) ST uncertainty is reduced (Q3 results and FY13 guidance have shown some stabilization/recovery since the flat y/y revenues of July),ii) the Money vertical (c.30% of revs revs’12) will no longer suffer from tough comparables from Q413/Q114 and iii) the structural growth opportunity remains: more customers could switch providers and do so online: switches/new purchases still make up only 26%/13%/16% of yearly market volumes in the key home insurance, cards and energy verticals and only 55%/56%/32% of those purchases occur online, vs. 44%/81% for motor insurance. The next catalyst will be the Q4 post close update on January 14. Energy is providing a case study to support the structural growth view: prospects for Energy price comparison websites have boomed with i) recent increases in UK Energy prices, which have prompted 900k households to switch providers in Oct/Nov’13 and ii) the end of doorstep-selling in 2012, which leaves more space for online sales. We now see Energy contributing £20m to MONY revenues in FY13 (c.9% of group revenues, vs. £8-9m in FY12), rising progressively thereafter. Our MONY Energy revenue estimate for 2016 is consistent with i) 5.6m Energy customers switching providers overall in the UK (no change vs. 2012), ii) 50% doing so online (vs. 32% for Energy in 2012 and 55% for Home Insurance), iii) MONY taking a 16% market share of online switches (more than the c.9% we estimate for 2012 but less than MONY’s apparent share in October’13), at JPMe c.£60 fee per switch. We also see increasing mobile adoption favouring MONY. MONY is the market leader in the financial price comparison market (>40% share of visits) and we expect their app to be the leader. Mobile users have only a few apps they use on a regular base: this creates significant barriers to entry and increases market share. Our EPS estimates are in line/+5% ahead of BBG. Our Dec-14E PT is DCF-based (WACC of 9%, g 2%) and is 211p. MONY trades at 12.9x EV/EBITDA’13 for 9% EBITDA CAGR’13-’15 but also a highly competitive 6.3% Equity FCF yield ’14 & 4.1% dividend yield ’14. Our Bull case offers a DCF value of 236p and 28% upside.
Russia
Yandex: Overweight, $50 PT. Yandex is the leading advertising platform in Russiawith over 300K+ advertisers in 1H13, accounting for c57% of the Russia online ad market. Yandex is also #1 internet destination, with c55 mn unique monthly visitors. Yandex is leveraging its platform and has become #1 comparison shopping destination, used by 40% of Russian online shoppers (Source: AKAR). Yandex in Turkey: while its search market share remains in the low-single digits, the company plans to start to monetize its product. We continue to prefer Yandex among the Russian TMT space and see the stock as an attractive long-term play on Russian consumption and internet roll-out. We believe the name deserves a premium valuation due to strong fundamentals, well-regarded corporate governance and high share liquidity. Any announcement on dividend could well extend the share price rally.
12
North America Equity Research09 January 2014
Doug Anmuth(1-212) [email protected]
U.S. Internet Themes for 2014
Revenue and Conversions to Tighten the Gap with Strong Mobile Usage
“The trend has been that mobile was winning…it’s now won.”– Eric Schmidt, Google Chairman
In 2014, global mobile usage should continue to take share from desktop—havingalready crossed 50% of total online usage in the U.S. in 2013—and given continuing growth in smartphone and tablet subscribers worldwide. However, the monetization and commerce associated with that usage has lagged, and we think that 2014 can be a year of catch-up as users become savvier and more comfortable with devices, apps continue to improve in functionality and UI, and more sites become mobile-optimized. Importantly, advertising spend on mobile devices is expected to continue growing as a portion of internet spend, which is, of course, also growing. MagnaGlobal expects global mobile advertising revenue will reach $15.9B in 2014, up 31% Y/Y, representing 12.4% of total online ad spend, relative to 10.7% of estimated total spend for 2013. We expect to see key stakeholders’ success increasingly impacted by their ability to take advantage of the mobile shift, including companies with an online advertising-driven business model, and retailers and eCommerce operators. The discussion below includes: 1) how far along we are in the mobile usage transition; 2) how users engage differently with mobile sites and apps relative to engagement and conversion patterns on desktop; and 3) which companies are best positioned to benefit most or are already closing the gap between mobile usage and mobile revenue.
Nearing Mobile Usage Inflection Point
Mobile usage accelerating while penetration continues to grow, but given saturation levels in certain markets, growth may decelerate
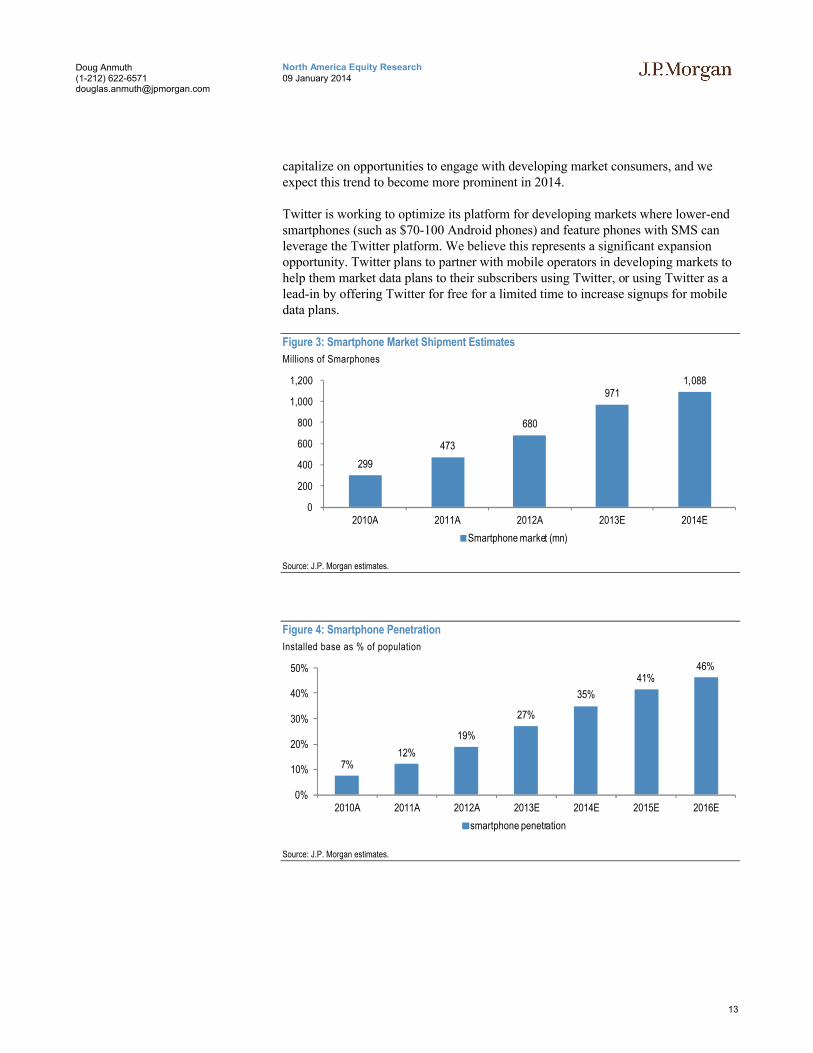
Current J.P. Morgan estimates put global smartphone shipments at 971M for 2014, and while growth continues, it may decelerate given increasing global penetration as high as 60s-70s (%) in countries including UAE, South Korea, Saudi Arabia, Singapore, and Norway. While smartphone penetration is above 50% in most developed countries, according to Google’s Our Mobile Planet research, developing countries still have significant room to grow smartphone users with India’s penetration at only 13%. Additionally, J.P. Morgan estimates put global tablet shipments at 221M in 2013 and are expected to reach 277M in 2014, and 318M in 2015. Despite smartphone and tablet growth reaching more mature levels over the coming years, we believe the monetization associated with those users will grow much faster, as mobile revenue still pales in comparison to mobile usage.
We believe that global mobile internet usage is still at a very early growth stage and as traffic per user increases, the way in which users engage with mobile applications and sites will evolve and impact the companies most levered to mobile engagement, including Facebook, Twitter, Pandora, Google, and others. In 2013 we saw many companies—notably Twitter—increase focus on adapting their local services to
13
North America Equity Research09 January 2014
Doug Anmuth(1-212) [email protected]
capitalize on opportunities to engage with developing market consumers, and we expect this trend to become more prominent in 2014.
Twitter is working to optimize its platform for developing markets where lower-end smartphones (such as $70-100 Android phones) and feature phones with SMS can leverage the Twitter platform. We believe this represents a significant expansion opportunity. Twitter plans to partner with mobile operators in developing markets to help them market data plans to their subscribers using Twitter, or using Twitter as a lead-in by offering Twitter for free for a limited time to increase signups for mobile data plans.
Figure 3: Smartphone Market Shipment Estimates
Millions of Smarphones
299
473
680
9711,088
0
200
400
600
800
1,000
1,200
2010A 2011A 2012A 2013E 2014E
Smartphone market (mn)
Source: J.P. Morgan estimates.
Figure 4: Smartphone Penetration
Installed base as % of population
7%12%
19%
27%
35%
41%46%
0%
10%
20%
30%
40%
50%
2010A 2011A 2012A 2013E 2014E 2015E 2016E
smartphone penetration
Source: J.P. Morgan estimates.
14
North America Equity Research09 January 2014
Doug Anmuth(1-212) [email protected]
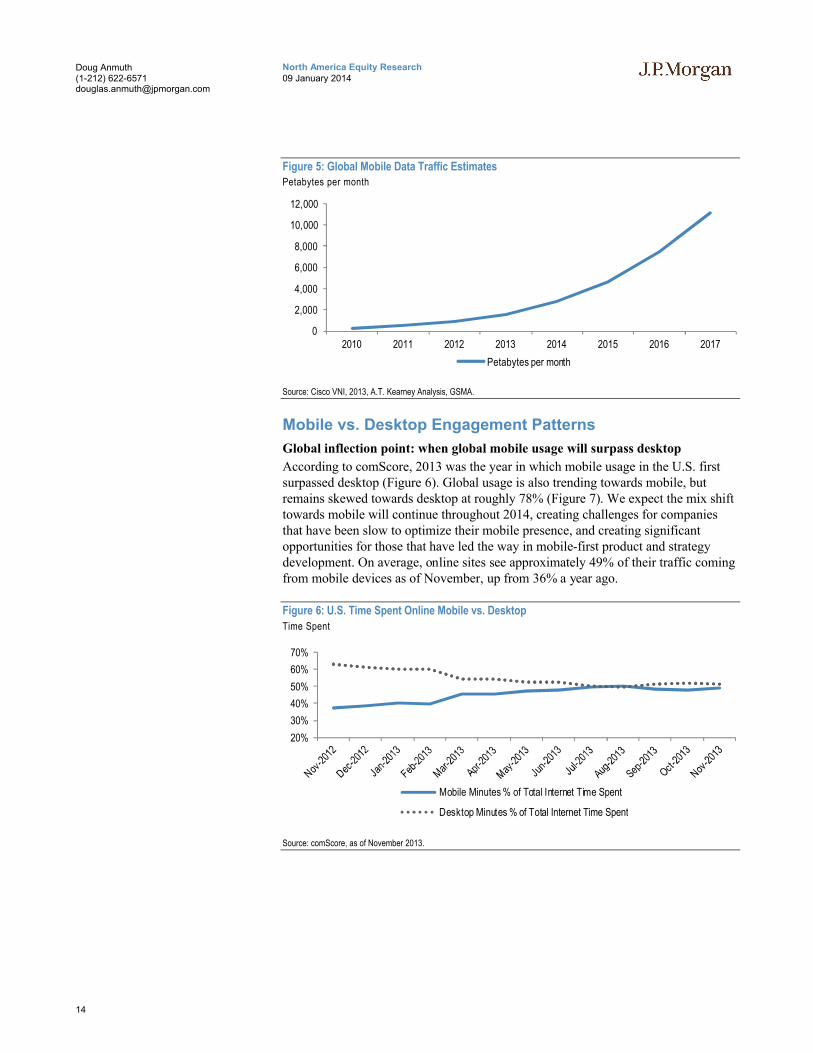
Figure 5: Global Mobile Data Traffic EstimatesPetabytes per month
0
2,000
4,000
6,000
8,000
10,000
12,000
2010 2011 2012 2013 2014 2015 2016 2017
Petabytes per month
Source: Cisco VNI, 2013, A.T. Kearney Analysis, GSMA.
Mobile vs. Desktop Engagement Patterns
Global inflection point: when global mobile usage will surpass desktop
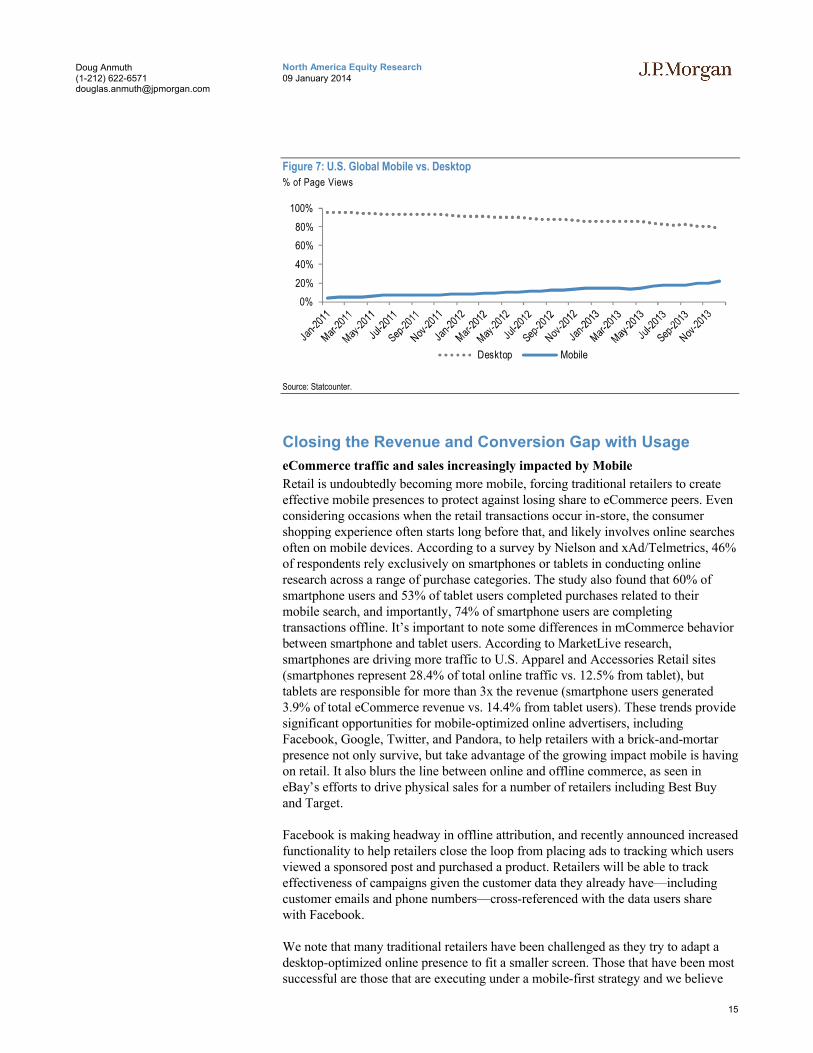
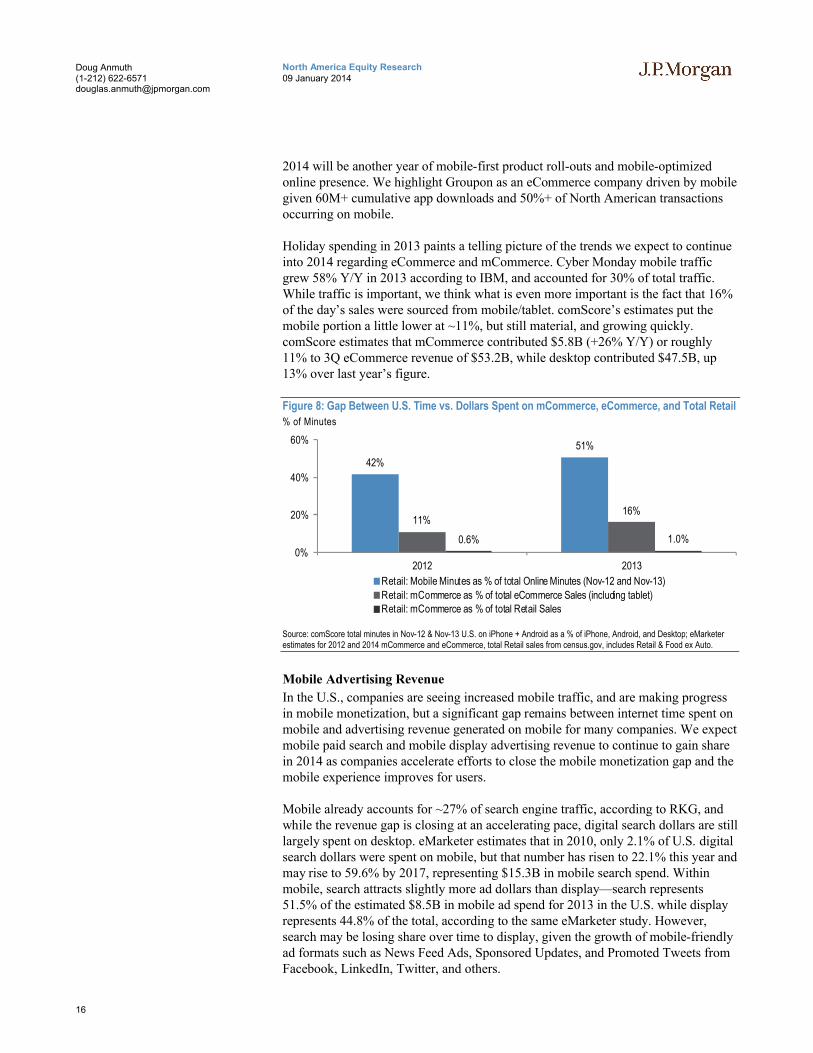
According to comScore, 2013 was the year in which mobile usage in the U.S. first surpassed desktop (Figure 6). Global usage is also trending towards mobile, but remains skewed towards desktop at roughly 78% (Figure 7). We expect the mix shift towards mobile will continue throughout 2014, creating challenges for companies that have been slow to optimize their mobile presence, and creating significant opportunities for those that have led the way in mobile-first product and strategy development. On average, online sites see approximately 49% of their traffic coming from mobile devices as of November, up from 36% a year ago.
Figure 6: U.S. Time Spent Online Mobile vs. Desktop
Time Spent
20%
30%
40%
50%
60%
70%
Mobile Minutes % of Total Internet Time Spent
Desktop Minutes % of Total Internet Time Spent
Source: comScore, as of November 2013.
15
North America Equity Research09 January 2014
Doug Anmuth(1-212) [email protected]
Figure 7: U.S. Global Mobile vs. Desktop
% of Page Views
0%
20%
40%
60%
80%
100%
Desktop Mobile
Source: Statcounter.
Closing the Revenue and Conversion Gap with Usage
eCommerce traffic and sales increasingly impacted by Mobile
Retail is undoubtedly becoming more mobile, forcing traditional retailers to create effective mobile presences to protect against losing share to eCommerce peers. Even considering occasions when the retail transactions occur in-store, the consumer shopping experience often starts long before that, and likely involves online searches often on mobile devices. According to a survey by Nielson and xAd/Telmetrics, 46% of respondents rely exclusively on smartphones or tablets in conducting online research across a range of purchase categories. The study also found that 60% of smartphone users and 53% of tablet users completed purchases related to their mobile search, and importantly, 74% of smartphone users are completing transactions offline. It’s important to note some differences in mCommerce behavior between smartphone and tablet users. According to MarketLive research,smartphones are driving more traffic to U.S. Apparel and Accessories Retail sites (smartphones represent 28.4% of total online traffic vs. 12.5% from tablet), but tablets are responsible for more than 3x the revenue (smartphone users generated 3.9% of total eCommerce revenue vs. 14.4% from tablet users). These trends provide significant opportunities for mobile-optimized online advertisers, including Facebook, Google, Twitter, and Pandora, to help retailers with a brick-and-mortar presence not only survive, but take advantage of the growing impact mobile is having on retail. It also blurs the line between online and offline commerce, as seen in eBay’s efforts to drive physical sales for a number of retailers including Best Buy and Target.
Facebook is making headway in offline attribution, and recently announced increased functionality to help retailers close the loop from placing ads to tracking which users viewed a sponsored post and purchased a product. Retailers will be able to track effectiveness of campaigns given the customer data they already have—including customer emails and phone numbers—cross-referenced with the data users share with Facebook.
We note that many traditional retailers have been challenged as they try to adapt a desktop-optimized online presence to fit a smaller screen. Those that have been most successful are those that are executing under a mobile-first strategy and we believe
16
North America Equity Research09 January 2014
Doug Anmuth(1-212) [email protected]
2014 will be another year of mobile-first product roll-outs and mobile-optimized online presence. We highlight Groupon as an eCommerce company driven by mobilegiven 60M+ cumulative app downloads and 50%+ of North American transactions occurring on mobile.
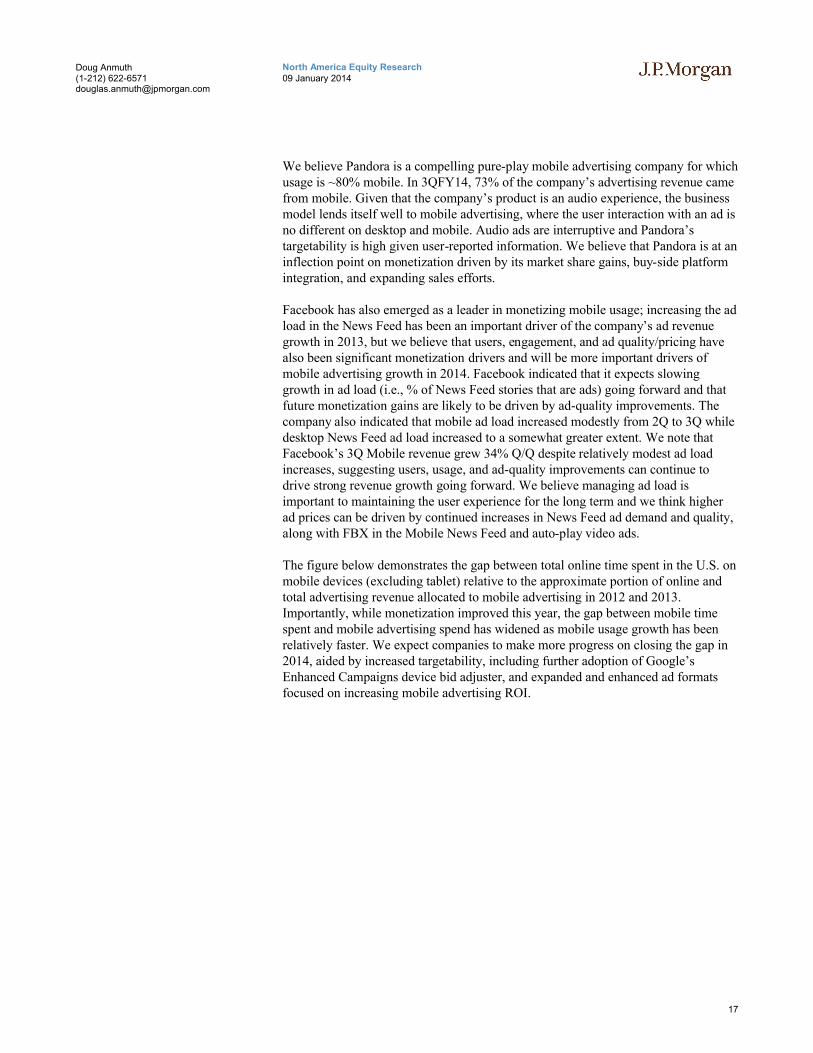
Holiday spending in 2013 paints a telling picture of the trends we expect to continue into 2014 regarding eCommerce and mCommerce. Cyber Monday mobile traffic grew 58% Y/Y in 2013 according to IBM, and accounted for 30% of total traffic. While traffic is important, we think what is even more important is the fact that 16% of the day’s sales were sourced from mobile/tablet. comScore’s estimates put the mobile portion a little lower at ~11%, but still material, and growing quickly. comScore estimates that mCommerce contributed $5.8B (+26% Y/Y) or roughly 11% to 3Q eCommerce revenue of $53.2B, while desktop contributed $47.5B, up 13% over last year’s figure.
Figure 8: Gap Between U.S. Time vs. Dollars Spent on mCommerce, eCommerce, and Total Retail
% of Minutes
42%
51%
11%16%
0.6% 1.0%0%
20%
40%
60%
2012 2013
Retail: Mobile Minutes as % of total Online Minutes (Nov-12 and Nov-13)
Retail: mCommerce as % of total eCommerce Sales (including tablet)Retail: mCommerce as % of total Retail Sales
Source: comScore total minutes in Nov-12 & Nov-13 U.S. on iPhone + Android as a % of iPhone, Android, and Desktop; eMarketer estimates for 2012 and 2014 mCommerce and eCommerce, total Retail sales from census.gov, includes Retail & Food ex Auto.
Mobile Advertising Revenue
In the U.S., companies are seeing increased mobile traffic, and are making progress in mobile monetization, but a significant gap remains between internet time spent on mobile and advertising revenue generated on mobile for many companies. We expect mobile paid search and mobile display advertising revenue to continue to gain share in 2014 as companies accelerate efforts to close the mobile monetization gap and the mobile experience improves for users.
Mobile already accounts for ~27% of search engine traffic, according to RKG, and while the revenue gap is closing at an accelerating pace, digital search dollars are still largely spent on desktop. eMarketer estimates that in 2010, only 2.1% of U.S. digital search dollars were spent on mobile, but that number has risen to 22.1% this year and may rise to 59.6% by 2017, representing $15.3B in mobile search spend. Within mobile, search attracts slightly more ad dollars than display—search represents 51.5% of the estimated $8.5B in mobile ad spend for 2013 in the U.S. while display represents 44.8% of the total, according to the same eMarketer study. However, search may be losing share over time to display, given the growth of mobile-friendly ad formats such as News Feed Ads, Sponsored Updates, and Promoted Tweets from Facebook, LinkedIn, Twitter, and others.
17
North America Equity Research09 January 2014
Doug Anmuth(1-212) [email protected]
We believe Pandora is a compelling pure-play mobile advertising company for which usage is ~80% mobile. In 3QFY14, 73% of the company’s advertising revenue came from mobile. Given that the company’s product is an audio experience, the business model lends itself well to mobile advertising, where the user interaction with an ad is no different on desktop and mobile. Audio ads are interruptive and Pandora’s targetability is high given user-reported information. We believe that Pandora is at an inflection point on monetization driven by its market share gains, buy-side platform integration, and expanding sales efforts.
Facebook has also emerged as a leader in monetizing mobile usage; increasing the ad load in the News Feed has been an important driver of the company’s ad revenue growth in 2013, but we believe that users, engagement, and ad quality/pricing have also been significant monetization drivers and will be more important drivers of mobile advertising growth in 2014. Facebook indicated that it expects slowing growth in ad load (i.e., % of News Feed stories that are ads) going forward and that future monetization gains are likely to be driven by ad-quality improvements. The company also indicated that mobile ad load increased modestly from 2Q to 3Q while desktop News Feed ad load increased to a somewhat greater extent. We note that Facebook’s 3Q Mobile revenue grew 34% Q/Q despite relatively modest ad load increases, suggesting users, usage, and ad-quality improvements can continue to drive strong revenue growth going forward. We believe managing ad load is important to maintaining the user experience for the long term and we think higher ad prices can be driven by continued increases in News Feed ad demand and quality, along with FBX in the Mobile News Feed and auto-play video ads.
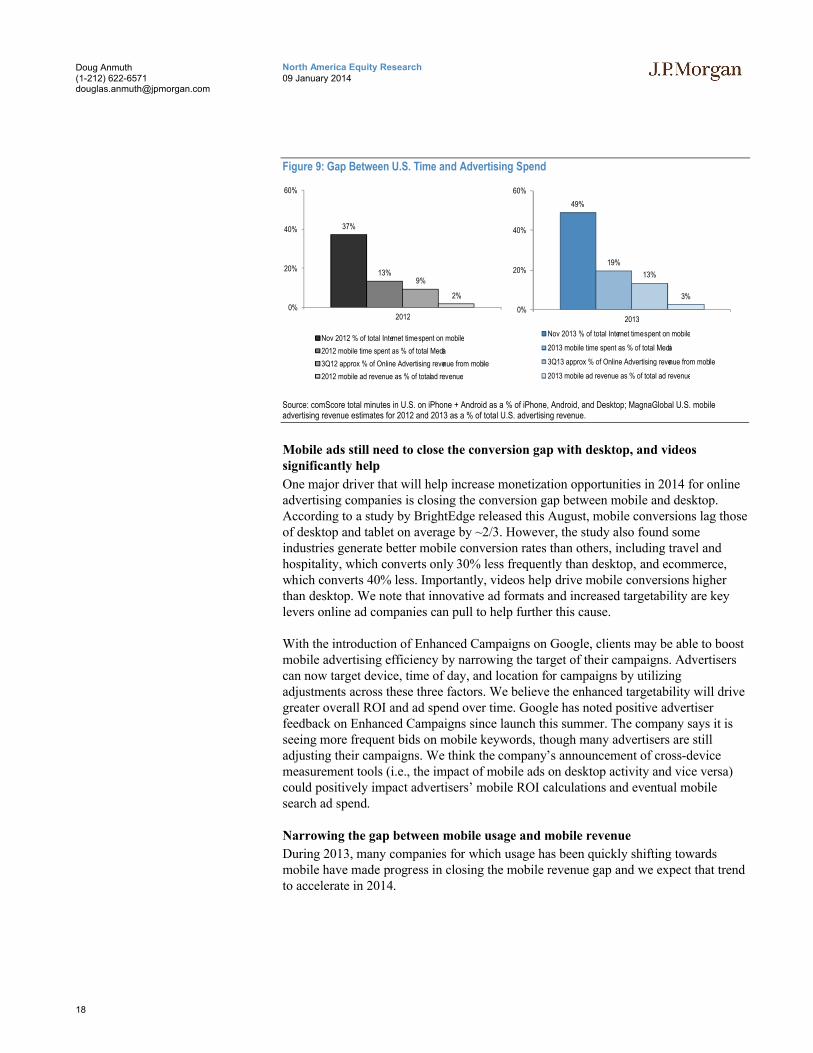
The figure below demonstrates the gap between total online time spent in the U.S. on mobile devices (excluding tablet) relative to the approximate portion of online and total advertising revenue allocated to mobile advertising in 2012 and 2013. Importantly, while monetization improved this year, the gap between mobile time spent and mobile advertising spend has widened as mobile usage growth has been relatively faster. We expect companies to make more progress on closing the gap in 2014, aided by increased targetability, including further adoption of Google’s Enhanced Campaigns device bid adjuster, and expanded and enhanced ad formats focused on increasing mobile advertising ROI.
18
North America Equity Research09 January 2014
Doug Anmuth(1-212) [email protected]
Figure 9: Gap Between U.S. Time and Advertising Spend
49%
19%
13%
3%
0%
20%
40%
60%
2013
Nov 2013 % of total Internet time spent on mobile
2013 mobile time spent as % of total Media
3Q13 approx % of Online Advertising revenue from mobile
2013 mobile ad revenue as % of total ad revenue
37%
13%9%
2%
0%
20%
40%
60%
2012
Nov 2012 % of total Internet time spent on mobile
2012 mobile time spent as % of total Media
3Q12 approx % of Online Advertising revenue from mobile
2012 mobile ad revenue as % of total ad revenue
Source: comScore total minutes in U.S. on iPhone + Android as a % of iPhone, Android, and Desktop; MagnaGlobal U.S. mobile advertising revenue estimates for 2012 and 2013 as a % of total U.S. advertising revenue.
Mobile ads still need to close the conversion gap with desktop, and videos significantly help
One major driver that will help increase monetization opportunities in 2014 for online advertising companies is closing the conversion gap between mobile and desktop. According to a study by BrightEdge released this August, mobile conversions lag those of desktop and tablet on average by ~2/3. However, the study also found some industries generate better mobile conversion rates than others, including travel and hospitality, which converts only 30% less frequently than desktop, and ecommerce, which converts 40% less. Importantly, videos help drive mobile conversions higher than desktop. We note that innovative ad formats and increased targetability are key levers online ad companies can pull to help further this cause.
With the introduction of Enhanced Campaigns on Google, clients may be able to boost mobile advertising efficiency by narrowing the target of their campaigns. Advertisers can now target device, time of day, and location for campaigns by utilizing adjustments across these three factors. We believe the enhanced targetability will drive greater overall ROI and ad spend over time. Google has noted positive advertiser feedback on Enhanced Campaigns since launch this summer. The company says it is seeing more frequent bids on mobile keywords, though many advertisers are still adjusting their campaigns. We think the company’s announcement of cross-device measurement tools (i.e., the impact of mobile ads on desktop activity and vice versa) could positively impact advertisers’ mobile ROI calculations and eventual mobilesearch ad spend.
Narrowing the gap between mobile usage and mobile revenue
During 2013, many companies for which usage has been quickly shifting towards mobile have made progress in closing the mobile revenue gap and we expect that trend to accelerate in 2014.
19
North America Equity Research09 January 2014
Doug Anmuth(1-212) [email protected]
We note that Pandora and Facebook are companies that stand out in achieving superior mobile monetization, making significant progress in closing the gap. These companies have been able to generate increased mobile advertising demand from higher-quality advertisers. Given the data these companies possess and innovation in mobile ad formats, they have benefited from a mix of pricing and volume increases. For example, Pandora’s video and audio ads command premium pricing to mobile display ads with CPMs in the $15-$25, $8-$12, and $5-$7 range, respectively. We expect these companies to continue to make progress towards mobile monetization and usage equality in 2014. We also highlight companies with significant potential to close larger monetization gaps, including Google. We believe Google has the targetability data, engagement, and ad tech innovation including Enhanced Campaigns to make material progress in closing its monetization gap in 2014.
20
North America Equity Research09 January 2014
Doug Anmuth(1-212) [email protected]
Native Ads to Drive Mobile Ad Monetization
We believe native ads are quickly becoming the de facto ad format on mobile and increasingly moving into desktop. Native ads are ads embedded in a NewsFeed or stream and in many cases closely resemble organic content, making them much more likely to get clicked on compared to historical banner display ads. According to MAGNA Global, mobile advertising, both display and search, is estimated to be $15.9B in 2014 and forecasted to grow to $20 billion in 2015 and $37 billion by 2018, on par with display. We think there is a significant shift to move advertising dollars toward native and news feed advertising, especially on mobile devices, which we believe will soon account for the majority of Internet usage time. We believe a growing interest in mobile advertising from brand advertisers coupled with improving mobile ad formats suited for smaller screen sizes should help to bridge the gap between time spent on mobile and mobile marketing spend. We believe companies that reach scale in users and rapidly improve mobile monetization will likely take share.
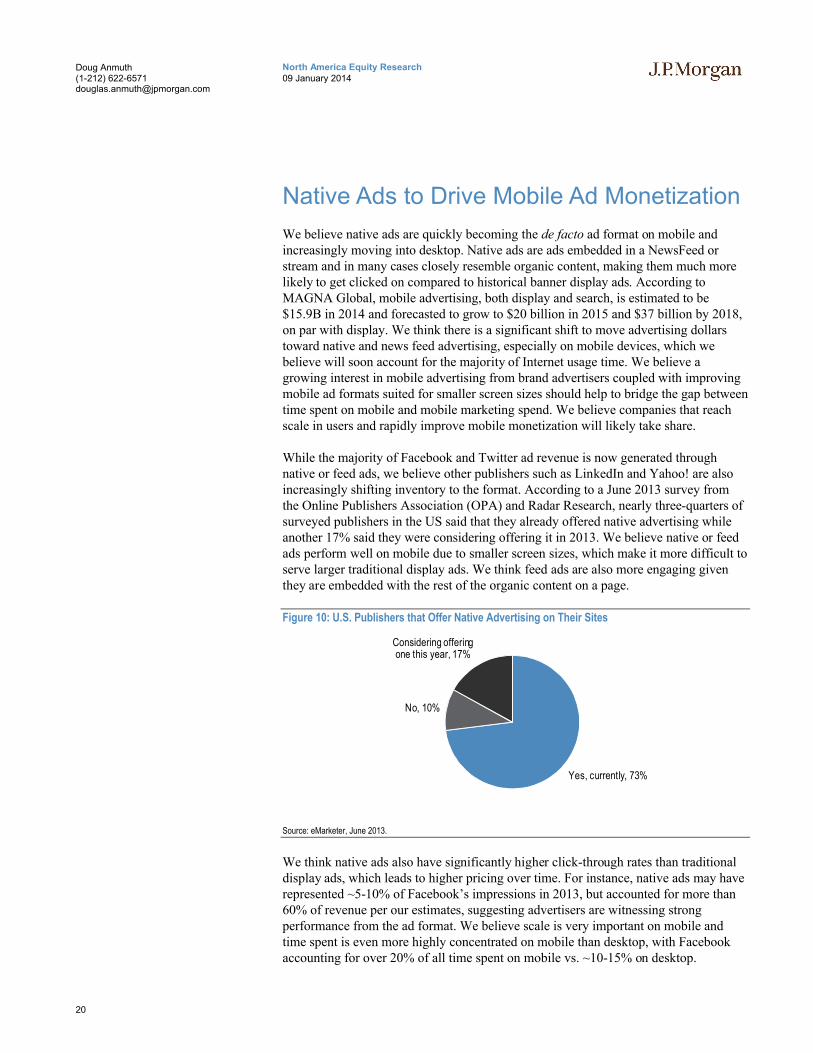
While the majority of Facebook and Twitter ad revenue is now generated through native or feed ads, we believe other publishers such as LinkedIn and Yahoo! are also increasingly shifting inventory to the format. According to a June 2013 survey from the Online Publishers Association (OPA) and Radar Research, nearly three-quarters of surveyed publishers in the US said that they already offered native advertising while another 17% said they were considering offering it in 2013. We believe native or feedads perform well on mobile due to smaller screen sizes, which make it more difficult to serve larger traditional display ads. We think feed ads are also more engaging given they are embedded with the rest of the organic content on a page.
Figure 10: U.S. Publishers that Offer Native Advertising on Their Sites
Yes, currently, 73%
No, 10%
Considering offering one this year, 17%
Source: eMarketer, June 2013.
We think native ads also have significantly higher click-through rates than traditional display ads, which leads to higher pricing over time. For instance, native ads may have represented ~5-10% of Facebook’s impressions in 2013, but accounted for more than 60% of revenue per our estimates, suggesting advertisers are witnessing strong performance from the ad format. We believe scale is very important on mobile and time spent is even more highly concentrated on mobile than desktop, with Facebook accounting for over 20% of all time spent on mobile vs. ~10-15% on desktop.
21
North America Equity Research09 January 2014
Doug Anmuth(1-212) [email protected]
Overall, we believe Twitter is in a similar position in monetization as Facebook was a bit more than a year ago when it had just turned on news feed ads across both desktop and mobile. That is to say the basic products are there and still being developed, and we believe it is early in building advertiser demand in the platform. However, we are clearly bullish on the shift of dollars toward news feed ads, particularly on mobile devices, and we expect Twitter to realize significant ARPU gains over time.
Twitter offers advertisers some basic re-targeting and programmatic capabilities today, though the company does not offer advertisers the ability to bid on individual impressions in real-time. We believe the addition of Twitter ad inventory on the MoPub Marketplace (i.e., MoPub’s ad exchange) should significantly accelerate Twitter’s efforts in RTB and drive higher monetization and ad pricing over time. We expect strong demand for Twitter’s RTB products from direct response advertisers but also from brand advertisers over time, and we note Facebook continues to witness strong demand for FBX (Facebook Exchange) ads both in the Desktop News Feed aswell as its Desktop Right Rail, and we expect FBX to soon move to mobile.
Twitter launched Promoted Tweets in the Timeline in April 2010. This was an early form of news feed advertising that was soon adopted by other companies. Facebook launched Sponsored Stories in the News Feed in January 2012 for the desktop and in March 2012 for mobile devices.
We believe LinkedIn is also making good progress with its Sponsored Content native ads. More than 1,000 advertisers are running Sponsored Updates, a single-digit percentage of LinkedIn advertisers on any given day. We believe the Sponsored Update ad load is running at around a mid-single-digit percentage of total pieces of content in the newsfeed. Also, similar to what can been seen at Facebook, Sponsored Updates have higher click-through rates, particularly on mobile, which currently accounts for 2/3 of LinkedIn’s Sponsored Updates revenue. LinkedIn noted that sponsored jobs in the feed have performed particularly well. We believe Sponsored Updates eCPMs are already higher than for LinkedIn’s traditional display ads and pricing should increase more as advertiser demand in the platform begins to build.
22
North America Equity Research09 January 2014
Doug Anmuth(1-212) [email protected]
Cross-Device Advertising and Attribution Becoming Critical
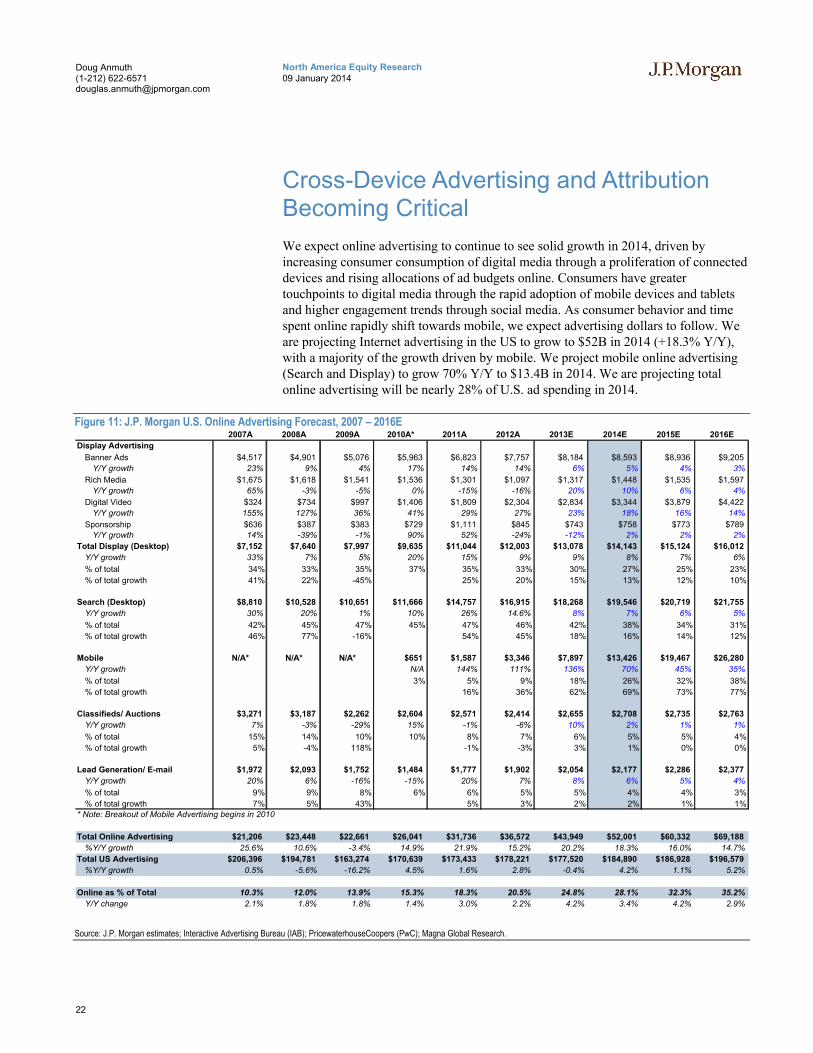
We expect online advertising to continue to see solid growth in 2014, driven by increasing consumer consumption of digital media through a proliferation of connected devices and rising allocations of ad budgets online. Consumers have greater touchpoints to digital media through the rapid adoption of mobile devices and tablets and higher engagement trends through social media. As consumer behavior and time spent online rapidly shift towards mobile, we expect advertising dollars to follow. We are projecting Internet advertising in the US to grow to $52B in 2014 (+18.3% Y/Y), with a majority of the growth driven by mobile. We project mobile online advertising (Search and Display) to grow 70% Y/Y to $13.4B in 2014. We are projecting total online advertising will be nearly 28% of U.S. ad spending in 2014.
Figure 11: J.P. Morgan U.S. Online Advertising Forecast, 2007 – 2016E2007A 2008A 2009A 2010A* 2011A 2012A 2013E 2014E 2015E 2016E
Display Advertising
Banner Ads $4,517 $4,901 $5,076 $5,963 $6,823 $7,757 $8,184 $8,593 $8,936 $9,205
Y/Y growth 23% 9% 4% 17% 14% 14% 6% 5% 4% 3%
Rich Media $1,675 $1,618 $1,541 $1,536 $1,301 $1,097 $1,317 $1,448 $1,535 $1,597
Y/Y growth 65% -3% -5% 0% -15% -16% 20% 10% 6% 4%
Digital Video $324 $734 $997 $1,406 $1,809 $2,304 $2,834 $3,344 $3,879 $4,422
Y/Y growth 155% 127% 36% 41% 29% 27% 23% 18% 16% 14%
Sponsorship $636 $387 $383 $729 $1,111 $845 $743 $758 $773 $789
Y/Y growth 14% -39% -1% 90% 52% -24% -12% 2% 2% 2%
Total Display (Desktop) $7,152 $7,640 $7,997 $9,635 $11,044 $12,003 $13,078 $14,143 $15,124 $16,012
Y/Y growth 33% 7% 5% 20% 15% 9% 9% 8% 7% 6%
% of total 34% 33% 35% 37% 35% 33% 30% 27% 25% 23%
% of total growth 41% 22% -45% 25% 20% 15% 13% 12% 10%
Search (Desktop) $8,810 $10,528 $10,651 $11,666 $14,757 $16,915 $18,268 $19,546 $20,719 $21,755
Y/Y growth 30% 20% 1% 10% 26% 14.6% 8% 7% 6% 5%
% of total 42% 45% 47% 45% 47% 46% 42% 38% 34% 31%
% of total growth 46% 77% -16% 54% 45% 18% 16% 14% 12%
Mobile N/A* N/A* N/A* $651 $1,587 $3,346 $7,897 $13,426 $19,467 $26,280
Y/Y growth N/A 144% 111% 136% 70% 45% 35%
% of total 3% 5% 9% 18% 26% 32% 38%
% of total growth 16% 36% 62% 69% 73% 77%
Classifieds/ Auctions $3,271 $3,187 $2,262 $2,604 $2,571 $2,414 $2,655 $2,708 $2,735 $2,763
Y/Y growth 7% -3% -29% 15% -1% -6% 10% 2% 1% 1%
% of total 15% 14% 10% 10% 8% 7% 6% 5% 5% 4%
% of total growth 5% -4% 118% -1% -3% 3% 1% 0% 0%
Lead Generation/ E-mail $1,972 $2,093 $1,752 $1,484 $1,777 $1,902 $2,054 $2,177 $2,286 $2,377
Y/Y growth 20% 6% -16% -15% 20% 7% 8% 6% 5% 4%
% of total 9% 9% 8% 6% 6% 5% 5% 4% 4% 3%
% of total growth 7% 5% 43% 5% 3% 2% 2% 1% 1%
* Note: Breakout of Mobile Advertising begins in 2010
Total Online Advertising $21,206 $23,448 $22,661 $26,041 $31,736 $36,572 $43,949 $52,001 $60,332 $69,188
%Y/Y growth 25.6% 10.6% -3.4% 14.9% 21.9% 15.2% 20.2% 18.3% 16.0% 14.7%
Total US Advertising $206,396 $194,781 $163,274 $170,639 $173,433 $178,221 $177,520 $184,890 $186,928 $196,579
%Y/Y growth 0.5% -5.6% -16.2% 4.5% 1.6% 2.8% -0.4% 4.2% 1.1% 5.2%
Online as % of Total 10.3% 12.0% 13.9% 15.3% 18.3% 20.5% 24.8% 28.1% 32.3% 35.2%
Y/Y change 2.1% 1.8% 1.8% 1.4% 3.0% 2.2% 4.2% 3.4% 4.2% 2.9%
Source: J.P. Morgan estimates; Interactive Advertising Bureau (IAB); PricewaterhouseCoopers (PwC); Magna Global Research.

23
North America Equity Research09 January 2014
Doug Anmuth(1-212) [email protected]
Advertising continues to shift online and, as people spend more time on various devices at different times of the day at different locations, advertisers are looking for ways to reach consumers at multiple touchpoints throughout the day. We believe there is less of an emphasis on desktop vs. mobile and a greater focus on the right context. There is less separation of usage times across various devices, as seen in the figure below. A typical Internet user is on several devices simultaneously throughout the day and now second or even third screen experiences are fairly constant. We believe it is critical for advertisers to use new tools to target their advertising effectively and they need to be able to track/measure behavior across devices as users are on multiple devices throughout the day. Several of the largest online advertisers have already begun shifting their products in this direction, particularly the companies for which users are and can be logged in across various devices and services. As shown in Figure 12 below, mobile phone and tablet activity spikes in the evening hours.
Figure 12: Share of Daily Traffic by Device
0%
1%
2%
3%
4%
5%
6%
7%
8%
9%
10%
12:00 AM 4:00 AM 8:00 AM 12:00 PM 4:00 PM 8:00 PM
Sh
are
of
Dai
ly D
evic
e Tr
affic
Tablet Mobile Computer
Source: comScore.
Google launches Estimated Cross-Device Conversions
In November 2013, Google launched Estimated Cross-Device Conversions (ECDC) in AdWords as a part of the new Estimated Total Conversions (ETC) product. Other products to come in the ETC series will include phone calls and in-store visits. ECDC is aimed at providing advertisers with data to reflect the impact of an advertiser’s campaigns across various devices. This is a natural progression of Google’s holistic perspective of online advertising that is highlighted in Enhanced Campaigns. Enhanced Campaigns allow advertisers to reach users on all devices through a single AdWords campaign where the context of the user is of greater focus rather than just looking at which device they are using. Through ETC products, Google is creating analytics tools to measure conversions that start with an AdWords click that leads to a transaction completed on any device, on the phone, or in-store.
Google estimates ECDC based on aggregate data from users who are signed into the Google accounts across multiple devices, which is used to create an anonymous and aggregate estimate for the number of cross-device conversions attributed to AdWords.
24
North America Equity Research09 January 2014
Doug Anmuth(1-212) [email protected]
ECDC uses last paid click attribution so that the conversions are attributed to the ad that was last clicked before the transaction, lead submission, or other call to action was placed. Google currently calculates ECDC for conversion paths that start from a Google search but the company is looking for ways to capture cross-device conversions from display and other search networks. In early tests, Google reported that the entertainment vertical saw the largest increase of conversions at 12%, travel and technology at 8%, retail at 7%, and local at 2%. Going forward, we expect Google to continue to add additional tools for other conversion types such as phone calls and in-store visits. Early checks with SEMs suggest some advertisers using ECDC are seeing an increase in conversions as high as 33%.
Facebook expected to further enable cross-device targeting
Facebook is another online platform where users are signed in across multiple devices. Though not yet available, Facebook Exchange (FBX) ads will soon become available in the mobile News Feed, we believe. As a reminder, FBX enables real-time bidding driven by advertisers’ cookie-based data rather than simply targeting through broad demographics or interests. We believe the incorporation of FBX ads into Facebook’s mobile News Feed will be material. For example, if a user visits an online travel site at work on a desktop but leaves before the check-out process, that OTA can re-target the same user on Facebook with additional messages or offers when they check their mobile app later at home.
Facebook also offers Custom Audiences, a product that allows advertisers to upload customer information gathered from their offline customers such as emails, user IDs, or phone numbers and target them on Facebook. We are encouraged that Facebook’s ability to leverage third-party data through the Facebook Exchange (FBX) and Custom Audiences can drive improvements in yield. Third-party data through FBX and Custom Audiences pushes Facebook further down the purchase funnel, driving higher ROI and ad spend. We look for further investments and advertiser tools to further enable these actions in 2014.
Twitter launches retargeting with Tailored Audiences
Twitter rolled out Tailored Audiences (TA) globally in November 2013. TA enables ad retargeting on Twitter’s platform using user behavior on other websites. Since the beta test began in July, Twitter has reported seeing strong results. HubSpot reported seeing a 45% lift in engagement rates, Krossover saw a 74% decrease in cost per customer acquisition (CPA), and New Relic saw 195% higher conversion rates. Ad partners that are helping Twitter with TA include Adara, AdRoll, BlueKai, Chango, DataXu, Dstillery, Lotame, Quantcast, ValueClick, and [x+1]. We believe retargeting will be an effective tool for Twitter’s advertisers given the platform’s advantage on mobile devices and we look for more dynamic cross-device ad targeting tools to come.
25
North America Equity Research09 January 2014
Doug Anmuth(1-212) [email protected]
Traditional Media Measurement Tools to Drive Traditional Media Dollars Online
We think 2014 is going to be a breakthrough year for traditional media measurement shifting online given YouTube adoption of Nielsen OCR, Nielsen’s likely measurement of Internet radio, and social audience measurement with key partners including Twitter and Facebook. Fragmentation of consumer time and attention across channels, devices, operating systems, and time periods is driving the multi-channel measurement trends and creating a growing need among advertisers and content creators for consistent measurement across mediums. Consumers are more frequently engaging with brands in multiple physical and digital formats before making a purchase decision and brands need help connecting the dots between online and offline touch-points. Additionally, advertisers such as Google, Twitter, and Facebook are working with traditional measurement leaders because they seek objective, third-party sources for complex cross-channel ROI and conversion metrics. Importantly, we think multi-channel measurement trends will accelerate the secular shift of dollars from traditional media including TV and radio towards digital. (Note: Nielsen Holdings is covered by J.P. Morgan’s Business, Information and Education Services analyst Andrew Steinerman.)
Nielsen OCR measurement of YouTube could drive material change in TV buyer behavior
This November, Google announced that it was letting Nielsen place measurement tags on ads running on YouTube, after resisting the idea of OCR measurement for some time as the company continues to build its own measurement options. Google realizes that its clients want meaningful measurement and brand-friendly metrics, and it now believes that partnering with industry leaders like Nielsen and comScore to offer objective credentialed third-party measurement will enhance advertiser demand. We believe OCR measurement of YouTube will be impactful in increasing the site’s advertising revenue throughout 2014. According to Google’s latest YouTube Insights research from October 2013—which quotes data provided by Nielsen—more consumers already watch YouTube than cable networks and 63% of campaigns targeting 18-34 year olds would benefit from a shift to YouTube from TV given increased potential reach. In fact, YouTube commands higher reach than any major cable network among males 18-24, 18-34, 18-49, and females 18-49 and 25-54. Nielson OCR tags should accelerate the shift of TV dollars online.

26
North America Equity Research09 January 2014
Doug Anmuth(1-212) [email protected]
Figure 13: YouTube’s Reach, as Measured by Nielsen
% Reach
48%
Reach of YouTube
CMDY TBSC FX MTV SPK TNT AMC ESPN AEN
Males 18-34
48%
Reach of YouTube
CMDY TBSC FX MTV SPK ESPN USA AMC TNT
Males 18-24
47%
Reach of YouTube
TBSC FX CMDY TNT ESPN SPK DISC AEN AMC
Males 18-49
47%
TBSC FX TNT Reach of YouTube
CMDY DISC ESPN AEN AMC HIST
Males 25-54
51%
Reach of YouTube
TBSC FX AEN TNT LIF TLC FAM E! MTV
Females 25-54
49%
Reach of YouTube
TBSC FX MTV FAM AEN E! TLC TNT DSNY
Females 18-49
46%
MTV TBSC Reach of YouTube
FX FAM E! TLC DSNY AEN CMDY
Females 18-34
40%
MTV FAM FX TBSC E! Reach of YouTube
NICK TLC CMDY AEN
Females 18-24
Source: Nielsen, August 2013, Google Insights, J.P. Morgan estimates.
Social audience measurement enhancing TV ratings potential
Twitter and Nielsen launched an exclusive partnership called Nielsen Twitter TV Rating in October. This partnership will help measure the reach of Tweets across TV programming and we believe it will help demonstrate the value of Twitter as an ad platform, especially for TV advertisers. Nielsen is the first partner to receive Twitter’s reach data and has already published several reports and studies demonstrating Twitter’s relationship with TV. As of 2Q13, Nielsen recorded a 38% increase in Tweets about TV to 263M from 190M in 2Q12 and a 24% increase in Twitter TV authors to 19M vs. 15M in 2Q12. On average, the audience viewing Tweets is 50x greater than the number of authors Tweeting. This means for every 1,000 users Tweeting about a program, over 50,000 users are seeing those Tweets.
The relationship between Twitter and TV is also impacting the way we watch TV.Nielsen has found that Twitter drives tune-ins to new programming, but a growing number of people are also Tweeting more about shows they are already watching in real-time. According to Paul Donato, Nielsen’s Chief Research Officer, a spike in TV ratings can increase the volume of Tweets, and a spike in Tweets can lead to an increase in tune-ins. Nielsen reported in August 2013 that Tweets influenced TV ratings of 29% of episodes measured, and TV ratings drove higher Tweet volume for 48% of the episodes measured. We believe the relationship between Twitter and TV will continue to grow, along with the proliferation of mobile devices as a second screen.
27
North America Equity Research09 January 2014
Doug Anmuth(1-212) [email protected]
In November, Twitter announced the expansion of its TV targeting suite calledTV Conversation targeting. Now available to advertisers in the U.S. and UK, TVConversation targeting enables networks and brands to connect with Twitter users that are already engaging in conversations or status updates regarding TV programming. Early partners in this new product include Betfair, Dominos, and British Sky Broadcasting. Twitter plans to roll out this new targeting feature to Brazil, Canada, France, and Spain in the near future.
Facebook is also working with Nielsen on TV measurement efforts and has been for years. The companies have partnered—in a privacy-protected way—to provide performance data to advertisers through Nielsen OCR. The large user base and reliability of age and gender data that have helped Facebook attract its own advertisers has also helped Nielsen enhance its OCR product and we expect continued partnership to drive improvements in multi-channel measurement. Over time, the relationship is expanding with a newer focus on helping to improve video-viewing measurement on mobile.
Expect streaming audio measurement to similarly impact radio advertising
Just as we are seeing a shift in digital video measurement with YouTube, we expect streaming music providers including Pandora to gravitate towards partnerships with traditional measurement providers. Nielsen already took the first step in transforming audio measurement this fall when it completed its acquisition of Arbitron, a leading radio ratings company. Nielsen noted at its Investor Day this past December that it is deeply engaged in developing the technology to measure streaming radio and it is working to fully integrate Nielsen Audio. Further, measuring streaming radio is in line with the company’s mission to measure all media consumption and it realizes that digital audio measurement is key to the future of radio advertising. We believe Nielsen can move quickly in its streaming music measurement goals by leveraging what the company already does in digital video measurement. Still, Nielsen may have work to do in encouraging common digital audio metrics within the radio industry, which could take some time.
Over the last 1-2 years, as a part of Pandora’s multi-stage process to compete on an even playing field with traditional broadcast radio, the company has: 1) securedmeasurement of its service by Triton Digital; 2) become integrated into the two largest radio buy-side ad platforms, which represent ~80% of the roughly $15B annual broadcast radio ad spend opportunity; 3) continued to grow its U.S. radio market share to 8.6%; 4) expanded its local sales force of experienced local radio ad sales professionals; and 5) started to enhance targeting capabilities by cross-referencing user-provided and third-party demographic data. One of the few points of friction that still remains for some potential advertising clients—likely some of the more traditional local radio ad buyers—is that Pandora has not yet been measured by Arbitron (now Nielson Audio), the leader in U.S. radio ratings. While Triton measurements are already displayed in a format that is comparable to Nielson Audio’s AQH method, we believe that a true apples-to-apples comparison by a single measurement provider and leader in its field may push some remaining advertisers over the hurdle in embracing Pandora as a compelling advertising medium. We expect to see increased advertiser demand when Nielsen Audio commences its anticipated streaming radio measurement, and are confident that Pandora’s ability to deliver attractive ROIs will be a driver of advertising sell-through rate and pricing over time.
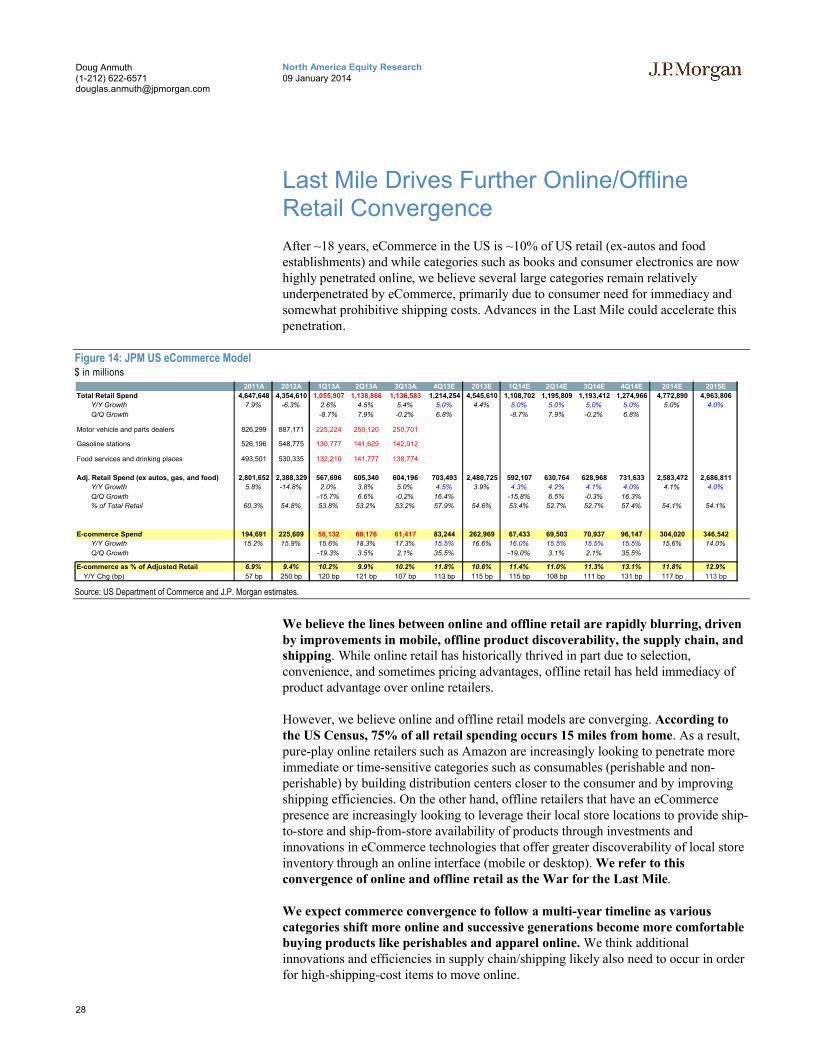
28
North America Equity Research09 January 2014
Doug Anmuth(1-212) [email protected]
Last Mile Drives Further Online/Offline Retail Convergence
After ~18 years, eCommerce in the US is ~10% of US retail (ex-autos and food establishments) and while categories such as books and consumer electronics are now highly penetrated online, we believe several large categories remain relatively underpenetrated by eCommerce, primarily due to consumer need for immediacy and somewhat prohibitive shipping costs. Advances in the Last Mile could accelerate this penetration.
Figure 14: JPM US eCommerce Model$ in millions
2011A 2012A 1Q13A 2Q13A 3Q13A 4Q13E 2013E 1Q14E 2Q14E 3Q14E 4Q14E 2014E 2015E
Total Retail Spend 4,647,648 4,354,610 1,055,907 1,138,866 1,136,583 1,214,254 4,545,610 1,108,702 1,195,809 1,193,412 1,274,966 4,772,890 4,963,806
Y/Y Growth 7.9% -6.3% 2.6% 4.5% 5.4% 5.0% 4.4% 5.0% 5.0% 5.0% 5.0% 5.0% 4.0%
Q/Q Growth -8.7% 7.9% -0.2% 6.8% -8.7% 7.9% -0.2% 6.8%
Motor vehicle and parts dealers 826,299 887,171 225,224 250,120 250,701
Gasoline stations 526,196 548,775 130,777 141,629 142,912
Food services and drinking places 493,501 530,335 132,210 141,777 138,774
Adj. Retail Spend (ex autos, gas, and food) 2,801,652 2,388,329 567,696 605,340 604,196 703,493 2,480,725 592,107 630,764 628,968 731,633 2,583,472 2,686,811
Y/Y Growth 5.8% -14.8% 2.0% 3.8% 5.0% 4.5% 3.9% 4.3% 4.2% 4.1% 4.0% 4.1% 4.0%
Q/Q Growth -15.7% 6.6% -0.2% 16.4% -15.8% 6.5% -0.3% 16.3%
% of Total Retail 60.3% 54.8% 53.8% 53.2% 53.2% 57.9% 54.6% 53.4% 52.7% 52.7% 57.4% 54.1% 54.1%
E-commerce Spend 194,691 225,609 58,132 60,176 61,417 83,244 262,969 67,433 69,503 70,937 96,147 304,020 346,542
Y/Y Growth 15.2% 15.9% 15.6% 18.3% 17.3% 15.5% 16.6% 16.0% 15.5% 15.5% 15.5% 15.6% 14.0%
Q/Q Growth -19.3% 3.5% 2.1% 35.5% -19.0% 3.1% 2.1% 35.5%
E-commerce as % of Adjusted Retail 6.9% 9.4% 10.2% 9.9% 10.2% 11.8% 10.6% 11.4% 11.0% 11.3% 13.1% 11.8% 12.9%
Y/Y Chg (bp) 57 bp 250 bp 120 bp 121 bp 107 bp 113 bp 115 bp 115 bp 108 bp 111 bp 131 bp 117 bp 113 bp
Source: US Department of Commerce and J.P. Morgan estimates.
We believe the lines between online and offline retail are rapidly blurring, driven by improvements in mobile, offline product discoverability, the supply chain, and shipping. While online retail has historically thrived in part due to selection, convenience, and sometimes pricing advantages, offline retail has held immediacy of product advantage over online retailers.
However, we believe online and offline retail models are converging. According to the US Census, 75% of all retail spending occurs 15 miles from home. As a result, pure-play online retailers such as Amazon are increasingly looking to penetrate more immediate or time-sensitive categories such as consumables (perishable and non-perishable) by building distribution centers closer to the consumer and by improving shipping efficiencies. On the other hand, offline retailers that have an eCommerce presence are increasingly looking to leverage their local store locations to provide ship-to-store and ship-from-store availability of products through investments and innovations in eCommerce technologies that offer greater discoverability of local store inventory through an online interface (mobile or desktop). We refer to this convergence of online and offline retail as the War for the Last Mile.
We expect commerce convergence to follow a multi-year timeline as various categories shift more online and successive generations become more comfortable buying products like perishables and apparel online. We think additional innovations and efficiencies in supply chain/shipping likely also need to occur in order for high-shipping-cost items to move online.
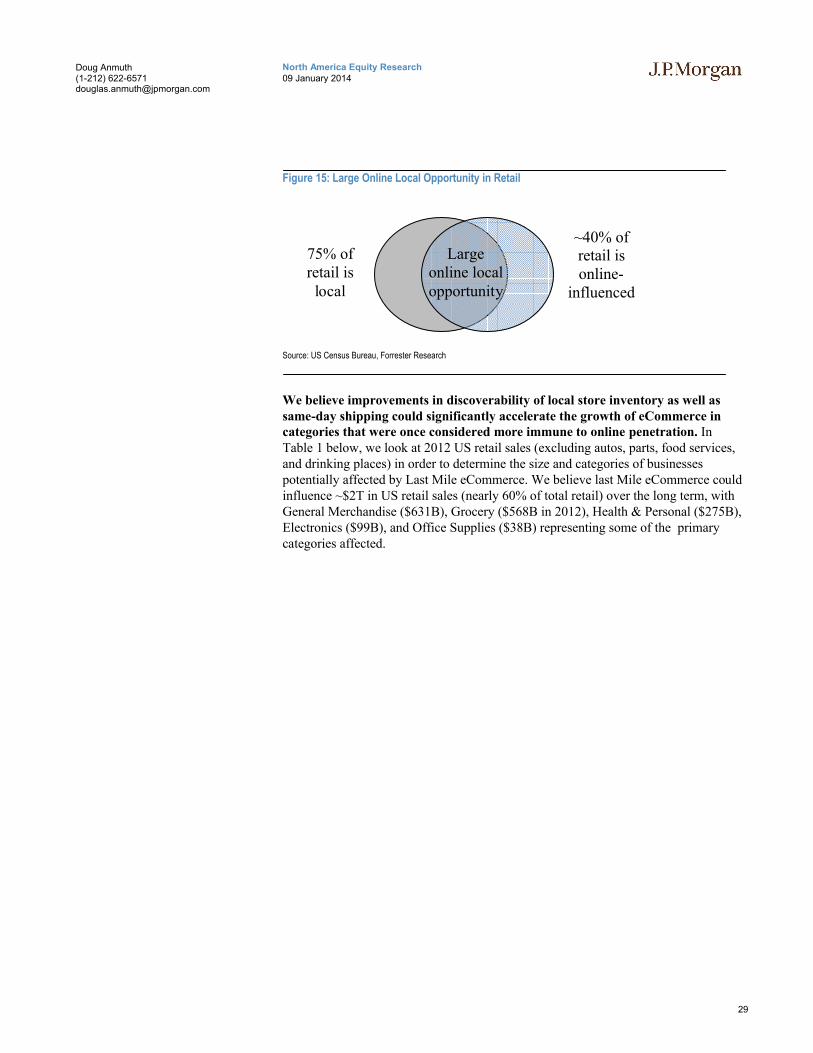
29
North America Equity Research09 January 2014
Doug Anmuth(1-212) [email protected]
Figure 15: Large Online Local Opportunity in Retail
Source: US Census Bureau, Forrester Research
We believe improvements in discoverability of local store inventory as well as same-day shipping could significantly accelerate the growth of eCommerce in categories that were once considered more immune to online penetration. In Table 1 below, we look at 2012 US retail sales (excluding autos, parts, food services, and drinking places) in order to determine the size and categories of businesses potentially affected by Last Mile eCommerce. We believe last Mile eCommerce could influence ~$2T in US retail sales (nearly 60% of total retail) over the long term, with General Merchandise ($631B), Grocery ($568B in 2012), Health & Personal ($275B), Electronics ($99B), and Office Supplies ($38B) representing some of the primary categories affected.
~40% of retail is online-
influenced
75% of retail is local
Large online local opportunity
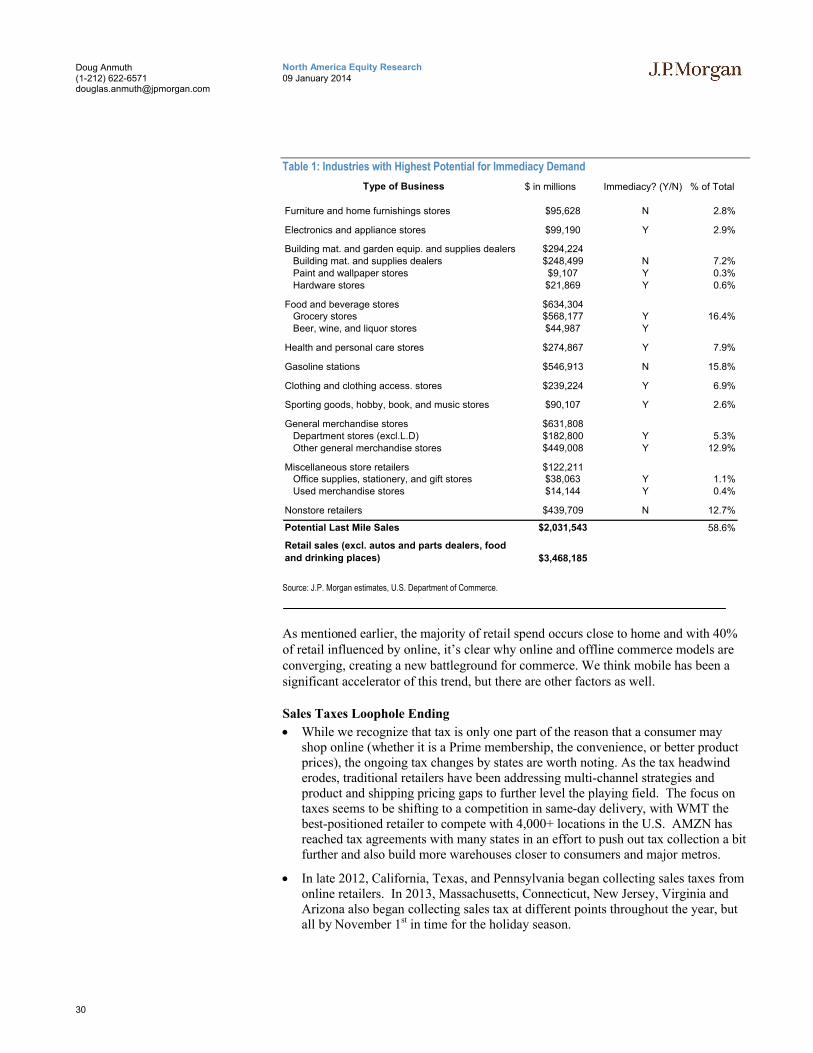
30
North America Equity Research09 January 2014
Doug Anmuth(1-212) [email protected]
Table 1: Industries with Highest Potential for Immediacy Demand
Type of Business $ in millions Immediacy? (Y/N) % of Total
Furniture and home furnishings stores $95,628 N 2.8%
Electronics and appliance stores $99,190 Y 2.9%
Building mat. and garden equip. and supplies dealers $294,224Building mat. and supplies dealers $248,499 N 7.2%Paint and wallpaper stores $9,107 Y 0.3%Hardware stores $21,869 Y 0.6%
Food and beverage stores $634,304Grocery stores $568,177 Y 16.4%Beer, wine, and liquor stores $44,987 Y
Health and personal care stores $274,867 Y 7.9%
Gasoline stations $546,913 N 15.8%
Clothing and clothing access. stores $239,224 Y 6.9%
Sporting goods, hobby, book, and music stores $90,107 Y 2.6%
General merchandise stores $631,808Department stores (excl.L.D) $182,800 Y 5.3%Other general merchandise stores $449,008 Y 12.9%
Miscellaneous store retailers $122,211Office supplies, stationery, and gift stores $38,063 Y 1.1%Used merchandise stores $14,144 Y 0.4%
Nonstore retailers $439,709 N 12.7%
Potential Last Mile Sales $2,031,543 58.6%
Retail sales (excl. autos and parts dealers, food
and drinking places) $3,468,185
Source: J.P. Morgan estimates, U.S. Department of Commerce.
As mentioned earlier, the majority of retail spend occurs close to home and with 40% of retail influenced by online, it’s clear why online and offline commerce models are converging, creating a new battleground for commerce. We think mobile has been a significant accelerator of this trend, but there are other factors as well.
Sales Taxes Loophole Ending
While we recognize that tax is only one part of the reason that a consumer may shop online (whether it is a Prime membership, the convenience, or better product prices), the ongoing tax changes by states are worth noting. As the tax headwind erodes, traditional retailers have been addressing multi-channel strategies and product and shipping pricing gaps to further level the playing field. The focus on taxes seems to be shifting to a competition in same-day delivery, with WMT the best-positioned retailer to compete with 4,000+ locations in the U.S. AMZN has reached tax agreements with many states in an effort to push out tax collection a bit further and also build more warehouses closer to consumers and major metros.
In late 2012, California, Texas, and Pennsylvania began collecting sales taxes from online retailers. In 2013, Massachusetts, Connecticut, New Jersey, Virginia and Arizona also began collecting sales tax at different points throughout the year, but all by November 1st in time for the holiday season.
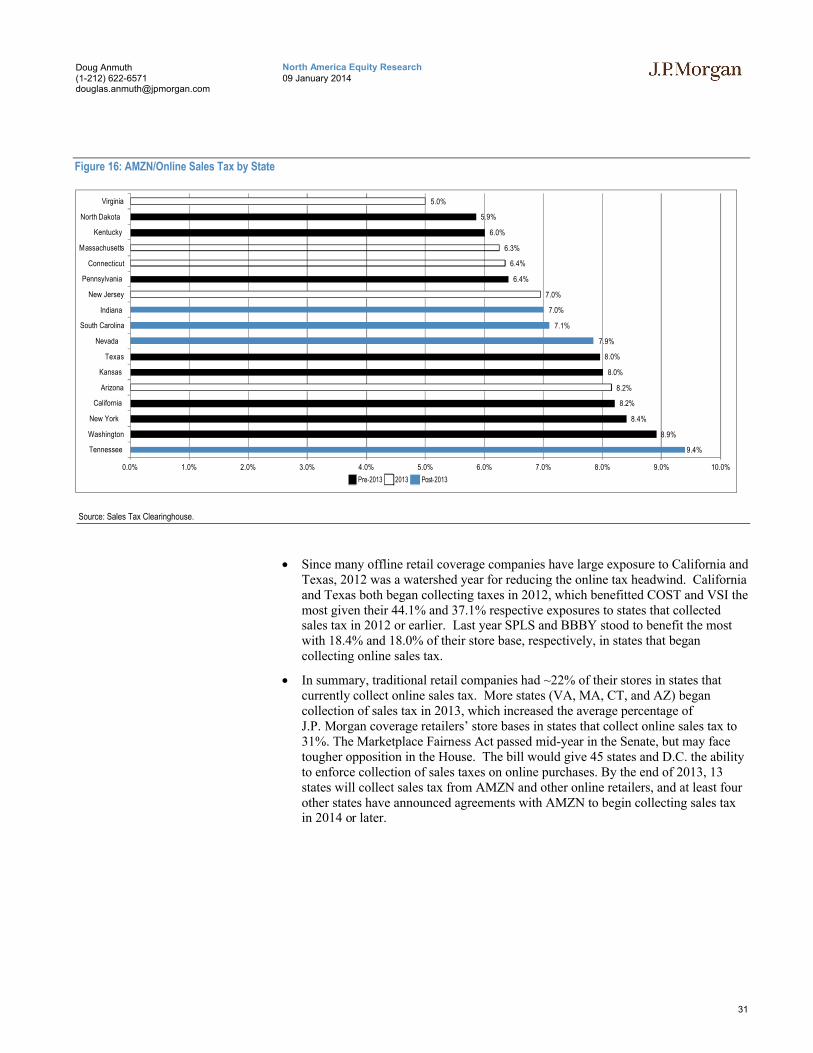
31
North America Equity Research09 January 2014
Doug Anmuth(1-212) [email protected]
Figure 16: AMZN/Online Sales Tax by State
9.4%
8.9%
8.4%
8.2%
8.2%
8.0%
8.0%
7.9%
7.1%
7.0%
7.0%
6.4%
6.4%
6.3%
6.0%
5.9%
5.0%
0.0% 1.0% 2.0% 3.0% 4.0% 5.0% 6.0% 7.0% 8.0% 9.0% 10.0%
Tennessee
Washington
New York
California
Arizona
Kansas
Texas
Nevada
South Carolina
Indiana
New Jersey
Pennsylvania
Connecticut
Massachusetts
Kentucky
North Dakota
Virginia
Pre-2013 2013 Post-2013
Source: Sales Tax Clearinghouse.
Since many offline retail coverage companies have large exposure to California and Texas, 2012 was a watershed year for reducing the online tax headwind. California and Texas both began collecting taxes in 2012, which benefitted COST and VSI the most given their 44.1% and 37.1% respective exposures to states that collected sales tax in 2012 or earlier. Last year SPLS and BBBY stood to benefit the most with 18.4% and 18.0% of their store base, respectively, in states that began collecting online sales tax.
In summary, traditional retail companies had ~22% of their stores in states that currently collect online sales tax. More states (VA, MA, CT, and AZ) began collection of sales tax in 2013, which increased the average percentage of J.P. Morgan coverage retailers’ store bases in states that collect online sales tax to 31%. The Marketplace Fairness Act passed mid-year in the Senate, but may face tougher opposition in the House. The bill would give 45 states and D.C. the ability to enforce collection of sales taxes on online purchases. By the end of 2013, 13 states will collect sales tax from AMZN and other online retailers, and at least four other states have announced agreements with AMZN to begin collecting sales tax in 2014 or later.
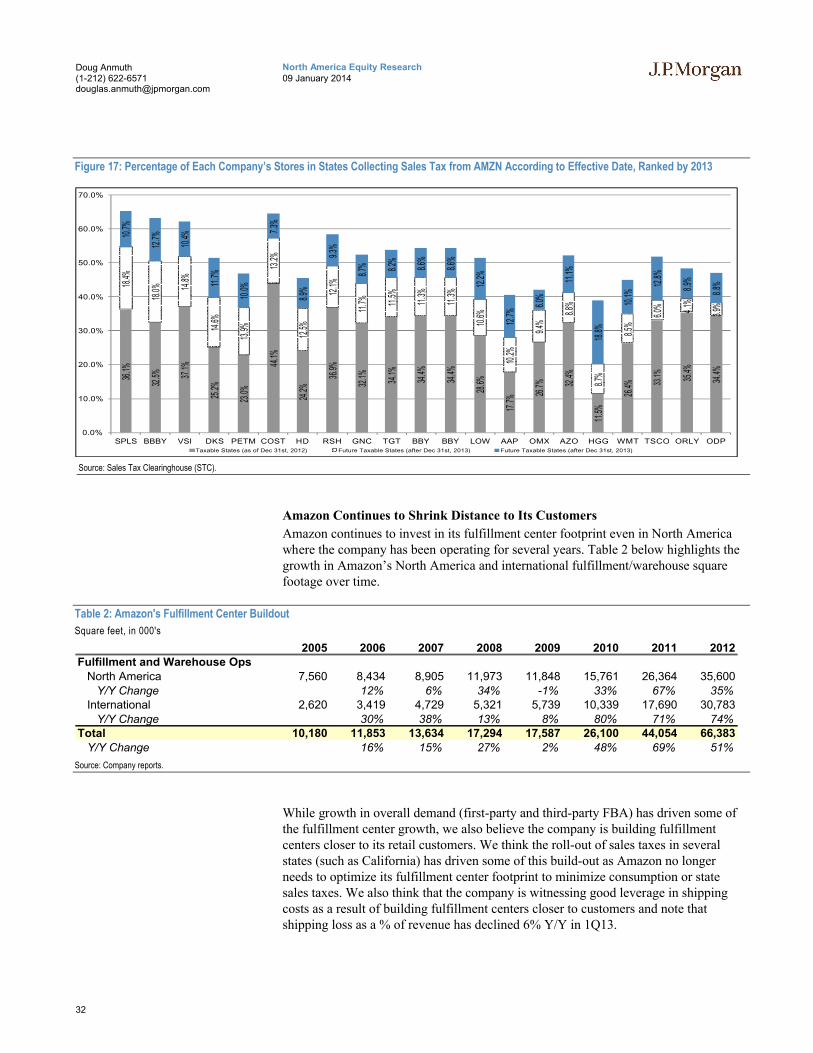
32
North America Equity Research09 January 2014
Doug Anmuth(1-212) [email protected]
Figure 17: Percentage of Each Company’s Stores in States Collecting Sales Tax from AMZN According to Effective Date, Ranked by 2013
36.1%
32.5% 37
.1%
25.2%
23.0%
44.1%
24.2%
36.9%
32.1
%
34.1%
34.4
%
34.4
%
28.6%
17.7%
26.7
% 32.4%
11.5%
26.4% 33
.1% 35.4%
34.4
%
18.4%
18.0
% 14.8%
14.6%
13.9
%
13.2%
12.5%
12.1%
11.7
%
11.5
%
11.3
%
11.3
%
10.6%
10.2%
9.4%
8.8%
8.7%
8.5%
6.0% 4.1%
3.9%
10.7%
12.7%
10.4%
11.7%
10.0%
7.3%
8.9%
9.3%
8.7% 8.2
%
8.6%
8.6%
12.2
%
12.7%
6.0%
11.1%
18.8%
10.1%
12.8
%
8.9%
8.8%
0.0%
10.0%
20.0%
30.0%
40.0%
50.0%
60.0%
70.0%
SPLS BBBY VSI DKS PETM COST HD RSH GNC TGT BBY BBY LOW AAP OMX AZO HGG WMT TSCO ORLY ODPTaxable States (as of Dec 31st, 2012) Future Taxable States (after Dec 31st, 2013) Future Taxable States (after Dec 31st, 2013)
Source: Sales Tax Clearinghouse (STC).
Amazon Continues to Shrink Distance to Its Customers
Amazon continues to invest in its fulfillment center footprint even in North America where the company has been operating for several years. Table 2 below highlights the growth in Amazon’s North America and international fulfillment/warehouse square footage over time.
Table 2: Amazon's Fulfillment Center Buildout
Square feet, in 000's
2005 2006 2007 2008 2009 2010 2011 2012Fulfillment and Warehouse Ops
North America 7,560 8,434 8,905 11,973 11,848 15,761 26,364 35,600Y/Y Change 12% 6% 34% -1% 33% 67% 35%
International 2,620 3,419 4,729 5,321 5,739 10,339 17,690 30,783Y/Y Change 30% 38% 13% 8% 80% 71% 74%
Total 10,180 11,853 13,634 17,294 17,587 26,100 44,054 66,383Y/Y Change 16% 15% 27% 2% 48% 69% 51%
Source: Company reports.
While growth in overall demand (first-party and third-party FBA) has driven some of the fulfillment center growth, we also believe the company is building fulfillment centers closer to its retail customers. We think the roll-out of sales taxes in several states (such as California) has driven some of this build-out as Amazon no longer needs to optimize its fulfillment center footprint to minimize consumption or state sales taxes. We also think that the company is witnessing good leverage in shipping costs as a result of building fulfillment centers closer to customers and note that shipping loss as a % of revenue has declined 6% Y/Y in 1Q13.
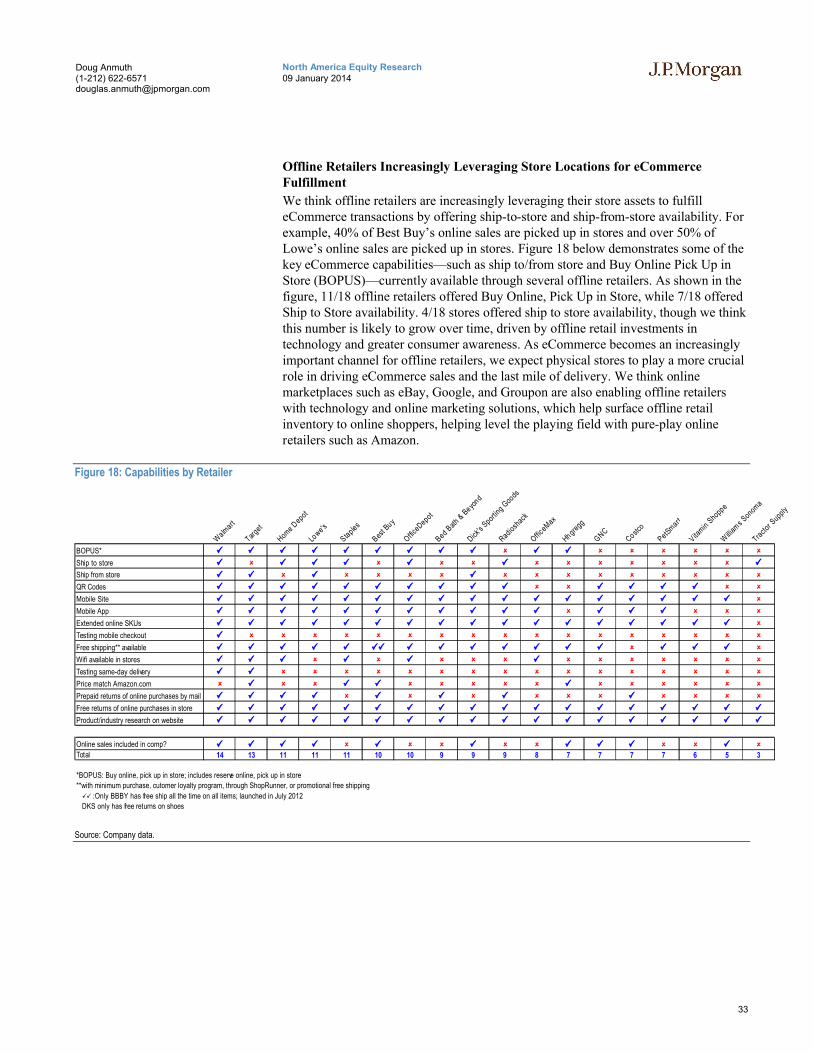
33
North America Equity Research09 January 2014
Doug Anmuth(1-212) [email protected]
Offline Retailers Increasingly Leveraging Store Locations for eCommerce Fulfillment
We think offline retailers are increasingly leveraging their store assets to fulfill eCommerce transactions by offering ship-to-store and ship-from-store availability. For example, 40% of Best Buy’s online sales are picked up in stores and over 50% of Lowe’s online sales are picked up in stores. Figure 18 below demonstrates some of the key eCommerce capabilities—such as ship to/from store and Buy Online Pick Up in Store (BOPUS)—currently available through several offline retailers. As shown in the figure, 11/18 offline retailers offered Buy Online, Pick Up in Store, while 7/18 offered Ship to Store availability. 4/18 stores offered ship to store availability, though we think this number is likely to grow over time, driven by offline retail investments in technology and greater consumer awareness. As eCommerce becomes an increasingly important channel for offline retailers, we expect physical stores to play a more crucial role in driving eCommerce sales and the last mile of delivery. We think online marketplaces such as eBay, Google, and Groupon are also enabling offline retailers with technology and online marketing solutions, which help surface offline retail inventory to online shoppers, helping level the playing field with pure-play online retailers such as Amazon.
Figure 18: Capabilities by Retailer
Walm
art
Target
Home D
epot
Lowe's
Staples
Best B
uy
Office
Depot
Bed Bath
& B
eyond
Dick's
Sporting G
oods
Radiosh
ack
OfficeM
ax
Hhgregg
GNC
Costco
PetSm
art
Vitam
in Shoppe
Willi
ams
Sonoma
Tract
or Supply
BOPUS* Ship to store Ship from store QR Codes Mobile Site Mobile App Extended online SKUs Testing mobile checkout Free shipping** available Wifi available in stores Testing same-day delivery Price match Amazon.com Prepaid returns of online purchases by mail Free returns of online purchases in store Product/industry research on website
Online sales included in comp? Total 14 13 11 11 11 10 10 9 9 9 8 7 7 7 7 6 5 3
*BOPUS: Buy online, pick up in store; includes reserve online, pick up in store
**with minimum purchase, cutomer loyalty program, through ShopRunner, or promotional free shipping
:Only BBBY has free ship all the time on all items; launched in July 2012
DKS only has free returns on shoes
Source: Company data.
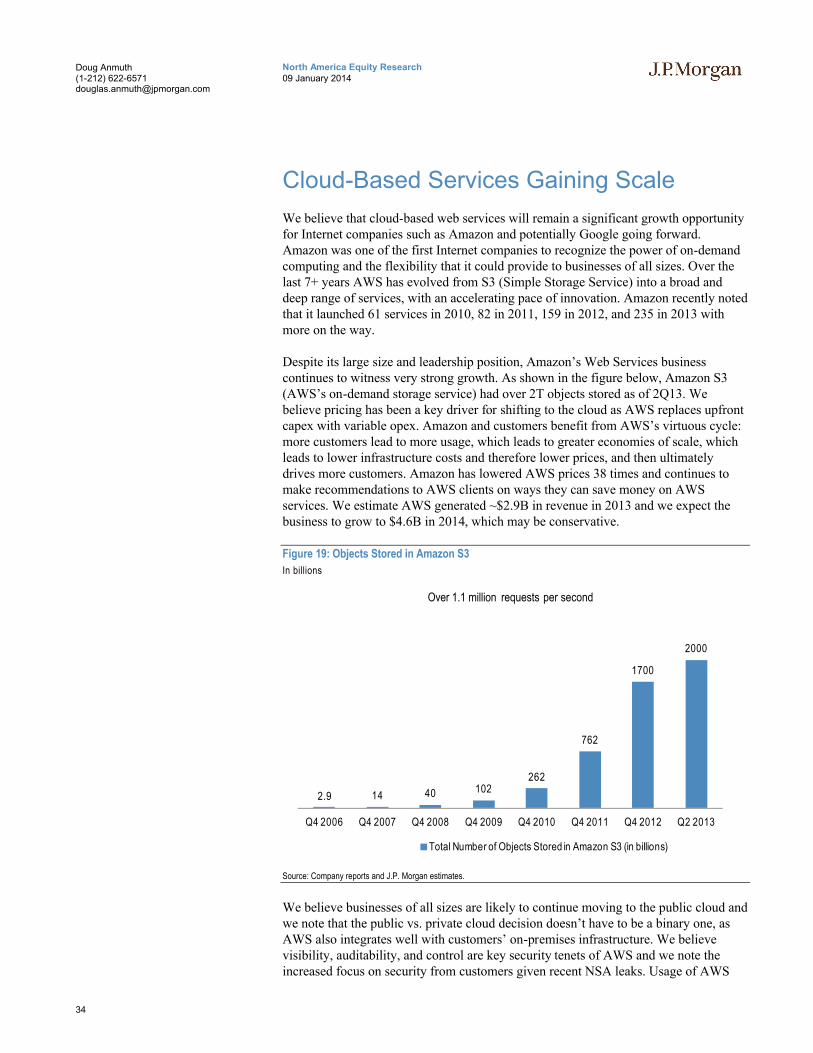
34
North America Equity Research09 January 2014
Doug Anmuth(1-212) [email protected]
Cloud-Based Services Gaining Scale
We believe that cloud-based web services will remain a significant growth opportunity for Internet companies such as Amazon and potentially Google going forward. Amazon was one of the first Internet companies to recognize the power of on-demand computing and the flexibility that it could provide to businesses of all sizes. Over the last 7+ years AWS has evolved from S3 (Simple Storage Service) into a broad and deep range of services, with an accelerating pace of innovation. Amazon recently noted that it launched 61 services in 2010, 82 in 2011, 159 in 2012, and 235 in 2013 with more on the way.
Despite its large size and leadership position, Amazon’s Web Services business continues to witness very strong growth. As shown in the figure below, Amazon S3 (AWS’s on-demand storage service) had over 2T objects stored as of 2Q13. We believe pricing has been a key driver for shifting to the cloud as AWS replaces upfront capex with variable opex. Amazon and customers benefit from AWS’s virtuous cycle: more customers lead to more usage, which leads to greater economies of scale, which leads to lower infrastructure costs and therefore lower prices, and then ultimately drives more customers. Amazon has lowered AWS prices 38 times and continues to make recommendations to AWS clients on ways they can save money on AWS services. We estimate AWS generated ~$2.9B in revenue in 2013 and we expect the business to grow to $4.6B in 2014, which may be conservative.
Figure 19: Objects Stored in Amazon S3
In billions
2.9 14 40 102262
762
1700
2000
Q4 2006 Q4 2007 Q4 2008 Q4 2009 Q4 2010 Q4 2011 Q4 2012 Q2 2013
Over 1.1 million requests per second
Total Number of Objects Stored in Amazon S3 (in billions)
Source: Company reports and J.P. Morgan estimates.
We believe businesses of all sizes are likely to continue moving to the public cloud and we note that the public vs. private cloud decision doesn’t have to be a binary one, as AWS also integrates well with customers’ on-premises infrastructure. We believe visibility, auditability, and control are key security tenets of AWS and we note the increased focus on security from customers given recent NSA leaks. Usage of AWS
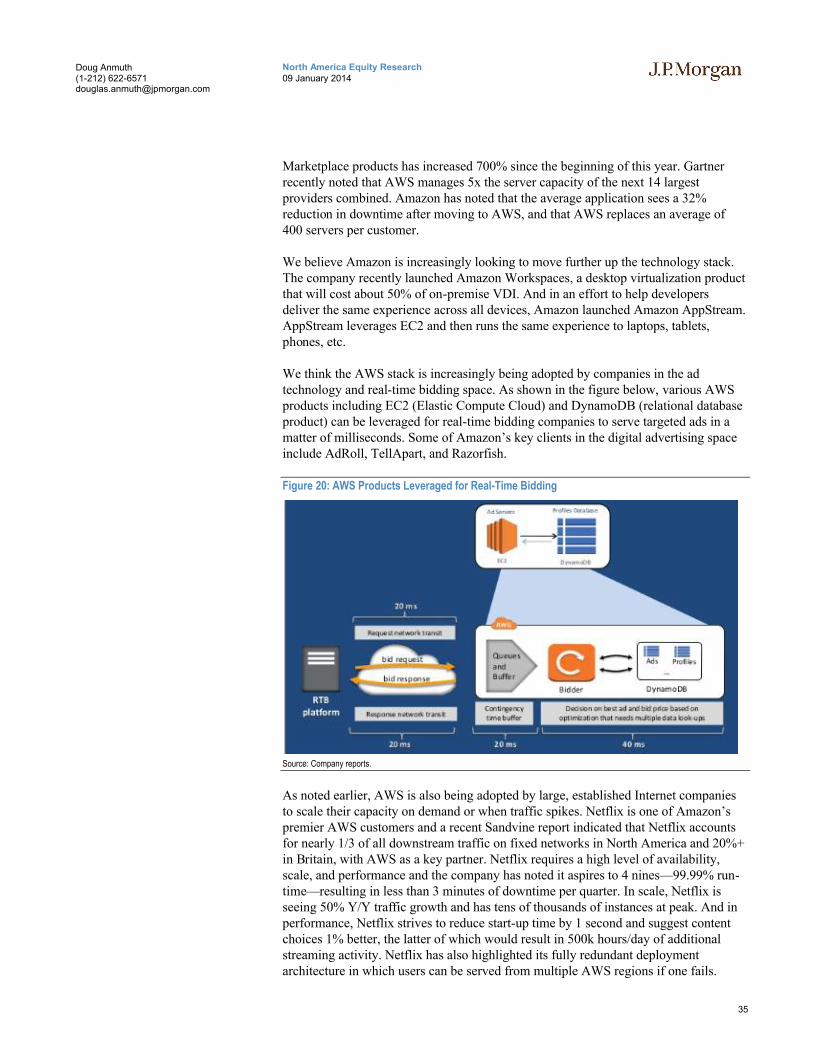
35
North America Equity Research09 January 2014
Doug Anmuth(1-212) [email protected]
Marketplace products has increased 700% since the beginning of this year. Gartner recently noted that AWS manages 5x the server capacity of the next 14 largest providers combined. Amazon has noted that the average application sees a 32% reduction in downtime after moving to AWS, and that AWS replaces an average of 400 servers per customer.
We believe Amazon is increasingly looking to move further up the technology stack. The company recently launched Amazon Workspaces, a desktop virtualization product that will cost about 50% of on-premise VDI. And in an effort to help developers deliver the same experience across all devices, Amazon launched Amazon AppStream. AppStream leverages EC2 and then runs the same experience to laptops, tablets, phones, etc.
We think the AWS stack is increasingly being adopted by companies in the ad technology and real-time bidding space. As shown in the figure below, various AWS products including EC2 (Elastic Compute Cloud) and DynamoDB (relational database product) can be leveraged for real-time bidding companies to serve targeted ads in a matter of milliseconds. Some of Amazon’s key clients in the digital advertising space include AdRoll, TellApart, and Razorfish.
Figure 20: AWS Products Leveraged for Real-Time Bidding
Source: Company reports.
As noted earlier, AWS is also being adopted by large, established Internet companies to scale their capacity on demand or when traffic spikes. Netflix is one of Amazon’s premier AWS customers and a recent Sandvine report indicated that Netflix accounts for nearly 1/3 of all downstream traffic on fixed networks in North America and 20%+ in Britain, with AWS as a key partner. Netflix requires a high level of availability, scale, and performance and the company has noted it aspires to 4 nines—99.99% run-time—resulting in less than 3 minutes of downtime per quarter. In scale, Netflix is seeing 50% Y/Y traffic growth and has tens of thousands of instances at peak. And in performance, Netflix strives to reduce start-up time by 1 second and suggest content choices 1% better, the latter of which would result in 500k hours/day of additional streaming activity. Netflix has also highlighted its fully redundant deployment architecture in which users can be served from multiple AWS regions if one fails.

36
North America Equity Research09 January 2014
Doug Anmuth(1-212) [email protected]
We believe Google also has an opportunity to become a significant player in IaaS (infrastructure-as-a-service) given its existing cash and infrastructure resources. In December, the company announced the general availability of its Google Compute Engine (GCE) which provides developers the ability to build applications with both managed and unmanaged services that run on Google’s infrastructure. GCE customers include Snapchat, Cooladata, Mendelics, Evite and Wix. While AWS remains the dominant player in the space, we believe many enterprises are also selecting multiple IaaS providers in order to diversify their IT resources across multiple vendors and geographies. However, we believe companies may be less comfortable putting their mission-critical data on Google’s cloud given the large dependence they may already have on GOOG through search, ads, analytics, etc.
37
North America Equity Research09 January 2014
Doug Anmuth(1-212) [email protected]
Blurring of the Lines in Online Travel
In 2014 we remain positive on the secular online shift in the travel industry, as we look for increasing OTA penetration rates in all regions of the world. We believe there is a large global opportunity for the OTAs as they target underpenetrated international markets as new areas of growth, intensifying the competition between the OTAs in all geographies and across business models. We believe key themes in 2014 for online travel include: 1) intensifying competition between OTAs likely to continue to pressure sales and marketing spend across the major players; 2) blurring of lines between OTAs and meta search as the OTAs look to move higher up the purchase funnel; 3) a stronger push into international markets, particularly with cross-border travel; and 4) looking for ways to expand mobile bookings beyond next-24-hour bookings.
We expect continuing competition among the OTAs, particularly in Europe and the U.S., as Expedia pushes harder into Europe and Booking.com into the U.S. We believe the OTAs will continue to pursue APAC and LatAm hotel markets as new regions for growth, competing against local incumbent OTAs with dominant market shares. We think this is likely to increase M&A activity in new growth markets and increase marketing spend to support growth in both consumer demand and hotel supply in growth markets. While we think increased competition is likely to pressure sales and marketing spend in 2014 across the OTAs, we still believe Priceline can sustain solid international bookings growth through increased investments and sales and marketing spend.
The lines between OTAs and meta search are starting to blur following two key combinations in 2013—Priceline with Kayak and Expedia with Trivago. We believe these deals open up new opportunities for both Priceline and Expedia to leverage the meta-search models through a direct bookings path, effectively turning Kayak and Trivago into new distribution channels for bookings, as well as a way to realize marketing efficiencies through increased spend on owned channels. These deals also enable the OTAs to move higher up into the consumer travel booking channel, as many travel searches first begin on Google or meta-search sites then progress down the funnel towards the OTAs where the transactions are made. From the meta-search side, in our view, TripAdvisor’s meta-display model with plans for direct mobile bookings in 2014 may initially provide the OTAs with a boost to mobile bookings, but could also pose a competitive threat further down the path. We also note that TripAdvisor’s TRIP Connect, which enables smaller hotels to bid directly in the meta display, could gain traction in fragmented hotel markets in international regions.
In the U.S., Priceline has been executing better with accelerating bookings growth at Priceline.com with Express Deals, in addition to its efforts with Booking.com in the U.S. While Express Deals negatively impacted Expedia’s Hotwire brand in 2013, we look for Expedia to stabilize in 2014 and focus on international expansion. We also note that Priceline has been incorporating a greater presence of its products through Kayak, and Expedia has been marketing Trivago in the U.S. market as well. We believe the domestic travel industry will continue to be very competitive, as some of the offline TV ad spend seen this year will likely continue into 2014.
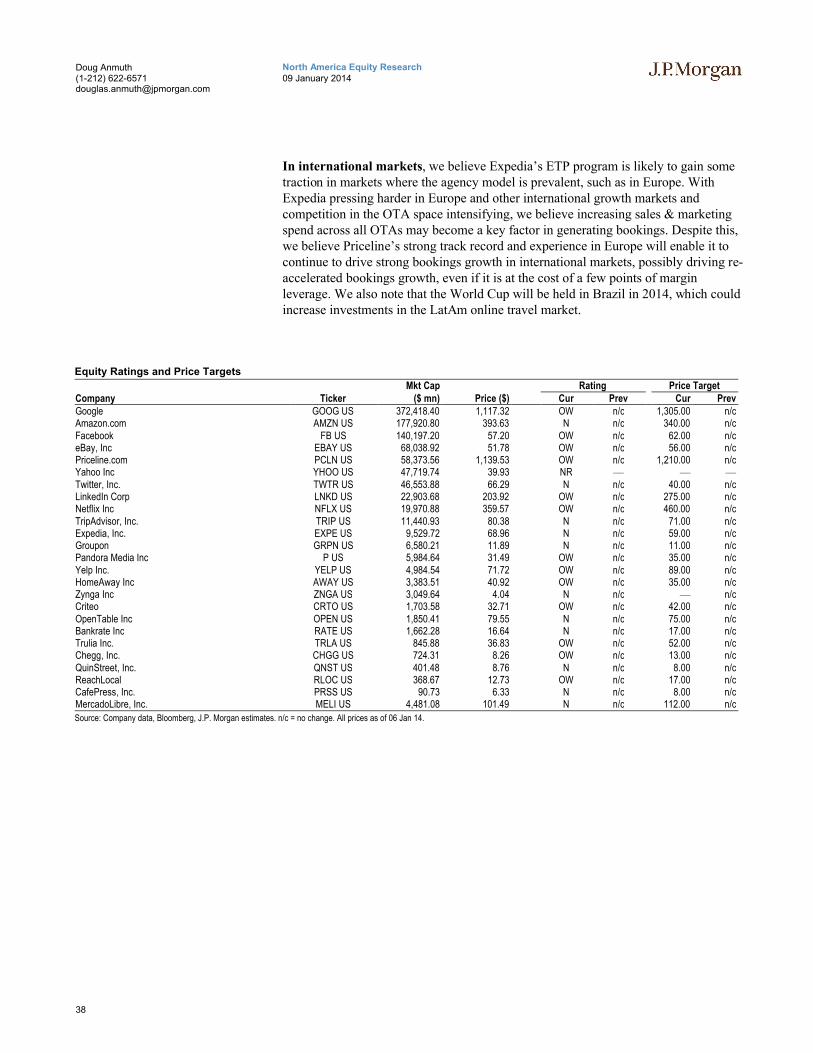
38
North America Equity Research09 January 2014
Doug Anmuth(1-212) [email protected]
In international markets, we believe Expedia’s ETP program is likely to gain some traction in markets where the agency model is prevalent, such as in Europe. With Expedia pressing harder in Europe and other international growth markets and competition in the OTA space intensifying, we believe increasing sales & marketing spend across all OTAs may become a key factor in generating bookings. Despite this, we believe Priceline’s strong track record and experience in Europe will enable it to continue to drive strong bookings growth in international markets, possibly driving re-accelerated bookings growth, even if it is at the cost of a few points of margin leverage. We also note that the World Cup will be held in Brazil in 2014, which could increase investments in the LatAm online travel market.
Equity Ratings and Price Targets
Mkt Cap Rating Price TargetCompany Ticker ($ mn) Price ($) Cur Prev Cur PrevGoogle GOOG US 372,418.40 1,117.32 OW n/c 1,305.00 n/cAmazon.com AMZN US 177,920.80 393.63 N n/c 340.00 n/cFacebook FB US 140,197.20 57.20 OW n/c 62.00 n/ceBay, Inc EBAY US 68,038.92 51.78 OW n/c 56.00 n/cPriceline.com PCLN US 58,373.56 1,139.53 OW n/c 1,210.00 n/cYahoo Inc YHOO US 47,719.74 39.93 NR — — —Twitter, Inc. TWTR US 46,553.88 66.29 N n/c 40.00 n/cLinkedIn Corp LNKD US 22,903.68 203.92 OW n/c 275.00 n/cNetflix Inc NFLX US 19,970.88 359.57 OW n/c 460.00 n/cTripAdvisor, Inc. TRIP US 11,440.93 80.38 N n/c 71.00 n/cExpedia, Inc. EXPE US 9,529.72 68.96 N n/c 59.00 n/cGroupon GRPN US 6,580.21 11.89 N n/c 11.00 n/cPandora Media Inc P US 5,984.64 31.49 OW n/c 35.00 n/cYelp Inc. YELP US 4,984.54 71.72 OW n/c 89.00 n/cHomeAway Inc AWAY US 3,383.51 40.92 OW n/c 35.00 n/cZynga Inc ZNGA US 3,049.64 4.04 N n/c — n/cCriteo CRTO US 1,703.58 32.71 OW n/c 42.00 n/cOpenTable Inc OPEN US 1,850.41 79.55 N n/c 75.00 n/cBankrate Inc RATE US 1,662.28 16.64 N n/c 17.00 n/cTrulia Inc. TRLA US 845.88 36.83 OW n/c 52.00 n/cChegg, Inc. CHGG US 724.31 8.26 OW n/c 13.00 n/cQuinStreet, Inc. QNST US 401.48 8.76 N n/c 8.00 n/cReachLocal RLOC US 368.67 12.73 OW n/c 17.00 n/cCafePress, Inc. PRSS US 90.73 6.33 N n/c 8.00 n/cMercadoLibre, Inc. MELI US 4,481.08 101.49 N n/c 112.00 n/c
Source: Company data, Bloomberg, J.P. Morgan estimates. n/c = no change. All prices as of 06 Jan 14.
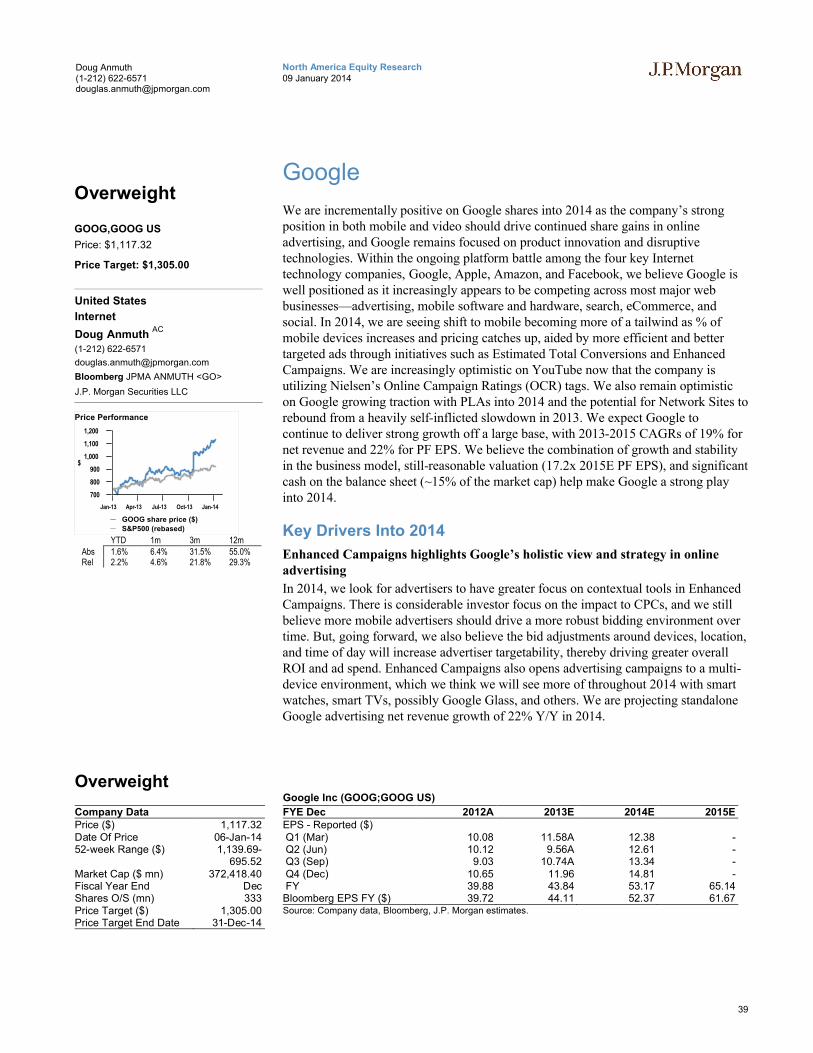
39
North America Equity Research09 January 2014
Doug Anmuth(1-212) [email protected]
We are incrementally positive on Google shares into 2014 as the company’s strong position in both mobile and video should drive continued share gains in online advertising, and Google remains focused on product innovation and disruptive technologies. Within the ongoing platform battle among the four key Internet technology companies, Google, Apple, Amazon, and Facebook, we believe Google is well positioned as it increasingly appears to be competing across most major web businesses—advertising, mobile software and hardware, search, eCommerce, and social. In 2014, we are seeing shift to mobile becoming more of a tailwind as % of mobile devices increases and pricing catches up, aided by more efficient and better targeted ads through initiatives such as Estimated Total Conversions and Enhanced Campaigns. We are increasingly optimistic on YouTube now that the company is utilizing Nielsen’s Online Campaign Ratings (OCR) tags. We also remain optimistic on Google growing traction with PLAs into 2014 and the potential for Network Sites to rebound from a heavily self-inflicted slowdown in 2013. We expect Google to continue to deliver strong growth off a large base, with 2013-2015 CAGRs of 19% for net revenue and 22% for PF EPS. We believe the combination of growth and stability in the business model, still-reasonable valuation (17.2x 2015E PF EPS), and significant cash on the balance sheet (~15% of the market cap) help make Google a strong play into 2014.
Key Drivers Into 2014
Enhanced Campaigns highlights Google’s holistic view and strategy in online advertising
In 2014, we look for advertisers to have greater focus on contextual tools in Enhanced Campaigns. There is considerable investor focus on the impact to CPCs, and we still believe more mobile advertisers should drive a more robust bidding environment over time. But, going forward, we also believe the bid adjustments around devices, location, and time of day will increase advertiser targetability, thereby driving greater overall ROI and ad spend. Enhanced Campaigns also opens advertising campaigns to a multi-device environment, which we think we will see more of throughout 2014 with smart watches, smart TVs, possibly Google Glass, and others. We are projecting standalone Google advertising net revenue growth of 22% Y/Y in 2014.
Overweight
Company DataPrice ($) 1,117.32Date Of Price 06-Jan-1452-week Range ($) 1,139.69-
695.52Market Cap ($ mn) 372,418.40Fiscal Year End DecShares O/S (mn) 333Price Target ($) 1,305.00Price Target End Date 31-Dec-14
Google Inc (GOOG;GOOG US)
FYE Dec 2012A 2013E 2014E 2015EEPS - Reported ($)Q1 (Mar) 10.08 11.58A 12.38 -Q2 (Jun) 10.12 9.56A 12.61 -Q3 (Sep) 9.03 10.74A 13.34 -Q4 (Dec) 10.65 11.96 14.81 -FY 39.88 43.84 53.17 65.14Bloomberg EPS FY ($) 39.72 44.11 52.37 61.67Source: Company data, Bloomberg, J.P. Morgan estimates.
Overweight
GOOG,GOOG US
Price: $1,117.32
Price Target: $1,305.00
United States
Internet
Doug Anmuth AC
(1-212) 622-6571
Bloomberg JPMA ANMUTH <GO>
J.P. Morgan Securities LLC
700
800
900
1,000
1,100
1,200
$
Jan-13 Apr-13 Jul-13 Oct-13 Jan-14
Price Performance
GOOG share price ($)
S&P500 (rebased)
YTD 1m 3m 12mAbs 1.6% 6.4% 31.5% 55.0%Rel 2.2% 4.6% 21.8% 29.3%
40
North America Equity Research09 January 2014
Doug Anmuth(1-212) [email protected]
Google to increase mobile engagement and monetization
We believe mobile CPCs—especially on smartphones—have room to increase relative to desktop and they will also become a greater share of Google clicks, ultimately creating a more positive CPC mix shift in the business. We believe Google is very well positioned in mobile given an advertising format that ports well to mobile, Android’s strong share, and largely untapped local opportunities. While full adoption of Enhanced Campaign tools could take some time, we believe simplifying the cross-device process in AdWords is a big step toward driving greater mobile dollars. And the proliferation of Android devices helps ensure distribution of Google search and software services in a mobile world.
Android share gains to continue in 2014
On the mobile front, Android’s share of the US smartphone market grew to 52% versus 41% for Apple’s iPhone as of October 2013. While Android’s share gains have been predominantly driven by Samsung devices, Google’s mobile offerings have expanded beyond its Nexus devices with the launch of Moto X, the first Motorola device designed and produced under Google’s ownership. While Apple has been increasingly looking to develop more proprietary software and services such as Siri and Apple Maps that may help distinguish its products, we believe the dominance of Android and Google’s iOS app offerings help to protect Google’s user growth and mobile engagement. We also believe Google is focused on growing Android’s share of tablets, which still lags Apple’s iPad, and look for Google-designed tablets from Motorola going forward.
Estimated Conversions to improve cross-device conversions
In November 2013, Google launched Estimated Cross-Device Conversions (ECDC) in AdWords as a part of the new Estimated Total Conversions (ETC) product. ECDC is aimed towards providing advertisers with data to reflect the impact of an advertiser’s campaigns across various devices. Google is creating analytics tools to measure conversions that start with an AdWords click that leads to a transaction completed on any device, on the phone, or in-store. ECDC uses last paid click attribution so that the conversions are attributed to the ad that was last clicked before the transaction, lead submission, or other call to action was placed. Going forward, we expect Google to continue to add additional tools for other conversion types such as phone calls and in-store visits.
YouTube: Nielsen OCR measurement a major step in measurement
In November 2013, Google announced that it was letting Nielsen (covered by JP Morgan’s Business, Information and Education Services analyst Andrew Steinerman) place measurement tags on ads running on YouTube. We believe OCR measurement of YouTube will be impactful in increasing the site’s advertising revenue throughout 2014, especially from branded TV ad spend. According to Google’s latest YouTube Insights research from October 2013—which quotes data provided by Nielsen—more consumers already watch YouTube than cable networks and 63% of campaigns targeting 18-34 year olds would benefit from a shift to YouTube from TV given increased potential reach. The data suggests that YouTube commands higher reach than any major cable network among males 18-24, 18-34, and 18-49, and females 18-49 and 25-54. We are currently forecasting 2014 YouTube revenues of $5.1B (35.6% Y/Y).
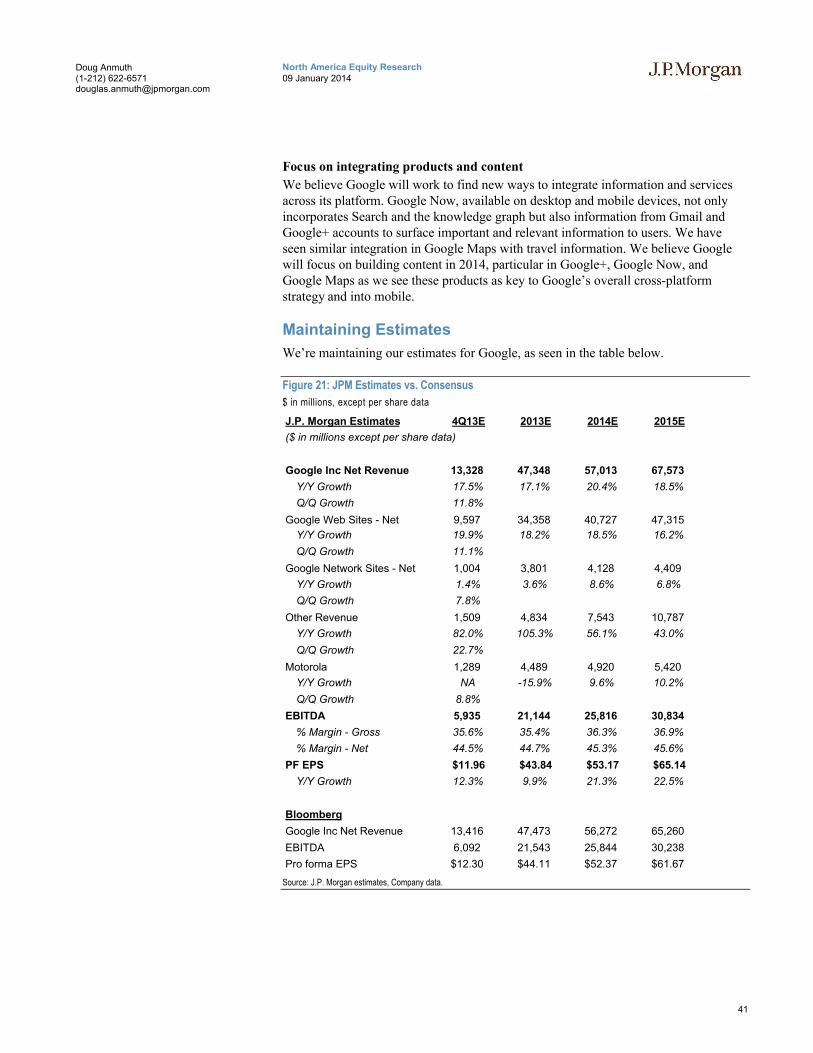
41
North America Equity Research09 January 2014
Doug Anmuth(1-212) [email protected]
Focus on integrating products and content
We believe Google will work to find new ways to integrate information and services across its platform. Google Now, available on desktop and mobile devices, not only incorporates Search and the knowledge graph but also information from Gmail and Google+ accounts to surface important and relevant information to users. We have seen similar integration in Google Maps with travel information. We believe Google will focus on building content in 2014, particular in Google+, Google Now, and Google Maps as we see these products as key to Google’s overall cross-platform strategy and into mobile.
Maintaining Estimates
We’re maintaining our estimates for Google, as seen in the table below.
Figure 21: JPM Estimates vs. Consensus
$ in millions, except per share data
J.P. Morgan Estimates 4Q13E 2013E 2014E 2015E
($ in millions except per share data)
Google Inc Net Revenue 13,328 47,348 57,013 67,573
Y/Y Growth 17.5% 17.1% 20.4% 18.5%
Q/Q Growth 11.8%
Google Web Sites - Net 9,597 34,358 40,727 47,315
Y/Y Growth 19.9% 18.2% 18.5% 16.2%
Q/Q Growth 11.1%
Google Network Sites - Net 1,004 3,801 4,128 4,409
Y/Y Growth 1.4% 3.6% 8.6% 6.8%
Q/Q Growth 7.8%
Other Revenue 1,509 4,834 7,543 10,787
Y/Y Growth 82.0% 105.3% 56.1% 43.0%
Q/Q Growth 22.7%
Motorola 1,289 4,489 4,920 5,420
Y/Y Growth NA -15.9% 9.6% 10.2%
Q/Q Growth 8.8%
EBITDA 5,935 21,144 25,816 30,834
% Margin - Gross 35.6% 35.4% 36.3% 36.9%
% Margin - Net 44.5% 44.7% 45.3% 45.6%
PF EPS $11.96 $43.84 $53.17 $65.14
Y/Y Growth 12.3% 9.9% 21.3% 22.5%
Bloomberg
Google Inc Net Revenue 13,416 47,473 56,272 65,260
EBITDA 6,092 21,543 25,844 30,238
Pro forma EPS $12.30 $44.11 $52.37 $61.67
Source: J.P. Morgan estimates, Company data.
42
North America Equity Research09 January 2014
Doug Anmuth(1-212) [email protected]
Investment Thesis, Valuation and Risks
Google (Overweight; Price Target: $1,305.00)
Investment Thesis
Overall, we continue to believe Google fundamentals are strong. The Paid Clicks and CPC divergence is tightening, but more importantly we are projecting organic grossrevenue to grow 20% in 2014. Core search growth remains solid and Google is now getting significant lift from display and mobile, which we forecast to combine for nearly 40% of gross revenue in 2014. We are encouraged by the growth potential driven by mobile and display, Enhanced Campaigns, and PLAs. We also believe Google will ultimately pare Motorola losses and potentially come out with Google-designed devices that are more competitive.
Valuation
Our December 2014 price target of $1,305 is based on 20.0x 2015E PF EPS of $65.14. At 20x 2015E PF EPS, Google's PEG ratio is 1.1x, which is in-line with large cap Internet peers. Additionally, we believe shares of Google should trade at a premium to the S&P 500 P/E, which trades at ~14x 2015 estimates, as Google is one of the few companies in the S&P 500 growing both revenue and EPS above a 2012-2015E CAGR of 18%, respectively.
Risks to Rating and Price Target
Downside risks include: 1) potential for a return to heavy investment spending and margin compression; 2) continued competition for engineering talent; 3) Motorola integration risk; and 4) increased regulatory scrutiny.

43
North America Equity Research09 January 2014
Doug Anmuth(1-212) [email protected]
Google: Summary of FinancialsIncome Statement - Annual FY12A FY13E FY14E FY15E Income Statement - Quarterly 1Q13A 2Q13A 3Q13A 4Q13E
Gross Revenues 68,755 Gross Revenues
Revenues 40,419 47,348 57,013 67,573 Revenues 11,007A 11,092A 11,921A 13,328
Operating income 12,722 13,842 17,389 21,353 Operating income 3,477A 3,123A 3,444A 3,798
D&A 2,962 4,054 4,551 5,022 D&A 899A 1,030A 974A 1,151
EBITDA 15,684 17,896 21,939 26,374 EBITDA 4,376A 4,153A 4,418A 4,949
Net interest income / (expense) - - - - Net interest income / (expense) - - - -
Other income / (expense) 625 658 1,307 2,071 Other income / (expense) 134A 247A 24A 253
Pretax income 13,347 14,500 18,696 23,423 Pretax income 3,611A 3,370A 3,468A 4,051
Income taxes (2,589) (2,386) (3,552) (4,333) Income taxes (287)A (816)A (513)A (770)
Net Income 10,758 12,114 15,144 19,090 Net Income 3,324A 2,554A 2,955A 3,281
Weighted average diluted shares 332 339 344 349 Weighted average diluted shares 337A 338A 339A 341
Diluted EPS 39.88 43.84 53.17 65.14 Diluted EPS 11.58A 9.56A 10.74A 11.96
Balance Sheet and Cash Flow Data FY12A FY13E FY14E FY15E Ratio Analysis FY12A FY13E FY14E FY15E
Cash and cash equivalents 14,778 20,608 39,039 61,479 Sales growth 38.9% 17.1% 20.4% 18.5%
Accounts receivable 7,885 8,130 8,790 10,136 EBITDA growth 17.8% 11.7% 22.1% 19.4%
Other current assets 3,976 4,204 4,266 4,374 EPS growth 10.6% 9.9% 21.3% 22.5%
Current assets 60,454 74,223 93,375 117,269
PP&E 11,854 15,323 17,537 20,033 EBITDA margin 46.8% 44.7% 45.3% 45.6%
Total assets 93,798 110,624 132,467 158,942 Net margin 32.8% 31.4% 32.1% 33.6%
Total debt 5,537 5,997 5,997 5,997 Debt / EBITDA 0.3 0.3 0.2 0.2
Total liabilities 22,083 24,354 31,056 38,438
Shareholders' equity 71,715 86,270 101,411 120,504 Return on assets (ROA) 15.9% 14.5% 15.0% 15.6%
Return on equity (ROE) 20.4% 18.8% 19.5% 20.5%
Net Income (including charges) 10,737 12,825 15,144 19,090
D&A 2,962 4,054 4,551 5,022 Enterprise value / EBITDA 19.0 16.7 13.0 10.1
Change in working capital 898 627 694 866 Enterprise value / Free cash flow 26.1 25.8 18.2 13.7
Other - - - - P/E 34.6 29.5 25.4 20.4
Cash flow from operations 17,010 20,021 23,889 29,061
Capex (3,273) (6,314) (5,502) (6,251)
Free cash flow 13,737 13,707 18,387 22,809
Cash flow from investing activities (13,056) (13,273) (5,502) (6,251)
Cash flow from financing activities 1,229 (912) (358) (358)
Dividends - - - -
Dividend yield - - - -
Source: Company reports and J.P. Morgan estimates.Note: $ in millions (except per-share data).Fiscal year ends Dec
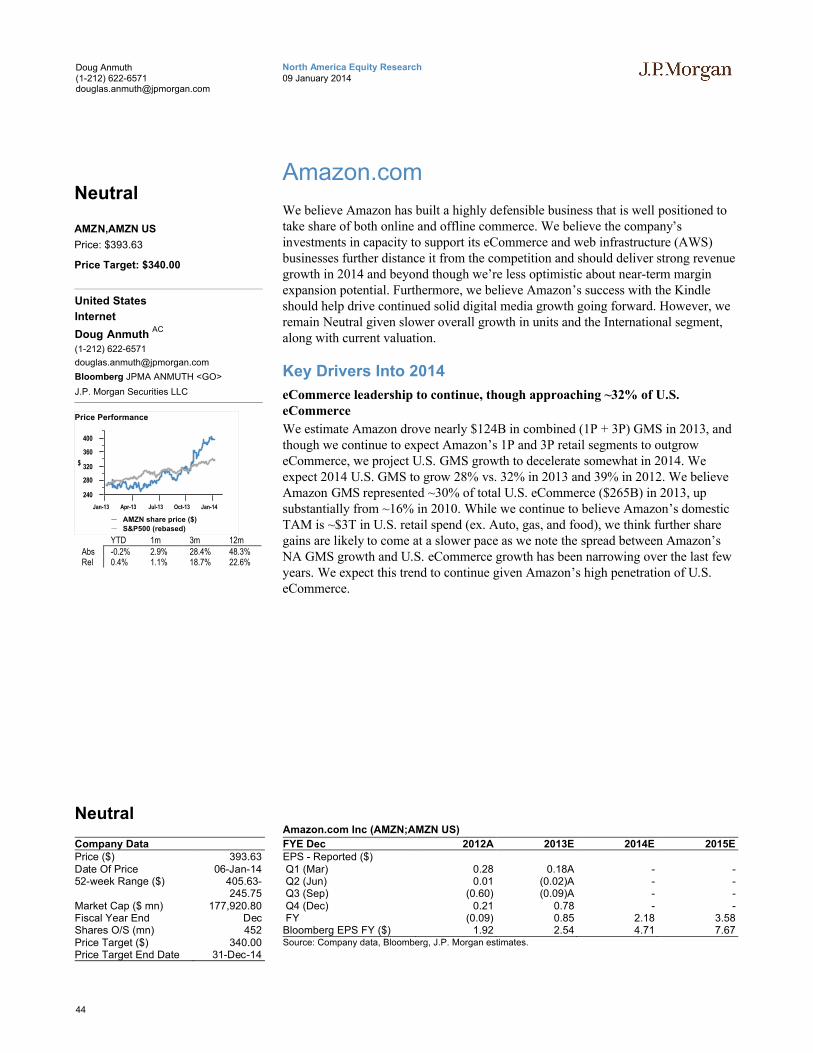
44
North America Equity Research09 January 2014
Doug Anmuth(1-212) [email protected]
Amazon.com
We believe Amazon has built a highly defensible business that is well positioned to take share of both online and offline commerce. We believe the company’s investments in capacity to support its eCommerce and web infrastructure (AWS) businesses further distance it from the competition and should deliver strong revenue growth in 2014 and beyond though we’re less optimistic about near-term margin expansion potential. Furthermore, we believe Amazon’s success with the Kindle should help drive continued solid digital media growth going forward. However, we remain Neutral given slower overall growth in units and the International segment, along with current valuation.
Key Drivers Into 2014
eCommerce leadership to continue, though approaching ~32% of U.S.eCommerce
We estimate Amazon drove nearly $124B in combined (1P + 3P) GMS in 2013, and though we continue to expect Amazon’s 1P and 3P retail segments to outgrow eCommerce, we project U.S. GMS growth to decelerate somewhat in 2014. We expect 2014 U.S. GMS to grow 28% vs. 32% in 2013 and 39% in 2012. We believeAmazon GMS represented ~30% of total U.S. eCommerce ($265B) in 2013, up substantially from ~16% in 2010. While we continue to believe Amazon’s domestic TAM is ~$3T in U.S. retail spend (ex. Auto, gas, and food), we think further share gains are likely to come at a slower pace as we note the spread between Amazon’s NA GMS growth and U.S. eCommerce growth has been narrowing over the last few years. We expect this trend to continue given Amazon’s high penetration of U.S.eCommerce.
Neutral
Company DataPrice ($) 393.63Date Of Price 06-Jan-1452-week Range ($) 405.63-
245.75Market Cap ($ mn) 177,920.80Fiscal Year End DecShares O/S (mn) 452Price Target ($) 340.00Price Target End Date 31-Dec-14
Amazon.com Inc (AMZN;AMZN US)
FYE Dec 2012A 2013E 2014E 2015EEPS - Reported ($)Q1 (Mar) 0.28 0.18A - -Q2 (Jun) 0.01 (0.02)A - -Q3 (Sep) (0.60) (0.09)A - -Q4 (Dec) 0.21 0.78 - -FY (0.09) 0.85 2.18 3.58Bloomberg EPS FY ($) 1.92 2.54 4.71 7.67Source: Company data, Bloomberg, J.P. Morgan estimates.
Neutral
AMZN,AMZN US
Price: $393.63
Price Target: $340.00
United States
Internet
Doug Anmuth AC
(1-212) 622-6571
Bloomberg JPMA ANMUTH <GO>
J.P. Morgan Securities LLC
240
280
320
360
400
$
Jan-13 Apr-13 Jul-13 Oct-13 Jan-14
Price Performance
AMZN share price ($)
S&P500 (rebased)
YTD 1m 3m 12mAbs -0.2% 2.9% 28.4% 48.3%Rel 0.4% 1.1% 18.7% 22.6%
45
North America Equity Research09 January 2014
Doug Anmuth(1-212) [email protected]
Prime drives continued wallet share gains
Amazon recently noted it added millions of Prime members in 3Q and we think the company has been consistently doing so for the last several quarters. We think strong growth in Prime has been driven by valuable shipping benefits as well as the inclusion of Prime Instant Video and Kindle Lending Library for Prime members in the U.S.. According to comScore, the top 20% of online shoppers account for over 2/3rds of online dollars in the U.S. and we think a large % of these heavy purchasers(over a third) are Amazon customers. We believe Prime, in addition to other initiatives such as Free Super Saver Shipping, can increase average order values significantly, and the continued expansion of Prime benefits in International markets and inclusion of FBA items in Prime give Amazon significant advantages over its online competitors. We think the recent increase in the Free Super Saver Shipping threshold to $35 from $25 should also help drive additional Prime subscriptions.
Amazon Web Services the Leader in IaaS
Amazon’s Web Services offering has quickly emerged as a leader in utility cloudcomputing and is being adopted by both large enterprises and smaller start-ups alike.We see AWS benefiting from two secular shifts: 1) Enterprises outsourcing their data center spend to focus on their core business—only ~20% of data center spend is outsourced today; and 2) Amazon’s on-demand utility-like cloud computing and storage offering creates low barriers to adoption as businesses only pay for capacity used. We are bullish on Amazon growing its lead in cloud computing and expect AWS revenue of $4.6B in 2014 from $2.9B in 2013. We think AWS is rapidly becoming a meaningful part of overall gross profit and estimate AWS was 14% of Amazon’s total gross profit in 2012 and we expect AWS to account for 18% of gross profit in 2014. However, we think AWS CSOI margins are low as Amazon continues to re-invest in new data centers and grows the business through lower pricing. We think a sum-of-the-parts valuation using AWS provides support for the shares; as Amazon continues to disrupt more traditional tech infrastructure companies, it is likely to attract a broader range of tech investors.
Potential for improving growth in International Media
We believe softness in International Media—which we expect to grow ~8.5% Y/Y on an ex-FX basis in 2013 (from 12% in 2012)—drove some of the overall unit deceleration in 2013. Amazon’s digital offerings (eBooks, music, video) are relatively new in several geographies where physical media sales are weakening and unit/gross profit growth could re-accelerate as Amazon’s international digital sales grow. Amazon should also benefit from a more stable macro environment in Europe.
FBA still relatively early, but growing rapidly
We believe FBA remains a relatively newer product compared to Amazon’s 3P agency business as FBA was only recently rolled out in several overseas markets such as Spain (2013), Canada (late 2012), and Italy (2011). As a result, we think FBA represented roughly 24% of Amazon’s 2013 3P units and 10% of overall units (1P + 3P). We expect FBA-enabled unit sales growth to outpace 3P (non-FBA) sales growth for the next several years and are modeling FBA to reach 30% of all 3P units in 2014.
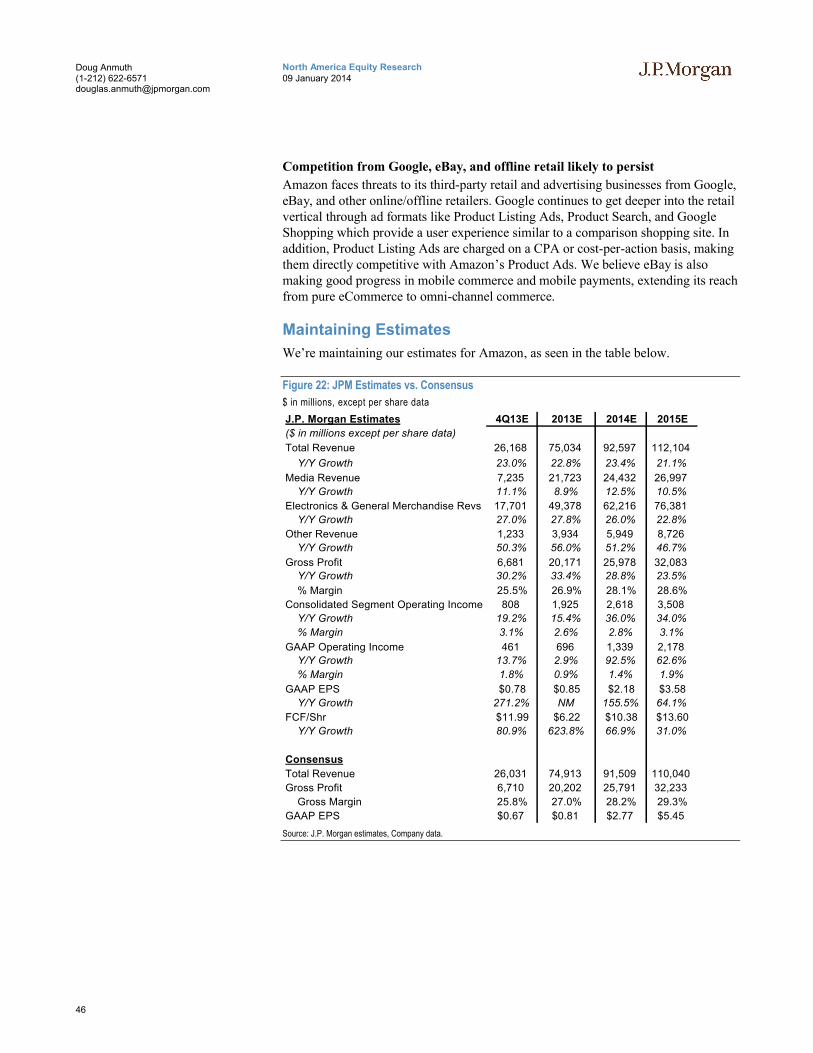
46
North America Equity Research09 January 2014
Doug Anmuth(1-212) [email protected]
Competition from Google, eBay, and offline retail likely to persist
Amazon faces threats to its third-party retail and advertising businesses from Google, eBay, and other online/offline retailers. Google continues to get deeper into the retail vertical through ad formats like Product Listing Ads, Product Search, and Google Shopping which provide a user experience similar to a comparison shopping site. In addition, Product Listing Ads are charged on a CPA or cost-per-action basis, making them directly competitive with Amazon’s Product Ads. We believe eBay is also making good progress in mobile commerce and mobile payments, extending its reach from pure eCommerce to omni-channel commerce.
Maintaining Estimates
We’re maintaining our estimates for Amazon, as seen in the table below.
Figure 22: JPM Estimates vs. Consensus
$ in millions, except per share data
J.P. Morgan Estimates 4Q13E 2013E 2014E 2015E
($ in millions except per share data)
Total Revenue 26,168 75,034 92,597 112,104
Y/Y Growth 23.0% 22.8% 23.4% 21.1%
Media Revenue 7,235 21,723 24,432 26,997
Y/Y Growth 11.1% 8.9% 12.5% 10.5%
Electronics & General Merchandise Revs 17,701 49,378 62,216 76,381
Y/Y Growth 27.0% 27.8% 26.0% 22.8%
Other Revenue 1,233 3,934 5,949 8,726
Y/Y Growth 50.3% 56.0% 51.2% 46.7%
Gross Profit 6,681 20,171 25,978 32,083
Y/Y Growth 30.2% 33.4% 28.8% 23.5%
% Margin 25.5% 26.9% 28.1% 28.6%
Consolidated Segment Operating Income 808 1,925 2,618 3,508
Y/Y Growth 19.2% 15.4% 36.0% 34.0%
% Margin 3.1% 2.6% 2.8% 3.1%
GAAP Operating Income 461 696 1,339 2,178
Y/Y Growth 13.7% 2.9% 92.5% 62.6%
% Margin 1.8% 0.9% 1.4% 1.9%
GAAP EPS $0.78 $0.85 $2.18 $3.58
Y/Y Growth 271.2% NM 155.5% 64.1%
FCF/Shr $11.99 $6.22 $10.38 $13.60
Y/Y Growth 80.9% 623.8% 66.9% 31.0%
Consensus
Total Revenue 26,031 74,913 91,509 110,040
Gross Profit 6,710 20,202 25,791 32,233
Gross Margin 25.8% 27.0% 28.2% 29.3%
GAAP EPS $0.67 $0.81 $2.77 $5.45
Source: J.P. Morgan estimates, Company data.
47
North America Equity Research09 January 2014
Doug Anmuth(1-212) [email protected]
Investment Thesis, Valuation and Risks
Amazon.com (Neutral; Price Target: $340.00)
Investment Thesis
Neutral rating. We believe Amazon continues to show strong ability to take share ofoverall eCommerce and its flexibility in pushing 1st-party versus 3rd-party inventory is a major advantage compared to other retailers. We think Amazon remains a share gain story in Media and EGM. However, we expect decelerating gross profit growth in the near term due to decelerating 3P sales as well as continued investments in international and increased competition in the US.
Valuation
Our year-end 2014 price target of $340 is based on 25x our 2015E FCF/share of $13.60, which is consistent with Amazon’s historical FCF multiple range of 20-25x. We value Amazon on a FCF basis given that the company continues to benefit from a positive working capital cycle which we believe is inherent to the business model.
Risks to Rating and Price Target
Upside risks include: 1) reacceleration in unit and gross profit growth; 2) improving profitability from fulfillment centers; and 3) better-than-expected growth in 3P, FBA, and AWS.
Downside risks include: 1) heavy investment spending creates further margin pressure; 2) competition from online and offline retailers coming out with improved offerings; and 3) consumer spending suffering due to macroeconomic weakness.
48
North America Equity Research09 January 2014
Doug Anmuth(1-212) [email protected]
Amazon.com: Summary of FinancialsIncome Statement - Annual FY12A FY13E FY14E FY15E Income Statement - Quarterly 1Q13A 2Q13A 3Q13A 4Q13E
Revenues 61,093 75,034 92,597 112,104 Revenues 16,070A 15,704A 17,092A 26,168Operating income 676 696 1,339 2,178 Operating income 181A 79A (25)A 461D&A 2,158 3,051 3,967 4,760 D&A 700A 756A 834A 761EBITDA 2,993 3,851 5,415 7,051 EBITDA 912A 867A 820A 1,252Net interest income / (expense) (51) (46) 14 18 Net interest income / (expense) (23)A (24)A (27)A 28Other income / (expense) (287) (210) (27) (18) Other income / (expense) (117)A (73)A (28)A 8Pretax income 389 486 1,313 2,159 Pretax income 64A 6A (53)A 469Income taxes (429) (91) (302) (497) Income taxes 18A (13)A 12A (108)Net Income (40) 395 1,011 1,663 Net Income 82A (7)A (41)A 361Weighted average diluted shares 461 462 463 464 Weighted average diluted shares 463A 456A 457A 462Diluted EPS (0.09) 0.85 2.18 3.58 Diluted EPS 0.18A (0.02)A (0.09)A 0.78
Balance Sheet and Cash Flow Data FY12A FY13E FY14E FY15E Ratio Analysis FY12A FY13E FY14E FY15E
Cash and cash equivalents 11,448 12,775 17,630 23,989 Sales growth 27.1% 22.8% 23.4% 21.1%Accounts receivable 3,364 3,579 4,537 5,269 EBITDA growth 44.1% 30.1% 32.3% 25.6%Other current assets 453 453 453 453 EPS growth (106.4%) (1080.1%) 155.5% 64.1%Current assets 21,296 25,653 35,584 45,406PP&E 7,060 10,303 10,132 9,632 EBITDA margin 6.3% 6.6% 7.1% 7.4%Total assets 32,555 40,461 50,113 59,322 Net margin 1.8% 2.2% 2.5% 2.7%Total debt 3,084 3,084 3,084 3,084 Debt / EBITDA 0.8 0.6 0.5 0.4Total liabilities 24,363 31,013 39,655 47,201Shareholders' equity 8,192 9,448 10,459 12,121 Return on assets (ROA) 3.8% 4.6% 5.1% 5.5%
Return on equity (ROE) 13.9% 19.1% 23.4% 26.8%Net Income (including charges) (40) 395 1,011 1,663D&A 2,158 3,051 3,967 4,760 Enterprise value / EBITDA 37.1 28.2 20.6 15.6Change in working capital 1,526 1,744 2,354 2,830 Enterprise value / Free cash flow 328.9 48.2 28.3 20.5Other - - - - P/E NM 460.6 180.3 109.9Cash flow from operations 4,180 6,508 8,601 10,569Capex (3,784) (3,636) (3,796) (4,260)Free cash flow 431 2,916 4,792 6,294Cash flow from investing activities (3,596) (4,506) (3,796) (4,260)Cash flow from financing activities 2,259 (596) 50 50Dividends - - - -Dividend yield - - - -
Source: Company reports and J.P. Morgan estimates.Note: $ in millions (except per-share data).Fiscal year ends Dec
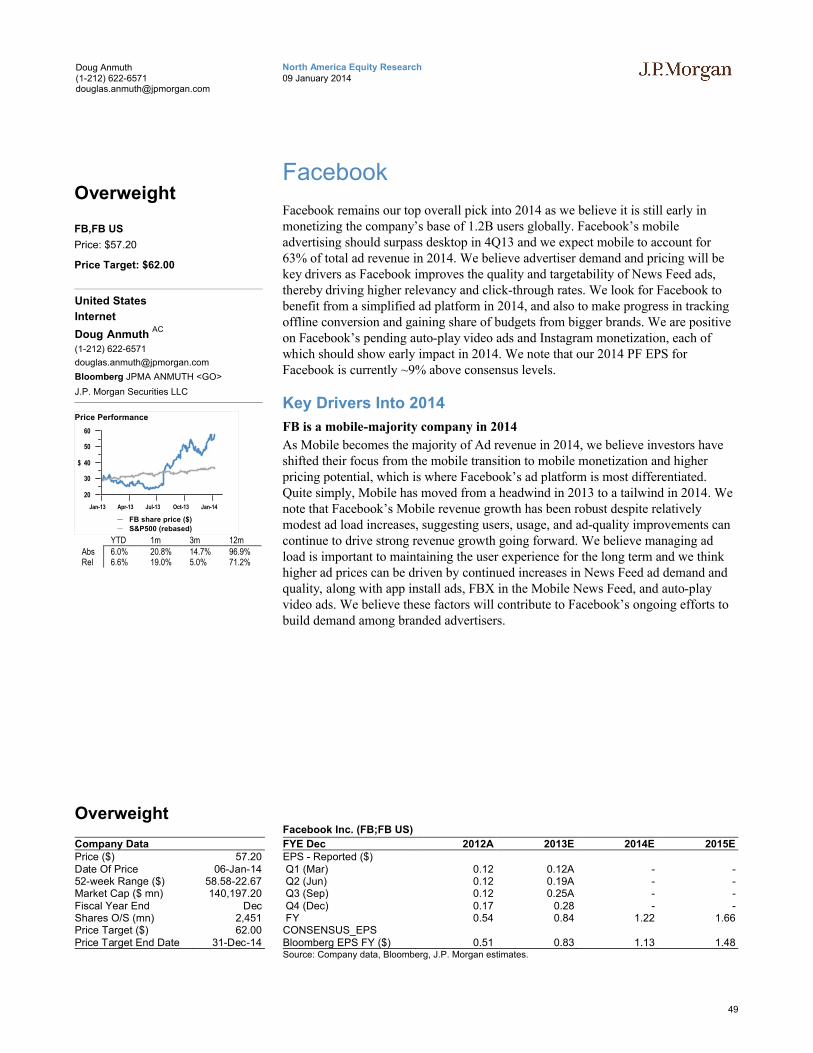
49
North America Equity Research09 January 2014
Doug Anmuth(1-212) [email protected]
Facebook remains our top overall pick into 2014 as we believe it is still early in monetizing the company’s base of 1.2B users globally. Facebook’s mobile advertising should surpass desktop in 4Q13 and we expect mobile to account for 63% of total ad revenue in 2014. We believe advertiser demand and pricing will be key drivers as Facebook improves the quality and targetability of News Feed ads, thereby driving higher relevancy and click-through rates. We look for Facebook to benefit from a simplified ad platform in 2014, and also to make progress in tracking offline conversion and gaining share of budgets from bigger brands. We are positive on Facebook’s pending auto-play video ads and Instagram monetization, each of which should show early impact in 2014. We note that our 2014 PF EPS for Facebook is currently ~9% above consensus levels.
Key Drivers Into 2014
FB is a mobile-majority company in 2014
As Mobile becomes the majority of Ad revenue in 2014, we believe investors have shifted their focus from the mobile transition to mobile monetization and higher pricing potential, which is where Facebook’s ad platform is most differentiated. Quite simply, Mobile has moved from a headwind in 2013 to a tailwind in 2014. We note that Facebook’s Mobile revenue growth has been robust despite relatively modest ad load increases, suggesting users, usage, and ad-quality improvements can continue to drive strong revenue growth going forward. We believe managing ad load is important to maintaining the user experience for the long term and we think higher ad prices can be driven by continued increases in News Feed ad demand and quality, along with app install ads, FBX in the Mobile News Feed, and auto-play video ads. We believe these factors will contribute to Facebook’s ongoing efforts to build demand among branded advertisers.
Overweight
Company DataPrice ($) 57.20Date Of Price 06-Jan-1452-week Range ($) 58.58-22.67Market Cap ($ mn) 140,197.20Fiscal Year End DecShares O/S (mn) 2,451Price Target ($) 62.00Price Target End Date 31-Dec-14
Facebook Inc. (FB;FB US)
FYE Dec 2012A 2013E 2014E 2015EEPS - Reported ($)Q1 (Mar) 0.12 0.12A - -Q2 (Jun) 0.12 0.19A - -Q3 (Sep) 0.12 0.25A - -Q4 (Dec) 0.17 0.28 - -FY 0.54 0.84 1.22 1.66CONSENSUS_EPSBloomberg EPS FY ($) 0.51 0.83 1.13 1.48Source: Company data, Bloomberg, J.P. Morgan estimates.
Overweight
FB,FB US
Price: $57.20
Price Target: $62.00
United States
Internet
Doug Anmuth AC
(1-212) 622-6571
Bloomberg JPMA ANMUTH <GO>
J.P. Morgan Securities LLC
20
30
40
50
60
$
Jan-13 Apr-13 Jul-13 Oct-13 Jan-14
Price Performance
FB share price ($)
S&P500 (rebased)
YTD 1m 3m 12mAbs 6.0% 20.8% 14.7% 96.9%Rel 6.6% 19.0% 5.0% 71.2%
50
North America Equity Research09 January 2014
Doug Anmuth(1-212) [email protected]
Taking a pause on ad load likely the right long-term strategy
Increasing the ad load for the News Feed has been an important driver of Facebook’s ad revenue growth in 2013, though we believe users, engagement, and ad quality/pricing have also been significant monetization drivers. Facebook indicated that it expects little additional growth in ad load (i.e. % of News Feed stories that are ads) going forward and that future monetization gains are likely to be driven by ad-quality improvements. However, we remain confident that Facebook is not stopping ad load increases, but only slowing them in its ongoing efforts to optimize the user experience—the right thing to do over the long term, in our view. And as advertiser demand and quality around Facebook ads continue to increase, we believe that will enable greater quantity over time. We note that Facebook’s 3Q Mobile revenue grew 34% Q/Q despite relatively modest ad load increases, suggesting users, usage, and ad-quality improvements can continue to drive strong revenue growth going forward. In 2014, we are projecting Facebook’s mobile ad revenue to grow 107% Y/Y to $6.3B.
Teen engagement to be driven by Instagram and Messenger
Strong 3Q results were overshadowed by the company’s comments around decreasing usage among younger teens. In terms of teen engagement, we think the decrease in daily usage is limited to a small portion of younger teens, likely ages 13-15, and some of these users may be shifting to Facebook-owned Instagram, which will monetize more in 2014. Facebook is also focusing on the updated Facebook Messenger, which enables texting outside of Facebook simply through phone numbers, as well as direct messaging in Instagram. We believe Facebook Messenger—which is gaining traction following an update to include non-Facebook users based on phone numbers in 4Q—is helping to address teenage usage, enabling Facebook to be more competitive with Twitter and other messaging apps, as well as opening up the possibility for additional methods of monetization going forward.
Instagram monetization to ramp
Instagram recently began showing ads from a small number of hand-selected brand marketers including Ben & Jerry’s, Burberry, GE, Lexus, Levi’s, Macy’s, Michael Kors, PayPal, and Starwood. We believe Instagram ads will roll out slowly, and the model over time could feature a lower ad load and perhaps higher CPMs than what exist on Facebook. We believe Instagram’s social and visual medium will be attractive for advertisers and we do not currently factor Instagram advertising into our Facebook estimates. Additionally, we believe this helps Facebook compete more directly against Twitter and Vine.
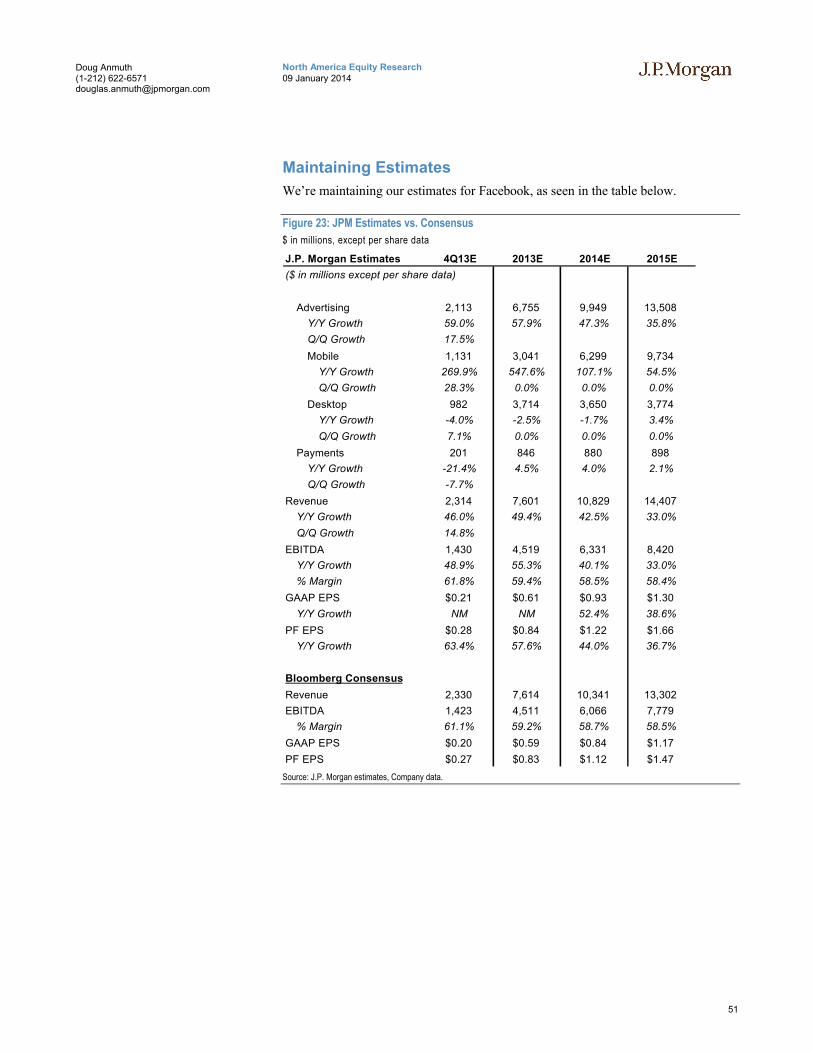
51
North America Equity Research09 January 2014
Doug Anmuth(1-212) [email protected]
Maintaining Estimates
We’re maintaining our estimates for Facebook, as seen in the table below.
Figure 23: JPM Estimates vs. Consensus
$ in millions, except per share data
J.P. Morgan Estimates 4Q13E 2013E 2014E 2015E
($ in millions except per share data)
Advertising 2,113 6,755 9,949 13,508
Y/Y Growth 59.0% 57.9% 47.3% 35.8%
Q/Q Growth 17.5%
Mobile 1,131 3,041 6,299 9,734
Y/Y Growth 269.9% 547.6% 107.1% 54.5%
Q/Q Growth 28.3% 0.0% 0.0% 0.0%
Desktop 982 3,714 3,650 3,774
Y/Y Growth -4.0% -2.5% -1.7% 3.4%
Q/Q Growth 7.1% 0.0% 0.0% 0.0%
Payments 201 846 880 898
Y/Y Growth -21.4% 4.5% 4.0% 2.1%
Q/Q Growth -7.7%
Revenue 2,314 7,601 10,829 14,407
Y/Y Growth 46.0% 49.4% 42.5% 33.0%
Q/Q Growth 14.8%
EBITDA 1,430 4,519 6,331 8,420
Y/Y Growth 48.9% 55.3% 40.1% 33.0%
% Margin 61.8% 59.4% 58.5% 58.4%
GAAP EPS $0.21 $0.61 $0.93 $1.30
Y/Y Growth NM NM 52.4% 38.6%
PF EPS $0.28 $0.84 $1.22 $1.66
Y/Y Growth 63.4% 57.6% 44.0% 36.7%
Bloomberg Consensus
Revenue 2,330 7,614 10,341 13,302
EBITDA 1,423 4,511 6,066 7,779
% Margin 61.1% 59.2% 58.7% 58.5%
GAAP EPS $0.20 $0.59 $0.84 $1.17
PF EPS $0.27 $0.83 $1.12 $1.47
Source: J.P. Morgan estimates, Company data.
52
North America Equity Research09 January 2014
Doug Anmuth(1-212) [email protected]
Investment Thesis, Valuation and Risks
Facebook (Overweight; Price Target: $62.00)
Investment Thesis
We believe Facebook’s virtual ownership of the social graph, strong competitive moat, and focus on the user experience position the company to significantly improve monetization over time and to become an enduring, blue-chip company built for the long term. Facebook’s massive reach and engagement continue to drive network effects and its targeting abilities provide significant value to advertisers, though it is still early. We believe Facebook’s ad platform is just beginning to shift toward more social ads with higher-quality formats, and it will become increasingly valuable to advertisers.
Valuation
$62 Price Target. Our 2014 December year-end price target of $62 employs an average of a DCF and multiples (EV/EBITDA and P/E) based valuation. We’re using this valuation approach as we believe it appropriately balances Facebook’s valuation relative to its growth and industry peers, while a DCF gives the company some credit for the opportunity to improve monetization over the long term.
Our DCF results in a $63 price per share and employs an 11% WACC and 3% long-term growth rate. We expect Facebook to generate $33.6B in revenue in 2020 with a 58% EBITDA margin.
Our EV/EBITDA valuation results in a $66 price per share and employs an 18x target EV/EBITDA multiple on our 2015E EBITDA of $8.4B. We note that our 18x 2015E EBITDA target multiple is at a discount to its high-growth industry peers such as Netflix (20x) and TripAdvisor (19x) but at a premium to other online advertising peers such as Google (9x).
Our P/E valuation results in a $58 price per share and employs a 35x P/E multiple on our 2015E PF EPS estimate of $1.66, which is below Facebook’s 36% 2013-16E PF EPS CAGR.
Risks to Rating and Price Target
Downside risks include: 1) user-first mentality could create short-term revenue risk and volatility; 2) competition from purpose-driven social services; 3) advertiser ROI on Facebook may remain difficult to measure; 4) privacy, security, and regulatory risks; 5) competition for online and mobile ad dollars from Google, Yahoo!, and other online advertising companies; and 6) dual-class share structure and Mark Zuckerberg’s control.
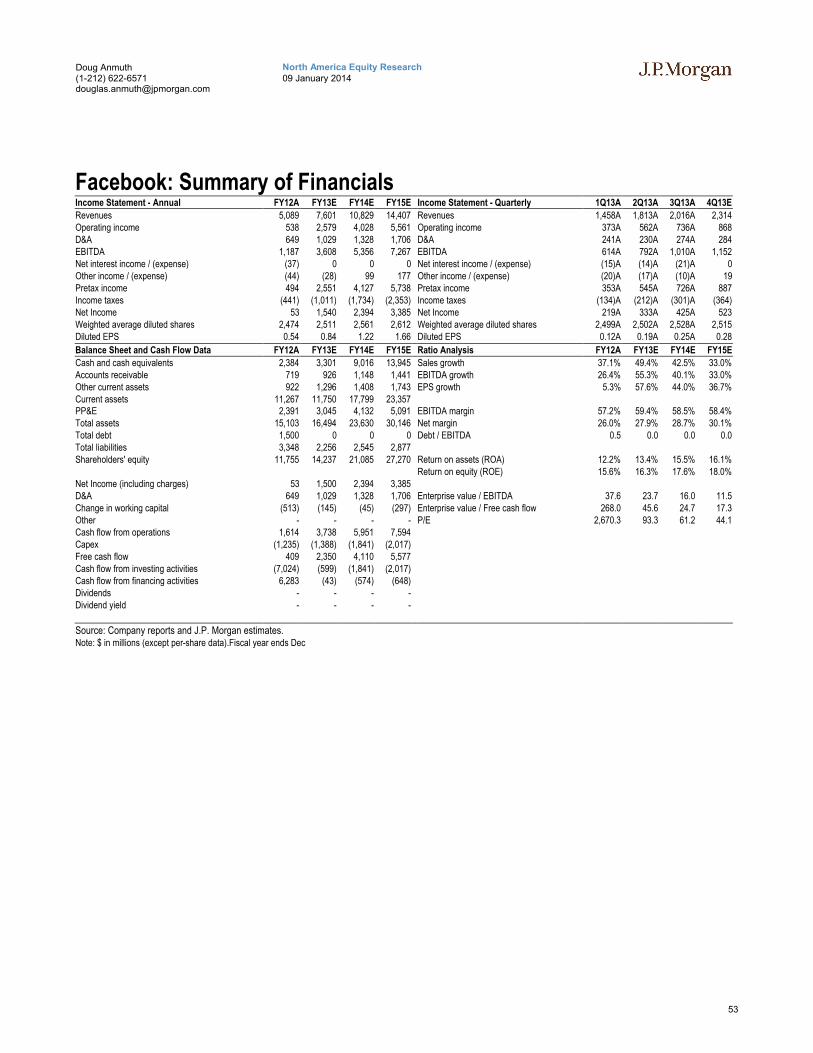
53
North America Equity Research09 January 2014
Doug Anmuth(1-212) [email protected]
Facebook: Summary of FinancialsIncome Statement - Annual FY12A FY13E FY14E FY15E Income Statement - Quarterly 1Q13A 2Q13A 3Q13A 4Q13E
Revenues 5,089 7,601 10,829 14,407 Revenues 1,458A 1,813A 2,016A 2,314Operating income 538 2,579 4,028 5,561 Operating income 373A 562A 736A 868D&A 649 1,029 1,328 1,706 D&A 241A 230A 274A 284EBITDA 1,187 3,608 5,356 7,267 EBITDA 614A 792A 1,010A 1,152Net interest income / (expense) (37) 0 0 0 Net interest income / (expense) (15)A (14)A (21)A 0Other income / (expense) (44) (28) 99 177 Other income / (expense) (20)A (17)A (10)A 19Pretax income 494 2,551 4,127 5,738 Pretax income 353A 545A 726A 887Income taxes (441) (1,011) (1,734) (2,353) Income taxes (134)A (212)A (301)A (364)Net Income 53 1,540 2,394 3,385 Net Income 219A 333A 425A 523Weighted average diluted shares 2,474 2,511 2,561 2,612 Weighted average diluted shares 2,499A 2,502A 2,528A 2,515Diluted EPS 0.54 0.84 1.22 1.66 Diluted EPS 0.12A 0.19A 0.25A 0.28
Balance Sheet and Cash Flow Data FY12A FY13E FY14E FY15E Ratio Analysis FY12A FY13E FY14E FY15E
Cash and cash equivalents 2,384 3,301 9,016 13,945 Sales growth 37.1% 49.4% 42.5% 33.0%Accounts receivable 719 926 1,148 1,441 EBITDA growth 26.4% 55.3% 40.1% 33.0%Other current assets 922 1,296 1,408 1,743 EPS growth 5.3% 57.6% 44.0% 36.7%Current assets 11,267 11,750 17,799 23,357PP&E 2,391 3,045 4,132 5,091 EBITDA margin 57.2% 59.4% 58.5% 58.4%Total assets 15,103 16,494 23,630 30,146 Net margin 26.0% 27.9% 28.7% 30.1%Total debt 1,500 0 0 0 Debt / EBITDA 0.5 0.0 0.0 0.0Total liabilities 3,348 2,256 2,545 2,877Shareholders' equity 11,755 14,237 21,085 27,270 Return on assets (ROA) 12.2% 13.4% 15.5% 16.1%
Return on equity (ROE) 15.6% 16.3% 17.6% 18.0%Net Income (including charges) 53 1,500 2,394 3,385D&A 649 1,029 1,328 1,706 Enterprise value / EBITDA 37.6 23.7 16.0 11.5Change in working capital (513) (145) (45) (297) Enterprise value / Free cash flow 268.0 45.6 24.7 17.3Other - - - - P/E 2,670.3 93.3 61.2 44.1Cash flow from operations 1,614 3,738 5,951 7,594Capex (1,235) (1,388) (1,841) (2,017)Free cash flow 409 2,350 4,110 5,577Cash flow from investing activities (7,024) (599) (1,841) (2,017)Cash flow from financing activities 6,283 (43) (574) (648)Dividends - - - -Dividend yield - - - -
Source: Company reports and J.P. Morgan estimates.Note: $ in millions (except per-share data).Fiscal year ends Dec

54
North America Equity Research09 January 2014
Doug Anmuth(1-212) [email protected]
eBay, Inc
eBay underperformed in 2013 as numbers came down following each of the three reported quarters since the March Investor Day, partly due to decelerating International GMV and PayPal margins. However, we believe sentiment is mixed to negative now—with likely general expectations for numbers to come down in January—and we remain optimistic on eBay’s long-term opportunities in mobile and offline retail/payments.
Key Drivers Into 2014
Marketplace GMV comps ease a bit in 2014
We believe Marketplace GMV growth could improve in 2014 as eBay benefits from easier Y/Y compares, continued strong user growth, increased inventory from large retailers, mobile, and site improvements. We look for overall FX-neutral ex-vehicles GMV growth of 13% in 2014—14.6% in the US—with potential for faster growthfaster in the first half of 2014. We also believe eBay GMV can grow at or above reported comScore eCommerce growth numbers as international macro conditions improve.
Continued strong Payments Merchant Services TPV growth
Payments Merchant Services TPV growth accelerated to ~28% in 2013 and we expect it to remain in the mid-20s (%) range in 2014. However, higher Merchant Services TPV growth in 2013 came at the expense of some revenue take-rate compression as PayPal’s merchant mix shifts towards larger merchants. We believe PayPal continues to benefit from broader merchant adoption. Mobile should also remain a strong driver of Payments, including through incremental PayPal Mobile Express Checkout purchases. We view eBay’s complete value proposition to traditional retailers across Marketplace, Payments, and GSI as compelling and we believe it should yield deeper PayPal penetration over time.
Overweight
Company DataPrice ($) 51.78Date Of Price 06-Jan-1452-week Range ($) 58.04-48.06Fiscal Year End DecShares O/S (mn) 1,314Price Target ($) 56.00Price Target End Date 31-Dec-14Market Cap ($ mn) 68,038.92
eBay Inc (EBAY;EBAY US)
FYE Dec 2011A 2012A 2013E 2014E 2015EEPS - Reported ($)Q1 (Mar) 0.47 0.55 0.63A - -Q2 (Jun) 0.48 0.56 0.63A - -Q3 (Sep) 0.48 0.55 0.64A - -Q4 (Dec) 0.60 0.70 0.79 - -FY 2.03 2.36 2.68 3.03 3.44Bloomberg EPS FY ($) 2.00 2.35 2.70 3.14 3.63Source: Company data, Bloomberg, J.P. Morgan estimates.
Overweight
EBAY,EBAY US
Price: $51.78
Price Target: $56.00
United States
Internet
Doug Anmuth AC
(1-212) 622-6571
Bloomberg JPMA ANMUTH <GO>
J.P. Morgan Securities LLC
45
50
55
60
65
70
$
Jan-13 Apr-13 Jul-13 Oct-13 Jan-14
Price Performance
EBAY share price ($)
S&P500 (rebased)
YTD 1m 3m 12mAbs 4.1% 1.0% -1.0% 3.5%Rel -21.2% 1.6% -6.2% -21.4%
55
North America Equity Research09 January 2014
Doug Anmuth(1-212) [email protected]
Mobile remains a key growth driver
We believe eBay is extremely well positioned in mobile across both Marketplace and Payments, each of which are expected to do ~$20B of mobile volume in 2013. On the Marketplace side, eBay has been innovative with mobile apps, creating a seamless buying and selling experience that we believe has reinvigorated the business and also attracted a younger demographic. While eBay’s mobile products have seen strong user and engagement growth, conversions have lagged as mobile users tend to be younger and from emerging markets, and therefore they have not been as meaningful to eBay’s GMV growth over the last few quarters. However, Mobile remains important to eBay’s overall user growth strategy and it touches nearly one in every three purchases on eBay. We expect eBay to continue enhancing the mobile shopping and payments experience.
Will eBay reset the bar for 2015?
While we remain positive on eBay’s long-term opportunities for growth, we are modeling 2015 revenue and PF EPS of $20.85B and $3.44, below the company’s Analyst Day guidance of $21.5-23.5B and $3.59-3.98, respectively. Our numbers contemplate very little revenue benefit from the company’s offline retail and payments initiatives in the intermediate term though we do think eBay is wellpositioned here for the long term. We think it’s likely the company could lower its 2015 guidance on the 4Q13 earnings call in January, which we think is mostly expected, and could actually be a positive as eBay lowers the bar.
Long-term Marketplaces levers remain intact in 2014
We think eBay’s recent underlying Marketplaces metrics bode well for growth heading into 2014. Marketplaces user growth has accelerated for seven straight quarters and grew 14% Y/Y in 3Q13, the fastest growth since 2007. Sold items growth has been 11% the last 3 quarters despite tough Y/Y compares and eBay has successfully shifted sales toward Top Rated Sellers (46% of US GMV in 3Q). Beyond these strong underlying metrics and shifting more sales toward high-quality sellers, eBay should benefit in 2014 from continued improvements to its desktop site and mobile apps, better leveraging of data, and new search technology.
Further blurring of the line between eCommerce and traditional retail
eBay’s go-to-market strategy for big retailers has been that the company can offer liquidation and volume sales through Marketplaces, online and offline payments capabilities through PayPal and BillMeLater, and fulfillment and commerce technology through eBay Enterprise. And eBay would be able to partner with retailers across these areas without competing with them. As the lines between online and offline commerce continue to fade, we think eBay is well positioned. The expansion of eBay Now beyond the Bay Area and New York markets is another example of how eBay is bringing online and offline retail closer together.
Potentially higher than expected investments in 2014
While eBay has delivered mid-teens revenue growth in 2013 while keeping margins intact, we think 2014 could witness additional investments to drive higher revenue growth. We note that Sales & Marketing as a % of revenue was down ~130 bps Y/Y to 18.4% in 2013 and we think there’s potential for increases in Sales & Marketing expense as a % of revenue in 2014. We expect eBay to also prudently invest against its long-term opportunities in omni-channel retail, offline payments, mobile, and emerging markets.
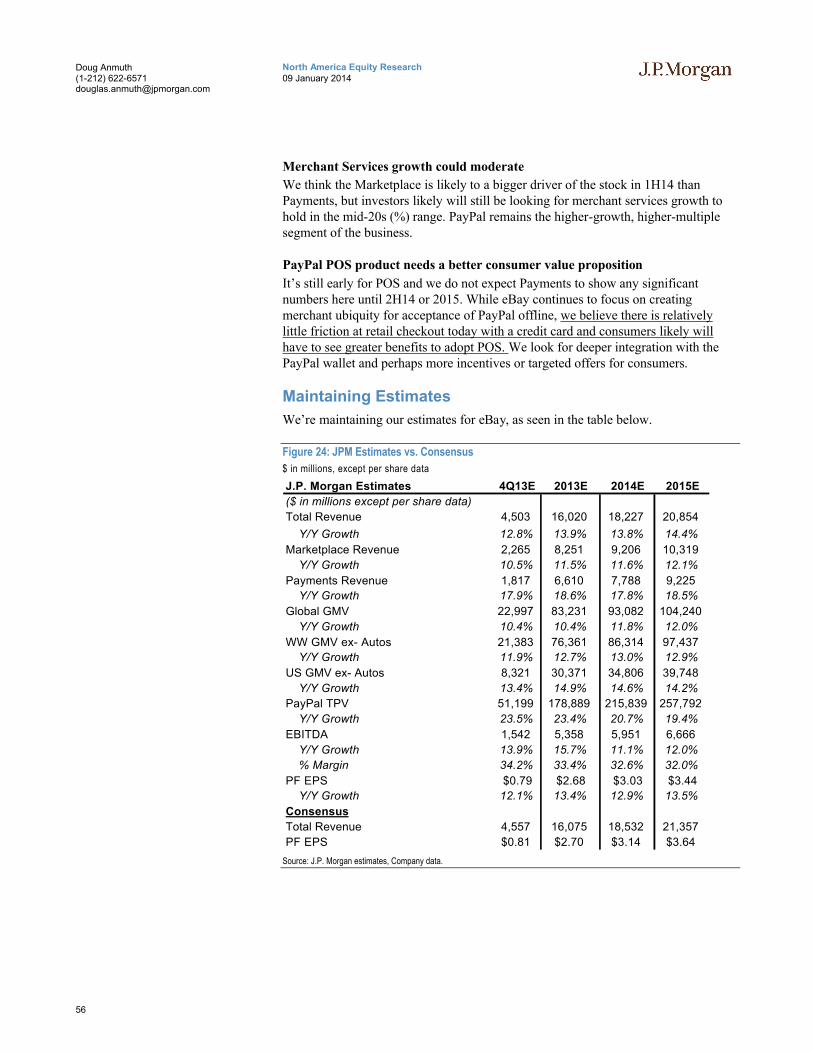
56
North America Equity Research09 January 2014
Doug Anmuth(1-212) [email protected]
Merchant Services growth could moderate
We think the Marketplace is likely to a bigger driver of the stock in 1H14 than Payments, but investors likely will still be looking for merchant services growth to hold in the mid-20s (%) range. PayPal remains the higher-growth, higher-multiple segment of the business.
PayPal POS product needs a better consumer value proposition
It’s still early for POS and we do not expect Payments to show any significant numbers here until 2H14 or 2015. While eBay continues to focus on creating merchant ubiquity for acceptance of PayPal offline, we believe there is relatively little friction at retail checkout today with a credit card and consumers likely will have to see greater benefits to adopt POS. We look for deeper integration with the PayPal wallet and perhaps more incentives or targeted offers for consumers.
Maintaining Estimates
We’re maintaining our estimates for eBay, as seen in the table below.
Figure 24: JPM Estimates vs. Consensus
$ in millions, except per share data
J.P. Morgan Estimates 4Q13E 2013E 2014E 2015E
($ in millions except per share data)
Total Revenue 4,503 16,020 18,227 20,854
Y/Y Growth 12.8% 13.9% 13.8% 14.4%
Marketplace Revenue 2,265 8,251 9,206 10,319
Y/Y Growth 10.5% 11.5% 11.6% 12.1%
Payments Revenue 1,817 6,610 7,788 9,225
Y/Y Growth 17.9% 18.6% 17.8% 18.5%
Global GMV 22,997 83,231 93,082 104,240
Y/Y Growth 10.4% 10.4% 11.8% 12.0%
WW GMV ex- Autos 21,383 76,361 86,314 97,437
Y/Y Growth 11.9% 12.7% 13.0% 12.9%
US GMV ex- Autos 8,321 30,371 34,806 39,748
Y/Y Growth 13.4% 14.9% 14.6% 14.2%
PayPal TPV 51,199 178,889 215,839 257,792
Y/Y Growth 23.5% 23.4% 20.7% 19.4%
EBITDA 1,542 5,358 5,951 6,666
Y/Y Growth 13.9% 15.7% 11.1% 12.0%
% Margin 34.2% 33.4% 32.6% 32.0%
PF EPS $0.79 $2.68 $3.03 $3.44
Y/Y Growth 12.1% 13.4% 12.9% 13.5%
Consensus
Total Revenue 4,557 16,075 18,532 21,357
PF EPS $0.81 $2.70 $3.14 $3.64
Source: J.P. Morgan estimates, Company data.
57
North America Equity Research09 January 2014
Doug Anmuth(1-212) [email protected]
Investment Thesis, Valuation and Risks
eBay, Inc (Overweight; Price Target: $56.00)
Investment Thesis
Maintain Overweight. eBay has become an increasingly important partner for retailers across all 3 segments—Marketplaces, Payments, and GSI—and continues to benefit from its strong mobile presence. We believe the company is highly innovative in terms of mCommerce, mobile payments, and online/offline shopping convergence and well positioned to grow above eCommerce growth rates. We reiterate our Overweight rating on EBAY.
Valuation
Our year-end 2014 price target of $56 is based on ~16x our 2015E EPS. We believe EBAY shares should trade at a premium to the S&P 500, which currently trades at P/E of ~13x, as eBay is one of the few companies in the S&P 500 growing revenue at a ~15% 2012-15E CAGR.
Risks to Rating and Price Target
Downside risks include: 1) an increase in competitive share in the eCommerce and hardline retail market (e.g., Amazon, Wal-Mart); 2) PayPal competition from large technology and credit card players as well as financial institutions; and 3) take-rate erosion.

58
North America Equity Research09 January 2014
Doug Anmuth(1-212) [email protected]
eBay, Inc: Summary of FinancialsIncome Statement - Annual FY12A FY13E FY14E FY15E Income Statement - Quarterly 1Q13A 2Q13A 3Q13A 4Q13E
Revenues 14,071 16,020 18,227 20,854 Revenues 3,748A 3,877A 3,892A 4,503Operating income 2,889 3,391 3,885 4,495 Operating income 800A 750A 799A 1,042D&A 1,201 1,379 1,467 1,543 D&A 329A 347A 357A 346EBITDA 4,090 4,770 5,352 6,038 EBITDA 1,129A 1,097A 1,156A 1,388Net interest income / (expense) 77 89 10 47 Net interest income / (expense) 9A 6A 74A (0)Other income / (expense) 195 89 10 47 Other income / (expense) 9A 6A 74A (0)Pretax income 3,084 3,480 3,895 4,542 Pretax income 809A 756A 873A 1,042Income taxes (474) (590) (623) (727) Income taxes (132)A (116)A (184)A (158)Net Income 2,610 2,889 3,272 3,816 Net Income 677A 640A 689A 883Weighted average diluted shares 1,312 1,313 1,315 1,317 Weighted average diluted shares 1,319A 1,313A 1,310A 1,310Diluted EPS 2.36 2.68 3.03 3.44 Diluted EPS 0.63A 0.63A 0.64A 0.79
Balance Sheet and Cash Flow Data FY12A FY13E FY14E FY15E Ratio Analysis FY12A FY13E FY14E FY15E
Cash and cash equivalents 6,817 4,763 9,128 12,978 Sales growth 20.8% 13.9% 13.8% 14.4%Accounts receivable 822 902 1,033 1,163 EBITDA growth 20.4% 15.7% 11.1% 12.0%Other current assets 11,353 8,301 9,357 10,464 EPS growth 16.4% 13.4% 12.9% 13.5%Current assets 21,583 18,958 24,509 29,596PP&E 2,491 2,923 3,398 3,906 EBITDA margin 32.9% 33.4% 32.6% 32.0%Total assets 37,274 36,480 42,609 48,314 Net margin 22.0% 22.0% 21.8% 21.7%Total debt 4,519 4,431 4,431 3,581 Debt / EBITDA 1.0 0.8 0.7 0.5Total liabilities 16,399 12,886 15,742 17,633Shareholders' equity 20,875 23,594 26,866 30,682 Return on assets (ROA) 9.6% 9.5% 10.1% 10.0%
Return on equity (ROE) 16.0% 15.8% 15.8% 15.7%Net Income (including charges) 2,610 2,889 3,272 3,816D&A 1,201 1,379 1,467 1,543 Enterprise value / EBITDA 14.7 13.1 11.0 9.1Change in working capital 0 0 256 (15) Enterprise value / Free cash flow 25.6 25.5 13.4 11.7Other - - - - P/E 26.0 23.5 20.8 17.9Cash flow from operations 3,839 4,199 6,473 6,928Capex (1,257) (1,374) (1,549) (1,668)Free cash flow 2,659 2,748 4,915 5,220Cash flow from investing activities (3,763) (5,199) (1,549) (1,668)Cash flow from financing activities 1,951 (1,084) (591) (1,441)Dividends - - - -Dividend yield - - - -
Source: Company reports and J.P. Morgan estimates.Note: $ in millions (except per-share data).Fiscal year ends Dec
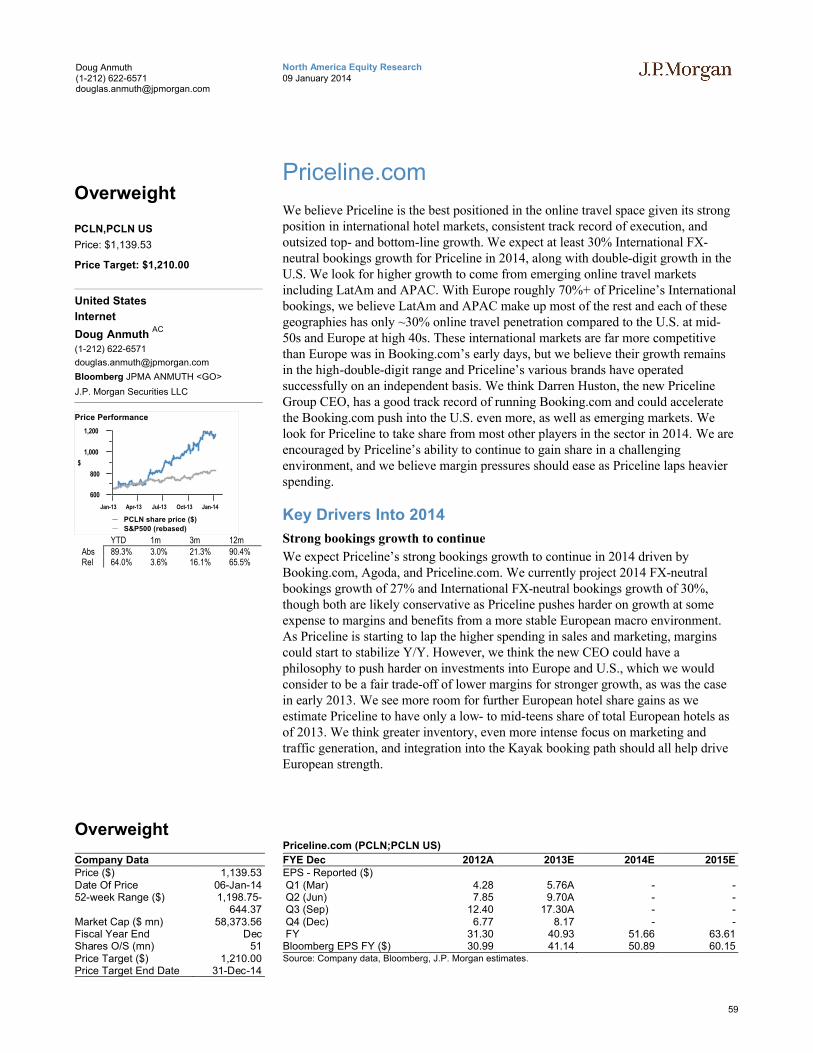
59
North America Equity Research09 January 2014
Doug Anmuth(1-212) [email protected]
Priceline.com
We believe Priceline is the best positioned in the online travel space given its strong position in international hotel markets, consistent track record of execution, and outsized top- and bottom-line growth. We expect at least 30% International FX-neutral bookings growth for Priceline in 2014, along with double-digit growth in the U.S. We look for higher growth to come from emerging online travel markets including LatAm and APAC. With Europe roughly 70%+ of Priceline’s International bookings, we believe LatAm and APAC make up most of the rest and each of these geographies has only ~30% online travel penetration compared to the U.S. at mid-50s and Europe at high 40s. These international markets are far more competitive than Europe was in Booking.com’s early days, but we believe their growth remains in the high-double-digit range and Priceline’s various brands have operated successfully on an independent basis. We think Darren Huston, the new Priceline Group CEO, has a good track record of running Booking.com and could accelerate the Booking.com push into the U.S. even more, as well as emerging markets. We look for Priceline to take share from most other players in the sector in 2014. We are encouraged by Priceline’s ability to continue to gain share in a challenging environment, and we believe margin pressures should ease as Priceline laps heavier spending.
Key Drivers Into 2014
Strong bookings growth to continue
We expect Priceline’s strong bookings growth to continue in 2014 driven by Booking.com, Agoda, and Priceline.com. We currently project 2014 FX-neutral bookings growth of 27% and International FX-neutral bookings growth of 30%, though both are likely conservative as Priceline pushes harder on growth at some expense to margins and benefits from a more stable European macro environment. As Priceline is starting to lap the higher spending in sales and marketing, margins could start to stabilize Y/Y. However, we think the new CEO could have a philosophy to push harder on investments into Europe and U.S., which we would consider to be a fair trade-off of lower margins for stronger growth, as was the casein early 2013. We see more room for further European hotel share gains as we estimate Priceline to have only a low- to mid-teens share of total European hotels as of 2013. We think greater inventory, even more intense focus on marketing and traffic generation, and integration into the Kayak booking path should all help drive European strength.
Overweight
Company DataPrice ($) 1,139.53Date Of Price 06-Jan-1452-week Range ($) 1,198.75-
644.37Market Cap ($ mn) 58,373.56Fiscal Year End DecShares O/S (mn) 51Price Target ($) 1,210.00Price Target End Date 31-Dec-14
Priceline.com (PCLN;PCLN US)
FYE Dec 2012A 2013E 2014E 2015EEPS - Reported ($)Q1 (Mar) 4.28 5.76A - -Q2 (Jun) 7.85 9.70A - -Q3 (Sep) 12.40 17.30A - -Q4 (Dec) 6.77 8.17 - -FY 31.30 40.93 51.66 63.61Bloomberg EPS FY ($) 30.99 41.14 50.89 60.15Source: Company data, Bloomberg, J.P. Morgan estimates.
Overweight
PCLN,PCLN US
Price: $1,139.53
Price Target: $1,210.00
United States
Internet
Doug Anmuth AC
(1-212) 622-6571
Bloomberg JPMA ANMUTH <GO>
J.P. Morgan Securities LLC
600
800
1,000
1,200
$
Jan-13 Apr-13 Jul-13 Oct-13 Jan-14
Price Performance
PCLN share price ($)
S&P500 (rebased)
YTD 1m 3m 12mAbs 89.3% 3.0% 21.3% 90.4%Rel 64.0% 3.6% 16.1% 65.5%
60
North America Equity Research09 January 2014
Doug Anmuth(1-212) [email protected]
Secular growth opportunities in LatAm and APAC
We continue to believe Priceline is well positioned in emerging online travel markets including APAC and Latam. With Europe roughly 70%+ of Priceline’s International bookings, we believe LatAm and APAC make up most of the rest and each of these geographies has only ~30% online travel penetration. These international markets are far more competitive than Europe was in Booking.com’s early days, but we believe their growth remains in the high-double-digit range and Priceline’s various brands have operated successfully on an independent basis. Additionally, as the World Cup is being hosted in Brazil in 2014, we look for increased inventory, online traffic, and overall travel volumes to drive higher international growth for Booking.com in the region, especially with cross-border travel from Europe.
Priceline to boost Kayak international expansion efforts in 2014
Following the close of the Kayak acquisition, we have seen a greater presence of Priceline and Booking.com products integrated into Kayak. We believe Priceline is focused on Kayak’s booking path potential in hotels and International markets, along with traffic diversification. While we think Kayak is helping the Priceline brand and Booking.com in the U.S., we look for the focus to shift to international expansion by leveraging the various Priceline Group brands in foreign markets.
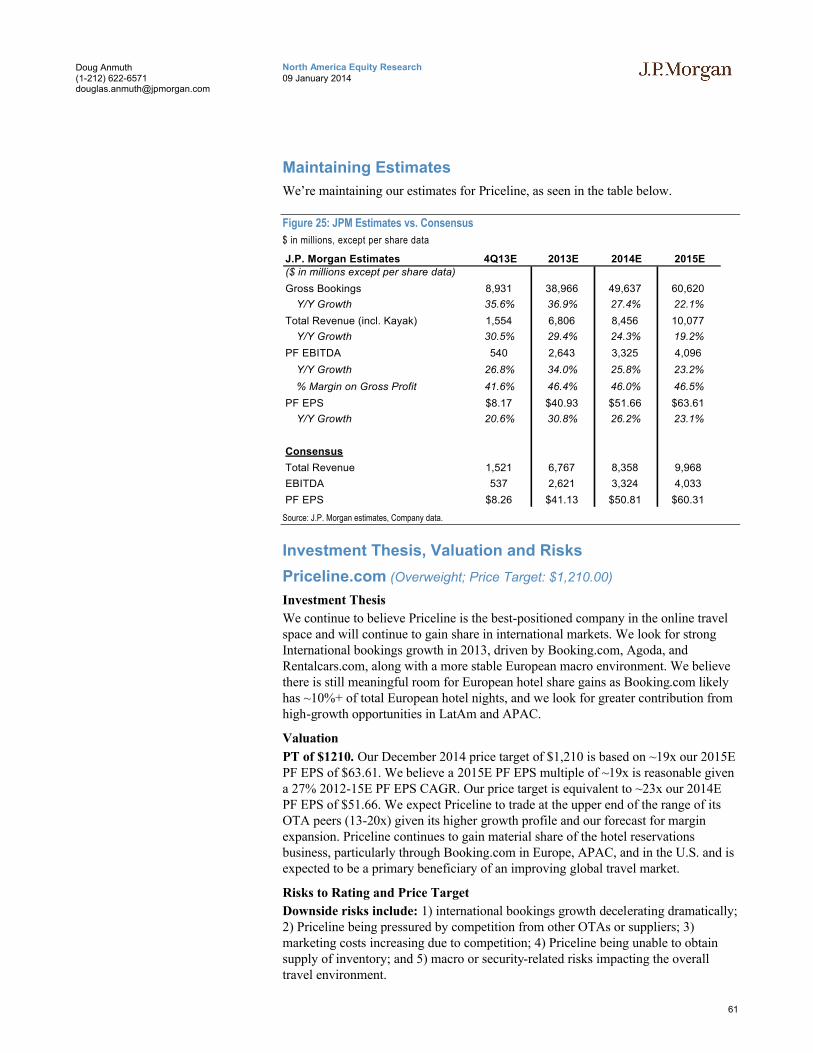
61
North America Equity Research09 January 2014
Doug Anmuth(1-212) [email protected]
Maintaining Estimates
We’re maintaining our estimates for Priceline, as seen in the table below.
Figure 25: JPM Estimates vs. Consensus
$ in millions, except per share data
J.P. Morgan Estimates 4Q13E 2013E 2014E 2015E($ in millions except per share data)
Gross Bookings 8,931 38,966 49,637 60,620
Y/Y Growth 35.6% 36.9% 27.4% 22.1%
Total Revenue (incl. Kayak) 1,554 6,806 8,456 10,077
Y/Y Growth 30.5% 29.4% 24.3% 19.2%
PF EBITDA 540 2,643 3,325 4,096
Y/Y Growth 26.8% 34.0% 25.8% 23.2%
% Margin on Gross Profit 41.6% 46.4% 46.0% 46.5%
PF EPS $8.17 $40.93 $51.66 $63.61
Y/Y Growth 20.6% 30.8% 26.2% 23.1%
Consensus
Total Revenue 1,521 6,767 8,358 9,968
EBITDA 537 2,621 3,324 4,033
PF EPS $8.26 $41.13 $50.81 $60.31
Source: J.P. Morgan estimates, Company data.
Investment Thesis, Valuation and Risks
Priceline.com (Overweight; Price Target: $1,210.00)
Investment Thesis
We continue to believe Priceline is the best-positioned company in the online travel space and will continue to gain share in international markets. We look for strong International bookings growth in 2013, driven by Booking.com, Agoda, and Rentalcars.com, along with a more stable European macro environment. We believe there is still meaningful room for European hotel share gains as Booking.com likely has ~10%+ of total European hotel nights, and we look for greater contribution from high-growth opportunities in LatAm and APAC.
Valuation
PT of $1210. Our December 2014 price target of $1,210 is based on ~19x our 2015E PF EPS of $63.61. We believe a 2015E PF EPS multiple of ~19x is reasonable given a 27% 2012-15E PF EPS CAGR. Our price target is equivalent to ~23x our 2014E PF EPS of $51.66. We expect Priceline to trade at the upper end of the range of its OTA peers (13-20x) given its higher growth profile and our forecast for margin expansion. Priceline continues to gain material share of the hotel reservations business, particularly through Booking.com in Europe, APAC, and in the U.S. and is expected to be a primary beneficiary of an improving global travel market.
Risks to Rating and Price Target
Downside risks include: 1) international bookings growth decelerating dramatically; 2) Priceline being pressured by competition from other OTAs or suppliers; 3) marketing costs increasing due to competition; 4) Priceline being unable to obtain supply of inventory; and 5) macro or security-related risks impacting the overall travel environment.
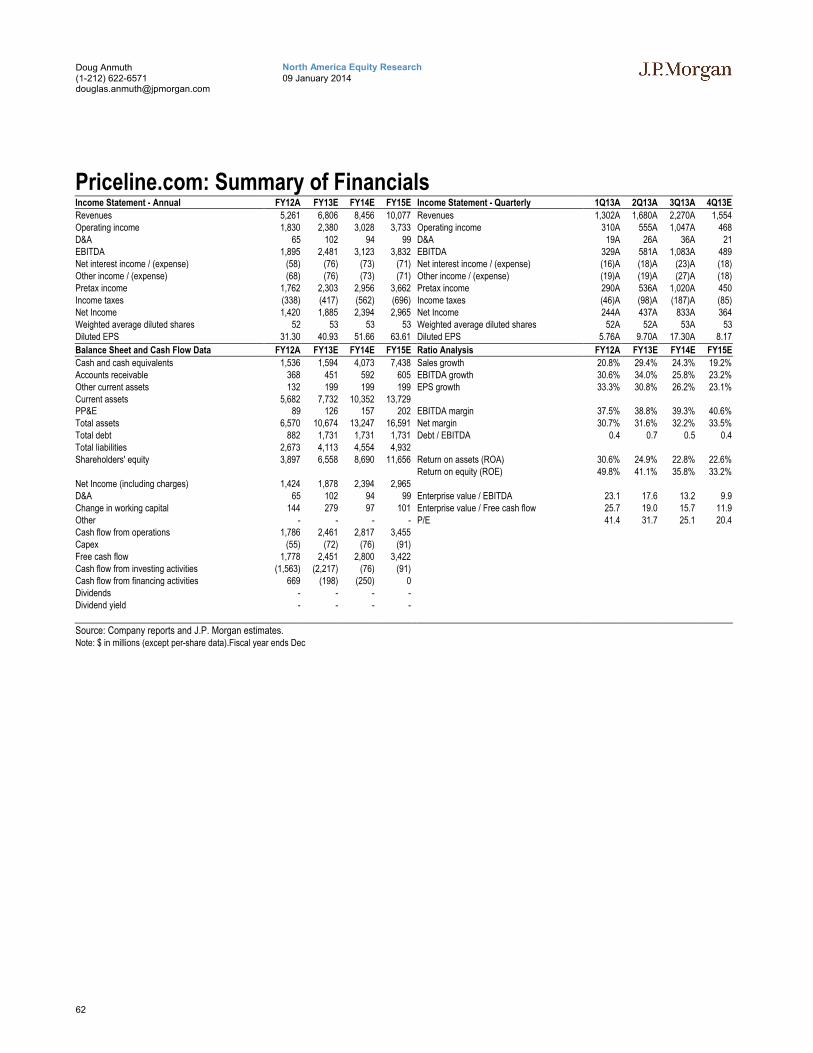
62
North America Equity Research09 January 2014
Doug Anmuth(1-212) [email protected]
Priceline.com: Summary of FinancialsIncome Statement - Annual FY12A FY13E FY14E FY15E Income Statement - Quarterly 1Q13A 2Q13A 3Q13A 4Q13E
Revenues 5,261 6,806 8,456 10,077 Revenues 1,302A 1,680A 2,270A 1,554Operating income 1,830 2,380 3,028 3,733 Operating income 310A 555A 1,047A 468D&A 65 102 94 99 D&A 19A 26A 36A 21EBITDA 1,895 2,481 3,123 3,832 EBITDA 329A 581A 1,083A 489Net interest income / (expense) (58) (76) (73) (71) Net interest income / (expense) (16)A (18)A (23)A (18)Other income / (expense) (68) (76) (73) (71) Other income / (expense) (19)A (19)A (27)A (18)Pretax income 1,762 2,303 2,956 3,662 Pretax income 290A 536A 1,020A 450Income taxes (338) (417) (562) (696) Income taxes (46)A (98)A (187)A (85)Net Income 1,420 1,885 2,394 2,965 Net Income 244A 437A 833A 364Weighted average diluted shares 52 53 53 53 Weighted average diluted shares 52A 52A 53A 53Diluted EPS 31.30 40.93 51.66 63.61 Diluted EPS 5.76A 9.70A 17.30A 8.17
Balance Sheet and Cash Flow Data FY12A FY13E FY14E FY15E Ratio Analysis FY12A FY13E FY14E FY15E
Cash and cash equivalents 1,536 1,594 4,073 7,438 Sales growth 20.8% 29.4% 24.3% 19.2%Accounts receivable 368 451 592 605 EBITDA growth 30.6% 34.0% 25.8% 23.2%Other current assets 132 199 199 199 EPS growth 33.3% 30.8% 26.2% 23.1%Current assets 5,682 7,732 10,352 13,729PP&E 89 126 157 202 EBITDA margin 37.5% 38.8% 39.3% 40.6%Total assets 6,570 10,674 13,247 16,591 Net margin 30.7% 31.6% 32.2% 33.5%Total debt 882 1,731 1,731 1,731 Debt / EBITDA 0.4 0.7 0.5 0.4Total liabilities 2,673 4,113 4,554 4,932Shareholders' equity 3,897 6,558 8,690 11,656 Return on assets (ROA) 30.6% 24.9% 22.8% 22.6%
Return on equity (ROE) 49.8% 41.1% 35.8% 33.2%Net Income (including charges) 1,424 1,878 2,394 2,965D&A 65 102 94 99 Enterprise value / EBITDA 23.1 17.6 13.2 9.9Change in working capital 144 279 97 101 Enterprise value / Free cash flow 25.7 19.0 15.7 11.9Other - - - - P/E 41.4 31.7 25.1 20.4Cash flow from operations 1,786 2,461 2,817 3,455Capex (55) (72) (76) (91)Free cash flow 1,778 2,451 2,800 3,422Cash flow from investing activities (1,563) (2,217) (76) (91)Cash flow from financing activities 669 (198) (250) 0Dividends - - - -Dividend yield - - - -
Source: Company reports and J.P. Morgan estimates.Note: $ in millions (except per-share data).Fiscal year ends Dec
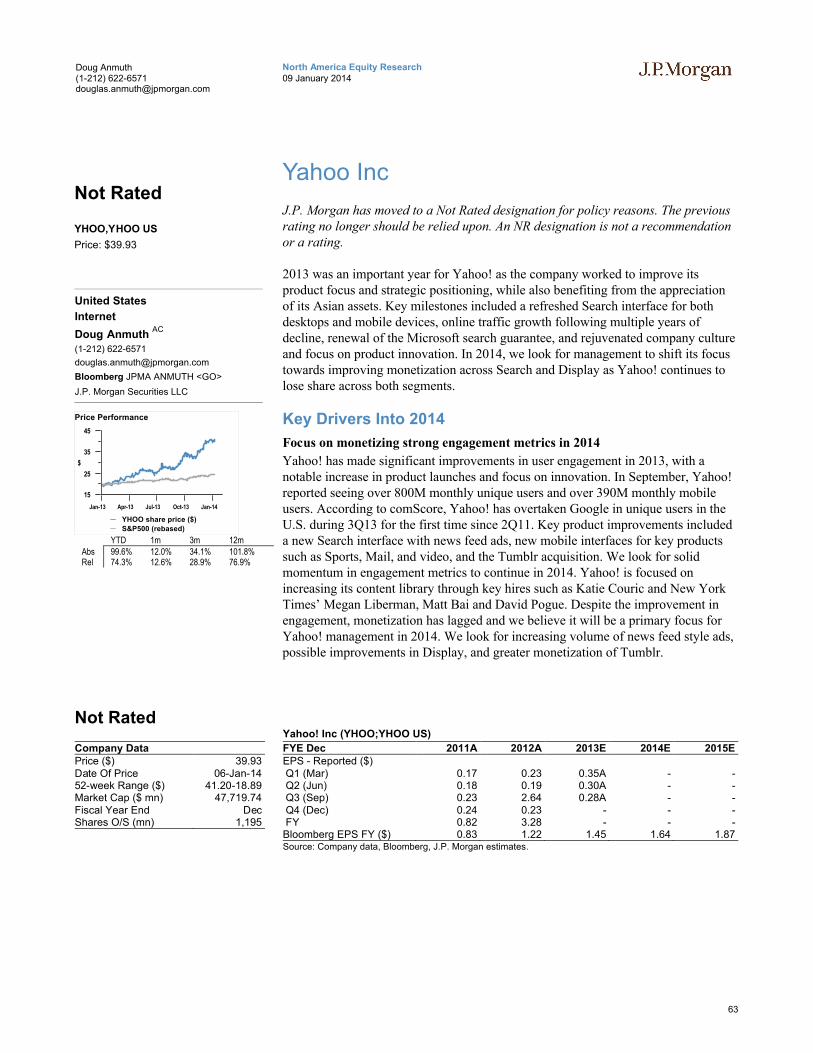
63
North America Equity Research09 January 2014
Doug Anmuth(1-212) [email protected]
Yahoo Inc
J.P. Morgan has moved to a Not Rated designation for policy reasons. The previous rating no longer should be relied upon. An NR designation is not a recommendation or a rating.
2013 was an important year for Yahoo! as the company worked to improve its product focus and strategic positioning, while also benefiting from the appreciation of its Asian assets. Key milestones included a refreshed Search interface for both desktops and mobile devices, online traffic growth following multiple years of decline, renewal of the Microsoft search guarantee, and rejuvenated company culture and focus on product innovation. In 2014, we look for management to shift its focus towards improving monetization across Search and Display as Yahoo! continues to lose share across both segments.
Key Drivers Into 2014
Focus on monetizing strong engagement metrics in 2014
Yahoo! has made significant improvements in user engagement in 2013, with a notable increase in product launches and focus on innovation. In September, Yahoo! reported seeing over 800M monthly unique users and over 390M monthly mobile users. According to comScore, Yahoo! has overtaken Google in unique users in the U.S. during 3Q13 for the first time since 2Q11. Key product improvements included a new Search interface with news feed ads, new mobile interfaces for key products such as Sports, Mail, and video, and the Tumblr acquisition. We look for solid momentum in engagement metrics to continue in 2014. Yahoo! is focused on increasing its content library through key hires such as Katie Couric and New York Times’ Megan Liberman, Matt Bai and David Pogue. Despite the improvement in engagement, monetization has lagged and we believe it will be a primary focus for Yahoo! management in 2014. We look for increasing volume of news feed style ads, possible improvements in Display, and greater monetization of Tumblr.
Not Rated
Company DataPrice ($) 39.93Date Of Price 06-Jan-1452-week Range ($) 41.20-18.89Market Cap ($ mn) 47,719.74Fiscal Year End DecShares O/S (mn) 1,195
Yahoo! Inc (YHOO;YHOO US)
FYE Dec 2011A 2012A 2013E 2014E 2015EEPS - Reported ($)Q1 (Mar) 0.17 0.23 0.35A - -Q2 (Jun) 0.18 0.19 0.30A - -Q3 (Sep) 0.23 2.64 0.28A - -Q4 (Dec) 0.24 0.23 - - -FY 0.82 3.28 - - -Bloomberg EPS FY ($) 0.83 1.22 1.45 1.64 1.87Source: Company data, Bloomberg, J.P. Morgan estimates.
Not Rated
YHOO,YHOO US
Price: $39.93
United States
Internet
Doug Anmuth AC
(1-212) 622-6571
Bloomberg JPMA ANMUTH <GO>
J.P. Morgan Securities LLC
15
25
35
45
$
Jan-13 Apr-13 Jul-13 Oct-13 Jan-14
Price Performance
YHOO share price ($)
S&P500 (rebased)
YTD 1m 3m 12mAbs 99.6% 12.0% 34.1% 101.8%Rel 74.3% 12.6% 28.9% 76.9%
64
North America Equity Research09 January 2014
Doug Anmuth(1-212) [email protected]
Focus on increasing Search monetization
According to comScore, Yahoo!’s share of queries in the U.S. declined through 2013 to 11.2% in November 2013 from 12.2% in December 2012. Despite improvements in overall traffic and engagement, Yahoo! continues to lose share of Search. Yahoo! renewed its Search partnership with Microsoft’s Bing in April 2013. In December, Yahoo! disclosed in an SEC filing that 31% of its revenues came from the Bing Search Agreement in 3Q13, up from 27% in 3Q12. While we are positive on the improvements in the Bing-Yahoo! Search Agreement potentially driving greater share and revenues in 2014, we are also somewhat concerned about the concentration of revenue tied to Microsoft. We note that guarantees from Microsoft expire in March 2014, though they could be renewed again.
Display to be driven by improving engagement metrics
While Yahoo! continues to focus on improving ad inventory and optimizing pricing and sales mix, we believe there is significant work to be done to successfully compete in an increasingly competitive display environment that is shifting towards programmatic buying. We believe Facebook’s FBX retargeting efforts could also be putting pressure on Yahoo!’s Display business. Yahoo! noted that in-stream ads were not a material contributor during the 3Q13, though we think it’s relatively early here and this could be bigger factor in 2014. We believe the improving engagement metrics are likely to help Display ad revenues going forward.
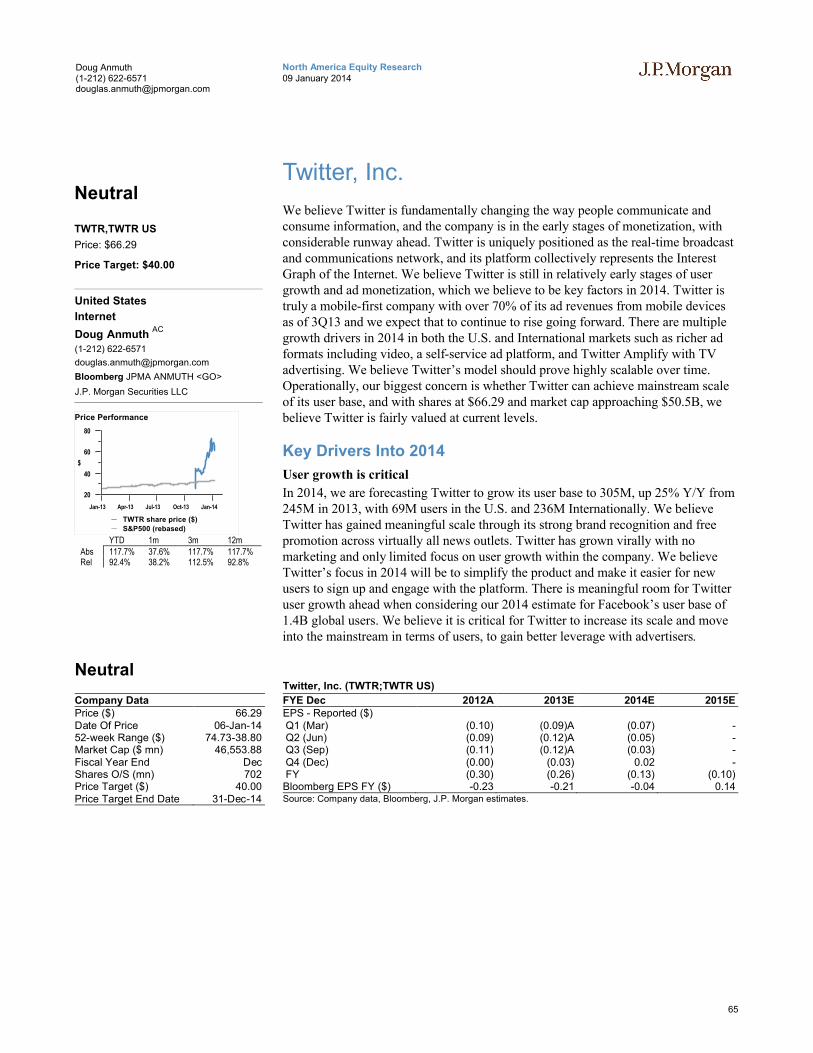
65
North America Equity Research09 January 2014
Doug Anmuth(1-212) [email protected]
Twitter, Inc.
We believe Twitter is fundamentally changing the way people communicate and consume information, and the company is in the early stages of monetization, with considerable runway ahead. Twitter is uniquely positioned as the real-time broadcast and communications network, and its platform collectively represents the Interest Graph of the Internet. We believe Twitter is still in relatively early stages of user growth and ad monetization, which we believe to be key factors in 2014. Twitter is truly a mobile-first company with over 70% of its ad revenues from mobile devices as of 3Q13 and we expect that to continue to rise going forward. There are multiple growth drivers in 2014 in both the U.S. and International markets such as richer ad formats including video, a self-service ad platform, and Twitter Amplify with TV advertising. We believe Twitter’s model should prove highly scalable over time. Operationally, our biggest concern is whether Twitter can achieve mainstream scale of its user base, and with shares at $66.29 and market cap approaching $50.5B, we believe Twitter is fairly valued at current levels.
Key Drivers Into 2014
User growth is critical
In 2014, we are forecasting Twitter to grow its user base to 305M, up 25% Y/Y from245M in 2013, with 69M users in the U.S. and 236M Internationally. We believe Twitter has gained meaningful scale through its strong brand recognition and free promotion across virtually all news outlets. Twitter has grown virally with no marketing and only limited focus on user growth within the company. We believe Twitter’s focus in 2014 will be to simplify the product and make it easier for new users to sign up and engage with the platform. There is meaningful room for Twitter user growth ahead when considering our 2014 estimate for Facebook’s user base of 1.4B global users. We believe it is critical for Twitter to increase its scale and move into the mainstream in terms of users, to gain better leverage with advertisers.
Neutral
Company DataPrice ($) 66.29Date Of Price 06-Jan-1452-week Range ($) 74.73-38.80Market Cap ($ mn) 46,553.88Fiscal Year End DecShares O/S (mn) 702Price Target ($) 40.00Price Target End Date 31-Dec-14
Twitter, Inc. (TWTR;TWTR US)
FYE Dec 2012A 2013E 2014E 2015EEPS - Reported ($)Q1 (Mar) (0.10) (0.09)A (0.07) -Q2 (Jun) (0.09) (0.12)A (0.05) -Q3 (Sep) (0.11) (0.12)A (0.03) -Q4 (Dec) (0.00) (0.03) 0.02 -FY (0.30) (0.26) (0.13) (0.10)Bloomberg EPS FY ($) -0.23 -0.21 -0.04 0.14Source: Company data, Bloomberg, J.P. Morgan estimates.
Neutral
TWTR,TWTR US
Price: $66.29
Price Target: $40.00
United States
Internet
Doug Anmuth AC
(1-212) 622-6571
Bloomberg JPMA ANMUTH <GO>
J.P. Morgan Securities LLC
20
40
60
80
$
Jan-13 Apr-13 Jul-13 Oct-13 Jan-14
Price Performance
TWTR share price ($)
S&P500 (rebased)
YTD 1m 3m 12mAbs 117.7% 37.6% 117.7% 117.7%Rel 92.4% 38.2% 112.5% 92.8%
66
North America Equity Research09 January 2014
Doug Anmuth(1-212) [email protected]
Advertising growth driven by improving ad products and monetization
We believe it is early in Twitter’s growth trajectory, and we expect monetization to be driven by a combination of growth in users, engagement (timeline views per user), and revenue per 1,000 timeline views. Notably, more than 70% of Twitter’s users and timeline views came from international markets in 3Q13, but International only accounted for 27% of advertising revenue in the quarter. Overall, we believe Twitter is in a similar position in monetization to the point at which Facebook was a bit more than a year ago when it had just turned on news feed ads across both desktop and mobile. That is to say the basic products are there and still being developed, and we believe it is early in advertiser demand building in the platform. However, we are clearly bullish on the shift of dollars toward news feed ads, particularly on mobile devices, and we expect Twitter to realize significant ARPU gains over time. Beyond just basic increases in demand for Twitter ads from marketers—which should be considerable—we look for new initiatives like Twitter Cards and Twitter Amplify to be strong growth drivers. We believe there is also strong monetization potential in Twitter’s self-serve platform, retargeting, a mobile ad exchange through the MoPub acquisition, and Vine.
Increasing competition with Facebook
Overall, we believe Twitter and Facebook have different use cases, with Twitter more as a real-time communications medium and Facebook more as a social network. There is, of course, some overlap in content today, but the two generally coexist, and we believe together they will be powerful drivers of the mobile and native advertising markets. However, we believe Facebook continues to adopt certain features of Twitter, and the two could become more competitive in 2014. We note that Twitter offered news feed ads before Facebook shifted in that direction. Facebook has also enabled one-way following of celebrities, implemented hashtags on both Facebook and Instagram, and introduced video on Instagram. Facebook is also now trying to complement TV advertising to take advantage of users’ real-time data and expressions on the site, similar to Twitter Amplify.
67
North America Equity Research09 January 2014
Doug Anmuth(1-212) [email protected]
Maintaining Estimates
We’re maintaining our estimates for Twitter, as seen in the table below.
Figure 26: JPM Estimates vs. Consensus
$ in millions, except per share data
J.P. Morgan Estimates 4Q13E 2013E 2014E 2015E
($ in millions except per share data)
Total Revenue 209.3 631.5 1059.1 1658.1
Y/Y Growth 86% 99% 68% 57%
Advertising 196.2 571.1 1000.7 1604.9
Y/Y Growth 97% 112% 75% 60%
Data Licensing 13.0 60.4 58.4 53.2
Y/Y Growth 2% 27% -3% -9%
EBITDA 15.5 46.2 94.1 261.1
Y/Y Growth -12% 118% 104% 178%
% Margin 7% 7% 9% 16%
GAAP EPS ($1.02) ($2.90) ($0.94) ($0.88)
Y/Y Growth NM NM NM NM
PF EPS ($0.03) ($0.26) ($0.13) ($0.10)
Y/Y Growth NM NM NM NM
Consensus
Total Revenue 217.4 639.3 1122.9 1760.4
EBITDA 21.0 51.5 135.2 327.0
GAAP EPS ($0.44) ($1.03) ($0.57) ($0.32)
PF EPS ($0.02) ($0.21) ($0.06) $0.13
Source: J.P. Morgan estimates, Company data.
Investment Thesis, Valuation and Risks
Twitter, Inc. (Neutral; Price Target: $40.00)
Investment Thesis
We believe Twitter is fundamentally changing the way people communicate and consume information, and the company is in the early stages of monetization, with considerable runway ahead. Twitter is uniquely positioned as the real-time broadcast and communications network, and its platform collectively represents the Interest Graph of the Internet. These features help make Twitter uniquely complementary to all other forms of media, including TV. We believe Twitter has multiple growth drivers ahead and its model should prove highly scalable over time. However, with shares at $66.29 and market cap approaching $50.5B, we believe Twitter is fairly valued at current levels.

68
North America Equity Research09 January 2014
Doug Anmuth(1-212) [email protected]
Valuation
Our December 2014 year-end PT of $40 is based on our DCF valuation. Twitter shares are currently trading at 45.7x 2014E EV/revenue and 30.9x 2015E EV/revenue, a significant premium to its peers. Twitter is growing faster off a smaller base, but these are significant premiums to Facebook at 11.9x and 8.9x and LinkedIn at 10.7x and 8.1x. We value shares of Twitter based on our DCF analysis, which factors in 2012-2020 CAGRs of 48% for revenue and 83% for EBITDA, along with a 4% terminal growth rate and 10% WACC. Our DCF yields fair value of $40.
Risks to Rating and Price Target
Upside Risks Include: 1) potential acceleration of user growth would be upside surprise; 2) new innovative products could drive higher engagement and Timeline Views; 3) overall ARPU could increase faster than expected.
Downside Risks Include: 1) Increasing competition for mobile and native ad dollars, particularly with Facebook and Google, among others; 2) slower than expected user growth could increase concerns about scale and reach; 3) international monetization could lag more than expected.
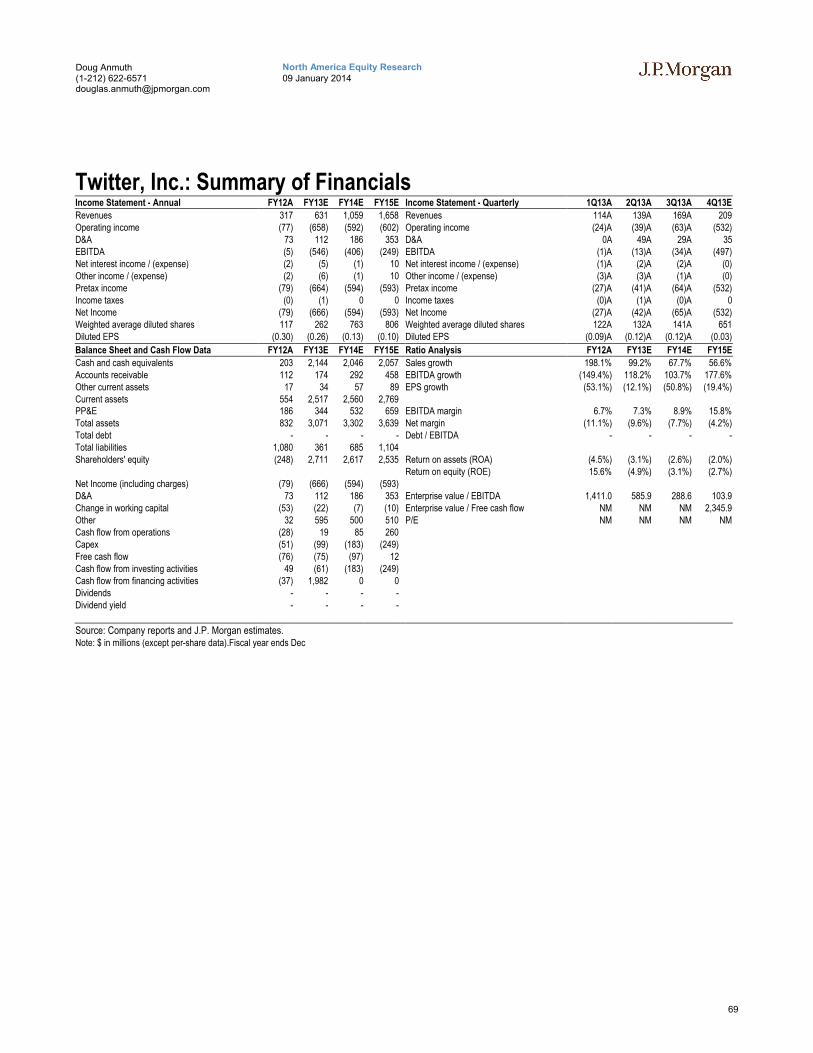
69
North America Equity Research09 January 2014
Doug Anmuth(1-212) [email protected]
Twitter, Inc.: Summary of FinancialsIncome Statement - Annual FY12A FY13E FY14E FY15E Income Statement - Quarterly 1Q13A 2Q13A 3Q13A 4Q13E
Revenues 317 631 1,059 1,658 Revenues 114A 139A 169A 209Operating income (77) (658) (592) (602) Operating income (24)A (39)A (63)A (532)D&A 73 112 186 353 D&A 0A 49A 29A 35EBITDA (5) (546) (406) (249) EBITDA (1)A (13)A (34)A (497)Net interest income / (expense) (2) (5) (1) 10 Net interest income / (expense) (1)A (2)A (2)A (0)Other income / (expense) (2) (6) (1) 10 Other income / (expense) (3)A (3)A (1)A (0)Pretax income (79) (664) (594) (593) Pretax income (27)A (41)A (64)A (532)Income taxes (0) (1) 0 0 Income taxes (0)A (1)A (0)A 0Net Income (79) (666) (594) (593) Net Income (27)A (42)A (65)A (532)Weighted average diluted shares 117 262 763 806 Weighted average diluted shares 122A 132A 141A 651Diluted EPS (0.30) (0.26) (0.13) (0.10) Diluted EPS (0.09)A (0.12)A (0.12)A (0.03)
Balance Sheet and Cash Flow Data FY12A FY13E FY14E FY15E Ratio Analysis FY12A FY13E FY14E FY15E
Cash and cash equivalents 203 2,144 2,046 2,057 Sales growth 198.1% 99.2% 67.7% 56.6%Accounts receivable 112 174 292 458 EBITDA growth (149.4%) 118.2% 103.7% 177.6%Other current assets 17 34 57 89 EPS growth (53.1%) (12.1%) (50.8%) (19.4%)Current assets 554 2,517 2,560 2,769PP&E 186 344 532 659 EBITDA margin 6.7% 7.3% 8.9% 15.8%Total assets 832 3,071 3,302 3,639 Net margin (11.1%) (9.6%) (7.7%) (4.2%)Total debt - - - - Debt / EBITDA - - - -Total liabilities 1,080 361 685 1,104Shareholders' equity (248) 2,711 2,617 2,535 Return on assets (ROA) (4.5%) (3.1%) (2.6%) (2.0%)
Return on equity (ROE) 15.6% (4.9%) (3.1%) (2.7%)Net Income (including charges) (79) (666) (594) (593)D&A 73 112 186 353 Enterprise value / EBITDA 1,411.0 585.9 288.6 103.9Change in working capital (53) (22) (7) (10) Enterprise value / Free cash flow NM NM NM 2,345.9Other 32 595 500 510 P/E NM NM NM NMCash flow from operations (28) 19 85 260Capex (51) (99) (183) (249)Free cash flow (76) (75) (97) 12Cash flow from investing activities 49 (61) (183) (249)Cash flow from financing activities (37) 1,982 0 0Dividends - - - -Dividend yield - - - -
Source: Company reports and J.P. Morgan estimates.Note: $ in millions (except per-share data).Fiscal year ends Dec
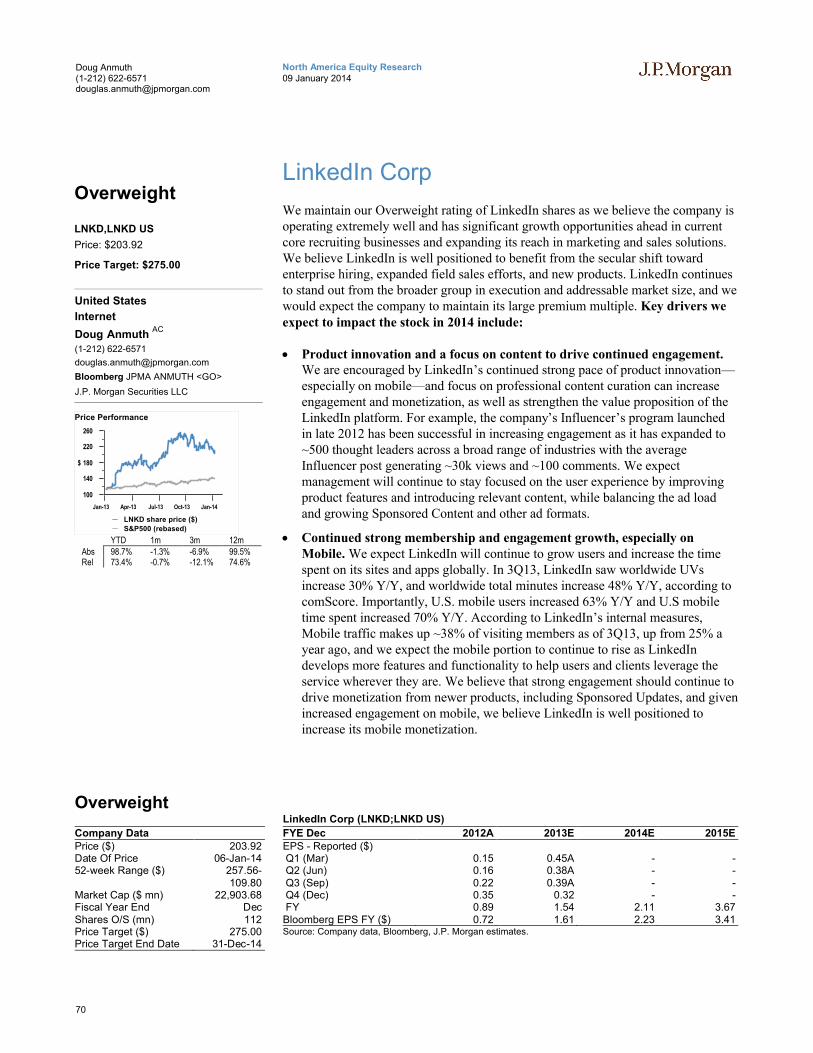
70
North America Equity Research09 January 2014
Doug Anmuth(1-212) [email protected]
LinkedIn Corp
We maintain our Overweight rating of LinkedIn shares as we believe the company is operating extremely well and has significant growth opportunities ahead in current core recruiting businesses and expanding its reach in marketing and sales solutions. We believe LinkedIn is well positioned to benefit from the secular shift toward enterprise hiring, expanded field sales efforts, and new products. LinkedIn continues to stand out from the broader group in execution and addressable market size, and we would expect the company to maintain its large premium multiple. Key drivers we expect to impact the stock in 2014 include:
Product innovation and a focus on content to drive continued engagement. We are encouraged by LinkedIn’s continued strong pace of product innovation—especially on mobile—and focus on professional content curation can increase engagement and monetization, as well as strengthen the value proposition of the LinkedIn platform. For example, the company’s Influencer’s program launched in late 2012 has been successful in increasing engagement as it has expanded to ~500 thought leaders across a broad range of industries with the averageInfluencer post generating ~30k views and ~100 comments. We expect management will continue to stay focused on the user experience by improving product features and introducing relevant content, while balancing the ad load and growing Sponsored Content and other ad formats.
Continued strong membership and engagement growth, especially on Mobile. We expect LinkedIn will continue to grow users and increase the time spent on its sites and apps globally. In 3Q13, LinkedIn saw worldwide UVs increase 30% Y/Y, and worldwide total minutes increase 48% Y/Y, according to comScore. Importantly, U.S. mobile users increased 63% Y/Y and U.S mobile time spent increased 70% Y/Y. According to LinkedIn’s internal measures, Mobile traffic makes up ~38% of visiting members as of 3Q13, up from 25% a year ago, and we expect the mobile portion to continue to rise as LinkedIn develops more features and functionality to help users and clients leverage the service wherever they are. We believe that strong engagement should continue to drive monetization from newer products, including Sponsored Updates, and given increased engagement on mobile, we believe LinkedIn is well positioned to increase its mobile monetization.
Overweight
Company DataPrice ($) 203.92Date Of Price 06-Jan-1452-week Range ($) 257.56-
109.80Market Cap ($ mn) 22,903.68Fiscal Year End DecShares O/S (mn) 112Price Target ($) 275.00Price Target End Date 31-Dec-14
LinkedIn Corp (LNKD;LNKD US)
FYE Dec 2012A 2013E 2014E 2015EEPS - Reported ($)Q1 (Mar) 0.15 0.45A - -Q2 (Jun) 0.16 0.38A - -Q3 (Sep) 0.22 0.39A - -Q4 (Dec) 0.35 0.32 - -FY 0.89 1.54 2.11 3.67Bloomberg EPS FY ($) 0.72 1.61 2.23 3.41Source: Company data, Bloomberg, J.P. Morgan estimates.
Overweight
LNKD,LNKD US
Price: $203.92
Price Target: $275.00
United States
Internet
Doug Anmuth AC
(1-212) 622-6571
Bloomberg JPMA ANMUTH <GO>
J.P. Morgan Securities LLC
100
140
180
220
260
$
Jan-13 Apr-13 Jul-13 Oct-13 Jan-14
Price Performance
LNKD share price ($)
S&P500 (rebased)
YTD 1m 3m 12mAbs 98.7% -1.3% -6.9% 99.5%Rel 73.4% -0.7% -12.1% 74.6%
71
North America Equity Research09 January 2014
Doug Anmuth(1-212) [email protected]
Continued Recruiter strength. We expect LinkedIn to continue to take share of the ~$27B addressable worldwide market for staffing and talent acquisition. Despite increasing penetration in the U.S., the company is experiencing success in increasing the number of seats per company and has significant traction among the lower-penetrated SMB market. We also note that Talent Solutions will benefit from price increases which should start impacting numbers during 4Q13 when affected markets, which represent roughly half of the Talent Solutions business,renew subscriptions. We believe enterprise demand is relatively inelastic in the impacted markets—U.S., Canada, Singapore, and Australia—but we note that the mid-single-digit increase is less than LinkedIn raised prices in 2009 and 2011.
Successful transition within Marketing Solutions with a focus on Sponsored Updates. We believe LinkedIn will continue to grow its share of the ~$100B+ global online ad market, where newer ad products including Sponsored Content are experiencing early success. We believe Marketing Solutions revenue will accelerate in 2014 and our 2014 estimate of $488M may be conservative. More than 1,000 advertisers are currently running Sponsored Updates campaigns after launching the program over the summer. Sponsored Updates advertisers still represent a single-digit percentage of LinkedIn advertisers on any given day, and we believe LinkedIn will significantly expand adoption of this ad product in 2014. We believe the Sponsored Update ad load is running at around a mid-single-digit percentage of total pieces of content in the newsfeed, and don’t expect material expansion of ad load in the near future. Similar to what we see at Facebook, Sponsored Updates have higher click-through rates, particularly on mobile, which currently accounts for 2/3 of LinkedIn’s Sponsored Updates revenue. We believe Sponsored Updates eCPMs are already higher than for LinkedIn’s traditional display ads and pricing should increase more as advertiser demand in the platform begins to build.
Sales Navigator starting to ramp and contributes to higher potential TAM. While not fully incorporated into our model, this newer product has significant potential to increase LinkedIn’s addressable market given the magnitude of sales professionals globally relative to the number of recruitment and talent acquisition professionals. Additionally, there is already a large base of sales professionals who already use LinkedIn as free members or premium subscribers. Linkedin is organically learning the features and use cases of these sales users and we believe the company will develop its Sales Navigator product with this information in mind. LinkedIn noted strong early growth from Sales Navigator at its 3Q13 earnings (customers 30%+ Q/Q) and a ramp in sales people to 50+ dedicated to the product. While still early days, Sales Solutions in our view can be a material driver of growth long-term for LinkedIn, and we are excited about the progress thus far. However, we highlight the importance of appropriately balancing the mix of sales professional functionality and the overall user experience. LinkedIn has been very cognizant and careful in the past regarding user experience, and we believe a Sales Navigator product roll-out will be no different.
What to look for into 2014: 1) Traction with newer products including Sales Navigator, mobile apps (Recruiter, Pulse), Sponsored Content/Jobs; 2) Marketing Solutions shift and impact of Sponsored Updates; 3) Engagement trends driven by product innovation, new/enhanced features, content.
Maintain OW, $275 price target. Our $275 PT is based on our DCF through 2020, which assumes a 10% cost of capital, 5% terminal growth rate, and 21x terminal EBITDA multiple. Key drivers of our DCF projections include 2012-2020 CAGRs of 30% for revenue and 36% for EBITDA, and our target equates to ~40x 2015E EBITDA of $777M.
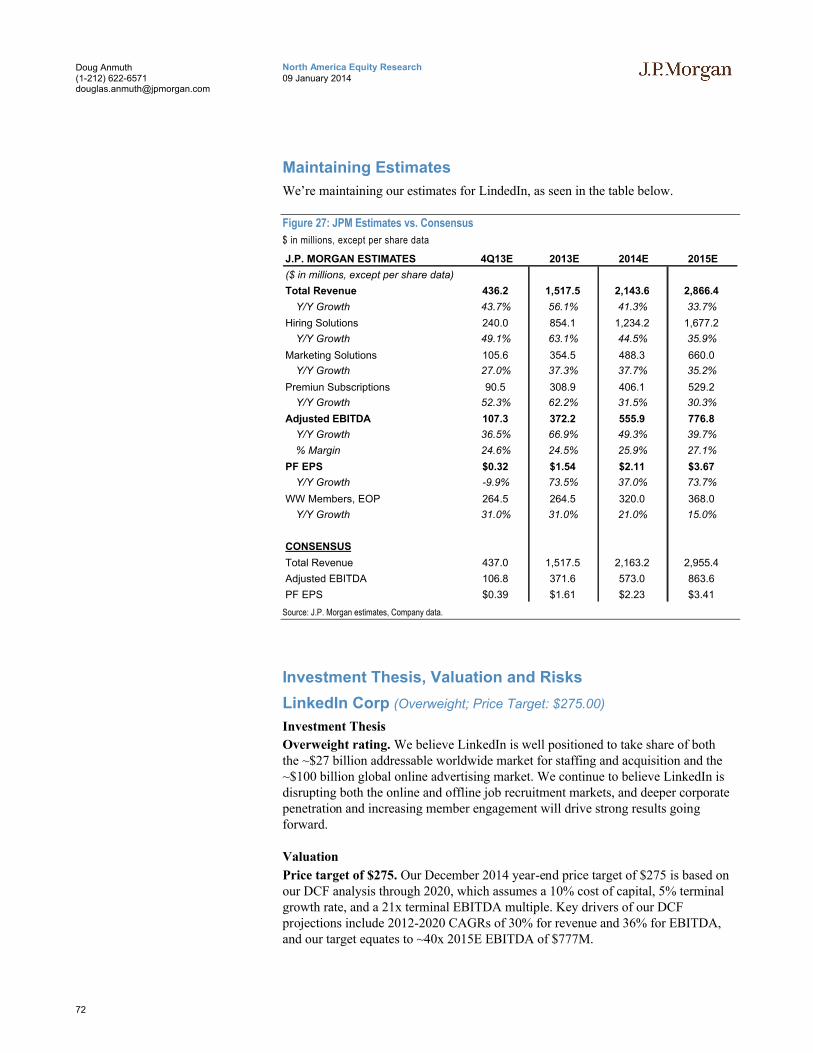
72
North America Equity Research09 January 2014
Doug Anmuth(1-212) [email protected]
Maintaining Estimates
We’re maintaining our estimates for LindedIn, as seen in the table below.
Figure 27: JPM Estimates vs. Consensus
$ in millions, except per share data
J.P. MORGAN ESTIMATES 4Q13E 2013E 2014E 2015E
($ in millions, except per share data)
Total Revenue 436.2 1,517.5 2,143.6 2,866.4
Y/Y Growth 43.7% 56.1% 41.3% 33.7%
Hiring Solutions 240.0 854.1 1,234.2 1,677.2
Y/Y Growth 49.1% 63.1% 44.5% 35.9%
Marketing Solutions 105.6 354.5 488.3 660.0
Y/Y Growth 27.0% 37.3% 37.7% 35.2%
Premiun Subscriptions 90.5 308.9 406.1 529.2
Y/Y Growth 52.3% 62.2% 31.5% 30.3%
Adjusted EBITDA 107.3 372.2 555.9 776.8
Y/Y Growth 36.5% 66.9% 49.3% 39.7%
% Margin 24.6% 24.5% 25.9% 27.1%
PF EPS $0.32 $1.54 $2.11 $3.67
Y/Y Growth -9.9% 73.5% 37.0% 73.7%
WW Members, EOP 264.5 264.5 320.0 368.0
Y/Y Growth 31.0% 31.0% 21.0% 15.0%
CONSENSUS
Total Revenue 437.0 1,517.5 2,163.2 2,955.4
Adjusted EBITDA 106.8 371.6 573.0 863.6
PF EPS $0.39 $1.61 $2.23 $3.41
Source: J.P. Morgan estimates, Company data.
Investment Thesis, Valuation and Risks
LinkedIn Corp (Overweight; Price Target: $275.00)
Investment Thesis
Overweight rating. We believe LinkedIn is well positioned to take share of both the ~$27 billion addressable worldwide market for staffing and acquisition and the ~$100 billion global online advertising market. We continue to believe LinkedIn is disrupting both the online and offline job recruitment markets, and deeper corporate penetration and increasing member engagement will drive strong results going forward.
Valuation
Price target of $275. Our December 2014 year-end price target of $275 is based on our DCF analysis through 2020, which assumes a 10% cost of capital, 5% terminal growth rate, and a 21x terminal EBITDA multiple. Key drivers of our DCF projections include 2012-2020 CAGRs of 30% for revenue and 36% for EBITDA, and our target equates to ~40x 2015E EBITDA of $777M.

73
North America Equity Research09 January 2014
Doug Anmuth(1-212) [email protected]
Risks to Rating and Price Target
Downside risks include: 1) macro weakness and a softer hiring environment; 2) slowing member growth; 3) a decrease or inability to strengthen user engagement trends; and 4) increased competition from other players both in the U.S. and internationally.
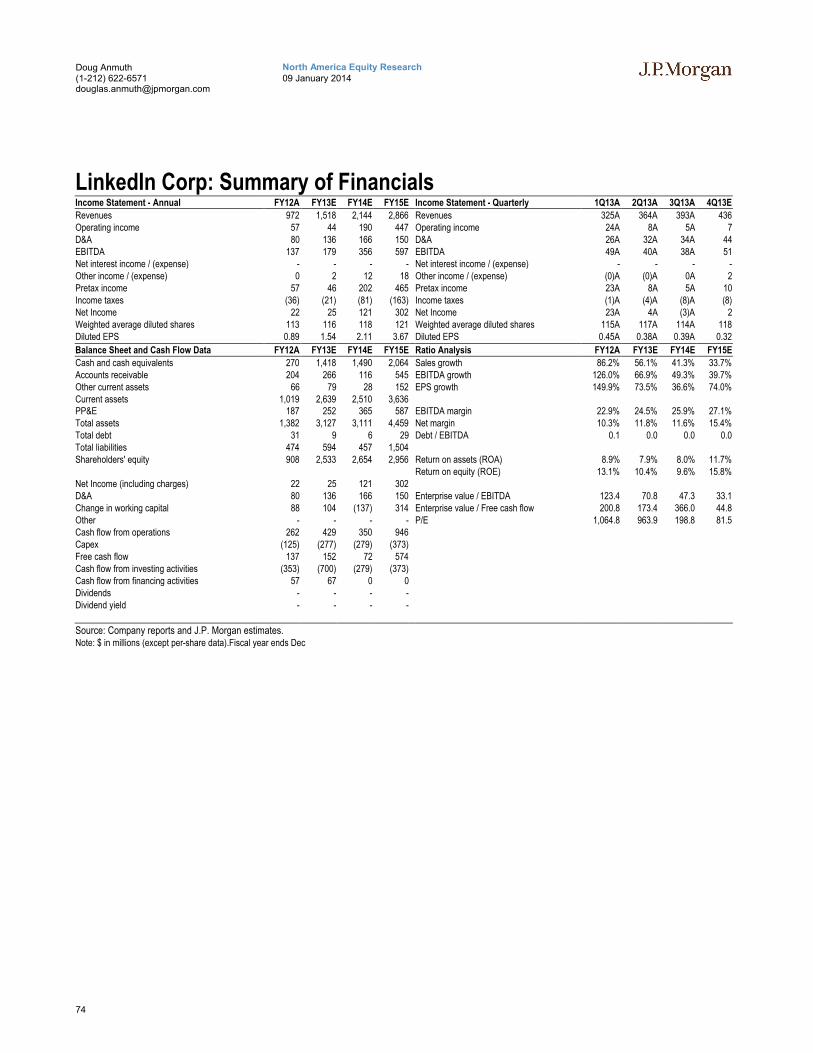
74
North America Equity Research09 January 2014
Doug Anmuth(1-212) [email protected]
LinkedIn Corp: Summary of FinancialsIncome Statement - Annual FY12A FY13E FY14E FY15E Income Statement - Quarterly 1Q13A 2Q13A 3Q13A 4Q13E
Revenues 972 1,518 2,144 2,866 Revenues 325A 364A 393A 436Operating income 57 44 190 447 Operating income 24A 8A 5A 7D&A 80 136 166 150 D&A 26A 32A 34A 44EBITDA 137 179 356 597 EBITDA 49A 40A 38A 51Net interest income / (expense) - - - - Net interest income / (expense) - - - -Other income / (expense) 0 2 12 18 Other income / (expense) (0)A (0)A 0A 2Pretax income 57 46 202 465 Pretax income 23A 8A 5A 10Income taxes (36) (21) (81) (163) Income taxes (1)A (4)A (8)A (8)Net Income 22 25 121 302 Net Income 23A 4A (3)A 2Weighted average diluted shares 113 116 118 121 Weighted average diluted shares 115A 117A 114A 118Diluted EPS 0.89 1.54 2.11 3.67 Diluted EPS 0.45A 0.38A 0.39A 0.32
Balance Sheet and Cash Flow Data FY12A FY13E FY14E FY15E Ratio Analysis FY12A FY13E FY14E FY15E
Cash and cash equivalents 270 1,418 1,490 2,064 Sales growth 86.2% 56.1% 41.3% 33.7%Accounts receivable 204 266 116 545 EBITDA growth 126.0% 66.9% 49.3% 39.7%Other current assets 66 79 28 152 EPS growth 149.9% 73.5% 36.6% 74.0%Current assets 1,019 2,639 2,510 3,636PP&E 187 252 365 587 EBITDA margin 22.9% 24.5% 25.9% 27.1%Total assets 1,382 3,127 3,111 4,459 Net margin 10.3% 11.8% 11.6% 15.4%Total debt 31 9 6 29 Debt / EBITDA 0.1 0.0 0.0 0.0Total liabilities 474 594 457 1,504Shareholders' equity 908 2,533 2,654 2,956 Return on assets (ROA) 8.9% 7.9% 8.0% 11.7%
Return on equity (ROE) 13.1% 10.4% 9.6% 15.8%Net Income (including charges) 22 25 121 302D&A 80 136 166 150 Enterprise value / EBITDA 123.4 70.8 47.3 33.1Change in working capital 88 104 (137) 314 Enterprise value / Free cash flow 200.8 173.4 366.0 44.8Other - - - - P/E 1,064.8 963.9 198.8 81.5Cash flow from operations 262 429 350 946Capex (125) (277) (279) (373)Free cash flow 137 152 72 574Cash flow from investing activities (353) (700) (279) (373)Cash flow from financing activities 57 67 0 0Dividends - - - -Dividend yield - - - -
Source: Company reports and J.P. Morgan estimates.Note: $ in millions (except per-share data).Fiscal year ends Dec

75
North America Equity Research09 January 2014
Doug Anmuth(1-212) [email protected]
Netflix Inc
We believe Netflix remains on track toward significantly disrupting the linear TVmarket through strong subscriber growth, content differentiation, and a betterconsumer proposition. We think the company is benefiting from key secular trends,including the proliferation of Internet-connected devices and increasing consumerpreference for on-demand video consumption over the Internet rather than linear TV.Higher subscribers have a disproportionately larger impact on profitability asrelatively fixed content costs account for the majority of Netflix’s costs. Continued content diversification and original shows should further differentiate Netflix from other Internet video services (such as Amazon and Hulu). We look for continuedstrong US sub growth in 2014 (+18% Y/Y), but also believe investors will focus more on International given the more green-field opportunity and likely expansion this year into more markets.
Key Drivers Into 2014
Expect originals to continue improving the Netflix brand
We expect new originals as well as new seasons of 2013 originals to continue helping differentiate the service. Original content—including Orange is the New Black and House of Cards—helped increase buzz and awareness of Netflix content in 2013 and we think these shows are building their respective loyal fans which should help build audiences over time. We remain encouraged by Netflix’s progress in original content, which has driven good viewership and helped differentiate the service. Netflix has ordered second seasons for each of its four new Original series and is also interested in a fifth season of Arrested Development.
Doubling of originals investment in 2014
Netflix recently launched Dreamworks Animation’s Turbo: F.A.S.T. (Fast Action Stunt Team), its first animated original, which we think drove good awareness and potential viewership on Netflix. In 2014, Netflix is expected to launch several original shows with Dreamworks. The company is also launching an unnamed series with the creators of Damages, as well as Sense8, a sci-fi series created by The Wachowskis (The Matrix) and J. Michael Straczynski (Babylon 5). Netflix expects to double its investment in original content in 2014 (though still representing less than 10% of global content expense) given strong traction of its 2013 slate of originals.
Overweight
Company DataPrice ($) 359.57Date Of Price 06-Jan-1452-week Range ($) 389.16-94.55Market Cap ($ mn) 19,970.88Fiscal Year End DecShares O/S (mn) 56Price Target ($) 460.00Price Target End Date 31-Dec-14
Netflix Inc (NFLX;NFLX US)
FYE Dec 2011A 2012A 2013E 2014E 2015EEPS - Reported ($)Q1 (Mar) 1.11 (0.08) 0.04A - -Q2 (Jun) 1.27 0.10 0.49A - -Q3 (Sep) 1.16 0.13 0.52A - -Q4 (Dec) 0.65 0.13 0.64 - -FY 4.17 0.31 1.70 4.48 7.69Bloomberg EPS FY ($) 4.75 0.82 2.76 5.03 8.89Source: Company data, Bloomberg, J.P. Morgan estimates.
Overweight
NFLX,NFLX US
Price: $359.57
Price Target: $460.00
United States
Internet
Doug Anmuth AC
(1-212) 622-6571
Bloomberg JPMA ANMUTH <GO>
J.P. Morgan Securities LLC
50
150
250
350
$
Jan-13 Apr-13 Jul-13 Oct-13 Jan-14
Price Performance
NFLX share price ($)
RTY (rebased)
YTD 1m 3m 12mAbs 295.6% 4.7% 21.2% 286.8%Rel 263.8% 4.4% 15.2% 252.7%
76
North America Equity Research09 January 2014
Doug Anmuth(1-212) [email protected]
Expecting continued strong net adds in the US and International
We expect 2014 US streaming net adds of ~5.8M, 5% below expected 2013 net adds of ~6.2M. We expect Netflix to end 2014 with ~39.1M streaming subscribers, reaching 50.6M subscribers by 2016. We note that we’re currently not modeling any price increases through 2016 though we think the company is likely to have some pricing power over the next couple of years as it continues to add significant new and exclusive content which should increase the perceived value of the service, particularly in relation to pay TV alternatives. We think a price increase could drive significant additional leverage in the model, which we think Netflix could re-invest in additional content or new international market launches. We expect 5.3M international streaming net adds, 15% above 4.6M net adds in 2013. We expect international streaming subscribers to reach 16M at the end of 2014.
Room for continued margin expansion
We think Netflix has continued room to expand margin in the US streaming segment as well as the international streaming segment, even as it continues to expand into new geographies, while the company has maintained DVD margin despite declining subscribers. We expect domestic streaming contribution margin to expand ~380 bps to 26.4% in 2014, despite a 16% increase in COGS (primarily content costs) as Netflix leverages continued strong domestic subscriber growth and slowing marketing expenses. We expect the overall international segment to remain unprofitable in 2014, though we expect losses to improve as Netflix improves profitability in existing markets and new market launches have a more marginal impact on overall costs than prior years.
Potential new through-the-middle partnerships
In 2013, Virgin Media in the UK and Hon Hem in Sweden announced that Netflix streaming video service would be available to their subscribers using TiVo set-top boxes. Netflix will appear as an app on these set-top boxes, and will continue to own the billing and customer relationship. We expect the company to announce similar “through-the-middle” partnerships with pay-TV providers, particularly in international markets.
Potentially higher than expected content costs
While we believe Netflix continues to diversify its content from multiple suppliers and through originals, there is some potential that content negotiations for higher-quality episodic content could become more competitive as content suppliers potentially demand price increases at or above the company’s rate of subscriber growth. We also think competition from Amazon, Hulu, as well as potential new entrants like Apple and Google could raise the price of streaming content.
TV Everywhere offerings continue to improve
As Pay TV operators witness slow subscriber growth relative to Netflix, they continue to improve their TV Everywhere offerings to better match their offerings to consumers that are increasingly looking to view content on-demand on multiple devices. We expect Pay TV operators to continue investing in their TV Everywhere offerings, both from a content and user interface standpoint, and note that some are already beginning to test offering entire back seasons of shows. We also think the potential for broadband price increases for Internet-only cable subscribers could reduce the financial benefits of cord-cutting or cord-shaving.
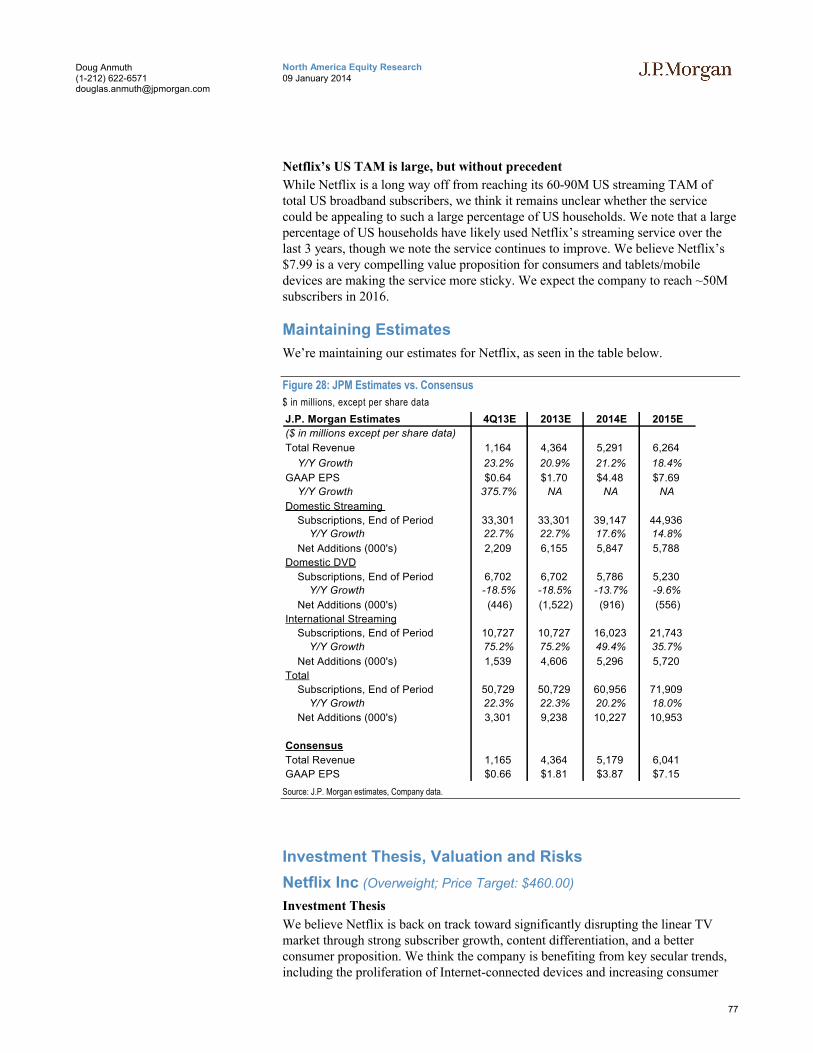
77
North America Equity Research09 January 2014
Doug Anmuth(1-212) [email protected]
Netflix’s US TAM is large, but without precedent
While Netflix is a long way off from reaching its 60-90M US streaming TAM of total US broadband subscribers, we think it remains unclear whether the service could be appealing to such a large percentage of US households. We note that a large percentage of US households have likely used Netflix’s streaming service over the last 3 years, though we note the service continues to improve. We believe Netflix’s $7.99 is a very compelling value proposition for consumers and tablets/mobile devices are making the service more sticky. We expect the company to reach ~50M subscribers in 2016.
Maintaining Estimates
We’re maintaining our estimates for Netflix, as seen in the table below.
Figure 28: JPM Estimates vs. Consensus
$ in millions, except per share data
J.P. Morgan Estimates 4Q13E 2013E 2014E 2015E
($ in millions except per share data)
Total Revenue 1,164 4,364 5,291 6,264
Y/Y Growth 23.2% 20.9% 21.2% 18.4%
GAAP EPS $0.64 $1.70 $4.48 $7.69
Y/Y Growth 375.7% NA NA NA
Domestic Streaming
Subscriptions, End of Period 33,301 33,301 39,147 44,936
Y/Y Growth 22.7% 22.7% 17.6% 14.8%
Net Additions (000's) 2,209 6,155 5,847 5,788
Domestic DVD
Subscriptions, End of Period 6,702 6,702 5,786 5,230
Y/Y Growth -18.5% -18.5% -13.7% -9.6%
Net Additions (000's) (446) (1,522) (916) (556)
International Streaming
Subscriptions, End of Period 10,727 10,727 16,023 21,743
Y/Y Growth 75.2% 75.2% 49.4% 35.7%
Net Additions (000's) 1,539 4,606 5,296 5,720
Total
Subscriptions, End of Period 50,729 50,729 60,956 71,909
Y/Y Growth 22.3% 22.3% 20.2% 18.0%
Net Additions (000's) 3,301 9,238 10,227 10,953
Consensus
Total Revenue 1,165 4,364 5,179 6,041
GAAP EPS $0.66 $1.81 $3.87 $7.15
Source: J.P. Morgan estimates, Company data.
Investment Thesis, Valuation and Risks
Netflix Inc (Overweight; Price Target: $460.00)
Investment Thesis
We believe Netflix is back on track toward significantly disrupting the linear TV market through strong subscriber growth, content differentiation, and a better consumer proposition. We think the company is benefiting from key secular trends, including the proliferation of Internet-connected devices and increasing consumer
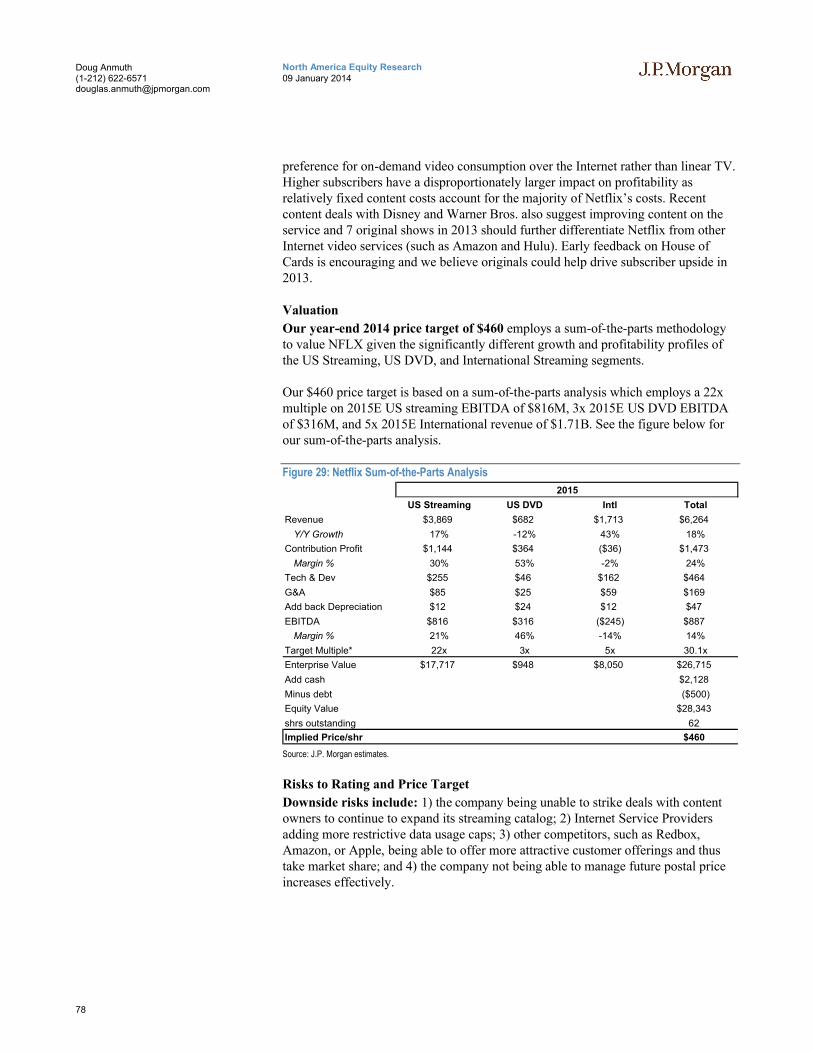
78
North America Equity Research09 January 2014
Doug Anmuth(1-212) [email protected]
preference for on-demand video consumption over the Internet rather than linear TV. Higher subscribers have a disproportionately larger impact on profitability as relatively fixed content costs account for the majority of Netflix’s costs. Recent content deals with Disney and Warner Bros. also suggest improving content on the service and 7 original shows in 2013 should further differentiate Netflix from other Internet video services (such as Amazon and Hulu). Early feedback on House of Cards is encouraging and we believe originals could help drive subscriber upside in 2013.
Valuation
Our year-end 2014 price target of $460 employs a sum-of-the-parts methodology to value NFLX given the significantly different growth and profitability profiles of the US Streaming, US DVD, and International Streaming segments.
Our $460 price target is based on a sum-of-the-parts analysis which employs a 22x multiple on 2015E US streaming EBITDA of $816M, 3x 2015E US DVD EBITDA of $316M, and 5x 2015E International revenue of $1.71B. See the figure below for our sum-of-the-parts analysis.
Figure 29: Netflix Sum-of-the-Parts Analysis
US Streaming US DVD Intl Total
Revenue $3,869 $682 $1,713 $6,264
Y/Y Growth 17% -12% 43% 18%
Contribution Profit $1,144 $364 ($36) $1,473
Margin % 30% 53% -2% 24%
Tech & Dev $255 $46 $162 $464
G&A $85 $25 $59 $169
Add back Depreciation $12 $24 $12 $47
EBITDA $816 $316 ($245) $887
Margin % 21% 46% -14% 14%
Target Multiple* 22x 3x 5x 30.1x
Enterprise Value $17,717 $948 $8,050 $26,715
Add cash $2,128
Minus debt ($500)
Equity Value $28,343
shrs outstanding 62
Implied Price/shr $460
2015
Source: J.P. Morgan estimates.
Risks to Rating and Price Target
Downside risks include: 1) the company being unable to strike deals with contentowners to continue to expand its streaming catalog; 2) Internet Service Providers adding more restrictive data usage caps; 3) other competitors, such as Redbox, Amazon, or Apple, being able to offer more attractive customer offerings and thus take market share; and 4) the company not being able to manage future postal priceincreases effectively.

79
North America Equity Research09 January 2014
Doug Anmuth(1-212) [email protected]
Netflix Inc: Summary of FinancialsIncome Statement - Annual FY12A FY13E FY14E FY15E Income Statement - Quarterly 1Q13A 2Q13A 3Q13A 4Q13E
Revenues 3,609 4,364 5,291 6,264 Revenues 1,024A 1,069A 1,106A 1,164Operating income 50 212 451 764 Operating income 32A 57A 57A 66D&A 45 47 46 47 D&A 12A 12A 11A 11EBITDA 95 259 497 811 EBITDA 44A 69A 69A 77Net interest income / (expense) (20) (53) (15) (12) Net interest income / (expense) (31)A (10)A (8)A (4)Other income / (expense) (20) (53) (15) (12) Other income / (expense) (31)A (10)A (8)A (4)Pretax income 30 159 436 752 Pretax income 1A 47A 49A 62Income taxes (13) (55) (161) (278) Income taxes 2A (17)A (18)A (22)Net Income 17 104 275 474 Net Income 3A 29A 32A 40Weighted average diluted shares 55 61 61 62 Weighted average diluted shares 60A 61A 61A 63Diluted EPS 0.31 1.70 4.48 7.69 Diluted EPS 0.04A 0.49A 0.52A 0.64
Balance Sheet and Cash Flow Data FY12A FY13E FY14E FY15E Ratio Analysis FY12A FY13E FY14E FY15E
Cash and cash equivalents 290 482 737 1,432 Sales growth 12.6% 20.9% 21.2% 18.4%Accounts receivable - - - - EBITDA growth 49.1% 55.5% 1.0% 24.7%Other current assets 1,493 1,528 1,565 1,584 EPS growth (92.5%) 441.0% 163.2% 71.7%Current assets 2,241 2,705 2,999 3,712PP&E 132 133 155 183 EBITDA margin 48.8% 62.7% 52.3% 55.1%Total assets 3,968 4,685 4,966 5,959 Net margin 2.5% 4.0% 6.6% 8.8%Total debt 400 500 500 500 Debt / EBITDA 0.2 0.2 0.2 0.1Total liabilities 3,223 3,422 3,354 3,798Shareholders' equity 745 1,263 1,612 2,161 Return on assets (ROA) 2.6% 4.1% 7.2% 10.1%
Return on equity (ROE) 13.1% 17.6% 24.3% 29.1%Net Income (including charges) 17 104 275 474D&A 45 47 46 47 Enterprise value / EBITDA 9.2 5.9 5.7 4.4Change in working capital 26 (18) (105) 424 Enterprise value / Free cash flow NM 137.4 69.7 22.8Other - - - - P/E 1,143.9 211.5 80.3 46.8Cash flow from operations 23 121 286 728Capex (41) (47) (69) (75)Free cash flow (7) 117 226 661Cash flow from investing activities (246) (343) (84) (86)Cash flow from financing activities 6 418 53 53Dividends - - - -Dividend yield - - - -
Source: Company reports and J.P. Morgan estimates.Note: $ in millions (except per-share data).Fiscal year ends Dec

80
North America Equity Research09 January 2014
Doug Anmuth(1-212) [email protected]
TripAdvisor, Inc.
2013 marked a significant milestone for TripAdvisor as it shifted its business model to meta display. We believe meta display provides a better user interface for travelers and we expect it to drive strength in hotel shopper growth over time. Despite the ongoing headwind to revenue, the higher-quality traffic through better conversions and click-through rates should also lift pricing levels in the longer term. We believe the shift to meta is strategically important as it moves the consumer further down the booking path and could shift online travel purchase behavior over time, but near-term we expect continued choppiness in the meta transition as OTAs continue to push back on price increases and look to diversify their traffic sources. In 2014, some of the key products we are also focused on include the direct mobile bookings path, Trip Connect, and TripAdvisor’s China properties Daodao and Kuxun.
Key Drivers Into 2014
Meta display and offline TV ad spend to drive solid hotel shopper growth
We expect TripAdvisor to continue to see strong hotel shopper growth in 2014 driven by meta display and the company’s first run of offline TV ads. Despite some ongoing CPC pricing headwinds from the meta display transition, international shift, and mobile mix, we look for TripAdvisor to capitalize on strong online traffic growth and hotel shopper growth. We expect to see 30%+ hotel shopper growth in 2014 aided by meta display to drive an acceleration in CPC-based revenue growth to 24.5% Y/Y in 2014, with further upside potential from direct mobile bookings.Overall, we are forecasting 2014 total revenue of $1.2B (25% Y/Y), EBITDA of $487M (40.8% margin), and adjusted EPS of $2.18.
Direct mobile bookings to come in 2014
TripAdvisor is expected to launch direct bookings for mobile in 2014, designed to reduce the friction points in booking travel on mobile devices. We believe the addition of a direct mobile bookings path further blurs the line with the OTAs. While we expect TripAdvisor to enable the OTAs to participate in direct mobile bookings, we think this also broadens out the functionality that TripAdvisor offers itself. Currently only planned for mobile, we expect the booking path to come to desktop down the road.
Neutral
Company DataPrice ($) 80.38Date Of Price 06-Jan-1452-week Range ($) 90.43-42.04Market Cap ($ mn) 11,440.93Fiscal Year End DecShares O/S (mn) 142Price Target ($) 71.00Price Target End Date 31-Dec-14
TripAdvisor, Inc. (TRIP;TRIP US)
FYE Dec 2010A 2011A 2012A 2013E 2014E 2015EEPS - Reported ($)Q1 (Mar) 0.31 0.36 0.38 0.50A - -Q2 (Jun) 0.32 0.41 0.42 0.52A - -Q3 (Sep) 0.34 0.42 0.46 0.45A - -Q4 (Dec) 0.17 0.24 0.29 0.23 - -FY 1.14 1.47 1.55 1.70 2.18 2.73Bloomberg EPS FY ($) 0.96 1.38 1.45 1.79 2.20 2.77Source: Company data, Bloomberg, J.P. Morgan estimates.
Neutral
TRIP,TRIP US
Price: $80.38
Price Target: $71.00
United States
Internet
Doug Anmuth AC
(1-212) 622-6571
Bloomberg JPMA ANMUTH <GO>
J.P. Morgan Securities LLC
40
50
60
70
80
90
$
Jan-13 Apr-13 Jul-13 Oct-13 Jan-14
Price Performance
TRIP share price ($)
RTY (rebased)
YTD 1m 3m 12mAbs 95.3% -6.7% 12.8% 88.5%Rel 63.5% -7.0% 6.8% 54.4%

81
North America Equity Research09 January 2014
Doug Anmuth(1-212) [email protected]
TripConnect to enable more supplier direct advertising bids
TripConnect allows for hotels to bid for direct bookings alongside the OTA offers in the TripAdvisor meta display interface. We believe this is an important driver for TripAdvisor’s CPC platform as it expands this capability beyond just the large hotel chains. TripAdvisor has initially signed up ~100 certified Internet Booking Engines—sites that provide a booking platform for smaller hotels—but we expect coverage to expand going forward. While still early, we believe TripConnect further blurs the lines with the OTAs as some hotels can now opt to bid for traffic on TripAdvisor as an alternative to distributing rooms through the OTAs.
TripAdvisor continues to invest in China
We expect TripAdvisor to continue to build its brand and invest in China, even at an EBITDA loss, through Daodao and Kuxun. While the China market has had some challenges in online travel with aggressive couponing and intense competition, we think TripAdvisor will try to leverage its large content offering for outbound, cross-border Chinese travelers.
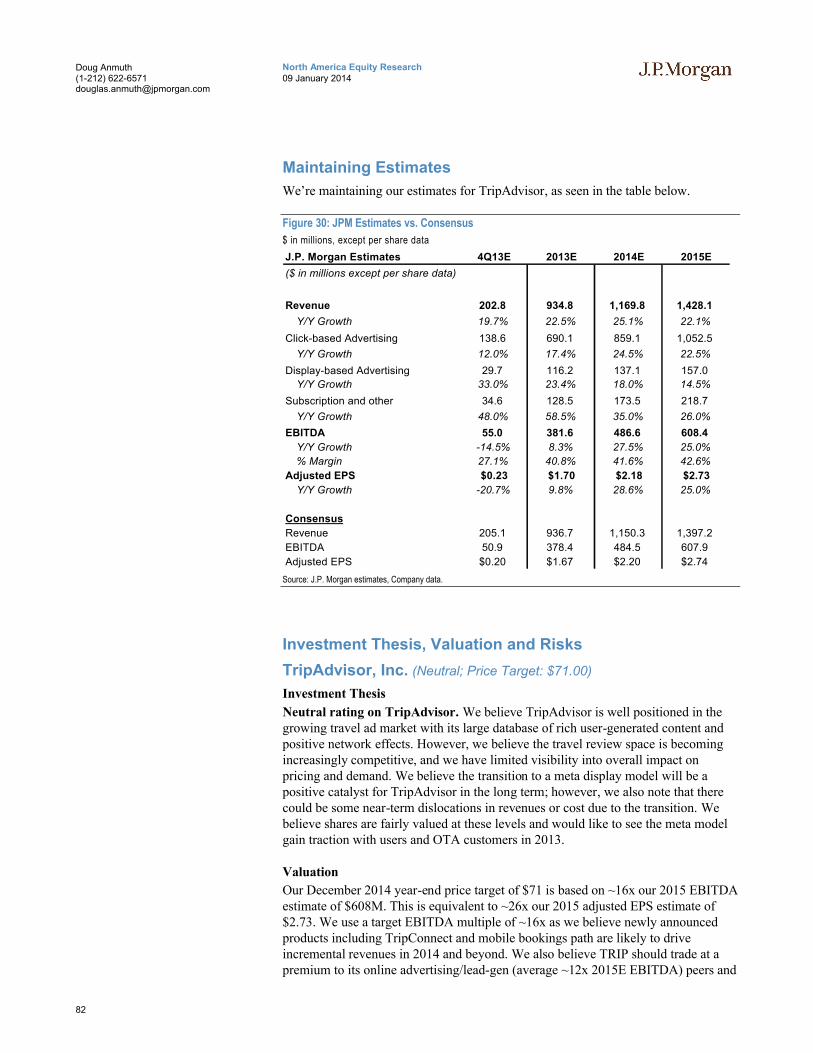
82
North America Equity Research09 January 2014
Doug Anmuth(1-212) [email protected]
Maintaining Estimates
We’re maintaining our estimates for TripAdvisor, as seen in the table below.
Figure 30: JPM Estimates vs. Consensus
$ in millions, except per share data
J.P. Morgan Estimates 4Q13E 2013E 2014E 2015E
($ in millions except per share data)
Revenue 202.8 934.8 1,169.8 1,428.1
Y/Y Growth 19.7% 22.5% 25.1% 22.1%
Click-based Advertising 138.6 690.1 859.1 1,052.5
Y/Y Growth 12.0% 17.4% 24.5% 22.5%
Display-based Advertising 29.7 116.2 137.1 157.0
Y/Y Growth 33.0% 23.4% 18.0% 14.5%
Subscription and other 34.6 128.5 173.5 218.7
Y/Y Growth 48.0% 58.5% 35.0% 26.0%
EBITDA 55.0 381.6 486.6 608.4
Y/Y Growth -14.5% 8.3% 27.5% 25.0%
% Margin 27.1% 40.8% 41.6% 42.6%
Adjusted EPS $0.23 $1.70 $2.18 $2.73
Y/Y Growth -20.7% 9.8% 28.6% 25.0%
Consensus
Revenue 205.1 936.7 1,150.3 1,397.2
EBITDA 50.9 378.4 484.5 607.9
Adjusted EPS $0.20 $1.67 $2.20 $2.74
Source: J.P. Morgan estimates, Company data.
Investment Thesis, Valuation and Risks
TripAdvisor, Inc. (Neutral; Price Target: $71.00)
Investment Thesis
Neutral rating on TripAdvisor. We believe TripAdvisor is well positioned in the growing travel ad market with its large database of rich user-generated content and positive network effects. However, we believe the travel review space is becoming increasingly competitive, and we have limited visibility into overall impact on pricing and demand. We believe the transition to a meta display model will be a positive catalyst for TripAdvisor in the long term; however, we also note that there could be some near-term dislocations in revenues or cost due to the transition. We believe shares are fairly valued at these levels and would like to see the meta model gain traction with users and OTA customers in 2013.
Valuation
Our December 2014 year-end price target of $71 is based on ~16x our 2015 EBITDA estimate of $608M. This is equivalent to ~26x our 2015 adjusted EPS estimate of $2.73. We use a target EBITDA multiple of ~16x as we believe newly announced products including TripConnect and mobile bookings path are likely to drive incremental revenues in 2014 and beyond. We also believe TRIP should trade at a premium to its online advertising/lead-gen (average ~12x 2015E EBITDA) peers and
83
North America Equity Research09 January 2014
Doug Anmuth(1-212) [email protected]
online travel comps (average ~10x 2015E EBITDA) given: 1) strong engagement and hotel shopper growth; 2) the new meta search display model, which we believe should lead to an improved user interface, higher conversions and engagement, and higher revenues from its OTA customers over time; and 3) longer-term drivers of growth from new products such as the mobile booking path and TripConnect.
Risks to Rating and Price Target
Upside risks include: 1) TripAdvisor being able to continue the acceleration in hotel shopper growth; 2) greater-than-expected increase in CPCs post the meta search display transition and on favorable travel industry metrics; 3) increased monetization from international markets faster than expected; 4) higher volumes of participation from other OTA advertising partners; and 5) Subscription and Other segment becoming a meaningful contributor to growth more quickly than projected.
Downside risks include: 1) macroeconomic concerns negatively impacting the travel advertising industry and CPCs; 2) Google’s travel products increasing competitive pressures through significant progress in online traffic trends and travel ad spend; 3) a decline in contribution from advertising partners due to pressures in volume or pricing; 4) greater-than-expected headwinds to revenue growth following the meta display transition; and 5) higher-than-expected sales and marketing costs, particularly associated with offline TV advertising.

84
North America Equity Research09 January 2014
Doug Anmuth(1-212) [email protected]
TripAdvisor, Inc.: Summary of FinancialsIncome Statement - Annual FY12A FY13E FY14E FY15E Income Statement - Quarterly 1Q13A 2Q13A 3Q13A 4Q13E
Revenues 763 935 1,170 1,428 Revenues 230A 247A 255A 203Operating income 296 301 373 473 Operating income 88A 94A 84A 35D&A 26 33 44 49 D&A 7A 9A 9A 8EBITDA 322 334 416 523 EBITDA 96A 103A 93A 43Net interest income / (expense) 0 0 0 0 Net interest income / (expense) 0A 0A 0A 0Other income / (expense) (14) (11) (8) (6) Other income / (expense) (4)A (4)A (0)A (3)Pretax income 282 290 365 467 Pretax income 84A 90A 84A 32Income taxes (87) (82) (98) (121) Income taxes (22)A (23)A (28)A (9)Net Income 194 208 266 346 Net Income 62A 67A 56A 23Weighted average diluted shares 142 145 149 154 Weighted average diluted shares 145A 146A 145A 144Diluted EPS 1.55 1.70 2.18 2.73 Diluted EPS 0.50A 0.52A 0.45A 0.23
Balance Sheet and Cash Flow Data FY12A FY13E FY14E FY15E Ratio Analysis FY12A FY13E FY14E FY15E
Cash and cash equivalents 368 259 591 1,042 Sales growth 19.8% 22.5% 25.1% 22.1%Accounts receivable 81 120 129 129 EBITDA growth 9.2% 8.3% 27.5% 25.0%Other current assets 65 64 64 64 EPS growth 5.1% 9.8% 28.6% 25.0%Current assets 632 599 940 1,391PP&E 44 68 95 117 EBITDA margin 46.2% 40.8% 41.6% 42.6%Total assets 1,299 1,401 1,767 2,241 Net margin 28.8% 26.3% 27.9% 29.4%Total debt 412 376 376 376 Debt / EBITDA 1.2 1.0 0.8 0.6Total liabilities 572 599 637 664Shareholders' equity 727 802 1,130 1,577 Return on assets (ROA) 20.6% 18.2% 20.6% 20.9%
Return on equity (ROE) 43.0% 32.2% 33.7% 31.0%Net Income (including charges) 195 208 266 346D&A 26 33 44 49 Enterprise value / EBITDA 30.5 28.4 21.6 16.5Change in working capital (6) 46 29 27 Enterprise value / Free cash flow 51.2 38.4 29.9 22.3Other - - - - P/E 58.8 56.0 45.1 35.7Cash flow from operations 239 333 409 508Capex (29) (51) (58) (57)Free cash flow 210 282 351 451Cash flow from investing activities (244) (427) (58) (57)Cash flow from financing activities 190 (17) 0 0Dividends - - - -Dividend yield - - - -
Source: Company reports and J.P. Morgan estimates.Note: $ in millions (except per-share data).Fiscal year ends Dec
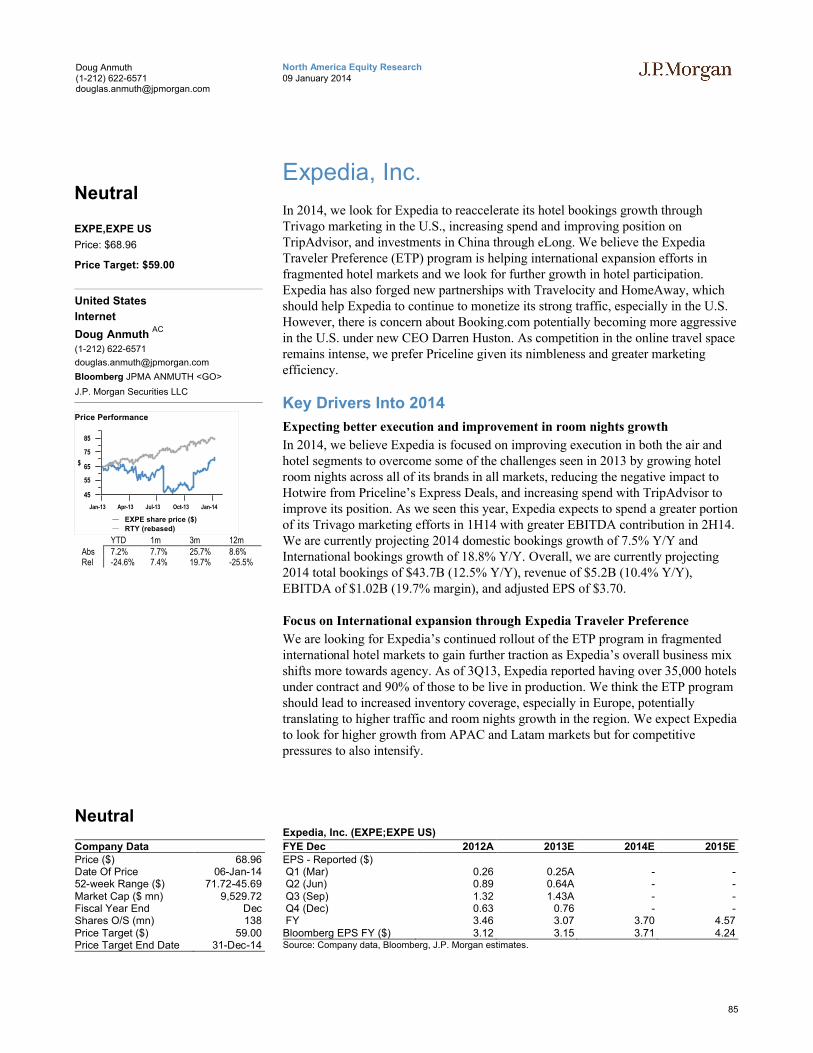
85
North America Equity Research09 January 2014
Doug Anmuth(1-212) [email protected]
Expedia, Inc.
In 2014, we look for Expedia to reaccelerate its hotel bookings growth through Trivago marketing in the U.S., increasing spend and improving position on TripAdvisor, and investments in China through eLong. We believe the Expedia Traveler Preference (ETP) program is helping international expansion efforts in fragmented hotel markets and we look for further growth in hotel participation. Expedia has also forged new partnerships with Travelocity and HomeAway, which should help Expedia to continue to monetize its strong traffic, especially in the U.S. However, there is concern about Booking.com potentially becoming more aggressive in the U.S. under new CEO Darren Huston. As competition in the online travel space remains intense, we prefer Priceline given its nimbleness and greater marketing efficiency.
Key Drivers Into 2014
Expecting better execution and improvement in room nights growth
In 2014, we believe Expedia is focused on improving execution in both the air and hotel segments to overcome some of the challenges seen in 2013 by growing hotel room nights across all of its brands in all markets, reducing the negative impact to Hotwire from Priceline’s Express Deals, and increasing spend with TripAdvisor to improve its position. As we seen this year, Expedia expects to spend a greater portion of its Trivago marketing efforts in 1H14 with greater EBITDA contribution in 2H14. We are currently projecting 2014 domestic bookings growth of 7.5% Y/Y and International bookings growth of 18.8% Y/Y. Overall, we are currently projecting 2014 total bookings of $43.7B (12.5% Y/Y), revenue of $5.2B (10.4% Y/Y), EBITDA of $1.02B (19.7% margin), and adjusted EPS of $3.70.
Focus on International expansion through Expedia Traveler Preference
We are looking for Expedia’s continued rollout of the ETP program in fragmented international hotel markets to gain further traction as Expedia’s overall business mix shifts more towards agency. As of 3Q13, Expedia reported having over 35,000 hotels under contract and 90% of those to be live in production. We think the ETP program should lead to increased inventory coverage, especially in Europe, potentially translating to higher traffic and room nights growth in the region. We expect Expedia to look for higher growth from APAC and Latam markets but for competitive pressures to also intensify.
Neutral
Company DataPrice ($) 68.96Date Of Price 06-Jan-1452-week Range ($) 71.72-45.69Market Cap ($ mn) 9,529.72Fiscal Year End DecShares O/S (mn) 138Price Target ($) 59.00Price Target End Date 31-Dec-14
Expedia, Inc. (EXPE;EXPE US)
FYE Dec 2012A 2013E 2014E 2015EEPS - Reported ($)Q1 (Mar) 0.26 0.25A - -Q2 (Jun) 0.89 0.64A - -Q3 (Sep) 1.32 1.43A - -Q4 (Dec) 0.63 0.76 - -FY 3.46 3.07 3.70 4.57Bloomberg EPS FY ($) 3.12 3.15 3.71 4.24Source: Company data, Bloomberg, J.P. Morgan estimates.
Neutral
EXPE,EXPE US
Price: $68.96
Price Target: $59.00
United States
Internet
Doug Anmuth AC
(1-212) 622-6571
Bloomberg JPMA ANMUTH <GO>
J.P. Morgan Securities LLC
45
55
65
75
85
$
Jan-13 Apr-13 Jul-13 Oct-13 Jan-14
Price Performance
EXPE share price ($)
RTY (rebased)
YTD 1m 3m 12mAbs 7.2% 7.7% 25.7% 8.6%Rel -24.6% 7.4% 19.7% -25.5%
86
North America Equity Research09 January 2014
Doug Anmuth(1-212) [email protected]
Expedia to launch Travelocity partnership in 2014
The partnership is expected to go live in 1H14 as Expedia powers Travelocity’s bookings and customer service functions. We believe this is likely to provide a stream of high-margin revenue for Expedia while enabling Travelocity to reduce tech costs and focus on marketing its brand. We think this is an opportunistic deal for Expedia in an environment in which Booking.com is pushing more aggressively into the U.S. market. We believe the guidance for this deal to contribute $40M-65M in 2014 EBITDA is likely conservative and see potential upside from the partnership.
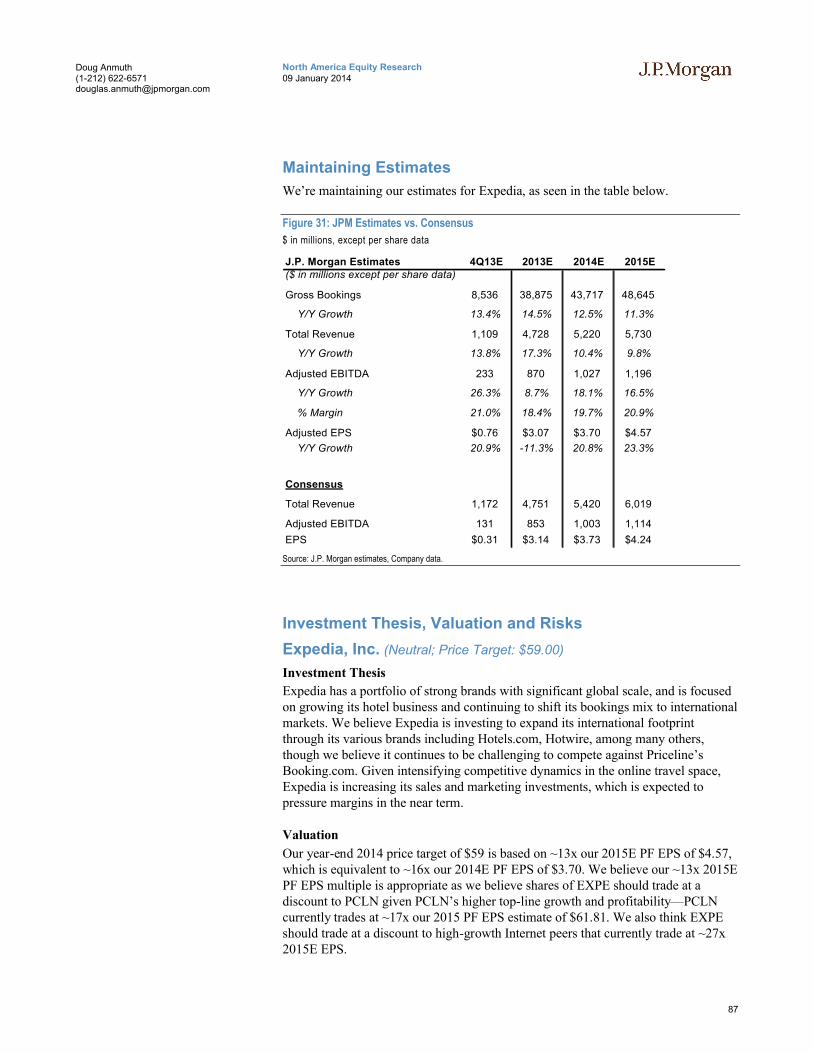
87
North America Equity Research09 January 2014
Doug Anmuth(1-212) [email protected]
Maintaining Estimates
We’re maintaining our estimates for Expedia, as seen in the table below.
Figure 31: JPM Estimates vs. Consensus
$ in millions, except per share data
J.P. Morgan Estimates 4Q13E 2013E 2014E 2015E($ in millions except per share data)
Gross Bookings 8,536 38,875 43,717 48,645
Y/Y Growth 13.4% 14.5% 12.5% 11.3%
Total Revenue 1,109 4,728 5,220 5,730
Y/Y Growth 13.8% 17.3% 10.4% 9.8%
Adjusted EBITDA 233 870 1,027 1,196
Y/Y Growth 26.3% 8.7% 18.1% 16.5%
% Margin 21.0% 18.4% 19.7% 20.9%
Adjusted EPS $0.76 $3.07 $3.70 $4.57
Y/Y Growth 20.9% -11.3% 20.8% 23.3%
Consensus
Total Revenue 1,172 4,751 5,420 6,019
Adjusted EBITDA 131 853 1,003 1,114
EPS $0.31 $3.14 $3.73 $4.24
Source: J.P. Morgan estimates, Company data.
Investment Thesis, Valuation and Risks
Expedia, Inc. (Neutral; Price Target: $59.00)
Investment Thesis
Expedia has a portfolio of strong brands with significant global scale, and is focused on growing its hotel business and continuing to shift its bookings mix to international markets. We believe Expedia is investing to expand its international footprint through its various brands including Hotels.com, Hotwire, among many others, though we believe it continues to be challenging to compete against Priceline’s Booking.com. Given intensifying competitive dynamics in the online travel space, Expedia is increasing its sales and marketing investments, which is expected to pressure margins in the near term.
Valuation
Our year-end 2014 price target of $59 is based on ~13x our 2015E PF EPS of $4.57, which is equivalent to ~16x our 2014E PF EPS of $3.70. We believe our ~13x 2015EPF EPS multiple is appropriate as we believe shares of EXPE should trade at a discount to PCLN given PCLN’s higher top-line growth and profitability—PCLN currently trades at ~17x our 2015 PF EPS estimate of $61.81. We also think EXPE should trade at a discount to high-growth Internet peers that currently trade at ~27x 2015E EPS.
88
North America Equity Research09 January 2014
Doug Anmuth(1-212) [email protected]
Risks to Rating and Price Target
Upside risks include: 1) higher-than-expected international bookings growth for the Expedia brand and Hotels.com; 2) increased efficiency and incremental bookings generated from benefits from the platform migration; and 3) upside to international bookings driven by the AirAsia JV and/or China Southern Airlines partnership.
Downside risks include: 1) a significant slowdown in the global travel industry; 2) Expedia brand performing below expectations post platform migration; 3) increased competition in the U.S. and International markets resulting in significantly higher sales and marketing investments; and 4) Google’s travel products or search ad changes leading to a reduction in bookings and online traffic.
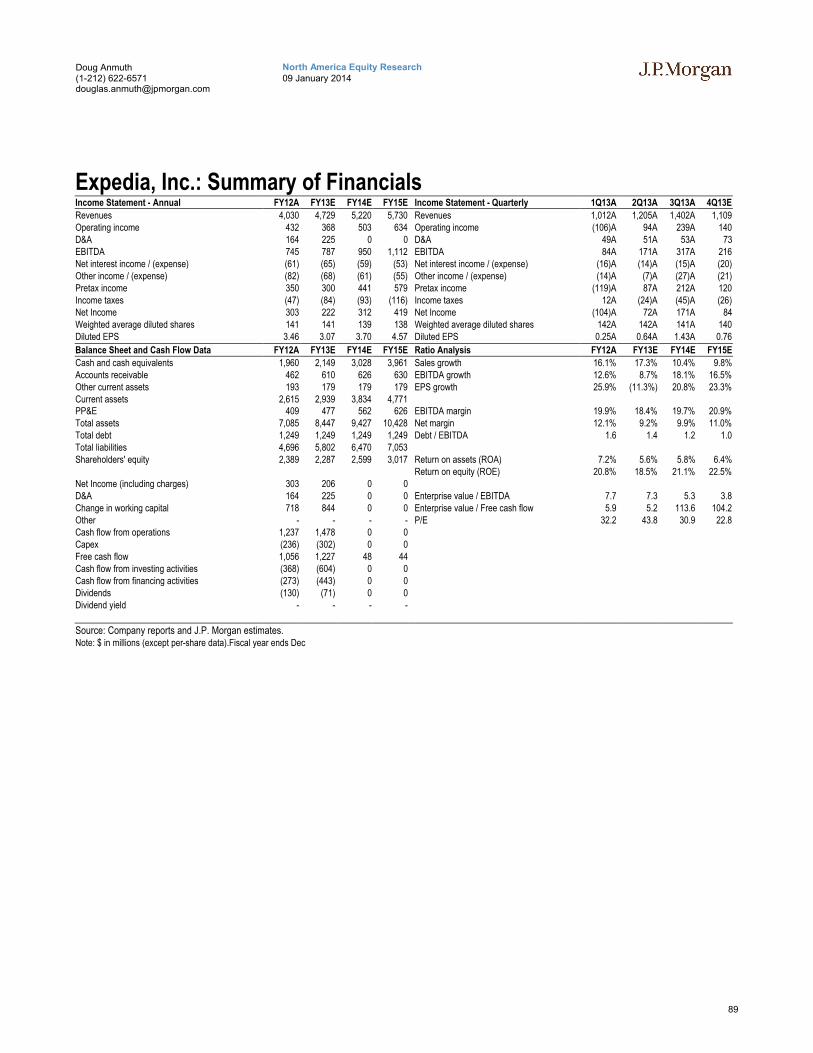
89
North America Equity Research09 January 2014
Doug Anmuth(1-212) [email protected]
Expedia, Inc.: Summary of FinancialsIncome Statement - Annual FY12A FY13E FY14E FY15E Income Statement - Quarterly 1Q13A 2Q13A 3Q13A 4Q13E
Revenues 4,030 4,729 5,220 5,730 Revenues 1,012A 1,205A 1,402A 1,109Operating income 432 368 503 634 Operating income (106)A 94A 239A 140D&A 164 225 0 0 D&A 49A 51A 53A 73EBITDA 745 787 950 1,112 EBITDA 84A 171A 317A 216Net interest income / (expense) (61) (65) (59) (53) Net interest income / (expense) (16)A (14)A (15)A (20)Other income / (expense) (82) (68) (61) (55) Other income / (expense) (14)A (7)A (27)A (21)Pretax income 350 300 441 579 Pretax income (119)A 87A 212A 120Income taxes (47) (84) (93) (116) Income taxes 12A (24)A (45)A (26)Net Income 303 222 312 419 Net Income (104)A 72A 171A 84Weighted average diluted shares 141 141 139 138 Weighted average diluted shares 142A 142A 141A 140Diluted EPS 3.46 3.07 3.70 4.57 Diluted EPS 0.25A 0.64A 1.43A 0.76
Balance Sheet and Cash Flow Data FY12A FY13E FY14E FY15E Ratio Analysis FY12A FY13E FY14E FY15E
Cash and cash equivalents 1,960 2,149 3,028 3,961 Sales growth 16.1% 17.3% 10.4% 9.8%Accounts receivable 462 610 626 630 EBITDA growth 12.6% 8.7% 18.1% 16.5%Other current assets 193 179 179 179 EPS growth 25.9% (11.3%) 20.8% 23.3%Current assets 2,615 2,939 3,834 4,771PP&E 409 477 562 626 EBITDA margin 19.9% 18.4% 19.7% 20.9%Total assets 7,085 8,447 9,427 10,428 Net margin 12.1% 9.2% 9.9% 11.0%Total debt 1,249 1,249 1,249 1,249 Debt / EBITDA 1.6 1.4 1.2 1.0Total liabilities 4,696 5,802 6,470 7,053Shareholders' equity 2,389 2,287 2,599 3,017 Return on assets (ROA) 7.2% 5.6% 5.8% 6.4%
Return on equity (ROE) 20.8% 18.5% 21.1% 22.5%Net Income (including charges) 303 206 0 0D&A 164 225 0 0 Enterprise value / EBITDA 7.7 7.3 5.3 3.8Change in working capital 718 844 0 0 Enterprise value / Free cash flow 5.9 5.2 113.6 104.2Other - - - - P/E 32.2 43.8 30.9 22.8Cash flow from operations 1,237 1,478 0 0Capex (236) (302) 0 0Free cash flow 1,056 1,227 48 44Cash flow from investing activities (368) (604) 0 0Cash flow from financing activities (273) (443) 0 0Dividends (130) (71) 0 0Dividend yield - - - -
Source: Company reports and J.P. Morgan estimates.Note: $ in millions (except per-share data).Fiscal year ends Dec
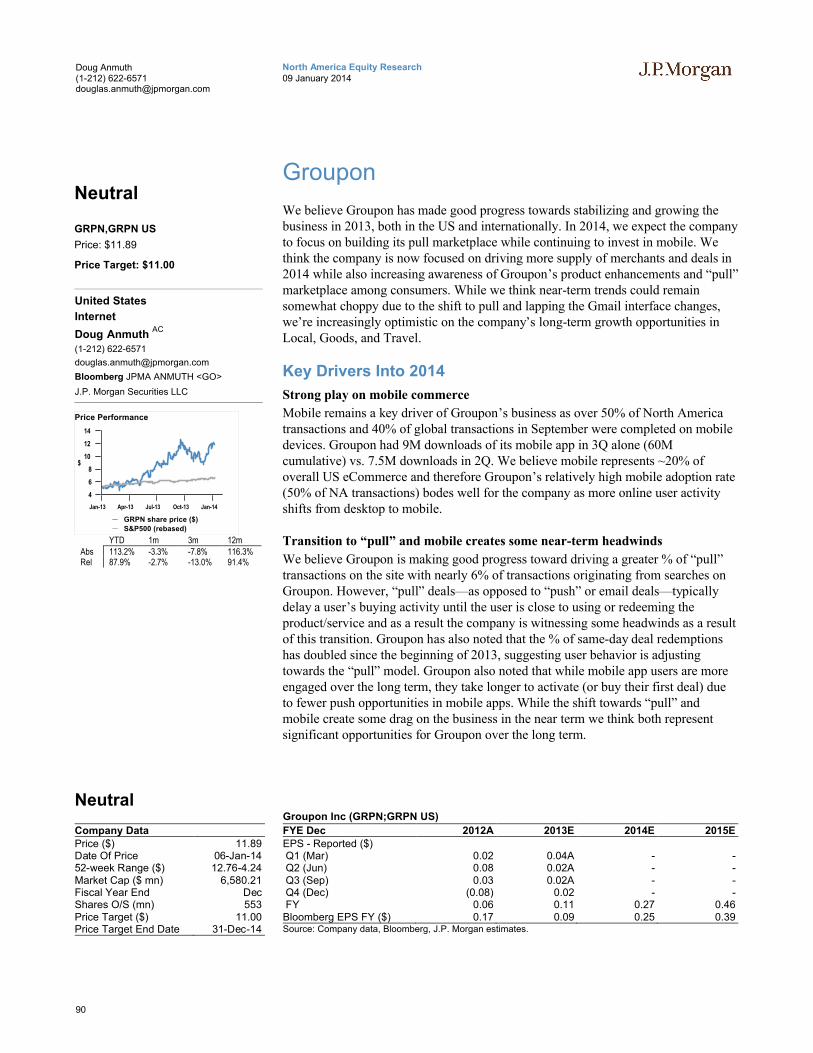
90
North America Equity Research09 January 2014
Doug Anmuth(1-212) [email protected]
Groupon
We believe Groupon has made good progress towards stabilizing and growing the business in 2013, both in the US and internationally. In 2014, we expect the company to focus on building its pull marketplace while continuing to invest in mobile. We think the company is now focused on driving more supply of merchants and deals in 2014 while also increasing awareness of Groupon’s product enhancements and “pull” marketplace among consumers. While we think near-term trends could remain somewhat choppy due to the shift to pull and lapping the Gmail interface changes, we’re increasingly optimistic on the company’s long-term growth opportunities in Local, Goods, and Travel.
Key Drivers Into 2014
Strong play on mobile commerce
Mobile remains a key driver of Groupon’s business as over 50% of North Americatransactions and 40% of global transactions in September were completed on mobile devices. Groupon had 9M downloads of its mobile app in 3Q alone (60M cumulative) vs. 7.5M downloads in 2Q. We believe mobile represents ~20% of overall US eCommerce and therefore Groupon’s relatively high mobile adoption rate (50% of NA transactions) bodes well for the company as more online user activity shifts from desktop to mobile.
Transition to “pull” and mobile creates some near-term headwinds
We believe Groupon is making good progress toward driving a greater % of “pull”transactions on the site with nearly 6% of transactions originating from searches on Groupon. However, “pull” deals—as opposed to “push” or email deals—typically delay a user’s buying activity until the user is close to using or redeeming the product/service and as a result the company is witnessing some headwinds as a result of this transition. Groupon has also noted that the % of same-day deal redemptions has doubled since the beginning of 2013, suggesting user behavior is adjusting towards the “pull” model. Groupon also noted that while mobile app users are more engaged over the long term, they take longer to activate (or buy their first deal) due to fewer push opportunities in mobile apps. While the shift towards “pull” and mobile create some drag on the business in the near term we think both representsignificant opportunities for Groupon over the long term.
Neutral
Company DataPrice ($) 11.89Date Of Price 06-Jan-1452-week Range ($) 12.76-4.24Market Cap ($ mn) 6,580.21Fiscal Year End DecShares O/S (mn) 553Price Target ($) 11.00Price Target End Date 31-Dec-14
Groupon Inc (GRPN;GRPN US)
FYE Dec 2012A 2013E 2014E 2015EEPS - Reported ($)Q1 (Mar) 0.02 0.04A - -Q2 (Jun) 0.08 0.02A - -Q3 (Sep) 0.03 0.02A - -Q4 (Dec) (0.08) 0.02 - -FY 0.06 0.11 0.27 0.46Bloomberg EPS FY ($) 0.17 0.09 0.25 0.39Source: Company data, Bloomberg, J.P. Morgan estimates.
Neutral
GRPN,GRPN US
Price: $11.89
Price Target: $11.00
United States
Internet
Doug Anmuth AC
(1-212) 622-6571
Bloomberg JPMA ANMUTH <GO>
J.P. Morgan Securities LLC
4
6
8
10
12
14
$
Jan-13 Apr-13 Jul-13 Oct-13 Jan-14
Price Performance
GRPN share price ($)
S&P500 (rebased)
YTD 1m 3m 12mAbs 113.2% -3.3% -7.8% 116.3%Rel 87.9% -2.7% -13.0% 91.4%
91
North America Equity Research09 January 2014
Doug Anmuth(1-212) [email protected]
Expect continued improvements in international markets
While growth in international markets, particularly Rest of World, has trailed that in the US, we think Groupon is focused on turning around these markets, though we think the company may opportunistically divest or exit some cities in certain countries. The company is also focused on rolling out its One Playbook across all its geographies which we think should go a long way in improving merchant and consumer satisfaction towards US levels.
Still early in shift to “Pull”
While the company has made great strides towards increasing deal inventory through its Deal Bank and opening up the site to search engines, we think consumers remain relatively unaware of the company’s “pull” initiative. We think there’s some potential that the transition towards “pull” may take longer than expected or require higher-than-expected marketing expenses.
Gmail change impact likely to persist for a few more quarters
Groupon’s 3Q revenue was negatively impacted by seasonality as well as the Gmail changes that resulted in a low-double-digit decline in Gmail email open rates. In 2Q, Gmail began automatically including Groupon and other “promotional” e-mail in a separate “Promotions” folder, outside the primary inbox. While the company is focused on transitioning away from e-mail to a “pull” model, and Gmail represents a subset of mobile email opens, we think this is a headwind that’s likely to persist for the next couple of quarters.
Potential for improvement in fulfillment and shipping expenses
As the Goods business continues to grow faster than Groupon’s Local segment, we see significant room for Groupon to get some additional scale or efficiency from its fulfillment and shipping expenses, which the company has noted are higher than industry averages. We think there’s room for the company to drive better fulfillment and shipping efficiencies from its shipping vendors as the Goods business grows. Moreover, we think there’s also a user component that can drive additional fulfillment/shipping efficiencies as consumers order multiple items per transaction. We note that the company only recently implemented shopping cart functionality on the site which we believe should drive higher order values over time.
An emphasis on SEM and transactional marketing
Groupon opened up its site to search engines on November 1 and consumers can now browse deals without logging in or signing up. The company has increased the number of deals on the site to ~65k in North America and we think Groupon is likely to begin investing in search engine marketing and optimization to drive more transactions to the site.
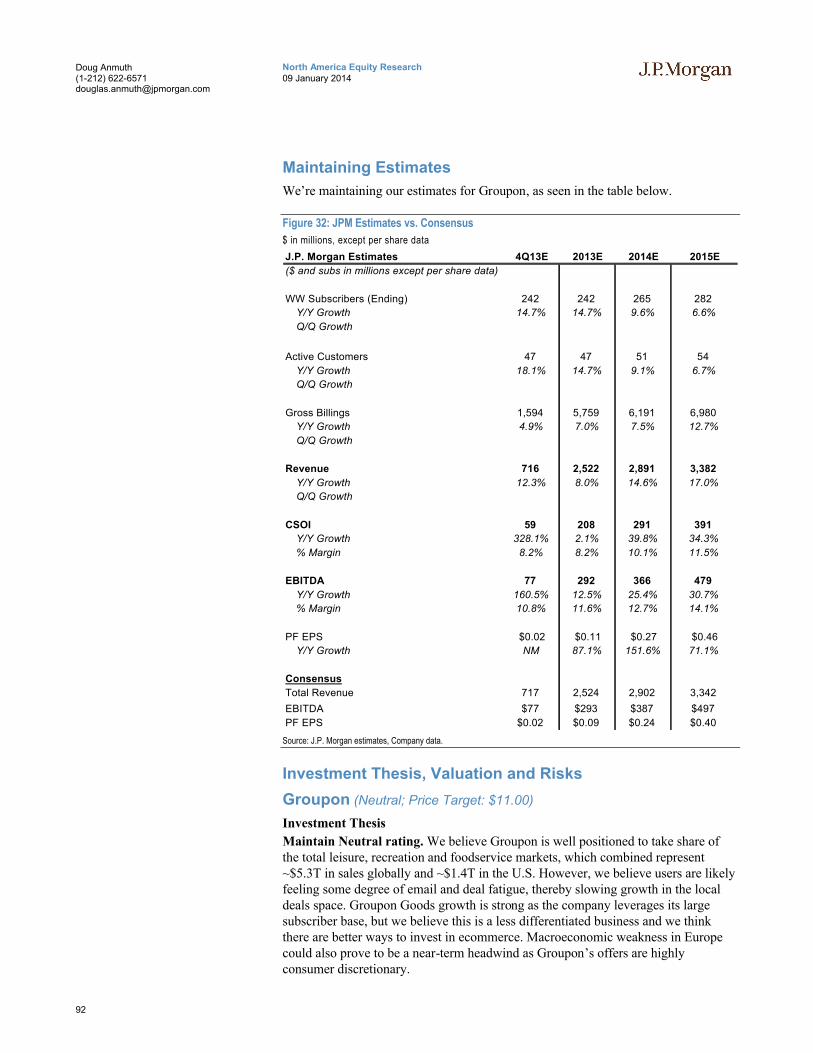
92
North America Equity Research09 January 2014
Doug Anmuth(1-212) [email protected]
Maintaining Estimates
We’re maintaining our estimates for Groupon, as seen in the table below.
Figure 32: JPM Estimates vs. Consensus
$ in millions, except per share data
J.P. Morgan Estimates 4Q13E 2013E 2014E 2015E
($ and subs in millions except per share data)
WW Subscribers (Ending) 242 242 265 282
Y/Y Growth 14.7% 14.7% 9.6% 6.6%
Q/Q Growth
Active Customers 47 47 51 54
Y/Y Growth 18.1% 14.7% 9.1% 6.7%
Q/Q Growth
Gross Billings 1,594 5,759 6,191 6,980
Y/Y Growth 4.9% 7.0% 7.5% 12.7%
Q/Q Growth
Revenue 716 2,522 2,891 3,382
Y/Y Growth 12.3% 8.0% 14.6% 17.0%
Q/Q Growth
CSOI 59 208 291 391
Y/Y Growth 328.1% 2.1% 39.8% 34.3%
% Margin 8.2% 8.2% 10.1% 11.5%
EBITDA 77 292 366 479
Y/Y Growth 160.5% 12.5% 25.4% 30.7%
% Margin 10.8% 11.6% 12.7% 14.1%
PF EPS $0.02 $0.11 $0.27 $0.46
Y/Y Growth NM 87.1% 151.6% 71.1%
Consensus
Total Revenue 717 2,524 2,902 3,342
EBITDA $77 $293 $387 $497
PF EPS $0.02 $0.09 $0.24 $0.40
Source: J.P. Morgan estimates, Company data.
Investment Thesis, Valuation and Risks
Groupon (Neutral; Price Target: $11.00)
Investment Thesis
Maintain Neutral rating. We believe Groupon is well positioned to take share of the total leisure, recreation and foodservice markets, which combined represent ~$5.3T in sales globally and ~$1.4T in the U.S. However, we believe users are likely feeling some degree of email and deal fatigue, thereby slowing growth in the local deals space. Groupon Goods growth is strong as the company leverages its large subscriber base, but we believe this is a less differentiated business and we think there are better ways to invest in ecommerce. Macroeconomic weakness in Europe could also prove to be a near-term headwind as Groupon’s offers are highly consumer discretionary.

93
North America Equity Research09 January 2014
Doug Anmuth(1-212) [email protected]
Valuation
Our year-end 2014 price target of $11 is based on ~9.5x our 2015E EBITDA of $479M, roughly in line with industry peers such as Google and eBay.
Risks to Rating and Price Target
Upside risks include: 1) deal targeting and personalization improvements potentially driving upside; and 2) significant improvements in conversions, as Groupon is testing deal targeting in the UK and other European markets where local deals have remained weak, potentially driving upside to our estimates.
Downside risks mainly relate to potential for further deal fatigue to increase downside risk. We think consumers will always look for ways to save money, making local deals an important channel for discovering new merchants andproducts. However, we think the limited history of local deals makes it difficult to predict whether consumer behavior toward the format will remain as robust.
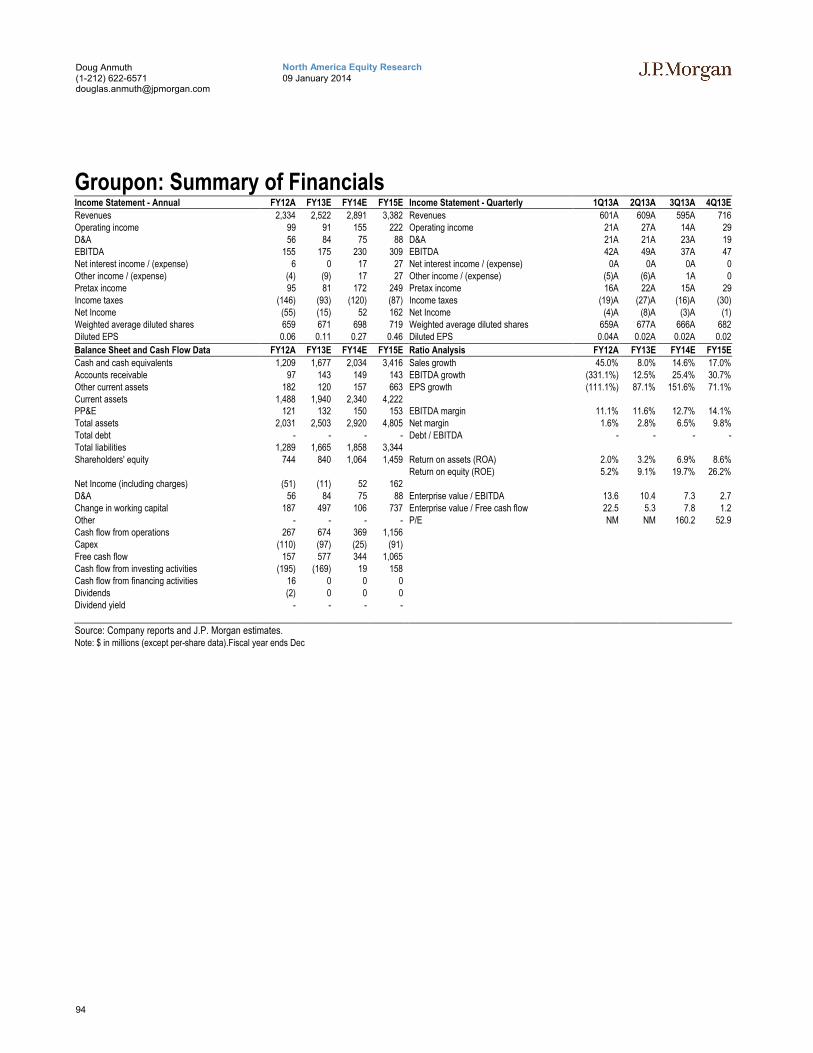
94
North America Equity Research09 January 2014
Doug Anmuth(1-212) [email protected]
Groupon: Summary of FinancialsIncome Statement - Annual FY12A FY13E FY14E FY15E Income Statement - Quarterly 1Q13A 2Q13A 3Q13A 4Q13E
Revenues 2,334 2,522 2,891 3,382 Revenues 601A 609A 595A 716Operating income 99 91 155 222 Operating income 21A 27A 14A 29D&A 56 84 75 88 D&A 21A 21A 23A 19EBITDA 155 175 230 309 EBITDA 42A 49A 37A 47Net interest income / (expense) 6 0 17 27 Net interest income / (expense) 0A 0A 0A 0Other income / (expense) (4) (9) 17 27 Other income / (expense) (5)A (6)A 1A 0Pretax income 95 81 172 249 Pretax income 16A 22A 15A 29Income taxes (146) (93) (120) (87) Income taxes (19)A (27)A (16)A (30)Net Income (55) (15) 52 162 Net Income (4)A (8)A (3)A (1)Weighted average diluted shares 659 671 698 719 Weighted average diluted shares 659A 677A 666A 682Diluted EPS 0.06 0.11 0.27 0.46 Diluted EPS 0.04A 0.02A 0.02A 0.02
Balance Sheet and Cash Flow Data FY12A FY13E FY14E FY15E Ratio Analysis FY12A FY13E FY14E FY15E
Cash and cash equivalents 1,209 1,677 2,034 3,416 Sales growth 45.0% 8.0% 14.6% 17.0%Accounts receivable 97 143 149 143 EBITDA growth (331.1%) 12.5% 25.4% 30.7%Other current assets 182 120 157 663 EPS growth (111.1%) 87.1% 151.6% 71.1%Current assets 1,488 1,940 2,340 4,222PP&E 121 132 150 153 EBITDA margin 11.1% 11.6% 12.7% 14.1%Total assets 2,031 2,503 2,920 4,805 Net margin 1.6% 2.8% 6.5% 9.8%Total debt - - - - Debt / EBITDA - - - -Total liabilities 1,289 1,665 1,858 3,344Shareholders' equity 744 840 1,064 1,459 Return on assets (ROA) 2.0% 3.2% 6.9% 8.6%
Return on equity (ROE) 5.2% 9.1% 19.7% 26.2%Net Income (including charges) (51) (11) 52 162D&A 56 84 75 88 Enterprise value / EBITDA 13.6 10.4 7.3 2.7Change in working capital 187 497 106 737 Enterprise value / Free cash flow 22.5 5.3 7.8 1.2Other - - - - P/E NM NM 160.2 52.9Cash flow from operations 267 674 369 1,156Capex (110) (97) (25) (91)Free cash flow 157 577 344 1,065Cash flow from investing activities (195) (169) 19 158Cash flow from financing activities 16 0 0 0Dividends (2) 0 0 0Dividend yield - - - -
Source: Company reports and J.P. Morgan estimates.Note: $ in millions (except per-share data).Fiscal year ends Dec
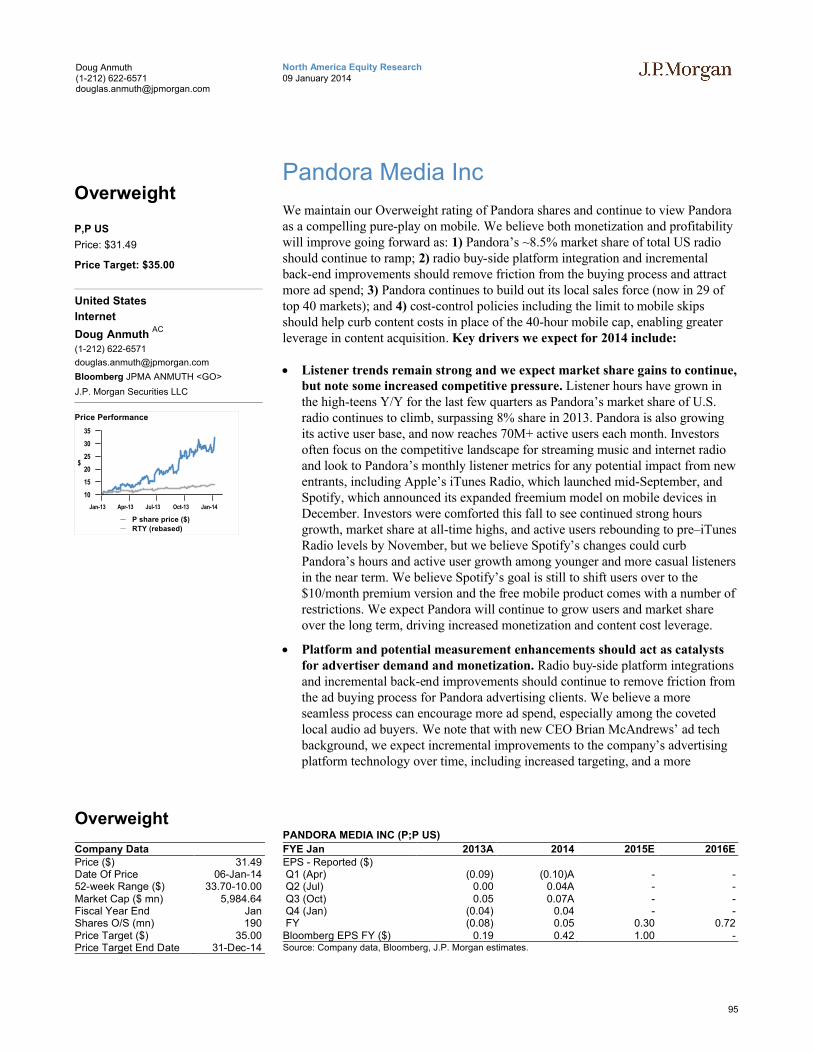
95
North America Equity Research09 January 2014
Doug Anmuth(1-212) [email protected]
Pandora Media Inc
We maintain our Overweight rating of Pandora shares and continue to view Pandora as a compelling pure-play on mobile. We believe both monetization and profitability will improve going forward as: 1) Pandora’s ~8.5% market share of total US radio should continue to ramp; 2) radio buy-side platform integration and incremental back-end improvements should remove friction from the buying process and attract more ad spend; 3) Pandora continues to build out its local sales force (now in 29 of top 40 markets); and 4) cost-control policies including the limit to mobile skips should help curb content costs in place of the 40-hour mobile cap, enabling greater leverage in content acquisition. Key drivers we expect for 2014 include:
Listener trends remain strong and we expect market share gains to continue, but note some increased competitive pressure. Listener hours have grown in the high-teens Y/Y for the last few quarters as Pandora’s market share of U.S. radio continues to climb, surpassing 8% share in 2013. Pandora is also growing its active user base, and now reaches 70M+ active users each month. Investors often focus on the competitive landscape for streaming music and internet radio and look to Pandora’s monthly listener metrics for any potential impact from new entrants, including Apple’s iTunes Radio, which launched mid-September, and Spotify, which announced its expanded freemium model on mobile devices in December. Investors were comforted this fall to see continued strong hours growth, market share at all-time highs, and active users rebounding to pre–iTunes Radio levels by November, but we believe Spotify’s changes could curb Pandora’s hours and active user growth among younger and more casual listeners in the near term. We believe Spotify’s goal is still to shift users over to the $10/month premium version and the free mobile product comes with a number of restrictions. We expect Pandora will continue to grow users and market shareover the long term, driving increased monetization and content cost leverage.
Platform and potential measurement enhancements should act as catalystsfor advertiser demand and monetization. Radio buy-side platform integrationsand incremental back-end improvements should continue to remove friction from the ad buying process for Pandora advertising clients. We believe a more seamless process can encourage more ad spend, especially among the covetedlocal audio ad buyers. We note that with new CEO Brian McAndrews’ ad tech background, we expect incremental improvements to the company’s advertising platform technology over time, including increased targeting, and a more
Overweight
Company DataPrice ($) 31.49Date Of Price 06-Jan-1452-week Range ($) 33.70-10.00Market Cap ($ mn) 5,984.64Fiscal Year End JanShares O/S (mn) 190Price Target ($) 35.00Price Target End Date 31-Dec-14
PANDORA MEDIA INC (P;P US)
FYE Jan 2013A 2014 2015E 2016EEPS - Reported ($)Q1 (Apr) (0.09) (0.10)A - -Q2 (Jul) 0.00 0.04A - -Q3 (Oct) 0.05 0.07A - -Q4 (Jan) (0.04) 0.04 - -FY (0.08) 0.05 0.30 0.72Bloomberg EPS FY ($) 0.19 0.42 1.00 -Source: Company data, Bloomberg, J.P. Morgan estimates.
Overweight
P,P US
Price: $31.49
Price Target: $35.00
United States
Internet
Doug Anmuth AC
(1-212) 622-6571
Bloomberg JPMA ANMUTH <GO>
J.P. Morgan Securities LLC
10
15
20
25
30
35
$
Jan-13 Apr-13 Jul-13 Oct-13 Jan-14
Price Performance
P share price ($)
RTY (rebased)
96
North America Equity Research09 January 2014
Doug Anmuth(1-212) [email protected]
automated buying process to facilitate scalability of smaller, more targeted campaigns. Additionally, we expect to see increased advertiser demand when Nielsen Audio (formerly Arbitron) commences its expected streaming radio measurement, and we are confident that Pandora’s ability to deliver attractive ROIs will be a driver of advertising sell-through rate and pricing over time.
Continued sales force build-out to help drive RPM. We expect Pandora to continue building out its sales force, now armed with enhanced ad targetabilityand unique ad formats, and believe it will drive the growth of local audio ads and higher RPM. Pandora continues to build out its local sales force, with local sales reps now in 29 of top the 40 markets. We note the early part of the calendar year tends to be a heavier hiring period for Pandora and we expect further expansion of the local sales footprint in 1H14. We also note that Pandora’s growing salesforce will have a stronger toolkit with which to entice local ad buyers, given the company’s new audience segmentation initiative and unique ad formats relative to what broadcast can offer. Pandora currently enables its advertisers to target users based on registration data including age, gender, and zip code. In a new effort, Pandora is starting to cross-reference registration information with listener patterns and other third-party data to allow for more granular targeting of audience segments such as Hispanic listeners in a certain metro area. We believe these highly targeted campaigns will command premium CPMs, likely of at least $20+. We look for Pandora to announce more audience segments 2014, and believe that increased targetability along with innovative ad formats, including combining audio with video, can help increase RPM going forward.
Confident in Pandora’s ability to gain content cost leverage in the model.Cost-control policies including the limit to mobile skips should continue to help curb content costs in place of the short-lived 40-hour mobile cap that was in effect from March to August of 2013. As evidenced in recent quarters, these more fine-tuned policies can help support leverage in content acquisition. However, we highlight that the largest portion of the company’s current content cost structure expires after 2015, and will be determined by a two-year CRB arbitration process, beginning this month. We believe Pandora has a compelling case for reducing per-track rates given vast cost differences with virtually every other radio medium—terrestrial, satellite, even cable—and current per-track rates do not encourage competition from smaller companies and start-ups. We are modeling rates to continue to increase going forward though we believe Pandora could see a modest reduction. We also highlight Pandora’s option to attempt its own direct deals with labels, if the company believes it can attain more attractive rates directly, relative to the outcome of the CRB arbitration process.
Competition remains for users’ listening hours and brands’ advertising dollars. Pandora continues to compete with streaming radio and music providers such as Apple, Google, and Spotify, and others. Recent focus has centered around Apple’s iTunes Radio, launched in September, and Spotify, which expanded its freemium model on mobile in December. Given November’s rebound in Pandora listener metrics, including strength in hours growth, an all-time high market share, and a rebound in active users to pre–iTunes Radio levels, we believe the company held up well through Apple’s competitive launch. We believe Spotify’s changes announced in December could curb Pandora’s hours and active user growth among younger and more casual listeners in the near term, but we believe Spotify’s goal is still to shift users over to the $10/month premium version and the free mobile product comes with a number of restrictions. We note that
97
North America Equity Research09 January 2014
Doug Anmuth(1-212) [email protected]
monthly audience metrics will be in focus for the next few months as investors gauge any potential impact from Spotify’s expanded free mobile user functionality.
What to look for going into 2014: 1) Growth in advertising RPM, specifically on mobile, which would be aided by an increasing portion of local audio ads, new targeting capabilities, more robust sales force, and measurement/platform integration; 2) Further sales force build-out into new markets, either deepening presence in lucrative markets or initiating a presence in new U.S. (or international) markets, potentially adding 10-12 new markets this year; 3)Potential to expand into new international markets would represent incremental upside we are not currently including in our model; 4) Any feedback from the arbitration process, which starts in January 2014; 5) Potential measurement by Nielson Audio, which we believe would further reduce friction for radio ad buyers.
$35 PT and Overweight rating. Our price target of $35 is based on our DCF model through 2020, which assumes a 12% cost of capital, 4% terminal growth rate, and a 13.0x terminal EBITDA multiple. Key drivers of our DCF projection include 2012-2020 CAGRs of 37% for revenue and 115% for EBITDA. Our $35 price target equates to ~7x FY2015E EV/Revenue. We remain positive on Pandora as we believe it is well positioned to take share of the U.S. online display, mobile, and radio ad markets (~$37B opportunity by 2014). We continue to view Pandora as a compelling pure-play on mobile advertising and believe both monetization and profitability will improve over the next few quarters.
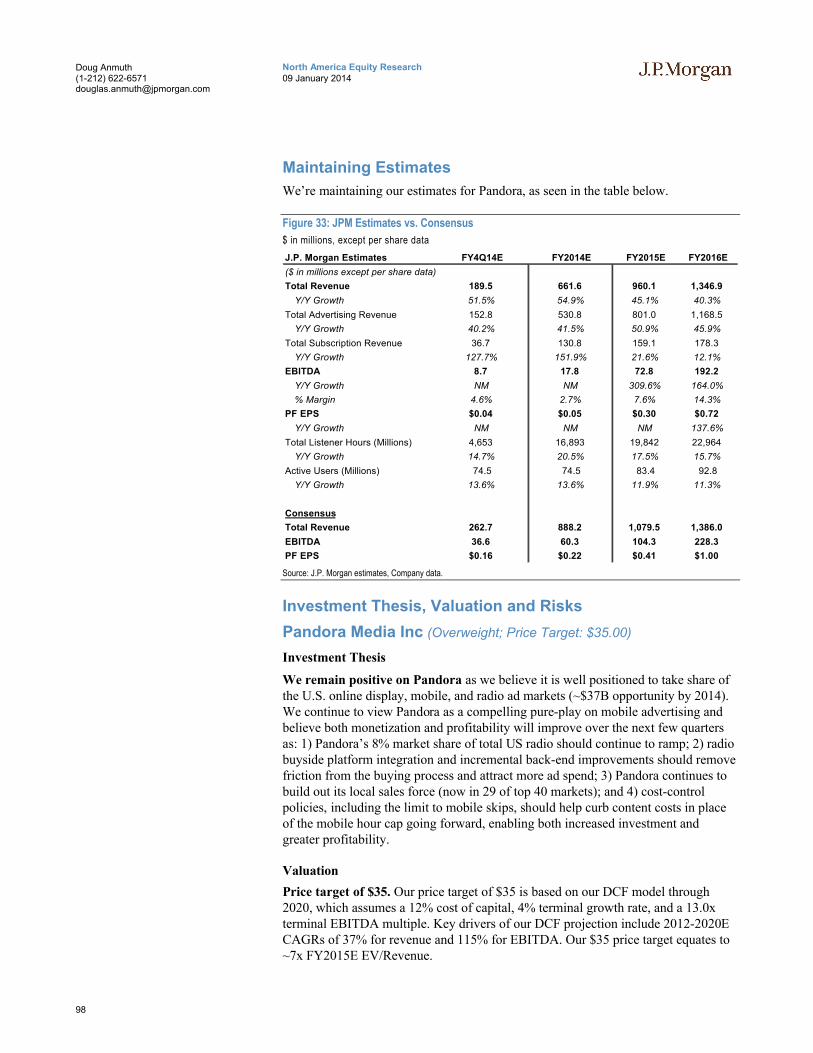
98
North America Equity Research09 January 2014
Doug Anmuth(1-212) [email protected]
Maintaining Estimates
We’re maintaining our estimates for Pandora, as seen in the table below.
Figure 33: JPM Estimates vs. Consensus
$ in millions, except per share data
J.P. Morgan Estimates FY4Q14E FY2014E FY2015E FY2016E
($ in millions except per share data)
Total Revenue 189.5 661.6 960.1 1,346.9
Y/Y Growth 51.5% 54.9% 45.1% 40.3%
Total Advertising Revenue 152.8 530.8 801.0 1,168.5
Y/Y Growth 40.2% 41.5% 50.9% 45.9%
Total Subscription Revenue 36.7 130.8 159.1 178.3
Y/Y Growth 127.7% 151.9% 21.6% 12.1%
EBITDA 8.7 17.8 72.8 192.2
Y/Y Growth NM NM 309.6% 164.0%
% Margin 4.6% 2.7% 7.6% 14.3%
PF EPS $0.04 $0.05 $0.30 $0.72
Y/Y Growth NM NM NM 137.6%
Total Listener Hours (Millions) 4,653 16,893 19,842 22,964
Y/Y Growth 14.7% 20.5% 17.5% 15.7%
Active Users (Millions) 74.5 74.5 83.4 92.8
Y/Y Growth 13.6% 13.6% 11.9% 11.3%
Consensus
Total Revenue 262.7 888.2 1,079.5 1,386.0
EBITDA 36.6 60.3 104.3 228.3
PF EPS $0.16 $0.22 $0.41 $1.00
Source: J.P. Morgan estimates, Company data.
Investment Thesis, Valuation and Risks
Pandora Media Inc (Overweight; Price Target: $35.00)
Investment Thesis
We remain positive on Pandora as we believe it is well positioned to take share of the U.S. online display, mobile, and radio ad markets (~$37B opportunity by 2014). We continue to view Pandora as a compelling pure-play on mobile advertising and believe both monetization and profitability will improve over the next few quarters as: 1) Pandora’s 8% market share of total US radio should continue to ramp; 2) radio buyside platform integration and incremental back-end improvements should remove friction from the buying process and attract more ad spend; 3) Pandora continues to build out its local sales force (now in 29 of top 40 markets); and 4) cost-control policies, including the limit to mobile skips, should help curb content costs in place of the mobile hour cap going forward, enabling both increased investment and greater profitability.
Valuation
Price target of $35. Our price target of $35 is based on our DCF model through 2020, which assumes a 12% cost of capital, 4% terminal growth rate, and a 13.0x terminal EBITDA multiple. Key drivers of our DCF projection include 2012-2020ECAGRs of 37% for revenue and 115% for EBITDA. Our $35 price target equates to ~7x FY2015E EV/Revenue.

99
North America Equity Research09 January 2014
Doug Anmuth(1-212) [email protected]
Risks to Rating and Price Target
Downside risks include: 1) the sales force being unable to keep up with rapidly growing listener hours; 2) the mobile ad market developing more slowly that we project, or monetization not improving; 3) Pandora being unable to negotiate a favorable royalty rate structure beyond 2015; and 4) increased competition from players such as Apple, Google, and Spotify.
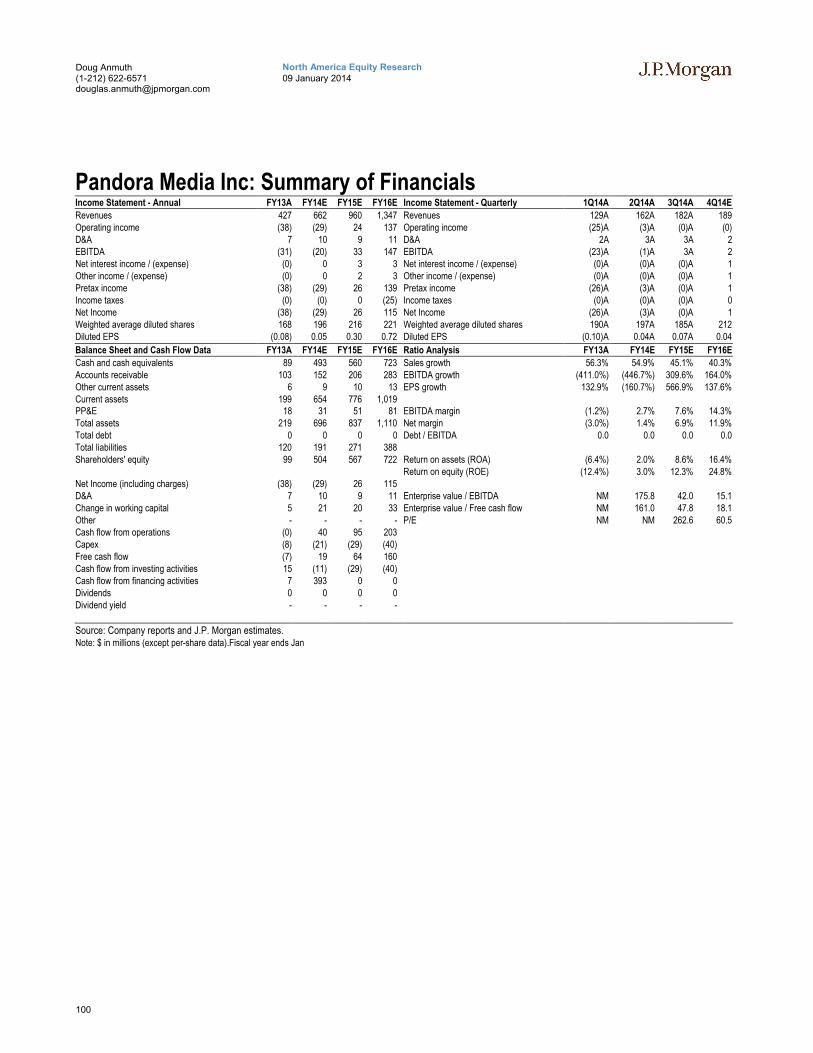
100
North America Equity Research09 January 2014
Doug Anmuth(1-212) [email protected]
Pandora Media Inc: Summary of FinancialsIncome Statement - Annual FY13A FY14E FY15E FY16E Income Statement - Quarterly 1Q14A 2Q14A 3Q14A 4Q14E
Revenues 427 662 960 1,347 Revenues 129A 162A 182A 189Operating income (38) (29) 24 137 Operating income (25)A (3)A (0)A (0)D&A 7 10 9 11 D&A 2A 3A 3A 2EBITDA (31) (20) 33 147 EBITDA (23)A (1)A 3A 2Net interest income / (expense) (0) 0 3 3 Net interest income / (expense) (0)A (0)A (0)A 1Other income / (expense) (0) 0 2 3 Other income / (expense) (0)A (0)A (0)A 1Pretax income (38) (29) 26 139 Pretax income (26)A (3)A (0)A 1Income taxes (0) (0) 0 (25) Income taxes (0)A (0)A (0)A 0Net Income (38) (29) 26 115 Net Income (26)A (3)A (0)A 1Weighted average diluted shares 168 196 216 221 Weighted average diluted shares 190A 197A 185A 212Diluted EPS (0.08) 0.05 0.30 0.72 Diluted EPS (0.10)A 0.04A 0.07A 0.04
Balance Sheet and Cash Flow Data FY13A FY14E FY15E FY16E Ratio Analysis FY13A FY14E FY15E FY16E
Cash and cash equivalents 89 493 560 723 Sales growth 56.3% 54.9% 45.1% 40.3%Accounts receivable 103 152 206 283 EBITDA growth (411.0%) (446.7%) 309.6% 164.0%Other current assets 6 9 10 13 EPS growth 132.9% (160.7%) 566.9% 137.6%Current assets 199 654 776 1,019PP&E 18 31 51 81 EBITDA margin (1.2%) 2.7% 7.6% 14.3%Total assets 219 696 837 1,110 Net margin (3.0%) 1.4% 6.9% 11.9%Total debt 0 0 0 0 Debt / EBITDA 0.0 0.0 0.0 0.0Total liabilities 120 191 271 388Shareholders' equity 99 504 567 722 Return on assets (ROA) (6.4%) 2.0% 8.6% 16.4%
Return on equity (ROE) (12.4%) 3.0% 12.3% 24.8%Net Income (including charges) (38) (29) 26 115D&A 7 10 9 11 Enterprise value / EBITDA NM 175.8 42.0 15.1Change in working capital 5 21 20 33 Enterprise value / Free cash flow NM 161.0 47.8 18.1Other - - - - P/E NM NM 262.6 60.5Cash flow from operations (0) 40 95 203Capex (8) (21) (29) (40)Free cash flow (7) 19 64 160Cash flow from investing activities 15 (11) (29) (40)Cash flow from financing activities 7 393 0 0Dividends 0 0 0 0Dividend yield - - - -
Source: Company reports and J.P. Morgan estimates.Note: $ in millions (except per-share data).Fiscal year ends Jan
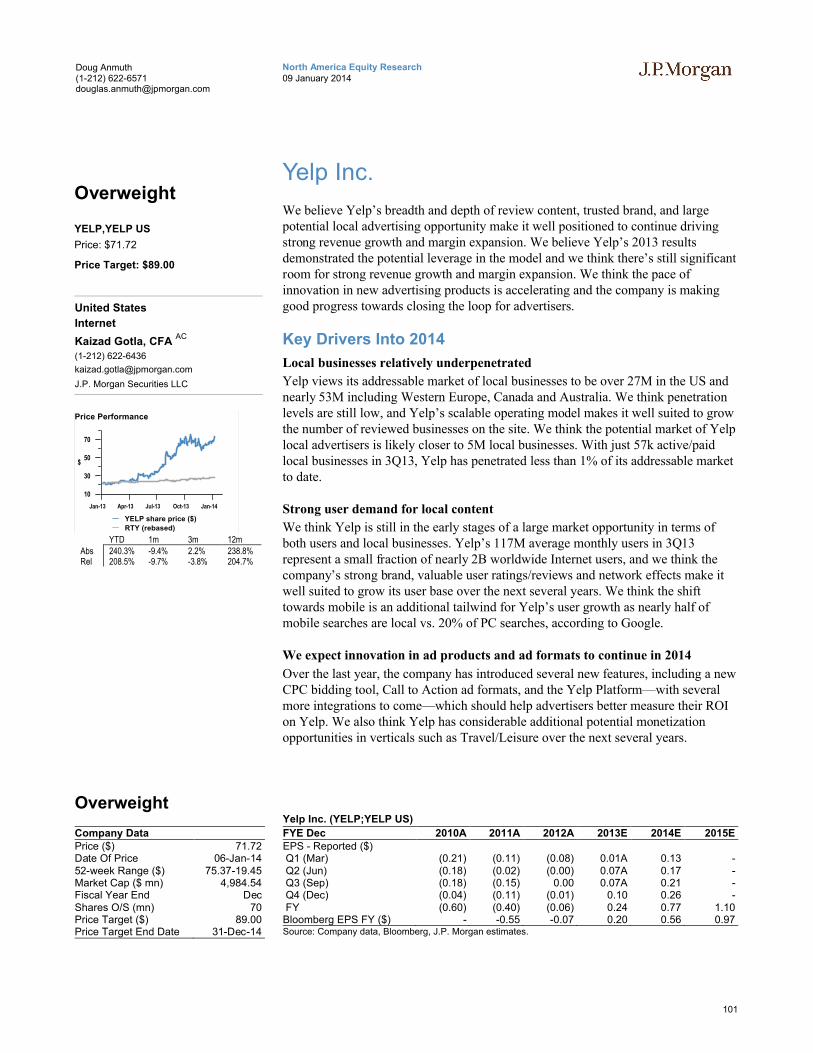
101
North America Equity Research09 January 2014
Doug Anmuth(1-212) [email protected]
Yelp Inc.
We believe Yelp’s breadth and depth of review content, trusted brand, and large potential local advertising opportunity make it well positioned to continue driving strong revenue growth and margin expansion. We believe Yelp’s 2013 results demonstrated the potential leverage in the model and we think there’s still significant room for strong revenue growth and margin expansion. We think the pace of innovation in new advertising products is accelerating and the company is making good progress towards closing the loop for advertisers.
Key Drivers Into 2014
Local businesses relatively underpenetrated
Yelp views its addressable market of local businesses to be over 27M in the US and nearly 53M including Western Europe, Canada and Australia. We think penetration levels are still low, and Yelp’s scalable operating model makes it well suited to grow the number of reviewed businesses on the site. We think the potential market of Yelp local advertisers is likely closer to 5M local businesses. With just 57k active/paid local businesses in 3Q13, Yelp has penetrated less than 1% of its addressable market to date.
Strong user demand for local content
We think Yelp is still in the early stages of a large market opportunity in terms of both users and local businesses. Yelp’s 117M average monthly users in 3Q13represent a small fraction of nearly 2B worldwide Internet users, and we think the company’s strong brand, valuable user ratings/reviews and network effects make it well suited to grow its user base over the next several years. We think the shift towards mobile is an additional tailwind for Yelp’s user growth as nearly half of mobile searches are local vs. 20% of PC searches, according to Google.
We expect innovation in ad products and ad formats to continue in 2014
Over the last year, the company has introduced several new features, including a new CPC bidding tool, Call to Action ad formats, and the Yelp Platform—with several more integrations to come—which should help advertisers better measure their ROI on Yelp. We also think Yelp has considerable additional potential monetization opportunities in verticals such as Travel/Leisure over the next several years.
Overweight
Company DataPrice ($) 71.72Date Of Price 06-Jan-1452-week Range ($) 75.37-19.45Market Cap ($ mn) 4,984.54Fiscal Year End DecShares O/S (mn) 70Price Target ($) 89.00Price Target End Date 31-Dec-14
Yelp Inc. (YELP;YELP US)
FYE Dec 2010A 2011A 2012A 2013E 2014E 2015EEPS - Reported ($)Q1 (Mar) (0.21) (0.11) (0.08) 0.01A 0.13 -Q2 (Jun) (0.18) (0.02) (0.00) 0.07A 0.17 -Q3 (Sep) (0.18) (0.15) 0.00 0.07A 0.21 -Q4 (Dec) (0.04) (0.11) (0.01) 0.10 0.26 -FY (0.60) (0.40) (0.06) 0.24 0.77 1.10Bloomberg EPS FY ($) - -0.55 -0.07 0.20 0.56 0.97Source: Company data, Bloomberg, J.P. Morgan estimates.
Overweight
YELP,YELP US
Price: $71.72
Price Target: $89.00
United States
Internet
Kaizad Gotla, CFA AC
(1-212) 622-6436
J.P. Morgan Securities LLC
10
30
50
70
$
Jan-13 Apr-13 Jul-13 Oct-13 Jan-14
Price Performance
YELP share price ($)
RTY (rebased)
YTD 1m 3m 12mAbs 240.3% -9.4% 2.2% 238.8%Rel 208.5% -9.7% -3.8% 204.7%
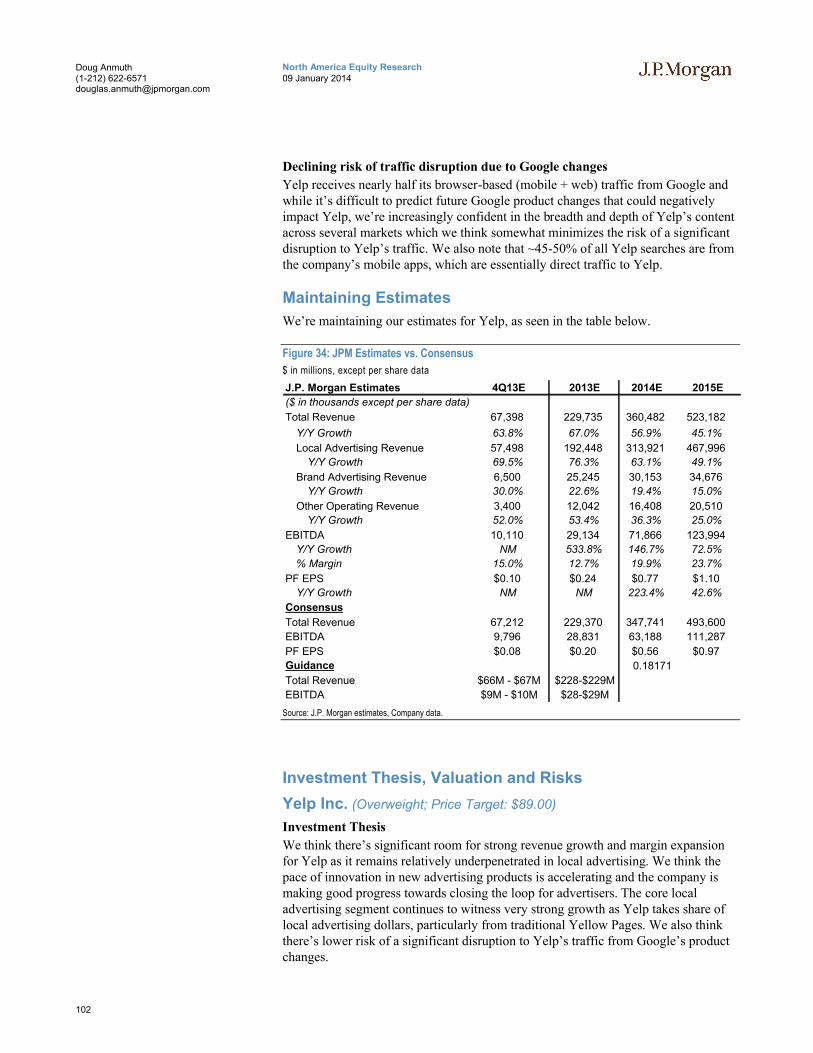
102
North America Equity Research09 January 2014
Doug Anmuth(1-212) [email protected]
Declining risk of traffic disruption due to Google changes
Yelp receives nearly half its browser-based (mobile + web) traffic from Google and while it’s difficult to predict future Google product changes that could negatively impact Yelp, we’re increasingly confident in the breadth and depth of Yelp’s content across several markets which we think somewhat minimizes the risk of a significant disruption to Yelp’s traffic. We also note that ~45-50% of all Yelp searches are from the company’s mobile apps, which are essentially direct traffic to Yelp.
Maintaining Estimates
We’re maintaining our estimates for Yelp, as seen in the table below.
Figure 34: JPM Estimates vs. Consensus
$ in millions, except per share data
J.P. Morgan Estimates 4Q13E 2013E 2014E 2015E
($ in thousands except per share data)
Total Revenue 67,398 229,735 360,482 523,182
Y/Y Growth 63.8% 67.0% 56.9% 45.1%
Local Advertising Revenue 57,498 192,448 313,921 467,996
Y/Y Growth 69.5% 76.3% 63.1% 49.1%
Brand Advertising Revenue 6,500 25,245 30,153 34,676
Y/Y Growth 30.0% 22.6% 19.4% 15.0%
Other Operating Revenue 3,400 12,042 16,408 20,510
Y/Y Growth 52.0% 53.4% 36.3% 25.0%
EBITDA 10,110 29,134 71,866 123,994
Y/Y Growth NM 533.8% 146.7% 72.5%
% Margin 15.0% 12.7% 19.9% 23.7%
PF EPS $0.10 $0.24 $0.77 $1.10
Y/Y Growth NM NM 223.4% 42.6%
Consensus
Total Revenue 67,212 229,370 347,741 493,600
EBITDA 9,796 28,831 63,188 111,287
PF EPS $0.08 $0.20 $0.56 $0.97
Guidance 0.18171
Total Revenue $66M - $67M $228-$229M
EBITDA $9M - $10M $28-$29M
Source: J.P. Morgan estimates, Company data.
Investment Thesis, Valuation and Risks
Yelp Inc. (Overweight; Price Target: $89.00)
Investment Thesis
We think there’s significant room for strong revenue growth and margin expansionfor Yelp as it remains relatively underpenetrated in local advertising. We think the pace of innovation in new advertising products is accelerating and the company is making good progress towards closing the loop for advertisers. The core local advertising segment continues to witness very strong growth as Yelp takes share of local advertising dollars, particularly from traditional Yellow Pages. We also think there’s lower risk of a significant disruption to Yelp’s traffic from Google’s product changes.
103
North America Equity Research09 January 2014
Doug Anmuth(1-212) [email protected]
Valuation
$89 based on our DCF analysis. Our PT is based on our DCF analysis, which assumes a 9% WACC and 3.5% long-term growth rate. Given Yelp’s high revenue growth and margin expansion trajectory, we prefer to employ a DCF to derive our price target, as we think a multiple-based approach likely doesn’t appropriately factor in the company’s early-stage growth trajectory. Our DCF sensitivity analysis yields a price target range of $68-116. Our DCF-based PT of $89 assumes 2020 revenue of $1.7B and a ~30% EBITDA margin. Our PT implies a ~50.5x 2015E EV/EBITDA multiple.
Risks to Rating and Price Target
Downside risks include: 1) the nascent nature of Yelp’s business model potentially creating significant volatility in the company’s quarterly results and our estimates; 2) the increasingly competitive market for local business information and local advertising, as small and large Internet companies invest aggressively in the space, potentially pressuring Yelp; and 3) traffic growth potentially slowing if Google significantly changed its search results rankings, given Yelp receives nearly half its traffic from Google search results.

104
North America Equity Research09 January 2014
Doug Anmuth(1-212) [email protected]
Yelp Inc.: Summary of FinancialsIncome Statement - Annual FY12A FY13E FY14E FY15E Income Statement - Quarterly 1Q13A 2Q13A 3Q13A 4Q13E
Revenues 138 230 360 523 Revenues 46A 55A 61A 67
Operating income (19) (8) 20 62 Operating income (5)A (1)A (2)A (2)
D&A 7 11 16 23 D&A 2A 3A 3A 3
EBITDA (12) 3 36 85 EBITDA (2)A 2A 1A 2
Net interest income / (expense) - - - - Net interest income / (expense) - - - -
Other income / (expense) (0) (0) (0) (0) Other income / (expense) (0)A (0)A (0)A (0)
Pretax income (19) (9) 20 62 Pretax income (5)A (1)A (2)A (2)
Income taxes (0) (1) (0) (20) Income taxes (0)A (0)A (1)A (0)
Net Income (19) (10) 20 41 Net Income (5)A (1)A (2)A (2)
Weighted average diluted shares 54 71 72 73 Weighted average diluted shares 70A 70A 71A 72
Diluted EPS (0.06) 0.24 0.77 1.10 Diluted EPS 0.01A 0.07A 0.07A 0.10
Balance Sheet and Cash Flow Data FY12A FY13E FY14E FY15E Ratio Analysis FY12A FY13E FY14E FY15E
Cash and cash equivalents 95 103 164 247 Sales growth 65.2% 67.0% 56.9% 45.1%Accounts receivable 11 16 17 21 EBITDA growth (507.5%) 533.8% 146.7% 72.5%
Other current assets 5 7 11 16 EPS growth (86.0%) (531.2%) 223.4% 42.6%
Current assets 112 126 192 284
PP&E 15 22 20 13 EBITDA margin 3.3% 12.7% 19.9% 23.7%
Total assets 188 221 286 370 Net margin (2.2%) 7.4% 15.4% 15.4%
Total debt 1 1 1 1 Debt / EBITDA 0.1 0.0 0.0 0.0
Total liabilities 22 22 31 35
Shareholders' equity 166 203 259 339 Return on assets (ROA) (2.6%) 8.3% 21.8% 24.6%
Return on equity (ROE) (4.3%) 9.2% 24.0% 26.9%
Net Income (including charges) (19) (10) 20 41
D&A 7 11 16 23 Enterprise value / EBITDA 939.0 147.9 59.1 33.6
Change in working capital (5) (13) 3 (5) Enterprise value / Free cash flow NM 901.8 70.3 50.0
Other - - - - P/E NM NM 261.2 126.8
Cash flow from operations (1) 18 75 99
Capex (8) (13) (14) (16)
Free cash flow (9) 5 60 83
Cash flow from investing activities (41) (19) (14) (16)
Cash flow from financing activities 115 9 0 0
Dividends - - - -
Dividend yield - - - -
Source: Company reports and J.P. Morgan estimates.Note: $ in millions (except per-share data).Fiscal year ends Dec
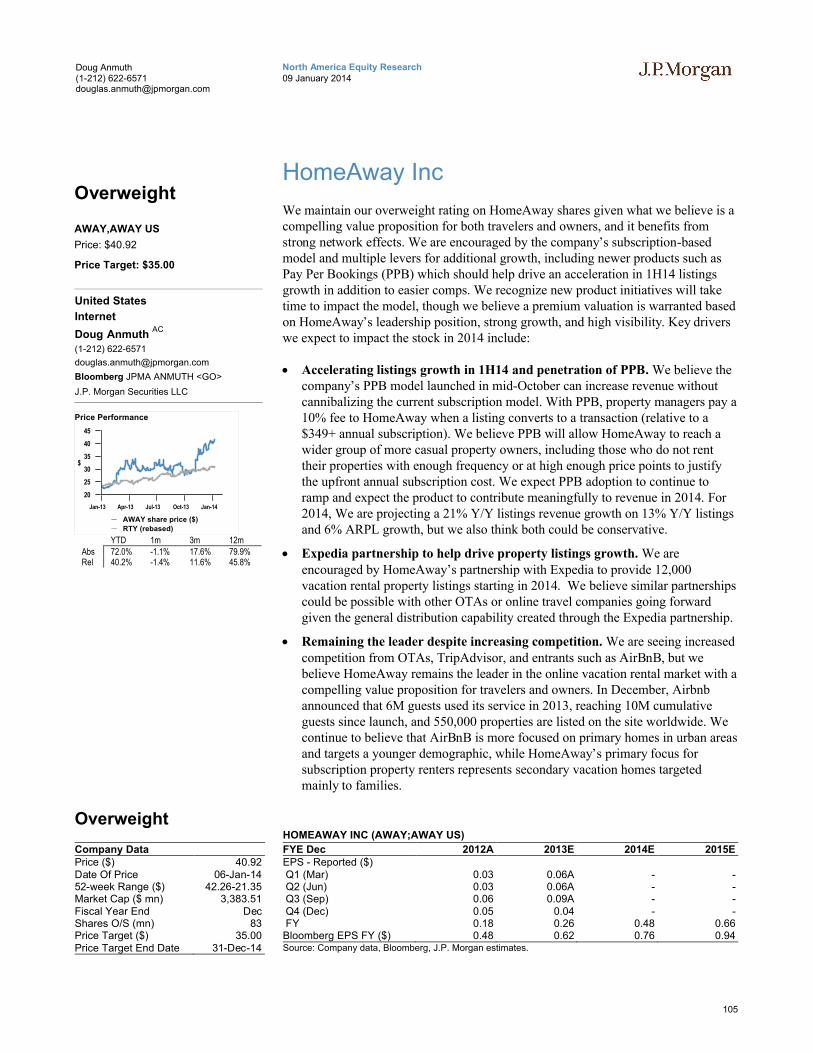
105
North America Equity Research09 January 2014
Doug Anmuth(1-212) [email protected]
HomeAway Inc
We maintain our overweight rating on HomeAway shares given what we believe is a compelling value proposition for both travelers and owners, and it benefits from strong network effects. We are encouraged by the company’s subscription-based model and multiple levers for additional growth, including newer products such as Pay Per Bookings (PPB) which should help drive an acceleration in 1H14 listings growth in addition to easier comps. We recognize new product initiatives will take time to impact the model, though we believe a premium valuation is warranted based on HomeAway’s leadership position, strong growth, and high visibility. Key drivers we expect to impact the stock in 2014 include:
Accelerating listings growth in 1H14 and penetration of PPB. We believe the company’s PPB model launched in mid-October can increase revenue without cannibalizing the current subscription model. With PPB, property managers pay a 10% fee to HomeAway when a listing converts to a transaction (relative to a $349+ annual subscription). We believe PPB will allow HomeAway to reach a wider group of more casual property owners, including those who do not rent their properties with enough frequency or at high enough price points to justify the upfront annual subscription cost. We expect PPB adoption to continue to ramp and expect the product to contribute meaningfully to revenue in 2014. For 2014, We are projecting a 21% Y/Y listings revenue growth on 13% Y/Y listings and 6% ARPL growth, but we also think both could be conservative.
Expedia partnership to help drive property listings growth. We are encouraged by HomeAway’s partnership with Expedia to provide 12,000 vacation rental property listings starting in 2014. We believe similar partnerships could be possible with other OTAs or online travel companies going forward given the general distribution capability created through the Expedia partnership.
Remaining the leader despite increasing competition. We are seeing increased competition from OTAs, TripAdvisor, and entrants such as AirBnB, but we believe HomeAway remains the leader in the online vacation rental market with a compelling value proposition for travelers and owners. In December, Airbnb announced that 6M guests used its service in 2013, reaching 10M cumulative guests since launch, and 550,000 properties are listed on the site worldwide. We continue to believe that AirBnB is more focused on primary homes in urban areas and targets a younger demographic, while HomeAway’s primary focus for subscription property renters represents secondary vacation homes targeted mainly to families.
Overweight
Company DataPrice ($) 40.92Date Of Price 06-Jan-1452-week Range ($) 42.26-21.35Market Cap ($ mn) 3,383.51Fiscal Year End DecShares O/S (mn) 83Price Target ($) 35.00Price Target End Date 31-Dec-14
HOMEAWAY INC (AWAY;AWAY US)
FYE Dec 2012A 2013E 2014E 2015EEPS - Reported ($)Q1 (Mar) 0.03 0.06A - -Q2 (Jun) 0.03 0.06A - -Q3 (Sep) 0.06 0.09A - -Q4 (Dec) 0.05 0.04 - -FY 0.18 0.26 0.48 0.66Bloomberg EPS FY ($) 0.48 0.62 0.76 0.94Source: Company data, Bloomberg, J.P. Morgan estimates.
Overweight
AWAY,AWAY US
Price: $40.92
Price Target: $35.00
United States
Internet
Doug Anmuth AC
(1-212) 622-6571
Bloomberg JPMA ANMUTH <GO>
J.P. Morgan Securities LLC
20
25
30
35
40
45
$
Jan-13 Apr-13 Jul-13 Oct-13 Jan-14
Price Performance
AWAY share price ($)
RTY (rebased)
YTD 1m 3m 12mAbs 72.0% -1.1% 17.6% 79.9%Rel 40.2% -1.4% 11.6% 45.8%
106
North America Equity Research09 January 2014
Doug Anmuth(1-212) [email protected]
Acquisitions continue to bolster International expansion. HomeAway announced the acquisition of Stayz in December 2013, marking the latest investment among several HomeAway has made in expanding into the APAC region. Stayz brings 33,000 property listings to HomeAway’s offerings and commission-based experience. Stayz bolsters the company’s position in APAC which includes prior investment in majority stake in both Bookabach (8,000 listings in New Zealand, Australia, and Pacific Islands) and TravelMob (14,000 short-term rentals listings in Asia Pacific).
What to look for in 2014: 1) Benefit to listings and revenue from newer products including PPB, online bookings, tiered pricing, and bundled listings; 2) European macro conditions impacting vacation rental market; 3) Progress of newer geographic regions and expectation for further geographical expansion, particularly in Asia-Pacific and Latin America.
Maintain our $35 price target. Our year-end 2014 price target of $35 is based on our DCF analysis through 2020, which assumes an 11.5% cost of capital, 3% terminal growth rate, and 12.1x terminal EBITDA multiple. We believe underlying fundamentals of the business remain strong and we look for additional benefits from the VRBO migration, bundled products, and pay-per-bookings benefits in 2014 and beyond. Key drivers of our DCF assumptions include 2012-2020 CAGRs of 17% for revenue and 19% for EBITDA. Our $35 price targetequates to ~17x our 2015 EBITDA estimate of $153M.
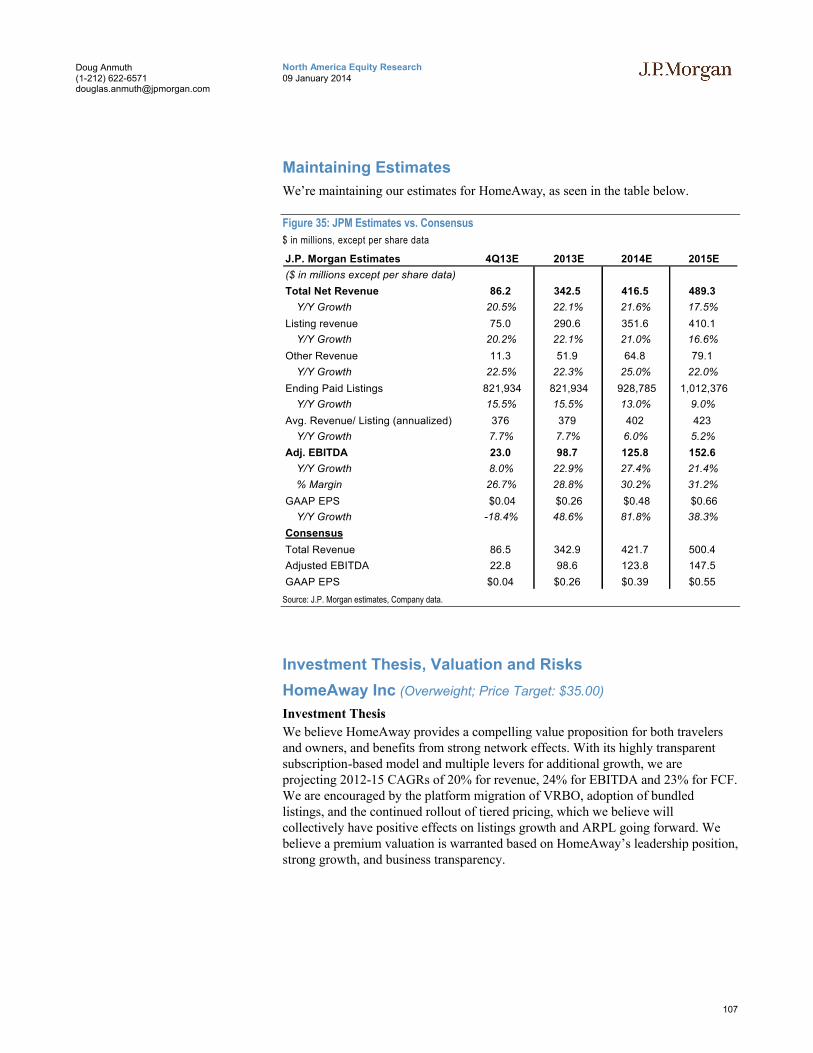
107
North America Equity Research09 January 2014
Doug Anmuth(1-212) [email protected]
Maintaining Estimates
We’re maintaining our estimates for HomeAway, as seen in the table below.
Figure 35: JPM Estimates vs. Consensus
$ in millions, except per share data
J.P. Morgan Estimates 4Q13E 2013E 2014E 2015E
($ in millions except per share data)
Total Net Revenue 86.2 342.5 416.5 489.3
Y/Y Growth 20.5% 22.1% 21.6% 17.5%
Listing revenue 75.0 290.6 351.6 410.1
Y/Y Growth 20.2% 22.1% 21.0% 16.6%
Other Revenue 11.3 51.9 64.8 79.1
Y/Y Growth 22.5% 22.3% 25.0% 22.0%
Ending Paid Listings 821,934 821,934 928,785 1,012,376
Y/Y Growth 15.5% 15.5% 13.0% 9.0%
Avg. Revenue/ Listing (annualized) 376 379 402 423
Y/Y Growth 7.7% 7.7% 6.0% 5.2%
Adj. EBITDA 23.0 98.7 125.8 152.6
Y/Y Growth 8.0% 22.9% 27.4% 21.4%
% Margin 26.7% 28.8% 30.2% 31.2%
GAAP EPS $0.04 $0.26 $0.48 $0.66
Y/Y Growth -18.4% 48.6% 81.8% 38.3%
Consensus
Total Revenue 86.5 342.9 421.7 500.4
Adjusted EBITDA 22.8 98.6 123.8 147.5
GAAP EPS $0.04 $0.26 $0.39 $0.55
Source: J.P. Morgan estimates, Company data.
Investment Thesis, Valuation and Risks
HomeAway Inc (Overweight; Price Target: $35.00)
Investment Thesis
We believe HomeAway provides a compelling value proposition for both travelers and owners, and benefits from strong network effects. With its highly transparent subscription-based model and multiple levers for additional growth, we are projecting 2012-15 CAGRs of 20% for revenue, 24% for EBITDA and 23% for FCF. We are encouraged by the platform migration of VRBO, adoption of bundled listings, and the continued rollout of tiered pricing, which we believe will collectively have positive effects on listings growth and ARPL going forward. We believe a premium valuation is warranted based on HomeAway’s leadership position, strong growth, and business transparency.
108
North America Equity Research09 January 2014
Doug Anmuth(1-212) [email protected]
Valuation
Maintain our $35 price target. Our year-end 2014 price target of $35 is based on our DCF analysis through 2020, which assumes an 11.5% cost of capital, 3% terminal growth rate, and 12.1x terminal EBITDA multiple. We believe underlying fundamentals of the business remain strong and we look for additional benefits from the VRBO migration, bundled products, and pay-per-bookings benefits in 2014 and beyond. Key drivers of our DCF assumptions include 2012-2020 CAGRs of 17% for revenue and 19% for EBITDA. Our $35 price target equates to ~17x our 2015EBITDA estimate of $153M.
Risks to Rating and Price Target
Downside risks include: 1) macro weakness and a softer traveling environment; 2) FX volatility as roughly 40% of revenue is international; 3) an increase in competition from OTAs and new entrants; 4) failure to identify, complete, or integrate strategic acquisitions; and 5) liability claims based on events that occur during travelers’ stays.
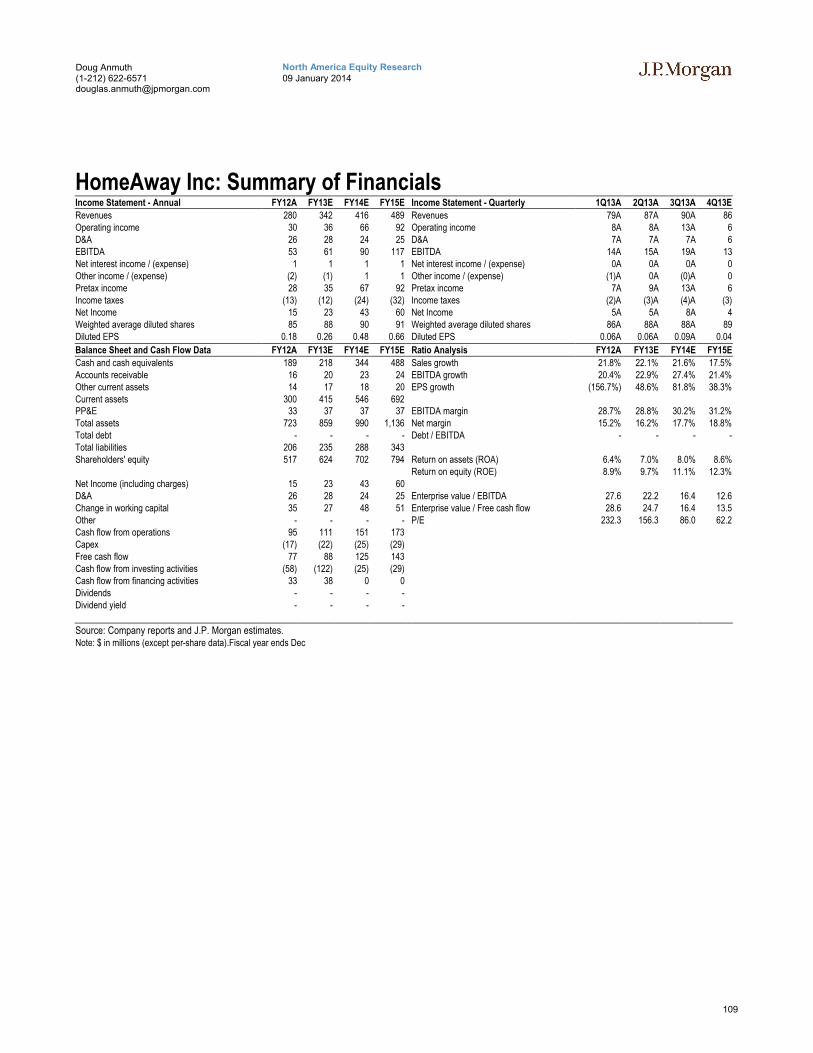
109
North America Equity Research09 January 2014
Doug Anmuth(1-212) [email protected]
HomeAway Inc: Summary of FinancialsIncome Statement - Annual FY12A FY13E FY14E FY15E Income Statement - Quarterly 1Q13A 2Q13A 3Q13A 4Q13E
Revenues 280 342 416 489 Revenues 79A 87A 90A 86Operating income 30 36 66 92 Operating income 8A 8A 13A 6D&A 26 28 24 25 D&A 7A 7A 7A 6EBITDA 53 61 90 117 EBITDA 14A 15A 19A 13Net interest income / (expense) 1 1 1 1 Net interest income / (expense) 0A 0A 0A 0Other income / (expense) (2) (1) 1 1 Other income / (expense) (1)A 0A (0)A 0Pretax income 28 35 67 92 Pretax income 7A 9A 13A 6Income taxes (13) (12) (24) (32) Income taxes (2)A (3)A (4)A (3)Net Income 15 23 43 60 Net Income 5A 5A 8A 4Weighted average diluted shares 85 88 90 91 Weighted average diluted shares 86A 88A 88A 89Diluted EPS 0.18 0.26 0.48 0.66 Diluted EPS 0.06A 0.06A 0.09A 0.04
Balance Sheet and Cash Flow Data FY12A FY13E FY14E FY15E Ratio Analysis FY12A FY13E FY14E FY15E
Cash and cash equivalents 189 218 344 488 Sales growth 21.8% 22.1% 21.6% 17.5%Accounts receivable 16 20 23 24 EBITDA growth 20.4% 22.9% 27.4% 21.4%Other current assets 14 17 18 20 EPS growth (156.7%) 48.6% 81.8% 38.3%Current assets 300 415 546 692PP&E 33 37 37 37 EBITDA margin 28.7% 28.8% 30.2% 31.2%Total assets 723 859 990 1,136 Net margin 15.2% 16.2% 17.7% 18.8%Total debt - - - - Debt / EBITDA - - - -Total liabilities 206 235 288 343Shareholders' equity 517 624 702 794 Return on assets (ROA) 6.4% 7.0% 8.0% 8.6%
Return on equity (ROE) 8.9% 9.7% 11.1% 12.3%Net Income (including charges) 15 23 43 60D&A 26 28 24 25 Enterprise value / EBITDA 27.6 22.2 16.4 12.6Change in working capital 35 27 48 51 Enterprise value / Free cash flow 28.6 24.7 16.4 13.5Other - - - - P/E 232.3 156.3 86.0 62.2Cash flow from operations 95 111 151 173Capex (17) (22) (25) (29)Free cash flow 77 88 125 143Cash flow from investing activities (58) (122) (25) (29)Cash flow from financing activities 33 38 0 0Dividends - - - -Dividend yield - - - -
Source: Company reports and J.P. Morgan estimates.Note: $ in millions (except per-share data).Fiscal year ends Dec
110
North America Equity Research09 January 2014
Doug Anmuth(1-212) [email protected]
Zynga Inc
We remain Neutral and somewhat cautious on Zynga as the company continues to transition towards mobile as older web titles potentially remain at risk of further declines. We think the addition of a new COO, Clive Downie, from DeNa should help improve confidence in management’s ability to turnaround the business, though we prefer to take a wait-and-see approach on new title launches before becoming more constructive on shares. Zynga’s cash, securities, and headquarters provide ~$2.20/shr in downside support, but we would also like to see more progress on the company’s fundamentals. We think Poker, Words With Friends, and FarmVilleremain Zynga’s most sustainable franchises going forward.
Key Drivers Into 2014
Engagement trends have been weak
Zynga’s engagement trends continued to decline materially in 2013 driven in part by games losing share on Facebook—bookings from Facebook declined to 65% in 3Q from 80% in 3Q12. 3Q13 DAUs reached recent lows of 30M (-49% Y/Y), down from 60M a year ago and 39M in 2Q, while MAUs declined 57% Y/Y to 133M. Zynga’s MUP decline somewhat stabilized, down 46% Y/Y (from 53% in 2Q) to 1.6M in 3Q13. We believe declining DAU trends are likely to continue to drive lower bookings for existing titles and we note mobile is becoming increasingly competitive for game developers.
Potential for further cost reductions
We believe Don Mattrick’s focus remains on transitioning and refocusing the company on growing and sustaining top franchises, creating new hits, moving to mobile, building out the Zynga network, and driving cost efficiencies. As a part of the company’s continued transition, headcount in 3Q was down 154 and Zynga has been redeploying talent to the company’s largest franchises. We expect potential additional cost efficiencies in 2014, particularly if the company is unable to stabilize the negative trends in its core web franchises.
What we’re expecting in terms of financials
We’re modeling 2014 bookings of $649M, -8% Y/Y as we expect negative trends in web titles such as Zynga Poker to stabilize and new mobile titles and advertising growth to somewhat offset declines in older web titles. We expect relatively flat overall DAUs though we’re modeling a 10% decline in bookings per DAU. We are also modeling $12.4M in EBITDA, down from EBITDA of $22.9M in 2013.
Neutral
Company DataPrice ($) 4.04Date Of Price 06-Jan-1452-week Range ($) 4.55-2.40Market Cap ($ mn) 3,049.64Fiscal Year End DecShares O/S (mn) 755
Zynga Inc (ZNGA;ZNGA US)
FYE Dec 2012A 2013E 2014E 2015EEPS - Reported ($)Q1 (Mar) 0.06 0.01A - -Q2 (Jun) 0.01 (0.01)A - -Q3 (Sep) (0.00) (0.02)A - -Q4 (Dec) 0.01 (0.04) - -FY 0.13 (0.08) (0.05) (0.04)Bloomberg EPS FY ($) 0.03 -0.06 -0.04 -0.01Source: Company data, Bloomberg, J.P. Morgan estimates.
Neutral
ZNGA,ZNGA US
Price: $4.04
—
United States
Internet
Doug Anmuth AC
(1-212) 622-6571
Bloomberg JPMA ANMUTH <GO>
J.P. Morgan Securities LLC
2.0
2.5
3.0
3.5
4.0
4.5
$
Jan-13 Apr-13 Jul-13 Oct-13 Jan-14
Price Performance
ZNGA share price ($)
S&P500 (rebased)
YTD 1m 3m 12mAbs 73.7% 2.0% 32.7% 68.0%Rel 48.4% 2.6% 27.5% 43.1%
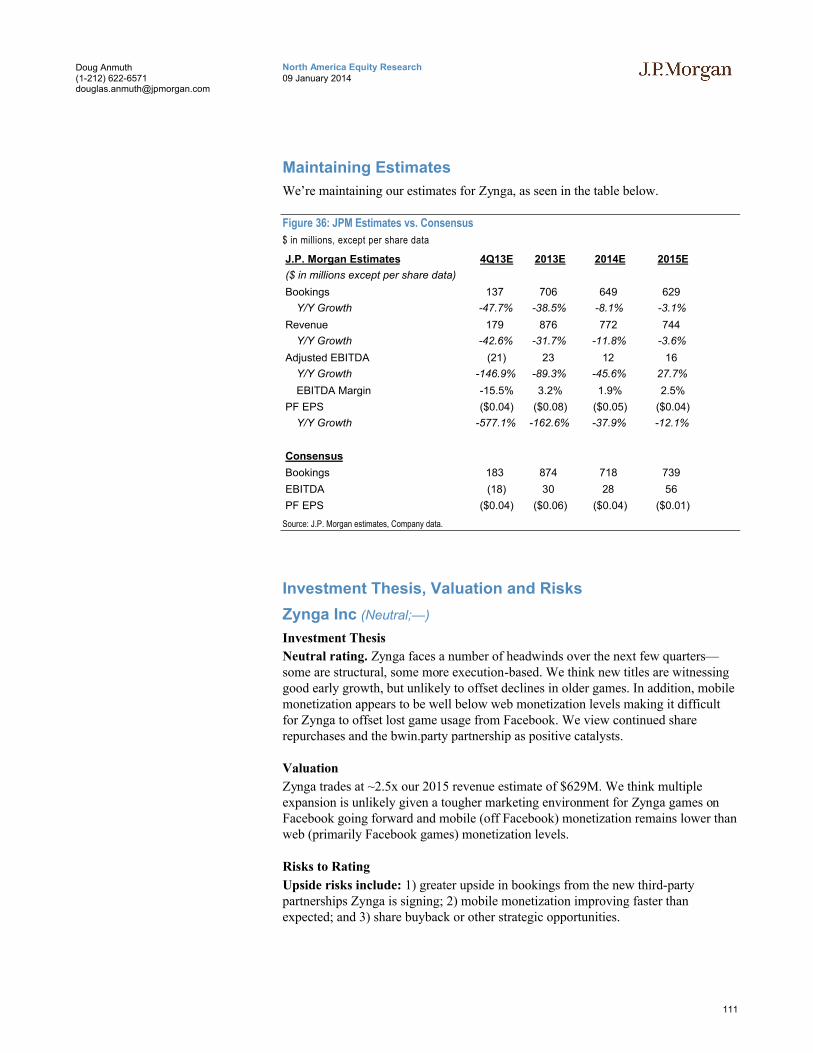
111
North America Equity Research09 January 2014
Doug Anmuth(1-212) [email protected]
Maintaining Estimates
We’re maintaining our estimates for Zynga, as seen in the table below.
Figure 36: JPM Estimates vs. Consensus
$ in millions, except per share data
J.P. Morgan Estimates 4Q13E 2013E 2014E 2015E
($ in millions except per share data)
Bookings 137 706 649 629
Y/Y Growth -47.7% -38.5% -8.1% -3.1%
Revenue 179 876 772 744
Y/Y Growth -42.6% -31.7% -11.8% -3.6%
Adjusted EBITDA (21) 23 12 16
Y/Y Growth -146.9% -89.3% -45.6% 27.7%
EBITDA Margin -15.5% 3.2% 1.9% 2.5%
PF EPS ($0.04) ($0.08) ($0.05) ($0.04)
Y/Y Growth -577.1% -162.6% -37.9% -12.1%
Consensus
Bookings 183 874 718 739
EBITDA (18) 30 28 56
PF EPS ($0.04) ($0.06) ($0.04) ($0.01)
Source: J.P. Morgan estimates, Company data.
Investment Thesis, Valuation and Risks
Zynga Inc (Neutral;—)
Investment Thesis
Neutral rating. Zynga faces a number of headwinds over the next few quarters—some are structural, some more execution-based. We think new titles are witnessing good early growth, but unlikely to offset declines in older games. In addition, mobile monetization appears to be well below web monetization levels making it difficult for Zynga to offset lost game usage from Facebook. We view continued share repurchases and the bwin.party partnership as positive catalysts.
Valuation
Zynga trades at ~2.5x our 2015 revenue estimate of $629M. We think multiple expansion is unlikely given a tougher marketing environment for Zynga games on Facebook going forward and mobile (off Facebook) monetization remains lower than web (primarily Facebook games) monetization levels.
Risks to Rating
Upside risks include: 1) greater upside in bookings from the new third-party partnerships Zynga is signing; 2) mobile monetization improving faster than expected; and 3) share buyback or other strategic opportunities.

112
North America Equity Research09 January 2014
Doug Anmuth(1-212) [email protected]
Downside risks include: 1) additional changes to the Facebook platform for game developers including Zynga; 2) significant attrition in players, due to competition or changing consumer behavior, having a material impact on Zynga’s bookings, especially as Zynga’s bookings are heavily concentrated among a small group of players; 3) competition in the social gaming space including EA and Disney, as well as private companies such as Crowdstar and Vostu; and 4) Zynga’s model being fundamentally hit-driven so it is critical that the company is able to launch new franchise titles going forward.

113
North America Equity Research09 January 2014
Doug Anmuth(1-212) [email protected]
Zynga Inc: Summary of FinancialsIncome Statement - Annual FY12A FY13E FY14E FY15E Income Statement - Quarterly 1Q13A 2Q13A 3Q13A 4Q13E
Revenues 1,281 876 772 744 Revenues 264A 231A 203A 179Operating income (183) (64) (38) (39) Operating income (5)A (30)A (3)A (25)D&A 141 118 82 75 D&A 32A 31A 34A 21EBITDA (41) 55 44 36 EBITDA 27A 0A 31A (4)Net interest income / (expense) 5 4 4 4 Net interest income / (expense) 1A 1A 1A 1Other income / (expense) 23 (4) (4) (4) Other income / (expense) 0A (3)A 2A (2)Pretax income (160) (67) (42) (42) Pretax income (5)A (34)A (1)A (28)Income taxes (50) 23 1 1 Income taxes 9A 18A 1A (4)Net Income (209) (44) (41) (42) Net Income 4A (16)A (0)A (32)Weighted average diluted shares 830 855 872 889 Weighted average diluted shares 828A 794A 804A 819Diluted EPS 0.13 (0.08) (0.05) (0.04) Diluted EPS 0.01A (0.01)A (0.02)A (0.04)
Balance Sheet and Cash Flow Data FY12A FY13E FY14E FY15E Ratio Analysis FY12A FY13E FY14E FY15E
Cash and cash equivalents 386 347 413 474 Sales growth 12.4% (31.7%) (11.8%) (3.6%)Accounts receivable 106 64 69 67 EBITDA growth (29.7%) (89.3%) (45.6%) 27.7%Other current assets 93 51 55 53 EPS growth (45.6%) (162.6%) (37.9%) (12.1%)Current assets 1,484 1,174 1,249 1,305PP&E 466 362 349 341 EBITDA margin 16.6% 2.6% 1.6% 2.1%Total assets 2,576 2,232 2,294 2,343 Net margin 8.4% (8.0%) (5.7%) (5.3%)Total debt 100 0 0 0 Debt / EBITDA 0.5 0.0 0.0 0.0Total liabilities 751 367 378 374Shareholders' equity 1,826 1,865 1,916 1,969 Return on assets (ROA) 4.2% (2.9%) (2.0%) (1.7%)
Return on equity (ROE) 6.0% (3.8%) (2.3%) (2.0%)Net Income (including charges) (209) (44) (41) (42)D&A 141 118 82 75 Enterprise value / EBITDA 11.2 101.6 181.4 138.3Change in working capital (68) (178) (6) 4 Enterprise value / Free cash flow NM NM 34.4 36.0Other - - - - P/E NM NM NM NMCash flow from operations 196 (23) 135 128Capex (332) (11) (69) (67)Free cash flow (136) (33) 66 61Cash flow from investing activities (1,497) 84 (69) (67)Cash flow from financing activities 105 (107) 0 0Dividends - - - -Dividend yield - - - -
Source: Company reports and J.P. Morgan estimates.Note: $ in millions (except per-share data).Fiscal year ends Dec
114
North America Equity Research09 January 2014
Doug Anmuth(1-212) [email protected]
Criteo
We believe Criteo is well-positioned to benefit from the shift in display ads towards Real-Time Bidding (RTB) and programmatic buying in general as we believe the company has strong technology and scale advantages. Criteo solves a fundamental challenge for eCommerce, travel and other transactional companies by finding, engaging, and converting customers cost-effectively, and making display perform like search. We believe Criteo delivers strong ROI at large scale, a combination that we think is differentiated within the ad-tech space. According to MAGNA GLOBAL, RTB and Non-RTB programmatic’s share of US display ad spend is expected to increase from 38% in 2012 to 53% in 2013 and to 83% by 2017.
Key Drivers Into 2014
Expect continued shift towards performance-based display to benefit Criteo
We believe the online display industry continues to shift toward audience-based ad buying driven by: 1) large and growing amounts of lower-priced display inventory that can be targeted for brand and direct response marketing, enabled by programmatic buying of inventory through ad exchanges and DSPs (demand-side platforms); 2) slower growth within desktop search, which forces transactional companies to explore other high-growth performance avenues; and 3) advertisers looking to diversify their performance ad dollars from Google. Global display is a ~$30B market, and programmatic buying of display ads is expected to reach $12B in 2013 and nearly triple in the next four years to ~$33B according to MAGNA GLOBAL. We believe Criteo will take share on a global basis as its retargeting technology delivers performance that is similar to search, offering fully automated campaigns for advertisers on a cost-per-click basis.
Criteo’s mobile business should witness strong growth in 2014
We believe mobile advertising is a very large opportunity for Criteo as it significantly expands the company’s inventory and reach, and also addresses a large and growing user audience on mobile devices. According to eMarketer and IAB data, US consumers spend ~10% of their overall media consumption time on mobile devices, yet ~1% of total advertising dollars are spent on mobile advertising. We expect this gap to converge significantly over the next few years as advertisers better understand mobile advertising ROI through data and technology. In 1Q13, Criteo launched a mobile solution in Japan, and the company plans to expand it globally over the next few quarters. We believe mobile still represents 6% of Criteo’s overall revenue (~15% of Criteo’s Japan revenue), and we believe the company is making very good progress with both advertisers and mobile publishers.
Overweight
Company DataPrice ($) 32.71Date Of Price 06-Jan-1452-week Range ($) 45.00-28.27Market Cap ($ mn) 1,703.58Fiscal Year End DecShares O/S (th) 52,081Price Target ($) 42.00Price Target End Date 31-Dec-14
Criteo (CRTO;CRTO US)
FYE Dec 2011A 2012A 2013E 2014E 2015EEPS - Reported (€)Q1 (Mar) - 0.10 0.05A 0.07 -Q2 (Jun) - 0.01 (0.09)A 0.03 -Q3 (Sep) 0.03 0.05 0.09A 0.07 -Q4 (Dec) 0.05 (0.07) 0.11 0.10 -FY 0.16 0.09 0.17 0.27 0.54
Source: Company data, Bloomberg, J.P. Morgan estimates.
Overweight
CRTO,CRTO US
Price: $32.71
Price Target: $42.00
France
Internet
Doug Anmuth AC
(1-212) 622-6571
Bloomberg JPMA ANMUTH <GO>
J.P. Morgan Securities LLC
28
32
36
40
$
Jan-13 Apr-13 Jul-13 Oct-13 Jan-14
Price Performance
CRTO share price ($)
RTY (rebased)
YTD 1m 3m 12mAbs 6.5% -8.5% 6.5% 6.5%Rel -25.3% -8.8% 0.5% -27.6%

115
North America Equity Research09 January 2014
Doug Anmuth(1-212) [email protected]
In many instances, Criteo has witnessed comparable conversions for clients on mobile, with average click-through rates on its ads of ~0.5% and advertisers witnessing conversion rates on their sites of over 5%.
Continued geographic expansion in APAC
We believe Criteo has a relatively high penetration of the retargeting market in Europe (~60%), with France likely the company’s most penetrated market. We believe the company is only 20% penetrated in the US, 12% in APAC, and 5% in Latin America, suggesting significant growth potential strictly from continued geographic expansion. We expect Americas gross revenue to grow at a 61% CAGR over 2012-15 and APAC to grow 95% during the same period. We believe the company is making good progress in APAC, particularly in Japan, where Criteo has an exclusive relationship for first-look inventory with Yahoo! Japan, which is also a reseller of Criteo’s services to its direct-response advertisers. We expect additional APAC growth also to be driven by new markets such as China and Taiwan. Though European penetration is higher than that in Criteo’s newer markets, we’re modeling strong growth in EMEA of 22% CAGR as Criteo expands into Eastern European markets such as Russia and Turkey. We believe several Criteo clients have customers in multiple geographies, and over time we expect Criteo’s clients to consolidate a greater percentage of their global retargeting spend with the company.
Additional opportunities in new verticals
The vast majority (~95%) of Criteo’s global revenue is currently derived from advertisers in the eCommerce, Classifieds and Travel verticals. While eCommerce and online travel remain two of the largest verticals for direct response advertising online, we think Criteo also has the opportunity to expand into relatively newer verticals such as auto, telecom, and finance. We believe new verticals represent a $8-9B opportunity for Criteo in the US alone. In 3Q, the company signed large clients in the credit card and autos vertical, and we expect newer verticals to represent asignificant opportunity for growth over time.
Likely bigger push up the marketing funnel
While Criteo has primarily focused on retargeting, we believe the company is also making some inroads up the marketing funnel to help its customers drive new users or prospects to these clients’ websites or physical stores. We believe Criteo’s technology can be adapted to optimize for brand awareness targets that are more important to “upper-funnel” or brand clients, and we believe this opens up a large additional market opportunity for Criteo. We also think it is easier for Criteo to compete for brand dollars given the company’s existing deep relationships with large marketers. From an advertiser’s perspective, consolidating brand and direct-response campaigns with a single vendor could drive greater marketing efficiencies through greater scale and by more easily tying together the impact of brand and direct-response campaigns.
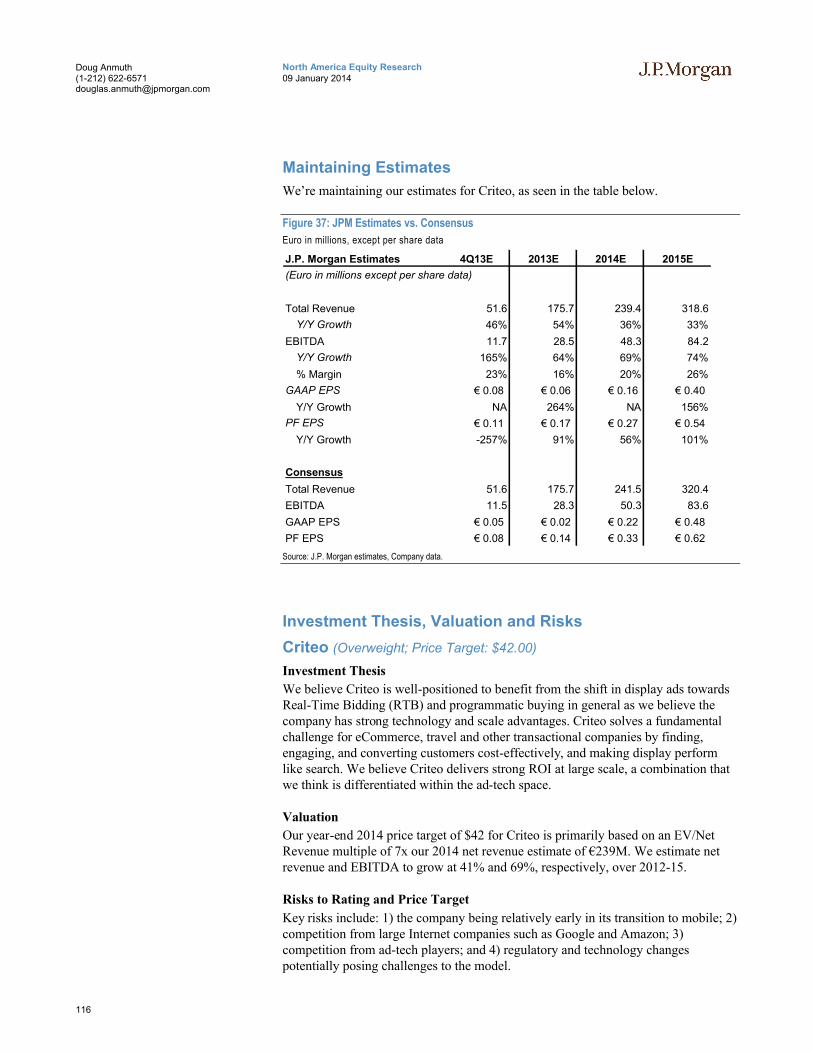
116
North America Equity Research09 January 2014
Doug Anmuth(1-212) [email protected]
Maintaining Estimates
We’re maintaining our estimates for Criteo, as seen in the table below.
Figure 37: JPM Estimates vs. Consensus
Euro in millions, except per share data
J.P. Morgan Estimates 4Q13E 2013E 2014E 2015E
(Euro in millions except per share data)
Total Revenue 51.6 175.7 239.4 318.6
Y/Y Growth 46% 54% 36% 33%
EBITDA 11.7 28.5 48.3 84.2
Y/Y Growth 165% 64% 69% 74%
% Margin 23% 16% 20% 26%
GAAP EPS € 0.08 € 0.06 € 0.16 € 0.40
Y/Y Growth NA 264% NA 156%
PF EPS € 0.11 € 0.17 € 0.27 € 0.54
Y/Y Growth -257% 91% 56% 101%
Consensus
Total Revenue 51.6 175.7 241.5 320.4
EBITDA 11.5 28.3 50.3 83.6
GAAP EPS € 0.05 € 0.02 € 0.22 € 0.48
PF EPS € 0.08 € 0.14 € 0.33 € 0.62
Source: J.P. Morgan estimates, Company data.
Investment Thesis, Valuation and Risks
Criteo (Overweight; Price Target: $42.00)
Investment Thesis
We believe Criteo is well-positioned to benefit from the shift in display ads towardsReal-Time Bidding (RTB) and programmatic buying in general as we believe the company has strong technology and scale advantages. Criteo solves a fundamental challenge for eCommerce, travel and other transactional companies by finding, engaging, and converting customers cost-effectively, and making display perform like search. We believe Criteo delivers strong ROI at large scale, a combination that we think is differentiated within the ad-tech space.
Valuation
Our year-end 2014 price target of $42 for Criteo is primarily based on an EV/NetRevenue multiple of 7x our 2014 net revenue estimate of €239M. We estimate net revenue and EBITDA to grow at 41% and 69%, respectively, over 2012-15.
Risks to Rating and Price Target
Key risks include: 1) the company being relatively early in its transition to mobile; 2) competition from large Internet companies such as Google and Amazon; 3) competition from ad-tech players; and 4) regulatory and technology changes potentially posing challenges to the model.

117
North America Equity Research09 January 2014
Doug Anmuth(1-212) [email protected]
Criteo: Summary of FinancialsIncome Statement - Annual FY12A FY13E FY14E FY15E Income Statement - Quarterly 1Q13A 2Q13A 3Q13A 4Q13E
Revenues 114,148 175,714 239,377 318,590 Revenues 37,307A 40,031A 46,815A 51,561Operating income 8,945 10,028 18,032 38,588 Operating income 1,050A (3,064)A 5,719A 6,323D&A 5,751 12,299 21,577 34,408 D&A 2,332A 3,108A 2,993A 3,866EBITDA 13,713 21,114 39,610 72,996 EBITDA 2,940A (585)A 8,570A 10,189Net interest income / (expense) - - - - Net interest income / (expense) - - - -Other income / (expense) (1,559) (2,500) (3,000) (3,600) Other income / (expense) 398A (2,791)A (1,054)A 947Pretax income 7,386 7,528 15,032 34,988 Pretax income 1,448A (5,855)A 4,665A 7,270Income taxes (6,556) (4,526) (4,961) (7,347) Income taxes (590)A 236A (1,627)A (2,545)Net Income 830 3,003 10,072 27,641 Net Income 858A (5,619)A 3,038A 4,726Weighted average diluted shares 48,587 52,752 64,025 68,675 Weighted average diluted shares 49,558A 51,674A 52,081A 57,695Diluted EPS 0.09 0.17 0.27 0.54 Diluted EPS 0.05A (0.09)A 0.09A 0.11
Balance Sheet and Cash Flow Data FY12A FY13E FY14E FY15E Ratio Analysis FY12A FY13E FY14E FY15E
Cash and cash equivalents 43,262 313,707 318,688 345,339 Sales growth 77.0% 53.9% 36.2% 33.1%Accounts receivable 60,685 80,828 110,113 146,551 EBITDA growth 25.2% 64.3% 69.1% 74.4%Other current assets 9,946 27,763 37,822 50,337 EPS growth (42.9%) 91.0% 56.3% 101.0%Current assets 113,893 422,298 466,623 542,228PP&E 14,566 29,188 46,450 63,016 EBITDA margin 15.2% 16.2% 20.2% 26.4%Total assets 137,130 469,043 530,630 622,802 Net margin 3.8% 5.2% 7.2% 11.7%Total debt 6,253 13,535 15,764 18,536 Debt / EBITDA 0.4 0.5 0.3 0.2Total liabilities 76,689 130,199 174,381 229,355Shareholders' equity 60,441 338,844 356,249 393,448 Return on assets (ROA) 4.4% 3.0% 3.5% 6.5%
Return on equity (ROE) 10.2% 4.6% 5.0% 9.9%Net Income (including charges) 830 3,003 10,072 27,641D&A 5,751 12,299 21,577 34,408 Enterprise value / EBITDA NM NM NM NMChange in working capital 3,427 15,421 4,838 6,020 Enterprise value / Free cash flow 19.9 NM NM NMOther - - - - P/E 1,405.1 421.7 152.6 59.6Cash flow from operations 11,811 29,038 43,669 77,626Capex (13,584) (25,359) (38,839) (50,974)Free cash flow (1,762) 3,749 4,829 26,652Cash flow from investing activities (19,610) (31,345) (38,839) (50,974)Cash flow from financing activities 35,903 274,160 0 0Dividends - - - -Dividend yield - - - -
Source: Company reports and J.P. Morgan estimates.Note: € in thousands (except per-share data).Fiscal year ends Dec
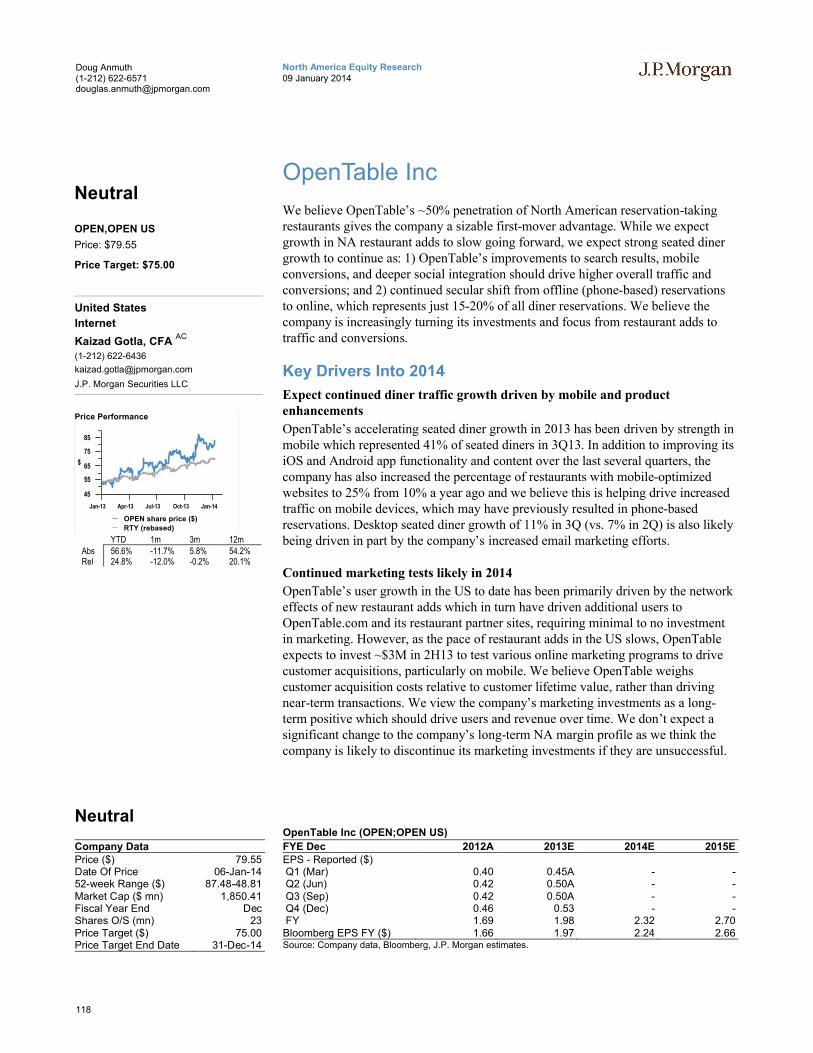
118
North America Equity Research09 January 2014
Doug Anmuth(1-212) [email protected]
OpenTable Inc
We believe OpenTable’s ~50% penetration of North American reservation-taking restaurants gives the company a sizable first-mover advantage. While we expectgrowth in NA restaurant adds to slow going forward, we expect strong seated diner growth to continue as: 1) OpenTable’s improvements to search results, mobile conversions, and deeper social integration should drive higher overall traffic and conversions; and 2) continued secular shift from offline (phone-based) reservations to online, which represents just 15-20% of all diner reservations. We believe the company is increasingly turning its investments and focus from restaurant adds to traffic and conversions.
Key Drivers Into 2014
Expect continued diner traffic growth driven by mobile and product enhancements
OpenTable’s accelerating seated diner growth in 2013 has been driven by strength in mobile which represented 41% of seated diners in 3Q13. In addition to improving its iOS and Android app functionality and content over the last several quarters, the company has also increased the percentage of restaurants with mobile-optimized websites to 25% from 10% a year ago and we believe this is helping drive increased traffic on mobile devices, which may have previously resulted in phone-based reservations. Desktop seated diner growth of 11% in 3Q (vs. 7% in 2Q) is also likely being driven in part by the company’s increased email marketing efforts.
Continued marketing tests likely in 2014
OpenTable’s user growth in the US to date has been primarily driven by the network effects of new restaurant adds which in turn have driven additional users to OpenTable.com and its restaurant partner sites, requiring minimal to no investment in marketing. However, as the pace of restaurant adds in the US slows, OpenTable expects to invest ~$3M in 2H13 to test various online marketing programs to drive customer acquisitions, particularly on mobile. We believe OpenTable weighs customer acquisition costs relative to customer lifetime value, rather than driving near-term transactions. We view the company’s marketing investments as a long-term positive which should drive users and revenue over time. We don’t expect a significant change to the company’s long-term NA margin profile as we think the company is likely to discontinue its marketing investments if they are unsuccessful.
Neutral
Company DataPrice ($) 79.55Date Of Price 06-Jan-1452-week Range ($) 87.48-48.81Market Cap ($ mn) 1,850.41Fiscal Year End DecShares O/S (mn) 23Price Target ($) 75.00Price Target End Date 31-Dec-14
OpenTable Inc (OPEN;OPEN US)
FYE Dec 2012A 2013E 2014E 2015EEPS - Reported ($)Q1 (Mar) 0.40 0.45A - -Q2 (Jun) 0.42 0.50A - -Q3 (Sep) 0.42 0.50A - -Q4 (Dec) 0.46 0.53 - -FY 1.69 1.98 2.32 2.70Bloomberg EPS FY ($) 1.66 1.97 2.24 2.66Source: Company data, Bloomberg, J.P. Morgan estimates.
Neutral
OPEN,OPEN US
Price: $79.55
Price Target: $75.00
United States
Internet
Kaizad Gotla, CFA AC
(1-212) 622-6436
J.P. Morgan Securities LLC
45
55
65
75
85
$
Jan-13 Apr-13 Jul-13 Oct-13 Jan-14
Price Performance
OPEN share price ($)
RTY (rebased)
YTD 1m 3m 12mAbs 56.6% -11.7% 5.8% 54.2%Rel 24.8% -12.0% -0.2% 20.1%
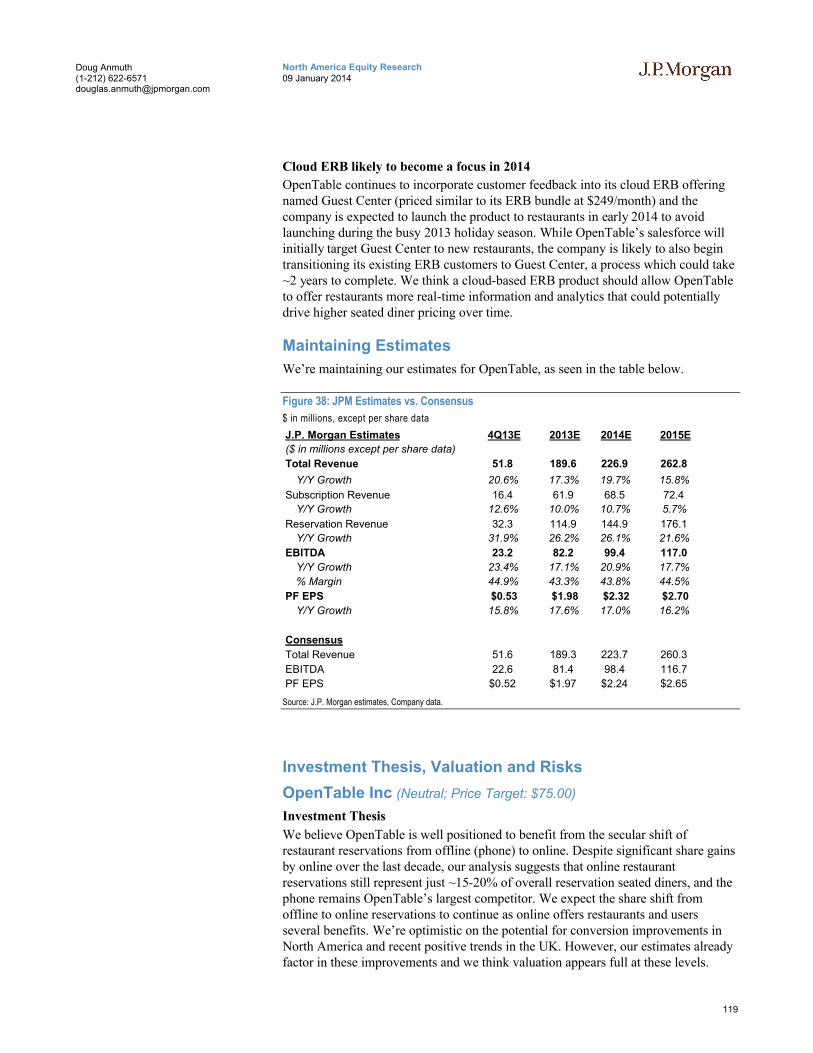
119
North America Equity Research09 January 2014
Doug Anmuth(1-212) [email protected]
Cloud ERB likely to become a focus in 2014
OpenTable continues to incorporate customer feedback into its cloud ERB offering named Guest Center (priced similar to its ERB bundle at $249/month) and the company is expected to launch the product to restaurants in early 2014 to avoid launching during the busy 2013 holiday season. While OpenTable’s salesforce will initially target Guest Center to new restaurants, the company is likely to also begin transitioning its existing ERB customers to Guest Center, a process which could take ~2 years to complete. We think a cloud-based ERB product should allow OpenTable to offer restaurants more real-time information and analytics that could potentially drive higher seated diner pricing over time.
Maintaining Estimates
We’re maintaining our estimates for OpenTable, as seen in the table below.
Figure 38: JPM Estimates vs. Consensus
$ in millions, except per share data
J.P. Morgan Estimates 4Q13E 2013E 2014E 2015E
($ in millions except per share data)
Total Revenue 51.8 189.6 226.9 262.8
Y/Y Growth 20.6% 17.3% 19.7% 15.8%
Subscription Revenue 16.4 61.9 68.5 72.4
Y/Y Growth 12.6% 10.0% 10.7% 5.7%
Reservation Revenue 32.3 114.9 144.9 176.1
Y/Y Growth 31.9% 26.2% 26.1% 21.6%
EBITDA 23.2 82.2 99.4 117.0
Y/Y Growth 23.4% 17.1% 20.9% 17.7%
% Margin 44.9% 43.3% 43.8% 44.5%
PF EPS $0.53 $1.98 $2.32 $2.70
Y/Y Growth 15.8% 17.6% 17.0% 16.2%
Consensus
Total Revenue 51.6 189.3 223.7 260.3
EBITDA 22.6 81.4 98.4 116.7
PF EPS $0.52 $1.97 $2.24 $2.65
Source: J.P. Morgan estimates, Company data.
Investment Thesis, Valuation and Risks
OpenTable Inc (Neutral; Price Target: $75.00)
Investment Thesis
We believe OpenTable is well positioned to benefit from the secular shift of restaurant reservations from offline (phone) to online. Despite significant share gains by online over the last decade, our analysis suggests that online restaurant reservations still represent just ~15-20% of overall reservation seated diners, and the phone remains OpenTable’s largest competitor. We expect the share shift from offline to online reservations to continue as online offers restaurants and users several benefits. We’re optimistic on the potential for conversion improvements in North America and recent positive trends in the UK. However, our estimates already factor in these improvements and we think valuation appears full at these levels.
120
North America Equity Research09 January 2014
Doug Anmuth(1-212) [email protected]
Valuation
Dec-14 PT of $75. Our $75 PT is based on a target P/E multiple of ~28x our 2015PF EPS estimate of $2.70. This target multiple is relatively in line with other online transaction sites such as Priceline and TripAdvisor. This target multiple is relatively in line with other online transaction sites such as Priceline and TripAdvisor, which are trading at ~18x and ~29.5x, respectively.
Risks to Rating and Price Target
Upside risks include: 1) macroeconomic conditions, including employment,improving faster than expected; 2) conversion improvements yielding higher seated diner growth; and 3) continued multiple expansion in the Internet sector.
Downside risks include: 1) higher-than-expected technology investments pressuringmargins; 2) increased levels of competition in international markets leading to lower international growth rates; 3) lower sales, hardware and installation costs of a competitive cloud-based offering over time being potentially disruptive to OpenTable’s current offering; and 4) negative macro trends impacting OpenTable’s business as it is dependent on consumer discretionary spending.

121
North America Equity Research09 January 2014
Doug Anmuth(1-212) [email protected]
OpenTable Inc: Summary of FinancialsIncome Statement - Annual FY12A FY13E FY14E FY15E Income Statement - Quarterly 1Q13A 2Q13A 3Q13A 4Q13E
Revenues 162 190 227 263 Revenues 46A 46A 47A 52Operating income 37 47 56 67 Operating income 10A 13A 10A 14D&A 13 17 18 20 D&A 4A 4A 5A 5EBITDA 46 60 70 82 EBITDA 13A 16A 13A 18Net interest income / (expense) - - - - Net interest income / (expense) - - - -Other income / (expense) 0 (0) 0 0 Other income / (expense) 0A (0)A (0)A 0Pretax income 37 47 56 67 Pretax income 10A 13A 10A 14Income taxes (13) (15) (19) (23) Income taxes (3)A (5)A (3)A (5)Net Income 24 32 37 44 Net Income 7A 8A 8A 9Weighted average diluted shares 23 24 24 25 Weighted average diluted shares 24A 24A 24A 24Diluted EPS 1.69 1.98 2.32 2.70 Diluted EPS 0.45A 0.50A 0.50A 0.53
Balance Sheet and Cash Flow Data FY12A FY13E FY14E FY15E Ratio Analysis FY12A FY13E FY14E FY15E
Cash and cash equivalents 103 107 175 254 Sales growth 15.9% 17.3% 19.7% 15.8%Accounts receivable 22 22 25 29 EBITDA growth 26.7% 17.1% 20.9% 17.7%Other current assets 17 22 23 24 EPS growth 32.2% 17.6% 17.0% 16.2%Current assets 143 163 235 319PP&E 21 27 30 33 EBITDA margin 43.4% 43.3% 43.8% 44.5%Total assets 237 296 365 448 Net margin 24.3% 25.1% 25.0% 25.6%Total debt - - - - Debt / EBITDA - - - -Total liabilities 69 71 78 86Shareholders' equity 168 224 287 361 Return on assets (ROA) 19.6% 17.8% 17.2% 16.5%
Return on equity (ROE) 28.2% 24.3% 22.2% 20.7%Net Income (including charges) 24 32 37 44D&A 13 17 18 20 Enterprise value / EBITDA 21.5 18.3 14.5 11.6Change in working capital 24 (3) 3 4 Enterprise value / Free cash flow 29.4 35.7 21.4 17.1Other 9 16 25 30 P/E 77.2 59.2 52.5 45.0Cash flow from operations 65 59 83 98Capex (13) (17) (16) (18)Free cash flow 51 42 67 80Cash flow from investing activities (5) (40) (16) (18)Cash flow from financing activities 10 (15) 0 0Dividends - - - -Dividend yield - - - -
Source: Company reports and J.P. Morgan estimates.Note: $ in millions (except per-share data).Fiscal year ends Dec
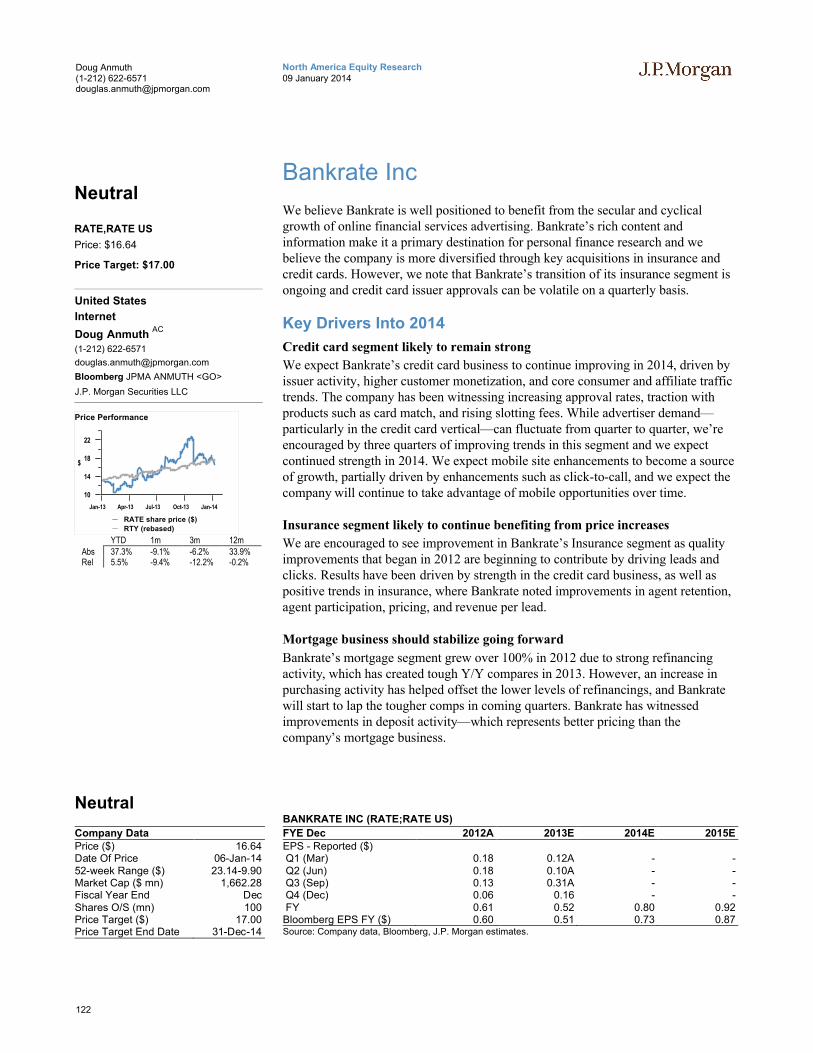
122
North America Equity Research09 January 2014
Doug Anmuth(1-212) [email protected]
Bankrate Inc
We believe Bankrate is well positioned to benefit from the secular and cyclical growth of online financial services advertising. Bankrate’s rich content and information make it a primary destination for personal finance research and we believe the company is more diversified through key acquisitions in insurance and credit cards. However, we note that Bankrate’s transition of its insurance segment is ongoing and credit card issuer approvals can be volatile on a quarterly basis.
Key Drivers Into 2014
Credit card segment likely to remain strong
We expect Bankrate’s credit card business to continue improving in 2014, driven by issuer activity, higher customer monetization, and core consumer and affiliate traffic trends. The company has been witnessing increasing approval rates, traction with products such as card match, and rising slotting fees. While advertiser demand—particularly in the credit card vertical—can fluctuate from quarter to quarter, we’re encouraged by three quarters of improving trends in this segment and we expect continued strength in 2014. We expect mobile site enhancements to become a source of growth, partially driven by enhancements such as click-to-call, and we expect the company will continue to take advantage of mobile opportunities over time.
Insurance segment likely to continue benefiting from price increases
We are encouraged to see improvement in Bankrate’s Insurance segment as quality improvements that began in 2012 are beginning to contribute by driving leads and clicks. Results have been driven by strength in the credit card business, as well as positive trends in insurance, where Bankrate noted improvements in agent retention, agent participation, pricing, and revenue per lead.
Mortgage business should stabilize going forward
Bankrate’s mortgage segment grew over 100% in 2012 due to strong refinancing activity, which has created tough Y/Y compares in 2013. However, an increase in purchasing activity has helped offset the lower levels of refinancings, and Bankrate will start to lap the tougher comps in coming quarters. Bankrate has witnessedimprovements in deposit activity—which represents better pricing than the company’s mortgage business.
Neutral
Company DataPrice ($) 16.64Date Of Price 06-Jan-1452-week Range ($) 23.14-9.90Market Cap ($ mn) 1,662.28Fiscal Year End DecShares O/S (mn) 100Price Target ($) 17.00Price Target End Date 31-Dec-14
BANKRATE INC (RATE;RATE US)
FYE Dec 2012A 2013E 2014E 2015EEPS - Reported ($)Q1 (Mar) 0.18 0.12A - -Q2 (Jun) 0.18 0.10A - -Q3 (Sep) 0.13 0.31A - -Q4 (Dec) 0.06 0.16 - -FY 0.61 0.52 0.80 0.92Bloomberg EPS FY ($) 0.60 0.51 0.73 0.87Source: Company data, Bloomberg, J.P. Morgan estimates.
Neutral
RATE,RATE US
Price: $16.64
Price Target: $17.00
United States
Internet
Doug Anmuth AC
(1-212) 622-6571
Bloomberg JPMA ANMUTH <GO>
J.P. Morgan Securities LLC
10
14
18
22
$
Jan-13 Apr-13 Jul-13 Oct-13 Jan-14
Price Performance
RATE share price ($)
RTY (rebased)
YTD 1m 3m 12mAbs 37.3% -9.1% -6.2% 33.9%Rel 5.5% -9.4% -12.2% -0.2%
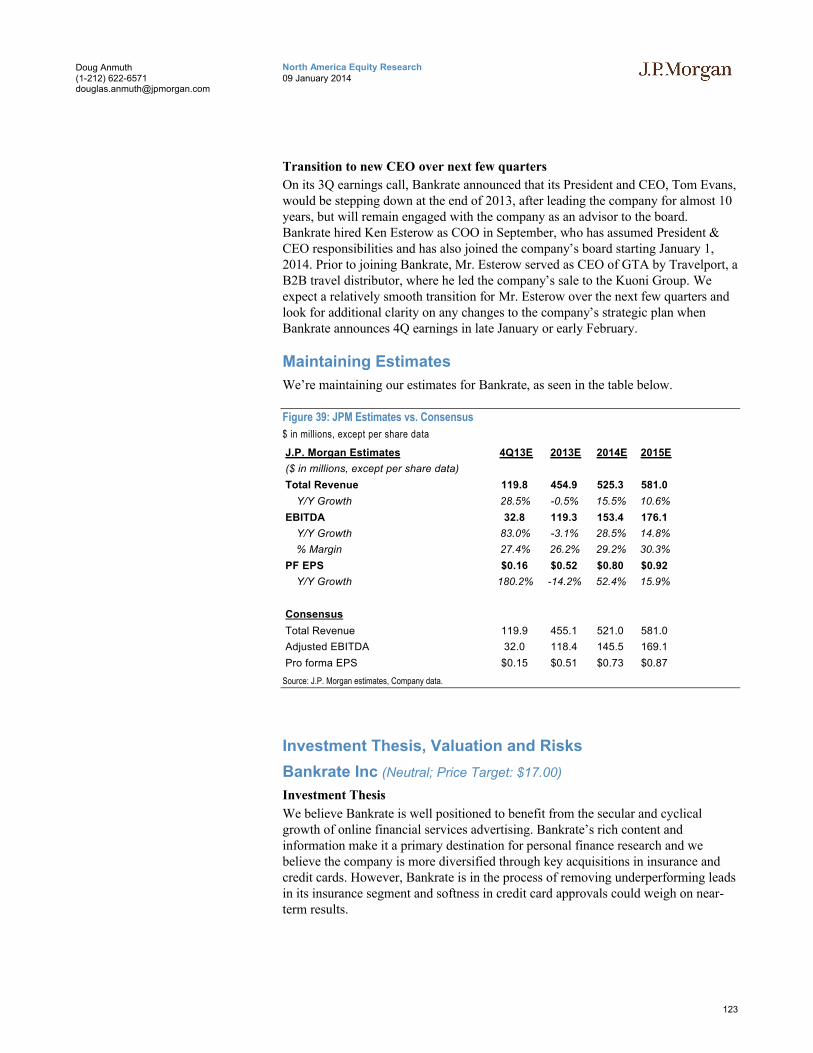
123
North America Equity Research09 January 2014
Doug Anmuth(1-212) [email protected]
Transition to new CEO over next few quarters
On its 3Q earnings call, Bankrate announced that its President and CEO, Tom Evans, would be stepping down at the end of 2013, after leading the company for almost 10 years, but will remain engaged with the company as an advisor to the board. Bankrate hired Ken Esterow as COO in September, who has assumed President & CEO responsibilities and has also joined the company’s board starting January 1, 2014. Prior to joining Bankrate, Mr. Esterow served as CEO of GTA by Travelport, a B2B travel distributor, where he led the company’s sale to the Kuoni Group. We expect a relatively smooth transition for Mr. Esterow over the next few quarters and look for additional clarity on any changes to the company’s strategic plan when Bankrate announces 4Q earnings in late January or early February.
Maintaining Estimates
We’re maintaining our estimates for Bankrate, as seen in the table below.
Figure 39: JPM Estimates vs. Consensus
$ in millions, except per share data
J.P. Morgan Estimates 4Q13E 2013E 2014E 2015E
($ in millions, except per share data)
Total Revenue 119.8 454.9 525.3 581.0
Y/Y Growth 28.5% -0.5% 15.5% 10.6%
EBITDA 32.8 119.3 153.4 176.1
Y/Y Growth 83.0% -3.1% 28.5% 14.8%
% Margin 27.4% 26.2% 29.2% 30.3%
PF EPS $0.16 $0.52 $0.80 $0.92
Y/Y Growth 180.2% -14.2% 52.4% 15.9%
Consensus
Total Revenue 119.9 455.1 521.0 581.0
Adjusted EBITDA 32.0 118.4 145.5 169.1
Pro forma EPS $0.15 $0.51 $0.73 $0.87
Source: J.P. Morgan estimates, Company data.
Investment Thesis, Valuation and Risks
Bankrate Inc (Neutral; Price Target: $17.00)
Investment Thesis
We believe Bankrate is well positioned to benefit from the secular and cyclical growth of online financial services advertising. Bankrate’s rich content and information make it a primary destination for personal finance research and we believe the company is more diversified through key acquisitions in insurance and credit cards. However, Bankrate is in the process of removing underperforming leads in its insurance segment and softness in credit card approvals could weigh on near-term results.
124
North America Equity Research09 January 2014
Doug Anmuth(1-212) [email protected]
Valuation
Our year-end 2014 price target of $17 is based on ~18x our 2015E PF EPS of $0.92. Our PT multiple is in line with other online advertising names such as Google. Our PT multiple is in line with other online advertising names such as Google, which is trading at ~17.5x.
Risks to Rating and Price Target
Upside risks include: 1) a faster-than-expected economic and housing recovery in the US, which could drive higher mortgage and credit card marketing spend; 2) credit card marketing seeing a significant rebound sooner than expected; and 3) quality improvements leading to improved pricing sooner than our expectations.
Downside risks include: 1) competition from several smaller companies driving leads to insurance advertisers, with cheaper, low-quality leads potentially posing a risk to pricing in the near term, even though Bankrate has not seen these pressures in its business to date; 2) a further deterioration of the economy or housing market pressuring pricing in the mortgage vertical; 3) further weakness in credit card marketing spend or an inability to drive higher insurance lead pricing; and 4) Bankrate not being able to successfully replace lost affiliate revenue with O&O revenue.
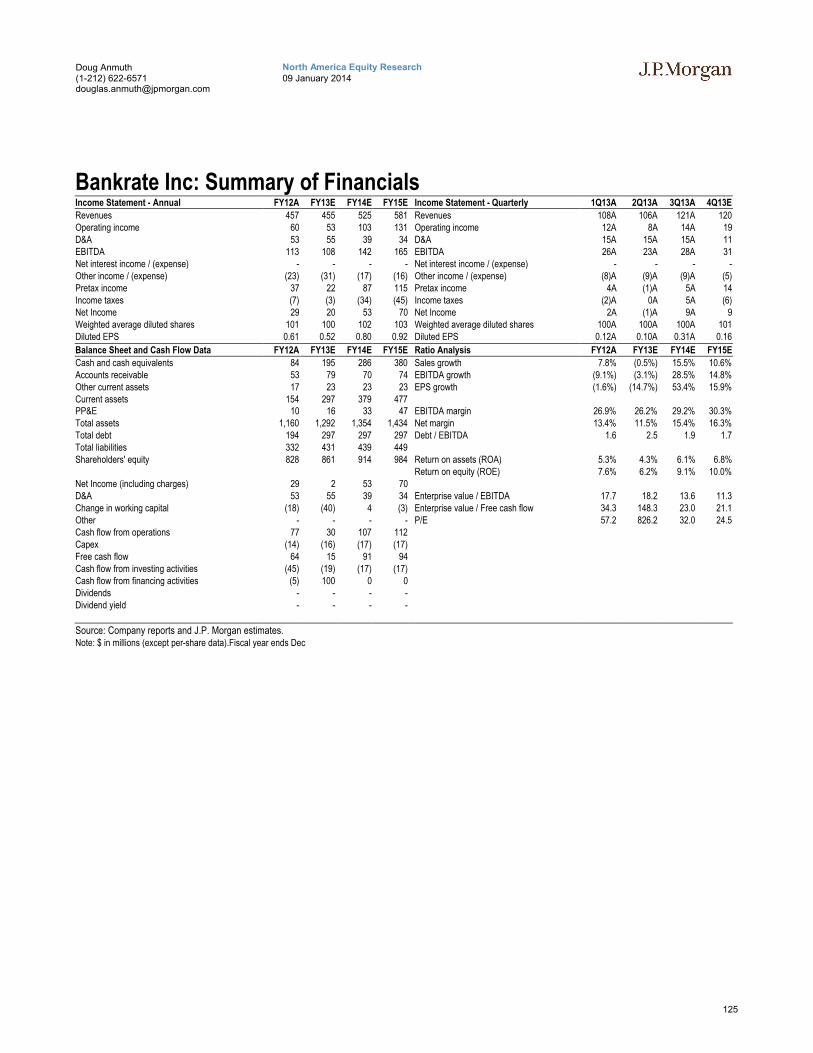
125
North America Equity Research09 January 2014
Doug Anmuth(1-212) [email protected]
Bankrate Inc: Summary of FinancialsIncome Statement - Annual FY12A FY13E FY14E FY15E Income Statement - Quarterly 1Q13A 2Q13A 3Q13A 4Q13E
Revenues 457 455 525 581 Revenues 108A 106A 121A 120Operating income 60 53 103 131 Operating income 12A 8A 14A 19D&A 53 55 39 34 D&A 15A 15A 15A 11EBITDA 113 108 142 165 EBITDA 26A 23A 28A 31Net interest income / (expense) - - - - Net interest income / (expense) - - - -Other income / (expense) (23) (31) (17) (16) Other income / (expense) (8)A (9)A (9)A (5)Pretax income 37 22 87 115 Pretax income 4A (1)A 5A 14Income taxes (7) (3) (34) (45) Income taxes (2)A 0A 5A (6)Net Income 29 20 53 70 Net Income 2A (1)A 9A 9Weighted average diluted shares 101 100 102 103 Weighted average diluted shares 100A 100A 100A 101Diluted EPS 0.61 0.52 0.80 0.92 Diluted EPS 0.12A 0.10A 0.31A 0.16
Balance Sheet and Cash Flow Data FY12A FY13E FY14E FY15E Ratio Analysis FY12A FY13E FY14E FY15E
Cash and cash equivalents 84 195 286 380 Sales growth 7.8% (0.5%) 15.5% 10.6%Accounts receivable 53 79 70 74 EBITDA growth (9.1%) (3.1%) 28.5% 14.8%Other current assets 17 23 23 23 EPS growth (1.6%) (14.7%) 53.4% 15.9%Current assets 154 297 379 477PP&E 10 16 33 47 EBITDA margin 26.9% 26.2% 29.2% 30.3%Total assets 1,160 1,292 1,354 1,434 Net margin 13.4% 11.5% 15.4% 16.3%Total debt 194 297 297 297 Debt / EBITDA 1.6 2.5 1.9 1.7Total liabilities 332 431 439 449Shareholders' equity 828 861 914 984 Return on assets (ROA) 5.3% 4.3% 6.1% 6.8%
Return on equity (ROE) 7.6% 6.2% 9.1% 10.0%Net Income (including charges) 29 2 53 70D&A 53 55 39 34 Enterprise value / EBITDA 17.7 18.2 13.6 11.3Change in working capital (18) (40) 4 (3) Enterprise value / Free cash flow 34.3 148.3 23.0 21.1Other - - - - P/E 57.2 826.2 32.0 24.5Cash flow from operations 77 30 107 112Capex (14) (16) (17) (17)Free cash flow 64 15 91 94Cash flow from investing activities (45) (19) (17) (17)Cash flow from financing activities (5) 100 0 0Dividends - - - -Dividend yield - - - -
Source: Company reports and J.P. Morgan estimates.Note: $ in millions (except per-share data).Fiscal year ends Dec
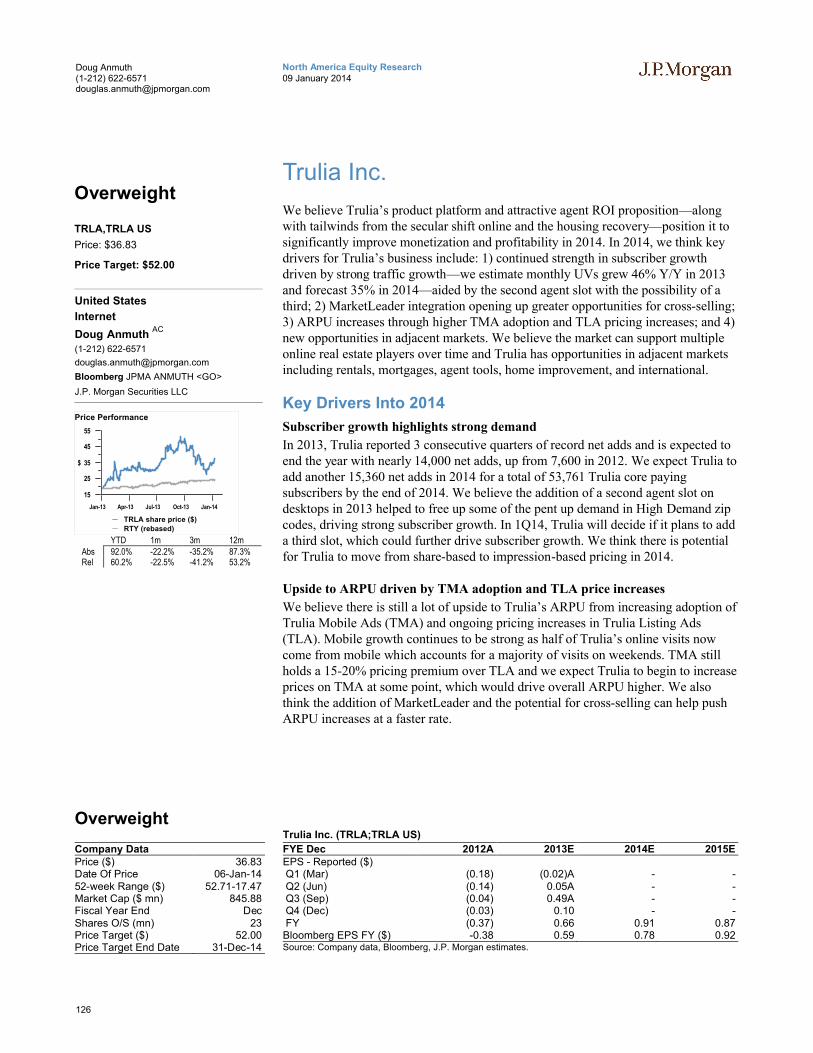
126
North America Equity Research09 January 2014
Doug Anmuth(1-212) [email protected]
Trulia Inc.
We believe Trulia’s product platform and attractive agent ROI proposition—along with tailwinds from the secular shift online and the housing recovery—position it to significantly improve monetization and profitability in 2014. In 2014, we think key drivers for Trulia’s business include: 1) continued strength in subscriber growthdriven by strong traffic growth—we estimate monthly UVs grew 46% Y/Y in 2013 and forecast 35% in 2014—aided by the second agent slot with the possibility of a third; 2) MarketLeader integration opening up greater opportunities for cross-selling; 3) ARPU increases through higher TMA adoption and TLA pricing increases; and 4) new opportunities in adjacent markets. We believe the market can support multiple online real estate players over time and Trulia has opportunities in adjacent markets including rentals, mortgages, agent tools, home improvement, and international.
Key Drivers Into 2014
Subscriber growth highlights strong demand
In 2013, Trulia reported 3 consecutive quarters of record net adds and is expected to end the year with nearly 14,000 net adds, up from 7,600 in 2012. We expect Trulia to add another 15,360 net adds in 2014 for a total of 53,761 Trulia core paying subscribers by the end of 2014. We believe the addition of a second agent slot on desktops in 2013 helped to free up some of the pent up demand in High Demand zip codes, driving strong subscriber growth. In 1Q14, Trulia will decide if it plans to add a third slot, which could further drive subscriber growth. We think there is potential for Trulia to move from share-based to impression-based pricing in 2014.
Upside to ARPU driven by TMA adoption and TLA price increases
We believe there is still a lot of upside to Trulia’s ARPU from increasing adoption of Trulia Mobile Ads (TMA) and ongoing pricing increases in Trulia Listing Ads (TLA). Mobile growth continues to be strong as half of Trulia’s online visits now come from mobile which accounts for a majority of visits on weekends. TMA still holds a 15-20% pricing premium over TLA and we expect Trulia to begin to increase prices on TMA at some point, which would drive overall ARPU higher. We also think the addition of MarketLeader and the potential for cross-selling can help push ARPU increases at a faster rate.
Overweight
Company DataPrice ($) 36.83Date Of Price 06-Jan-1452-week Range ($) 52.71-17.47Market Cap ($ mn) 845.88Fiscal Year End DecShares O/S (mn) 23Price Target ($) 52.00Price Target End Date 31-Dec-14
Trulia Inc. (TRLA;TRLA US)
FYE Dec 2012A 2013E 2014E 2015EEPS - Reported ($)Q1 (Mar) (0.18) (0.02)A - -Q2 (Jun) (0.14) 0.05A - -Q3 (Sep) (0.04) 0.49A - -Q4 (Dec) (0.03) 0.10 - -FY (0.37) 0.66 0.91 0.87Bloomberg EPS FY ($) -0.38 0.59 0.78 0.92Source: Company data, Bloomberg, J.P. Morgan estimates.
Overweight
TRLA,TRLA US
Price: $36.83
Price Target: $52.00
United States
Internet
Doug Anmuth AC
(1-212) 622-6571
Bloomberg JPMA ANMUTH <GO>
J.P. Morgan Securities LLC
15
25
35
45
55
$
Jan-13 Apr-13 Jul-13 Oct-13 Jan-14
Price Performance
TRLA share price ($)
RTY (rebased)
YTD 1m 3m 12mAbs 92.0% -22.2% -35.2% 87.3%Rel 60.2% -22.5% -41.2% 53.2%
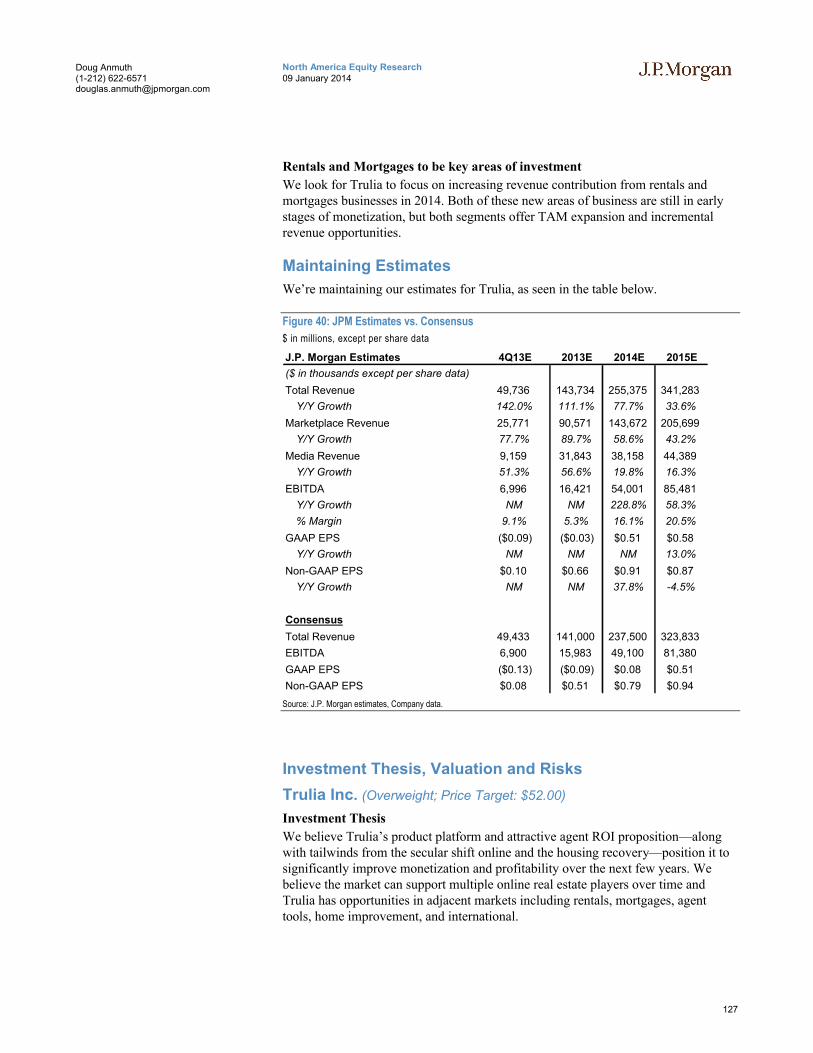
127
North America Equity Research09 January 2014
Doug Anmuth(1-212) [email protected]
Rentals and Mortgages to be key areas of investment
We look for Trulia to focus on increasing revenue contribution from rentals and mortgages businesses in 2014. Both of these new areas of business are still in early stages of monetization, but both segments offer TAM expansion and incremental revenue opportunities.
Maintaining Estimates
We’re maintaining our estimates for Trulia, as seen in the table below.
Figure 40: JPM Estimates vs. Consensus
$ in millions, except per share data
J.P. Morgan Estimates 4Q13E 2013E 2014E 2015E
($ in thousands except per share data)
Total Revenue 49,736 143,734 255,375 341,283
Y/Y Growth 142.0% 111.1% 77.7% 33.6%
Marketplace Revenue 25,771 90,571 143,672 205,699
Y/Y Growth 77.7% 89.7% 58.6% 43.2%
Media Revenue 9,159 31,843 38,158 44,389
Y/Y Growth 51.3% 56.6% 19.8% 16.3%
EBITDA 6,996 16,421 54,001 85,481
Y/Y Growth NM NM 228.8% 58.3%
% Margin 9.1% 5.3% 16.1% 20.5%
GAAP EPS ($0.09) ($0.03) $0.51 $0.58
Y/Y Growth NM NM NM 13.0%
Non-GAAP EPS $0.10 $0.66 $0.91 $0.87
Y/Y Growth NM NM 37.8% -4.5%
Consensus
Total Revenue 49,433 141,000 237,500 323,833
EBITDA 6,900 15,983 49,100 81,380
GAAP EPS ($0.13) ($0.09) $0.08 $0.51
Non-GAAP EPS $0.08 $0.51 $0.79 $0.94
Source: J.P. Morgan estimates, Company data.
Investment Thesis, Valuation and Risks
Trulia Inc. (Overweight; Price Target: $52.00)
Investment Thesis
We believe Trulia’s product platform and attractive agent ROI proposition—along with tailwinds from the secular shift online and the housing recovery—position it to significantly improve monetization and profitability over the next few years. We believe the market can support multiple online real estate players over time and Trulia has opportunities in adjacent markets including rentals, mortgages, agent tools, home improvement, and international.
128
North America Equity Research09 January 2014
Doug Anmuth(1-212) [email protected]
Valuation
Price target of $52. We believe Trulia deserves a premium to the broader market and much of our Internet coverage universe given its higher growth rates and margin expansion potential over the next few years. Our year-end 2014 price target of $52 is based on the average of: 1) EV/EBITDA multiple of 25x our 2015 EBITDA estimate of $85.5M, and 2) our DCF-based valuation. Our EV/EBITDA target multiple is at a discount to Zillow (32.5x) and modestly below Trulia’s comp group including Zillow, LinkedIn, TripAdvisor, HomeAway, and Yelp which currently trade at an average of ~29x 2015E EBITDA. Our DCF analysis for Trulia yields a $55 value based on a 12% cost of capital, 3% terminal growth rate, and 11x terminal EBITDA multiple.
Risks to Rating and Price Target
Downside risks include: 1) a decline in the macro housing industry having a material impact on Trulia’s performance; 2) limited financial history and potential challenges in maintaining profitability; 3) highly competitive environment leading to increased investments and marketing expenses; 4) problems or issues with the integration of Market Leader; and 5) potential lawsuits between competitors potentially resulting in unexpected legal costs.

129
North America Equity Research09 January 2014
Doug Anmuth(1-212) [email protected]
Trulia Inc.: Summary of FinancialsIncome Statement - Annual FY12A FY13E FY14E FY15E Income Statement - Quarterly 1Q13A 2Q13A 3Q13A 4Q13E
Revenues 68 144 255 341 Revenues 24A 30A 40A 50Operating income (10) (11) 23 46 Operating income (2)A (0)A (6)A (4)D&A 4 9 13 15 D&A 1A 2A 3A 2EBITDA (6) (2) 36 62 EBITDA (0)A 1A (2)A (1)Net interest income / (expense) (1) (1) (0) 0 Net interest income / (expense) (0)A (0)A (0)A (0)Other income / (expense) (1) (1) (0) 0 Other income / (expense) (0)A (0)A (0)A (0)Pretax income (11) (12) 23 46 Pretax income (2)A (0)A (6)A (4)Income taxes 0 17 0 (20) Income taxes (0)A (0)A 17A 0Net Income (11) 5 23 27 Net Income (2)A (0)A 11A (4)Weighted average diluted shares 23 36 45 46 Weighted average diluted shares 28A 34A 37A 44Diluted EPS (0.37) 0.66 0.91 0.87 Diluted EPS (0.02)A 0.05A 0.49A 0.10
Balance Sheet and Cash Flow Data FY12A FY13E FY14E FY15E Ratio Analysis FY12A FY13E FY14E FY15E
Cash and cash equivalents 100 56 84 122 Sales growth 76.8% 111.1% 77.7% 33.6%Accounts receivable 6 14 15 19 EBITDA growth 88.4% (587.9%) 228.8% 58.3%Other current assets 1 2 10 15 EPS growth 62.7% (280.8%) 37.8% (4.5%)Current assets 108 73 110 156PP&E 7 9 13 18 EBITDA margin (4.9%) 11.4% 21.1% 25.0%Total assets 119 471 512 564 Net margin (12.3%) 16.6% 16.1% 11.7%Total debt 10 8 8 8 Debt / EBITDA NM 0.5 0.1 0.1Total liabilities 32 58 76 101Shareholders' equity 87 413 436 463 Return on assets (ROA) (11.7%) 8.1% 8.4% 7.4%
Return on equity (ROE) (18.6%) 9.5% 9.7% 8.9%Net Income (including charges) (11) (1) 23 27D&A 4 9 13 15 Enterprise value / EBITDA NM 57.1 16.8 10.2Change in working capital 8 8 9 16 Enterprise value / Free cash flow NM 151.0 19.8 14.1Other - - - - P/E NM 269.7 72.4 64.0Cash flow from operations 4 18 62 82Capex (6) (11) (17) (20)Free cash flow (1) 6 46 62Cash flow from investing activities (2) (9) (17) (20)Cash flow from financing activities 91 108 (18) (24)Dividends - - - -Dividend yield - - - -
Source: Company reports and J.P. Morgan estimates.Note: $ in millions (except per-share data).Fiscal year ends Dec
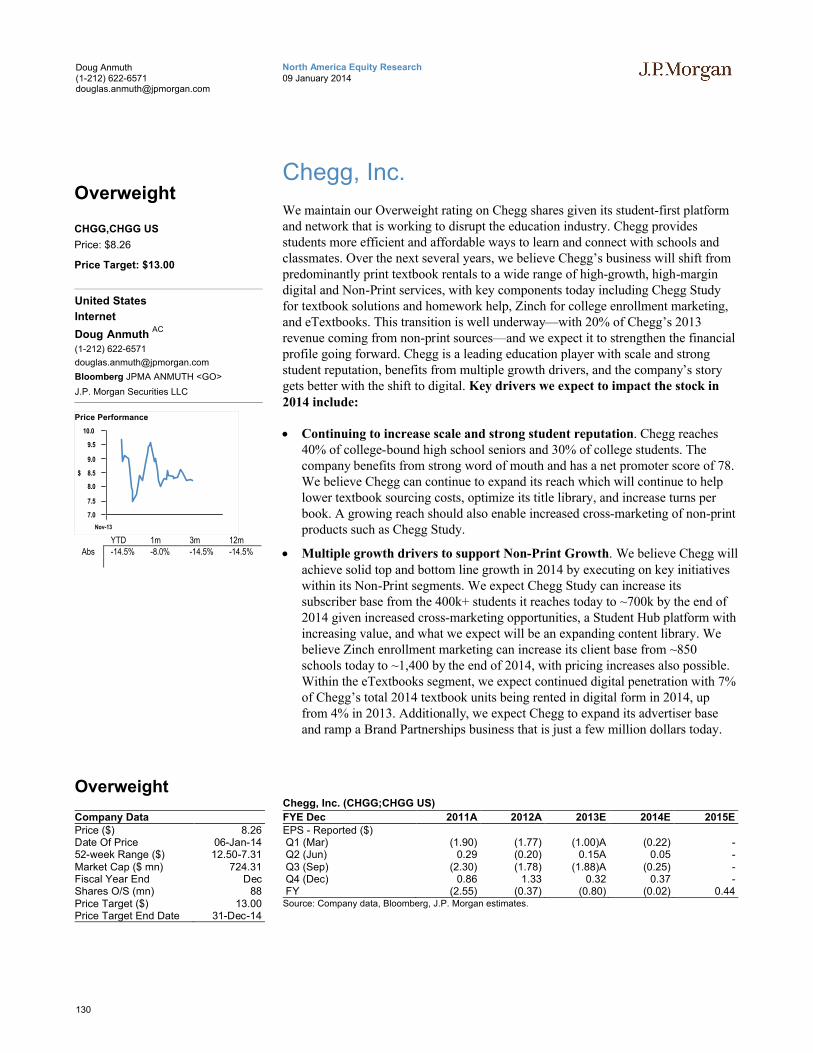
130
North America Equity Research09 January 2014
Doug Anmuth(1-212) [email protected]
Chegg, Inc.
We maintain our Overweight rating on Chegg shares given its student-first platform and network that is working to disrupt the education industry. Chegg provides students more efficient and affordable ways to learn and connect with schools and classmates. Over the next several years, we believe Chegg’s business will shift from predominantly print textbook rentals to a wide range of high-growth, high-margin digital and Non-Print services, with key components today including Chegg Study for textbook solutions and homework help, Zinch for college enrollment marketing, and eTextbooks. This transition is well underway—with 20% of Chegg’s 2013 revenue coming from non-print sources—and we expect it to strengthen the financial profile going forward. Chegg is a leading education player with scale and strong student reputation, benefits from multiple growth drivers, and the company’s story gets better with the shift to digital. Key drivers we expect to impact the stock in 2014 include:
Continuing to increase scale and strong student reputation. Chegg reaches 40% of college-bound high school seniors and 30% of college students. The company benefits from strong word of mouth and has a net promoter score of 78. We believe Chegg can continue to expand its reach which will continue to help lower textbook sourcing costs, optimize its title library, and increase turns per book. A growing reach should also enable increased cross-marketing of non-print products such as Chegg Study.
Multiple growth drivers to support Non-Print Growth. We believe Chegg will achieve solid top and bottom line growth in 2014 by executing on key initiatives within its Non-Print segments. We expect Chegg Study can increase its subscriber base from the 400k+ students it reaches today to ~700k by the end of 2014 given increased cross-marketing opportunities, a Student Hub platform with increasing value, and what we expect will be an expanding content library. We believe Zinch enrollment marketing can increase its client base from ~850 schools today to ~1,400 by the end of 2014, with pricing increases also possible. Within the eTextbooks segment, we expect continued digital penetration with 7% of Chegg’s total 2014 textbook units being rented in digital form in 2014, up from 4% in 2013. Additionally, we expect Chegg to expand its advertiser base and ramp a Brand Partnerships business that is just a few million dollars today.
Overweight
Company DataPrice ($) 8.26Date Of Price 06-Jan-1452-week Range ($) 12.50-7.31Market Cap ($ mn) 724.31Fiscal Year End DecShares O/S (mn) 88Price Target ($) 13.00Price Target End Date 31-Dec-14
Chegg, Inc. (CHGG;CHGG US)
FYE Dec 2011A 2012A 2013E 2014E 2015EEPS - Reported ($)Q1 (Mar) (1.90) (1.77) (1.00)A (0.22) -Q2 (Jun) 0.29 (0.20) 0.15A 0.05 -Q3 (Sep) (2.30) (1.78) (1.88)A (0.25) -Q4 (Dec) 0.86 1.33 0.32 0.37 -FY (2.55) (0.37) (0.80) (0.02) 0.44
Source: Company data, Bloomberg, J.P. Morgan estimates.
Overweight
CHGG,CHGG US
Price: $8.26
Price Target: $13.00
United States
Internet
Doug Anmuth AC
(1-212) 622-6571
Bloomberg JPMA ANMUTH <GO>
J.P. Morgan Securities LLC
7.0
7.5
8.0
8.5
9.0
9.5
10.0
$
Nov-13
Price Performance
YTD 1m 3m 12mAbs -14.5% -8.0% -14.5% -14.5%
131
North America Equity Research09 January 2014
Doug Anmuth(1-212) [email protected]
Shift to digital improving Chegg’s overall growth and margin profile. We estimate Non-Print will grow from 20% of revenue in 2013 to 27% in 2014 and nearly 50% by 2017. As Non-Print becomes a bigger part of the business, we believe Chegg’s model will: 1) become less capital intensive; 2) have smoother cash flows as it trades upfront purchases for licensing fees; 3) have lower/no physical shipping costs; 4) have a larger textbook library through eTexts; and 5)shift to a higher gross margin business.
What to look for in 2014: Overall mix shift towards Non-Print driven by: 1)Chegg Study subscriber growth and improving textbook customer attach rate; 2)Print textbook unit growth and increasing market share given more competitive pricing; 3) Growing Enrollment Marketing clients, sourcing more of their incoming classes, and potential pricing improvements or a more complex pricing structure; 4) Increasing Brand Partnership relationships (beyond 30+ today), including new types of campaigns, new clients, and larger campaigns with more repeat clients.
Maintaining overweight rating and $13 price target. Given the rapid transition we expect in the business model over the next three to five years and improving profitability, our primary valuation methodology is a DCF analysis. Our $13 December 2014 price target is based on our DCF analysis through 2020, which assumes a 12.5% cost of capital, 2.5% terminal growth rate, and 10.5x terminal EBITDA multiple. Key drivers of our DCF projections include a 2012-2020E revenue CAGR of 22%. We estimate adjusted EBITDA including book depreciation turns positive in 2014. Our $13 price target implies ~3x 2014E Revenue of $310.8M and ~21x 2015E EBITDA of $49.8M.
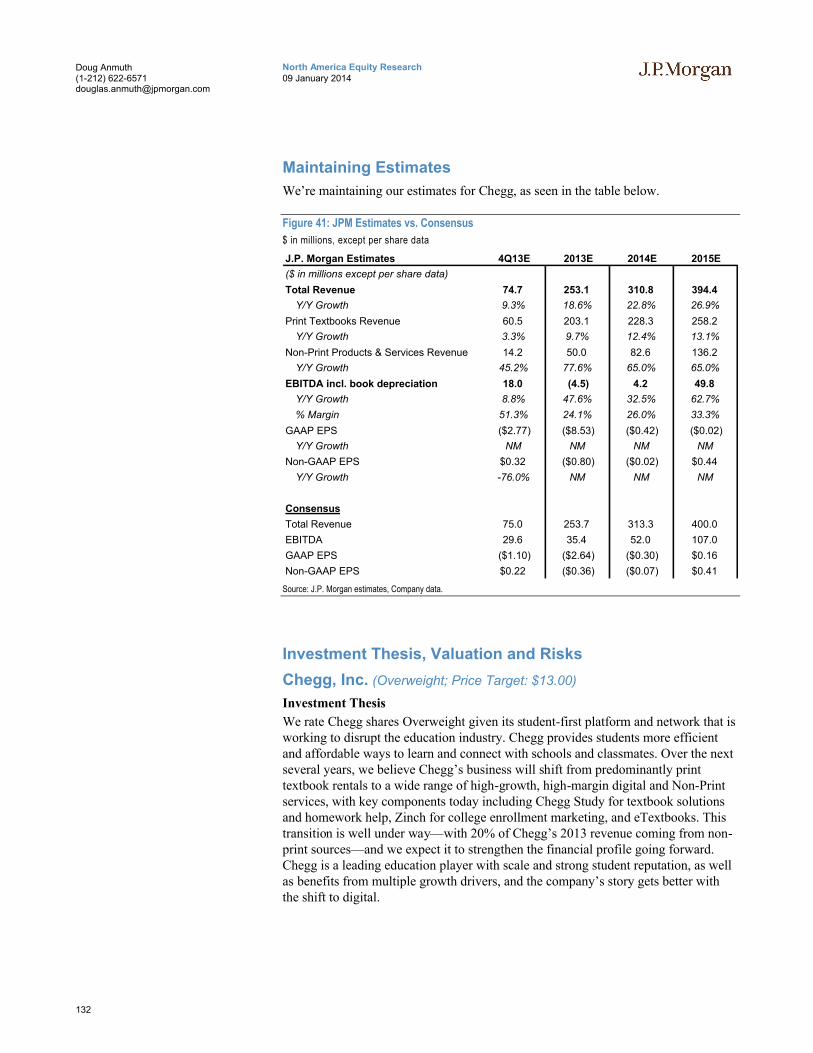
132
North America Equity Research09 January 2014
Doug Anmuth(1-212) [email protected]
Maintaining Estimates
We’re maintaining our estimates for Chegg, as seen in the table below.
Figure 41: JPM Estimates vs. Consensus
$ in millions, except per share data
J.P. Morgan Estimates 4Q13E 2013E 2014E 2015E
($ in millions except per share data)
Total Revenue 74.7 253.1 310.8 394.4
Y/Y Growth 9.3% 18.6% 22.8% 26.9%
Print Textbooks Revenue 60.5 203.1 228.3 258.2
Y/Y Growth 3.3% 9.7% 12.4% 13.1%
Non-Print Products & Services Revenue 14.2 50.0 82.6 136.2
Y/Y Growth 45.2% 77.6% 65.0% 65.0%
EBITDA incl. book depreciation 18.0 (4.5) 4.2 49.8
Y/Y Growth 8.8% 47.6% 32.5% 62.7%
% Margin 51.3% 24.1% 26.0% 33.3%
GAAP EPS ($2.77) ($8.53) ($0.42) ($0.02)
Y/Y Growth NM NM NM NM
Non-GAAP EPS $0.32 ($0.80) ($0.02) $0.44
Y/Y Growth -76.0% NM NM NM
Consensus
Total Revenue 75.0 253.7 313.3 400.0
EBITDA 29.6 35.4 52.0 107.0
GAAP EPS ($1.10) ($2.64) ($0.30) $0.16
Non-GAAP EPS $0.22 ($0.36) ($0.07) $0.41
Source: J.P. Morgan estimates, Company data.
Investment Thesis, Valuation and Risks
Chegg, Inc. (Overweight; Price Target: $13.00)
Investment Thesis
We rate Chegg shares Overweight given its student-first platform and network that is working to disrupt the education industry. Chegg provides students more efficient and affordable ways to learn and connect with schools and classmates. Over the next several years, we believe Chegg’s business will shift from predominantly print textbook rentals to a wide range of high-growth, high-margin digital and Non-Print services, with key components today including Chegg Study for textbook solutions and homework help, Zinch for college enrollment marketing, and eTextbooks. This transition is well under way—with 20% of Chegg’s 2013 revenue coming from non-print sources—and we expect it to strengthen the financial profile going forward. Chegg is a leading education player with scale and strong student reputation, as well as benefits from multiple growth drivers, and the company’s story gets better with the shift to digital.
133
North America Equity Research09 January 2014
Doug Anmuth(1-212) [email protected]
Valuation
Given the rapid transition we expect in the business model over the next three to five years and improving profitability, our primary valuation methodology is a DCF analysis. Our December 2014 price target of $13 is based on our DCF analysis through 2020, which assumes a 12.5% cost of capital, 2.5% terminal growth rate, and 10.5x terminal EBITDA multiple. Key drivers of our DCF projections include a 2012-2020E revenue CAGR of 22%. We estimate adjusted EBITDA including book depreciation turns positive in 2014. Our $13 price target implies ~3x 2014E Revenue of $310.8M and ~21x 2015E EBITDA of $49.8M.
Risks to Rating and Price Target
Downside risks include: 1) competition in the textbook market where Chegg primarily competes with college bookstores and Amazon; 2) the transition to digital reducing barriers to entry given the capital-intensive nature of the print textbook rental business; 3) Chegg relying on relationships with publishers for textbooks and certain study aid solutions; and 4) strong Non-Print execution being required in order for the company to shift from print textbooks.
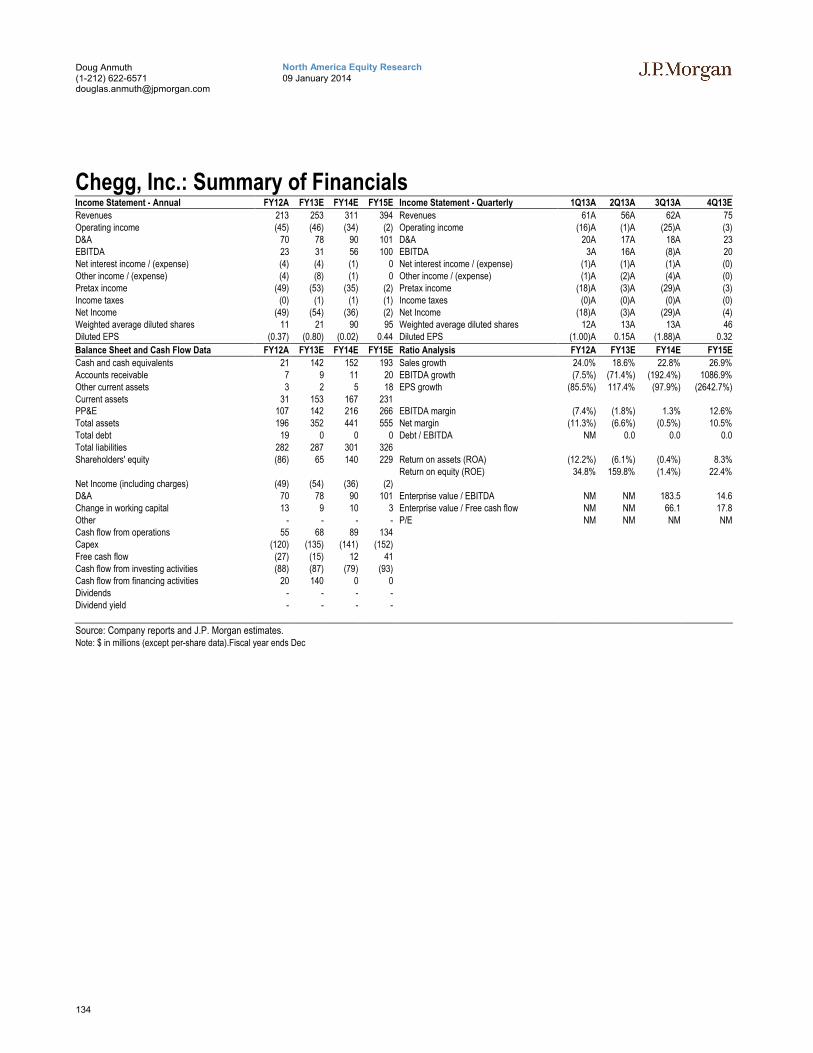
134
North America Equity Research09 January 2014
Doug Anmuth(1-212) [email protected]
Chegg, Inc.: Summary of FinancialsIncome Statement - Annual FY12A FY13E FY14E FY15E Income Statement - Quarterly 1Q13A 2Q13A 3Q13A 4Q13E
Revenues 213 253 311 394 Revenues 61A 56A 62A 75Operating income (45) (46) (34) (2) Operating income (16)A (1)A (25)A (3)D&A 70 78 90 101 D&A 20A 17A 18A 23EBITDA 23 31 56 100 EBITDA 3A 16A (8)A 20Net interest income / (expense) (4) (4) (1) 0 Net interest income / (expense) (1)A (1)A (1)A (0)Other income / (expense) (4) (8) (1) 0 Other income / (expense) (1)A (2)A (4)A (0)Pretax income (49) (53) (35) (2) Pretax income (18)A (3)A (29)A (3)Income taxes (0) (1) (1) (1) Income taxes (0)A (0)A (0)A (0)Net Income (49) (54) (36) (2) Net Income (18)A (3)A (29)A (4)Weighted average diluted shares 11 21 90 95 Weighted average diluted shares 12A 13A 13A 46Diluted EPS (0.37) (0.80) (0.02) 0.44 Diluted EPS (1.00)A 0.15A (1.88)A 0.32
Balance Sheet and Cash Flow Data FY12A FY13E FY14E FY15E Ratio Analysis FY12A FY13E FY14E FY15E
Cash and cash equivalents 21 142 152 193 Sales growth 24.0% 18.6% 22.8% 26.9%Accounts receivable 7 9 11 20 EBITDA growth (7.5%) (71.4%) (192.4%) 1086.9%Other current assets 3 2 5 18 EPS growth (85.5%) 117.4% (97.9%) (2642.7%)Current assets 31 153 167 231PP&E 107 142 216 266 EBITDA margin (7.4%) (1.8%) 1.3% 12.6%Total assets 196 352 441 555 Net margin (11.3%) (6.6%) (0.5%) 10.5%Total debt 19 0 0 0 Debt / EBITDA NM 0.0 0.0 0.0Total liabilities 282 287 301 326Shareholders' equity (86) 65 140 229 Return on assets (ROA) (12.2%) (6.1%) (0.4%) 8.3%
Return on equity (ROE) 34.8% 159.8% (1.4%) 22.4%Net Income (including charges) (49) (54) (36) (2)D&A 70 78 90 101 Enterprise value / EBITDA NM NM 183.5 14.6Change in working capital 13 9 10 3 Enterprise value / Free cash flow NM NM 66.1 17.8Other - - - - P/E NM NM NM NMCash flow from operations 55 68 89 134Capex (120) (135) (141) (152)Free cash flow (27) (15) 12 41Cash flow from investing activities (88) (87) (79) (93)Cash flow from financing activities 20 140 0 0Dividends - - - -Dividend yield - - - -
Source: Company reports and J.P. Morgan estimates.Note: $ in millions (except per-share data).Fiscal year ends Dec
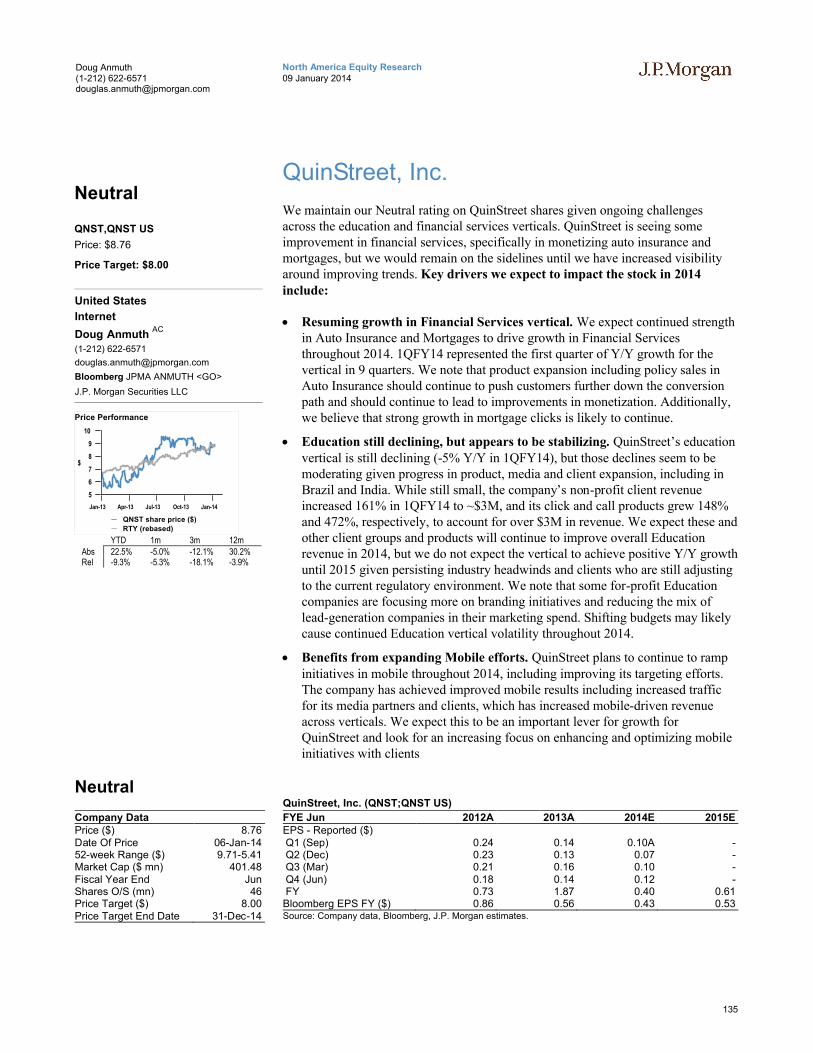
135
North America Equity Research09 January 2014
Doug Anmuth(1-212) [email protected]
QuinStreet, Inc.
We maintain our Neutral rating on QuinStreet shares given ongoing challenges across the education and financial services verticals. QuinStreet is seeing some improvement in financial services, specifically in monetizing auto insurance and mortgages, but we would remain on the sidelines until we have increased visibility around improving trends. Key drivers we expect to impact the stock in 2014 include:
Resuming growth in Financial Services vertical. We expect continued strength in Auto Insurance and Mortgages to drive growth in Financial Services throughout 2014. 1QFY14 represented the first quarter of Y/Y growth for the vertical in 9 quarters. We note that product expansion including policy sales in Auto Insurance should continue to push customers further down the conversion path and should continue to lead to improvements in monetization. Additionally, we believe that strong growth in mortgage clicks is likely to continue.
Education still declining, but appears to be stabilizing. QuinStreet’s education vertical is still declining (-5% Y/Y in 1QFY14), but those declines seem to be moderating given progress in product, media and client expansion, including in Brazil and India. While still small, the company’s non-profit client revenue increased 161% in 1QFY14 to ~$3M, and its click and call products grew 148% and 472%, respectively, to account for over $3M in revenue. We expect these and other client groups and products will continue to improve overall Education revenue in 2014, but we do not expect the vertical to achieve positive Y/Y growth until 2015 given persisting industry headwinds and clients who are still adjusting to the current regulatory environment. We note that some for-profit Education companies are focusing more on branding initiatives and reducing the mix of lead-generation companies in their marketing spend. Shifting budgets may likely cause continued Education vertical volatility throughout 2014.
Benefits from expanding Mobile efforts. QuinStreet plans to continue to ramp initiatives in mobile throughout 2014, including improving its targeting efforts. The company has achieved improved mobile results including increased traffic for its media partners and clients, which has increased mobile-driven revenue across verticals. We expect this to be an important lever for growth for QuinStreet and look for an increasing focus on enhancing and optimizing mobile initiatives with clients
Neutral
Company DataPrice ($) 8.76Date Of Price 06-Jan-1452-week Range ($) 9.71-5.41Market Cap ($ mn) 401.48Fiscal Year End JunShares O/S (mn) 46Price Target ($) 8.00Price Target End Date 31-Dec-14
QuinStreet, Inc. (QNST;QNST US)
FYE Jun 2012A 2013A 2014E 2015EEPS - Reported ($)Q1 (Sep) 0.24 0.14 0.10A -Q2 (Dec) 0.23 0.13 0.07 -Q3 (Mar) 0.21 0.16 0.10 -Q4 (Jun) 0.18 0.14 0.12 -FY 0.73 1.87 0.40 0.61Bloomberg EPS FY ($) 0.86 0.56 0.43 0.53Source: Company data, Bloomberg, J.P. Morgan estimates.
Neutral
QNST,QNST US
Price: $8.76
Price Target: $8.00
United States
Internet
Doug Anmuth AC
(1-212) 622-6571
Bloomberg JPMA ANMUTH <GO>
J.P. Morgan Securities LLC
5
6
7
8
9
10
$
Jan-13 Apr-13 Jul-13 Oct-13 Jan-14
Price Performance
QNST share price ($)
RTY (rebased)
YTD 1m 3m 12mAbs 22.5% -5.0% -12.1% 30.2%Rel -9.3% -5.3% -18.1% -3.9%
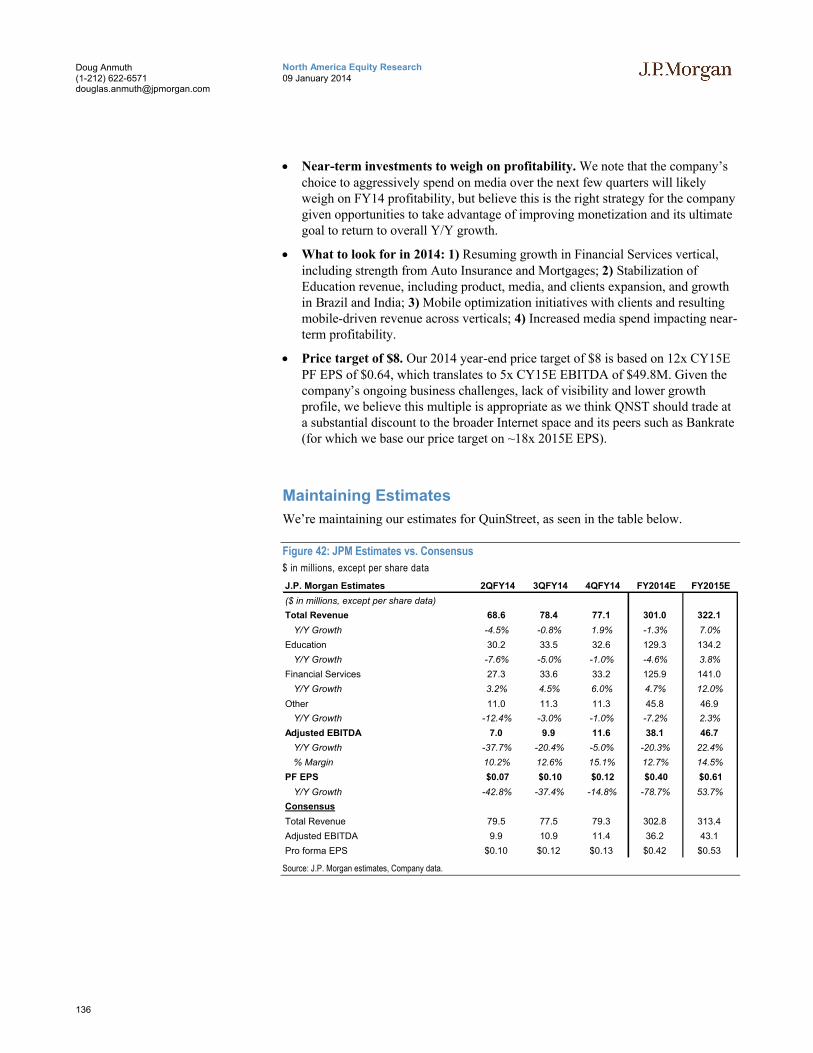
136
North America Equity Research09 January 2014
Doug Anmuth(1-212) [email protected]
Near-term investments to weigh on profitability. We note that the company’s choice to aggressively spend on media over the next few quarters will likely weigh on FY14 profitability, but believe this is the right strategy for the company given opportunities to take advantage of improving monetization and its ultimate goal to return to overall Y/Y growth.
What to look for in 2014: 1) Resuming growth in Financial Services vertical, including strength from Auto Insurance and Mortgages; 2) Stabilization of Education revenue, including product, media, and clients expansion, and growth in Brazil and India; 3) Mobile optimization initiatives with clients and resulting mobile-driven revenue across verticals; 4) Increased media spend impacting near-term profitability.
Price target of $8. Our 2014 year-end price target of $8 is based on 12x CY15E PF EPS of $0.64, which translates to 5x CY15E EBITDA of $49.8M. Given the company’s ongoing business challenges, lack of visibility and lower growth profile, we believe this multiple is appropriate as we think QNST should trade at a substantial discount to the broader Internet space and its peers such as Bankrate (for which we base our price target on ~18x 2015E EPS).
Maintaining Estimates
We’re maintaining our estimates for QuinStreet, as seen in the table below.
Figure 42: JPM Estimates vs. Consensus
$ in millions, except per share data
J.P. Morgan Estimates 2QFY14 3QFY14 4QFY14 FY2014E FY2015E
($ in millions, except per share data)
Total Revenue 68.6 78.4 77.1 301.0 322.1
Y/Y Growth -4.5% -0.8% 1.9% -1.3% 7.0%
Education 30.2 33.5 32.6 129.3 134.2
Y/Y Growth -7.6% -5.0% -1.0% -4.6% 3.8%
Financial Services 27.3 33.6 33.2 125.9 141.0
Y/Y Growth 3.2% 4.5% 6.0% 4.7% 12.0%
Other 11.0 11.3 11.3 45.8 46.9
Y/Y Growth -12.4% -3.0% -1.0% -7.2% 2.3%
Adjusted EBITDA 7.0 9.9 11.6 38.1 46.7
Y/Y Growth -37.7% -20.4% -5.0% -20.3% 22.4%
% Margin 10.2% 12.6% 15.1% 12.7% 14.5%
PF EPS $0.07 $0.10 $0.12 $0.40 $0.61
Y/Y Growth -42.8% -37.4% -14.8% -78.7% 53.7%
Consensus
Total Revenue 79.5 77.5 79.3 302.8 313.4
Adjusted EBITDA 9.9 10.9 11.4 36.2 43.1
Pro forma EPS $0.10 $0.12 $0.13 $0.42 $0.53
Source: J.P. Morgan estimates, Company data.
137
North America Equity Research09 January 2014
Doug Anmuth(1-212) [email protected]
Investment Thesis, Valuation and Risks
QuinStreet, Inc. (Neutral; Price Target: $8.00)
Investment Thesis
We maintain our Neutral rating on QuinStreet. We continue to believe QuinStreet could see healthy longer-term growth, but concerns around visibility and ongoing challenges in Education and Financial Services should keep the stock range-bound in the near term. We remain on the sidelines and look for increased visibility around improving trends.
Valuation
Maintain $8 price target. Our 2014 year-end price target of $8 is based on 12x CY15E PF EPS of $0.64, which translates to 5x CY15E EBITDA of $49.8M. Given the company’s ongoing business challenges, lack of visibility and lower growth profile, we believe this multiple is appropriate as we think QNST should trade at a substantial discount to the broader Internet space and its peers such as Bankrate (for which we base our price target based on ~18x 2015E EPS).
Risks to Rating and Price TargetUpside risks include: 1) volume improvement in the auto insurance industry occurring more quickly than we expect; 2) the company seeing a rapid increase in revenue from a major client; 3) click demand across the internet increasing more thanwe anticipate; and 4) other verticals becoming a meaningful contributor to growth more quickly than we project.
Downside risks include: 1) changes in regulations or government actions negatively impacting QuinStreet clients’ marketing practices and budgets; 2) pricing pressure from auto insurance competitors providing lower-quality clicks persisting longer than we anticipate; 3) the company seeing a rapid decline in revenue from a major client; and 4) changes in the way search engines rank pages within search results.
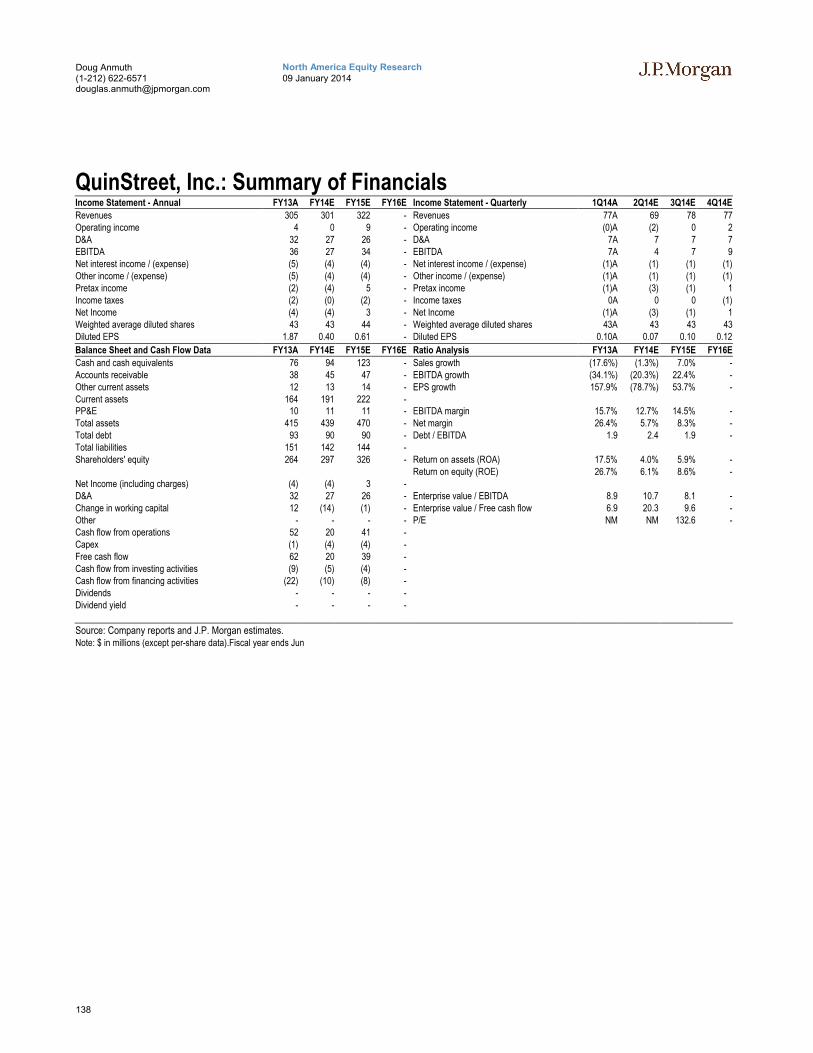
138
North America Equity Research09 January 2014
Doug Anmuth(1-212) [email protected]
QuinStreet, Inc.: Summary of FinancialsIncome Statement - Annual FY13A FY14E FY15E FY16E Income Statement - Quarterly 1Q14A 2Q14E 3Q14E 4Q14E
Revenues 305 301 322 - Revenues 77A 69 78 77Operating income 4 0 9 - Operating income (0)A (2) 0 2D&A 32 27 26 - D&A 7A 7 7 7EBITDA 36 27 34 - EBITDA 7A 4 7 9Net interest income / (expense) (5) (4) (4) - Net interest income / (expense) (1)A (1) (1) (1)Other income / (expense) (5) (4) (4) - Other income / (expense) (1)A (1) (1) (1)Pretax income (2) (4) 5 - Pretax income (1)A (3) (1) 1Income taxes (2) (0) (2) - Income taxes 0A 0 0 (1)Net Income (4) (4) 3 - Net Income (1)A (3) (1) 1Weighted average diluted shares 43 43 44 - Weighted average diluted shares 43A 43 43 43Diluted EPS 1.87 0.40 0.61 - Diluted EPS 0.10A 0.07 0.10 0.12
Balance Sheet and Cash Flow Data FY13A FY14E FY15E FY16E Ratio Analysis FY13A FY14E FY15E FY16E
Cash and cash equivalents 76 94 123 - Sales growth (17.6%) (1.3%) 7.0% -Accounts receivable 38 45 47 - EBITDA growth (34.1%) (20.3%) 22.4% -Other current assets 12 13 14 - EPS growth 157.9% (78.7%) 53.7% -Current assets 164 191 222 -PP&E 10 11 11 - EBITDA margin 15.7% 12.7% 14.5% -Total assets 415 439 470 - Net margin 26.4% 5.7% 8.3% -Total debt 93 90 90 - Debt / EBITDA 1.9 2.4 1.9 -Total liabilities 151 142 144 -Shareholders' equity 264 297 326 - Return on assets (ROA) 17.5% 4.0% 5.9% -
Return on equity (ROE) 26.7% 6.1% 8.6% -Net Income (including charges) (4) (4) 3 -D&A 32 27 26 - Enterprise value / EBITDA 8.9 10.7 8.1 -Change in working capital 12 (14) (1) - Enterprise value / Free cash flow 6.9 20.3 9.6 -Other - - - - P/E NM NM 132.6 -Cash flow from operations 52 20 41 -Capex (1) (4) (4) -Free cash flow 62 20 39 -Cash flow from investing activities (9) (5) (4) -Cash flow from financing activities (22) (10) (8) -Dividends - - - -Dividend yield - - - -
Source: Company reports and J.P. Morgan estimates.Note: $ in millions (except per-share data).Fiscal year ends Jun
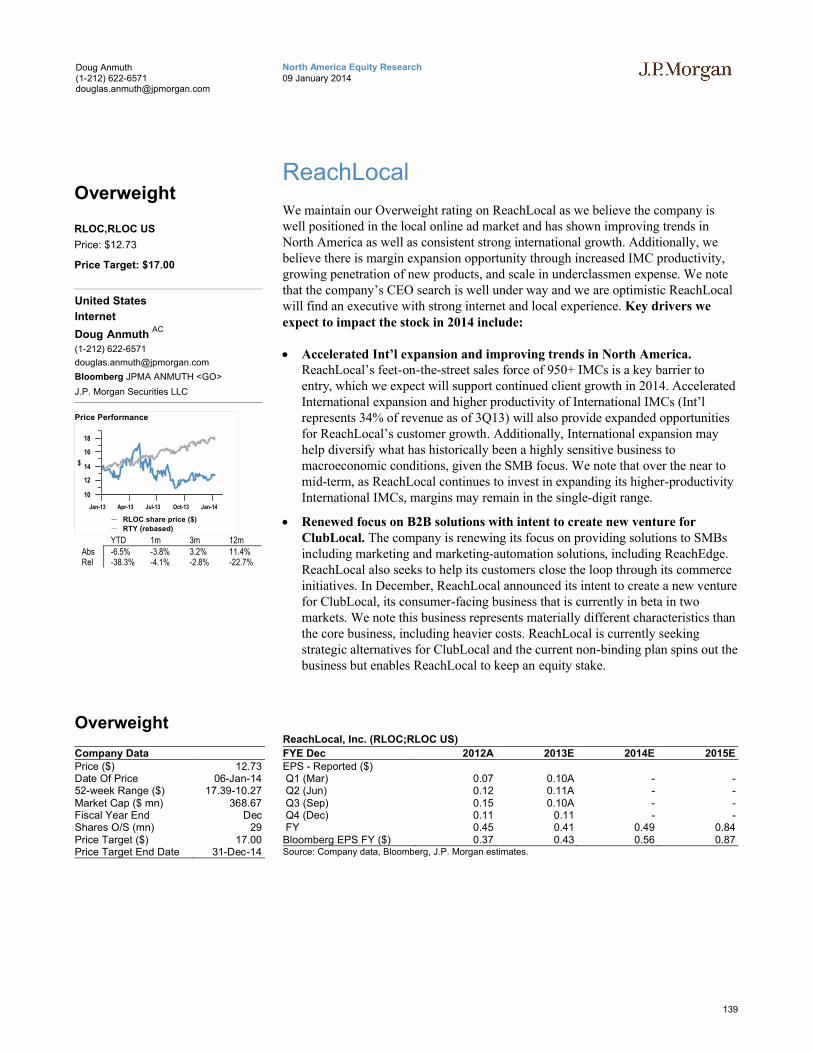
139
North America Equity Research09 January 2014
Doug Anmuth(1-212) [email protected]
ReachLocal
We maintain our Overweight rating on ReachLocal as we believe the company is well positioned in the local online ad market and has shown improving trends in North America as well as consistent strong international growth. Additionally, we believe there is margin expansion opportunity through increased IMC productivity, growing penetration of new products, and scale in underclassmen expense. We note that the company’s CEO search is well under way and we are optimistic ReachLocal will find an executive with strong internet and local experience. Key drivers we expect to impact the stock in 2014 include:
Accelerated Int’l expansion and improving trends in North America. ReachLocal’s feet-on-the-street sales force of 950+ IMCs is a key barrier to entry, which we expect will support continued client growth in 2014. Accelerated International expansion and higher productivity of International IMCs (Int’l represents 34% of revenue as of 3Q13) will also provide expanded opportunities for ReachLocal’s customer growth. Additionally, International expansion may help diversify what has historically been a highly sensitive business to macroeconomic conditions, given the SMB focus. We note that over the near to mid-term, as ReachLocal continues to invest in expanding its higher-productivity International IMCs, margins may remain in the single-digit range.
Renewed focus on B2B solutions with intent to create new venture for ClubLocal. The company is renewing its focus on providing solutions to SMBs including marketing and marketing-automation solutions, including ReachEdge. ReachLocal also seeks to help its customers close the loop through its commerce initiatives. In December, ReachLocal announced its intent to create a new venture for ClubLocal, its consumer-facing business that is currently in beta in two markets. We note this business represents materially different characteristics thanthe core business, including heavier costs. ReachLocal is currently seeking strategic alternatives for ClubLocal and the current non-binding plan spins out the business but enables ReachLocal to keep an equity stake.
Overweight
Company DataPrice ($) 12.73Date Of Price 06-Jan-1452-week Range ($) 17.39-10.27Market Cap ($ mn) 368.67Fiscal Year End DecShares O/S (mn) 29Price Target ($) 17.00Price Target End Date 31-Dec-14
ReachLocal, Inc. (RLOC;RLOC US)
FYE Dec 2012A 2013E 2014E 2015EEPS - Reported ($)Q1 (Mar) 0.07 0.10A - -Q2 (Jun) 0.12 0.11A - -Q3 (Sep) 0.15 0.10A - -Q4 (Dec) 0.11 0.11 - -FY 0.45 0.41 0.49 0.84Bloomberg EPS FY ($) 0.37 0.43 0.56 0.87Source: Company data, Bloomberg, J.P. Morgan estimates.
Overweight
RLOC,RLOC US
Price: $12.73
Price Target: $17.00
United States
Internet
Doug Anmuth AC
(1-212) 622-6571
Bloomberg JPMA ANMUTH <GO>
J.P. Morgan Securities LLC
10
12
14
16
18
$
Jan-13 Apr-13 Jul-13 Oct-13 Jan-14
Price Performance
RLOC share price ($)
RTY (rebased)
YTD 1m 3m 12mAbs -6.5% -3.8% 3.2% 11.4%Rel -38.3% -4.1% -2.8% -22.7%
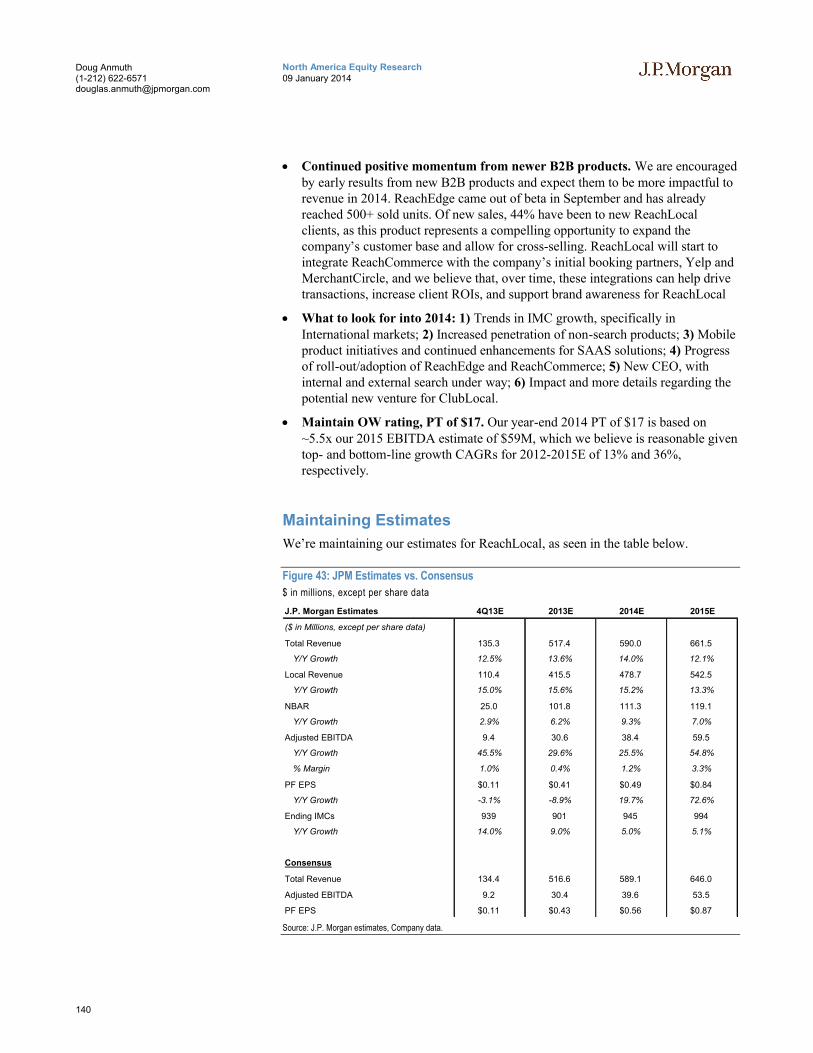
140
North America Equity Research09 January 2014
Doug Anmuth(1-212) [email protected]
Continued positive momentum from newer B2B products. We are encouraged by early results from new B2B products and expect them to be more impactful to revenue in 2014. ReachEdge came out of beta in September and has already reached 500+ sold units. Of new sales, 44% have been to new ReachLocal clients, as this product represents a compelling opportunity to expand the company’s customer base and allow for cross-selling. ReachLocal will start to integrate ReachCommerce with the company’s initial booking partners, Yelp and MerchantCircle, and we believe that, over time, these integrations can help drive transactions, increase client ROIs, and support brand awareness for ReachLocal
What to look for into 2014: 1) Trends in IMC growth, specifically in International markets; 2) Increased penetration of non-search products; 3) Mobile product initiatives and continued enhancements for SAAS solutions; 4) Progress of roll-out/adoption of ReachEdge and ReachCommerce; 5) New CEO, with internal and external search under way; 6) Impact and more details regarding the potential new venture for ClubLocal.
Maintain OW rating, PT of $17. Our year-end 2014 PT of $17 is based on ~5.5x our 2015 EBITDA estimate of $59M, which we believe is reasonable given top- and bottom-line growth CAGRs for 2012-2015E of 13% and 36%, respectively.
Maintaining Estimates
We’re maintaining our estimates for ReachLocal, as seen in the table below.
Figure 43: JPM Estimates vs. Consensus
$ in millions, except per share data
J.P. Morgan Estimates 4Q13E 2013E 2014E 2015E
($ in Millions, except per share data)
Total Revenue 135.3 517.4 590.0 661.5
Y/Y Growth 12.5% 13.6% 14.0% 12.1%
Local Revenue 110.4 415.5 478.7 542.5
Y/Y Growth 15.0% 15.6% 15.2% 13.3%
NBAR 25.0 101.8 111.3 119.1
Y/Y Growth 2.9% 6.2% 9.3% 7.0%
Adjusted EBITDA 9.4 30.6 38.4 59.5
Y/Y Growth 45.5% 29.6% 25.5% 54.8%
% Margin 1.0% 0.4% 1.2% 3.3%
PF EPS $0.11 $0.41 $0.49 $0.84
Y/Y Growth -3.1% -8.9% 19.7% 72.6%
Ending IMCs 939 901 945 994
Y/Y Growth 14.0% 9.0% 5.0% 5.1%
Consensus
Total Revenue 134.4 516.6 589.1 646.0
Adjusted EBITDA 9.2 30.4 39.6 53.5
PF EPS $0.11 $0.43 $0.56 $0.87
Source: J.P. Morgan estimates, Company data.
141
North America Equity Research09 January 2014
Doug Anmuth(1-212) [email protected]
Investment Thesis, Valuation and Risks
ReachLocal (Overweight; Price Target: $17.00)
Investment Thesis
We believe ReachLocal is well positioned in the local online ad market and has shown strong trends in international growth. Additionally, we believe there is a margin expansion opportunity through increased IMC productivity, growing penetration of new products, and scale in underclassmen expense.
Valuation
Maintain OW rating, PT of $17. Our year-end 2014 PT of $17 is based on ~5.5x our 2015 EBITDA estimate of $59M, which we believe is reasonable given top- and bottom-line growth CAGRs for 2012-2015E of 13% and 36%, respectively.
Risks to Rating and Price Target
Downside risks include: 1) the company failing to adequately recruit, train, and retain its internet marketing consultants; 2) Google and, to a lesser extent, Yahoo!, MSN et al, taking actions that are adverse to the company’s interests; 3) SMBs increasingly opting to perform advertising tasks on their own or go directly to Internet search engines and publishers; 4) the company failing to increase the number of its clients or to retain existing SMB clients; 5) the company being unable to maintain relationships with its national brands, agencies, or resellers; 6) the pricing of the advertising media that the company purchases on behalf of its clients risingfaster than expected, putting pressure on profitability; and 7) the economic situation worsening, jeopardizing the ability of ReachLocal’s clients to increase or maintain advertising spend.
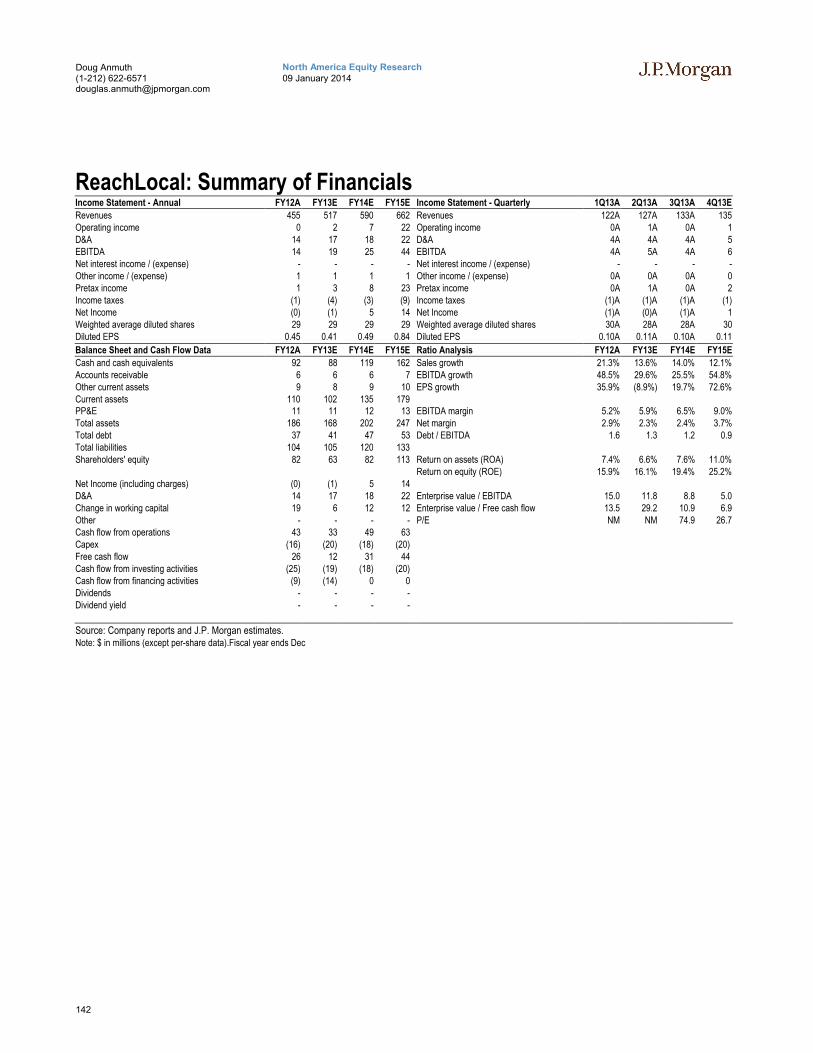
142
North America Equity Research09 January 2014
Doug Anmuth(1-212) [email protected]
ReachLocal: Summary of FinancialsIncome Statement - Annual FY12A FY13E FY14E FY15E Income Statement - Quarterly 1Q13A 2Q13A 3Q13A 4Q13E
Revenues 455 517 590 662 Revenues 122A 127A 133A 135Operating income 0 2 7 22 Operating income 0A 1A 0A 1D&A 14 17 18 22 D&A 4A 4A 4A 5EBITDA 14 19 25 44 EBITDA 4A 5A 4A 6Net interest income / (expense) - - - - Net interest income / (expense) - - - -Other income / (expense) 1 1 1 1 Other income / (expense) 0A 0A 0A 0Pretax income 1 3 8 23 Pretax income 0A 1A 0A 2Income taxes (1) (4) (3) (9) Income taxes (1)A (1)A (1)A (1)Net Income (0) (1) 5 14 Net Income (1)A (0)A (1)A 1Weighted average diluted shares 29 29 29 29 Weighted average diluted shares 30A 28A 28A 30Diluted EPS 0.45 0.41 0.49 0.84 Diluted EPS 0.10A 0.11A 0.10A 0.11
Balance Sheet and Cash Flow Data FY12A FY13E FY14E FY15E Ratio Analysis FY12A FY13E FY14E FY15E
Cash and cash equivalents 92 88 119 162 Sales growth 21.3% 13.6% 14.0% 12.1%Accounts receivable 6 6 6 7 EBITDA growth 48.5% 29.6% 25.5% 54.8%Other current assets 9 8 9 10 EPS growth 35.9% (8.9%) 19.7% 72.6%Current assets 110 102 135 179PP&E 11 11 12 13 EBITDA margin 5.2% 5.9% 6.5% 9.0%Total assets 186 168 202 247 Net margin 2.9% 2.3% 2.4% 3.7%Total debt 37 41 47 53 Debt / EBITDA 1.6 1.3 1.2 0.9Total liabilities 104 105 120 133Shareholders' equity 82 63 82 113 Return on assets (ROA) 7.4% 6.6% 7.6% 11.0%
Return on equity (ROE) 15.9% 16.1% 19.4% 25.2%Net Income (including charges) (0) (1) 5 14D&A 14 17 18 22 Enterprise value / EBITDA 15.0 11.8 8.8 5.0Change in working capital 19 6 12 12 Enterprise value / Free cash flow 13.5 29.2 10.9 6.9Other - - - - P/E NM NM 74.9 26.7Cash flow from operations 43 33 49 63Capex (16) (20) (18) (20)Free cash flow 26 12 31 44Cash flow from investing activities (25) (19) (18) (20)Cash flow from financing activities (9) (14) 0 0Dividends - - - -Dividend yield - - - -
Source: Company reports and J.P. Morgan estimates.Note: $ in millions (except per-share data).Fiscal year ends Dec
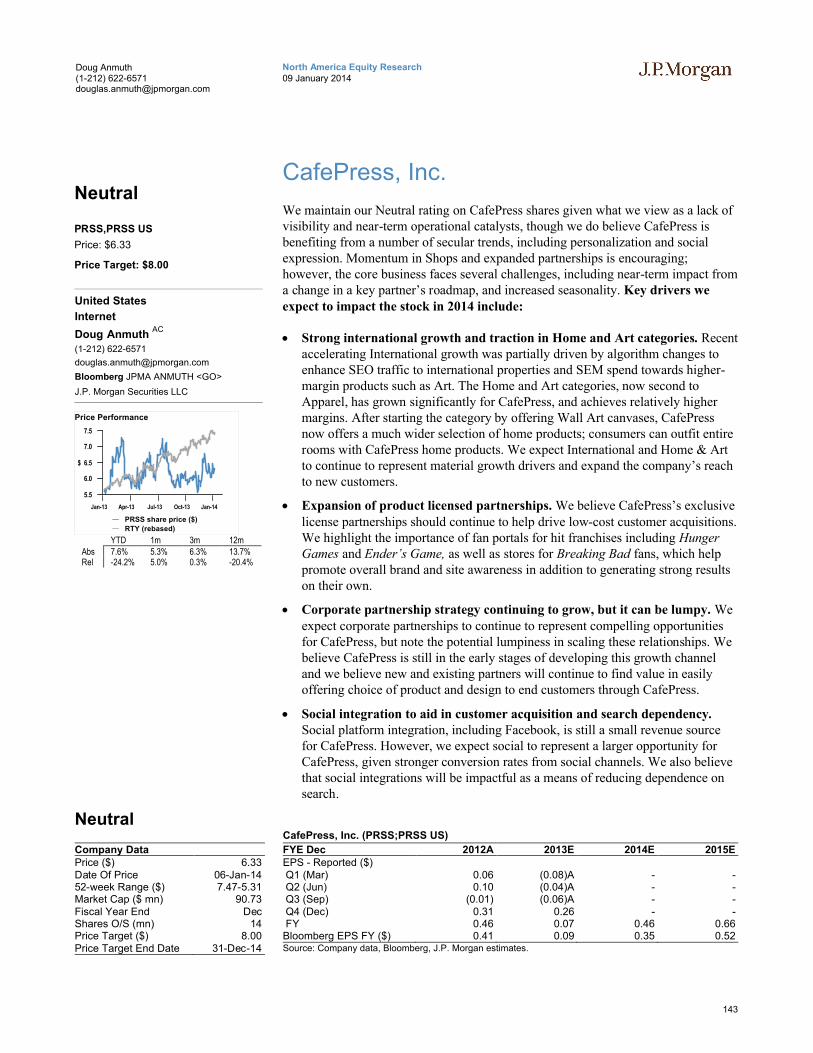
143
North America Equity Research09 January 2014
Doug Anmuth(1-212) [email protected]
CafePress, Inc.
We maintain our Neutral rating on CafePress shares given what we view as a lack of visibility and near-term operational catalysts, though we do believe CafePress is benefiting from a number of secular trends, including personalization and social expression. Momentum in Shops and expanded partnerships is encouraging; however, the core business faces several challenges, including near-term impact from a change in a key partner’s roadmap, and increased seasonality. Key drivers we expect to impact the stock in 2014 include:
Strong international growth and traction in Home and Art categories. Recentaccelerating International growth was partially driven by algorithm changes to enhance SEO traffic to international properties and SEM spend towards higher-margin products such as Art. The Home and Art categories, now second to Apparel, has grown significantly for CafePress, and achieves relatively higher margins. After starting the category by offering Wall Art canvases, CafePress now offers a much wider selection of home products; consumers can outfit entire rooms with CafePress home products. We expect International and Home & Art to continue to represent material growth drivers and expand the company’s reach to new customers.
Expansion of product licensed partnerships. We believe CafePress’s exclusive license partnerships should continue to help drive low-cost customer acquisitions. We highlight the importance of fan portals for hit franchises including Hunger Games and Ender’s Game, as well as stores for Breaking Bad fans, which help promote overall brand and site awareness in addition to generating strong results on their own.
Corporate partnership strategy continuing to grow, but it can be lumpy. We expect corporate partnerships to continue to represent compelling opportunities for CafePress, but note the potential lumpiness in scaling these relationships. We believe CafePress is still in the early stages of developing this growth channel and we believe new and existing partners will continue to find value in easily offering choice of product and design to end customers through CafePress.
Social integration to aid in customer acquisition and search dependency. Social platform integration, including Facebook, is still a small revenue sourcefor CafePress. However, we expect social to represent a larger opportunity for CafePress, given stronger conversion rates from social channels. We also believe that social integrations will be impactful as a means of reducing dependence on search.
Neutral
Company DataPrice ($) 6.33Date Of Price 06-Jan-1452-week Range ($) 7.47-5.31Market Cap ($ mn) 90.73Fiscal Year End DecShares O/S (mn) 14Price Target ($) 8.00Price Target End Date 31-Dec-14
CafePress, Inc. (PRSS;PRSS US)
FYE Dec 2012A 2013E 2014E 2015EEPS - Reported ($)Q1 (Mar) 0.06 (0.08)A - -Q2 (Jun) 0.10 (0.04)A - -Q3 (Sep) (0.01) (0.06)A - -Q4 (Dec) 0.31 0.26 - -FY 0.46 0.07 0.46 0.66Bloomberg EPS FY ($) 0.41 0.09 0.35 0.52Source: Company data, Bloomberg, J.P. Morgan estimates.
Neutral
PRSS,PRSS US
Price: $6.33
Price Target: $8.00
United States
Internet
Doug Anmuth AC
(1-212) 622-6571
Bloomberg JPMA ANMUTH <GO>
J.P. Morgan Securities LLC
5.5
6.0
6.5
7.0
7.5
$
Jan-13 Apr-13 Jul-13 Oct-13 Jan-14
Price Performance
PRSS share price ($)
RTY (rebased)
YTD 1m 3m 12mAbs 7.6% 5.3% 6.3% 13.7%Rel -24.2% 5.0% 0.3% -20.4%
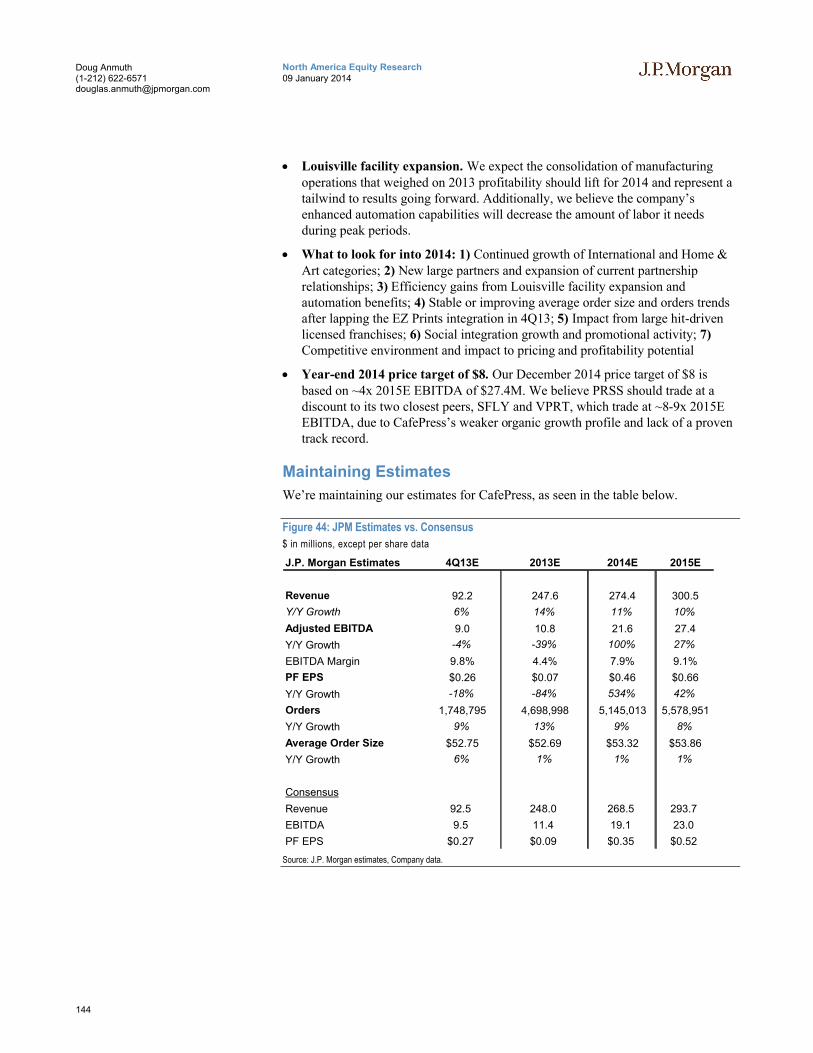
144
North America Equity Research09 January 2014
Doug Anmuth(1-212) [email protected]
Louisville facility expansion. We expect the consolidation of manufacturing operations that weighed on 2013 profitability should lift for 2014 and represent a tailwind to results going forward. Additionally, we believe the company’s enhanced automation capabilities will decrease the amount of labor it needs during peak periods.
What to look for into 2014: 1) Continued growth of International and Home & Art categories; 2) New large partners and expansion of current partnership relationships; 3) Efficiency gains from Louisville facility expansion and automation benefits; 4) Stable or improving average order size and orders trends after lapping the EZ Prints integration in 4Q13; 5) Impact from large hit-driven licensed franchises; 6) Social integration growth and promotional activity; 7) Competitive environment and impact to pricing and profitability potential
Year-end 2014 price target of $8. Our December 2014 price target of $8 is based on ~4x 2015E EBITDA of $27.4M. We believe PRSS should trade at a discount to its two closest peers, SFLY and VPRT, which trade at ~8-9x 2015E EBITDA, due to CafePress’s weaker organic growth profile and lack of a proven track record.
Maintaining Estimates
We’re maintaining our estimates for CafePress, as seen in the table below.
Figure 44: JPM Estimates vs. Consensus
$ in millions, except per share data
J.P. Morgan Estimates 4Q13E 2013E 2014E 2015E
Revenue 92.2 247.6 274.4 300.5
Y/Y Growth 6% 14% 11% 10%
Adjusted EBITDA 9.0 10.8 21.6 27.4
Y/Y Growth -4% -39% 100% 27%
EBITDA Margin 9.8% 4.4% 7.9% 9.1%
PF EPS $0.26 $0.07 $0.46 $0.66
Y/Y Growth -18% -84% 534% 42%
Orders 1,748,795 4,698,998 5,145,013 5,578,951
Y/Y Growth 9% 13% 9% 8%
Average Order Size $52.75 $52.69 $53.32 $53.86
Y/Y Growth 6% 1% 1% 1%
Consensus
Revenue 92.5 248.0 268.5 293.7
EBITDA 9.5 11.4 19.1 23.0
PF EPS $0.27 $0.09 $0.35 $0.52
Source: J.P. Morgan estimates, Company data.
145
North America Equity Research09 January 2014
Doug Anmuth(1-212) [email protected]
Investment Thesis, Valuation and Risks
CafePress, Inc. (Neutral; Price Target: $8.00)
Investment Thesis
Neutral rating. We believe CafePress is benefiting from a number of secular trends,including personalization and social expression. However, the core business faces several challenges, including the integration of EZ Prints, the mix shift of products resetting the levels of orders and AOS going forward, increased seasonality, and margin pressures from the consolidation of manufacturing operations.
Valuation
Year-end 2014 PT of $8. Our December 2014 price target of $8 is based on ~4x 2015E EBITDA of $27.4M. We believe PRSS should trade at a discount to its two closest peers, SFLY and VPRT, which trade at ~7-8x 2015E EBITDA, due to CafePress’s weaker organic growth profile and lack of a proven track record.
Risks to Rating and Price Target
Upside risks include: 1) EZ Prints turnaround of Shops growth; 2) greater-than-expected contributions from the Logo and Invitation Box acquisitions; 3) higher-than-expected customer conversions/repeat rates from promotional efforts; 4) a rebound in macro trends and traffic in international markets; and 5) materially higher AOS from product mix and increased pricing.
Downside risks include: 1) increased competitive offerings and pricing pressures, particularly in the art and stationery product categories; 2) seasonality and cyclicality causing fluctuations in results; 3) a slowdown in the broader economic environment leading to reduced order volumes; 4) an inability to fulfill orders, damaging the CafePress brand; and 5) controversial user-generated content that generates negative press.
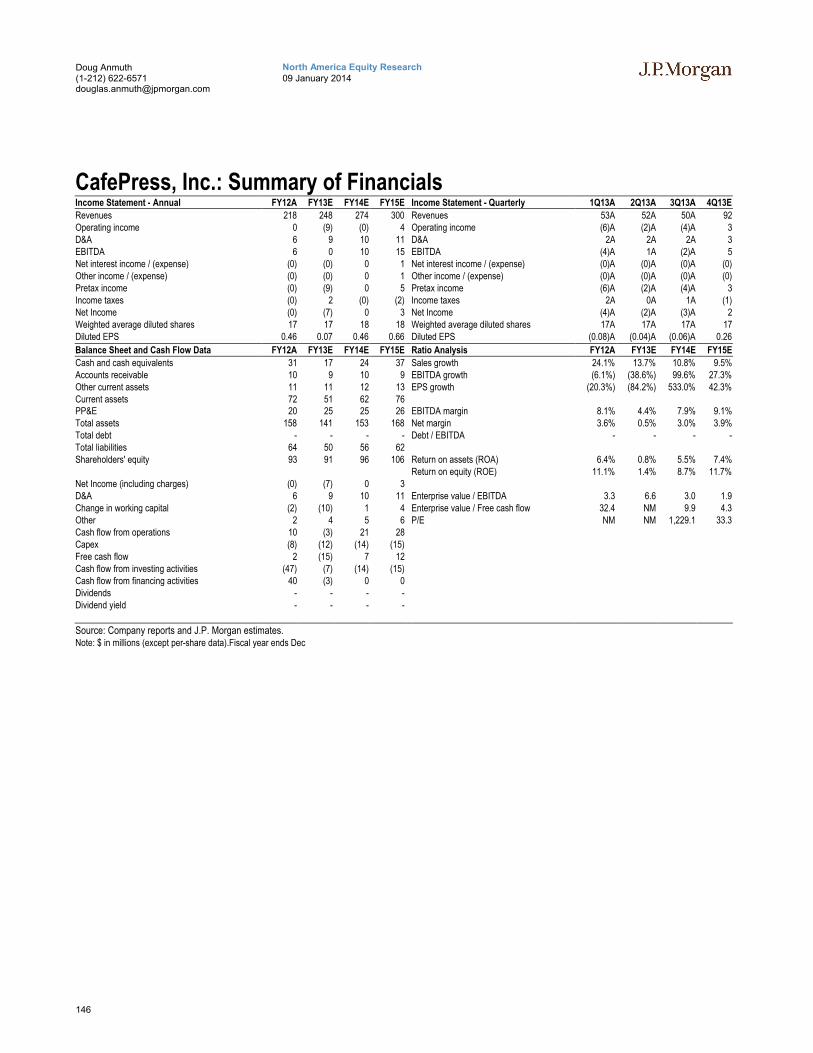
146
North America Equity Research09 January 2014
Doug Anmuth(1-212) [email protected]
CafePress, Inc.: Summary of FinancialsIncome Statement - Annual FY12A FY13E FY14E FY15E Income Statement - Quarterly 1Q13A 2Q13A 3Q13A 4Q13E
Revenues 218 248 274 300 Revenues 53A 52A 50A 92Operating income 0 (9) (0) 4 Operating income (6)A (2)A (4)A 3D&A 6 9 10 11 D&A 2A 2A 2A 3EBITDA 6 0 10 15 EBITDA (4)A 1A (2)A 5Net interest income / (expense) (0) (0) 0 1 Net interest income / (expense) (0)A (0)A (0)A (0)Other income / (expense) (0) (0) 0 1 Other income / (expense) (0)A (0)A (0)A (0)Pretax income (0) (9) 0 5 Pretax income (6)A (2)A (4)A 3Income taxes (0) 2 (0) (2) Income taxes 2A 0A 1A (1)Net Income (0) (7) 0 3 Net Income (4)A (2)A (3)A 2Weighted average diluted shares 17 17 18 18 Weighted average diluted shares 17A 17A 17A 17Diluted EPS 0.46 0.07 0.46 0.66 Diluted EPS (0.08)A (0.04)A (0.06)A 0.26
Balance Sheet and Cash Flow Data FY12A FY13E FY14E FY15E Ratio Analysis FY12A FY13E FY14E FY15E
Cash and cash equivalents 31 17 24 37 Sales growth 24.1% 13.7% 10.8% 9.5%Accounts receivable 10 9 10 9 EBITDA growth (6.1%) (38.6%) 99.6% 27.3%Other current assets 11 11 12 13 EPS growth (20.3%) (84.2%) 533.0% 42.3%Current assets 72 51 62 76PP&E 20 25 25 26 EBITDA margin 8.1% 4.4% 7.9% 9.1%Total assets 158 141 153 168 Net margin 3.6% 0.5% 3.0% 3.9%Total debt - - - - Debt / EBITDA - - - -Total liabilities 64 50 56 62Shareholders' equity 93 91 96 106 Return on assets (ROA) 6.4% 0.8% 5.5% 7.4%
Return on equity (ROE) 11.1% 1.4% 8.7% 11.7%Net Income (including charges) (0) (7) 0 3D&A 6 9 10 11 Enterprise value / EBITDA 3.3 6.6 3.0 1.9Change in working capital (2) (10) 1 4 Enterprise value / Free cash flow 32.4 NM 9.9 4.3Other 2 4 5 6 P/E NM NM 1,229.1 33.3Cash flow from operations 10 (3) 21 28Capex (8) (12) (14) (15)Free cash flow 2 (15) 7 12Cash flow from investing activities (47) (7) (14) (15)Cash flow from financing activities 40 (3) 0 0Dividends - - - -Dividend yield - - - -
Source: Company reports and J.P. Morgan estimates.Note: $ in millions (except per-share data).Fiscal year ends Dec
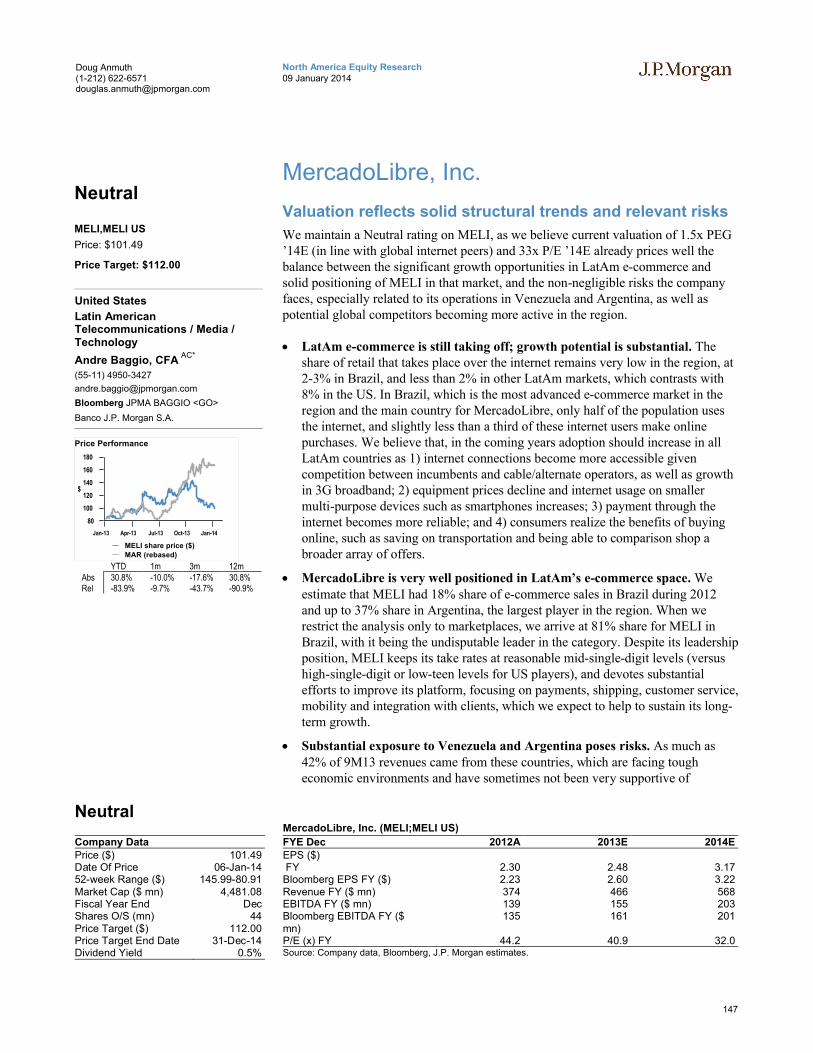
147
North America Equity Research09 January 2014
Doug Anmuth(1-212) [email protected]
MercadoLibre, Inc.
Valuation reflects solid structural trends and relevant risks
We maintain a Neutral rating on MELI, as we believe current valuation of 1.5x PEG ’14E (in line with global internet peers) and 33x P/E ’14E already prices well the balance between the significant growth opportunities in LatAm e-commerce and solid positioning of MELI in that market, and the non-negligible risks the company faces, especially related to its operations in Venezuela and Argentina, as well as potential global competitors becoming more active in the region.
LatAm e-commerce is still taking off; growth potential is substantial. The share of retail that takes place over the internet remains very low in the region, at 2-3% in Brazil, and less than 2% in other LatAm markets, which contrasts with 8% in the US. In Brazil, which is the most advanced e-commerce market in the region and the main country for MercadoLibre, only half of the population uses the internet, and slightly less than a third of these internet users make online purchases. We believe that, in the coming years adoption should increase in all LatAm countries as 1) internet connections become more accessible given competition between incumbents and cable/alternate operators, as well as growth in 3G broadband; 2) equipment prices decline and internet usage on smaller multi-purpose devices such as smartphones increases; 3) payment through the internet becomes more reliable; and 4) consumers realize the benefits of buying online, such as saving on transportation and being able to comparison shop a broader array of offers.
MercadoLibre is very well positioned in LatAm’s e-commerce space. We estimate that MELI had 18% share of e-commerce sales in Brazil during 2012 and up to 37% share in Argentina, the largest player in the region. When we restrict the analysis only to marketplaces, we arrive at 81% share for MELI in Brazil, with it being the undisputable leader in the category. Despite its leadership position, MELI keeps its take rates at reasonable mid-single-digit levels (versus high-single-digit or low-teen levels for US players), and devotes substantial efforts to improve its platform, focusing on payments, shipping, customer service, mobility and integration with clients, which we expect to help to sustain its long-term growth.
Substantial exposure to Venezuela and Argentina poses risks. As much as 42% of 9M13 revenues came from these countries, which are facing tough economic environments and have sometimes not been very supportive of
Neutral
Company DataPrice ($) 101.49Date Of Price 06-Jan-1452-week Range ($) 145.99-80.91Market Cap ($ mn) 4,481.08Fiscal Year End DecShares O/S (mn) 44Price Target ($) 112.00Price Target End Date 31-Dec-14Dividend Yield 0.5%
MercadoLibre, Inc. (MELI;MELI US)
FYE Dec 2012A 2013E 2014EEPS ($)FY 2.30 2.48 3.17Bloomberg EPS FY ($) 2.23 2.60 3.22Revenue FY ($ mn) 374 466 568EBITDA FY ($ mn) 139 155 203Bloomberg EBITDA FY ($ mn)
135 161 201
P/E (x) FY 44.2 40.9 32.0Source: Company data, Bloomberg, J.P. Morgan estimates.
Neutral
MELI,MELI US
Price: $101.49
Price Target: $112.00
United States
Latin American Telecommunications / Media / Technology
Andre Baggio, CFA AC*
(55-11) 4950-3427
Bloomberg JPMA BAGGIO <GO>
Banco J.P. Morgan S.A.
80
100
120
140
160
180
$
Jan-13 Apr-13 Jul-13 Oct-13 Jan-14
Price Performance
MELI share price ($)
MAR (rebased)
YTD 1m 3m 12mAbs 30.8% -10.0% -17.6% 30.8%Rel -83.9% -9.7% -43.7% -90.9%
148
North America Equity Research09 January 2014
Doug Anmuth(1-212) [email protected]
businesses. In Venezuela, for example, President Maduro has nominally criticized MercadoLibre’s websites on national television, and the government has introduced restrictions on the sale of new cars on the company’s platforms. Also, both countries have introduced capital controls, limiting substantially the ability of companies to send resources abroad. FX quotes in parallel markets point to high devaluation risks for the local currencies in these countries, with the parallel ARS suggesting 34% devaluation risk, while parallel VEF indicates as much as 90% devaluation potential. The potential impact of FX devaluation on EPS would be higher for Venezuela than Argentina, as MELI has substantial indirect costs denominated in ARS which offset revenues generated in that country, thus contributing to a near-zero estimated exposure to ARS for MELI.
Higher competition from global players is a threat to earnings growth. To date, MELI has faced limited competition in its core marketplace business, allowing it to capture most market growth without pressure on its profitability. Nevertheless, competitors are slowly entering the LatAm market, and a step-up in their efforts could have a negative impact on MELI. thus far, 1) Amazon has launched its e-book operations both in Brazil and Mexico; 2) eBay is already a leading player in electronic payments through PayPal, and has recently launched a mobile app focused on fashion items, with little competitive overlap with MELI to date; and 3) Rakuten operates a marketplace in Brazil following the acquisition of Ikeda in 2011, but growth has been slow.
Investment Thesis, Valuation and Risks
MercadoLibre, Inc. (Neutral; Price Target: $112.00)
Investment Thesis
We rate MELI Neutral, as we believe current valuation reflects well the balance of substantial growth opportunities in LatAm e-commerce with risks associated with currency devaluation, increased competition and economic weakness in the region.
Valuation
Our Dec-14 price target of $112 is based on a 50/50 mix of: 1) a DCF-based model ($113) employing 10.4% WACC in US$ nominal terms for non-Venezuelan cash flow, 19.4% WACC for Venezuela cash flows converted using parallel currency, and 3% perpetuity growth in real terms; and 2) a relative valuation model ($110), assuming MELI ex-Venezuela would trade at 1.5x PEG, in line with internet peers, while Venezuelan operations would trade at 19x estimated earnings (half of P/E multiple for other operations) calculated using parallel exchange rates.
Risks to Rating and Price Target
Upside risks include: 1) acceleration of top-line growth as a result of some of the new initiatives being implemented, such as Pago growth, logistics, fulfillment, customer center improvements, and mobility among others; 2) off-platform Pago becoming more relevant; and 3) higher-than-expected scale gains.
Downside risks include: 1) increased competition leading to compression in take rates; 2) devaluation in local currencies; 3) lower-than-expected internet growth in LatAm; 4) increased regulatory oversight for MercadoLibre or MercadoPago; 5) political instability in the countries in which MercadoLibre operates; 6) LatAm macroeconomic weakness affecting consumer behavior negatively; and 7) government intervention in MercadoLibre business model.
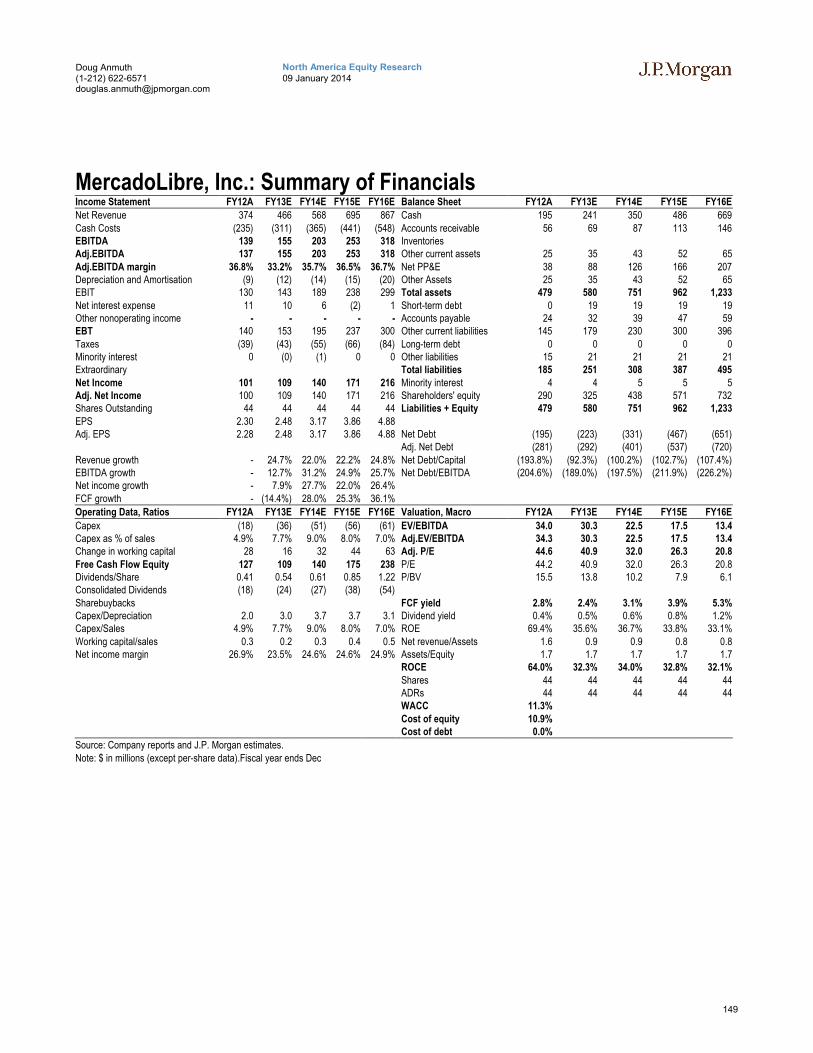
149
North America Equity Research09 January 2014
Doug Anmuth(1-212) [email protected]
MercadoLibre, Inc.: Summary of FinancialsIncome Statement FY12A FY13E FY14E FY15E FY16E Balance Sheet FY12A FY13E FY14E FY15E FY16E
Net Revenue 374 466 568 695 867 Cash 195 241 350 486 669Cash Costs (235) (311) (365) (441) (548) Accounts receivable 56 69 87 113 146EBITDA 139 155 203 253 318 InventoriesAdj.EBITDA 137 155 203 253 318 Other current assets 25 35 43 52 65Adj.EBITDA margin 36.8% 33.2% 35.7% 36.5% 36.7% Net PP&E 38 88 126 166 207Depreciation and Amortisation (9) (12) (14) (15) (20) Other Assets 25 35 43 52 65EBIT 130 143 189 238 299 Total assets 479 580 751 962 1,233Net interest expense 11 10 6 (2) 1 Short-term debt 0 19 19 19 19Other nonoperating income - - - - - Accounts payable 24 32 39 47 59EBT 140 153 195 237 300 Other current liabilities 145 179 230 300 396Taxes (39) (43) (55) (66) (84) Long-term debt 0 0 0 0 0Minority interest 0 (0) (1) 0 0 Other liabilities 15 21 21 21 21Extraordinary Total liabilities 185 251 308 387 495Net Income 101 109 140 171 216 Minority interest 4 4 5 5 5Adj. Net Income 100 109 140 171 216 Shareholders' equity 290 325 438 571 732Shares Outstanding 44 44 44 44 44 Liabilities + Equity 479 580 751 962 1,233EPS 2.30 2.48 3.17 3.86 4.88Adj. EPS 2.28 2.48 3.17 3.86 4.88 Net Debt (195) (223) (331) (467) (651)
Adj. Net Debt (281) (292) (401) (537) (720)Revenue growth - 24.7% 22.0% 22.2% 24.8% Net Debt/Capital (193.8%) (92.3%) (100.2%) (102.7%) (107.4%)EBITDA growth - 12.7% 31.2% 24.9% 25.7% Net Debt/EBITDA (204.6%) (189.0%) (197.5%) (211.9%) (226.2%)Net income growth - 7.9% 27.7% 22.0% 26.4%FCF growth - (14.4%) 28.0% 25.3% 36.1%
Operating Data, Ratios FY12A FY13E FY14E FY15E FY16E Valuation, Macro FY12A FY13E FY14E FY15E FY16E
Capex (18) (36) (51) (56) (61) EV/EBITDA 34.0 30.3 22.5 17.5 13.4Capex as % of sales 4.9% 7.7% 9.0% 8.0% 7.0% Adj.EV/EBITDA 34.3 30.3 22.5 17.5 13.4Change in working capital 28 16 32 44 63 Adj. P/E 44.6 40.9 32.0 26.3 20.8Free Cash Flow Equity 127 109 140 175 238 P/E 44.2 40.9 32.0 26.3 20.8Dividends/Share 0.41 0.54 0.61 0.85 1.22 P/BV 15.5 13.8 10.2 7.9 6.1Consolidated Dividends (18) (24) (27) (38) (54)Sharebuybacks FCF yield 2.8% 2.4% 3.1% 3.9% 5.3%Capex/Depreciation 2.0 3.0 3.7 3.7 3.1 Dividend yield 0.4% 0.5% 0.6% 0.8% 1.2%Capex/Sales 4.9% 7.7% 9.0% 8.0% 7.0% ROE 69.4% 35.6% 36.7% 33.8% 33.1%Working capital/sales 0.3 0.2 0.3 0.4 0.5 Net revenue/Assets 1.6 0.9 0.9 0.8 0.8Net income margin 26.9% 23.5% 24.6% 24.6% 24.9% Assets/Equity 1.7 1.7 1.7 1.7 1.7
ROCE 64.0% 32.3% 34.0% 32.8% 32.1%Shares 44 44 44 44 44ADRs 44 44 44 44 44WACC 11.3%Cost of equity 10.9%Cost of debt 0.0%
Source: Company reports and J.P. Morgan estimates.Note: $ in millions (except per-share data).Fiscal year ends Dec
Asia Pacific Equity Research09 January 2014
Equity Ratings and Price Targets
Mkt Cap Price Rating Price TargetCompany Ticker ($ mn) CCY Price Cur Prev Cur PrevTencent 700 HK 118,597.00 HKD 494.00 OW n/c 580.00 n/cQihoo 360 Technology Co. Ltd QIHU US 10,493.10 USD 80.10 OW n/c 98.00 n/cYY Inc YY US 1,739.95 USD 57.34 OW n/c 67.00 n/cBaidu.com BIDU US 61,784.22 USD 176.63 OW n/c 210.00 n/cSina Corp SINA US 5,626.10 USD 84.35 OW n/c 100.00 n/cSouFun Holdings Ltd SFUN US 6,469.53 USD 83.98 OW n/c 58.00 n/cPhoenix New Media Ltd FENG US 635.55 USD 9.81 OW n/c 15.00 n/cVipshop VIPS US 4,558.42 USD 82.28 OW n/c 88.00 n/cForgame Holdings Ltd 484 HK 880.51 HKD 54.45 OW n/c 70.00 n/cSohu.Com SOHU US 2,817.26 USD 73.94 N n/c 71.00 n/cNetEase NTES US 10,263.53 USD 78.03 N n/c 74.00 n/cYouku Tudou Inc. YOKU US 4,496.99 USD 33.92 N n/c 22.00 n/cCtrip.com International, Ltd CTRP US 6,084.56 USD 44.43 N n/c 50.00 n/cSungy Mobile Limited GOMO US 758.58 USD 20.18 N n/c 17.00 n/cDangdang DANG US 721.48 USD 9.00 UW n/c 7.50 n/cSource: Company data, Bloomberg, J.P. Morgan estimates. n/c = no change. All prices as of 06 Jan 14 except for 700 HK [07 Jan 14] 484 HK [07 Jan 14].
2014 China Internet OutlookApproaching return stage from investment in 2012/13
China
Internet
Alex Yao AC
(852) 2800 8535
Bloomberg JPMA YAO <GO>
J.P. Morgan Securities (Asia Pacific) Limited
China’s Internet sector has undergone an earnings downgrade cycle over the past three years due to investments in future growth drivers, with mobile Internet being a common area. We believe this earnings downgrade cycle has almost come to an end, with early movers (e.g. Tencent and Sina) beginning to harvest returns from the investment. Other names will follow suit over the next 1-2 years, in our view. With regard to mobile monetization, mobile gaming should be the first scalable business model capable of generating sizable revenue in 2014. Mobile ads are likely to gain more traction in 2014 due to growing demand from mobile game developers for mobile traffic. Such a trend should benefit game distributors (e.g. Tencent and Qihoo), as well as mobile advertising platforms (e.g. Tencent Guang Dian Tong and Mobile Baidu Union).
Among China’s larger companies, competition in mobile Internet has evolved from traffic acquisition to shaping new mobile eco-systems(e.g. Baidu’s Light App, and Tencent’s Weixin enterprise account) and user behavior (e.g. Ctrip’s brand ad campaign and competitive pricing) in order to capture new growth opportunities. We believe Tencent has extended its first-mover advantage in mobile user base into these two areas. In addition, we believe Tencent has reached the first return stage of mobile investment through game publishing while continuing to nurture new opportunities. We are OW on Tencent, Qihoo, and Baidu.
Competition remains intense in China’s online video, online travel and online gaming development market. Industry profitability and traffic share in these sectors could be volatile in 2014. We are Neutral on Youku, Ctrip, NetEase, and Sohu.
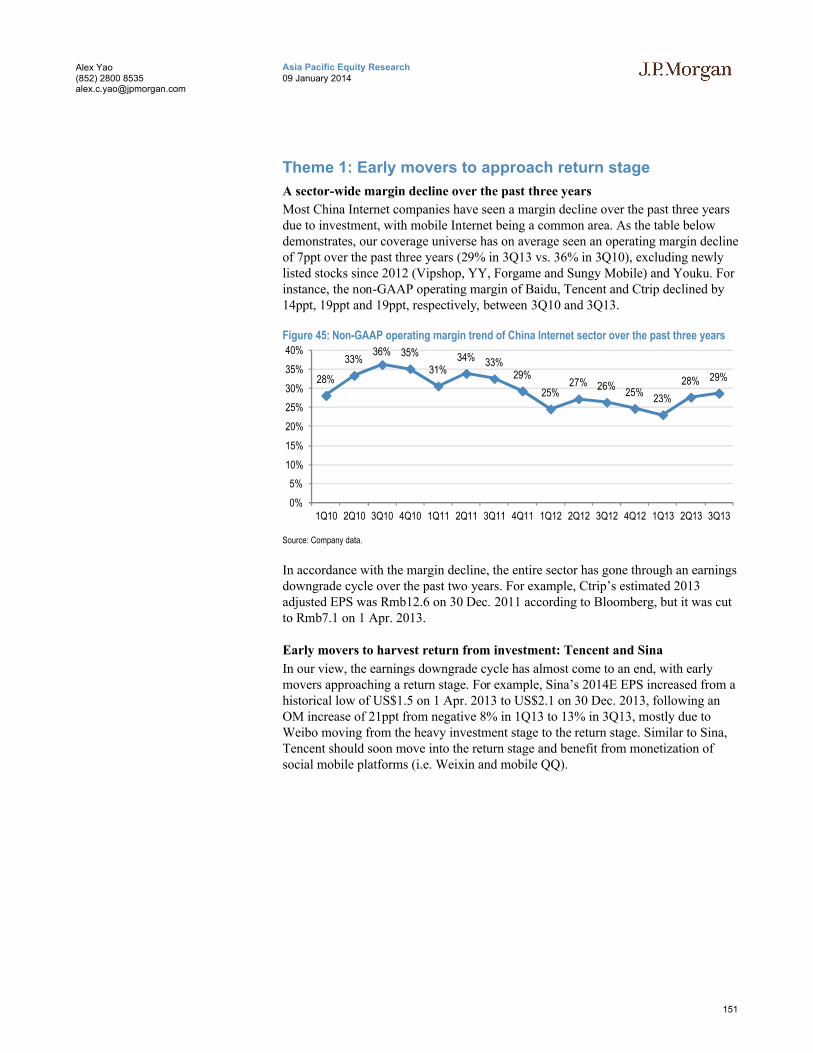
151
Asia Pacific Equity Research09 January 2014
Alex Yao(852) 2800 [email protected]
Theme 1: Early movers to approach return stage
A sector-wide margin decline over the past three years
Most China Internet companies have seen a margin decline over the past three years due to investment, with mobile Internet being a common area. As the table below demonstrates, our coverage universe has on average seen an operating margin decline of 7ppt over the past three years (29% in 3Q13 vs. 36% in 3Q10), excluding newly listed stocks since 2012 (Vipshop, YY, Forgame and Sungy Mobile) and Youku. For instance, the non-GAAP operating margin of Baidu, Tencent and Ctrip declined by 14ppt, 19ppt and 19ppt, respectively, between 3Q10 and 3Q13.
Figure 45: Non-GAAP operating margin trend of China Internet sector over the past three years
28%
33%36% 35%
31%34% 33%
29%
25%27% 26%
25%23%
28% 29%
0%
5%
10%
15%
20%
25%
30%
35%
40%
1Q10 2Q10 3Q10 4Q10 1Q11 2Q11 3Q11 4Q11 1Q12 2Q12 3Q12 4Q12 1Q13 2Q13 3Q13
Source: Company data.
In accordance with the margin decline, the entire sector has gone through an earnings downgrade cycle over the past two years. For example, Ctrip’s estimated 2013 adjusted EPS was Rmb12.6 on 30 Dec. 2011 according to Bloomberg, but it was cut to Rmb7.1 on 1 Apr. 2013.
Early movers to harvest return from investment: Tencent and Sina
In our view, the earnings downgrade cycle has almost come to an end, with early movers approaching a return stage. For example, Sina’s 2014E EPS increased from a historical low of US$1.5 on 1 Apr. 2013 to US$2.1 on 30 Dec. 2013, following an OM increase of 21ppt from negative 8% in 1Q13 to 13% in 3Q13, mostly due to Weibo moving from the heavy investment stage to the return stage. Similar to Sina, Tencent should soon move into the return stage and benefit from monetization of social mobile platforms (i.e. Weixin and mobile QQ).
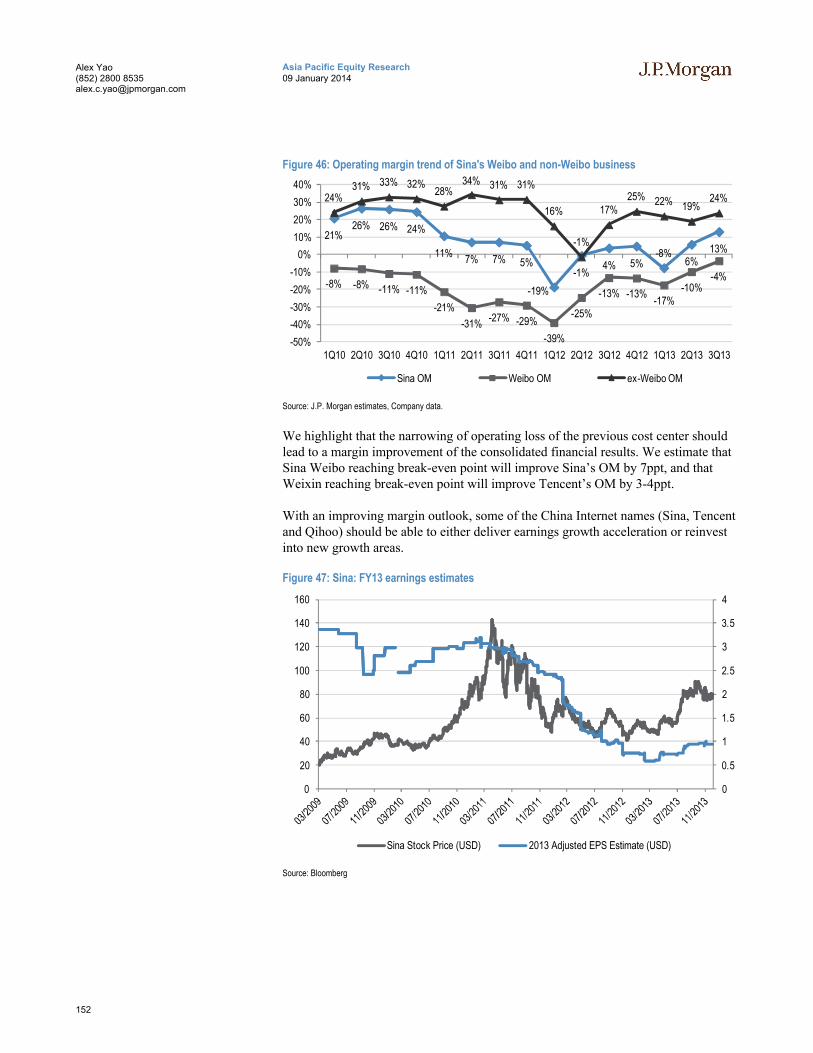
152
Asia Pacific Equity Research09 January 2014
Alex Yao(852) 2800 [email protected]
Figure 46: Operating margin trend of Sina's Weibo and non-Weibo business
21%26% 26% 24%
11%7% 7% 5%
-19%
-1%4% 5%
-8%6%
13%
-8% -8% -11% -11%
-21%
-31%-27% -29%
-39%
-25%
-13% -13%-17%
-10%-4%
24%31% 33% 32%
28%34% 31% 31%
16%
-1%
17%25% 22% 19%
24%
-50%
-40%
-30%
-20%
-10%
0%
10%
20%
30%
40%
1Q10 2Q10 3Q10 4Q10 1Q11 2Q11 3Q11 4Q11 1Q12 2Q12 3Q12 4Q12 1Q13 2Q13 3Q13
Sina OM Weibo OM ex-Weibo OM
Source: J.P. Morgan estimates, Company data.
We highlight that the narrowing of operating loss of the previous cost center should lead to a margin improvement of the consolidated financial results. We estimate that Sina Weibo reaching break-even point will improve Sina’s OM by 7ppt, and that Weixin reaching break-even point will improve Tencent’s OM by 3-4ppt.
With an improving margin outlook, some of the China Internet names (Sina, Tencent and Qihoo) should be able to either deliver earnings growth acceleration or reinvest into new growth areas.
Figure 47: Sina: FY13 earnings estimates
0
0.5
1
1.5
2
2.5
3
3.5
4
0
20
40
60
80
100
120
140
160
Sina Stock Price (USD) 2013 Adjusted EPS Estimate (USD)
Source: Bloomberg

153
Asia Pacific Equity Research09 January 2014
Alex Yao(852) 2800 [email protected]
Figure 48: Baidu: FY13 earnings estimates
0
1
2
3
4
5
6
7
0
20
40
60
80
100
120
140
160
180
200
Baidu Stock Price (USD) 2013 Adjusted EPS Estimate (USD)
Source: Bloomberg
Figure 49: Tencent: FY13 earnings estimates
0
2
4
6
8
10
12
0
50
100
150
200
250
300
350
400
Tencent Stock Price (HKD) 2013 Adjusted EPS Estimate (HKD)
Source: Bloomberg.
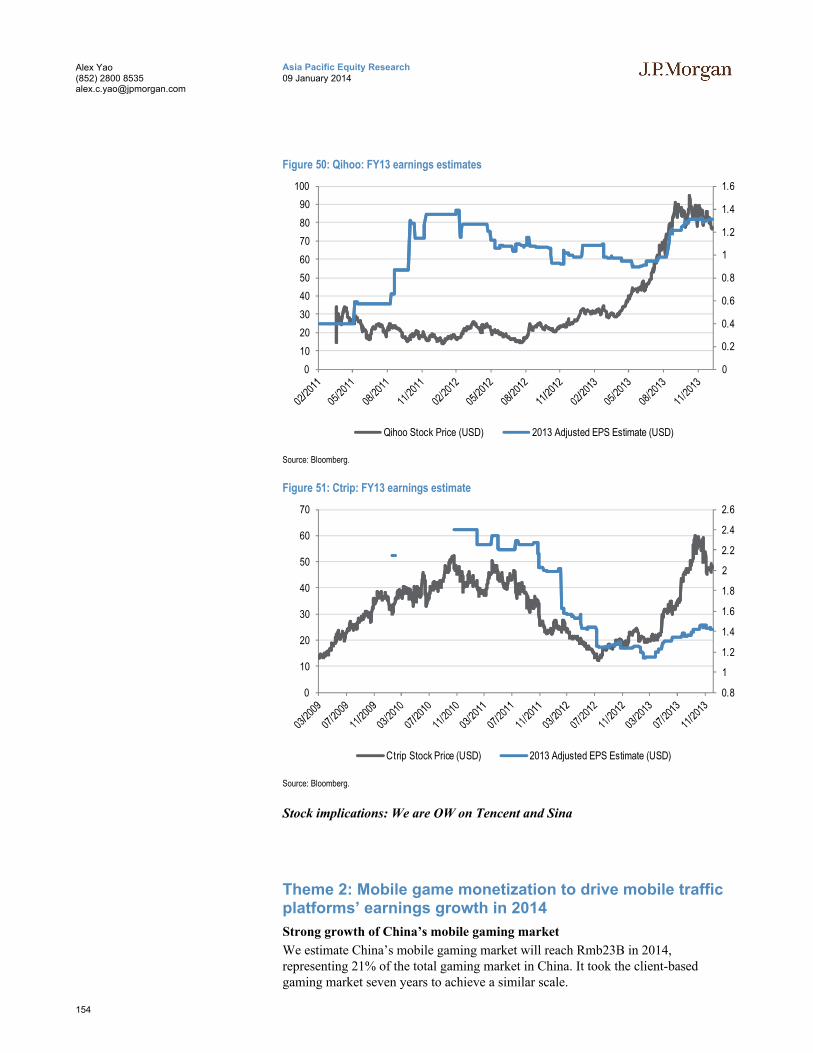
154
Asia Pacific Equity Research09 January 2014
Alex Yao(852) 2800 [email protected]
Figure 50: Qihoo: FY13 earnings estimates
0
0.2
0.4
0.6
0.8
1
1.2
1.4
1.6
0
10
20
30
40
50
60
70
80
90
100
Qihoo Stock Price (USD) 2013 Adjusted EPS Estimate (USD)
Source: Bloomberg.
Figure 51: Ctrip: FY13 earnings estimate
0.8
1
1.2
1.4
1.6
1.8
2
2.2
2.4
2.6
0
10
20
30
40
50
60
70
Ctrip Stock Price (USD) 2013 Adjusted EPS Estimate (USD)
Source: Bloomberg.
Stock implications: We are OW on Tencent and Sina
Theme 2: Mobile game monetization to drive mobile traffic platforms’ earnings growth in 2014
Strong growth of China’s mobile gaming market
We estimate China’s mobile gaming market will reach Rmb23B in 2014, representing 21% of the total gaming market in China. It took the client-based gaming market seven years to achieve a similar scale.
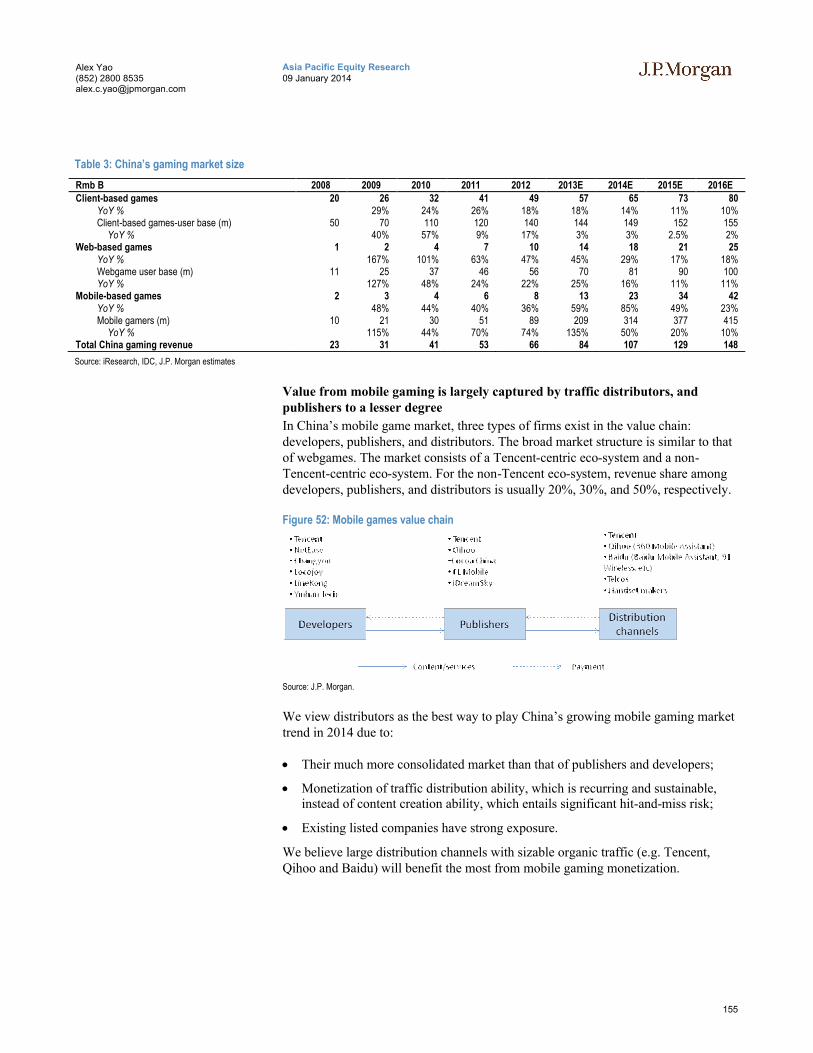
155
Asia Pacific Equity Research09 January 2014
Alex Yao(852) 2800 [email protected]
Table 3: China’s gaming market size
Rmb B 2008 2009 2010 2011 2012 2013E 2014E 2015E 2016EClient-based games 20 26 32 41 49 57 65 73 80
YoY % 29% 24% 26% 18% 18% 14% 11% 10%Client-based games-user base (m) 50 70 110 120 140 144 149 152 155
YoY % 40% 57% 9% 17% 3% 3% 2.5% 2%Web-based games 1 2 4 7 10 14 18 21 25
YoY % 167% 101% 63% 47% 45% 29% 17% 18%Webgame user base (m) 11 25 37 46 56 70 81 90 100YoY % 127% 48% 24% 22% 25% 16% 11% 11%
Mobile-based games 2 3 4 6 8 13 23 34 42YoY % 48% 44% 40% 36% 59% 85% 49% 23%Mobile gamers (m) 10 21 30 51 89 209 314 377 415
YoY % 115% 44% 70% 74% 135% 50% 20% 10%Total China gaming revenue 23 31 41 53 66 84 107 129 148
Source: iResearch, IDC, J.P. Morgan estimates
Value from mobile gaming is largely captured by traffic distributors, and publishers to a lesser degree
In China’s mobile game market, three types of firms exist in the value chain: developers, publishers, and distributors. The broad market structure is similar to that of webgames. The market consists of a Tencent-centric eco-system and a non-Tencent-centric eco-system. For the non-Tencent eco-system, revenue share among developers, publishers, and distributors is usually 20%, 30%, and 50%, respectively.
Figure 52: Mobile games value chain
Source: J.P. Morgan.
We view distributors as the best way to play China’s growing mobile gaming market trend in 2014 due to:
Their much more consolidated market than that of publishers and developers;
Monetization of traffic distribution ability, which is recurring and sustainable, instead of content creation ability, which entails significant hit-and-miss risk;
Existing listed companies have strong exposure.
We believe large distribution channels with sizable organic traffic (e.g. Tencent, Qihoo and Baidu) will benefit the most from mobile gaming monetization.
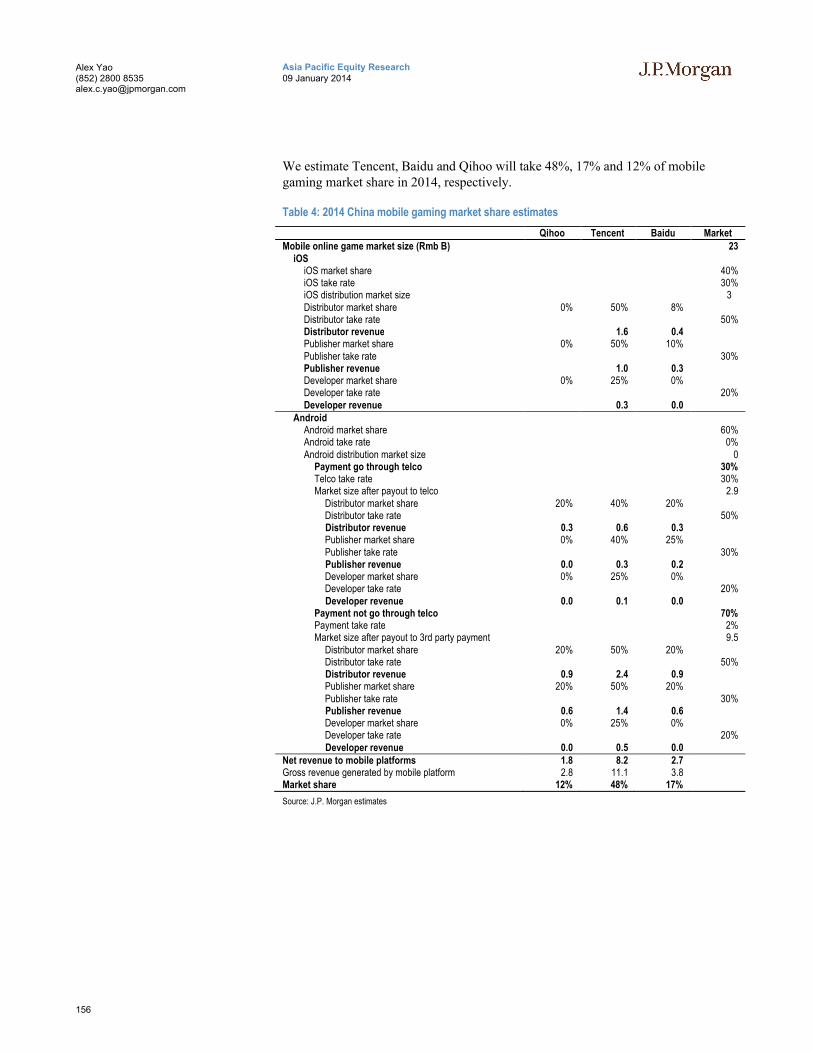
156
Asia Pacific Equity Research09 January 2014
Alex Yao(852) 2800 [email protected]
We estimate Tencent, Baidu and Qihoo will take 48%, 17% and 12% of mobile gaming market share in 2014, respectively.
Table 4: 2014 China mobile gaming market share estimates
Qihoo Tencent Baidu MarketMobile online game market size (Rmb B) 23
iOSiOS market share 40%iOS take rate 30%iOS distribution market size 3 Distributor market share 0% 50% 8%Distributor take rate 50%Distributor revenue 1.6 0.4Publisher market share 0% 50% 10%Publisher take rate 30%Publisher revenue 1.0 0.3Developer market share 0% 25% 0%Developer take rate 20%Developer revenue 0.3 0.0
AndroidAndroid market share 60%Android take rate 0%Android distribution market size 0
Payment go through telco 30%Telco take rate 30%Market size after payout to telco 2.9
Distributor market share 20% 40% 20%Distributor take rate 50%Distributor revenue 0.3 0.6 0.3Publisher market share 0% 40% 25%Publisher take rate 30%Publisher revenue 0.0 0.3 0.2Developer market share 0% 25% 0%Developer take rate 20%Developer revenue 0.0 0.1 0.0
Payment not go through telco 70%Payment take rate 2%Market size after payout to 3rd party payment 9.5
Distributor market share 20% 50% 20%Distributor take rate 50%Distributor revenue 0.9 2.4 0.9Publisher market share 20% 50% 20%Publisher take rate 30%Publisher revenue 0.6 1.4 0.6Developer market share 0% 25% 0%Developer take rate 20%Developer revenue 0.0 0.5 0.0
Net revenue to mobile platforms 1.8 8.2 2.7 Gross revenue generated by mobile platform 2.8 11.1 3.8Market share 12% 48% 17%
Source: J.P. Morgan estimates

157
Asia Pacific Equity Research09 January 2014
Alex Yao(852) 2800 [email protected]
In-game advertising: the second batch of beneficiaries
Increasing game monetization ability leads to demand for mobile ad inventory
With the emergence of mid-core and hard-core games on mobile devices, single mobile game monetization has reached a meaningful level. A successful mid-core mobile game is able to generate as much as Rmb100MM gross revenue a month, or a Rmb1.2B a year run rate in a non-Tencent ecosystem. We also found a number of mid-core/hard-core games generating RmbB30-40MM in gross revenue a month. With such monetization capabilities, more and more developers are likely to seek their own distribution strategy and buy mobile ad inventory in 2014. This trend is incrementally negative for Qihoo and Baidu’s 91 wireless. It is positive for Tencent’s mobile Guang Dian Tong and Baidu’s mobile ad union.
We expect this trend will lead to growing mobile ad demand for:
Single apps with large traffic and strong impression/time spend generation ability (Weixin, Qzone, Sina Weibo etc); and
Large mobile ad unions such as Tencent Guang Dian Tong and Baidu Union.
158
Asia Pacific Equity Research09 January 2014
Alex Yao(852) 2800 [email protected]
Theme 3: Large mobile platforms attempting to shape new eco-system and user behavior
Competition in China’s mobile Internet has further evolved from user acquisition to shaping eco-systems and consumer behavior. Tencent has further expanded its leadership position in mobile Internet from user base to building eco-systems and forming new consumer behavior. More importantly, in our view, Tencent’s mobile Internet development has reached the first stage of return through mobile game publishing while continuing to nurture other areas such as mobile commerce and O2O.
We view Tencent as the best positioned China Internet name in mobile. We estimate operating profit from Tencent’s mobile social platforms to reach Rmb3B and Rmb6Bin 2014 and 2015, respectively, mostly from mobile game publishing. We see potential upside risk to our forecasts given good traction in Tencent’s other mobile initiatives.
Expansion of super apps’ functionalities
After achieving high usage, most Chinese mobile apps diversify into new functionalities. For example, Tencent Weixin introduced mobile game publishing and enterprise accounts, Baidu Palm introduced Light App, and Sina Weibo tested mobile game distribution. These efforts, in our view, are attempts to shape userbehavior and capture new growth opportunities. We believe Tencent has done the best job in this area so far.
Baidu’s Light App vs. Tencent’s Weixin enterprise account: from eco-system to new consumer behavior
Two interesting developments in China’s mobile Internet are Baidu’s Light App and Tencent’s Weixin enterprise account. Both products represent these two large Internet names’ ambitions to shape a new eco-system and form consumer behavior in new territories on mobile Internet. Both Light App and Weixin enterprise account are designed to offer tailor-made content and services through Baidu and Tencent’s flagship mobile apps: Baidu Palm and Tencent Weixin.
We observed a much faster adoption of Weixin enterprise accounts than Light App among both developers and consumers. More than 2MM Weixin enterprise accounts have been registered over the past 15 months, with recent daily adds at 8,000, according to Tencent Tech. We heard positive feedback on the adoption of Weixin enterprise accounts from agencies and ecommerce companies. On the other hand, Baidu’s Light App seems to be at an earlier adoption stage than Weixin enterprise accounts.
Chinese consumers are increasingly spending more time on a few super apps, most prominently Tencent’s Weixin and mobile QQ. Therefore, Tencent could potentially form new user behavior on Weixin by introducing these enterprise accounts to Weixin users.
Tencent’s opportunities in mobile commerce
In addition to extending PC e-commerce transactions to mobile devices (e.g. Dangdang set up an enterprise account on Weixin, which is able to display inventory, place orders, and make payments), we found that offline merchants and

159
Asia Pacific Equity Research09 January 2014
Alex Yao(852) 2800 [email protected]
manufacturers are attempting to build new channels on Weixin in order to reduce inventory risk. The purpose of such attempts is to turn offline retail stores into experience centers for customers to try products. Orders of long-tail SKUs are then placed through an enterprise account on Weixin and fulfilled by a distributor or manufacturer. As a result, retail stores can keep minimal inventory of long-tail SKUs. This approach could potentially reduce inventory at the retailer level. In addition, brands are able to build a long-term relationship with consumers through this approach.
Market adoption of this mobile commerce approach on Weixin is currently at a very early stage. In the next few years, it could become a complementary commerce model to the currently marketplace model in China, in our view, given 1) Weixin’s large and still growing user base, 2) inventory management issues among Chinese consumer firms, and 3) VIPshop’s proven success in this area.
Weixin payment
Unlike PayPal or Tencent’s own Tenpay, Weixin payment does not require a pre-deposit into users’ accounts. It simply acts as an agent between users credit/debit card account and online transactions. More importantly, the payment can be triggered by scanning a QR code, which is easy to use, particularly in an offline environment. More than 10,000 vending machines in Beijing, Shanghai, Wuhan, Guangzhou and Shenzhen have integrated Weixin payment. Weixin payment supports:
QR-code scan payment;
in-app payment;
in-enterprise account payment.
Stock implications: We reiterate our OW on Tencent and Baidu
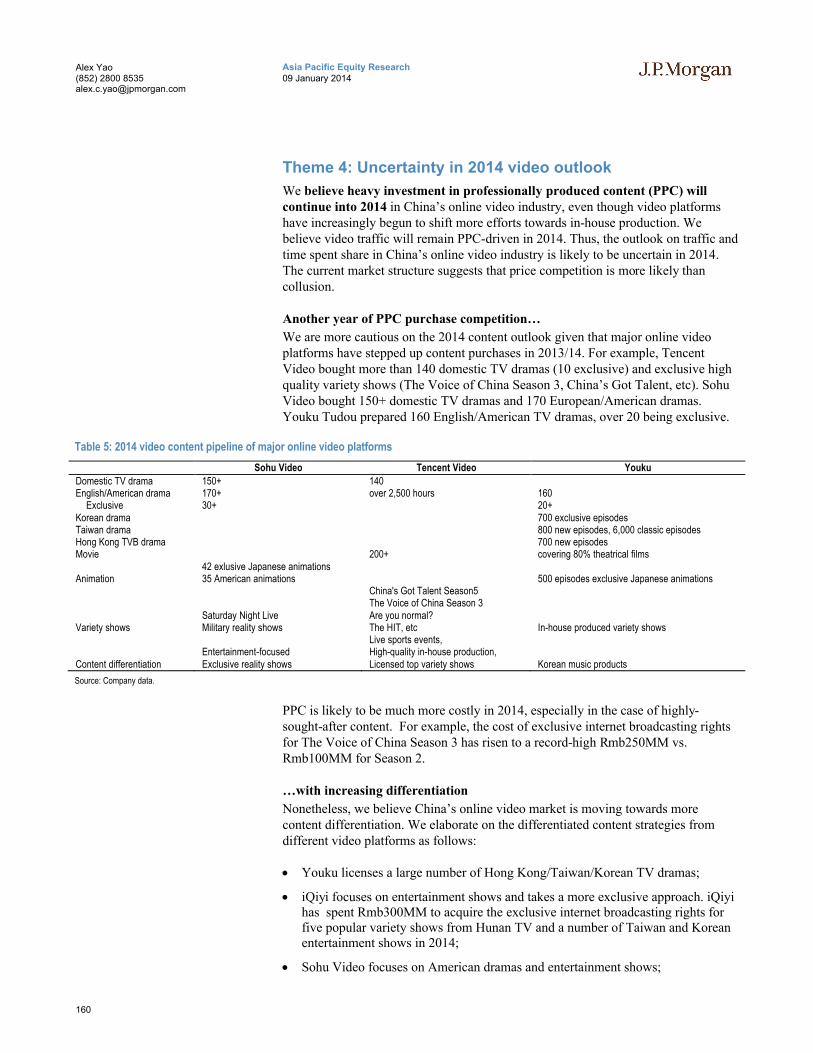
160
Asia Pacific Equity Research09 January 2014
Alex Yao(852) 2800 [email protected]
Theme 4: Uncertainty in 2014 video outlook
We believe heavy investment in professionally produced content (PPC) will continue into 2014 in China’s online video industry, even though video platforms have increasingly begun to shift more efforts towards in-house production. We believe video traffic will remain PPC-driven in 2014. Thus, the outlook on traffic and time spent share in China’s online video industry is likely to be uncertain in 2014. The current market structure suggests that price competition is more likely than collusion.
Another year of PPC purchase competition…
We are more cautious on the 2014 content outlook given that major online video platforms have stepped up content purchases in 2013/14. For example, Tencent Video bought more than 140 domestic TV dramas (10 exclusive) and exclusive high quality variety shows (The Voice of China Season 3, China’s Got Talent, etc). Sohu Video bought 150+ domestic TV dramas and 170 European/American dramas. Youku Tudou prepared 160 English/American TV dramas, over 20 being exclusive.
Table 5: 2014 video content pipeline of major online video platforms
Sohu Video Tencent Video Youku
Domestic TV drama 150+ 140English/American drama 170+ over 2,500 hours 160
Exclusive 30+ 20+Korean drama 700 exclusive episodesTaiwan drama 800 new episodes, 6,000 classic episodesHong Kong TVB drama 700 new episodesMovie 200+ covering 80% theatrical films
Animation42 exlusive Japanese animations35 American animations 500 episodes exclusive Japanese animations
Variety showsSaturday Night LiveMilitary reality shows
China's Got Talent Season5The Voice of China Season 3Are you normal?The HIT, etc In-house produced variety shows
Content differentiationEntertainment-focusedExclusive reality shows
Live sports events,High-quality in-house production, Licensed top variety shows Korean music products
Source: Company data.
PPC is likely to be much more costly in 2014, especially in the case of highly-sought-after content. For example, the cost of exclusive internet broadcasting rights for The Voice of China Season 3 has risen to a record-high Rmb250MM vs. Rmb100MM for Season 2.
…with increasing differentiation
Nonetheless, we believe China’s online video market is moving towards more content differentiation. We elaborate on the differentiated content strategies from different video platforms as follows:
Youku licenses a large number of Hong Kong/Taiwan/Korean TV dramas;
iQiyi focuses on entertainment shows and takes a more exclusive approach. iQiyi has spent Rmb300MM to acquire the exclusive internet broadcasting rights for five popular variety shows from Hunan TV and a number of Taiwan and Korean entertainment shows in 2014;
Sohu Video focuses on American dramas and entertainment shows;
161
Asia Pacific Equity Research09 January 2014
Alex Yao(852) 2800 [email protected]
PPTV focuses on live content and content cooperation with TV stations.
We observe efforts to differentiate content offerings on the back of growing skepticism about current PPC-centric content strategy and business sustainability among online video platforms. PPC, particularly TV dramas and entertainment shows, remains the largest traffic driver for online video platforms and generates most of the revenues. However, PPC is a commodity in China and no online video platform has the ability to consolidate PPC, so:
as online video penetration becomes saturated, traffic and time spent market share fluctuate in different years, based on which company has purchased the most popular video content in each year;
there is low profitability across online video platforms as content producers are able to extract more value than video platforms.
In-house production is in the right direction, but unlikely to move the needlein 2014
The online video industry is heading towards in-house production in 2014. For example, Sohu Video branded 2014 as “a year of in-house production” and expects in-house production to contribute 25-30% of total traffic in 2014. Youku will inject Rmb300MM for in-house production in 2014, the majority of which, in our view, will be spent on variety shows. Tencent Video regards in-house production as one of its key strategies in 2014 and aims to produce high-quality in-house productions by sourcing them to professional film companies and producers.
However, our channel checks suggest that professionally produced TV dramas and variety shows are the major traffic driver for the time being (over 70% traffic contribution in general). We think it will take time for in-house production to generate comparable traffic with PPC.
Margin outlook remains under pressure
Given the current reliance on PPC among Chinese video platforms, we believe popular content with strong visibility to be a hit has stronger bargaining power against online video platforms and is able to extract more value. This takes away online video platforms’ room for margin improvement.
The Voice of China Season 3 has been bought by Tencent for Rmb250MM, vs Season 2 for Rmb100MM by Sohu, indicating a top content price growth rate of 150% YoY. According to Sohu Video, the company generated over 2B video views and advertising revenue of Rmb200MM from the program. We think it is questionable whether Tencent will be able to grow the revenue at the same rate as the content price rise.
China’s entertainment broadcasting restrictions make certain content more scarce
China imposed a new round of restrictions on the broadcasting of TV programs in Oct. 2013. An important provision of the regulation is that only one vocal program can be broadcast each quarter during the prime time (19:30-22:20) of TV stations. We believe such a restriction will drive online video traffic to the platform that secures such highly-sought-after content.

162
Asia Pacific Equity Research09 January 2014
Alex Yao(852) 2800 [email protected]
We note that Tencent Video has bought a number of popular vocal programs for broadcasting in 2014, including The Voice of China Season 3, Duets Season 2 and The HIT. These scheduled programs should significantly drive the traffic growth of Tencent Video.
Mobile monetization is the swing factor for the sector margin outlook in 2014
China’s online video industry is undergoing two trends that we believe to be irreversible: 1) a slowing pace of video viewership growth; and 2) a usage shift from PC to mobile. As a result, we expect the revenue growth of the industry in 2014 to hinge on monetization progress of mobile traffic, which we estimate represents over 50% of total video traffic currently.
However, so far only PPTV and iQiyi have seen a meaningful revenue contribution from mobile, followed by Youku Tudou that has been increasingly ramping up its mobile monetization. We expect mobile monetization to be a key focal point across the online video industry in 2014.
Stock implications: We reiterate Neutral on Youku and OW on Tencent.

163
Asia Pacific Equity Research09 January 2014
Alex Yao(852) 2800 [email protected]
Theme 5: Continued growth of online-to-offline business; room for cooperation with big mobile platforms
China’s O2O business is undergoing a rapid expansion. Taking group-buying as an example, monthly GMV of the industry has seen steady growth over the past years and exceeded Rmb3B since July 2013. We believe the market landscape in China’s O2O market has stabilized after years of tough competition. Meituan and Dianping have emerged to lead the market, followed by 55tuan, Nuomi and Lashou.
Figure 53: Total GMV trend of group-buy industry in China
0
500
1,000
1,500
2,000
2,500
3,000
3,500
4,000Ja
n-12
Feb
-12
Mar
-12
Apr
-12
May
-12
Jun-
12
Jul-1
2
Aug
-12
Sep
-12
Oct
-12
Nov
-12
Dec
-12
Jan-
13
Feb
-13
Mar
-13
Apr
-13
May
-13
Jun-
13
Jul-1
3
Aug
-13
Sep
-13
Oct
-13
RMBm
Source: Tuan800
Market share consolidation
In our view, tier 1 players include Meituan and Dianping, which are seeing a Rmb1B monthly GMV, followed by three tier 2 players including 55tuan, Nuomi and Lashou, each with over Rmb300MM monthly GMV. The five players contributed 98% of total market GMV in October 2013.
Figure 54: Increasing concentration of China’s group-buying market
15%
33%46%9%
16%
25%
15%
13%
9%
8%
12%
9%
17%
11%
9%
0%
10%
20%
30%
40%
50%
60%
70%
80%
90%
100%
Jan-12 Dec-12 Oct-13Meituan Dianping 55tuan Nuomi Lashou Gaopeng
Dida Manzuo Qianpin 58tuan Ftuan
Source: Tuan800
We estimate that Meituan, China’s largest group-buy operator, increased GMV by 3x in 2013, vs. 4x in 2012. More importantly, more than half of the transactions are on mobile. Dianping, China’s largest city life service vertical, has exhibited a similargrowth pattern. As of October 2013, the two players accounted for over 70% of total
164
Asia Pacific Equity Research09 January 2014
Alex Yao(852) 2800 [email protected]
market GMV vs. 49% in December 2012. We expect market share concentration to continue in 2014.
Next stage: we expect cooperation between O2O sites and traffic platforms
Despite a concentrated market pattern having been established with regard to service providers, we see ample room for large traffic platforms to get involved, as:
the user base of these vertical leaders is dwarfed by large mobile traffic platforms such as Tencent and Qihoo;
O2O business involves large offline exposure and on-the-ground staff. For example, Meituan has close to 4,000 employees. Such a heavy offline exposure is not ideal for large online platforms that are pursuing scalable business models, in our view.
We expect more and more cooperation between large mobile platforms andvertical leaders in 2014. A typical trend is for internet giants with large traffic to begin to involve themselves in O2O through strategic investment/acquisition of O2O verticals (e.g. group-buying sites).
We believe mobile traffic platforms that are likely to benefit include:
Baidu Baidu has cooperated with a number of leading O2O service providers to
incorporate the latter’s service information on Baidu Map. These vertical SPs include Qunar/Ctrip/eLong in online travel, Dianping/QQ Catering in city lifestyle services, and Meituan in group-buying.
Baidu acquired a 59% shareholding of Nuomi through a US$160MM strategic investment in August 2013. Nuomi currently is one of the top 5 group-buying sites in China in terms of monthly GMV. We expect Baidu to cooperate closely with Nuomi in 2014.
TencentTencent aims to build an O2O eco-system around its mobile traffic platform Weixin which has a more than 200MM active user base. To achieve this, Tencent attempts to shape user behavior through
increasingly improving its O2O infrastructure, such as QR code usage, Weixin payment, LBS features; and
adding offline resources to Weixin’s platform; for example, Tencent Weishenghuo has offered merchants a platform to undertake1) virtual membership card offering, 2) customer relationship management (CRM), 3) customer service, and 4) coupon offers.
Stock implications: We reiterate OW on Tencent, Qihoo and Baidu
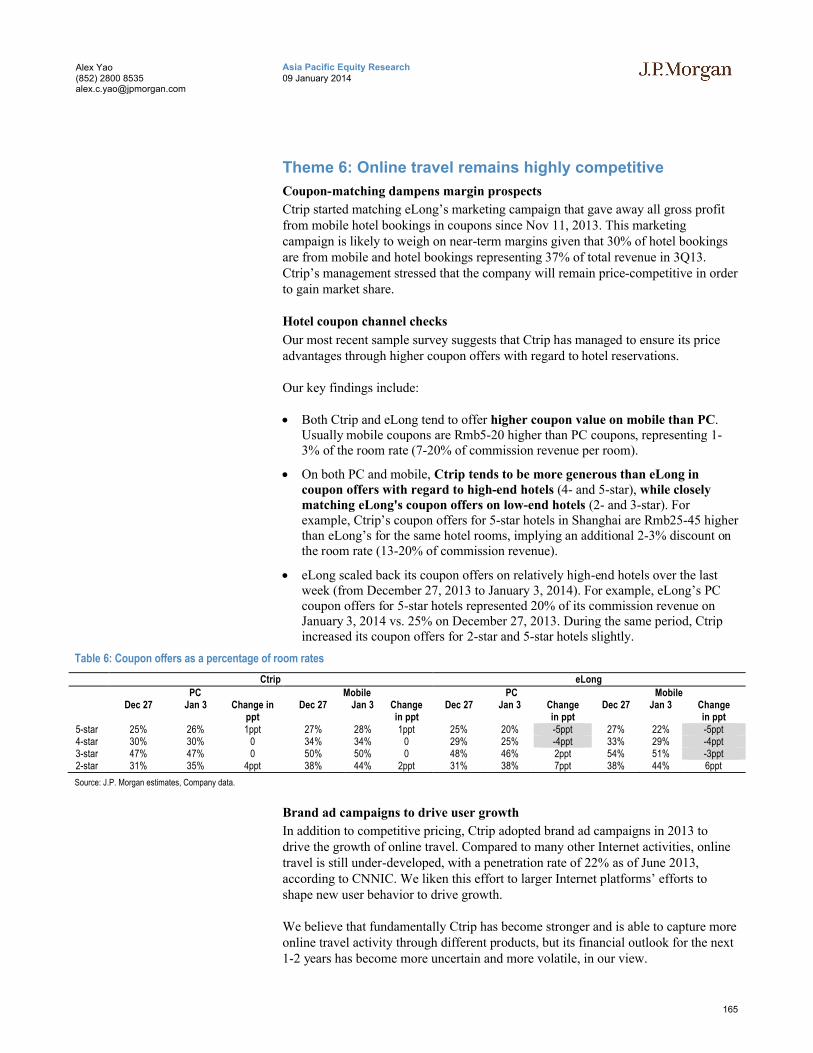
165
Asia Pacific Equity Research09 January 2014
Alex Yao(852) 2800 [email protected]
Theme 6: Online travel remains highly competitive
Coupon-matching dampens margin prospects
Ctrip started matching eLong’s marketing campaign that gave away all gross profit from mobile hotel bookings in coupons since Nov 11, 2013. This marketing campaign is likely to weigh on near-term margins given that 30% of hotel bookings are from mobile and hotel bookings representing 37% of total revenue in 3Q13. Ctrip’s management stressed that the company will remain price-competitive in order to gain market share.
Hotel coupon channel checks
Our most recent sample survey suggests that Ctrip has managed to ensure its price advantages through higher coupon offers with regard to hotel reservations.
Our key findings include:
Both Ctrip and eLong tend to offer higher coupon value on mobile than PC. Usually mobile coupons are Rmb5-20 higher than PC coupons, representing 1-3% of the room rate (7-20% of commission revenue per room).
On both PC and mobile, Ctrip tends to be more generous than eLong in coupon offers with regard to high-end hotels (4- and 5-star), while closely matching eLong's coupon offers on low-end hotels (2- and 3-star). For example, Ctrip’s coupon offers for 5-star hotels in Shanghai are Rmb25-45 higher than eLong’s for the same hotel rooms, implying an additional 2-3% discount on the room rate (13-20% of commission revenue).
eLong scaled back its coupon offers on relatively high-end hotels over the last week (from December 27, 2013 to January 3, 2014). For example, eLong’s PC coupon offers for 5-star hotels represented 20% of its commission revenue on January 3, 2014 vs. 25% on December 27, 2013. During the same period, Ctrip increased its coupon offers for 2-star and 5-star hotels slightly.
Table 6: Coupon offers as a percentage of room rates
Ctrip eLong
PC Mobile PC MobileDec 27 Jan 3 Change in
pptDec 27 Jan 3 Change
in pptDec 27 Jan 3 Change
in pptDec 27 Jan 3 Change
in ppt5-star 25% 26% 1ppt 27% 28% 1ppt 25% 20% -5ppt 27% 22% -5ppt4-star 30% 30% 0 34% 34% 0 29% 25% -4ppt 33% 29% -4ppt3-star 47% 47% 0 50% 50% 0 48% 46% 2ppt 54% 51% -3ppt2-star 31% 35% 4ppt 38% 44% 2ppt 31% 38% 7ppt 38% 44% 6ppt
Source: J.P. Morgan estimates, Company data.
Brand ad campaigns to drive user growth
In addition to competitive pricing, Ctrip adopted brand ad campaigns in 2013 to drive the growth of online travel. Compared to many other Internet activities, online travel is still under-developed, with a penetration rate of 22% as of June 2013, according to CNNIC. We liken this effort to larger Internet platforms’ efforts to shape new user behavior to drive growth.
We believe that fundamentally Ctrip has become stronger and is able to capture more online travel activity through different products, but its financial outlook for the next 1-2 years has become more uncertain and more volatile, in our view.

166
Asia Pacific Equity Research09 January 2014
Alex Yao(852) 2800 [email protected]
Uncertain financial outlook in 2014
We believe Ctrip’s brand ad efforts as well as price matching with eLong’s mobile coupons will lead to uncertainty in Ctrip’s margin outlook in 2014.
Stock implications: We reiterate Neutral on Ctrip
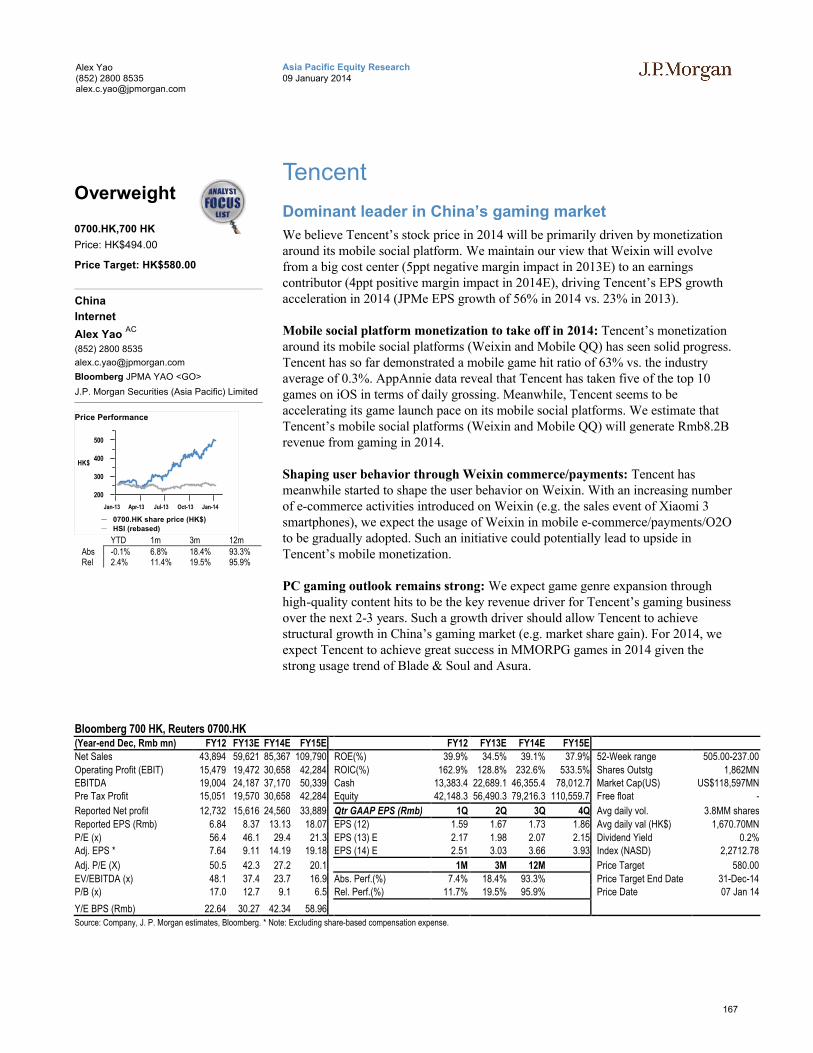
167
Asia Pacific Equity Research09 January 2014
Alex Yao(852) 2800 [email protected]
Tencent
Dominant leader in China’s gaming market
We believe Tencent’s stock price in 2014 will be primarily driven by monetization around its mobile social platform. We maintain our view that Weixin will evolve from a big cost center (5ppt negative margin impact in 2013E) to an earnings contributor (4ppt positive margin impact in 2014E), driving Tencent’s EPS growthacceleration in 2014 (JPMe EPS growth of 56% in 2014 vs. 23% in 2013).
Mobile social platform monetization to take off in 2014: Tencent’s monetization around its mobile social platforms (Weixin and Mobile QQ) has seen solid progress. Tencent has so far demonstrated a mobile game hit ratio of 63% vs. the industry average of 0.3%. AppAnnie data reveal that Tencent has taken five of the top 10 games on iOS in terms of daily grossing. Meanwhile, Tencent seems to be accelerating its game launch pace on its mobile social platforms. We estimate that Tencent’s mobile social platforms (Weixin and Mobile QQ) will generate Rmb8.2B revenue from gaming in 2014.
Shaping user behavior through Weixin commerce/payments: Tencent has meanwhile started to shape the user behavior on Weixin. With an increasing number of e-commerce activities introduced on Weixin (e.g. the sales event of Xiaomi 3 smartphones), we expect the usage of Weixin in mobile e-commerce/payments/O2O to be gradually adopted. Such an initiative could potentially lead to upside in Tencent’s mobile monetization.
PC gaming outlook remains strong: We expect game genre expansion through high-quality content hits to be the key revenue driver for Tencent’s gaming business over the next 2-3 years. Such a growth driver should allow Tencent to achieve structural growth in China’s gaming market (e.g. market share gain). For 2014, we expect Tencent to achieve great success in MMORPG games in 2014 given the strong usage trend of Blade & Soul and Asura.
Bloomberg 700 HK, Reuters 0700.HK(Year-end Dec, Rmb mn) FY12 FY13E FY14E FY15E FY12 FY13E FY14E FY15E
Net Sales 43,894 59,621 85,367 109,790 ROE(%) 39.9% 34.5% 39.1% 37.9% 52-Week range 505.00-237.00
Operating Profit (EBIT) 15,479 19,472 30,658 42,284 ROIC(%) 162.9% 128.8% 232.6% 533.5% Shares Outstg 1,862MNEBITDA 19,004 24,187 37,170 50,339 Cash 13,383.4 22,689.1 46,355.4 78,012.7 Market Cap(US) US$118,597MNPre Tax Profit 15,051 19,570 30,658 42,284 Equity 42,148.3 56,490.3 79,216.3 110,559.7 Free float -
Reported Net profit 12,732 15,616 24,560 33,889 Qtr GAAP EPS (Rmb) 1Q 2Q 3Q 4Q Avg daily vol. 3.8MM shares
Reported EPS (Rmb) 6.84 8.37 13.13 18.07 EPS (12) 1.59 1.67 1.73 1.86 Avg daily val (HK$) 1,670.70MN
P/E (x) 56.4 46.1 29.4 21.3 EPS (13) E 2.17 1.98 2.07 2.15 Dividend Yield 0.2%Adj. EPS * 7.64 9.11 14.19 19.18 EPS (14) E 2.51 3.03 3.66 3.93 Index (NASD) 2,2712.78
Adj. P/E (X) 50.5 42.3 27.2 20.1 1M 3M 12M Price Target 580.00
EV/EBITDA (x) 48.1 37.4 23.7 16.9 Abs. Perf.(%) 7.4% 18.4% 93.3% Price Target End Date 31-Dec-14P/B (x) 17.0 12.7 9.1 6.5 Rel. Perf.(%) 11.7% 19.5% 95.9% Price Date 07 Jan 14
Y/E BPS (Rmb) 22.64 30.27 42.34 58.96
Source: Company, J. P. Morgan estimates, Bloomberg. * Note: Excluding share-based compensation expense.
Overweight
0700.HK,700 HK
Price: HK$494.00
Price Target: HK$580.00
China
Internet
Alex Yao AC
(852) 2800 8535
Bloomberg JPMA YAO <GO>
J.P. Morgan Securities (Asia Pacific) Limited
200
300
400
500
HK$
Jan-13 Apr-13 Jul-13 Oct-13 Jan-14
Price Performance
0700.HK share price (HK$)
HSI (rebased)
YTD 1m 3m 12mAbs -0.1% 6.8% 18.4% 93.3%Rel 2.4% 11.4% 19.5% 95.9%
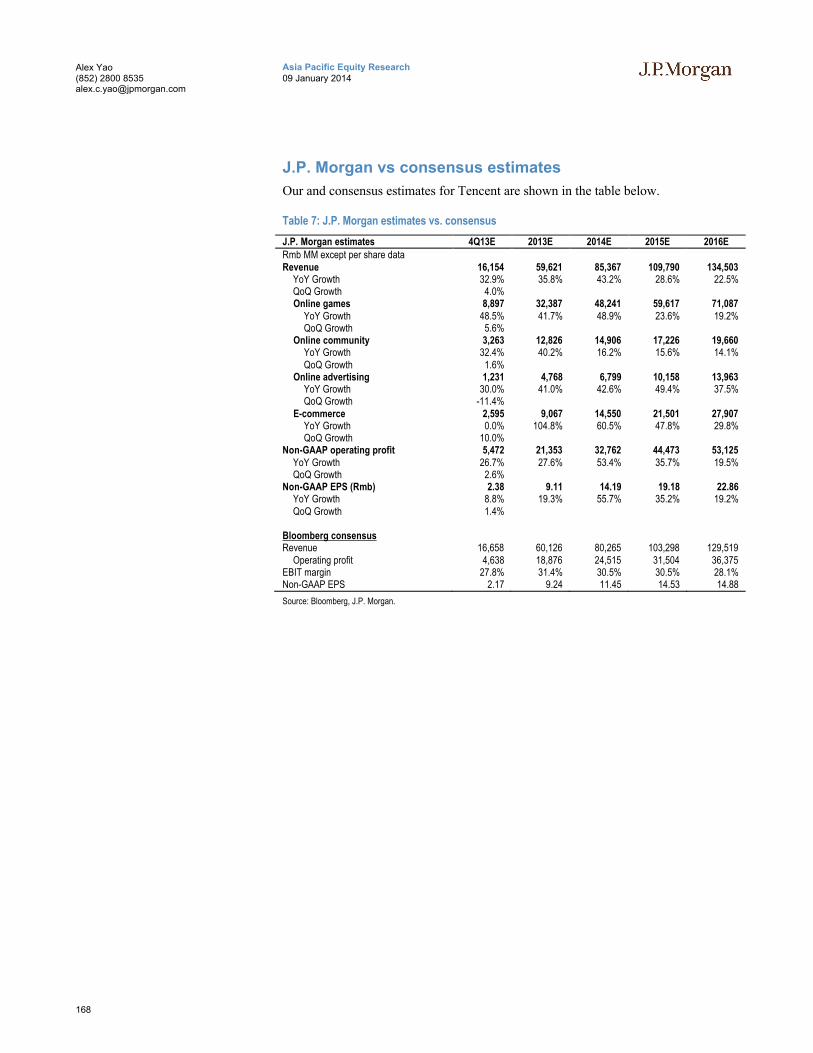
168
Asia Pacific Equity Research09 January 2014
Alex Yao(852) 2800 [email protected]
J.P. Morgan vs consensus estimates
Our and consensus estimates for Tencent are shown in the table below.
Table 7: J.P. Morgan estimates vs. consensus
J.P. Morgan estimates 4Q13E 2013E 2014E 2015E 2016ERmb MM except per share dataRevenue 16,154 59,621 85,367 109,790 134,503
YoY Growth 32.9% 35.8% 43.2% 28.6% 22.5%QoQ Growth 4.0%Online games 8,897 32,387 48,241 59,617 71,087
YoY Growth 48.5% 41.7% 48.9% 23.6% 19.2%QoQ Growth 5.6%
Online community 3,263 12,826 14,906 17,226 19,660YoY Growth 32.4% 40.2% 16.2% 15.6% 14.1%QoQ Growth 1.6%
Online advertising 1,231 4,768 6,799 10,158 13,963YoY Growth 30.0% 41.0% 42.6% 49.4% 37.5%QoQ Growth -11.4%
E-commerce 2,595 9,067 14,550 21,501 27,907YoY Growth 0.0% 104.8% 60.5% 47.8% 29.8%QoQ Growth 10.0%
Non-GAAP operating profit 5,472 21,353 32,762 44,473 53,125YoY Growth 26.7% 27.6% 53.4% 35.7% 19.5%QoQ Growth 2.6%
Non-GAAP EPS (Rmb) 2.38 9.11 14.19 19.18 22.86 YoY Growth 8.8% 19.3% 55.7% 35.2% 19.2%QoQ Growth 1.4%
Bloomberg consensusRevenue 16,658 60,126 80,265 103,298 129,519
Operating profit 4,638 18,876 24,515 31,504 36,375EBIT margin 27.8% 31.4% 30.5% 30.5% 28.1%Non-GAAP EPS 2.17 9.24 11.45 14.53 14.88
Source: Bloomberg, J.P. Morgan.

169
Asia Pacific Equity Research09 January 2014
Alex Yao(852) 2800 [email protected]
Investment Thesis, Valuation and Risks
Tencent (Overweight; Price Target: HK$580.00)
Investment Thesis
We believe Tencent’s solid market leadership in China’s gaming market will remain intact for the next 1-2 years. We expect mobile social platform monetization to generate Rmb3B and Rmb6B in operating profit in 2014 and 2015, respectively, driving revenue growth of 36% in 2014. The growth of the high-margin mobile social gaming business should accelerate earnings growth. We believe Tencent’s efforts to drive the adoption of Weixin ecommerce and payments will shape a new eco-system on mobile, which will result in potential earnings upside to the company from 2014 onwards.
Valuation
We have an Overweight rating on Tencent and a Dec-14 PT of HK$580. Our PT is based on 2014E EPS of HK$17.96, an FY14-16E non-GAAP EPS CAGR of 27%,and a PEG of 1.2x. We leverage PEG as our primary valuation methodology, as it balances valuation multiple and growth prospects.
We cross-check our PT against our DCF valuation, which yields a price of HK$625.Our key assumptions in our DCF model are: 1) a risk-free rate of 4%, 2) an equityrisk premium of 7% in the China market, 3) a beta of 1.2, 4) a discount rate of 12.6%, and 5) a terminal growth rate of 3%.
Our PT implies 32x 2014E P/E and 24x 2015E P/E.
Risks to Rating and Price Target
Downside risks to our view include:
potential cannibalization between mobile games and PC games,
core PC games aging faster than expected,
inability to launch successful mobile game titles continuously,
WeChat overseas marketing spend,
video content spend.

170
Asia Pacific Equity Research09 January 2014
Alex Yao(852) 2800 [email protected]
Tencent: Summary of FinancialsIncome Statement Ratio Analysis
Rmb in millions, year end Dec FY11 FY12 FY13E FY14E FY15E Rmb in millions, year end Dec FY11 FY12 FY13E FY14E FY15E
Revenues 28,496 43,894 59,621 85,367 109,790 Gross margin 65.2% 58.5% 54.9% 57.9% 58.4%
Cost of goods sold (9,928) (18,207) (26,910) (35,941) (45,657) EBITDA margin 52.4% 43.3% 40.6% 43.5% 45.9%Gross Profit 18,568 25,686 32,711 49,426 64,133 Operating margin 45.6% 37.3% 34.6% 37.6% 39.9%
R&D expenses - - - - - Net margin 38.4% 32.4% 28.5% 31.1% 32.7%
SG&A expenses (6,596) (10,511) (14,926) (20,393) (23,652) R&D/sales - - - - -Operating profit (EBIT) 12,254 15,479 19,472 30,658 42,284 SG&A/Sales 23.1% 23.9% 25.0% 23.9% 21.5%EBITDA 14,193 18,100 23,031 35,754 48,838
Interest income 0 0 14 0 0 Sales growth 45.0% 54.0% 35.8% 43.2% 28.6%Interest expense 0 0 (82) 0 0 Operating profit growth 24.6% 26.3% 25.8% 57.4% 37.9%
Investment income (Exp.) 0 0 (68) 0 0 Net profit growth 26.7% 24.8% 22.7% 57.3% 38.0%Non-operating Income (expense) (154) (428) 166 0 0 EPS (reported) growth 26.9% 24.6% 22.3% 56.9% 37.7%
Earnings before tax 12,099 15,051 19,570 30,658 42,284
Tax (1,874) (2,266) (3,904) (6,059) (8,357) Interest coverage (x) - - 356.4 - -Net income (reported) 10,203 12,732 15,616 24,560 33,889Net income (adjusted) 10,940 14,224 17,005 26,544 35,955 Net debt to total capital 3.3% (2.9%) (22.8%) (75.8%) (147.0%)
Net debt to equity 3.4% (2.8%) (18.6%) (43.1%) (59.5%)EPS (reported) 5.49 6.84 8.37 13.13 18.07EPS (adjusted) 5.89 7.64 9.11 14.19 19.18 Asset turnover 0.6 0.7 0.7 0.8 0.8
BVPS 15.65 22.64 30.27 42.34 58.96 Working capital turns (x) 2.1 2.9 3.2 2.7 2.0DPS 0.49 0.67 0.73 1.02 1.40 ROE 43.0% 39.9% 34.5% 39.1% 37.9%
Shares outstanding 1,819 1,827 1,836 1,841 1,845 ROIC 436.9% 162.9% 128.8% 232.6% 533.5%
Balance sheet Cash flow statement
Rmb in millions, year end Dec FY11 FY12 FY13E FY14E FY15E Rmb in millions, year end Dec FY11 FY12 FY13E FY14E FY15E
Cash and cash equivalents 12,612 13,383 22,689 46,355 78,013 Net income 10,203 12,732 15,616 24,560 33,889Accounts receivable 2,021 2,354 3,909 5,596 7,197 Depr. & amortization 1,939 2,620 3,559 5,096 6,554
Inventories 0 568 0 0 0 Change in working capital 1,177 3,508 4,629 2,220 7,962Others 2,212 3,878 1,771 6,317 4,085 Other (716) 516 (6,178) 2,196 (5,805)
Current assets 35,503 36,509 45,307 75,880 107,647 Cash flow from operations 13,358 19,429 17,677 34,111 42,638LT investments 4,344 16,524 16,702 16,702 16,702 Capex (5,504) (4,092) (5,366) (6,829) (6,587)Net fixed assets 5,885 8,753 10,559 12,293 12,326 Disposal/(purchase) 1 4 0 0 0
Others 2,892 1,405 7,405 5,210 11,014 Cash flow from investing (15,355) (16,270) (7,047) (8,572) (8,397)Total Assets 56,804 75,256 93,107 124,287 162,961 Free cash flow 7,855 15,342 12,366 27,281 36,051Liabilities Equity raised/(repaid) (1,326) 97 0 0 0
ST Loans 7,999 1,077 1,077 1,077 1,077 Debt raised/(repaid) 6,584 (1,279) 0 0 0Payables 7,258 10,513 13,817 18,678 22,601 Other 10 22 0 0 0
Others 5,926 9,075 9,280 12,873 16,281 Dividends paid (895) (1,225) (1,347) (1,873) (2,584)Total current liabilities 21,183 20,665 24,174 32,628 39,959 Cash flow from financing 4,373 (2,386) (1,347) (1,873) (2,584)Long-term debt 5,593 11,131 11,131 11,131 11,131 Net change in cash 2,204 771 9,306 23,666 31,657
Other liabilities 940 1,312 1,312 1,312 1,312 Beginning cash 10,408 12,612 13,383 22,689 46,355Total Liabilities 27,716 33,108 36,616 45,071 52,402 Ending cash 12,612 13,383 22,689 46,355 78,013Shareholder's equity 29,088 42,148 56,490 79,216 110,560
Source: Company reports and J.P. Morgan estimates.
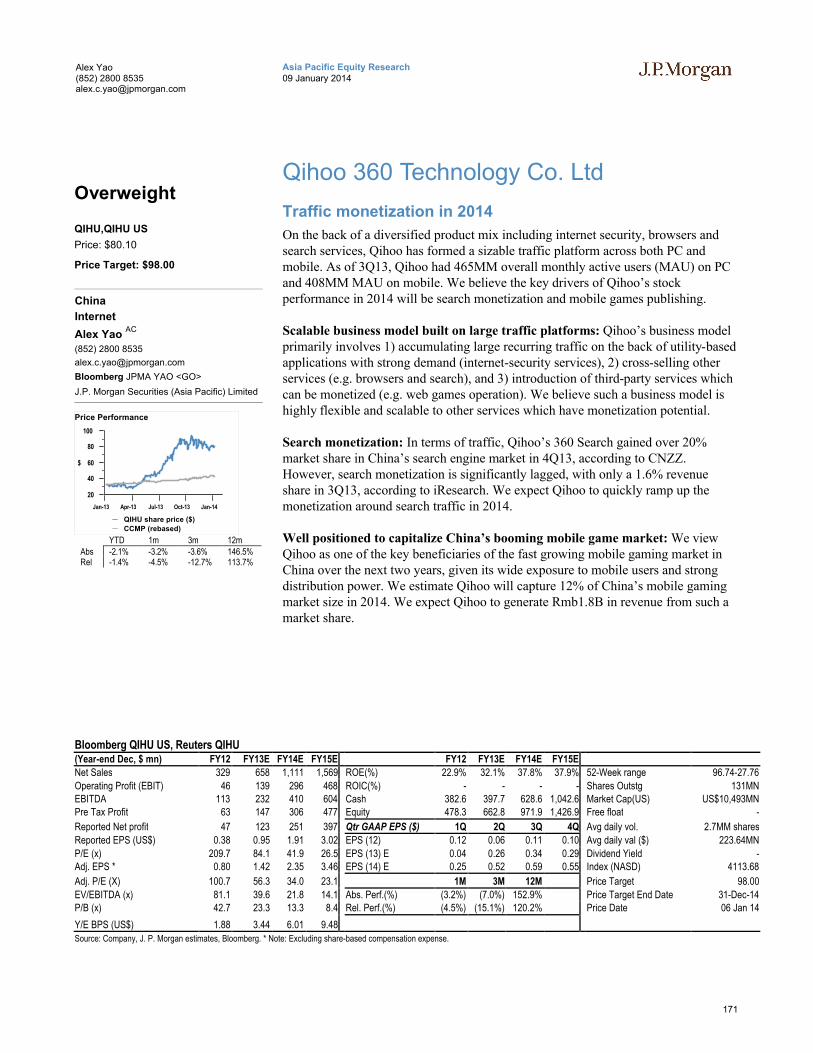
171
Asia Pacific Equity Research09 January 2014
Alex Yao(852) 2800 [email protected]
Qihoo 360 Technology Co. Ltd
Traffic monetization in 2014
On the back of a diversified product mix including internet security, browsers and search services, Qihoo has formed a sizable traffic platform across both PC and mobile. As of 3Q13, Qihoo had 465MM overall monthly active users (MAU) on PC and 408MM MAU on mobile. We believe the key drivers of Qihoo’s stock performance in 2014 will be search monetization and mobile games publishing.
Scalable business model built on large traffic platforms: Qihoo’s business model primarily involves 1) accumulating large recurring traffic on the back of utility-based applications with strong demand (internet-security services), 2) cross-selling other services (e.g. browsers and search), and 3) introduction of third-party services which can be monetized (e.g. web games operation). We believe such a business model is highly flexible and scalable to other services which have monetization potential.
Search monetization: In terms of traffic, Qihoo’s 360 Search gained over 20% market share in China’s search engine market in 4Q13, according to CNZZ. However, search monetization is significantly lagged, with only a 1.6% revenue share in 3Q13, according to iResearch. We expect Qihoo to quickly ramp up the monetization around search traffic in 2014.
Well positioned to capitalize China’s booming mobile game market: We view Qihoo as one of the key beneficiaries of the fast growing mobile gaming market in China over the next two years, given its wide exposure to mobile users and strong distribution power. We estimate Qihoo will capture 12% of China’s mobile gaming market size in 2014. We expect Qihoo to generate Rmb1.8B in revenue from such a market share.
Bloomberg QIHU US, Reuters QIHU(Year-end Dec, $ mn) FY12 FY13E FY14E FY15E FY12 FY13E FY14E FY15E
Net Sales 329 658 1,111 1,569 ROE(%) 22.9% 32.1% 37.8% 37.9% 52-Week range 96.74-27.76
Operating Profit (EBIT) 46 139 296 468 ROIC(%) - - - - Shares Outstg 131MNEBITDA 113 232 410 604 Cash 382.6 397.7 628.6 1,042.6 Market Cap(US) US$10,493MNPre Tax Profit 63 147 306 477 Equity 478.3 662.8 971.9 1,426.9 Free float -
Reported Net profit 47 123 251 397 Qtr GAAP EPS ($) 1Q 2Q 3Q 4Q Avg daily vol. 2.7MM shares
Reported EPS (US$) 0.38 0.95 1.91 3.02 EPS (12) 0.12 0.06 0.11 0.10 Avg daily val ($) 223.64MN
P/E (x) 209.7 84.1 41.9 26.5 EPS (13) E 0.04 0.26 0.34 0.29 Dividend Yield -Adj. EPS * 0.80 1.42 2.35 3.46 EPS (14) E 0.25 0.52 0.59 0.55 Index (NASD) 4113.68
Adj. P/E (X) 100.7 56.3 34.0 23.1 1M 3M 12M Price Target 98.00
EV/EBITDA (x) 81.1 39.6 21.8 14.1 Abs. Perf.(%) (3.2%) (7.0%) 152.9% Price Target End Date 31-Dec-14P/B (x) 42.7 23.3 13.3 8.4 Rel. Perf.(%) (4.5%) (15.1%) 120.2% Price Date 06 Jan 14
Y/E BPS (US$) 1.88 3.44 6.01 9.48
Source: Company, J. P. Morgan estimates, Bloomberg. * Note: Excluding share-based compensation expense.
Overweight
QIHU,QIHU US
Price: $80.10
Price Target: $98.00
China
Internet
Alex Yao AC
(852) 2800 8535
Bloomberg JPMA YAO <GO>
J.P. Morgan Securities (Asia Pacific) Limited
20
40
60
80
100
$
Jan-13 Apr-13 Jul-13 Oct-13 Jan-14
Price Performance
QIHU share price ($)
CCMP (rebased)
YTD 1m 3m 12mAbs -2.1% -3.2% -3.6% 146.5%Rel -1.4% -4.5% -12.7% 113.7%
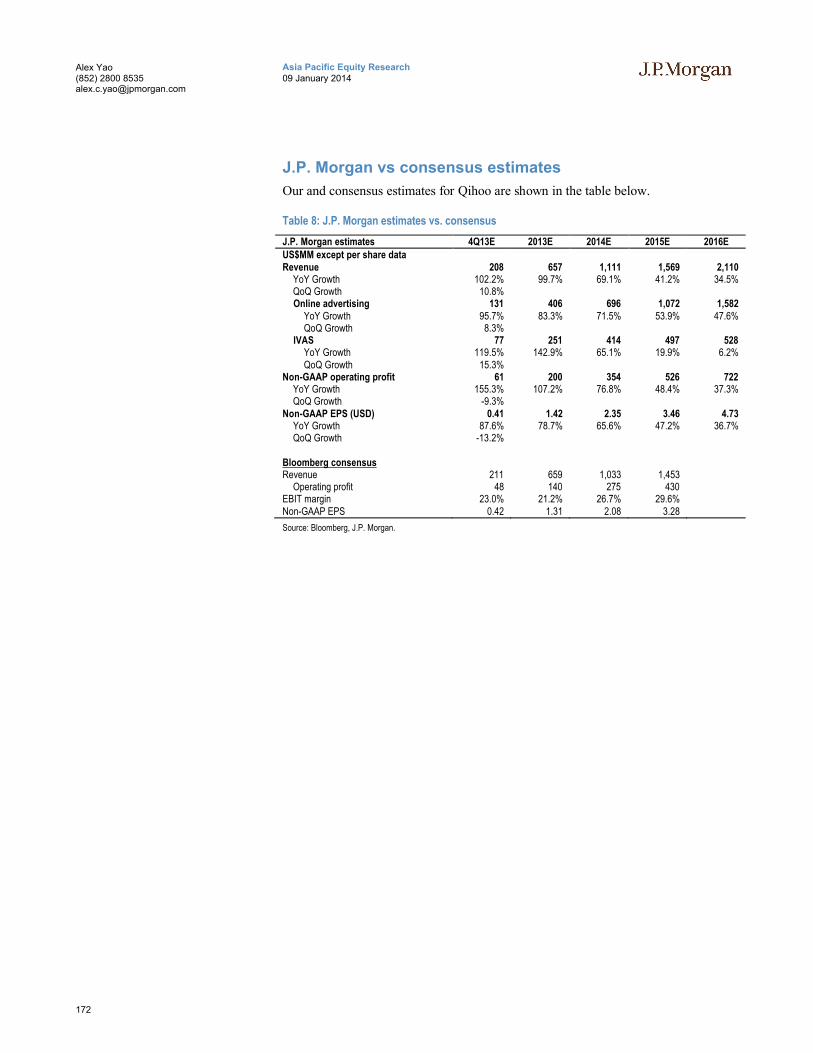
172
Asia Pacific Equity Research09 January 2014
Alex Yao(852) 2800 [email protected]
J.P. Morgan vs consensus estimates
Our and consensus estimates for Qihoo are shown in the table below.
Table 8: J.P. Morgan estimates vs. consensus
J.P. Morgan estimates 4Q13E 2013E 2014E 2015E 2016EUS$MM except per share dataRevenue 208 657 1,111 1,569 2,110
YoY Growth 102.2% 99.7% 69.1% 41.2% 34.5%QoQ Growth 10.8%Online advertising 131 406 696 1,072 1,582
YoY Growth 95.7% 83.3% 71.5% 53.9% 47.6%QoQ Growth 8.3%
IVAS 77 251 414 497 528YoY Growth 119.5% 142.9% 65.1% 19.9% 6.2%QoQ Growth 15.3%
Non-GAAP operating profit 61 200 354 526 722YoY Growth 155.3% 107.2% 76.8% 48.4% 37.3%QoQ Growth -9.3%
Non-GAAP EPS (USD) 0.41 1.42 2.35 3.46 4.73 YoY Growth 87.6% 78.7% 65.6% 47.2% 36.7%QoQ Growth -13.2%
Bloomberg consensusRevenue 211 659 1,033 1,453
Operating profit 48 140 275 430EBIT margin 23.0% 21.2% 26.7% 29.6%Non-GAAP EPS 0.42 1.31 2.08 3.28
Source: Bloomberg, J.P. Morgan.
173
Asia Pacific Equity Research09 January 2014
Alex Yao(852) 2800 [email protected]
Investment Thesis, Valuation and Risks
Qihoo 360 Technology Co. Ltd (Overweight; Price Target: $98.00)
Investment Thesis
Qihoo has formed large traffic platforms across both PC and mobile. The company is expanding revenue models towards performance-based ones (e.g. CPC/CPS ads, keyword search, game publishing) that better utilize its still-growing large traffic base. On the mobile side, we believe gaming publishing is a proven business model that will see significant growth in 2014.
Valuation
We maintain our Overweight rating on Qihoo and our Dec-14 PT of US$98. Our PT is based on 2014E non-GAAP FD EPADS of US$2.35, an FY14-16E EPADS CAGR of 42% and a PEG of 1.0x. We leverage PEG as our primary valuation methodology, as it is able to balance growth prospectus against PE multiple.
Our PT implies a 2014E P/E of 42x and a 2015E P/E of 28x.
As an additional check, we conduct a DCF valuation which yields a price of US$121. Our key assumptions in our DCF model are: 1) a long-term risk free rate of 4%, 2) an equity risk premium of 7% in China market, 3) a beta of 1.1, 4) a discount rate of 12%, and 5) a terminal growth rate of 3%.
Risks to Rating and Price Target
Downside risks to our view include:
search algorithm is behind market leader,
national distribution channel is behind market leader,
no scalable revenue model on mobile yet in spite of solid mobile usage,
lagged search monetization.
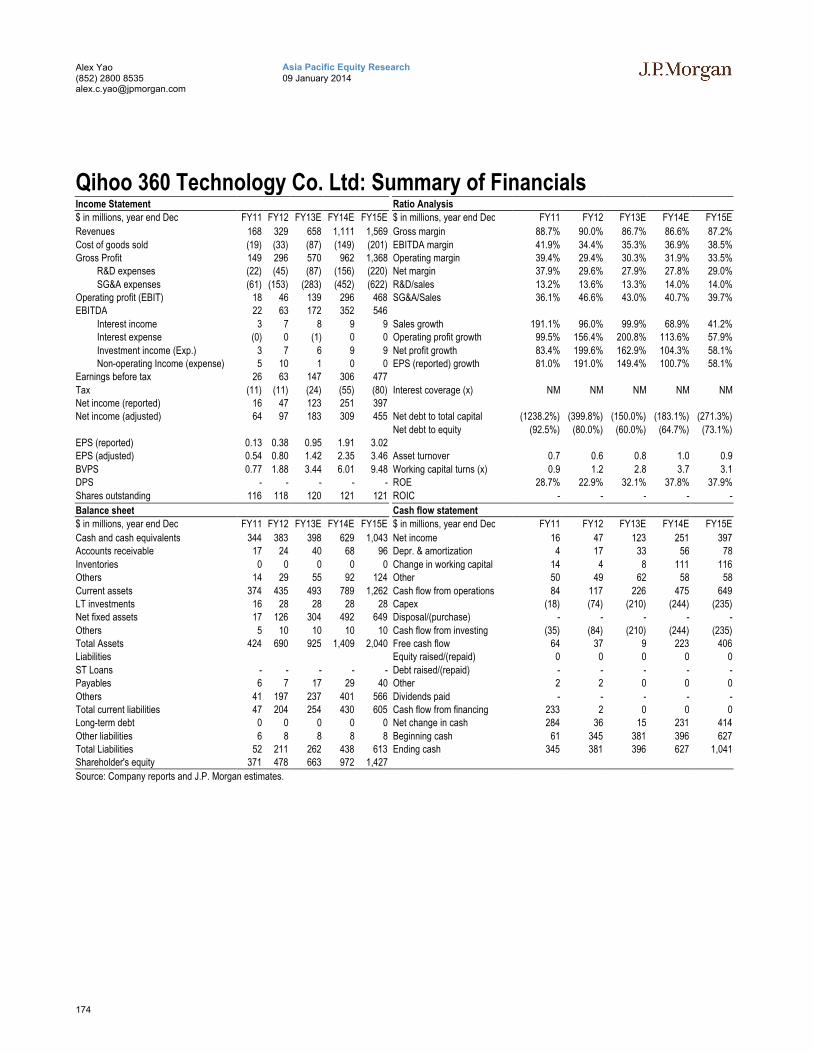
174
Asia Pacific Equity Research09 January 2014
Alex Yao(852) 2800 [email protected]
Qihoo 360 Technology Co. Ltd: Summary of FinancialsIncome Statement Ratio Analysis
$ in millions, year end Dec FY11 FY12 FY13E FY14E FY15E $ in millions, year end Dec FY11 FY12 FY13E FY14E FY15E
Revenues 168 329 658 1,111 1,569 Gross margin 88.7% 90.0% 86.7% 86.6% 87.2%
Cost of goods sold (19) (33) (87) (149) (201) EBITDA margin 41.9% 34.4% 35.3% 36.9% 38.5%Gross Profit 149 296 570 962 1,368 Operating margin 39.4% 29.4% 30.3% 31.9% 33.5%
R&D expenses (22) (45) (87) (156) (220) Net margin 37.9% 29.6% 27.9% 27.8% 29.0%
SG&A expenses (61) (153) (283) (452) (622) R&D/sales 13.2% 13.6% 13.3% 14.0% 14.0%Operating profit (EBIT) 18 46 139 296 468 SG&A/Sales 36.1% 46.6% 43.0% 40.7% 39.7%EBITDA 22 63 172 352 546
Interest income 3 7 8 9 9 Sales growth 191.1% 96.0% 99.9% 68.9% 41.2%Interest expense (0) 0 (1) 0 0 Operating profit growth 99.5% 156.4% 200.8% 113.6% 57.9%
Investment income (Exp.) 3 7 6 9 9 Net profit growth 83.4% 199.6% 162.9% 104.3% 58.1%Non-operating Income (expense) 5 10 1 0 0 EPS (reported) growth 81.0% 191.0% 149.4% 100.7% 58.1%
Earnings before tax 26 63 147 306 477
Tax (11) (11) (24) (55) (80) Interest coverage (x) NM NM NM NM NMNet income (reported) 16 47 123 251 397Net income (adjusted) 64 97 183 309 455 Net debt to total capital (1238.2%) (399.8%) (150.0%) (183.1%) (271.3%)
Net debt to equity (92.5%) (80.0%) (60.0%) (64.7%) (73.1%)EPS (reported) 0.13 0.38 0.95 1.91 3.02EPS (adjusted) 0.54 0.80 1.42 2.35 3.46 Asset turnover 0.7 0.6 0.8 1.0 0.9
BVPS 0.77 1.88 3.44 6.01 9.48 Working capital turns (x) 0.9 1.2 2.8 3.7 3.1DPS - - - - - ROE 28.7% 22.9% 32.1% 37.8% 37.9%
Shares outstanding 116 118 120 121 121 ROIC - - - - -
Balance sheet Cash flow statement
$ in millions, year end Dec FY11 FY12 FY13E FY14E FY15E $ in millions, year end Dec FY11 FY12 FY13E FY14E FY15E
Cash and cash equivalents 344 383 398 629 1,043 Net income 16 47 123 251 397Accounts receivable 17 24 40 68 96 Depr. & amortization 4 17 33 56 78
Inventories 0 0 0 0 0 Change in working capital 14 4 8 111 116Others 14 29 55 92 124 Other 50 49 62 58 58
Current assets 374 435 493 789 1,262 Cash flow from operations 84 117 226 475 649LT investments 16 28 28 28 28 Capex (18) (74) (210) (244) (235)Net fixed assets 17 126 304 492 649 Disposal/(purchase) - - - - -
Others 5 10 10 10 10 Cash flow from investing (35) (84) (210) (244) (235)Total Assets 424 690 925 1,409 2,040 Free cash flow 64 37 9 223 406Liabilities Equity raised/(repaid) 0 0 0 0 0
ST Loans - - - - - Debt raised/(repaid) - - - - -Payables 6 7 17 29 40 Other 2 2 0 0 0
Others 41 197 237 401 566 Dividends paid - - - - -Total current liabilities 47 204 254 430 605 Cash flow from financing 233 2 0 0 0Long-term debt 0 0 0 0 0 Net change in cash 284 36 15 231 414
Other liabilities 6 8 8 8 8 Beginning cash 61 345 381 396 627Total Liabilities 52 211 262 438 613 Ending cash 345 381 396 627 1,041Shareholder's equity 371 478 663 972 1,427
Source: Company reports and J.P. Morgan estimates.

175
Asia Pacific Equity Research09 January 2014
Alex Yao(852) 2800 [email protected]
YY Inc
New-type SNS leader incubating platform value
YY has established the leadership in online rich-media-based communications social networking market in China. We believe YY is similar to Tencent in 2005 in terms of its monetization stage and profitability, given their 1) similar scale of user base, 2) social communications focus and 3) direct monetization model facing consumers (fee-based). We expect YY’s operating margin to increase from 13% in 2012 to 25% in 2013 and 27% in 2014. We believe the stock price of YY in 2014 will be primarily driven by YY Music and mobile games publishing.
Scalability of social platforms: YY offers a social platform which enables users to communicate through rich media (e.g. voice, video and emoticons) on a real-time basis. Based on its key competence, YY has accumulated over 500MM registered users and 87MM MAUs as of 3Q13. The scalability of YY platform lies in 1) YY’s tech, which can be easily applied to other activities where real-time voice/video communications are required (e.g. online education and online recruiting), 2) with such a large social-oriented user base, YY is able to cross sell services (e.g. gameoperations).
Strong growth of YY Music likely to continue: We believe YY Music will see another year of strong growth in 2014, driven by 1) strong demand for online interactive music shows which are still in an early stage, and 2) migration of such content from TV stations. We expect YY Music to grow by 77% YoY in 2014.
Mobile gaming initiative: YY will involve itself in both game development and publishing in 2014. User base of mobile gaming business is likely to come from 1) PC-based YY services, 2) new users from non-game services (e.g. YY Music and education services), and 3) visitors to Duowan.com, the game portal under YY. We believe YY’s mobile gaming initiative is highly likely to work, given the entertainment orientation of YY’s user base.
Bloomberg YY US, Reuters YY(Year-end Dec, Rmb mn) FY12 FY13E FY14E FY15E FY12 FY13E FY14E FY15E
Net Sales 820 1,741 2,818 3,861 ROE(%) 19.5% 34.4% 37.7% 34.9% 52-Week range 58.48-13.06
Operating Profit (EBIT) 100 415 762 1,087 ROIC(%) 0.0% 0.0% 0.0% 0.0% Shares Outstg 30MNEBITDA 133 450 819 1,159 Cash 504.7 1,037.1 1,967.7 3,166.9 Market Cap(US) US$1,740MNPre Tax Profit 124 520 842 1,175 Equity 1,323.3 1,872.6 2,742.7 3,902.0 Free float -
Reported Net profit 89 415 712 1,002 Qtr GAAP EPS (Rmb) 1Q 2Q 3Q 4Q Avg daily vol. 1.7MM shares
Reported EPS (Rmb) 2.29 7.07 12.07 16.96 EPS (12) 0.13 0.64 0.72 0.63 Avg daily val ($) 83.31MN
P/E (x) 151.3 49.1 28.8 20.5 EPS (13) E 1.06 1.34 2.18 2.49 Dividend Yield -Adj. EPS * 4.87 9.35 14.74 19.64 EPS (14) E 2.29 3.04 3.18 3.56 Index (NASD) 4113.68
Adj. P/E (x) 71.2 37.1 23.5 17.7 1M 3M 12M Price Target 67.00
EV/EBITDA (x) 50.3 13.7 6.4 3.5 Abs. Perf.(%) 15.8% 15.3% 324.7% Price Target End Date 31-Dec-14P/B (x) 8.0 10.3 6.9 4.8 Rel. Perf.(%) 14.5% 7.3% 292.0% Price Date 06 Jan 14
Y/E BPS (Rmb) 43.61 33.69 50.43 71.72
Source: Company, J. P. Morgan estimates, Bloomberg. * Note: Excluding share-based compensation expense.
Overweight
YY,YY US
Price: $57.34
Price Target: $67.00
China
Internet
Alex Yao AC
(852) 2800 8535
Bloomberg JPMA YAO <GO>
J.P. Morgan Securities (Asia Pacific) Limited
10
20
30
40
50
60
$
Jan-13 Apr-13 Jul-13 Oct-13 Jan-14
Price Performance
YY share price ($)
CCMP (rebased)
YTD 1m 3m 12mAbs 9.3% 15.8% 16.8% 314.0%Rel 10.0% 14.5% 7.7% 281.2%
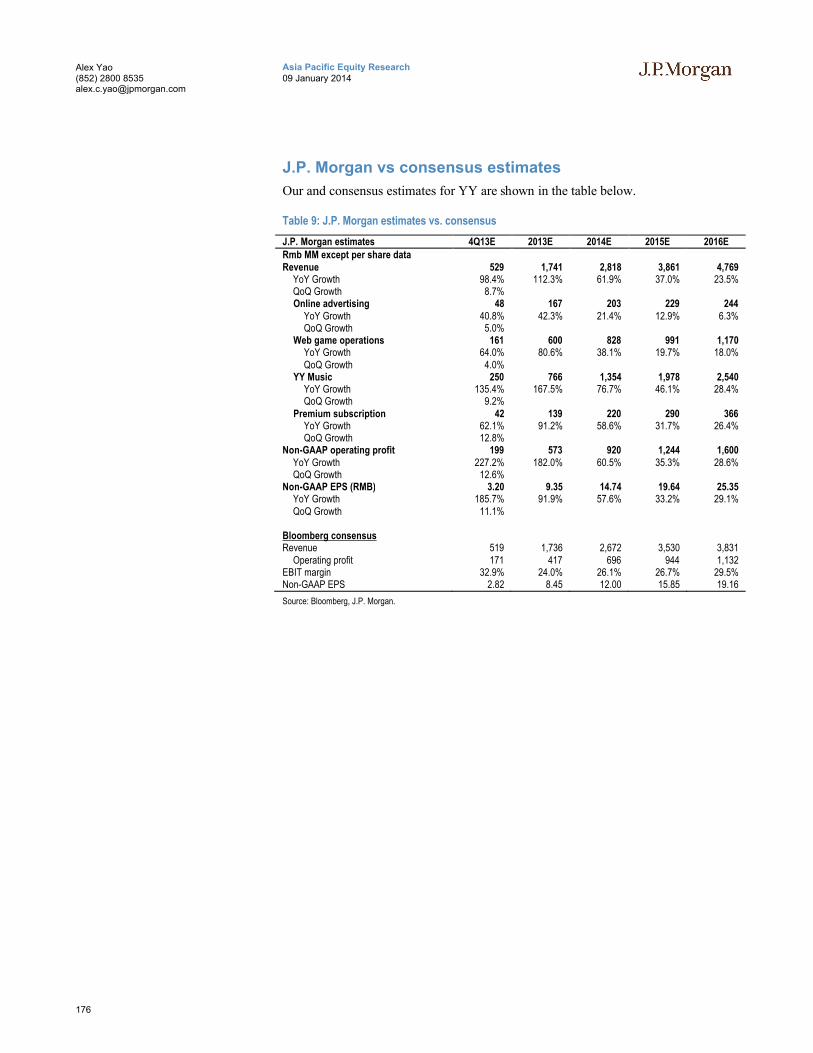
176
Asia Pacific Equity Research09 January 2014
Alex Yao(852) 2800 [email protected]
J.P. Morgan vs consensus estimates
Our and consensus estimates for YY are shown in the table below.
Table 9: J.P. Morgan estimates vs. consensus
J.P. Morgan estimates 4Q13E 2013E 2014E 2015E 2016ERmb MM except per share dataRevenue 529 1,741 2,818 3,861 4,769
YoY Growth 98.4% 112.3% 61.9% 37.0% 23.5%QoQ Growth 8.7%Online advertising 48 167 203 229 244
YoY Growth 40.8% 42.3% 21.4% 12.9% 6.3%QoQ Growth 5.0%
Web game operations 161 600 828 991 1,170YoY Growth 64.0% 80.6% 38.1% 19.7% 18.0%QoQ Growth 4.0%
YY Music 250 766 1,354 1,978 2,540YoY Growth 135.4% 167.5% 76.7% 46.1% 28.4%QoQ Growth 9.2%
Premium subscription 42 139 220 290 366YoY Growth 62.1% 91.2% 58.6% 31.7% 26.4%QoQ Growth 12.8%
Non-GAAP operating profit 199 573 920 1,244 1,600YoY Growth 227.2% 182.0% 60.5% 35.3% 28.6%QoQ Growth 12.6%
Non-GAAP EPS (RMB) 3.20 9.35 14.74 19.64 25.35 YoY Growth 185.7% 91.9% 57.6% 33.2% 29.1%QoQ Growth 11.1%
Bloomberg consensusRevenue 519 1,736 2,672 3,530 3,831
Operating profit 171 417 696 944 1,132EBIT margin 32.9% 24.0% 26.1% 26.7% 29.5%Non-GAAP EPS 2.82 8.45 12.00 15.85 19.16
Source: Bloomberg, J.P. Morgan.
177
Asia Pacific Equity Research09 January 2014
Alex Yao(852) 2800 [email protected]
Investment Thesis, Valuation and Risks
YY Inc (Overweight; Price Target: $67.00)
Investment Thesis
We liken YY to Tencent in 2005 in terms of monetization stage and profitability. We believe the similarities between the two names include user base scale, social communications and customer-faced revenue model. As a result, we expect margin improvement on YY, as Tencent achieved from 2005 to 2010, due to decreasing marketing expenses, infrastructure and personnel cost as a percentage of total revenue. We expect the operating margin of YY to increase from 13% in 2012 to 25% in 2013 and 27% in 2014.
Valuation
We maintain our Overweight rating on YY with a Jun-14 PT of US$68. Our PT isbased on 2014E non-GAAP FD EPADS of US$2.40, an FY14-16E EPADS CAGR of 31% and a PEG of 0.9x. We adopt PEG as our primary valuation methodology, as it is able to balance the growth outlook against P/E multiples.
Our PT implies a 2014E P/E of 28x and a 2015E P/E of 21x. The PEG of 0.9x is lower than the 2014E PEG multiples for traditional portals such as Sina (1.0x) and Tencent (1.0x).
Our 10-year DCF valuation delivers a price of US$77. The key assumptions in our DCF valuation are: 1) long-term risk free rate of 4%, 2) an equity risk premium of 7% in the China market, 3) a beta of 1.1, 4) a discount rate of 12% and 5) a terminal growth rate of 3%.
Risks to Rating and Price Target
Downside risks to our view include:
execution risks
increasing competition from other platforms
higher-than-expected marketing expenses

178
Asia Pacific Equity Research09 January 2014
Alex Yao(852) 2800 [email protected]
YY Inc: Summary of FinancialsIncome Statement Ratio Analysis
Rmb in millions, year end Dec FY11 FY12 FY13E FY14E FY15E Rmb in millions, year end Dec FY11 FY12 FY13E FY14E FY15E
Revenues 320 820 1,741 2,818 3,861 Gross margin 42.8% 49.3% 51.9% 52.7% 52.9%
Cost of goods sold (183) (416) (837) (1,332) (1,818) EBITDA margin (27.3%) 16.2% 25.9% 29.1% 30.0%Gross Profit 137 404 904 1,486 2,043 Operating margin (31.7%) 12.2% 23.8% 27.0% 28.1%
R&D expenses (107) (177) (257) (428) (568) Net margin 16.2% 23.1% 31.6% 30.9% 30.0%
SG&A expenses (132) (127) (232) (296) (388) R&D/sales 33.4% 21.6% 14.8% 15.2% 14.7%Operating profit (EBIT) (101) 100 415 762 1,087 SG&A/Sales 41.2% 15.5% 13.3% 10.5% 10.1%EBITDA (87) 133 450 819 1,159
Interest income 5 20 59 80 88 Sales growth 149.1% 156.5% 112.3% 61.9% 37.0%Interest expense 0 0 0 0 0 Operating profit growth (56.9%) (199.0%) 313.3% 83.7% 42.6%
Investment income (Exp.) 5 20 59 80 88 Net profit growth (65.2%) (207.2%) 365.7% 71.5% 40.6%Non-operating Income (expense) 16 4 46 0 0 EPS (reported) growth (70.9%) (167.0%) 208.4% 70.7% 40.5%
Earnings before tax (80) 124 520 842 1,175
Tax (1) (29) (87) (130) (173) Interest coverage (x) 17.9 NM NM NM NMNet income (reported) (83) 89 415 712 1,002Net income (adjusted) 52 190 549 870 1,159 Net debt to total capital - - - - -
Net debt to equity - - - - -EPS (reported) (3.42) 2.29 7.07 12.07 16.96EPS (adjusted) 2.13 4.87 9.35 14.74 19.64 Asset turnover 0.7 0.7 0.9 1.0 0.9
BVPS 25.49 43.61 33.69 50.43 71.72 Working capital turns (x) 1.6 0.9 1.2 1.3 1.3DPS - - - - - ROE 19.8% 19.5% 34.4% 37.7% 34.9%
Shares outstanding 24 30 56 54 54 ROIC 0.0% 0.0% 0.0% 0.0% 0.0%
Balance sheet Cash flow statement
Rmb in millions, year end Dec FY11 FY12 FY13E FY14E FY15E Rmb in millions, year end Dec FY11 FY12 FY13E FY14E FY15E
Cash and cash equivalents 129 505 1,037 1,968 3,167 Net income (83) 89 415 712 1,002Accounts receivable 47 118 198 321 439 Depr. & amortization 14 32 35 57 73
Inventories - - - - - Change in working capital 56 149 0 0 0Others 497 955 963 983 1,002 Other 113 86 128 274 270
Current assets 673 1,578 2,199 3,272 4,609 Cash flow from operations 100 357 579 1,043 1,345LT investments 5 3 3 3 3 Capex (47) (61) (66) (110) (143)Net fixed assets 54 90 125 182 257 Disposal/(purchase) 0 0 0 0 0
Others 2 4 4 4 4 Cash flow from investing (528) (499) (68) (112) (145)Total Assets 745 1,696 2,350 3,479 4,888 Free cash flow 48 281 464 865 1,127Liabilities Equity raised/(repaid) 489 523 0 0 0
ST Loans - - - - - Debt raised/(repaid) - - - - -Payables 16 28 69 110 149 Other (11) 0 0 0 0
Others 110 338 402 620 831 Dividends paid - - - - -Total current liabilities 126 366 471 729 980 Cash flow from financing 478 523 0 0 0Long-term debt - - - - - Net change in cash 45 376 532 931 1,199
Other liabilities 0 6 6 6 6 Beginning cash 84 129 505 1,037 1,968Total Liabilities 126 373 477 736 986 Ending cash 129 505 1,037 1,968 3,167Shareholder's equity 619 1,323 1,873 2,743 3,902
Source: Company reports and J.P. Morgan estimates.
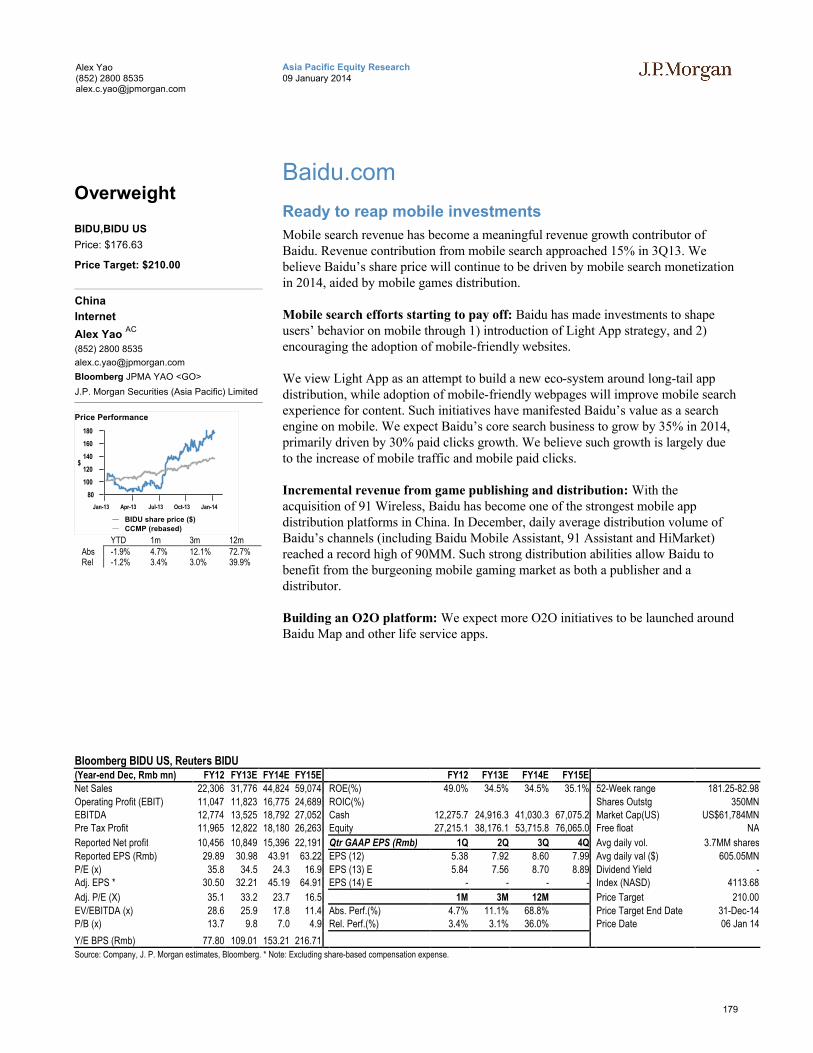
179
Asia Pacific Equity Research09 January 2014
Alex Yao(852) 2800 [email protected]
Baidu.com
Ready to reap mobile investments
Mobile search revenue has become a meaningful revenue growth contributor of Baidu. Revenue contribution from mobile search approached 15% in 3Q13. We believe Baidu’s share price will continue to be driven by mobile search monetization in 2014, aided by mobile games distribution.
Mobile search efforts starting to pay off: Baidu has made investments to shape users’ behavior on mobile through 1) introduction of Light App strategy, and 2) encouraging the adoption of mobile-friendly websites.
We view Light App as an attempt to build a new eco-system around long-tail app distribution, while adoption of mobile-friendly webpages will improve mobile search experience for content. Such initiatives have manifested Baidu’s value as a search engine on mobile. We expect Baidu’s core search business to grow by 35% in 2014, primarily driven by 30% paid clicks growth. We believe such growth is largely due to the increase of mobile traffic and mobile paid clicks.
Incremental revenue from game publishing and distribution: With the acquisition of 91 Wireless, Baidu has become one of the strongest mobile app distribution platforms in China. In December, daily average distribution volume of Baidu’s channels (including Baidu Mobile Assistant, 91 Assistant and HiMarket) reached a record high of 90MM. Such strong distribution abilities allow Baidu to benefit from the burgeoning mobile gaming market as both a publisher and a distributor.
Building an O2O platform: We expect more O2O initiatives to be launched around Baidu Map and other life service apps.
Bloomberg BIDU US, Reuters BIDU(Year-end Dec, Rmb mn) FY12 FY13E FY14E FY15E FY12 FY13E FY14E FY15E
Net Sales 22,306 31,776 44,824 59,074 ROE(%) 49.0% 34.5% 34.5% 35.1% 52-Week range 181.25-82.98
Operating Profit (EBIT) 11,047 11,823 16,775 24,689 ROIC(%) Shares Outstg 350MNEBITDA 12,774 13,525 18,792 27,052 Cash 12,275.7 24,916.3 41,030.3 67,075.2 Market Cap(US) US$61,784MNPre Tax Profit 11,965 12,822 18,180 26,263 Equity 27,215.1 38,176.1 53,715.8 76,065.0 Free float NA
Reported Net profit 10,456 10,849 15,396 22,191 Qtr GAAP EPS (Rmb) 1Q 2Q 3Q 4Q Avg daily vol. 3.7MM shares
Reported EPS (Rmb) 29.89 30.98 43.91 63.22 EPS (12) 5.38 7.92 8.60 7.99 Avg daily val ($) 605.05MN
P/E (x) 35.8 34.5 24.3 16.9 EPS (13) E 5.84 7.56 8.70 8.89 Dividend Yield -Adj. EPS * 30.50 32.21 45.19 64.91 EPS (14) E - - - - Index (NASD) 4113.68
Adj. P/E (X) 35.1 33.2 23.7 16.5 1M 3M 12M Price Target 210.00
EV/EBITDA (x) 28.6 25.9 17.8 11.4 Abs. Perf.(%) 4.7% 11.1% 68.8% Price Target End Date 31-Dec-14P/B (x) 13.7 9.8 7.0 4.9 Rel. Perf.(%) 3.4% 3.1% 36.0% Price Date 06 Jan 14
Y/E BPS (Rmb) 77.80 109.01 153.21 216.71
Source: Company, J. P. Morgan estimates, Bloomberg. * Note: Excluding share-based compensation expense.
Overweight
BIDU,BIDU US
Price: $176.63
Price Target: $210.00
China
Internet
Alex Yao AC
(852) 2800 8535
Bloomberg JPMA YAO <GO>
J.P. Morgan Securities (Asia Pacific) Limited
80
100
120
140
160
180
$
Jan-13 Apr-13 Jul-13 Oct-13 Jan-14
Price Performance
BIDU share price ($)
CCMP (rebased)
YTD 1m 3m 12mAbs -1.9% 4.7% 12.1% 72.7%Rel -1.2% 3.4% 3.0% 39.9%
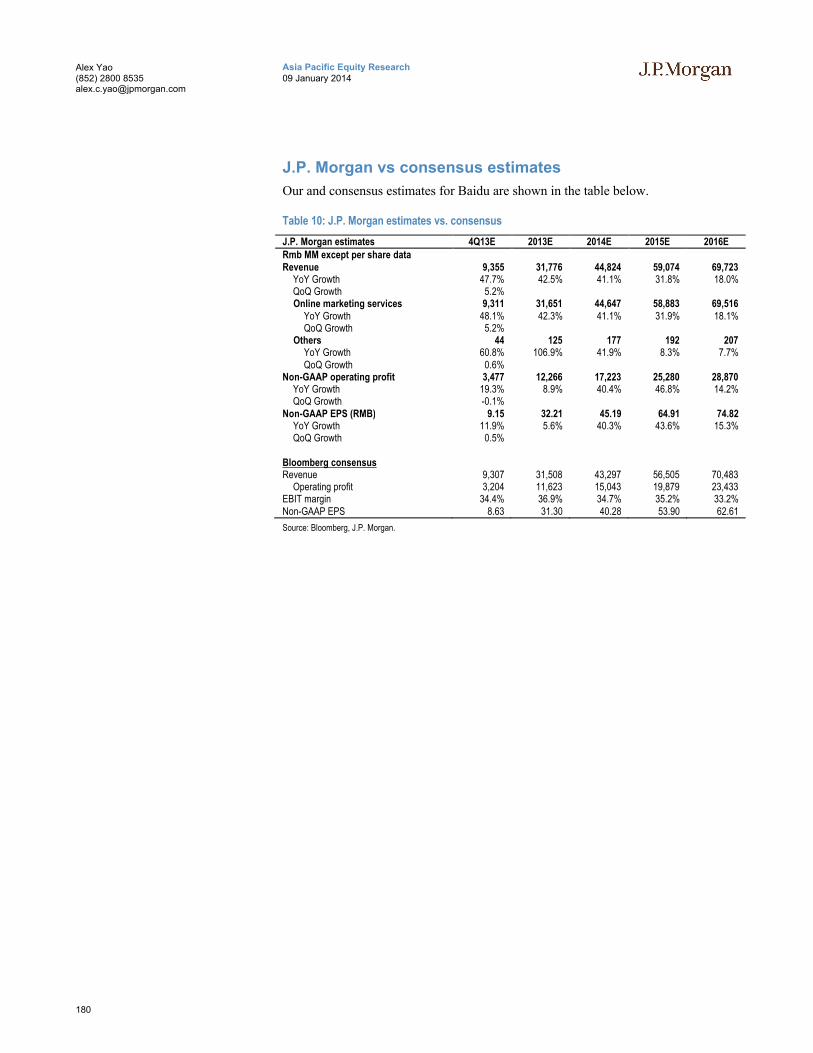
180
Asia Pacific Equity Research09 January 2014
Alex Yao(852) 2800 [email protected]
J.P. Morgan vs consensus estimates
Our and consensus estimates for Baidu are shown in the table below.
Table 10: J.P. Morgan estimates vs. consensus
J.P. Morgan estimates 4Q13E 2013E 2014E 2015E 2016ERmb MM except per share dataRevenue 9,355 31,776 44,824 59,074 69,723
YoY Growth 47.7% 42.5% 41.1% 31.8% 18.0%QoQ Growth 5.2%Online marketing services 9,311 31,651 44,647 58,883 69,516
YoY Growth 48.1% 42.3% 41.1% 31.9% 18.1%QoQ Growth 5.2%
Others 44 125 177 192 207YoY Growth 60.8% 106.9% 41.9% 8.3% 7.7%QoQ Growth 0.6%
Non-GAAP operating profit 3,477 12,266 17,223 25,280 28,870YoY Growth 19.3% 8.9% 40.4% 46.8% 14.2%QoQ Growth -0.1%
Non-GAAP EPS (RMB) 9.15 32.21 45.19 64.91 74.82YoY Growth 11.9% 5.6% 40.3% 43.6% 15.3%QoQ Growth 0.5%
Bloomberg consensusRevenue 9,307 31,508 43,297 56,505 70,483
Operating profit 3,204 11,623 15,043 19,879 23,433EBIT margin 34.4% 36.9% 34.7% 35.2% 33.2%Non-GAAP EPS 8.63 31.30 40.28 53.90 62.61
Source: Bloomberg, J.P. Morgan.
181
Asia Pacific Equity Research09 January 2014
Alex Yao(852) 2800 [email protected]
Investment Thesis, Valuation and Risks
Baidu.com (Overweight; Price Target: $210.00)
Investment Thesis
We believe Baidu is heading in the right direction to build a solid and scalable eco-system on mobile Internet. Such an eco-system should lead to more sustainable earnings growth in the longer term.
Valuation
We are Overweight on Baidu with a Dec-14 PT of US$210. Our PT is based on 2014E EPS of US$7.35, an FY14-16E Non-GAAP EPS CAGR of 29% and a PEG of 1.0x.
Our PT implies a 29x 2014E P/E and 20x 2015E P/E.
As an additional check, we conduct a DCF valuation which delivers a price of US$220. Key assumptions in our DCF valuation are: 1) a long-term risk free rate of 4%, 2) an equity risk premium of 7% in the China market, 3) a beta of 1.3, 4) a discount rate of 13% and 5) a terminal growth rate of 4%.
Risks to Rating and Price Target
Downside risks to our views include:
cannibalization between mobile search and PC traffic
increased traffic acquisition cost on PC in order to retain traffic
higher-than-expected mobile investments
higher-than-expected losses from investee companies
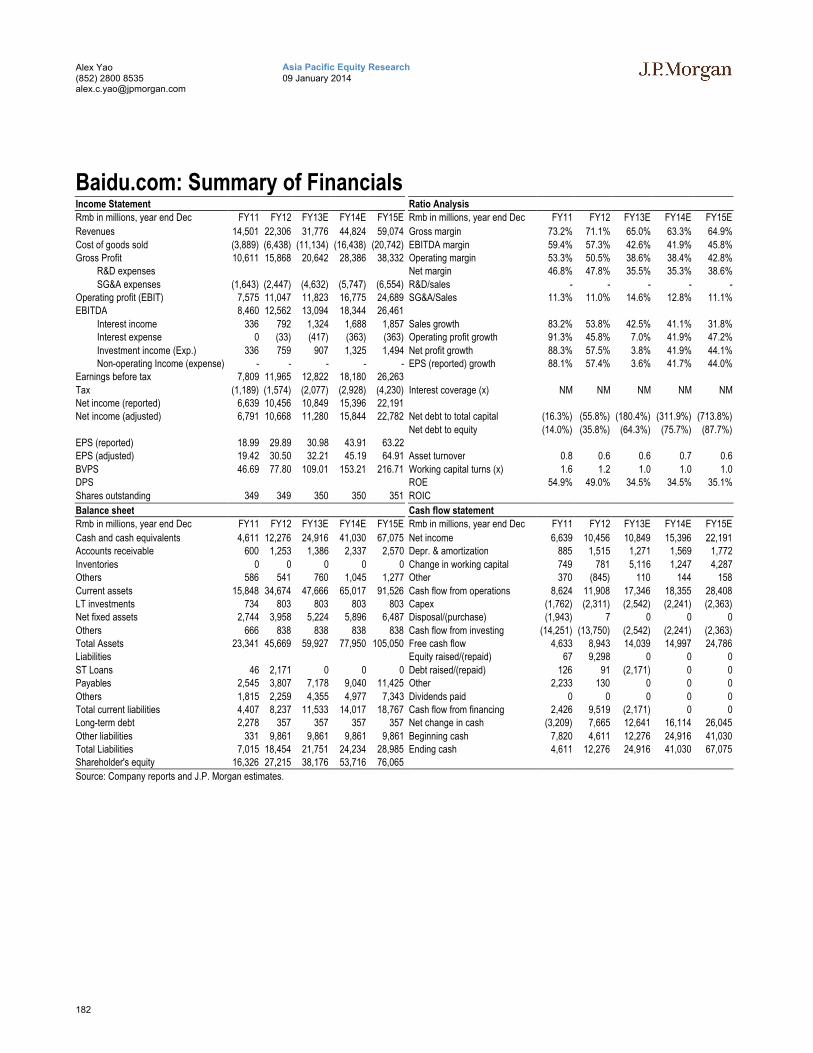
182
Asia Pacific Equity Research09 January 2014
Alex Yao(852) 2800 [email protected]
Baidu.com: Summary of FinancialsIncome Statement Ratio Analysis
Rmb in millions, year end Dec FY11 FY12 FY13E FY14E FY15E Rmb in millions, year end Dec FY11 FY12 FY13E FY14E FY15E
Revenues 14,501 22,306 31,776 44,824 59,074 Gross margin 73.2% 71.1% 65.0% 63.3% 64.9%
Cost of goods sold (3,889) (6,438) (11,134) (16,438) (20,742) EBITDA margin 59.4% 57.3% 42.6% 41.9% 45.8%Gross Profit 10,611 15,868 20,642 28,386 38,332 Operating margin 53.3% 50.5% 38.6% 38.4% 42.8%
R&D expenses Net margin 46.8% 47.8% 35.5% 35.3% 38.6%
SG&A expenses (1,643) (2,447) (4,632) (5,747) (6,554) R&D/sales - - - - -Operating profit (EBIT) 7,575 11,047 11,823 16,775 24,689 SG&A/Sales 11.3% 11.0% 14.6% 12.8% 11.1%EBITDA 8,460 12,562 13,094 18,344 26,461
Interest income 336 792 1,324 1,688 1,857 Sales growth 83.2% 53.8% 42.5% 41.1% 31.8%Interest expense 0 (33) (417) (363) (363) Operating profit growth 91.3% 45.8% 7.0% 41.9% 47.2%
Investment income (Exp.) 336 759 907 1,325 1,494 Net profit growth 88.3% 57.5% 3.8% 41.9% 44.1%Non-operating Income (expense) - - - - - EPS (reported) growth 88.1% 57.4% 3.6% 41.7% 44.0%
Earnings before tax 7,809 11,965 12,822 18,180 26,263
Tax (1,189) (1,574) (2,077) (2,928) (4,230) Interest coverage (x) NM NM NM NM NMNet income (reported) 6,639 10,456 10,849 15,396 22,191Net income (adjusted) 6,791 10,668 11,280 15,844 22,782 Net debt to total capital (16.3%) (55.8%) (180.4%) (311.9%) (713.8%)
Net debt to equity (14.0%) (35.8%) (64.3%) (75.7%) (87.7%)EPS (reported) 18.99 29.89 30.98 43.91 63.22EPS (adjusted) 19.42 30.50 32.21 45.19 64.91 Asset turnover 0.8 0.6 0.6 0.7 0.6
BVPS 46.69 77.80 109.01 153.21 216.71 Working capital turns (x) 1.6 1.2 1.0 1.0 1.0DPS ROE 54.9% 49.0% 34.5% 34.5% 35.1%
Shares outstanding 349 349 350 350 351 ROIC
Balance sheet Cash flow statement
Rmb in millions, year end Dec FY11 FY12 FY13E FY14E FY15E Rmb in millions, year end Dec FY11 FY12 FY13E FY14E FY15E
Cash and cash equivalents 4,611 12,276 24,916 41,030 67,075 Net income 6,639 10,456 10,849 15,396 22,191Accounts receivable 600 1,253 1,386 2,337 2,570 Depr. & amortization 885 1,515 1,271 1,569 1,772
Inventories 0 0 0 0 0 Change in working capital 749 781 5,116 1,247 4,287Others 586 541 760 1,045 1,277 Other 370 (845) 110 144 158
Current assets 15,848 34,674 47,666 65,017 91,526 Cash flow from operations 8,624 11,908 17,346 18,355 28,408LT investments 734 803 803 803 803 Capex (1,762) (2,311) (2,542) (2,241) (2,363)Net fixed assets 2,744 3,958 5,224 5,896 6,487 Disposal/(purchase) (1,943) 7 0 0 0
Others 666 838 838 838 838 Cash flow from investing (14,251) (13,750) (2,542) (2,241) (2,363)Total Assets 23,341 45,669 59,927 77,950 105,050 Free cash flow 4,633 8,943 14,039 14,997 24,786Liabilities Equity raised/(repaid) 67 9,298 0 0 0
ST Loans 46 2,171 0 0 0 Debt raised/(repaid) 126 91 (2,171) 0 0Payables 2,545 3,807 7,178 9,040 11,425 Other 2,233 130 0 0 0
Others 1,815 2,259 4,355 4,977 7,343 Dividends paid 0 0 0 0 0Total current liabilities 4,407 8,237 11,533 14,017 18,767 Cash flow from financing 2,426 9,519 (2,171) 0 0Long-term debt 2,278 357 357 357 357 Net change in cash (3,209) 7,665 12,641 16,114 26,045
Other liabilities 331 9,861 9,861 9,861 9,861 Beginning cash 7,820 4,611 12,276 24,916 41,030Total Liabilities 7,015 18,454 21,751 24,234 28,985 Ending cash 4,611 12,276 24,916 41,030 67,075Shareholder's equity 16,326 27,215 38,176 53,716 76,065
Source: Company reports and J.P. Morgan estimates.
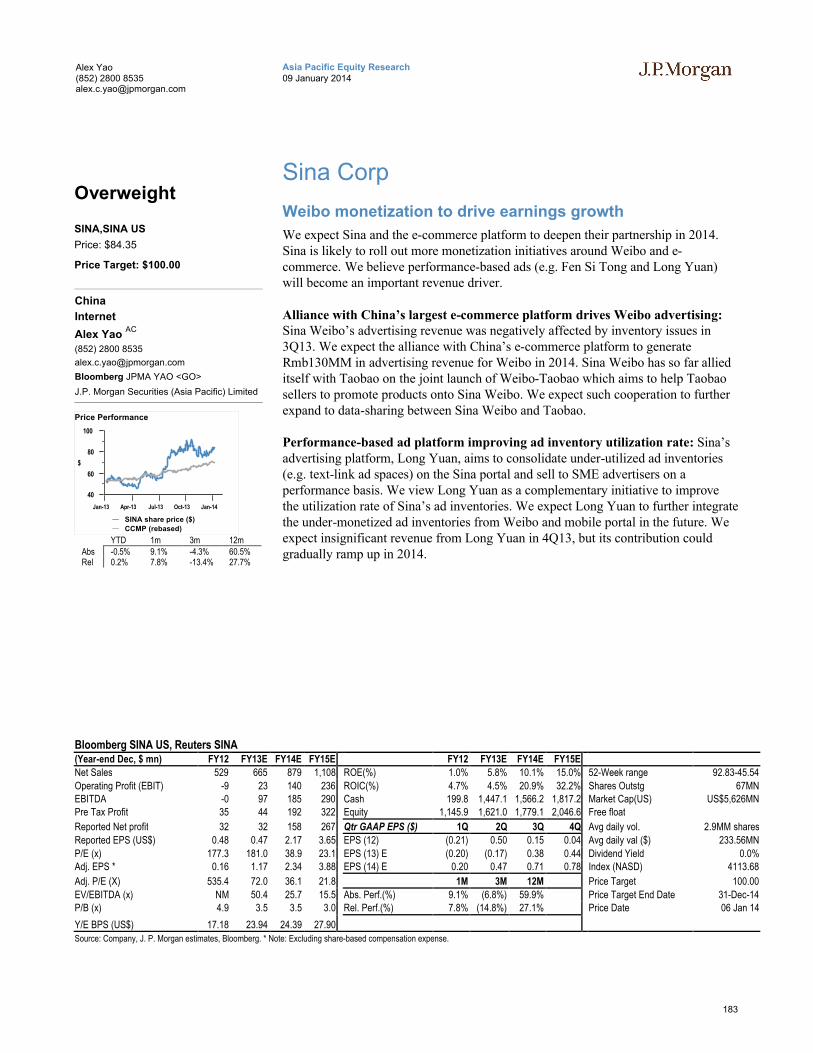
183
Asia Pacific Equity Research09 January 2014
Alex Yao(852) 2800 [email protected]
Sina Corp
Weibo monetization to drive earnings growth
We expect Sina and the e-commerce platform to deepen their partnership in 2014. Sina is likely to roll out more monetization initiatives around Weibo and e-commerce. We believe performance-based ads (e.g. Fen Si Tong and Long Yuan) will become an important revenue driver.
Alliance with China’s largest e-commerce platform drives Weibo advertising:Sina Weibo’s advertising revenue was negatively affected by inventory issues in 3Q13. We expect the alliance with China’s e-commerce platform to generate Rmb130MM in advertising revenue for Weibo in 2014. Sina Weibo has so far allied itself with Taobao on the joint launch of Weibo-Taobao which aims to help Taobao sellers to promote products onto Sina Weibo. We expect such cooperation to further expand to data-sharing between Sina Weibo and Taobao.
Performance-based ad platform improving ad inventory utilization rate: Sina’s advertising platform, Long Yuan, aims to consolidate under-utilized ad inventories (e.g. text-link ad spaces) on the Sina portal and sell to SME advertisers on a performance basis. We view Long Yuan as a complementary initiative to improve the utilization rate of Sina’s ad inventories. We expect Long Yuan to further integrate the under-monetized ad inventories from Weibo and mobile portal in the future. We expect insignificant revenue from Long Yuan in 4Q13, but its contribution could gradually ramp up in 2014.
Bloomberg SINA US, Reuters SINA(Year-end Dec, $ mn) FY12 FY13E FY14E FY15E FY12 FY13E FY14E FY15E
Net Sales 529 665 879 1,108 ROE(%) 1.0% 5.8% 10.1% 15.0% 52-Week range 92.83-45.54
Operating Profit (EBIT) -9 23 140 236 ROIC(%) 4.7% 4.5% 20.9% 32.2% Shares Outstg 67MNEBITDA -0 97 185 290 Cash 199.8 1,447.1 1,566.2 1,817.2 Market Cap(US) US$5,626MNPre Tax Profit 35 44 192 322 Equity 1,145.9 1,621.0 1,779.1 2,046.6 Free float
Reported Net profit 32 32 158 267 Qtr GAAP EPS ($) 1Q 2Q 3Q 4Q Avg daily vol. 2.9MM shares
Reported EPS (US$) 0.48 0.47 2.17 3.65 EPS (12) (0.21) 0.50 0.15 0.04 Avg daily val ($) 233.56MN
P/E (x) 177.3 181.0 38.9 23.1 EPS (13) E (0.20) (0.17) 0.38 0.44 Dividend Yield 0.0%Adj. EPS * 0.16 1.17 2.34 3.88 EPS (14) E 0.20 0.47 0.71 0.78 Index (NASD) 4113.68
Adj. P/E (X) 535.4 72.0 36.1 21.8 1M 3M 12M Price Target 100.00
EV/EBITDA (x) NM 50.4 25.7 15.5 Abs. Perf.(%) 9.1% (6.8%) 59.9% Price Target End Date 31-Dec-14P/B (x) 4.9 3.5 3.5 3.0 Rel. Perf.(%) 7.8% (14.8%) 27.1% Price Date 06 Jan 14
Y/E BPS (US$) 17.18 23.94 24.39 27.90
Source: Company, J. P. Morgan estimates, Bloomberg. * Note: Excluding share-based compensation expense.
Overweight
SINA,SINA US
Price: $84.35
Price Target: $100.00
China
Internet
Alex Yao AC
(852) 2800 8535
Bloomberg JPMA YAO <GO>
J.P. Morgan Securities (Asia Pacific) Limited
40
60
80
100
$
Jan-13 Apr-13 Jul-13 Oct-13 Jan-14
Price Performance
SINA share price ($)
CCMP (rebased)
YTD 1m 3m 12mAbs -0.5% 9.1% -4.3% 60.5%Rel 0.2% 7.8% -13.4% 27.7%
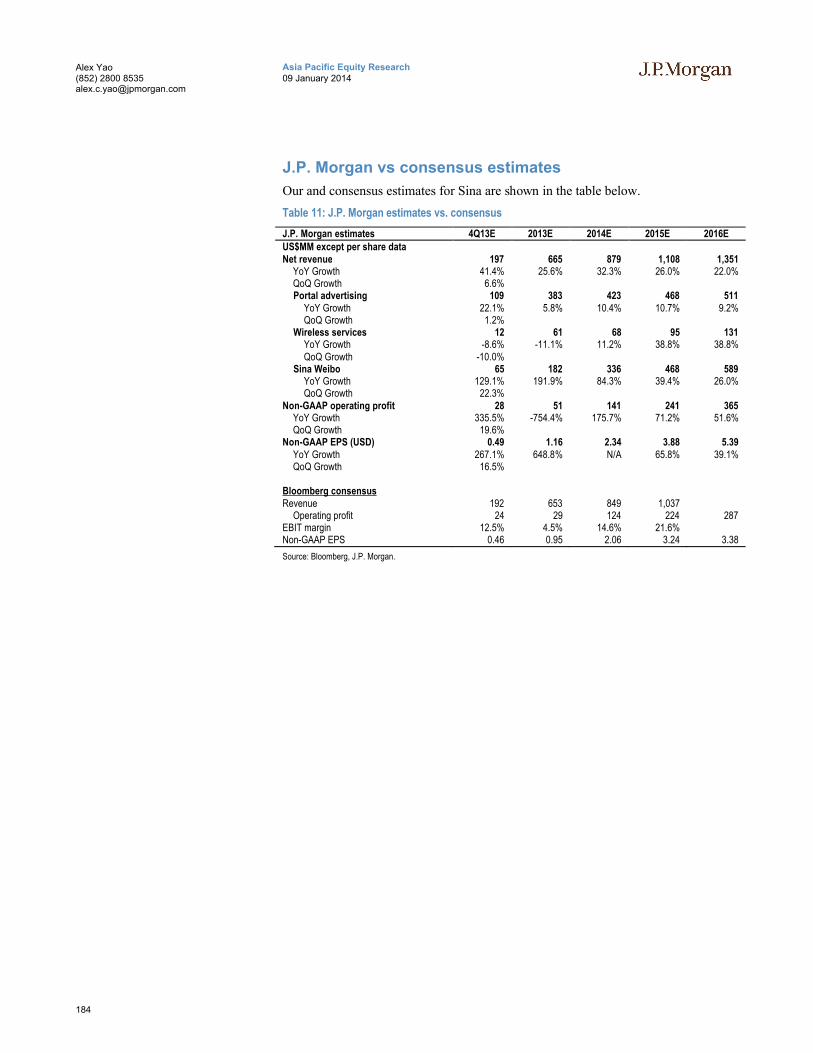
184
Asia Pacific Equity Research09 January 2014
Alex Yao(852) 2800 [email protected]
J.P. Morgan vs consensus estimates
Our and consensus estimates for Sina are shown in the table below.
Table 11: J.P. Morgan estimates vs. consensus
J.P. Morgan estimates 4Q13E 2013E 2014E 2015E 2016EUS$MM except per share dataNet revenue 197 665 879 1,108 1,351
YoY Growth 41.4% 25.6% 32.3% 26.0% 22.0%QoQ Growth 6.6%Portal advertising 109 383 423 468 511
YoY Growth 22.1% 5.8% 10.4% 10.7% 9.2%QoQ Growth 1.2%
Wireless services 12 61 68 95 131YoY Growth -8.6% -11.1% 11.2% 38.8% 38.8%QoQ Growth -10.0%
Sina Weibo 65 182 336 468 589YoY Growth 129.1% 191.9% 84.3% 39.4% 26.0%QoQ Growth 22.3%
Non-GAAP operating profit 28 51 141 241 365YoY Growth 335.5% -754.4% 175.7% 71.2% 51.6%QoQ Growth 19.6%
Non-GAAP EPS (USD) 0.49 1.16 2.34 3.88 5.39 YoY Growth 267.1% 648.8% N/A 65.8% 39.1%QoQ Growth 16.5%
Bloomberg consensusRevenue 192 653 849 1,037
Operating profit 24 29 124 224 287EBIT margin 12.5% 4.5% 14.6% 21.6%Non-GAAP EPS 0.46 0.95 2.06 3.24 3.38
Source: Bloomberg, J.P. Morgan.
185
Asia Pacific Equity Research09 January 2014
Alex Yao(852) 2800 [email protected]
Investment Thesis, Valuation and Risks
Sina Corp (Overweight; Price Target: $100.00)
Investment Thesis
We expect Weibo monetization to quickly improve Sina’s profitability over the next 12 months. With the cooperation with China’s largest e-commerce platform, Sina Weibo is likely to expand monetization to e-commerce and SMEs. We expect Weibo’s quarterly net profit to turn positive in 4Q13. We expect increasing Weibo monetization to drive Sina’s OM from -2% in 2012 to 8% in 2013 and 16% in 2014.
Valuation
Our SOTP valuation yields a Dec-14 US$100 price target. Key valuation metrics in our SOTP valuation are:
14x 2014E non-GAAP P/E on portal ads
8x 2014E non-GAAP P/E on WVAS
A US$5B valuation of Sina Weibo on US$46MM 2014E net profit, a 2014-16E CAGR of 120% and 0.9x PEG
Our PT implies a 43x 2014E P/E and 26x 2015E P/E.
Risks to Rating and Price Target
Downside risks to our views include:
a soft brand advertising outlook could prove worse than expected
relatively weak execution ability and product innovations compared to other larger Internet peers
Weibo usage from PC could stagnate, leading to limited inventory growth
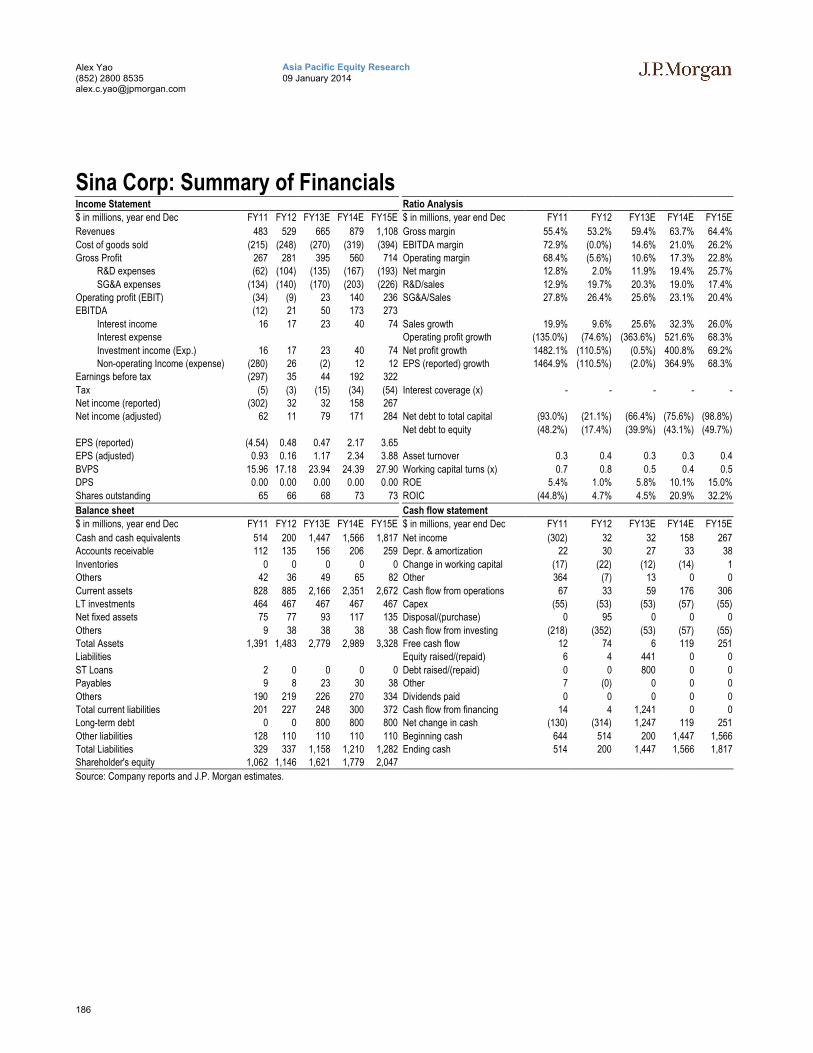
186
Asia Pacific Equity Research09 January 2014
Alex Yao(852) 2800 [email protected]
Sina Corp: Summary of FinancialsIncome Statement Ratio Analysis
$ in millions, year end Dec FY11 FY12 FY13E FY14E FY15E $ in millions, year end Dec FY11 FY12 FY13E FY14E FY15E
Revenues 483 529 665 879 1,108 Gross margin 55.4% 53.2% 59.4% 63.7% 64.4%
Cost of goods sold (215) (248) (270) (319) (394) EBITDA margin 72.9% (0.0%) 14.6% 21.0% 26.2%Gross Profit 267 281 395 560 714 Operating margin 68.4% (5.6%) 10.6% 17.3% 22.8%
R&D expenses (62) (104) (135) (167) (193) Net margin 12.8% 2.0% 11.9% 19.4% 25.7%
SG&A expenses (134) (140) (170) (203) (226) R&D/sales 12.9% 19.7% 20.3% 19.0% 17.4%Operating profit (EBIT) (34) (9) 23 140 236 SG&A/Sales 27.8% 26.4% 25.6% 23.1% 20.4%EBITDA (12) 21 50 173 273
Interest income 16 17 23 40 74 Sales growth 19.9% 9.6% 25.6% 32.3% 26.0%Interest expense Operating profit growth (135.0%) (74.6%) (363.6%) 521.6% 68.3%
Investment income (Exp.) 16 17 23 40 74 Net profit growth 1482.1% (110.5%) (0.5%) 400.8% 69.2%Non-operating Income (expense) (280) 26 (2) 12 12 EPS (reported) growth 1464.9% (110.5%) (2.0%) 364.9% 68.3%
Earnings before tax (297) 35 44 192 322
Tax (5) (3) (15) (34) (54) Interest coverage (x) - - - - -Net income (reported) (302) 32 32 158 267Net income (adjusted) 62 11 79 171 284 Net debt to total capital (93.0%) (21.1%) (66.4%) (75.6%) (98.8%)
Net debt to equity (48.2%) (17.4%) (39.9%) (43.1%) (49.7%)EPS (reported) (4.54) 0.48 0.47 2.17 3.65EPS (adjusted) 0.93 0.16 1.17 2.34 3.88 Asset turnover 0.3 0.4 0.3 0.3 0.4
BVPS 15.96 17.18 23.94 24.39 27.90 Working capital turns (x) 0.7 0.8 0.5 0.4 0.5DPS 0.00 0.00 0.00 0.00 0.00 ROE 5.4% 1.0% 5.8% 10.1% 15.0%
Shares outstanding 65 66 68 73 73 ROIC (44.8%) 4.7% 4.5% 20.9% 32.2%
Balance sheet Cash flow statement
$ in millions, year end Dec FY11 FY12 FY13E FY14E FY15E $ in millions, year end Dec FY11 FY12 FY13E FY14E FY15E
Cash and cash equivalents 514 200 1,447 1,566 1,817 Net income (302) 32 32 158 267Accounts receivable 112 135 156 206 259 Depr. & amortization 22 30 27 33 38
Inventories 0 0 0 0 0 Change in working capital (17) (22) (12) (14) 1Others 42 36 49 65 82 Other 364 (7) 13 0 0
Current assets 828 885 2,166 2,351 2,672 Cash flow from operations 67 33 59 176 306LT investments 464 467 467 467 467 Capex (55) (53) (53) (57) (55)Net fixed assets 75 77 93 117 135 Disposal/(purchase) 0 95 0 0 0
Others 9 38 38 38 38 Cash flow from investing (218) (352) (53) (57) (55)Total Assets 1,391 1,483 2,779 2,989 3,328 Free cash flow 12 74 6 119 251Liabilities Equity raised/(repaid) 6 4 441 0 0
ST Loans 2 0 0 0 0 Debt raised/(repaid) 0 0 800 0 0Payables 9 8 23 30 38 Other 7 (0) 0 0 0
Others 190 219 226 270 334 Dividends paid 0 0 0 0 0Total current liabilities 201 227 248 300 372 Cash flow from financing 14 4 1,241 0 0Long-term debt 0 0 800 800 800 Net change in cash (130) (314) 1,247 119 251
Other liabilities 128 110 110 110 110 Beginning cash 644 514 200 1,447 1,566Total Liabilities 329 337 1,158 1,210 1,282 Ending cash 514 200 1,447 1,566 1,817Shareholder's equity 1,062 1,146 1,621 1,779 2,047
Source: Company reports and J.P. Morgan estimates.
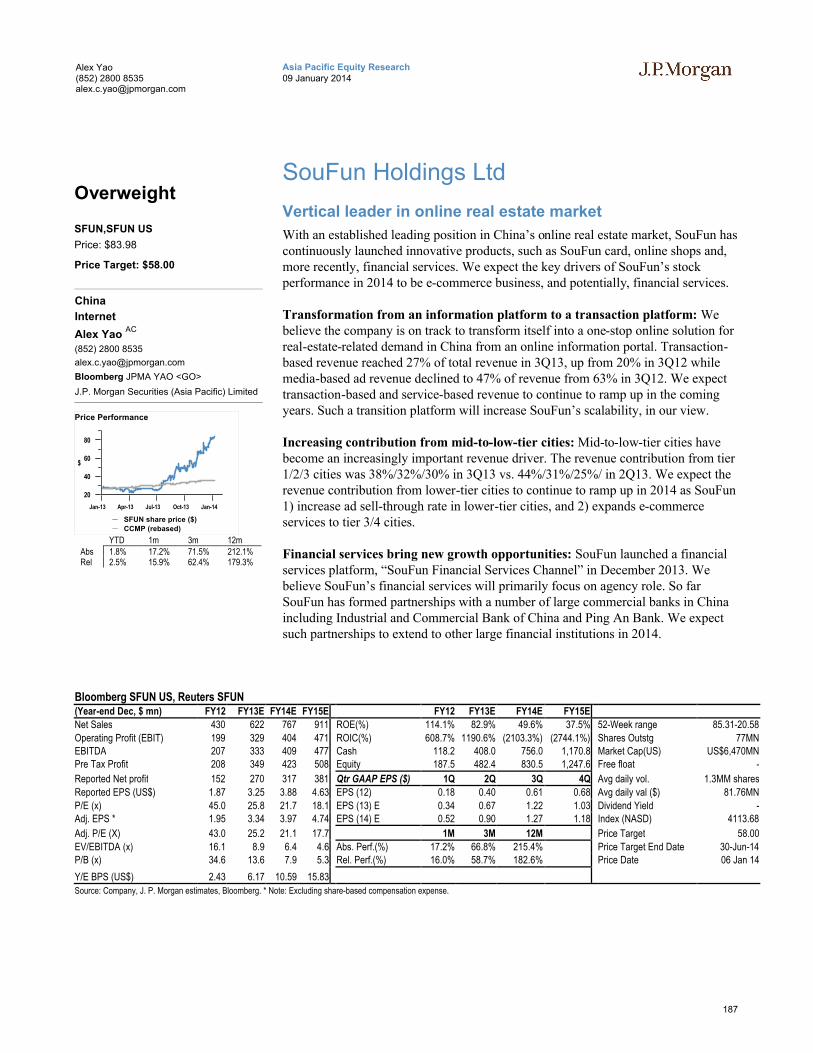
187
Asia Pacific Equity Research09 January 2014
Alex Yao(852) 2800 [email protected]
SouFun Holdings Ltd
Vertical leader in online real estate market
With an established leading position in China’s online real estate market, SouFun has continuously launched innovative products, such as SouFun card, online shops and, more recently, financial services. We expect the key drivers of SouFun’s stock performance in 2014 to be e-commerce business, and potentially, financial services.
Transformation from an information platform to a transaction platform: We believe the company is on track to transform itself into a one-stop online solution for real-estate-related demand in China from an online information portal. Transaction-based revenue reached 27% of total revenue in 3Q13, up from 20% in 3Q12 while media-based ad revenue declined to 47% of revenue from 63% in 3Q12. We expect transaction-based and service-based revenue to continue to ramp up in the coming years. Such a transition platform will increase SouFun’s scalability, in our view.
Increasing contribution from mid-to-low-tier cities: Mid-to-low-tier cities have become an increasingly important revenue driver. The revenue contribution from tier 1/2/3 cities was 38%/32%/30% in 3Q13 vs. 44%/31%/25%/ in 2Q13. We expect the revenue contribution from lower-tier cities to continue to ramp up in 2014 as SouFun 1) increase ad sell-through rate in lower-tier cities, and 2) expands e-commerce services to tier 3/4 cities.
Financial services bring new growth opportunities: SouFun launched a financial services platform, “SouFun Financial Services Channel” in December 2013. We believe SouFun’s financial services will primarily focus on agency role. So far SouFun has formed partnerships with a number of large commercial banks in China including Industrial and Commercial Bank of China and Ping An Bank. We expect such partnerships to extend to other large financial institutions in 2014.
Bloomberg SFUN US, Reuters SFUN(Year-end Dec, $ mn) FY12 FY13E FY14E FY15E FY12 FY13E FY14E FY15E
Net Sales 430 622 767 911 ROE(%) 114.1% 82.9% 49.6% 37.5% 52-Week range 85.31-20.58
Operating Profit (EBIT) 199 329 404 471 ROIC(%) 608.7% 1190.6% (2103.3%) (2744.1%) Shares Outstg 77MNEBITDA 207 333 409 477 Cash 118.2 408.0 756.0 1,170.8 Market Cap(US) US$6,470MNPre Tax Profit 208 349 423 508 Equity 187.5 482.4 830.5 1,247.6 Free float -
Reported Net profit 152 270 317 381 Qtr GAAP EPS ($) 1Q 2Q 3Q 4Q Avg daily vol. 1.3MM shares
Reported EPS (US$) 1.87 3.25 3.88 4.63 EPS (12) 0.18 0.40 0.61 0.68 Avg daily val ($) 81.76MN
P/E (x) 45.0 25.8 21.7 18.1 EPS (13) E 0.34 0.67 1.22 1.03 Dividend Yield -Adj. EPS * 1.95 3.34 3.97 4.74 EPS (14) E 0.52 0.90 1.27 1.18 Index (NASD) 4113.68
Adj. P/E (X) 43.0 25.2 21.1 17.7 1M 3M 12M Price Target 58.00
EV/EBITDA (x) 16.1 8.9 6.4 4.6 Abs. Perf.(%) 17.2% 66.8% 215.4% Price Target End Date 30-Jun-14P/B (x) 34.6 13.6 7.9 5.3 Rel. Perf.(%) 16.0% 58.7% 182.6% Price Date 06 Jan 14
Y/E BPS (US$) 2.43 6.17 10.59 15.83
Source: Company, J. P. Morgan estimates, Bloomberg. * Note: Excluding share-based compensation expense.
Overweight
SFUN,SFUN US
Price: $83.98
Price Target: $58.00
China
Internet
Alex Yao AC
(852) 2800 8535
Bloomberg JPMA YAO <GO>
J.P. Morgan Securities (Asia Pacific) Limited
20
40
60
80
$
Jan-13 Apr-13 Jul-13 Oct-13 Jan-14
Price Performance
SFUN share price ($)
CCMP (rebased)
YTD 1m 3m 12mAbs 1.8% 17.2% 71.5% 212.1%Rel 2.5% 15.9% 62.4% 179.3%
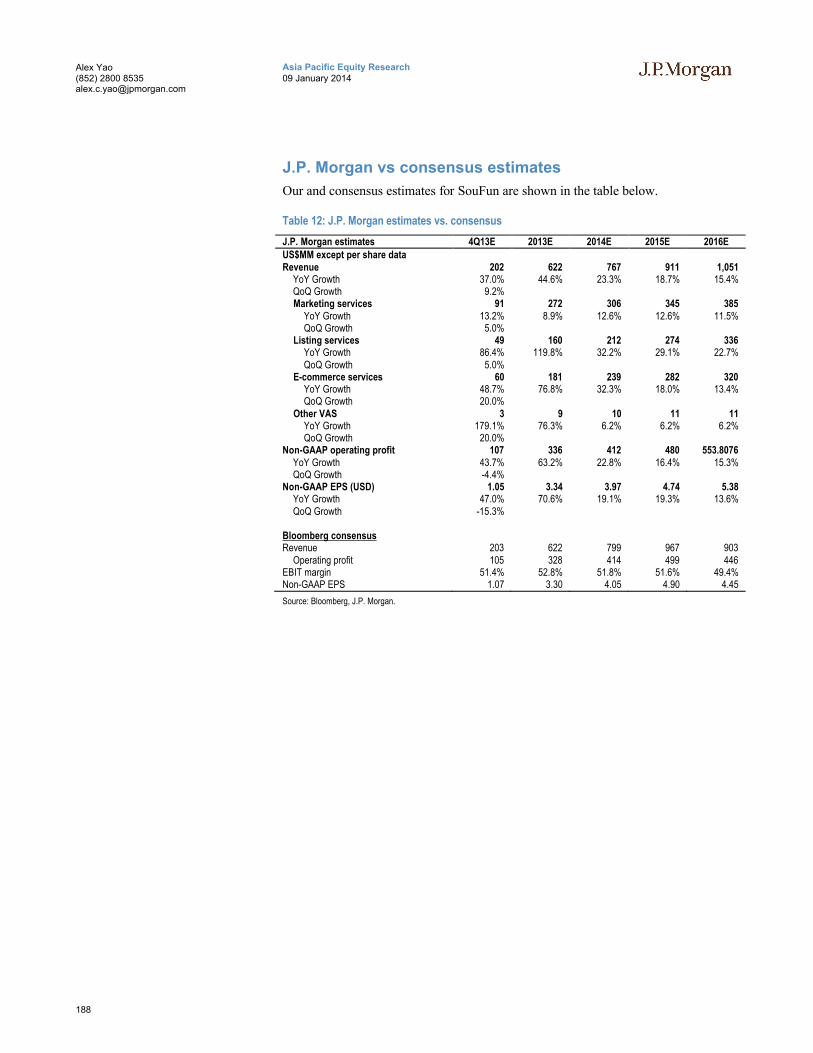
188
Asia Pacific Equity Research09 January 2014
Alex Yao(852) 2800 [email protected]
J.P. Morgan vs consensus estimates
Our and consensus estimates for SouFun are shown in the table below.
Table 12: J.P. Morgan estimates vs. consensus
J.P. Morgan estimates 4Q13E 2013E 2014E 2015E 2016EUS$MM except per share dataRevenue 202 622 767 911 1,051
YoY Growth 37.0% 44.6% 23.3% 18.7% 15.4%QoQ Growth 9.2%Marketing services 91 272 306 345 385
YoY Growth 13.2% 8.9% 12.6% 12.6% 11.5%QoQ Growth 5.0%
Listing services 49 160 212 274 336YoY Growth 86.4% 119.8% 32.2% 29.1% 22.7%QoQ Growth 5.0%
E-commerce services 60 181 239 282 320YoY Growth 48.7% 76.8% 32.3% 18.0% 13.4%QoQ Growth 20.0%
Other VAS 3 9 10 11 11YoY Growth 179.1% 76.3% 6.2% 6.2% 6.2%QoQ Growth 20.0%
Non-GAAP operating profit 107 336 412 480 553.8076YoY Growth 43.7% 63.2% 22.8% 16.4% 15.3%QoQ Growth -4.4%
Non-GAAP EPS (USD) 1.05 3.34 3.97 4.74 5.38 YoY Growth 47.0% 70.6% 19.1% 19.3% 13.6%QoQ Growth -15.3%
Bloomberg consensusRevenue 203 622 799 967 903
Operating profit 105 328 414 499 446EBIT margin 51.4% 52.8% 51.8% 51.6% 49.4%Non-GAAP EPS 1.07 3.30 4.05 4.90 4.45
Source: Bloomberg, J.P. Morgan.
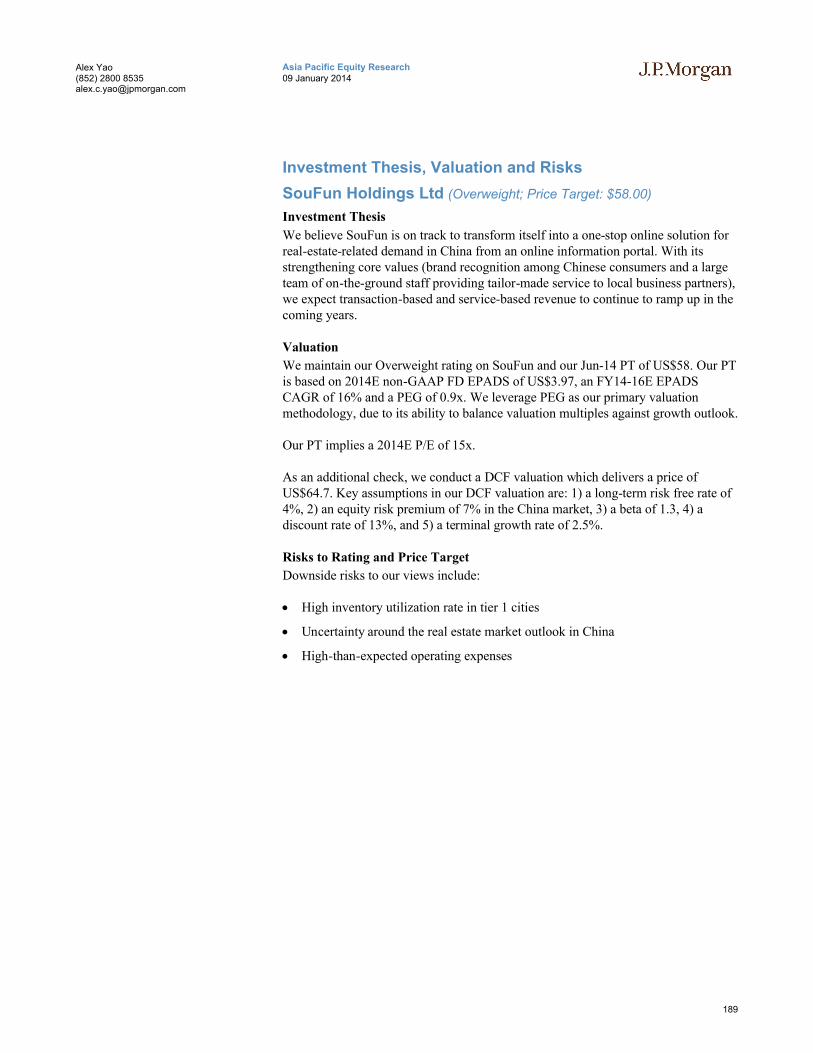
189
Asia Pacific Equity Research09 January 2014
Alex Yao(852) 2800 [email protected]
Investment Thesis, Valuation and Risks
SouFun Holdings Ltd (Overweight; Price Target: $58.00)
Investment Thesis
We believe SouFun is on track to transform itself into a one-stop online solution for real-estate-related demand in China from an online information portal. With its strengthening core values (brand recognition among Chinese consumers and a large team of on-the-ground staff providing tailor-made service to local business partners), we expect transaction-based and service-based revenue to continue to ramp up in the coming years.
Valuation
We maintain our Overweight rating on SouFun and our Jun-14 PT of US$58. Our PT is based on 2014E non-GAAP FD EPADS of US$3.97, an FY14-16E EPADS CAGR of 16% and a PEG of 0.9x. We leverage PEG as our primary valuation methodology, due to its ability to balance valuation multiples against growth outlook.
Our PT implies a 2014E P/E of 15x.
As an additional check, we conduct a DCF valuation which delivers a price of US$64.7. Key assumptions in our DCF valuation are: 1) a long-term risk free rate of 4%, 2) an equity risk premium of 7% in the China market, 3) a beta of 1.3, 4) a discount rate of 13%, and 5) a terminal growth rate of 2.5%.
Risks to Rating and Price Target
Downside risks to our views include:
High inventory utilization rate in tier 1 cities
Uncertainty around the real estate market outlook in China
High-than-expected operating expenses
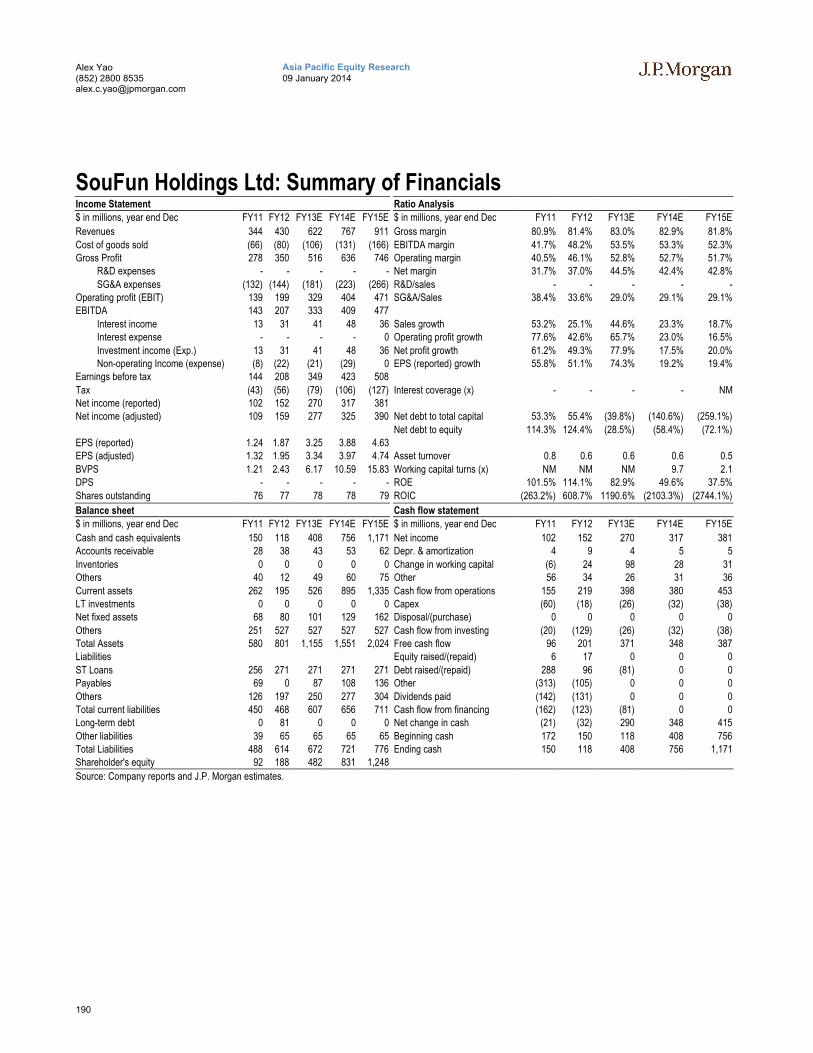
190
Asia Pacific Equity Research09 January 2014
Alex Yao(852) 2800 [email protected]
SouFun Holdings Ltd: Summary of FinancialsIncome Statement Ratio Analysis
$ in millions, year end Dec FY11 FY12 FY13E FY14E FY15E $ in millions, year end Dec FY11 FY12 FY13E FY14E FY15E
Revenues 344 430 622 767 911 Gross margin 80.9% 81.4% 83.0% 82.9% 81.8%
Cost of goods sold (66) (80) (106) (131) (166) EBITDA margin 41.7% 48.2% 53.5% 53.3% 52.3%Gross Profit 278 350 516 636 746 Operating margin 40.5% 46.1% 52.8% 52.7% 51.7%
R&D expenses - - - - - Net margin 31.7% 37.0% 44.5% 42.4% 42.8%
SG&A expenses (132) (144) (181) (223) (266) R&D/sales - - - - -Operating profit (EBIT) 139 199 329 404 471 SG&A/Sales 38.4% 33.6% 29.0% 29.1% 29.1%EBITDA 143 207 333 409 477
Interest income 13 31 41 48 36 Sales growth 53.2% 25.1% 44.6% 23.3% 18.7%Interest expense - - - - 0 Operating profit growth 77.6% 42.6% 65.7% 23.0% 16.5%
Investment income (Exp.) 13 31 41 48 36 Net profit growth 61.2% 49.3% 77.9% 17.5% 20.0%Non-operating Income (expense) (8) (22) (21) (29) 0 EPS (reported) growth 55.8% 51.1% 74.3% 19.2% 19.4%
Earnings before tax 144 208 349 423 508
Tax (43) (56) (79) (106) (127) Interest coverage (x) - - - - NMNet income (reported) 102 152 270 317 381Net income (adjusted) 109 159 277 325 390 Net debt to total capital 53.3% 55.4% (39.8%) (140.6%) (259.1%)
Net debt to equity 114.3% 124.4% (28.5%) (58.4%) (72.1%)EPS (reported) 1.24 1.87 3.25 3.88 4.63EPS (adjusted) 1.32 1.95 3.34 3.97 4.74 Asset turnover 0.8 0.6 0.6 0.6 0.5
BVPS 1.21 2.43 6.17 10.59 15.83 Working capital turns (x) NM NM NM 9.7 2.1DPS - - - - - ROE 101.5% 114.1% 82.9% 49.6% 37.5%
Shares outstanding 76 77 78 78 79 ROIC (263.2%) 608.7% 1190.6% (2103.3%) (2744.1%)
Balance sheet Cash flow statement
$ in millions, year end Dec FY11 FY12 FY13E FY14E FY15E $ in millions, year end Dec FY11 FY12 FY13E FY14E FY15E
Cash and cash equivalents 150 118 408 756 1,171 Net income 102 152 270 317 381Accounts receivable 28 38 43 53 62 Depr. & amortization 4 9 4 5 5
Inventories 0 0 0 0 0 Change in working capital (6) 24 98 28 31Others 40 12 49 60 75 Other 56 34 26 31 36
Current assets 262 195 526 895 1,335 Cash flow from operations 155 219 398 380 453LT investments 0 0 0 0 0 Capex (60) (18) (26) (32) (38)Net fixed assets 68 80 101 129 162 Disposal/(purchase) 0 0 0 0 0
Others 251 527 527 527 527 Cash flow from investing (20) (129) (26) (32) (38)Total Assets 580 801 1,155 1,551 2,024 Free cash flow 96 201 371 348 387Liabilities Equity raised/(repaid) 6 17 0 0 0
ST Loans 256 271 271 271 271 Debt raised/(repaid) 288 96 (81) 0 0Payables 69 0 87 108 136 Other (313) (105) 0 0 0
Others 126 197 250 277 304 Dividends paid (142) (131) 0 0 0Total current liabilities 450 468 607 656 711 Cash flow from financing (162) (123) (81) 0 0Long-term debt 0 81 0 0 0 Net change in cash (21) (32) 290 348 415
Other liabilities 39 65 65 65 65 Beginning cash 172 150 118 408 756Total Liabilities 488 614 672 721 776 Ending cash 150 118 408 756 1,171Shareholder's equity 92 188 482 831 1,248
Source: Company reports and J.P. Morgan estimates.

191
Asia Pacific Equity Research09 January 2014
Alex Yao(852) 2800 [email protected]
Phoenix New Media Ltd
Traffic monetization accelerates
Steady traffic growth backed by unique content offerings. Phoenix New Media’s key strength lies in its differentiated content offerings, including 1) a focus on news and lifestyle-related content, 2) exclusive content from Phoenix Satellite Television, and 3) short-form news video and documentary content. With an established reputation in premium news and video content, PNM has managed to capture a large number of loyal users, which are primarily well-educated and high-income users between 25 and 40 in tier 1/2 cities. Such differentiation will continue to drive steady traffic growth and driven down user acquisition cost in mid- to long term.
Mobile monetization should continue to improve in 2014: Mobile monetization of PNM has seen great progress. In 3Q13, mobile revenue represented over 10% of the company’s total revenue vs. 2% in 1Q12. We believe the contribution will continue to increase as the mobile advertising measurement scheme will gradually be established and accepted in 2014.
PNM likely to take a balanced approach to mobile monetization: On one hand, the company will strengthen mobile monetization around its major apps (including iFeng Video, iFeng FM and iFeng Reading) in 2014. On the other hand, the company also views mobile web as an important mobile monetization initiative. The company’s mobile portal, 3g.ifeng.com, is a leading mobile portal in China with 39MM daily average unique visitors in 3Q13.
Potential expansion into game publishing to drive revenue growth and margin improvement: Game publishing could potentially become a new growth driver in 2014. We believe the company is likely to further explore both webgame and mobile game publishing, given its large organic traffic on both PC and mobile. We believe such an initiative will 1) become a meaningful revenue driver in 2014, and 2) further lead to margin improve given the high-margin nature of gaming business.
Bloomberg FENG US, Reuters FENG(Year-end Dec, Rmb mn) FY12 FY13E FY14E FY15E FY12 FY13E FY14E FY15E
Net Sales 1,111 1,399 1,769 2,159 ROE(%) 8.5% 18.2% 19.1% 21.1% 52-Week range 13.38-3.40
Operating Profit (EBIT) 85 237 328 462 ROIC(%) 3710.4% 585.2% 423.9% 566.5% Shares Outstg 65MNEBITDA 106 265 357 492 Cash 916.2 1,178.8 1,497.1 1,923.3 Market Cap(US) US$636MNPre Tax Profit 124 294 376 512 Equity 1,366.3 1,640.7 1,988.1 2,457.1 Free float -
Reported Net profit 107 257 328 448 Qtr GAAP EPS (Rmb) 1Q 2Q 3Q 4Q Avg daily vol. 1.2MM shares
Reported EPS (Rmb) 1.33 3.30 4.13 5.47 EPS (12) 0.41 0.43 0.14 0.35 Avg daily val ($) 11.85MN
P/E (x) 44.5 18.0 14.4 10.9 EPS (13) E 0.50 1.00 1.04 0.77 Dividend Yield 0.0%Adj. EPS * 1.42 3.52 4.38 5.73 EPS (14) E 0.54 1.04 1.38 1.17 Index (NASD) 4113.68
Adj. P/E (X) 41.9 16.9 13.6 10.4 1M 3M 12M Price Target 15.00
EV/EBITDA (x) 29.7 10.9 7.2 4.3 Abs. Perf.(%) 6.6% (20.0%) 170.3% Price Target End Date 30-Jun-14P/B (x) 3.4 2.7 2.3 1.9 Rel. Perf.(%) 5.4% (28.0%) 137.5% Price Date 06 Jan 14
Y/E BPS (Rmb) 17.63 21.62 25.77 30.85
Source: Company, J. P. Morgan estimates, Bloomberg. * Note: Excluding share-based compensation expense.
Overweight
FENG,FENG US
Price: $9.81
Price Target: $15.00
China
Internet
Alex Yao AC
(852) 2800 8535
Bloomberg JPMA YAO <GO>
J.P. Morgan Securities (Asia Pacific) Limited
2
6
10
14
$
Jan-13 Apr-13 Jul-13 Oct-13 Jan-14
Price Performance
FENG share price ($)
CCMP (rebased)
YTD 1m 3m 12mAbs -2.9% 6.6% -22.3% 176.3%Rel -2.2% 5.3% -31.4% 143.5%
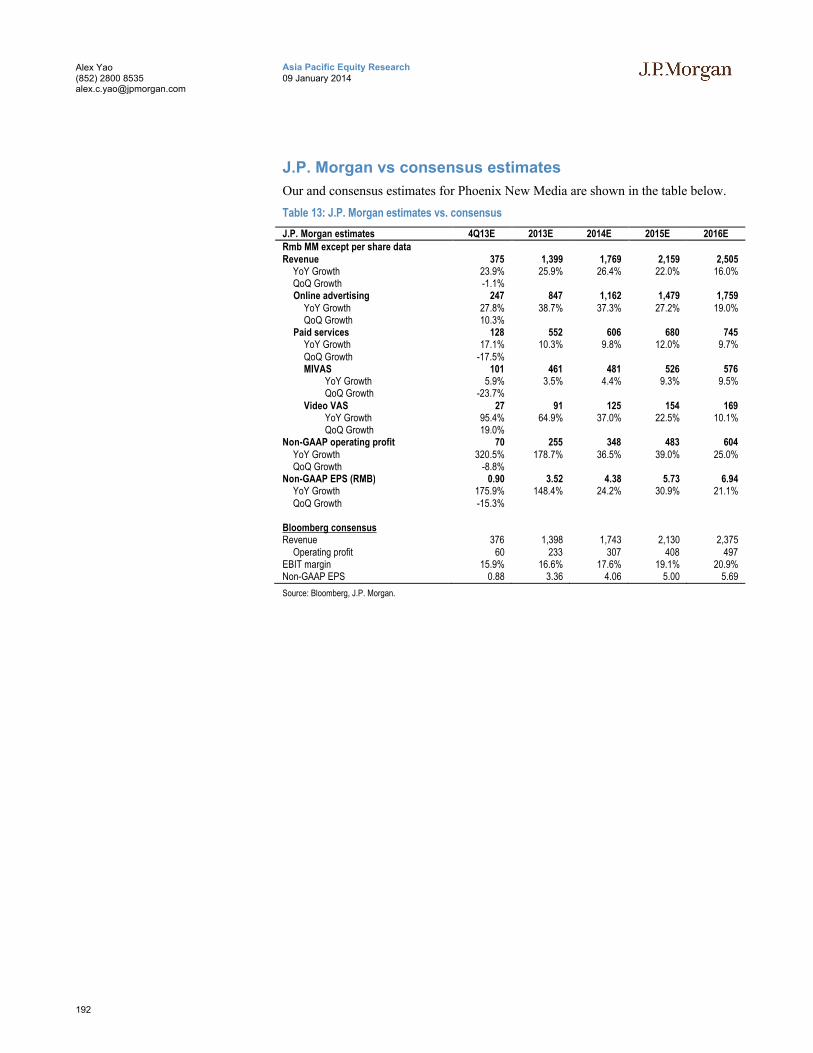
192
Asia Pacific Equity Research09 January 2014
Alex Yao(852) 2800 [email protected]
J.P. Morgan vs consensus estimates
Our and consensus estimates for Phoenix New Media are shown in the table below.
Table 13: J.P. Morgan estimates vs. consensus
J.P. Morgan estimates 4Q13E 2013E 2014E 2015E 2016ERmb MM except per share dataRevenue 375 1,399 1,769 2,159 2,505
YoY Growth 23.9% 25.9% 26.4% 22.0% 16.0%QoQ Growth -1.1%Online advertising 247 847 1,162 1,479 1,759
YoY Growth 27.8% 38.7% 37.3% 27.2% 19.0%QoQ Growth 10.3%
Paid services 128 552 606 680 745YoY Growth 17.1% 10.3% 9.8% 12.0% 9.7%QoQ Growth -17.5%MIVAS 101 461 481 526 576
YoY Growth 5.9% 3.5% 4.4% 9.3% 9.5%QoQ Growth -23.7%
Video VAS 27 91 125 154 169YoY Growth 95.4% 64.9% 37.0% 22.5% 10.1%QoQ Growth 19.0%
Non-GAAP operating profit 70 255 348 483 604YoY Growth 320.5% 178.7% 36.5% 39.0% 25.0%QoQ Growth -8.8%
Non-GAAP EPS (RMB) 0.90 3.52 4.38 5.73 6.94 YoY Growth 175.9% 148.4% 24.2% 30.9% 21.1%QoQ Growth -15.3%
Bloomberg consensusRevenue 376 1,398 1,743 2,130 2,375
Operating profit 60 233 307 408 497EBIT margin 15.9% 16.6% 17.6% 19.1% 20.9%Non-GAAP EPS 0.88 3.36 4.06 5.00 5.69
Source: Bloomberg, J.P. Morgan.
193
Asia Pacific Equity Research09 January 2014
Alex Yao(852) 2800 [email protected]
Investment Thesis, Valuation and Risks
Phoenix New Media Ltd (Overweight; Price Target: $15.00)
Investment Thesis
We think Phoenix New Media’s key strength in content offerings will continue to help it capture a large number of loyal users across both its PC portal, mobile portal and mobile apps. We expect accelerated monetization of these traffic through advertising in 2014. Meanwhile, with successful precedents, cross-selling of other services (e.g. gaming and digital reading) is likely to become an additional driver of revenue growth in 2014.
Valuation
We maintain our Overweight rating on Phoenix New Media and our Jun-14 PT of US$15. Our PT is based on 2014E non-GAAP FD EPADS of US$0.71, an FY14-16E EPADS CAGR of 26% and a PEG of 0.8x. We adopt PEG as our primary valuation methodology, as it is able to balance the growth outlook against P/E multiples.
Our PT implies a 2014E P/E of 21x.
As an additional check, we conduct a DCF valuation which delivers a comparable price of US$14. Key assumptions in our DCF valuation are: 1) a long-term risk free rate of 4%, 2) an equity risk premium of 7% in the China market, 3) a beta of 1.2, 4) a discount rate of 12.4%, and 5) a terminal growth rate of 3%.
Risks to Rating and Price Target
Downside risks to our views include:
Weaker-than-expected mobile monetization
Mobile ads pricing might be under pressure
Macro uncertainty
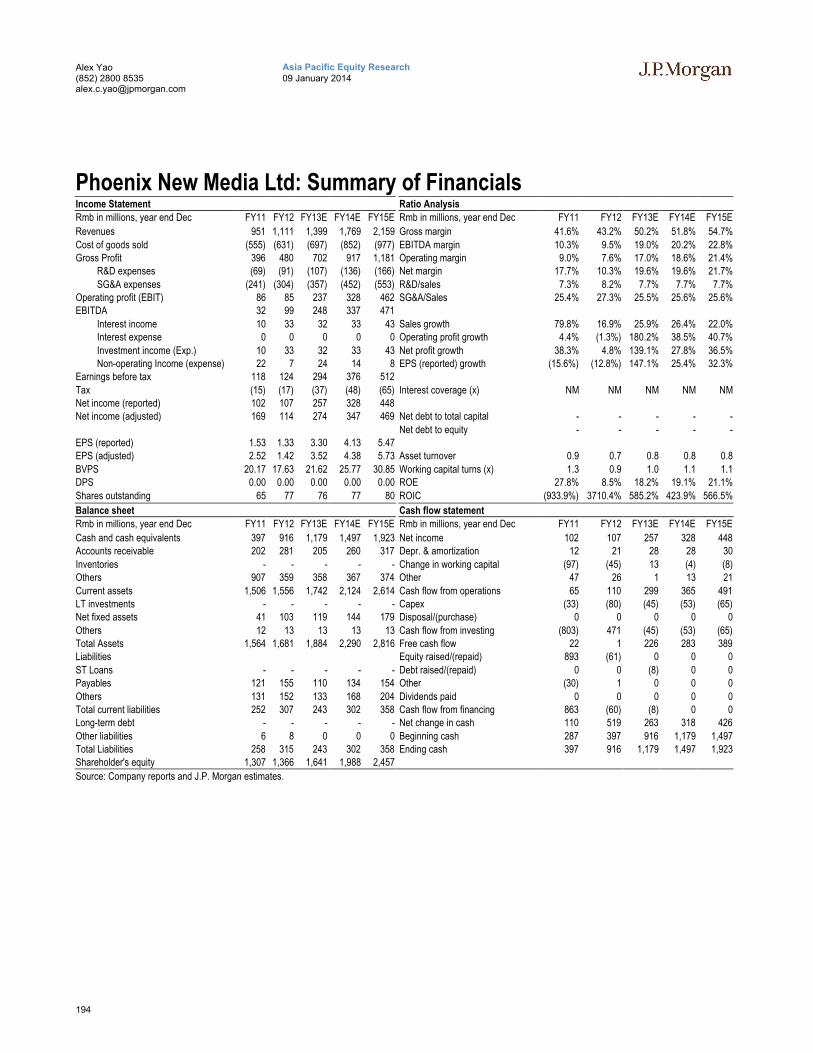
194
Asia Pacific Equity Research09 January 2014
Alex Yao(852) 2800 [email protected]
Phoenix New Media Ltd: Summary of FinancialsIncome Statement Ratio Analysis
Rmb in millions, year end Dec FY11 FY12 FY13E FY14E FY15E Rmb in millions, year end Dec FY11 FY12 FY13E FY14E FY15E
Revenues 951 1,111 1,399 1,769 2,159 Gross margin 41.6% 43.2% 50.2% 51.8% 54.7%
Cost of goods sold (555) (631) (697) (852) (977) EBITDA margin 10.3% 9.5% 19.0% 20.2% 22.8%Gross Profit 396 480 702 917 1,181 Operating margin 9.0% 7.6% 17.0% 18.6% 21.4%
R&D expenses (69) (91) (107) (136) (166) Net margin 17.7% 10.3% 19.6% 19.6% 21.7%
SG&A expenses (241) (304) (357) (452) (553) R&D/sales 7.3% 8.2% 7.7% 7.7% 7.7%Operating profit (EBIT) 86 85 237 328 462 SG&A/Sales 25.4% 27.3% 25.5% 25.6% 25.6%EBITDA 32 99 248 337 471
Interest income 10 33 32 33 43 Sales growth 79.8% 16.9% 25.9% 26.4% 22.0%Interest expense 0 0 0 0 0 Operating profit growth 4.4% (1.3%) 180.2% 38.5% 40.7%
Investment income (Exp.) 10 33 32 33 43 Net profit growth 38.3% 4.8% 139.1% 27.8% 36.5%Non-operating Income (expense) 22 7 24 14 8 EPS (reported) growth (15.6%) (12.8%) 147.1% 25.4% 32.3%
Earnings before tax 118 124 294 376 512
Tax (15) (17) (37) (48) (65) Interest coverage (x) NM NM NM NM NMNet income (reported) 102 107 257 328 448Net income (adjusted) 169 114 274 347 469 Net debt to total capital - - - - -
Net debt to equity - - - - -EPS (reported) 1.53 1.33 3.30 4.13 5.47EPS (adjusted) 2.52 1.42 3.52 4.38 5.73 Asset turnover 0.9 0.7 0.8 0.8 0.8
BVPS 20.17 17.63 21.62 25.77 30.85 Working capital turns (x) 1.3 0.9 1.0 1.1 1.1DPS 0.00 0.00 0.00 0.00 0.00 ROE 27.8% 8.5% 18.2% 19.1% 21.1%
Shares outstanding 65 77 76 77 80 ROIC (933.9%) 3710.4% 585.2% 423.9% 566.5%
Balance sheet Cash flow statement
Rmb in millions, year end Dec FY11 FY12 FY13E FY14E FY15E Rmb in millions, year end Dec FY11 FY12 FY13E FY14E FY15E
Cash and cash equivalents 397 916 1,179 1,497 1,923 Net income 102 107 257 328 448Accounts receivable 202 281 205 260 317 Depr. & amortization 12 21 28 28 30
Inventories - - - - - Change in working capital (97) (45) 13 (4) (8)Others 907 359 358 367 374 Other 47 26 1 13 21
Current assets 1,506 1,556 1,742 2,124 2,614 Cash flow from operations 65 110 299 365 491LT investments - - - - - Capex (33) (80) (45) (53) (65)Net fixed assets 41 103 119 144 179 Disposal/(purchase) 0 0 0 0 0
Others 12 13 13 13 13 Cash flow from investing (803) 471 (45) (53) (65)Total Assets 1,564 1,681 1,884 2,290 2,816 Free cash flow 22 1 226 283 389Liabilities Equity raised/(repaid) 893 (61) 0 0 0
ST Loans - - - - - Debt raised/(repaid) 0 0 (8) 0 0Payables 121 155 110 134 154 Other (30) 1 0 0 0
Others 131 152 133 168 204 Dividends paid 0 0 0 0 0Total current liabilities 252 307 243 302 358 Cash flow from financing 863 (60) (8) 0 0Long-term debt - - - - - Net change in cash 110 519 263 318 426
Other liabilities 6 8 0 0 0 Beginning cash 287 397 916 1,179 1,497Total Liabilities 258 315 243 302 358 Ending cash 397 916 1,179 1,497 1,923Shareholder's equity 1,307 1,366 1,641 1,988 2,457
Source: Company reports and J.P. Morgan estimates.
195
Asia Pacific Equity Research09 January 2014
Alex Yao(852) 2800 [email protected]
Vipshop
Online flash sales leader
We view online flash sale platforms as an efficient inventory clearance channel for offline retailers. Such a value proposition is extremely important given the under-developed offline sales channels in China.
Online flash sales market still sees great growth potential. According to Frost & Sullivan, China’s online flash sales market reached US$23.6B in 2012, representing 0.7% of the country’s total retail sales. Such a low penetration rate suggests that there are still great opportunities in online flash sales market in China.
Relatively benign competitive environment: Compared to the traditional B2C e-commerce realm, competition in the online flash sales market is still relatively moderate. On one hand, large comprehensive B2C e-commerce platforms (e.g. Tmall and JD.com) have not begun to expand into flash sales very aggressively; on the other hand, there is still ample room for growth in China’s online flash sales market to accommodate an increasing number of new entrants.
Expecting margin improvements in 2014: We expect Vipshop to see continued margin improvements in 2014 due to:
Increasing contribution from marketplace business model. Marketplace business generated US$2.5MM revenue in 3Q13 and we expect the business to contribute US$4MM revenue in 4Q13, leading to margin improvement of 0.7ppt in 4Q13. We expect such a trend to continue in the next 12 months.
Logistics efficiency. Total warehouse area of Vipshop reached roughly 300,000 square meters in 3Q13 after putting new warehouses into use. The company will continue to expand warehouse capacity in 2014.
In addition to logistics efficiency, we expect fulfillment cost to continue to trend down in 4Q13 as measured by the percentage of total revenue, driven by 1) seasonality, and 2) continued shift from national couriers to local couriers.
Bloomberg VIPS US, Reuters VIPS(Year-end Dec, $ mn) FY12 FY13E FY14E FY15E FY12 FY13E FY14E FY15E
Net Sales 692 1,643 2,881 4,288 ROE(%) (3.7%) 56.5% 61.8% 51.6% 52-Week range 91.20-16.66
Operating Profit (EBIT) -12 55 139 217 ROIC(%) 21.6% (76.3%) (108.0%) (114.2%) Shares Outstg 55MNEBITDA -7 63 151 230 Cash 124.5 156.6 334.0 505.8 Market Cap(US) US$4,558MNPre Tax Profit -9 69 155 234 Equity 82.6 147.5 279.4 473.8 Free float
Reported Net profit -9 53 118 178 Qtr GAAP EPS ($) 1Q 2Q 3Q 4Q Avg daily vol. 1.0MM shares
Reported EPS (US$) (0.21) 0.92 2.05 3.11 EPS (12) (0.33) (0.11) (0.03) 0.12 Avg daily val ($) 77.55MN
P/E (x) NM 89.3 40.1 26.5 EPS (13) E 0.11 0.16 0.21 0.44 Dividend Yield -Adj. EPS * (0.04) 1.13 2.30 3.39 EPS (14) E 0.37 0.42 0.53 0.73 Index (NASD) 4113.68
Adj. P/E (X) NM 72.7 35.8 24.3 1M 3M 12M Price Target 88.00
EV/EBITDA (x) NM 57.6 22.9 14.2 Abs. Perf.(%) (0.3%) 21.1% 395.7% Price Target End Date 30-Jun-14P/B (x) 89.4 64.0 33.8 19.9 Rel. Perf.(%) (1.6%) 13.1% 362.9% Price Date 06 Jan 14
Y/E BPS (US$) 0.92 1.29 2.43 4.13
Source: Company, J. P. Morgan estimates, Bloomberg. * Note: Excluding share-based compensation expense.
Overweight
VIPS,VIPS US
Price: $82.28
Price Target: $88.00
China
Internet
Alex Yao AC
(852) 2800 8535
Bloomberg JPMA YAO <GO>
J.P. Morgan Securities (Asia Pacific) Limited
10
30
50
70
90
$
Jan-13 Apr-13 Jul-13 Oct-13 Jan-14
Price Performance
VIPS share price ($)
CCMP (rebased)
YTD 1m 3m 12mAbs -5.4% -0.3% 20.6% 357.1%Rel -4.7% -1.6% 11.5% 324.3%
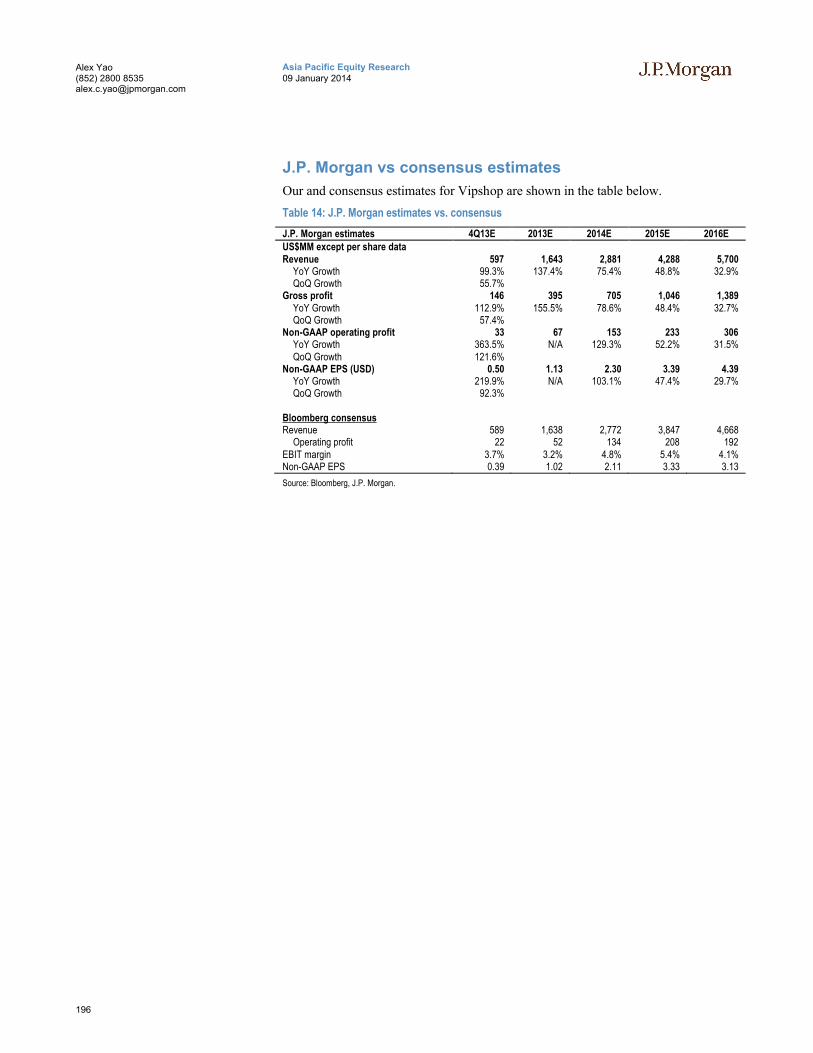
196
Asia Pacific Equity Research09 January 2014
Alex Yao(852) 2800 [email protected]
J.P. Morgan vs consensus estimates
Our and consensus estimates for Vipshop are shown in the table below.
Table 14: J.P. Morgan estimates vs. consensus
J.P. Morgan estimates 4Q13E 2013E 2014E 2015E 2016EUS$MM except per share dataRevenue 597 1,643 2,881 4,288 5,700
YoY Growth 99.3% 137.4% 75.4% 48.8% 32.9%QoQ Growth 55.7%
Gross profit 146 395 705 1,046 1,389YoY Growth 112.9% 155.5% 78.6% 48.4% 32.7%QoQ Growth 57.4%
Non-GAAP operating profit 33 67 153 233 306YoY Growth 363.5% N/A 129.3% 52.2% 31.5%QoQ Growth 121.6%
Non-GAAP EPS (USD) 0.50 1.13 2.30 3.39 4.39 YoY Growth 219.9% N/A 103.1% 47.4% 29.7%QoQ Growth 92.3%
Bloomberg consensusRevenue 589 1,638 2,772 3,847 4,668
Operating profit 22 52 134 208 192EBIT margin 3.7% 3.2% 4.8% 5.4% 4.1%Non-GAAP EPS 0.39 1.02 2.11 3.33 3.13
Source: Bloomberg, J.P. Morgan.
197
Asia Pacific Equity Research09 January 2014
Alex Yao(852) 2800 [email protected]
Investment Thesis, Valuation and Risks
Vipshop (Overweight; Price Target: $88.00)
Investment Thesis
We believe Vipshop’s key value proposition as an online inventory clearance channel is intact. We expect solid revenue growth to continue in 2014 driven by the expansion of active user base. We view the introduction of marketplace model as a complementary initiative to enhance traffic monetization. Revenue from the marketplace model is highly profitable and should continue to improve Vipshop’s margin in the next 12 months. Nonetheless, we think room for growth of the marketplace model in the next 1-2 years is likely to be limited given Vipshop’s low penetration in China’s ecommerce population (7% by MAU or 2% by DAU).
Valuation
We maintain our Overweight rating on Vipshop and Jun-14 PT of US$88. Our PT is based on 2014E non-GAAP FD EPADS of US$2.30, FY14-16E EPADS CAGR of 38% and a PEG of 1.0x. We adopt PEG as our primary valuation methodology, as it is able to balance the growth outlook against P/E multiples.
Our PT implies a 2014E/PE of 38x.
As an additional check, we also conduct DCF valuation which delivers a comparable price of US$89. Key assumptions to our DCF valuation include: 1) long-term risk free rate of 4%, 2) an equity risk premium of 7% in the China market, 3) a beta of 1.6, 4) a discount rate of 15% and 5) a terminal growth rate of 3%.
Risks to Rating and Price Target
Downside risks to our views include:
Growing competition in China’s online flash sales market in mid- to long term
User acquisition cost might increase over time
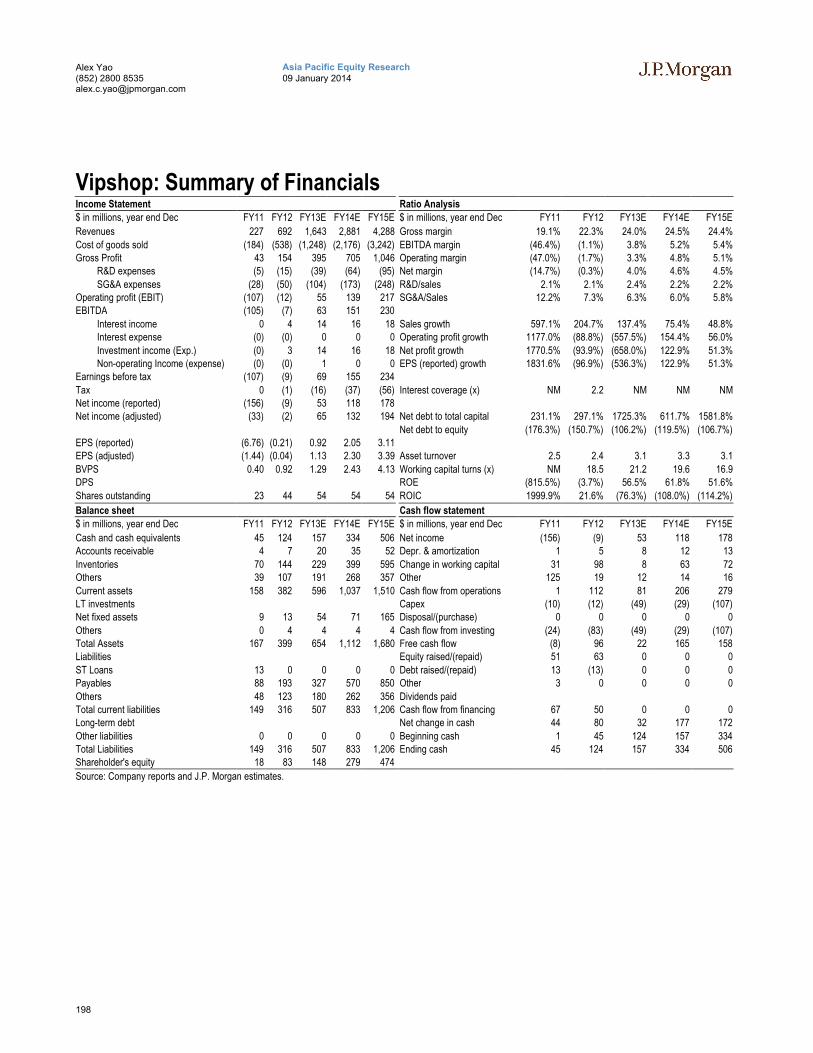
198
Asia Pacific Equity Research09 January 2014
Alex Yao(852) 2800 [email protected]
Vipshop: Summary of FinancialsIncome Statement Ratio Analysis
$ in millions, year end Dec FY11 FY12 FY13E FY14E FY15E $ in millions, year end Dec FY11 FY12 FY13E FY14E FY15E
Revenues 227 692 1,643 2,881 4,288 Gross margin 19.1% 22.3% 24.0% 24.5% 24.4%
Cost of goods sold (184) (538) (1,248) (2,176) (3,242) EBITDA margin (46.4%) (1.1%) 3.8% 5.2% 5.4%Gross Profit 43 154 395 705 1,046 Operating margin (47.0%) (1.7%) 3.3% 4.8% 5.1%
R&D expenses (5) (15) (39) (64) (95) Net margin (14.7%) (0.3%) 4.0% 4.6% 4.5%
SG&A expenses (28) (50) (104) (173) (248) R&D/sales 2.1% 2.1% 2.4% 2.2% 2.2%Operating profit (EBIT) (107) (12) 55 139 217 SG&A/Sales 12.2% 7.3% 6.3% 6.0% 5.8%EBITDA (105) (7) 63 151 230
Interest income 0 4 14 16 18 Sales growth 597.1% 204.7% 137.4% 75.4% 48.8%Interest expense (0) (0) 0 0 0 Operating profit growth 1177.0% (88.8%) (557.5%) 154.4% 56.0%
Investment income (Exp.) (0) 3 14 16 18 Net profit growth 1770.5% (93.9%) (658.0%) 122.9% 51.3%Non-operating Income (expense) (0) (0) 1 0 0 EPS (reported) growth 1831.6% (96.9%) (536.3%) 122.9% 51.3%
Earnings before tax (107) (9) 69 155 234
Tax 0 (1) (16) (37) (56) Interest coverage (x) NM 2.2 NM NM NMNet income (reported) (156) (9) 53 118 178Net income (adjusted) (33) (2) 65 132 194 Net debt to total capital 231.1% 297.1% 1725.3% 611.7% 1581.8%
Net debt to equity (176.3%) (150.7%) (106.2%) (119.5%) (106.7%)EPS (reported) (6.76) (0.21) 0.92 2.05 3.11EPS (adjusted) (1.44) (0.04) 1.13 2.30 3.39 Asset turnover 2.5 2.4 3.1 3.3 3.1
BVPS 0.40 0.92 1.29 2.43 4.13 Working capital turns (x) NM 18.5 21.2 19.6 16.9DPS ROE (815.5%) (3.7%) 56.5% 61.8% 51.6%
Shares outstanding 23 44 54 54 54 ROIC 1999.9% 21.6% (76.3%) (108.0%) (114.2%)
Balance sheet Cash flow statement
$ in millions, year end Dec FY11 FY12 FY13E FY14E FY15E $ in millions, year end Dec FY11 FY12 FY13E FY14E FY15E
Cash and cash equivalents 45 124 157 334 506 Net income (156) (9) 53 118 178Accounts receivable 4 7 20 35 52 Depr. & amortization 1 5 8 12 13
Inventories 70 144 229 399 595 Change in working capital 31 98 8 63 72Others 39 107 191 268 357 Other 125 19 12 14 16
Current assets 158 382 596 1,037 1,510 Cash flow from operations 1 112 81 206 279LT investments Capex (10) (12) (49) (29) (107)Net fixed assets 9 13 54 71 165 Disposal/(purchase) 0 0 0 0 0
Others 0 4 4 4 4 Cash flow from investing (24) (83) (49) (29) (107)Total Assets 167 399 654 1,112 1,680 Free cash flow (8) 96 22 165 158Liabilities Equity raised/(repaid) 51 63 0 0 0
ST Loans 13 0 0 0 0 Debt raised/(repaid) 13 (13) 0 0 0Payables 88 193 327 570 850 Other 3 0 0 0 0
Others 48 123 180 262 356 Dividends paidTotal current liabilities 149 316 507 833 1,206 Cash flow from financing 67 50 0 0 0Long-term debt Net change in cash 44 80 32 177 172
Other liabilities 0 0 0 0 0 Beginning cash 1 45 124 157 334Total Liabilities 149 316 507 833 1,206 Ending cash 45 124 157 334 506Shareholder's equity 18 83 148 279 474
Source: Company reports and J.P. Morgan estimates.
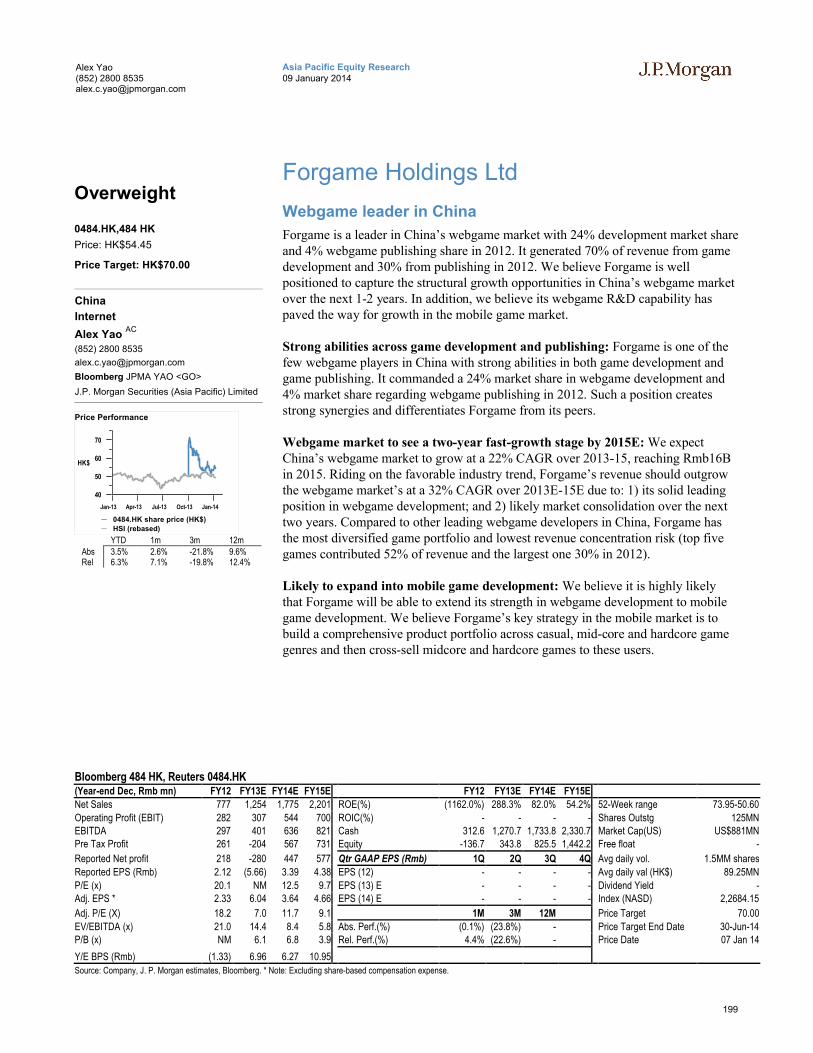
199
Asia Pacific Equity Research09 January 2014
Alex Yao(852) 2800 [email protected]
Forgame Holdings Ltd
Webgame leader in China
Forgame is a leader in China’s webgame market with 24% development market share and 4% webgame publishing share in 2012. It generated 70% of revenue from game development and 30% from publishing in 2012. We believe Forgame is well positioned to capture the structural growth opportunities in China’s webgame market over the next 1-2 years. In addition, we believe its webgame R&D capability has paved the way for growth in the mobile game market.
Strong abilities across game development and publishing: Forgame is one of the few webgame players in China with strong abilities in both game development and game publishing. It commanded a 24% market share in webgame development and 4% market share regarding webgame publishing in 2012. Such a position creates strong synergies and differentiates Forgame from its peers.
Webgame market to see a two-year fast-growth stage by 2015E: We expect China’s webgame market to grow at a 22% CAGR over 2013-15, reaching Rmb16B in 2015. Riding on the favorable industry trend, Forgame’s revenue should outgrow the webgame market’s at a 32% CAGR over 2013E-15E due to: 1) its solid leading position in webgame development; and 2) likely market consolidation over the next two years. Compared to other leading webgame developers in China, Forgame has the most diversified game portfolio and lowest revenue concentration risk (top five games contributed 52% of revenue and the largest one 30% in 2012).
Likely to expand into mobile game development: We believe it is highly likely that Forgame will be able to extend its strength in webgame development to mobile game development. We believe Forgame’s key strategy in the mobile market is to build a comprehensive product portfolio across casual, mid-core and hardcore game genres and then cross-sell midcore and hardcore games to these users.
Bloomberg 484 HK, Reuters 0484.HK(Year-end Dec, Rmb mn) FY12 FY13E FY14E FY15E FY12 FY13E FY14E FY15E
Net Sales 777 1,254 1,775 2,201 ROE(%) (1162.0%) 288.3% 82.0% 54.2% 52-Week range 73.95-50.60
Operating Profit (EBIT) 282 307 544 700 ROIC(%) - - - - Shares Outstg 125MNEBITDA 297 401 636 821 Cash 312.6 1,270.7 1,733.8 2,330.7 Market Cap(US) US$881MNPre Tax Profit 261 -204 567 731 Equity -136.7 343.8 825.5 1,442.2 Free float -
Reported Net profit 218 -280 447 577 Qtr GAAP EPS (Rmb) 1Q 2Q 3Q 4Q Avg daily vol. 1.5MM shares
Reported EPS (Rmb) 2.12 (5.66) 3.39 4.38 EPS (12) - - - - Avg daily val (HK$) 89.25MN
P/E (x) 20.1 NM 12.5 9.7 EPS (13) E - - - - Dividend Yield -Adj. EPS * 2.33 6.04 3.64 4.66 EPS (14) E - - - - Index (NASD) 2,2684.15
Adj. P/E (X) 18.2 7.0 11.7 9.1 1M 3M 12M Price Target 70.00
EV/EBITDA (x) 21.0 14.4 8.4 5.8 Abs. Perf.(%) (0.1%) (23.8%) - Price Target End Date 30-Jun-14P/B (x) NM 6.1 6.8 3.9 Rel. Perf.(%) 4.4% (22.6%) - Price Date 07 Jan 14
Y/E BPS (Rmb) (1.33) 6.96 6.27 10.95
Source: Company, J. P. Morgan estimates, Bloomberg. * Note: Excluding share-based compensation expense.
Overweight
0484.HK,484 HK
Price: HK$54.45
Price Target: HK$70.00
China
Internet
Alex Yao AC
(852) 2800 8535
Bloomberg JPMA YAO <GO>
J.P. Morgan Securities (Asia Pacific) Limited
40
50
60
70
HK$
Jan-13 Apr-13 Jul-13 Oct-13 Jan-14
Price Performance
0484.HK share price (HK$)
HSI (rebased)
YTD 1m 3m 12mAbs 3.5% 2.6% -21.8% 9.6%Rel 6.3% 7.1% -19.8% 12.4%
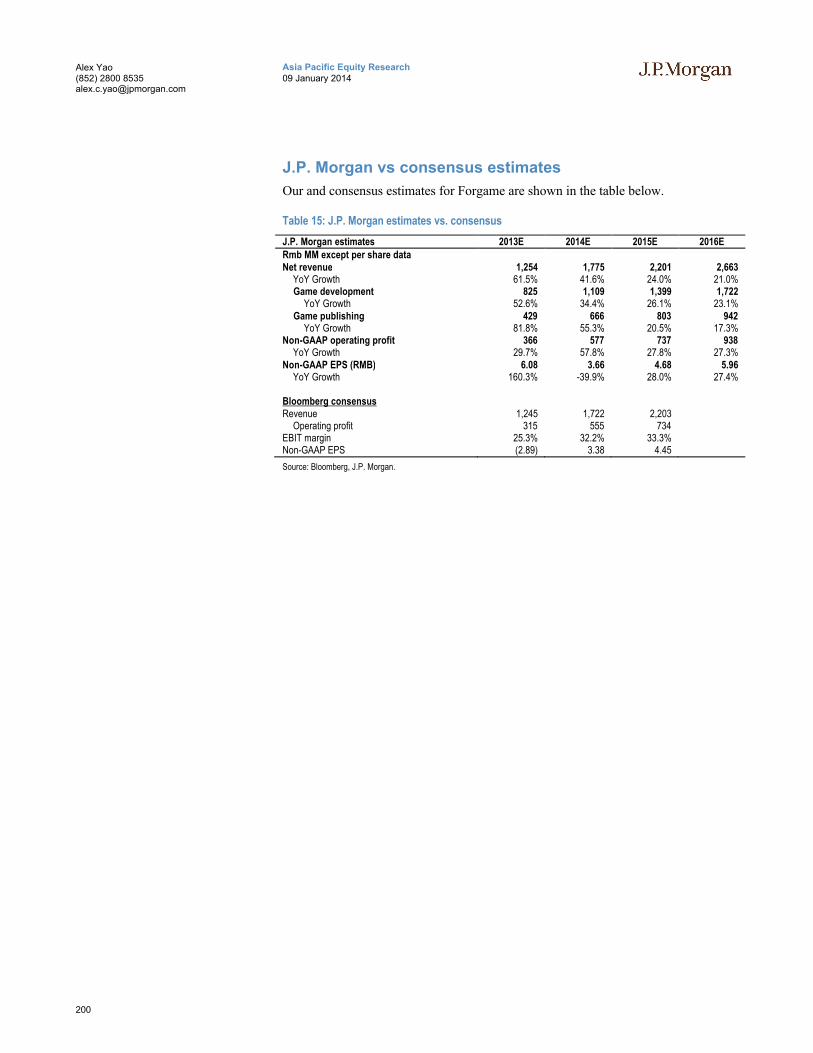
200
Asia Pacific Equity Research09 January 2014
Alex Yao(852) 2800 [email protected]
J.P. Morgan vs consensus estimates
Our and consensus estimates for Forgame are shown in the table below.
Table 15: J.P. Morgan estimates vs. consensus
J.P. Morgan estimates 2013E 2014E 2015E 2016ERmb MM except per share dataNet revenue 1,254 1,775 2,201 2,663
YoY Growth 61.5% 41.6% 24.0% 21.0%Game development 825 1,109 1,399 1,722
YoY Growth 52.6% 34.4% 26.1% 23.1%Game publishing 429 666 803 942
YoY Growth 81.8% 55.3% 20.5% 17.3%Non-GAAP operating profit 366 577 737 938
YoY Growth 29.7% 57.8% 27.8% 27.3%Non-GAAP EPS (RMB) 6.08 3.66 4.68 5.96
YoY Growth 160.3% -39.9% 28.0% 27.4%
Bloomberg consensusRevenue 1,245 1,722 2,203
Operating profit 315 555 734EBIT margin 25.3% 32.2% 33.3%Non-GAAP EPS (2.89) 3.38 4.45
Source: Bloomberg, J.P. Morgan.
201
Asia Pacific Equity Research09 January 2014
Alex Yao(852) 2800 [email protected]
Investment Thesis, Valuation and Risks
Forgame Holdings Ltd (Overweight; Price Target: HK$70.00)
Investment Thesis
We believe Forgame’s leading position in China’s webgame market will help it to capture the growth opportunities in this market over the next two years. Forgame is one of the few webgame companies in China that possess both game development and publishing capabilities. We believe such a position creates strong synergies and differentiates Forgame from its peers. We believe it is highly likely that Forgame will be able to extend its strength in game development to the burgeoning mobile gaming market.
Valuation
We maintain our Overweight rating on Forgame and our Jun-14 PT of HK$70. Our PT is based on 2014E non-GAAP FD EPADS of HK$4.57, an FY14-16E EPADS CAGR of 28% and a PEG of 0.55x. We leverage PEG as our primary valuation methodology, due to its ability to balance valuation multiples against growth outlook.
Our PT implies a 2014E P/E of 15x.
As an additional check, we conduct DCF valuation which delivers a comparable price of HK$67. Key assumptions in our DCF valuation are: 1) a long-term risk free rate of 4%, 2) an equity risk premium of 7% in the China market, 3) a beta of 1.3, 4) a discount rate of 13% and 5) a terminal growth rate of 2.5%.
Risks to Rating and Price Target
Downside risks to our views include:
Ability to continuously launch successful games
Ability to expand strength from PC webgames to mobile games
Mobile games taking more-than-expected usage and revenue share from webgames
Competition with larger and listed MMO developers might intensify
Ability to diversify out of RPG and strategy game genres
Mobile user acquisition costs might be higher than those for PC webgames
Losing talent to competitors
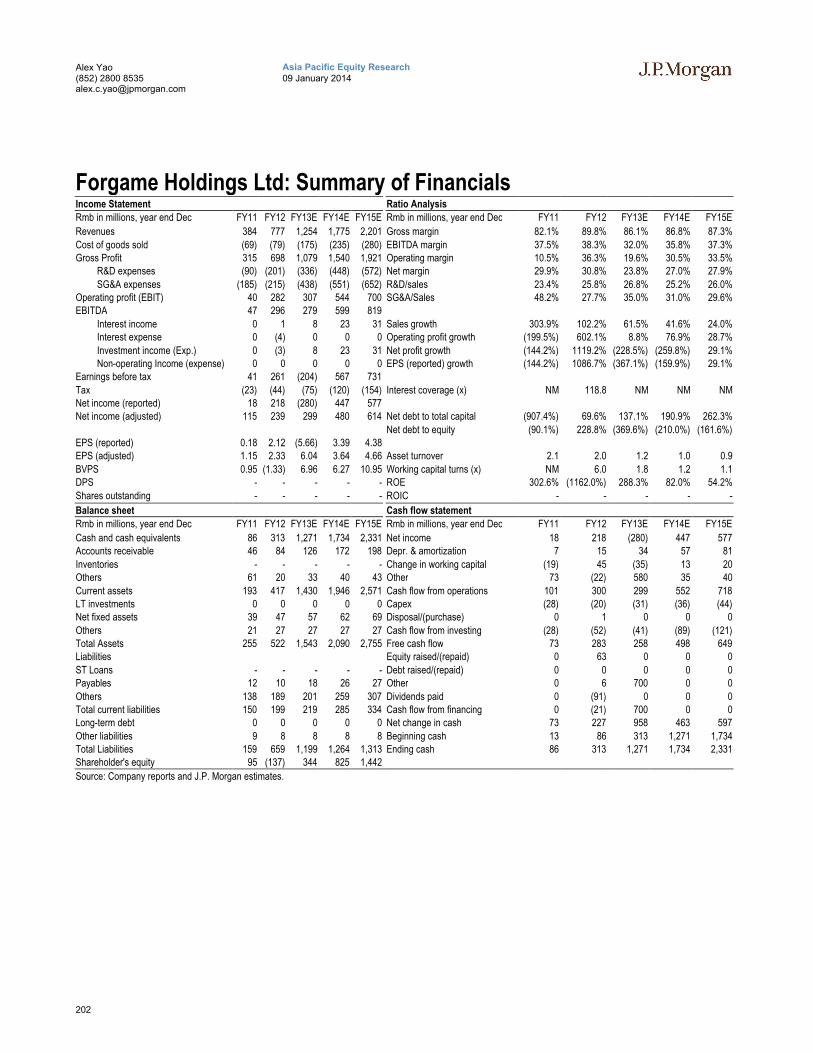
202
Asia Pacific Equity Research09 January 2014
Alex Yao(852) 2800 [email protected]
Forgame Holdings Ltd: Summary of FinancialsIncome Statement Ratio Analysis
Rmb in millions, year end Dec FY11 FY12 FY13E FY14E FY15E Rmb in millions, year end Dec FY11 FY12 FY13E FY14E FY15E
Revenues 384 777 1,254 1,775 2,201 Gross margin 82.1% 89.8% 86.1% 86.8% 87.3%
Cost of goods sold (69) (79) (175) (235) (280) EBITDA margin 37.5% 38.3% 32.0% 35.8% 37.3%Gross Profit 315 698 1,079 1,540 1,921 Operating margin 10.5% 36.3% 19.6% 30.5% 33.5%
R&D expenses (90) (201) (336) (448) (572) Net margin 29.9% 30.8% 23.8% 27.0% 27.9%
SG&A expenses (185) (215) (438) (551) (652) R&D/sales 23.4% 25.8% 26.8% 25.2% 26.0%Operating profit (EBIT) 40 282 307 544 700 SG&A/Sales 48.2% 27.7% 35.0% 31.0% 29.6%EBITDA 47 296 279 599 819
Interest income 0 1 8 23 31 Sales growth 303.9% 102.2% 61.5% 41.6% 24.0%Interest expense 0 (4) 0 0 0 Operating profit growth (199.5%) 602.1% 8.8% 76.9% 28.7%
Investment income (Exp.) 0 (3) 8 23 31 Net profit growth (144.2%) 1119.2% (228.5%) (259.8%) 29.1%Non-operating Income (expense) 0 0 0 0 0 EPS (reported) growth (144.2%) 1086.7% (367.1%) (159.9%) 29.1%
Earnings before tax 41 261 (204) 567 731
Tax (23) (44) (75) (120) (154) Interest coverage (x) NM 118.8 NM NM NMNet income (reported) 18 218 (280) 447 577Net income (adjusted) 115 239 299 480 614 Net debt to total capital (907.4%) 69.6% 137.1% 190.9% 262.3%
Net debt to equity (90.1%) 228.8% (369.6%) (210.0%) (161.6%)EPS (reported) 0.18 2.12 (5.66) 3.39 4.38EPS (adjusted) 1.15 2.33 6.04 3.64 4.66 Asset turnover 2.1 2.0 1.2 1.0 0.9
BVPS 0.95 (1.33) 6.96 6.27 10.95 Working capital turns (x) NM 6.0 1.8 1.2 1.1DPS - - - - - ROE 302.6% (1162.0%) 288.3% 82.0% 54.2%
Shares outstanding - - - - - ROIC - - - - -
Balance sheet Cash flow statement
Rmb in millions, year end Dec FY11 FY12 FY13E FY14E FY15E Rmb in millions, year end Dec FY11 FY12 FY13E FY14E FY15E
Cash and cash equivalents 86 313 1,271 1,734 2,331 Net income 18 218 (280) 447 577Accounts receivable 46 84 126 172 198 Depr. & amortization 7 15 34 57 81
Inventories - - - - - Change in working capital (19) 45 (35) 13 20Others 61 20 33 40 43 Other 73 (22) 580 35 40
Current assets 193 417 1,430 1,946 2,571 Cash flow from operations 101 300 299 552 718LT investments 0 0 0 0 0 Capex (28) (20) (31) (36) (44)Net fixed assets 39 47 57 62 69 Disposal/(purchase) 0 1 0 0 0
Others 21 27 27 27 27 Cash flow from investing (28) (52) (41) (89) (121)Total Assets 255 522 1,543 2,090 2,755 Free cash flow 73 283 258 498 649Liabilities Equity raised/(repaid) 0 63 0 0 0
ST Loans - - - - - Debt raised/(repaid) 0 0 0 0 0Payables 12 10 18 26 27 Other 0 6 700 0 0
Others 138 189 201 259 307 Dividends paid 0 (91) 0 0 0Total current liabilities 150 199 219 285 334 Cash flow from financing 0 (21) 700 0 0Long-term debt 0 0 0 0 0 Net change in cash 73 227 958 463 597
Other liabilities 9 8 8 8 8 Beginning cash 13 86 313 1,271 1,734Total Liabilities 159 659 1,199 1,264 1,313 Ending cash 86 313 1,271 1,734 2,331Shareholder's equity 95 (137) 344 825 1,442
Source: Company reports and J.P. Morgan estimates.
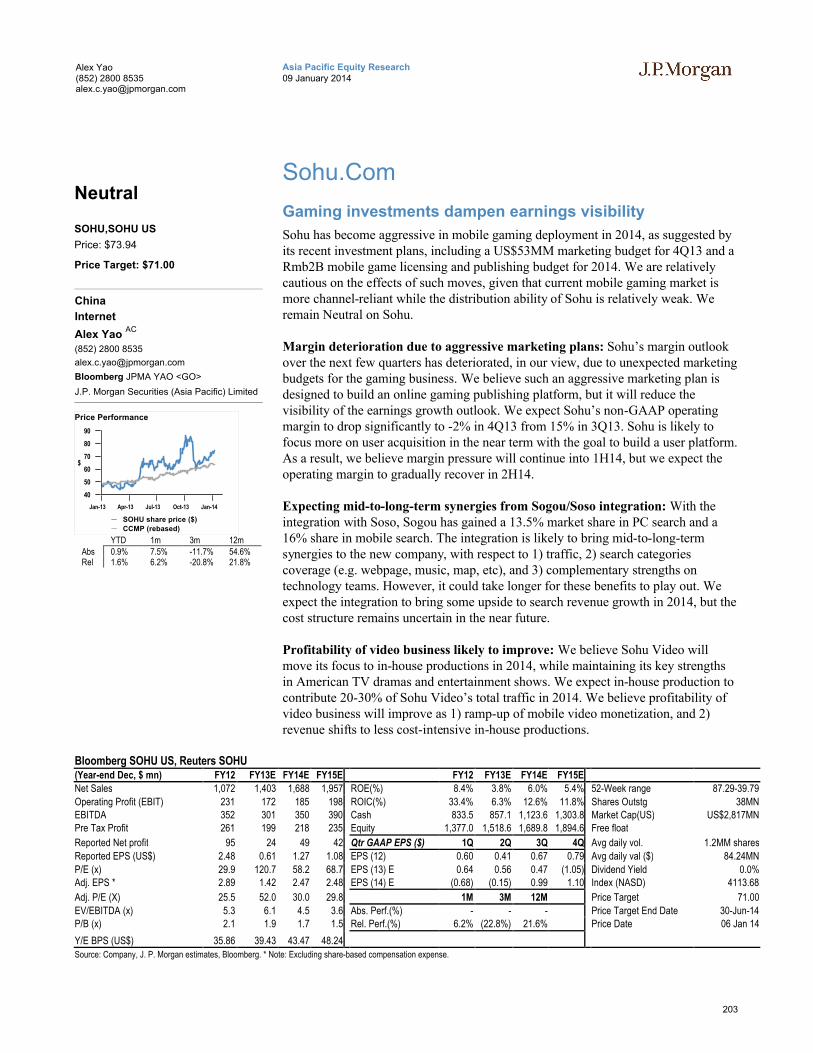
203
Asia Pacific Equity Research09 January 2014
Alex Yao(852) 2800 [email protected]
Sohu.Com
Gaming investments dampen earnings visibility
Sohu has become aggressive in mobile gaming deployment in 2014, as suggested by its recent investment plans, including a US$53MM marketing budget for 4Q13 and a Rmb2B mobile game licensing and publishing budget for 2014. We are relatively cautious on the effects of such moves, given that current mobile gaming market is more channel-reliant while the distribution ability of Sohu is relatively weak. We remain Neutral on Sohu.
Margin deterioration due to aggressive marketing plans: Sohu’s margin outlook over the next few quarters has deteriorated, in our view, due to unexpected marketing budgets for the gaming business. We believe such an aggressive marketing plan is designed to build an online gaming publishing platform, but it will reduce the visibility of the earnings growth outlook. We expect Sohu’s non-GAAP operating margin to drop significantly to -2% in 4Q13 from 15% in 3Q13. Sohu is likely to focus more on user acquisition in the near term with the goal to build a user platform. As a result, we believe margin pressure will continue into 1H14, but we expect the operating margin to gradually recover in 2H14.
Expecting mid-to-long-term synergies from Sogou/Soso integration: With the integration with Soso, Sogou has gained a 13.5% market share in PC search and a 16% share in mobile search. The integration is likely to bring mid-to-long-term synergies to the new company, with respect to 1) traffic, 2) search categories coverage (e.g. webpage, music, map, etc), and 3) complementary strengths on technology teams. However, it could take longer for these benefits to play out. We expect the integration to bring some upside to search revenue growth in 2014, but the cost structure remains uncertain in the near future.
Profitability of video business likely to improve: We believe Sohu Video will move its focus to in-house productions in 2014, while maintaining its key strengths in American TV dramas and entertainment shows. We expect in-house production to contribute 20-30% of Sohu Video’s total traffic in 2014. We believe profitability of video business will improve as 1) ramp-up of mobile video monetization, and 2) revenue shifts to less cost-intensive in-house productions.
Bloomberg SOHU US, Reuters SOHU(Year-end Dec, $ mn) FY12 FY13E FY14E FY15E FY12 FY13E FY14E FY15E
Net Sales 1,072 1,403 1,688 1,957 ROE(%) 8.4% 3.8% 6.0% 5.4% 52-Week range 87.29-39.79
Operating Profit (EBIT) 231 172 185 198 ROIC(%) 33.4% 6.3% 12.6% 11.8% Shares Outstg 38MNEBITDA 352 301 350 390 Cash 833.5 857.1 1,123.6 1,303.8 Market Cap(US) US$2,817MNPre Tax Profit 261 199 218 235 Equity 1,377.0 1,518.6 1,689.8 1,894.6 Free float
Reported Net profit 95 24 49 42 Qtr GAAP EPS ($) 1Q 2Q 3Q 4Q Avg daily vol. 1.2MM shares
Reported EPS (US$) 2.48 0.61 1.27 1.08 EPS (12) 0.60 0.41 0.67 0.79 Avg daily val ($) 84.24MN
P/E (x) 29.9 120.7 58.2 68.7 EPS (13) E 0.64 0.56 0.47 (1.05) Dividend Yield 0.0%Adj. EPS * 2.89 1.42 2.47 2.48 EPS (14) E (0.68) (0.15) 0.99 1.10 Index (NASD) 4113.68
Adj. P/E (X) 25.5 52.0 30.0 29.8 1M 3M 12M Price Target 71.00
EV/EBITDA (x) 5.3 6.1 4.5 3.6 Abs. Perf.(%) - - - Price Target End Date 30-Jun-14P/B (x) 2.1 1.9 1.7 1.5 Rel. Perf.(%) 6.2% (22.8%) 21.6% Price Date 06 Jan 14
Y/E BPS (US$) 35.86 39.43 43.47 48.24
Source: Company, J. P. Morgan estimates, Bloomberg. * Note: Excluding share-based compensation expense.
Neutral
SOHU,SOHU US
Price: $73.94
Price Target: $71.00
China
Internet
Alex Yao AC
(852) 2800 8535
Bloomberg JPMA YAO <GO>
J.P. Morgan Securities (Asia Pacific) Limited
40
50
60
70
80
90
$
Jan-13 Apr-13 Jul-13 Oct-13 Jan-14
Price Performance
SOHU share price ($)
CCMP (rebased)
YTD 1m 3m 12mAbs 0.9% 7.5% -11.7% 54.6%Rel 1.6% 6.2% -20.8% 21.8%
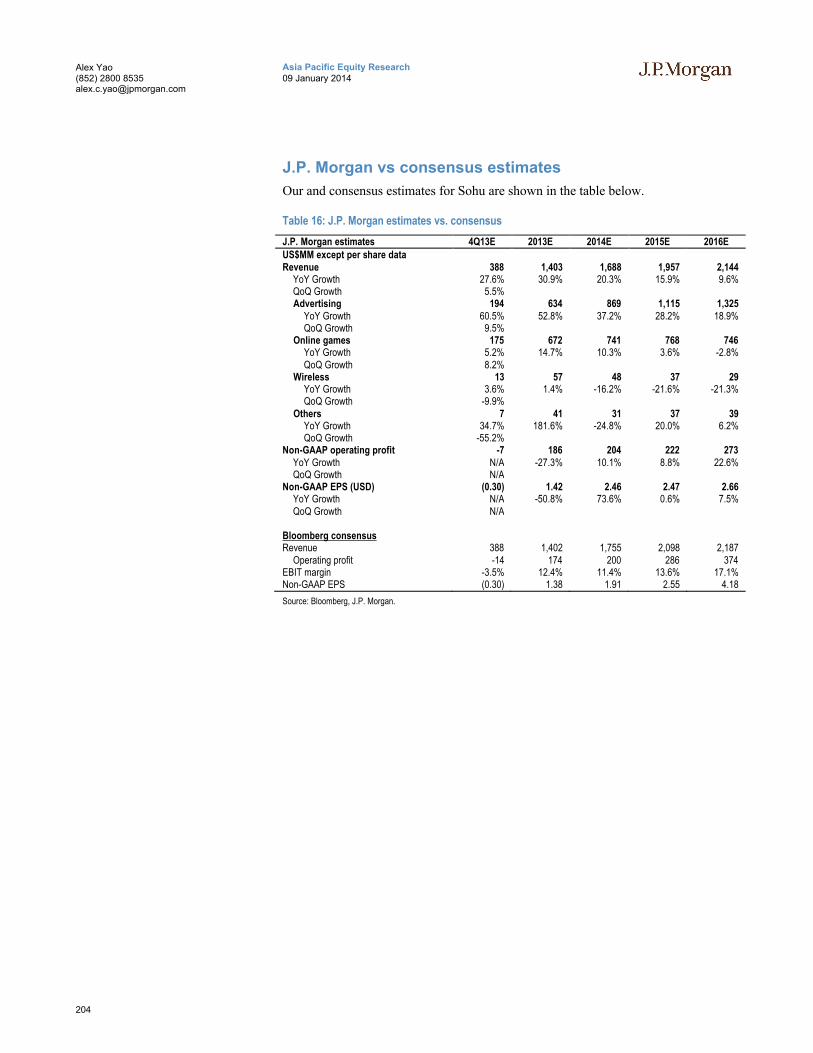
204
Asia Pacific Equity Research09 January 2014
Alex Yao(852) 2800 [email protected]
J.P. Morgan vs consensus estimates
Our and consensus estimates for Sohu are shown in the table below.
Table 16: J.P. Morgan estimates vs. consensus
J.P. Morgan estimates 4Q13E 2013E 2014E 2015E 2016EUS$MM except per share dataRevenue 388 1,403 1,688 1,957 2,144
YoY Growth 27.6% 30.9% 20.3% 15.9% 9.6%QoQ Growth 5.5%Advertising 194 634 869 1,115 1,325
YoY Growth 60.5% 52.8% 37.2% 28.2% 18.9%QoQ Growth 9.5%
Online games 175 672 741 768 746YoY Growth 5.2% 14.7% 10.3% 3.6% -2.8%QoQ Growth 8.2%
Wireless 13 57 48 37 29YoY Growth 3.6% 1.4% -16.2% -21.6% -21.3%QoQ Growth -9.9%
Others 7 41 31 37 39YoY Growth 34.7% 181.6% -24.8% 20.0% 6.2%QoQ Growth -55.2%
Non-GAAP operating profit -7 186 204 222 273YoY Growth N/A -27.3% 10.1% 8.8% 22.6%QoQ Growth N/A
Non-GAAP EPS (USD) (0.30) 1.42 2.46 2.47 2.66 YoY Growth N/A -50.8% 73.6% 0.6% 7.5%QoQ Growth N/A
Bloomberg consensusRevenue 388 1,402 1,755 2,098 2,187
Operating profit -14 174 200 286 374EBIT margin -3.5% 12.4% 11.4% 13.6% 17.1%Non-GAAP EPS (0.30) 1.38 1.91 2.55 4.18
Source: Bloomberg, J.P. Morgan.
205
Asia Pacific Equity Research09 January 2014
Alex Yao(852) 2800 [email protected]
Investment Thesis, Valuation and Risks
Sohu.Com (Neutral; Price Target: $71.00)
Investment Thesis
Sohu’s margin outlook over the next few quarters has deteriorated due to unexpected marketing budgets for the gaming business. We believe such an aggressive marketing plan is designed to build an online gaming publishing platform. Visibility on the earnings growth outlook decreases as a result of the marketing plan.
Valuation
We maintain our Neutral rating on Sohu and our Jun-14 PT of US$71.
Our SOTP valuation comprises:
US$438MM from portal ads based on 10x 2014E non-GAAP P/E.
US$289MM from Sogou, based on a 2014E/PS ratio of 2.5x, 2014E revenue of US$322MM and a 40% shareholding in Sogou.
US$330MM from the video business, based on 2014E revenue of US$110MM and a 2014E P/S ratio of 3.0x.
US$654MM from the online gaming business, based on 2014E net profit of US$271MM and a 2014E non-GAAP ex-cash P/E of 4.0x.
US$30MM from WVAS based on 8x 2014E non-GAAP P/E.
Our PT implies a 2014E P/E of 29x.
Risks to Rating and Price Target
Upside risks to our views include 1) faster-than-expected ramp-up of video revenue, 2) stronger-than-expected performance of new TLBB, and 3) mobile gaming performance.
Downside risks to our views include 1) soft advertising outlook, 2) loss of content-centric video traffic, and 3) higher-than-expected marketing expenses.
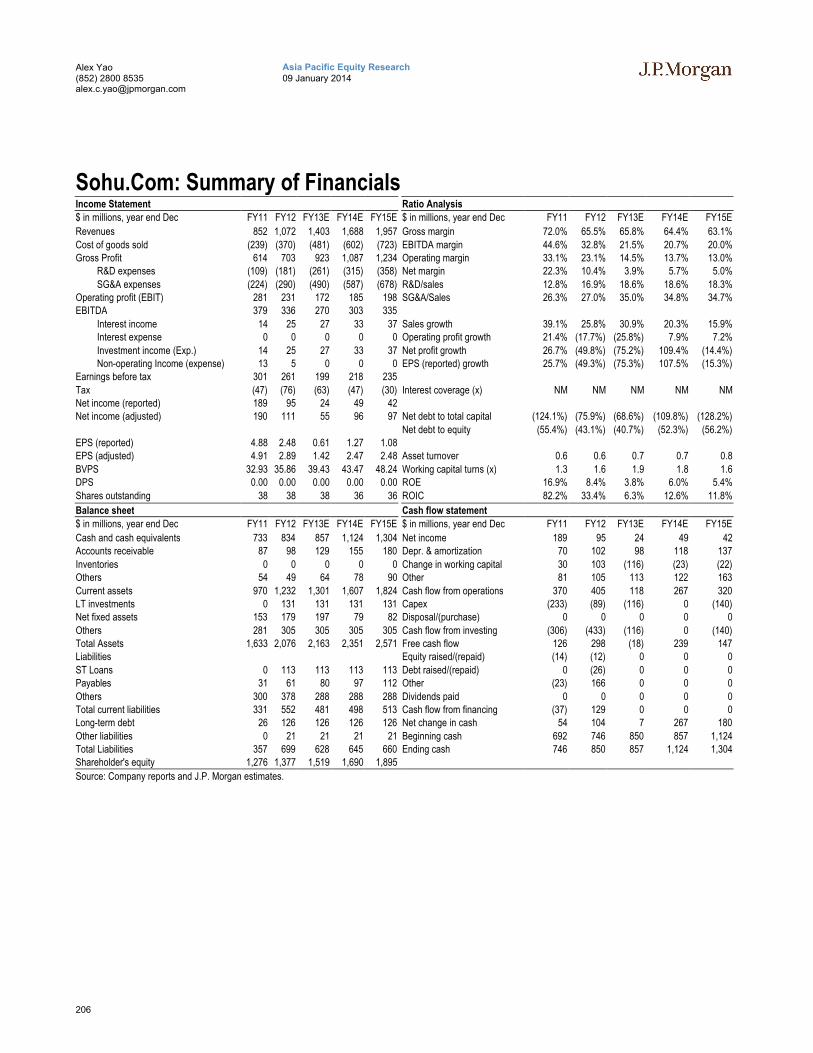
206
Asia Pacific Equity Research09 January 2014
Alex Yao(852) 2800 [email protected]
Sohu.Com: Summary of FinancialsIncome Statement Ratio Analysis
$ in millions, year end Dec FY11 FY12 FY13E FY14E FY15E $ in millions, year end Dec FY11 FY12 FY13E FY14E FY15E
Revenues 852 1,072 1,403 1,688 1,957 Gross margin 72.0% 65.5% 65.8% 64.4% 63.1%
Cost of goods sold (239) (370) (481) (602) (723) EBITDA margin 44.6% 32.8% 21.5% 20.7% 20.0%Gross Profit 614 703 923 1,087 1,234 Operating margin 33.1% 23.1% 14.5% 13.7% 13.0%
R&D expenses (109) (181) (261) (315) (358) Net margin 22.3% 10.4% 3.9% 5.7% 5.0%
SG&A expenses (224) (290) (490) (587) (678) R&D/sales 12.8% 16.9% 18.6% 18.6% 18.3%Operating profit (EBIT) 281 231 172 185 198 SG&A/Sales 26.3% 27.0% 35.0% 34.8% 34.7%EBITDA 379 336 270 303 335
Interest income 14 25 27 33 37 Sales growth 39.1% 25.8% 30.9% 20.3% 15.9%Interest expense 0 0 0 0 0 Operating profit growth 21.4% (17.7%) (25.8%) 7.9% 7.2%
Investment income (Exp.) 14 25 27 33 37 Net profit growth 26.7% (49.8%) (75.2%) 109.4% (14.4%)Non-operating Income (expense) 13 5 0 0 0 EPS (reported) growth 25.7% (49.3%) (75.3%) 107.5% (15.3%)
Earnings before tax 301 261 199 218 235
Tax (47) (76) (63) (47) (30) Interest coverage (x) NM NM NM NM NMNet income (reported) 189 95 24 49 42Net income (adjusted) 190 111 55 96 97 Net debt to total capital (124.1%) (75.9%) (68.6%) (109.8%) (128.2%)
Net debt to equity (55.4%) (43.1%) (40.7%) (52.3%) (56.2%)EPS (reported) 4.88 2.48 0.61 1.27 1.08EPS (adjusted) 4.91 2.89 1.42 2.47 2.48 Asset turnover 0.6 0.6 0.7 0.7 0.8
BVPS 32.93 35.86 39.43 43.47 48.24 Working capital turns (x) 1.3 1.6 1.9 1.8 1.6DPS 0.00 0.00 0.00 0.00 0.00 ROE 16.9% 8.4% 3.8% 6.0% 5.4%
Shares outstanding 38 38 38 36 36 ROIC 82.2% 33.4% 6.3% 12.6% 11.8%
Balance sheet Cash flow statement
$ in millions, year end Dec FY11 FY12 FY13E FY14E FY15E $ in millions, year end Dec FY11 FY12 FY13E FY14E FY15E
Cash and cash equivalents 733 834 857 1,124 1,304 Net income 189 95 24 49 42Accounts receivable 87 98 129 155 180 Depr. & amortization 70 102 98 118 137
Inventories 0 0 0 0 0 Change in working capital 30 103 (116) (23) (22)Others 54 49 64 78 90 Other 81 105 113 122 163
Current assets 970 1,232 1,301 1,607 1,824 Cash flow from operations 370 405 118 267 320LT investments 0 131 131 131 131 Capex (233) (89) (116) 0 (140)Net fixed assets 153 179 197 79 82 Disposal/(purchase) 0 0 0 0 0
Others 281 305 305 305 305 Cash flow from investing (306) (433) (116) 0 (140)Total Assets 1,633 2,076 2,163 2,351 2,571 Free cash flow 126 298 (18) 239 147Liabilities Equity raised/(repaid) (14) (12) 0 0 0
ST Loans 0 113 113 113 113 Debt raised/(repaid) 0 (26) 0 0 0Payables 31 61 80 97 112 Other (23) 166 0 0 0
Others 300 378 288 288 288 Dividends paid 0 0 0 0 0Total current liabilities 331 552 481 498 513 Cash flow from financing (37) 129 0 0 0Long-term debt 26 126 126 126 126 Net change in cash 54 104 7 267 180
Other liabilities 0 21 21 21 21 Beginning cash 692 746 850 857 1,124Total Liabilities 357 699 628 645 660 Ending cash 746 850 857 1,124 1,304Shareholder's equity 1,276 1,377 1,519 1,690 1,895
Source: Company reports and J.P. Morgan estimates.
207
Asia Pacific Equity Research09 January 2014
Alex Yao(852) 2800 [email protected]
NetEase
Mixed dynamics of game titles
NetEase’s core gaming business is underpinned by three different factors: 1) continued deterioration of World of Warcraft; 2) relatively stable performance of legacy titles (e.g. Fantasy Westward Journey and Westward Journey); and 3) growth from relatively new games (e.g. Ghost, Heroes of Tang Dynasty II). We expect revenue growth to stay at 1-3% QoQ over the next few quarters, until mobile games or new PC games take off. With a stabilized margin outlook, we forecast EPS to grow 8% in 2014. The key swing factor to our assumption is legacy titles performance.
Lackluster PC gaming performance: Core gaming business (84% of total revenue) grew 2% QoQ and 21% YoY in 3Q13. Fantasy Westward Journey II, Kung Fu Master, Heroes of Tang Dynasty II and New Westward Journey Online II, were the major drivers of revenue growth, while World of Warcraft experienced continued usage and revenue decline.
Solid mobile games pipeline but uncertain revenue outlook: NetEase has roughly 20 mobile games in the pipeline, such as the mobile version of Westward Journey 3 (WWJ3) and Hearthstone, a card game licensed from Blizzard. Similar to its gaming initiative on PC, NetEase will primarily focus on in-house developed mobile game titles in 2014. However, revenue contribution from these titles is uncertain given the higher hit-or-miss risks in the mobile game market, especially for mobile game developers.
Bloomberg NTES US, Reuters NTES(Year-end Dec, Rmb mn) FY12 FY13E FY14E FY15E FY12 FY13E FY14E FY15E
Net Sales 8,380 9,752 10,733 11,793 ROE(%) 26.8% 26.1% 22.8% 21.1% 52-Week range 79.86-41.20
Operating Profit (EBIT) 3,712 4,381 4,949 5,637 ROIC(%) (1769.1%) (579.4%) (475.7%) (453.6%) Shares Outstg 132MNEBITDA 3,945 4,654 5,250 5,967 Cash 1,590.8 2,160.6 3,674.7 5,364.6 Market Cap(US) US$10,264MNPre Tax Profit 4,278 4,929 5,393 6,225 Equity 15,601.5 19,053.6 23,707.4 28,996.6 Free float
Reported Net profit 3,637 4,272 4,599 5,274 Qtr GAAP EPS (Rmb) 1Q 2Q 3Q 4Q Avg daily vol. 0.8MM shares
Reported EPS (Rmb) 27.654 32.743 35.251 40.429 EPS (12) 7.168 6.646 6.165 7.678 Avg daily val ($) 53.29MN
P/E (x) 17.1 14.4 13.4 11.7 EPS (13) E 8.189 8.410 8.038 8.107 Dividend Yield 1.3%Adj. EPS * 29.35 34.81 37.53 42.88 EPS (14) E 8.670 8.558 8.904 9.117 Index (NASD) 4113.68
Adj. P/E (X) 16.1 13.6 12.6 11.0 1M 3M 12M Price Target 74.00
EV/EBITDA (x) 13.7 11.5 9.9 8.4 Abs. Perf.(%) - - - Price Target End Date 30-Jun-14P/B (x) 4.0 3.2 2.6 2.1 Rel. Perf.(%) 9.1% (0.5%) 47.0% Price Date 06 Jan 14
Y/E BPS (Rmb) 118.61 146.05 181.72 222.26
Source: Company, J. P. Morgan estimates, Bloomberg. * Note: Excluding share-based compensation expense.
Neutral
NTES,NTES US
Price: $78.03
Price Target: $74.00
China
Internet
Alex Yao AC
(852) 2800 8535
Bloomberg JPMA YAO <GO>
J.P. Morgan Securities (Asia Pacific) Limited
40
50
60
70
80
$
Jan-13 Apr-13 Jul-13 Oct-13 Jan-14
Price Performance
NTES share price ($)
CCMP (rebased)
YTD 1m 3m 12mAbs -0.4% 10.4% 9.8% 81.4%Rel 0.3% 9.1% 0.7% 48.6%
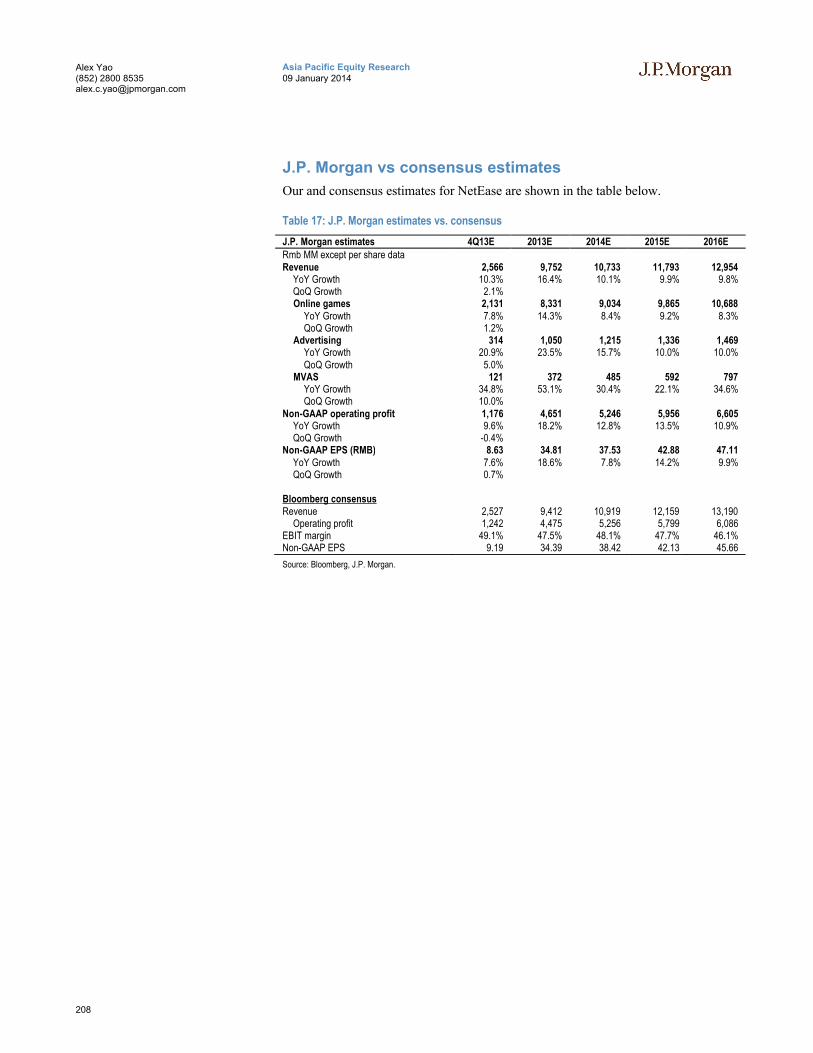
208
Asia Pacific Equity Research09 January 2014
Alex Yao(852) 2800 [email protected]
J.P. Morgan vs consensus estimates
Our and consensus estimates for NetEase are shown in the table below.
Table 17: J.P. Morgan estimates vs. consensus
J.P. Morgan estimates 4Q13E 2013E 2014E 2015E 2016ERmb MM except per share dataRevenue 2,566 9,752 10,733 11,793 12,954
YoY Growth 10.3% 16.4% 10.1% 9.9% 9.8%QoQ Growth 2.1%Online games 2,131 8,331 9,034 9,865 10,688
YoY Growth 7.8% 14.3% 8.4% 9.2% 8.3%QoQ Growth 1.2%
Advertising 314 1,050 1,215 1,336 1,469YoY Growth 20.9% 23.5% 15.7% 10.0% 10.0%QoQ Growth 5.0%
MVAS 121 372 485 592 797YoY Growth 34.8% 53.1% 30.4% 22.1% 34.6%QoQ Growth 10.0%
Non-GAAP operating profit 1,176 4,651 5,246 5,956 6,605YoY Growth 9.6% 18.2% 12.8% 13.5% 10.9%QoQ Growth -0.4%
Non-GAAP EPS (RMB) 8.63 34.81 37.53 42.88 47.11 YoY Growth 7.6% 18.6% 7.8% 14.2% 9.9%QoQ Growth 0.7%
Bloomberg consensusRevenue 2,527 9,412 10,919 12,159 13,190
Operating profit 1,242 4,475 5,256 5,799 6,086EBIT margin 49.1% 47.5% 48.1% 47.7% 46.1%Non-GAAP EPS 9.19 34.39 38.42 42.13 45.66
Source: Bloomberg, J.P. Morgan.
209
Asia Pacific Equity Research09 January 2014
Alex Yao(852) 2800 [email protected]
Investment Thesis, Valuation and Risks
NetEase (Neutral; Price Target: $74.00)
Investment Thesis
We believe revenue growth from legacy titles will continue to slow down in 2014. As a result, NetEase’s growth is likely to primarily hinge on the performance of 1) newly launched PC games, and 2) mobile games. We think visibility on the successof these titles in 2014 is low. Meanwhile, we believe mobile games developers entail higher hit-or-miss risks than distributors given the lower hit rate in the mobile gaming market.
Valuation
We maintain our Neutral rating on NetEase and our Jun-14 PT of US$74. Our PT is based on 2014E non-GAAP FD EPADS of US$6.02, an FY14-16E EPADS CAGR of 12% and a PEG of 1.0x. We leverage PEG as our primary valuation methodology, due to its ability to balance valuation multiples against growth outlook.
Our PT implies a 2014E P/E of 12x.
As an additional check, we conduct a DCF valuation which delivers a comparable price of US$80. Key assumptions in our DCF valuation are: 1) a long-term risk free rate of 4%, 2) an equity risk premium of 7% in the China market, 3) a beta of 0.7, 4) a discount rate of 9% and 5) a terminal growth rate of 2%.
Risks to Rating and Price Target
Upside risks to our views include:
Mobile games monetization
Slower-than-expected game aging
Outperformance of new PC games
Downside risks to our views include:
Shrinking revenue from World of Warcraft
Faster-than-expected game aging
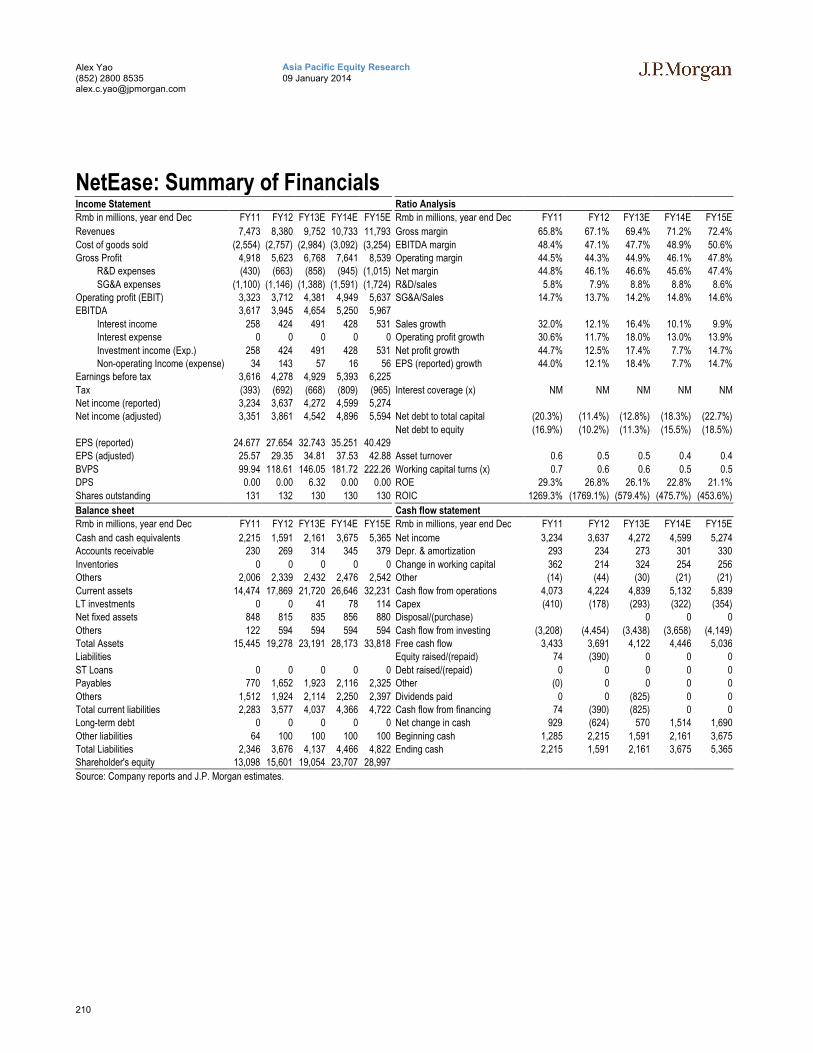
210
Asia Pacific Equity Research09 January 2014
Alex Yao(852) 2800 [email protected]
NetEase: Summary of FinancialsIncome Statement Ratio Analysis
Rmb in millions, year end Dec FY11 FY12 FY13E FY14E FY15E Rmb in millions, year end Dec FY11 FY12 FY13E FY14E FY15E
Revenues 7,473 8,380 9,752 10,733 11,793 Gross margin 65.8% 67.1% 69.4% 71.2% 72.4%
Cost of goods sold (2,554) (2,757) (2,984) (3,092) (3,254) EBITDA margin 48.4% 47.1% 47.7% 48.9% 50.6%Gross Profit 4,918 5,623 6,768 7,641 8,539 Operating margin 44.5% 44.3% 44.9% 46.1% 47.8%
R&D expenses (430) (663) (858) (945) (1,015) Net margin 44.8% 46.1% 46.6% 45.6% 47.4%
SG&A expenses (1,100) (1,146) (1,388) (1,591) (1,724) R&D/sales 5.8% 7.9% 8.8% 8.8% 8.6%Operating profit (EBIT) 3,323 3,712 4,381 4,949 5,637 SG&A/Sales 14.7% 13.7% 14.2% 14.8% 14.6%EBITDA 3,617 3,945 4,654 5,250 5,967
Interest income 258 424 491 428 531 Sales growth 32.0% 12.1% 16.4% 10.1% 9.9%Interest expense 0 0 0 0 0 Operating profit growth 30.6% 11.7% 18.0% 13.0% 13.9%
Investment income (Exp.) 258 424 491 428 531 Net profit growth 44.7% 12.5% 17.4% 7.7% 14.7%Non-operating Income (expense) 34 143 57 16 56 EPS (reported) growth 44.0% 12.1% 18.4% 7.7% 14.7%
Earnings before tax 3,616 4,278 4,929 5,393 6,225
Tax (393) (692) (668) (809) (965) Interest coverage (x) NM NM NM NM NMNet income (reported) 3,234 3,637 4,272 4,599 5,274Net income (adjusted) 3,351 3,861 4,542 4,896 5,594 Net debt to total capital (20.3%) (11.4%) (12.8%) (18.3%) (22.7%)
Net debt to equity (16.9%) (10.2%) (11.3%) (15.5%) (18.5%)EPS (reported) 24.677 27.654 32.743 35.251 40.429EPS (adjusted) 25.57 29.35 34.81 37.53 42.88 Asset turnover 0.6 0.5 0.5 0.4 0.4
BVPS 99.94 118.61 146.05 181.72 222.26 Working capital turns (x) 0.7 0.6 0.6 0.5 0.5DPS 0.00 0.00 6.32 0.00 0.00 ROE 29.3% 26.8% 26.1% 22.8% 21.1%
Shares outstanding 131 132 130 130 130 ROIC 1269.3% (1769.1%) (579.4%) (475.7%) (453.6%)
Balance sheet Cash flow statement
Rmb in millions, year end Dec FY11 FY12 FY13E FY14E FY15E Rmb in millions, year end Dec FY11 FY12 FY13E FY14E FY15E
Cash and cash equivalents 2,215 1,591 2,161 3,675 5,365 Net income 3,234 3,637 4,272 4,599 5,274Accounts receivable 230 269 314 345 379 Depr. & amortization 293 234 273 301 330
Inventories 0 0 0 0 0 Change in working capital 362 214 324 254 256Others 2,006 2,339 2,432 2,476 2,542 Other (14) (44) (30) (21) (21)
Current assets 14,474 17,869 21,720 26,646 32,231 Cash flow from operations 4,073 4,224 4,839 5,132 5,839LT investments 0 0 41 78 114 Capex (410) (178) (293) (322) (354)Net fixed assets 848 815 835 856 880 Disposal/(purchase) 0 0 0
Others 122 594 594 594 594 Cash flow from investing (3,208) (4,454) (3,438) (3,658) (4,149)Total Assets 15,445 19,278 23,191 28,173 33,818 Free cash flow 3,433 3,691 4,122 4,446 5,036Liabilities Equity raised/(repaid) 74 (390) 0 0 0
ST Loans 0 0 0 0 0 Debt raised/(repaid) 0 0 0 0 0Payables 770 1,652 1,923 2,116 2,325 Other (0) 0 0 0 0
Others 1,512 1,924 2,114 2,250 2,397 Dividends paid 0 0 (825) 0 0Total current liabilities 2,283 3,577 4,037 4,366 4,722 Cash flow from financing 74 (390) (825) 0 0Long-term debt 0 0 0 0 0 Net change in cash 929 (624) 570 1,514 1,690
Other liabilities 64 100 100 100 100 Beginning cash 1,285 2,215 1,591 2,161 3,675Total Liabilities 2,346 3,676 4,137 4,466 4,822 Ending cash 2,215 1,591 2,161 3,675 5,365Shareholder's equity 13,098 15,601 19,054 23,707 28,997
Source: Company reports and J.P. Morgan estimates.
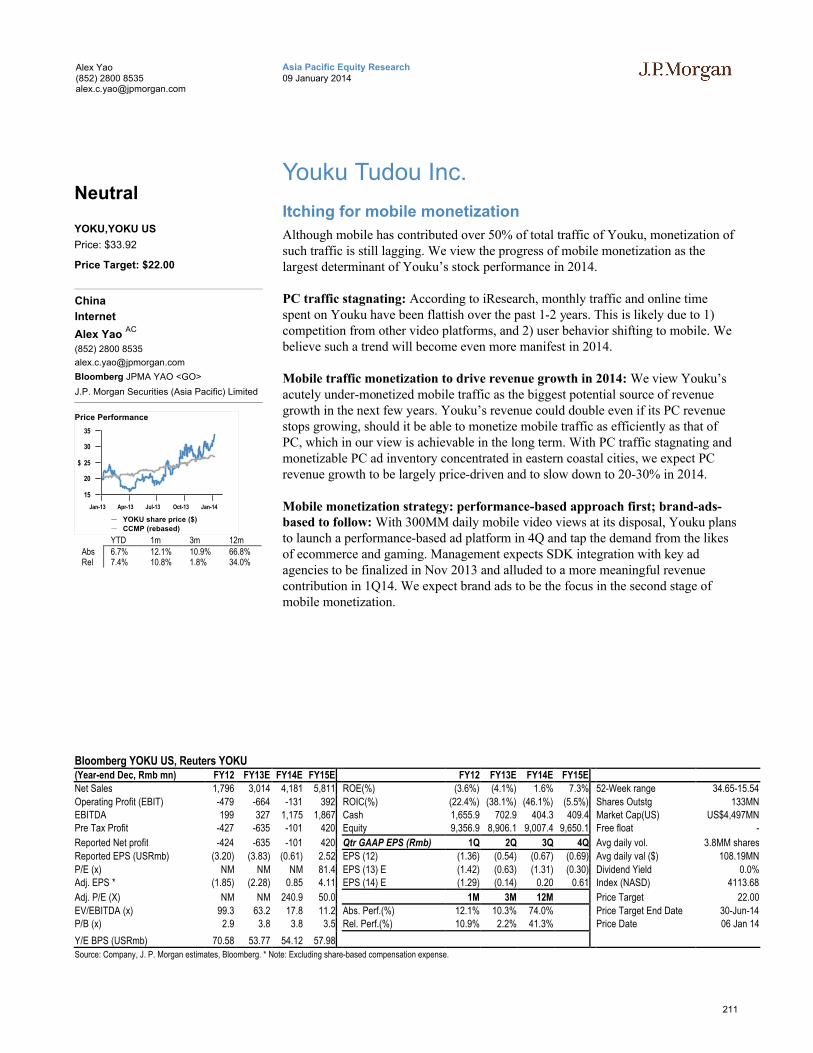
211
Asia Pacific Equity Research09 January 2014
Alex Yao(852) 2800 [email protected]
Youku Tudou Inc.
Itching for mobile monetization
Although mobile has contributed over 50% of total traffic of Youku, monetization of such traffic is still lagging. We view the progress of mobile monetization as the largest determinant of Youku’s stock performance in 2014.
PC traffic stagnating: According to iResearch, monthly traffic and online time spent on Youku have been flattish over the past 1-2 years. This is likely due to 1) competition from other video platforms, and 2) user behavior shifting to mobile. We believe such a trend will become even more manifest in 2014.
Mobile traffic monetization to drive revenue growth in 2014: We view Youku’s acutely under-monetized mobile traffic as the biggest potential source of revenue growth in the next few years. Youku’s revenue could double even if its PC revenue stops growing, should it be able to monetize mobile traffic as efficiently as that of PC, which in our view is achievable in the long term. With PC traffic stagnating and monetizable PC ad inventory concentrated in eastern coastal cities, we expect PC revenue growth to be largely price-driven and to slow down to 20-30% in 2014.
Mobile monetization strategy: performance-based approach first; brand-ads-based to follow: With 300MM daily mobile video views at its disposal, Youku plans to launch a performance-based ad platform in 4Q and tap the demand from the likes of ecommerce and gaming. Management expects SDK integration with key ad agencies to be finalized in Nov 2013 and alluded to a more meaningful revenue contribution in 1Q14. We expect brand ads to be the focus in the second stage of mobile monetization.
Bloomberg YOKU US, Reuters YOKU(Year-end Dec, Rmb mn) FY12 FY13E FY14E FY15E FY12 FY13E FY14E FY15E
Net Sales 1,796 3,014 4,181 5,811 ROE(%) (3.6%) (4.1%) 1.6% 7.3% 52-Week range 34.65-15.54
Operating Profit (EBIT) -479 -664 -131 392 ROIC(%) (22.4%) (38.1%) (46.1%) (5.5%) Shares Outstg 133MNEBITDA 199 327 1,175 1,867 Cash 1,655.9 702.9 404.3 409.4 Market Cap(US) US$4,497MNPre Tax Profit -427 -635 -101 420 Equity 9,356.9 8,906.1 9,007.4 9,650.1 Free float -
Reported Net profit -424 -635 -101 420 Qtr GAAP EPS (Rmb) 1Q 2Q 3Q 4Q Avg daily vol. 3.8MM shares
Reported EPS (USRmb) (3.20) (3.83) (0.61) 2.52 EPS (12) (1.36) (0.54) (0.67) (0.69) Avg daily val ($) 108.19MN
P/E (x) NM NM NM 81.4 EPS (13) E (1.42) (0.63) (1.31) (0.30) Dividend Yield 0.0%Adj. EPS * (1.85) (2.28) 0.85 4.11 EPS (14) E (1.29) (0.14) 0.20 0.61 Index (NASD) 4113.68
Adj. P/E (X) NM NM 240.9 50.0 1M 3M 12M Price Target 22.00
EV/EBITDA (x) 99.3 63.2 17.8 11.2 Abs. Perf.(%) 12.1% 10.3% 74.0% Price Target End Date 30-Jun-14P/B (x) 2.9 3.8 3.8 3.5 Rel. Perf.(%) 10.9% 2.2% 41.3% Price Date 06 Jan 14
Y/E BPS (USRmb) 70.58 53.77 54.12 57.98
Source: Company, J. P. Morgan estimates, Bloomberg. * Note: Excluding share-based compensation expense.
Neutral
YOKU,YOKU US
Price: $33.92
Price Target: $22.00
China
Internet
Alex Yao AC
(852) 2800 8535
Bloomberg JPMA YAO <GO>
J.P. Morgan Securities (Asia Pacific) Limited
15
20
25
30
35
$
Jan-13 Apr-13 Jul-13 Oct-13 Jan-14
Price Performance
YOKU share price ($)
CCMP (rebased)
YTD 1m 3m 12mAbs 6.7% 12.1% 10.9% 66.8%Rel 7.4% 10.8% 1.8% 34.0%

212
Asia Pacific Equity Research09 January 2014
Alex Yao(852) 2800 [email protected]
J.P. Morgan vs consensus estimates
Our and consensus estimates for Youku are shown in the table below.
Table 18: J.P. Morgan estimates vs. consensus
J.P. Morgan estimates 4Q13E 2013E 2014E 2015E 2016ERmb MM except per share dataRevenue 2,566 9,752 10,733 11,793 12,954
YoY Growth 10.3% 16.4% 10.1% 9.9% 9.8%QoQ Growth 2.1%Online games 2,131 8,331 9,034 9,865 10,688
YoY Growth 7.8% 14.3% 8.4% 9.2% 8.3%QoQ Growth 1.2%
Advertising 314 1,050 1,215 1,336 1,469YoY Growth 20.9% 23.5% 15.7% 10.0% 10.0%QoQ Growth 5.0%
MVAS 121 372 485 592 797YoY Growth 34.8% 53.1% 30.4% 22.1% 34.6%QoQ Growth 10.0%
Non-GAAP operating profit 1,176 4,651 5,246 5,956 6,605YoY Growth 9.6% 18.2% 12.8% 13.5% 10.9%QoQ Growth -0.4%
Non-GAAP EPS (RMB) 8.63 34.81 37.53 42.88 47.11 YoY Growth 7.6% 18.6% 7.8% 14.2% 9.9%QoQ Growth 0.7%
Bloomberg consensusRevenue 2,527 9,412 10,919 12,159 13,190
Operating profit 1,242 4,475 5,256 5,799 6,086EBIT margin 49.1% 47.5% 48.1% 47.7% 46.1%Non-GAAP EPS 9.19 34.39 38.42 42.13 45.66
Source: Bloomberg, J.P. Morgan.
213
Asia Pacific Equity Research09 January 2014
Alex Yao(852) 2800 [email protected]
Investment Thesis, Valuation and Risks
Youku Tudou Inc. (Neutral; Price Target: $22.00)
Investment Thesis
We view Youku’s acutely under-monetized mobile traffic as the biggest source of revenue growth in the next few years. With PC traffic stagnating and monetizable PC ad inventory concentrated in eastern coastal cities, we expect PC revenue growth to be largely price-driven and to slow down to 20-30% in 2014.We recommend that investors stay on the sidelines for more visibility on whether mobile monetization will lead revenue growth to meet consensus estimates. We see both upside and downside risks to the stock price.
Valuation
We maintain our Neutral rating on Youku and our Jun-14 PT of US$22.
We adopt DCF as our primary methodology to valuate Youku. Our 10-year DCF uses a 1) discount rate of 15.2%, 2) long-term risk free rate of 4%, 3) equity risk premium of 7% in China market, 4) beta of 1.6, and 5) a terminal growth rate of 4%.
Our PT implies a 2015E P/E of 29x.
Risks to Rating and Price Target
Upside risks to our views include:
Stronger-than-expected mobile monetization
Ad pricing increase on PC
Successful launch of new monetization initiatives
Downside risks to our views include:
PC traffic decline
Higher-than-expected content cost
Weaker-than-expected mobile monetization

214
Asia Pacific Equity Research09 January 2014
Alex Yao(852) 2800 [email protected]
Youku Tudou Inc.: Summary of FinancialsIncome Statement Ratio Analysis
Rmb in millions, year end Dec FY11 FY12 FY13E FY14E FY15E Rmb in millions, year end Dec FY11 FY12 FY13E FY14E FY15E
Revenues 898 1,796 3,014 4,181 5,811 Gross margin 22.3% 16.5% 18.1% 30.2% 39.7%
Cost of goods sold (697) (1,500) (2,470) (2,918) (3,501) EBITDA margin 8.9% 11.1% 10.8% 28.1% 32.1%Gross Profit 200 296 544 1,263 2,310 Operating margin (15.1%) (16.7%) (13.5%) 2.7% 11.3%
R&D expenses (73) (173) (272) (318) (378) Net margin (13.9%) (13.6%) (12.5%) 3.4% 11.8%
SG&A expenses (280) (602) (936) (1,076) (1,540) R&D/sales 8.1% 9.6% 9.0% 7.6% 6.5%Operating profit (EBIT) (183) (479) (664) (131) 392 SG&A/Sales 31.2% 33.5% 31.0% 25.7% 26.5%EBITDA 32 19 70 932 1,604
Interest income 24 45 29 29 28 Sales growth 131.9% 100.0% 67.9% 38.7% 39.0%Interest expense (7) (4) 0 0 0 Operating profit growth 18.9% 161.2% 38.7% (80.3%) (399.8%)
Investment income (Exp.) 17 41 29 29 28 Net profit growth (15.9%) 146.4% 49.8% (84.0%) (514.1%)Non-operating Income (expense) (6) 10 0 0 0 EPS (reported) growth (80.3%) 105.7% 19.9% (84.1%) (514.1%)
Earnings before tax (172) (427) (635) (101) 420
Tax 0 3 (0) 0 0 Interest coverage (x) NM NM NM NM NMNet income (reported) (172) (424) (635) (101) 420Net income (adjusted) (125) (245) (378) 142 683 Net debt to total capital (118.8%) (21.4%) (8.5%) (4.6%) (4.3%)
Net debt to equity (54.3%) (17.6%) (7.8%) (4.4%) (4.2%)EPS (reported) (1.55) (3.20) (3.83) (0.61) 2.52EPS (adjusted) (1.13) (1.85) (2.28) 0.85 4.11 Asset turnover 0.3 0.2 0.3 0.4 0.5
BVPS 37.98 70.58 53.77 54.12 57.98 Working capital turns (x) 0.3 0.5 0.9 1.6 2.4DPS 0.00 0.00 0.00 0.00 0.00 ROE (4.1%) (3.6%) (4.1%) 1.6% 7.3%
Shares outstanding 111 133 166 166 166 ROIC (53.0%) (22.4%) (38.1%) (46.1%) (5.5%)
Balance sheet Cash flow statement
Rmb in millions, year end Dec FY11 FY12 FY13E FY14E FY15E Rmb in millions, year end Dec FY11 FY12 FY13E FY14E FY15E
Cash and cash equivalents 2,293 1,656 703 404 409 Net income (172) (424) (635) (101) 420Accounts receivable 421 933 1,074 1,489 2,070 Depr. & amortization 216 498 734 1,063 1,212
Inventories 16 20 0 0 0 Change in working capital (23) (54) (124) 13 18Others 18 75 66 92 127 Other 55 117 184 203 223
Current assets 4,148 4,803 3,962 4,104 4,725 Cash flow from operations 75 137 159 1,177 1,872LT investments 2 0 0 0 0 Capex (85) (90) (211) (272) (349)Net fixed assets 97 201 221 247 280 Disposal/(purchase) 0 0 0 0 0
Others 218 229 587 974 1,596 Cash flow from investing (1,985) (784) (1,112) (1,475) (1,867)Total Assets 4,676 10,793 10,330 10,885 12,162 Free cash flow (26) 5 (81) 875 1,496Liabilities Equity raised/(repaid) 2,518 22 0 0 0
ST Loans 9 7 7 7 7 Debt raised/(repaid) (27) (43) 0 0 0Payables 60 182 182 252 350 Other 0 38 0 0 0
Others 394 1,003 991 1,375 1,910 Dividends paid 0 0 0 0 0Total current liabilities 463 1,192 1,180 1,634 2,268 Cash flow from financing 2,491 18 0 0 0Long-term debt 0 0 0 0 0 Net change in cash 481 (637) (953) (299) 5
Other liabilities 7 244 244 244 244 Beginning cash 1,811 2,293 1,656 703 404Total Liabilities 470 1,436 1,424 1,878 2,512 Ending cash 2,293 1,656 703 404 409Shareholder's equity 4,205 9,357 8,906 9,007 9,650
Source: Company reports and J.P. Morgan estimates.
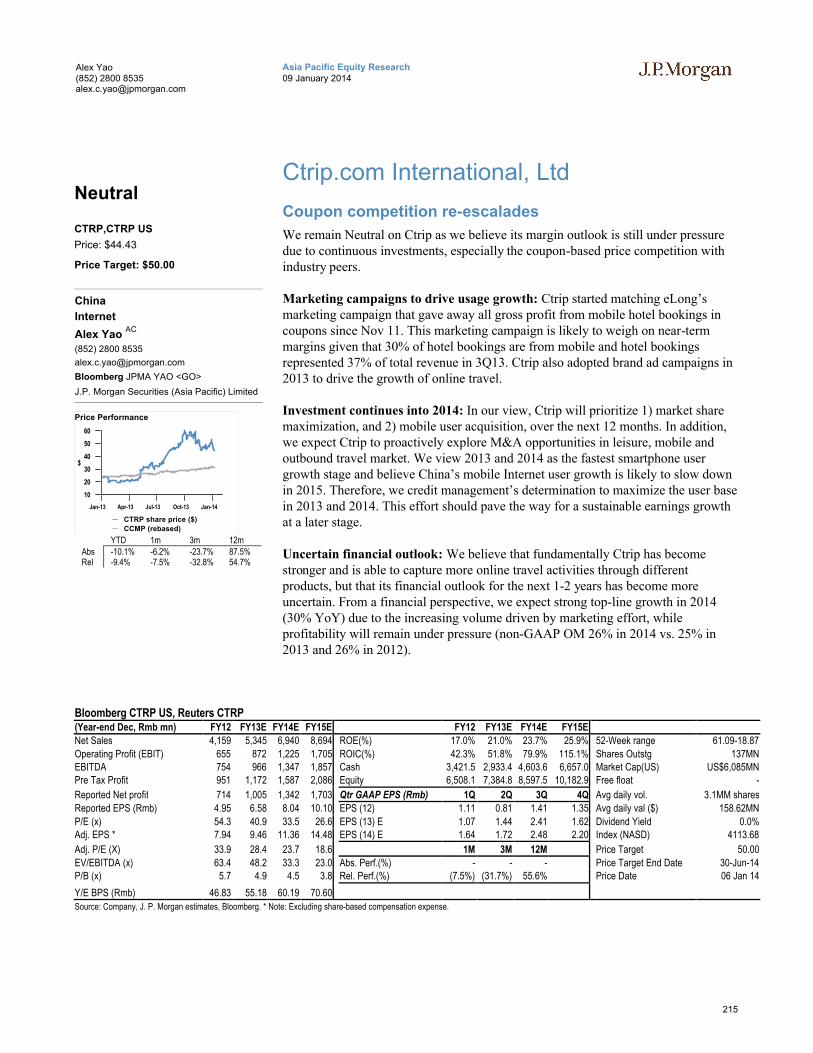
215
Asia Pacific Equity Research09 January 2014
Alex Yao(852) 2800 [email protected]
Ctrip.com International, Ltd
Coupon competition re-escalades
We remain Neutral on Ctrip as we believe its margin outlook is still under pressure due to continuous investments, especially the coupon-based price competition with industry peers.
Marketing campaigns to drive usage growth: Ctrip started matching eLong’s marketing campaign that gave away all gross profit from mobile hotel bookings in coupons since Nov 11. This marketing campaign is likely to weigh on near-term margins given that 30% of hotel bookings are from mobile and hotel bookings represented 37% of total revenue in 3Q13. Ctrip also adopted brand ad campaigns in 2013 to drive the growth of online travel.
Investment continues into 2014: In our view, Ctrip will prioritize 1) market share maximization, and 2) mobile user acquisition, over the next 12 months. In addition, we expect Ctrip to proactively explore M&A opportunities in leisure, mobile and outbound travel market. We view 2013 and 2014 as the fastest smartphone user growth stage and believe China’s mobile Internet user growth is likely to slow down in 2015. Therefore, we credit management’s determination to maximize the user base in 2013 and 2014. This effort should pave the way for a sustainable earnings growth at a later stage.
Uncertain financial outlook: We believe that fundamentally Ctrip has become stronger and is able to capture more online travel activities through different products, but that its financial outlook for the next 1-2 years has become more uncertain. From a financial perspective, we expect strong top-line growth in 2014 (30% YoY) due to the increasing volume driven by marketing effort, while profitability will remain under pressure (non-GAAP OM 26% in 2014 vs. 25% in 2013 and 26% in 2012).
Bloomberg CTRP US, Reuters CTRP(Year-end Dec, Rmb mn) FY12 FY13E FY14E FY15E FY12 FY13E FY14E FY15E
Net Sales 4,159 5,345 6,940 8,694 ROE(%) 17.0% 21.0% 23.7% 25.9% 52-Week range 61.09-18.87
Operating Profit (EBIT) 655 872 1,225 1,705 ROIC(%) 42.3% 51.8% 79.9% 115.1% Shares Outstg 137MNEBITDA 754 966 1,347 1,857 Cash 3,421.5 2,933.4 4,603.6 6,657.0 Market Cap(US) US$6,085MNPre Tax Profit 951 1,172 1,587 2,086 Equity 6,508.1 7,384.8 8,597.5 10,182.9 Free float -
Reported Net profit 714 1,005 1,342 1,703 Qtr GAAP EPS (Rmb) 1Q 2Q 3Q 4Q Avg daily vol. 3.1MM shares
Reported EPS (Rmb) 4.95 6.58 8.04 10.10 EPS (12) 1.11 0.81 1.41 1.35 Avg daily val ($) 158.62MN
P/E (x) 54.3 40.9 33.5 26.6 EPS (13) E 1.07 1.44 2.41 1.62 Dividend Yield 0.0%Adj. EPS * 7.94 9.46 11.36 14.48 EPS (14) E 1.64 1.72 2.48 2.20 Index (NASD) 4113.68
Adj. P/E (X) 33.9 28.4 23.7 18.6 1M 3M 12M Price Target 50.00
EV/EBITDA (x) 63.4 48.2 33.3 23.0 Abs. Perf.(%) - - - Price Target End Date 30-Jun-14P/B (x) 5.7 4.9 4.5 3.8 Rel. Perf.(%) (7.5%) (31.7%) 55.6% Price Date 06 Jan 14
Y/E BPS (Rmb) 46.83 55.18 60.19 70.60
Source: Company, J. P. Morgan estimates, Bloomberg. * Note: Excluding share-based compensation expense.
Neutral
CTRP,CTRP US
Price: $44.43
Price Target: $50.00
China
Internet
Alex Yao AC
(852) 2800 8535
Bloomberg JPMA YAO <GO>
J.P. Morgan Securities (Asia Pacific) Limited
10
20
30
40
50
60
$
Jan-13 Apr-13 Jul-13 Oct-13 Jan-14
Price Performance
CTRP share price ($)
CCMP (rebased)
YTD 1m 3m 12mAbs -10.1% -6.2% -23.7% 87.5%Rel -9.4% -7.5% -32.8% 54.7%

216
Asia Pacific Equity Research09 January 2014
Alex Yao(852) 2800 [email protected]
J.P. Morgan vs consensus estimates
Our and consensus estimates for Ctrip are shown in the table below.
Table 19: J.P. Morgan estimates vs. consensus
J.P. Morgan estimates 4Q13E 2013E 2014E 2015E 2016ERmb MM except per share dataNet revenue 1,399 5,345 6,940 8,694 10,627
YoY Growth 27.0% 28.5% 29.8% 25.3% 22.2%QoQ Growth -9.2%Hotel reservation 592 2,164 2,881 3,714 4,516
YoY Growth 26.4% 27.1% 33.2% 28.9% 21.6%QoQ Growth -3.1%
Air-ticketing 545 2,128 2,625 3,174 3,838YoY Growth 22.0% 25.9% 23.3% 20.9% 20.9%QoQ Growth -9.7%
Packaged tour services 240 981 1,369 1,771 2,290YoY Growth 44.6% 42.3% 39.5% 29.3% 29.3%QoQ Growth -25.0%
Corporate travel services 73 262 322 362 377YoY Growth 27.4% 31.2% 22.9% 12.4% 4.1%QoQ Growth 2.0%
Others 34 138 169 211 268YoY Growth 19.6% 8.4% 22.9% 24.9% 26.7%QoQ Growth 0.0%
Non-GAAP operating profit 325 1,313 1,780 2,444 3,321YoY Growth 39.3% 20.8% 35.6% 37.3% 35.9%QoQ Growth -20.3%
Non-GAAP EPS (RMB) 2.27 9.46 11.36 14.48 18.31 YoY Growth 5.9% 19.1% 20.1% 27.5% 26.5%QoQ Growth -27.0%
Bloomberg consensusRevenue 1,390 5,351 6,855 8,668 10,979
Operating profit 287 1,143 1,580 2,157 3,156EBIT margin 20.7% 21.4% 23.0% 24.9% 28.7%Non-GAAP EPS 2.16 8.61 10.62 13.73 16.39
Source: Bloomberg, J.P. Morgan.
217
Asia Pacific Equity Research09 January 2014
Alex Yao(852) 2800 [email protected]
Investment Thesis, Valuation and Risks
Ctrip.com International, Ltd (Neutral; Price Target: $50.00)
Investment Thesis
We expect Ctrip to focus on: 1) market share maximization, and 2) mobile user acquisition in the next 12 months. We believe the current stock price has already factored in Ctrip’s front-loaded investment and back-loaded monetization/margin improvement over the next two years. Nonetheless, our sensitivity analysis around 2015E margin and P/E multiple suggests the stock is fairly valued.
Valuation
We maintain our Neutral rating on Ctrip and Jun-14 PT of US$50. Our PT is based on 2014E non-GAAP FD EPADS of US$1.86, an FY14-16E EPADS CAGR of 27% and a PEG of 1.0x. We leverage PEG as our primary valuation methodology, due to its ability to balance valuation multiples against growth outlook.
Our PT implies a 2014E P/E of 27x and a 2015E P/E of 21x.
As an additional check, we conduct a DCF valuation which delivers a comparable price of US$52. Key assumptions in our DCF valuation are: 1) a long-term risk-free rate of 4%, 2) an equity risk premium of 7% in the China market, 3) a beta of 1.2, 4) a discount rate of 13% and 5) a terminal growth rate of 4%.
Risks to Rating and Price Target
Upside risks to our views include:
A friendly competitive environment
Better-than-expected macro environment
Market share gain
Downside risks to our views include:
Stronger-than-expected investments
Faster-than-expected marketing expense expansion
Intense competition from peer companies
Market share loss
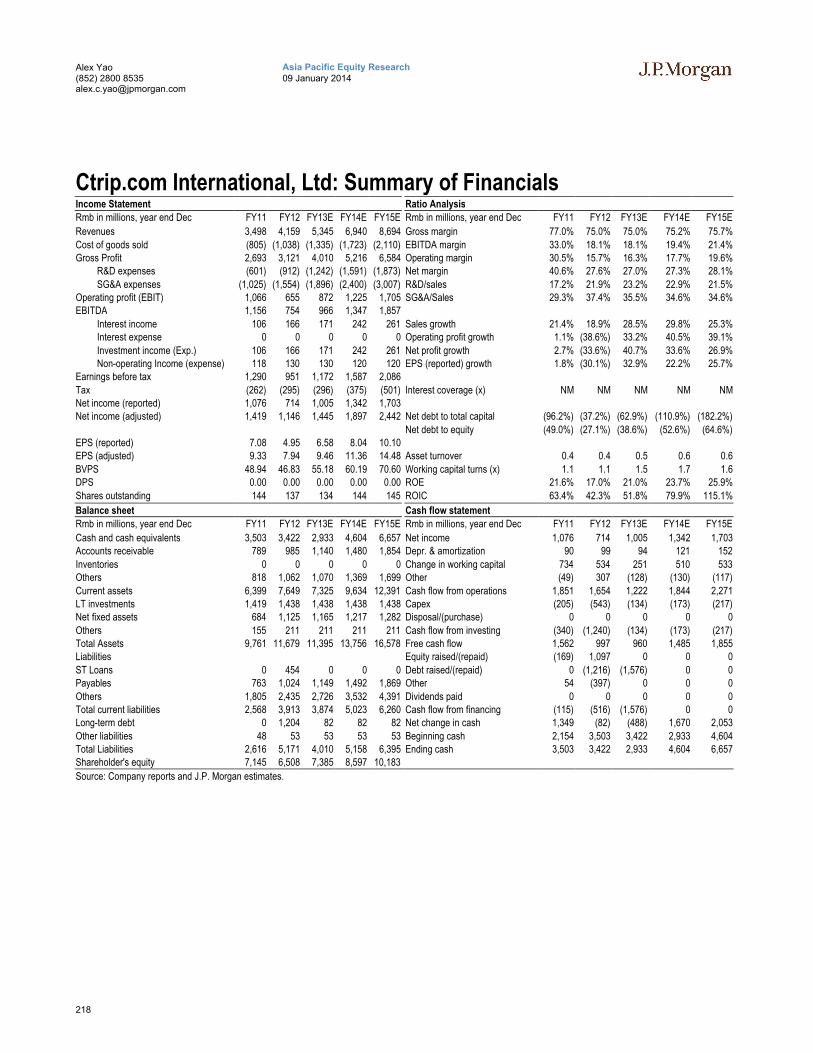
218
Asia Pacific Equity Research09 January 2014
Alex Yao(852) 2800 [email protected]
Ctrip.com International, Ltd: Summary of FinancialsIncome Statement Ratio Analysis
Rmb in millions, year end Dec FY11 FY12 FY13E FY14E FY15E Rmb in millions, year end Dec FY11 FY12 FY13E FY14E FY15E
Revenues 3,498 4,159 5,345 6,940 8,694 Gross margin 77.0% 75.0% 75.0% 75.2% 75.7%
Cost of goods sold (805) (1,038) (1,335) (1,723) (2,110) EBITDA margin 33.0% 18.1% 18.1% 19.4% 21.4%Gross Profit 2,693 3,121 4,010 5,216 6,584 Operating margin 30.5% 15.7% 16.3% 17.7% 19.6%
R&D expenses (601) (912) (1,242) (1,591) (1,873) Net margin 40.6% 27.6% 27.0% 27.3% 28.1%
SG&A expenses (1,025) (1,554) (1,896) (2,400) (3,007) R&D/sales 17.2% 21.9% 23.2% 22.9% 21.5%Operating profit (EBIT) 1,066 655 872 1,225 1,705 SG&A/Sales 29.3% 37.4% 35.5% 34.6% 34.6%EBITDA 1,156 754 966 1,347 1,857
Interest income 106 166 171 242 261 Sales growth 21.4% 18.9% 28.5% 29.8% 25.3%Interest expense 0 0 0 0 0 Operating profit growth 1.1% (38.6%) 33.2% 40.5% 39.1%
Investment income (Exp.) 106 166 171 242 261 Net profit growth 2.7% (33.6%) 40.7% 33.6% 26.9%Non-operating Income (expense) 118 130 130 120 120 EPS (reported) growth 1.8% (30.1%) 32.9% 22.2% 25.7%
Earnings before tax 1,290 951 1,172 1,587 2,086
Tax (262) (295) (296) (375) (501) Interest coverage (x) NM NM NM NM NMNet income (reported) 1,076 714 1,005 1,342 1,703Net income (adjusted) 1,419 1,146 1,445 1,897 2,442 Net debt to total capital (96.2%) (37.2%) (62.9%) (110.9%) (182.2%)
Net debt to equity (49.0%) (27.1%) (38.6%) (52.6%) (64.6%)EPS (reported) 7.08 4.95 6.58 8.04 10.10EPS (adjusted) 9.33 7.94 9.46 11.36 14.48 Asset turnover 0.4 0.4 0.5 0.6 0.6
BVPS 48.94 46.83 55.18 60.19 70.60 Working capital turns (x) 1.1 1.1 1.5 1.7 1.6DPS 0.00 0.00 0.00 0.00 0.00 ROE 21.6% 17.0% 21.0% 23.7% 25.9%
Shares outstanding 144 137 134 144 145 ROIC 63.4% 42.3% 51.8% 79.9% 115.1%
Balance sheet Cash flow statement
Rmb in millions, year end Dec FY11 FY12 FY13E FY14E FY15E Rmb in millions, year end Dec FY11 FY12 FY13E FY14E FY15E
Cash and cash equivalents 3,503 3,422 2,933 4,604 6,657 Net income 1,076 714 1,005 1,342 1,703Accounts receivable 789 985 1,140 1,480 1,854 Depr. & amortization 90 99 94 121 152
Inventories 0 0 0 0 0 Change in working capital 734 534 251 510 533Others 818 1,062 1,070 1,369 1,699 Other (49) 307 (128) (130) (117)
Current assets 6,399 7,649 7,325 9,634 12,391 Cash flow from operations 1,851 1,654 1,222 1,844 2,271LT investments 1,419 1,438 1,438 1,438 1,438 Capex (205) (543) (134) (173) (217)Net fixed assets 684 1,125 1,165 1,217 1,282 Disposal/(purchase) 0 0 0 0 0
Others 155 211 211 211 211 Cash flow from investing (340) (1,240) (134) (173) (217)Total Assets 9,761 11,679 11,395 13,756 16,578 Free cash flow 1,562 997 960 1,485 1,855Liabilities Equity raised/(repaid) (169) 1,097 0 0 0
ST Loans 0 454 0 0 0 Debt raised/(repaid) 0 (1,216) (1,576) 0 0Payables 763 1,024 1,149 1,492 1,869 Other 54 (397) 0 0 0
Others 1,805 2,435 2,726 3,532 4,391 Dividends paid 0 0 0 0 0Total current liabilities 2,568 3,913 3,874 5,023 6,260 Cash flow from financing (115) (516) (1,576) 0 0Long-term debt 0 1,204 82 82 82 Net change in cash 1,349 (82) (488) 1,670 2,053
Other liabilities 48 53 53 53 53 Beginning cash 2,154 3,503 3,422 2,933 4,604Total Liabilities 2,616 5,171 4,010 5,158 6,395 Ending cash 3,503 3,422 2,933 4,604 6,657Shareholder's equity 7,145 6,508 7,385 8,597 10,183
Source: Company reports and J.P. Morgan estimates.
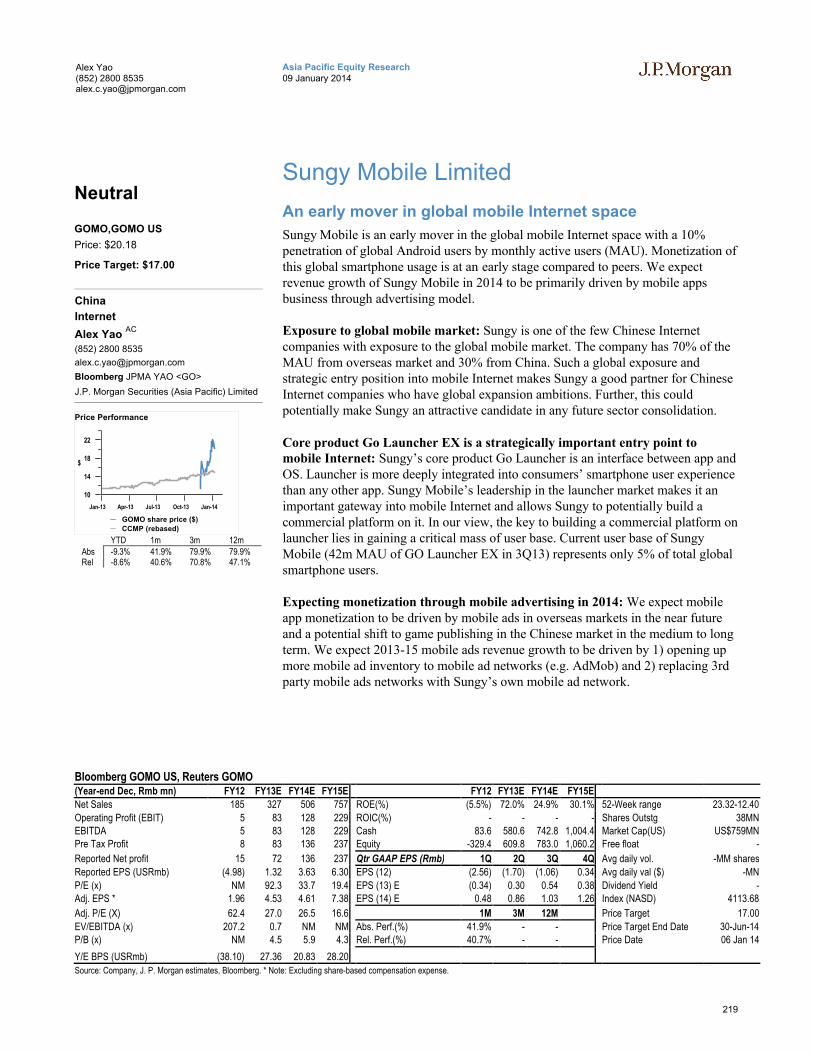
219
Asia Pacific Equity Research09 January 2014
Alex Yao(852) 2800 [email protected]
Sungy Mobile Limited
An early mover in global mobile Internet space
Sungy Mobile is an early mover in the global mobile Internet space with a 10% penetration of global Android users by monthly active users (MAU). Monetization of this global smartphone usage is at an early stage compared to peers. We expect revenue growth of Sungy Mobile in 2014 to be primarily driven by mobile apps business through advertising model.
Exposure to global mobile market: Sungy is one of the few Chinese Internet companies with exposure to the global mobile market. The company has 70% of the MAU from overseas market and 30% from China. Such a global exposure and strategic entry position into mobile Internet makes Sungy a good partner for Chinese Internet companies who have global expansion ambitions. Further, this could potentially make Sungy an attractive candidate in any future sector consolidation.
Core product Go Launcher EX is a strategically important entry point to mobile Internet: Sungy’s core product Go Launcher is an interface between app and OS. Launcher is more deeply integrated into consumers’ smartphone user experience than any other app. Sungy Mobile’s leadership in the launcher market makes it an important gateway into mobile Internet and allows Sungy to potentially build a commercial platform on it. In our view, the key to building a commercial platform on launcher lies in gaining a critical mass of user base. Current user base of Sungy Mobile (42m MAU of GO Launcher EX in 3Q13) represents only 5% of total global smartphone users.
Expecting monetization through mobile advertising in 2014: We expect mobile app monetization to be driven by mobile ads in overseas markets in the near future and a potential shift to game publishing in the Chinese market in the medium to long term. We expect 2013-15 mobile ads revenue growth to be driven by 1) opening up more mobile ad inventory to mobile ad networks (e.g. AdMob) and 2) replacing 3rd party mobile ads networks with Sungy’s own mobile ad network.
Bloomberg GOMO US, Reuters GOMO(Year-end Dec, Rmb mn) FY12 FY13E FY14E FY15E FY12 FY13E FY14E FY15E
Net Sales 185 327 506 757 ROE(%) (5.5%) 72.0% 24.9% 30.1% 52-Week range 23.32-12.40
Operating Profit (EBIT) 5 83 128 229 ROIC(%) - - - - Shares Outstg 38MNEBITDA 5 83 128 229 Cash 83.6 580.6 742.8 1,004.4 Market Cap(US) US$759MNPre Tax Profit 8 83 136 237 Equity -329.4 609.8 783.0 1,060.2 Free float -
Reported Net profit 15 72 136 237 Qtr GAAP EPS (Rmb) 1Q 2Q 3Q 4Q Avg daily vol. -MM shares
Reported EPS (USRmb) (4.98) 1.32 3.63 6.30 EPS (12) (2.56) (1.70) (1.06) 0.34 Avg daily val ($) -MN
P/E (x) NM 92.3 33.7 19.4 EPS (13) E (0.34) 0.30 0.54 0.38 Dividend Yield -Adj. EPS * 1.96 4.53 4.61 7.38 EPS (14) E 0.48 0.86 1.03 1.26 Index (NASD) 4113.68
Adj. P/E (X) 62.4 27.0 26.5 16.6 1M 3M 12M Price Target 17.00
EV/EBITDA (x) 207.2 0.7 NM NM Abs. Perf.(%) 41.9% - - Price Target End Date 30-Jun-14P/B (x) NM 4.5 5.9 4.3 Rel. Perf.(%) 40.7% - - Price Date 06 Jan 14
Y/E BPS (USRmb) (38.10) 27.36 20.83 28.20
Source: Company, J. P. Morgan estimates, Bloomberg. * Note: Excluding share-based compensation expense.
Neutral
GOMO,GOMO US
Price: $20.18
Price Target: $17.00
China
Internet
Alex Yao AC
(852) 2800 8535
Bloomberg JPMA YAO <GO>
J.P. Morgan Securities (Asia Pacific) Limited
10
14
18
22
$
Jan-13 Apr-13 Jul-13 Oct-13 Jan-14
Price Performance
GOMO share price ($)
CCMP (rebased)
YTD 1m 3m 12mAbs -9.3% 41.9% 79.9% 79.9%Rel -8.6% 40.6% 70.8% 47.1%
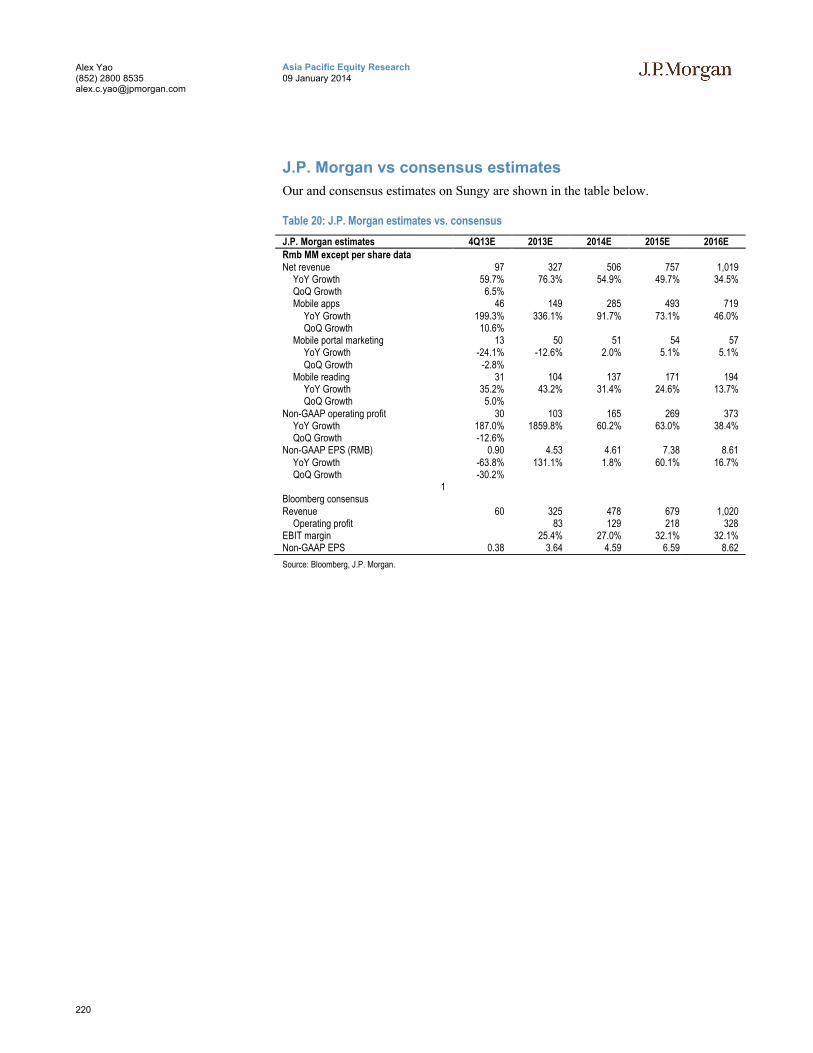
220
Asia Pacific Equity Research09 January 2014
Alex Yao(852) 2800 [email protected]
J.P. Morgan vs consensus estimates
Our and consensus estimates on Sungy are shown in the table below.
Table 20: J.P. Morgan estimates vs. consensus
J.P. Morgan estimates 4Q13E 2013E 2014E 2015E 2016ERmb MM except per share dataNet revenue 97 327 506 757 1,019
YoY Growth 59.7% 76.3% 54.9% 49.7% 34.5%QoQ Growth 6.5%Mobile apps 46 149 285 493 719
YoY Growth 199.3% 336.1% 91.7% 73.1% 46.0%QoQ Growth 10.6%
Mobile portal marketing 13 50 51 54 57YoY Growth -24.1% -12.6% 2.0% 5.1% 5.1%QoQ Growth -2.8%
Mobile reading 31 104 137 171 194YoY Growth 35.2% 43.2% 31.4% 24.6% 13.7%QoQ Growth 5.0%
Non-GAAP operating profit 30 103 165 269 373YoY Growth 187.0% 1859.8% 60.2% 63.0% 38.4%QoQ Growth -12.6%
Non-GAAP EPS (RMB) 0.90 4.53 4.61 7.38 8.61 YoY Growth -63.8% 131.1% 1.8% 60.1% 16.7%QoQ Growth -30.2%
1Bloomberg consensusRevenue 60 325 478 679 1,020
Operating profit 83 129 218 328EBIT margin 25.4% 27.0% 32.1% 32.1%Non-GAAP EPS 0.38 3.64 4.59 6.59 8.62
Source: Bloomberg, J.P. Morgan.
221
Asia Pacific Equity Research09 January 2014
Alex Yao(852) 2800 [email protected]
Investment Thesis, Valuation and Risks
Sungy Mobile Limited (Neutral; Price Target: $17.00)
Investment Thesis
Sungy Mobile’s key product GO Launcher EX took 64% of the third-party launcher market, but its penetration in the total Android user base is still very low (5% globally). A critical task for Sungy is to expand the addressable market and increase third-party launcher adoption. Monetization of Sungy’s global user base is at an early stage, given the substantial discount to peers on revenue per MAU. Despite a robust monetization improvement outlook (JPMe mobile app revenue CAGR 82% over 2013-15E), execution could entail risks due to a lack of proven precedent business in the global Internet market.
Valuation
We maintain our Neutral rating on Sungy and Jun-14 PT of US$17. Our PT is basedon 2014E non-GAAP FD EPADS of US$0.76, an FY14E-16E EPADS CAGR of 37% and a PEG of 0.6x. We leverage PEG as our primary valuation methodology, due to its ability to balance valuation multiples against growth outlook.
Our PT implies a 2014E/PE of 22x, which is at a 15% discount to the peer average 2014E P/E of 27x.
As an additional check, we also conduct s DCF valuation which delivers a comparable price of US$17.3. Key assumptions in our DCF valuation are: 1) a long-term risk free rate of 4%, 2) an equity risk premium of 7% in the China market, 3) a beta of 1.1, 4) a discount rate of 12%, and 5) a terminal growth rate of 3%.
Risks to Rating and Price Target
Upside risks to our views include:
Potential expansion into mobile game publishing in China
Global exposure offers cooperation opportunities with other China Internet companies
Downside risks to our views include:
The value of launcher is likely to diminish over time in western countries as Google improves functionality of original Android launcher
Difficulties in balancing user experience against monetization in apps
User penetration of Sungy Mobile is low in the US where mobile ads are well accepted
Uncertain outlook of mobile advertising market in China
Traditional businesses (mobile portal marketing and mobile reading) see modest growth or even stagnation
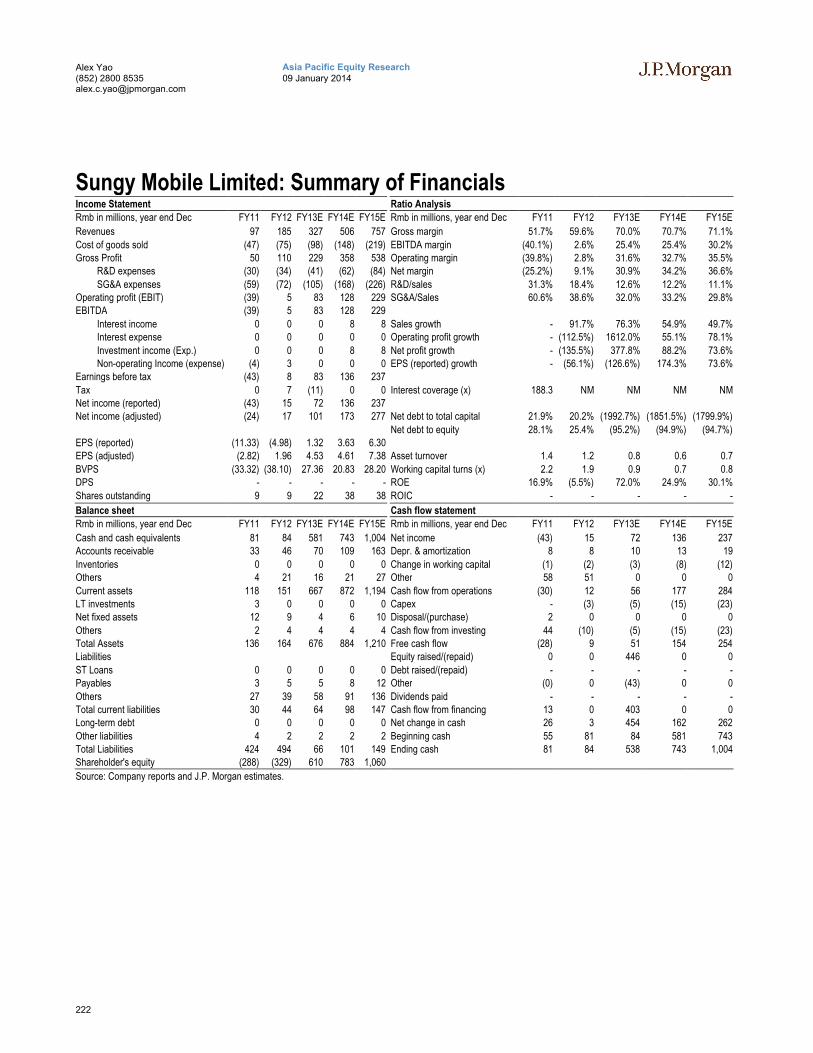
222
Asia Pacific Equity Research09 January 2014
Alex Yao(852) 2800 [email protected]
Sungy Mobile Limited: Summary of FinancialsIncome Statement Ratio Analysis
Rmb in millions, year end Dec FY11 FY12 FY13E FY14E FY15E Rmb in millions, year end Dec FY11 FY12 FY13E FY14E FY15E
Revenues 97 185 327 506 757 Gross margin 51.7% 59.6% 70.0% 70.7% 71.1%
Cost of goods sold (47) (75) (98) (148) (219) EBITDA margin (40.1%) 2.6% 25.4% 25.4% 30.2%Gross Profit 50 110 229 358 538 Operating margin (39.8%) 2.8% 31.6% 32.7% 35.5%
R&D expenses (30) (34) (41) (62) (84) Net margin (25.2%) 9.1% 30.9% 34.2% 36.6%
SG&A expenses (59) (72) (105) (168) (226) R&D/sales 31.3% 18.4% 12.6% 12.2% 11.1%Operating profit (EBIT) (39) 5 83 128 229 SG&A/Sales 60.6% 38.6% 32.0% 33.2% 29.8%EBITDA (39) 5 83 128 229
Interest income 0 0 0 8 8 Sales growth - 91.7% 76.3% 54.9% 49.7%Interest expense 0 0 0 0 0 Operating profit growth - (112.5%) 1612.0% 55.1% 78.1%
Investment income (Exp.) 0 0 0 8 8 Net profit growth - (135.5%) 377.8% 88.2% 73.6%Non-operating Income (expense) (4) 3 0 0 0 EPS (reported) growth - (56.1%) (126.6%) 174.3% 73.6%
Earnings before tax (43) 8 83 136 237
Tax 0 7 (11) 0 0 Interest coverage (x) 188.3 NM NM NM NMNet income (reported) (43) 15 72 136 237Net income (adjusted) (24) 17 101 173 277 Net debt to total capital 21.9% 20.2% (1992.7%) (1851.5%) (1799.9%)
Net debt to equity 28.1% 25.4% (95.2%) (94.9%) (94.7%)EPS (reported) (11.33) (4.98) 1.32 3.63 6.30EPS (adjusted) (2.82) 1.96 4.53 4.61 7.38 Asset turnover 1.4 1.2 0.8 0.6 0.7
BVPS (33.32) (38.10) 27.36 20.83 28.20 Working capital turns (x) 2.2 1.9 0.9 0.7 0.8DPS - - - - - ROE 16.9% (5.5%) 72.0% 24.9% 30.1%
Shares outstanding 9 9 22 38 38 ROIC - - - - -
Balance sheet Cash flow statement
Rmb in millions, year end Dec FY11 FY12 FY13E FY14E FY15E Rmb in millions, year end Dec FY11 FY12 FY13E FY14E FY15E
Cash and cash equivalents 81 84 581 743 1,004 Net income (43) 15 72 136 237Accounts receivable 33 46 70 109 163 Depr. & amortization 8 8 10 13 19
Inventories 0 0 0 0 0 Change in working capital (1) (2) (3) (8) (12)Others 4 21 16 21 27 Other 58 51 0 0 0
Current assets 118 151 667 872 1,194 Cash flow from operations (30) 12 56 177 284LT investments 3 0 0 0 0 Capex - (3) (5) (15) (23)Net fixed assets 12 9 4 6 10 Disposal/(purchase) 2 0 0 0 0
Others 2 4 4 4 4 Cash flow from investing 44 (10) (5) (15) (23)Total Assets 136 164 676 884 1,210 Free cash flow (28) 9 51 154 254Liabilities Equity raised/(repaid) 0 0 446 0 0
ST Loans 0 0 0 0 0 Debt raised/(repaid) - - - - -Payables 3 5 5 8 12 Other (0) 0 (43) 0 0
Others 27 39 58 91 136 Dividends paid - - - - -Total current liabilities 30 44 64 98 147 Cash flow from financing 13 0 403 0 0Long-term debt 0 0 0 0 0 Net change in cash 26 3 454 162 262
Other liabilities 4 2 2 2 2 Beginning cash 55 81 84 581 743Total Liabilities 424 494 66 101 149 Ending cash 81 84 538 743 1,004Shareholder's equity (288) (329) 610 783 1,060
Source: Company reports and J.P. Morgan estimates.
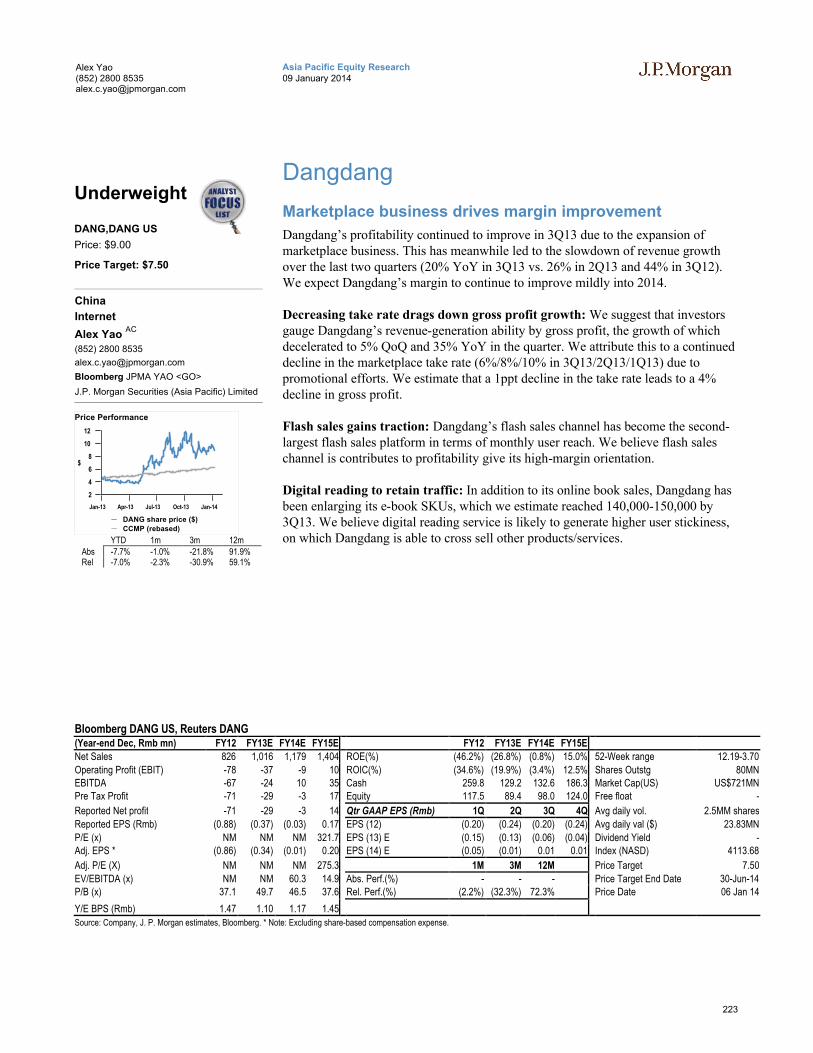
223
Asia Pacific Equity Research09 January 2014
Alex Yao(852) 2800 [email protected]
Dangdang
Marketplace business drives margin improvement
Dangdang’s profitability continued to improve in 3Q13 due to the expansion of marketplace business. This has meanwhile led to the slowdown of revenue growth over the last two quarters (20% YoY in 3Q13 vs. 26% in 2Q13 and 44% in 3Q12). We expect Dangdang’s margin to continue to improve mildly into 2014.
Decreasing take rate drags down gross profit growth: We suggest that investors gauge Dangdang’s revenue-generation ability by gross profit, the growth of which decelerated to 5% QoQ and 35% YoY in the quarter. We attribute this to a continued decline in the marketplace take rate (6%/8%/10% in 3Q13/2Q13/1Q13) due to promotional efforts. We estimate that a 1ppt decline in the take rate leads to a 4% decline in gross profit.
Flash sales gains traction: Dangdang’s flash sales channel has become the second-largest flash sales platform in terms of monthly user reach. We believe flash sales channel is contributes to profitability give its high-margin orientation.
Digital reading to retain traffic: In addition to its online book sales, Dangdang has been enlarging its e-book SKUs, which we estimate reached 140,000-150,000 by 3Q13. We believe digital reading service is likely to generate higher user stickiness, on which Dangdang is able to cross sell other products/services.
Bloomberg DANG US, Reuters DANG(Year-end Dec, Rmb mn) FY12 FY13E FY14E FY15E FY12 FY13E FY14E FY15E
Net Sales 826 1,016 1,179 1,404 ROE(%) (46.2%) (26.8%) (0.8%) 15.0% 52-Week range 12.19-3.70
Operating Profit (EBIT) -78 -37 -9 10 ROIC(%) (34.6%) (19.9%) (3.4%) 12.5% Shares Outstg 80MNEBITDA -67 -24 10 35 Cash 259.8 129.2 132.6 186.3 Market Cap(US) US$721MNPre Tax Profit -71 -29 -3 17 Equity 117.5 89.4 98.0 124.0 Free float -
Reported Net profit -71 -29 -3 14 Qtr GAAP EPS (Rmb) 1Q 2Q 3Q 4Q Avg daily vol. 2.5MM shares
Reported EPS (Rmb) (0.88) (0.37) (0.03) 0.17 EPS (12) (0.20) (0.24) (0.20) (0.24) Avg daily val ($) 23.83MN
P/E (x) NM NM NM 321.7 EPS (13) E (0.15) (0.13) (0.06) (0.04) Dividend Yield -Adj. EPS * (0.86) (0.34) (0.01) 0.20 EPS (14) E (0.05) (0.01) 0.01 0.01 Index (NASD) 4113.68
Adj. P/E (X) NM NM NM 275.3 1M 3M 12M Price Target 7.50
EV/EBITDA (x) NM NM 60.3 14.9 Abs. Perf.(%) - - - Price Target End Date 30-Jun-14P/B (x) 37.1 49.7 46.5 37.6 Rel. Perf.(%) (2.2%) (32.3%) 72.3% Price Date 06 Jan 14
Y/E BPS (Rmb) 1.47 1.10 1.17 1.45
Source: Company, J. P. Morgan estimates, Bloomberg. * Note: Excluding share-based compensation expense.
Underweight
DANG,DANG US
Price: $9.00
Price Target: $7.50
China
Internet
Alex Yao AC
(852) 2800 8535
Bloomberg JPMA YAO <GO>
J.P. Morgan Securities (Asia Pacific) Limited
2
4
6
8
10
12
$
Jan-13 Apr-13 Jul-13 Oct-13 Jan-14
Price Performance
DANG share price ($)
CCMP (rebased)
YTD 1m 3m 12mAbs -7.7% -1.0% -21.8% 91.9%Rel -7.0% -2.3% -30.9% 59.1%
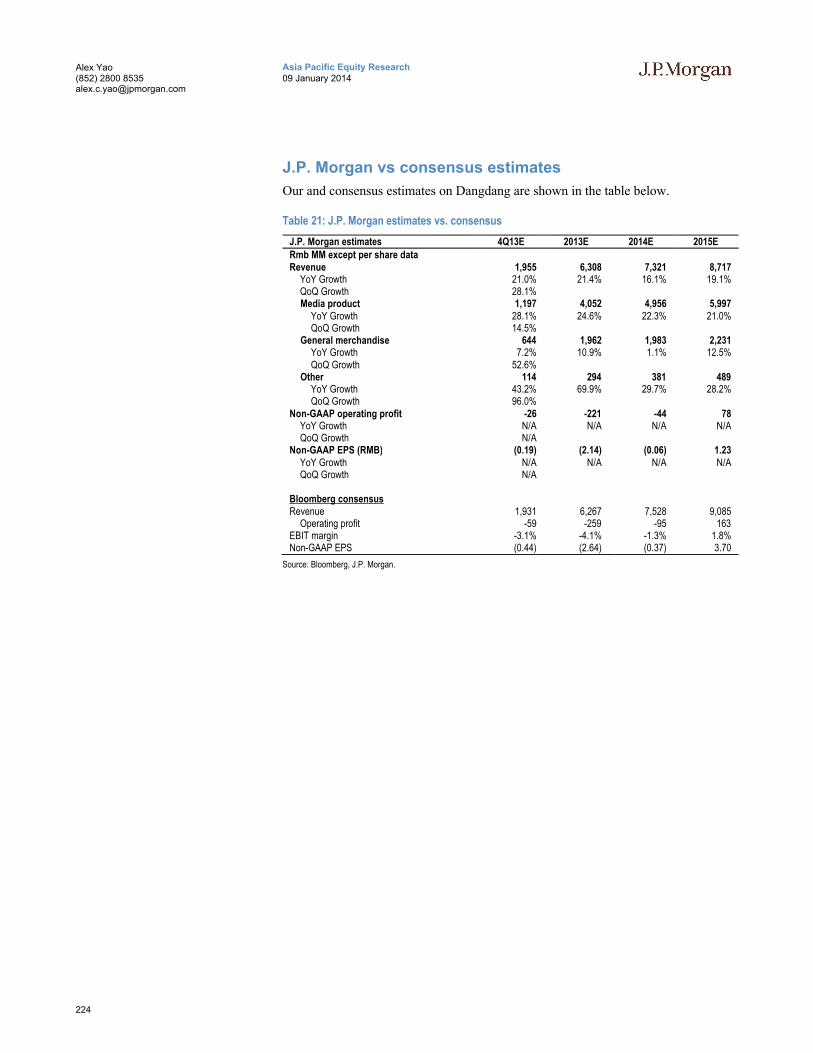
224
Asia Pacific Equity Research09 January 2014
Alex Yao(852) 2800 [email protected]
J.P. Morgan vs consensus estimates
Our and consensus estimates on Dangdang are shown in the table below.
Table 21: J.P. Morgan estimates vs. consensus
J.P. Morgan estimates 4Q13E 2013E 2014E 2015ERmb MM except per share dataRevenue 1,955 6,308 7,321 8,717
YoY Growth 21.0% 21.4% 16.1% 19.1%QoQ Growth 28.1%Media product 1,197 4,052 4,956 5,997
YoY Growth 28.1% 24.6% 22.3% 21.0%QoQ Growth 14.5%
General merchandise 644 1,962 1,983 2,231YoY Growth 7.2% 10.9% 1.1% 12.5%QoQ Growth 52.6%
Other 114 294 381 489YoY Growth 43.2% 69.9% 29.7% 28.2%QoQ Growth 96.0%
Non-GAAP operating profit -26 -221 -44 78YoY Growth N/A N/A N/A N/AQoQ Growth N/A
Non-GAAP EPS (RMB) (0.19) (2.14) (0.06) 1.23 YoY Growth N/A N/A N/A N/AQoQ Growth N/A
Bloomberg consensusRevenue 1,931 6,267 7,528 9,085
Operating profit -59 -259 -95 163EBIT margin -3.1% -4.1% -1.3% 1.8%Non-GAAP EPS (0.44) (2.64) (0.37) 3.70
Source: Bloomberg, J.P. Morgan.
225
Asia Pacific Equity Research09 January 2014
Alex Yao(852) 2800 [email protected]
Investment Thesis, Valuation and Risks
Dangdang (Underweight; Price Target: $7.50)
Investment Thesis
We expect Dangdang’s margin to continue to improve modestly as the company expands into new categories and marketplace e-commerce model. However, Dangdang may face intense competition from large e-commerce players as it grows its marketplace business. We believe margin improvement is already reflected in its share price.
Valuation
We stay Underweight on Dangdang with a Jun-14 PT of US$7.5.
We adopt DCF as our primary methodology to value Dangdang. Our 10-year DCF is based on a discount rate of 17% and a terminal growth rate of 2%. Key assumptions include 1) a long-term risk free rate of 4%, 2) an equity risk premium of 7% in the China market, and 3) a beta of 1.8.
Risks to Rating and Price Target
Upside risks to our views include:
Stronger-than-expected margin improvement
Successful expansion into new categories
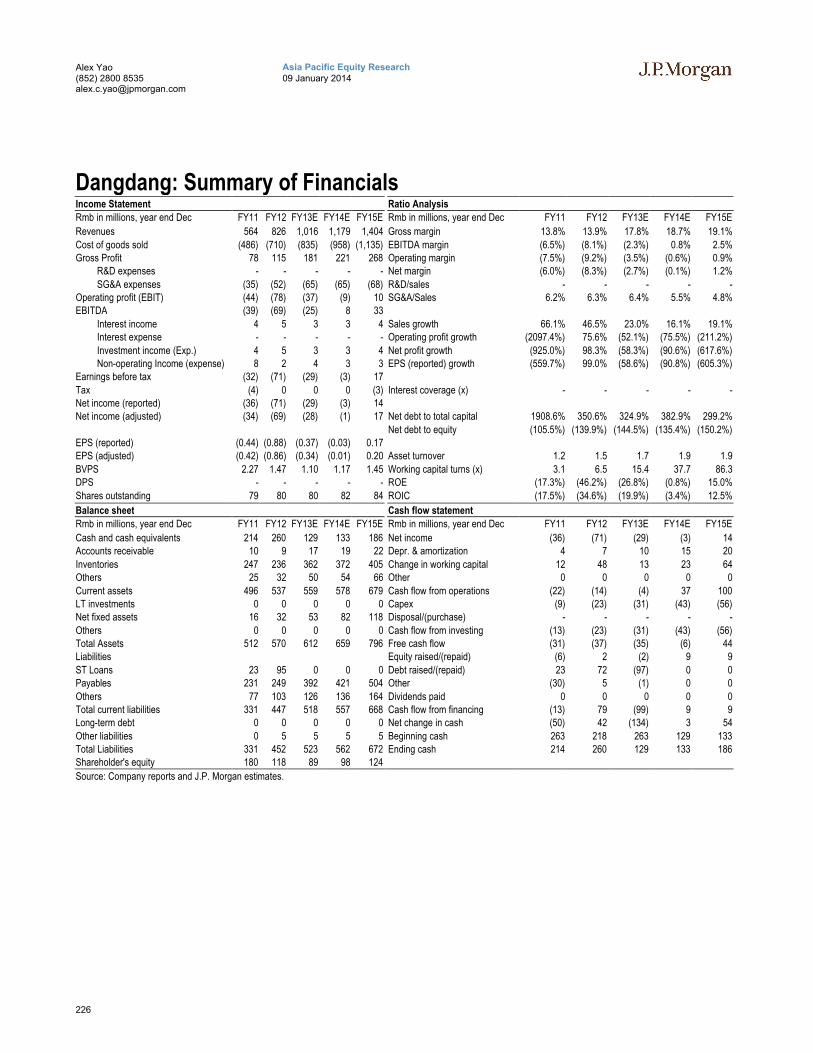
226
Asia Pacific Equity Research09 January 2014
Alex Yao(852) 2800 [email protected]
Dangdang: Summary of FinancialsIncome Statement Ratio Analysis
Rmb in millions, year end Dec FY11 FY12 FY13E FY14E FY15E Rmb in millions, year end Dec FY11 FY12 FY13E FY14E FY15E
Revenues 564 826 1,016 1,179 1,404 Gross margin 13.8% 13.9% 17.8% 18.7% 19.1%
Cost of goods sold (486) (710) (835) (958) (1,135) EBITDA margin (6.5%) (8.1%) (2.3%) 0.8% 2.5%Gross Profit 78 115 181 221 268 Operating margin (7.5%) (9.2%) (3.5%) (0.6%) 0.9%
R&D expenses - - - - - Net margin (6.0%) (8.3%) (2.7%) (0.1%) 1.2%
SG&A expenses (35) (52) (65) (65) (68) R&D/sales - - - - -Operating profit (EBIT) (44) (78) (37) (9) 10 SG&A/Sales 6.2% 6.3% 6.4% 5.5% 4.8%EBITDA (39) (69) (25) 8 33
Interest income 4 5 3 3 4 Sales growth 66.1% 46.5% 23.0% 16.1% 19.1%Interest expense - - - - - Operating profit growth (2097.4%) 75.6% (52.1%) (75.5%) (211.2%)
Investment income (Exp.) 4 5 3 3 4 Net profit growth (925.0%) 98.3% (58.3%) (90.6%) (617.6%)Non-operating Income (expense) 8 2 4 3 3 EPS (reported) growth (559.7%) 99.0% (58.6%) (90.8%) (605.3%)
Earnings before tax (32) (71) (29) (3) 17
Tax (4) 0 0 0 (3) Interest coverage (x) - - - - -Net income (reported) (36) (71) (29) (3) 14Net income (adjusted) (34) (69) (28) (1) 17 Net debt to total capital 1908.6% 350.6% 324.9% 382.9% 299.2%
Net debt to equity (105.5%) (139.9%) (144.5%) (135.4%) (150.2%)EPS (reported) (0.44) (0.88) (0.37) (0.03) 0.17EPS (adjusted) (0.42) (0.86) (0.34) (0.01) 0.20 Asset turnover 1.2 1.5 1.7 1.9 1.9
BVPS 2.27 1.47 1.10 1.17 1.45 Working capital turns (x) 3.1 6.5 15.4 37.7 86.3DPS - - - - - ROE (17.3%) (46.2%) (26.8%) (0.8%) 15.0%
Shares outstanding 79 80 80 82 84 ROIC (17.5%) (34.6%) (19.9%) (3.4%) 12.5%
Balance sheet Cash flow statement
Rmb in millions, year end Dec FY11 FY12 FY13E FY14E FY15E Rmb in millions, year end Dec FY11 FY12 FY13E FY14E FY15E
Cash and cash equivalents 214 260 129 133 186 Net income (36) (71) (29) (3) 14Accounts receivable 10 9 17 19 22 Depr. & amortization 4 7 10 15 20
Inventories 247 236 362 372 405 Change in working capital 12 48 13 23 64Others 25 32 50 54 66 Other 0 0 0 0 0
Current assets 496 537 559 578 679 Cash flow from operations (22) (14) (4) 37 100LT investments 0 0 0 0 0 Capex (9) (23) (31) (43) (56)Net fixed assets 16 32 53 82 118 Disposal/(purchase) - - - - -
Others 0 0 0 0 0 Cash flow from investing (13) (23) (31) (43) (56)Total Assets 512 570 612 659 796 Free cash flow (31) (37) (35) (6) 44Liabilities Equity raised/(repaid) (6) 2 (2) 9 9
ST Loans 23 95 0 0 0 Debt raised/(repaid) 23 72 (97) 0 0Payables 231 249 392 421 504 Other (30) 5 (1) 0 0
Others 77 103 126 136 164 Dividends paid 0 0 0 0 0Total current liabilities 331 447 518 557 668 Cash flow from financing (13) 79 (99) 9 9Long-term debt 0 0 0 0 0 Net change in cash (50) 42 (134) 3 54
Other liabilities 0 5 5 5 5 Beginning cash 263 218 263 129 133Total Liabilities 331 452 523 562 672 Ending cash 214 260 129 133 186Shareholder's equity 180 118 89 98 124
Source: Company reports and J.P. Morgan estimates.
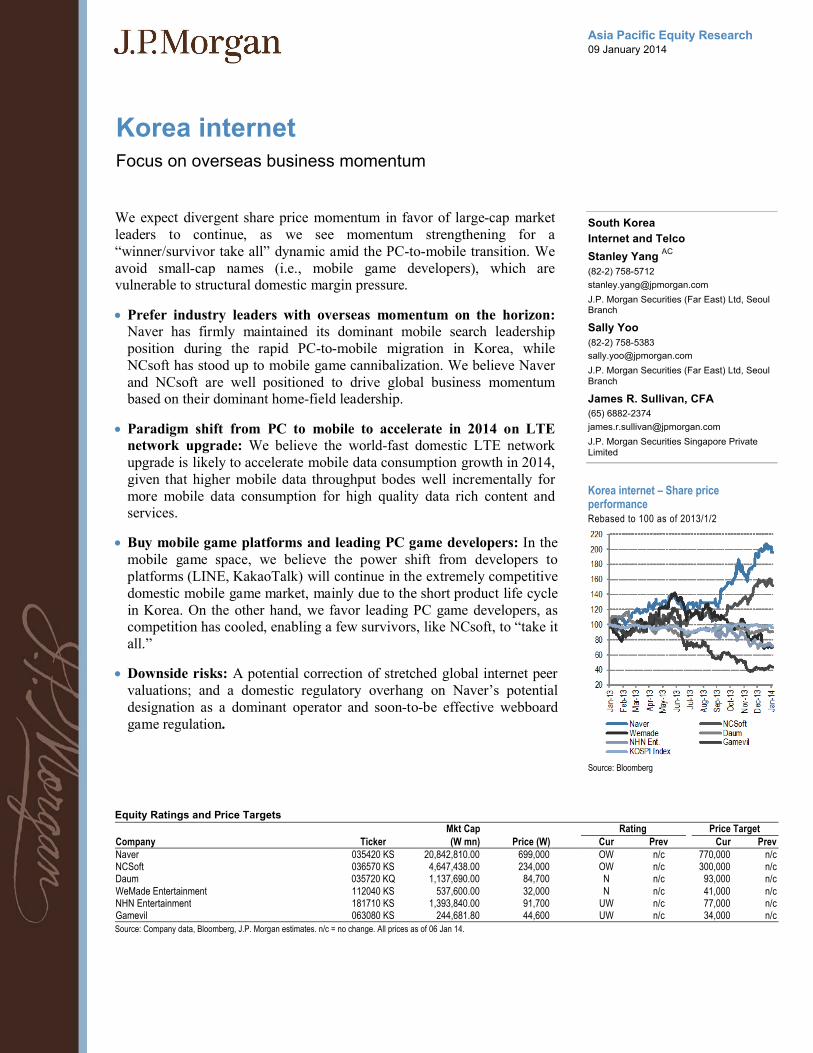
Asia Pacific Equity Research09 January 2014
Equity Ratings and Price Targets
Mkt Cap Rating Price TargetCompany Ticker (W mn) Price (W) Cur Prev Cur PrevNaver 035420 KS 20,842,810.00 699,000 OW n/c 770,000 n/cNCSoft 036570 KS 4,647,438.00 234,000 OW n/c 300,000 n/cDaum 035720 KQ 1,137,690.00 84,700 N n/c 93,000 n/cWeMade Entertainment 112040 KS 537,600.00 32,000 N n/c 41,000 n/cNHN Entertainment 181710 KS 1,393,840.00 91,700 UW n/c 77,000 n/cGamevil 063080 KS 244,681.80 44,600 UW n/c 34,000 n/cSource: Company data, Bloomberg, J.P. Morgan estimates. n/c = no change. All prices as of 06 Jan 14.
Korea internetFocus on overseas business momentum
South Korea
Internet and Telco
Stanley Yang AC
(82-2) 758-5712
J.P. Morgan Securities (Far East) Ltd, Seoul Branch
Sally Yoo
(82-2) 758-5383
J.P. Morgan Securities (Far East) Ltd, Seoul Branch
James R. Sullivan, CFA
(65) 6882-2374
J.P. Morgan Securities Singapore Private Limited
We expect divergent share price momentum in favor of large-cap market leaders to continue, as we see momentum strengthening for a “winner/survivor take all” dynamic amid the PC-to-mobile transition. We avoid small-cap names (i.e., mobile game developers), which are vulnerable to structural domestic margin pressure.
Prefer industry leaders with overseas momentum on the horizon:Naver has firmly maintained its dominant mobile search leadership position during the rapid PC-to-mobile migration in Korea, while NCsoft has stood up to mobile game cannibalization. We believe Naver and NCsoft are well positioned to drive global business momentum based on their dominant home-field leadership.
Paradigm shift from PC to mobile to accelerate in 2014 on LTE network upgrade: We believe the world-fast domestic LTE network upgrade is likely to accelerate mobile data consumption growth in 2014,given that higher mobile data throughput bodes well incrementally for more mobile data consumption for high quality data rich content and services.
Buy mobile game platforms and leading PC game developers: In the mobile game space, we believe the power shift from developers to platforms (LINE, KakaoTalk) will continue in the extremely competitive domestic mobile game market, mainly due to the short product life cycle in Korea. On the other hand, we favor leading PC game developers, as competition has cooled, enabling a few survivors, like NCsoft, to “take it all.”
Downside risks: A potential correction of stretched global internet peer valuations; and a domestic regulatory overhang on Naver’s potential designation as a dominant operator and soon-to-be effective webboard game regulation.
Korea internet – Share price performanceRebased to 100 as of 2013/1/2
Source: Bloomberg
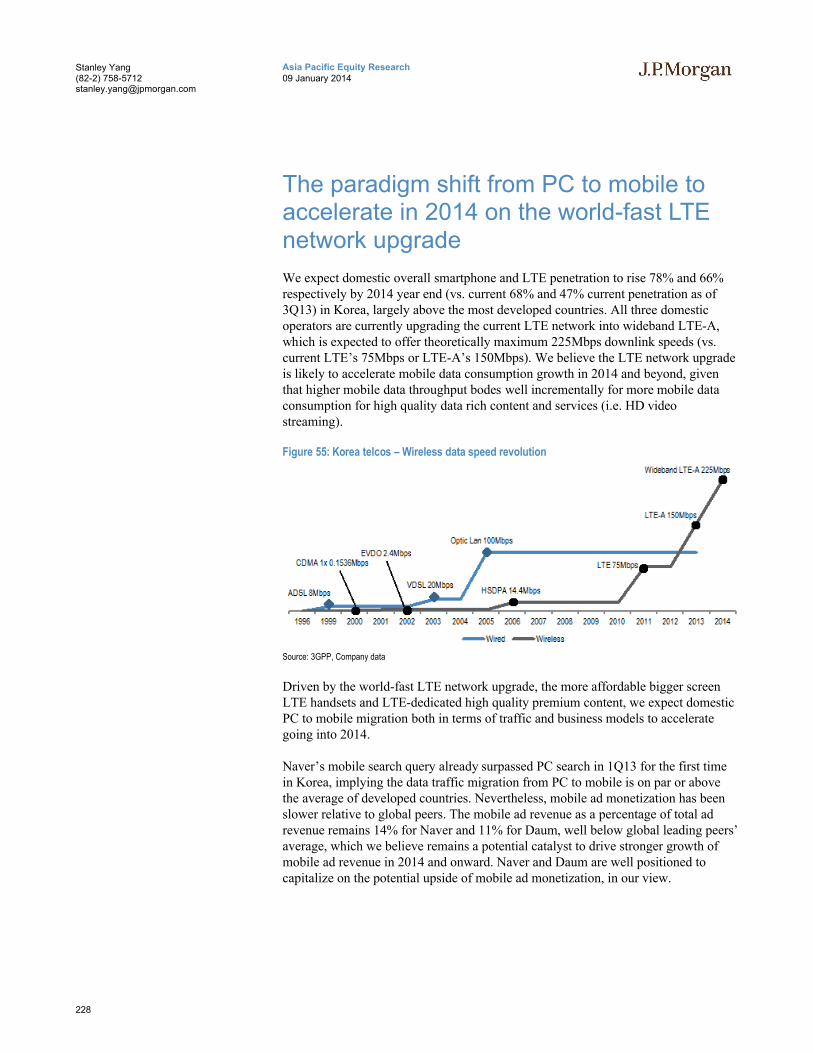
228
Asia Pacific Equity Research09 January 2014
Stanley Yang(82-2) [email protected]
The paradigm shift from PC to mobile to accelerate in 2014 on the world-fast LTE network upgrade
We expect domestic overall smartphone and LTE penetration to rise 78% and 66% respectively by 2014 year end (vs. current 68% and 47% current penetration as of 3Q13) in Korea, largely above the most developed countries. All three domestic operators are currently upgrading the current LTE network into wideband LTE-A, which is expected to offer theoretically maximum 225Mbps downlink speeds (vs. current LTE’s 75Mbps or LTE-A’s 150Mbps). We believe the LTE network upgrade is likely to accelerate mobile data consumption growth in 2014 and beyond, given that higher mobile data throughput bodes well incrementally for more mobile data consumption for high quality data rich content and services (i.e. HD video streaming).
Figure 55: Korea telcos – Wireless data speed revolution
Source: 3GPP, Company data
Driven by the world-fast LTE network upgrade, the more affordable bigger screen LTE handsets and LTE-dedicated high quality premium content, we expect domestic PC to mobile migration both in terms of traffic and business models to accelerate going into 2014.
Naver’s mobile search query already surpassed PC search in 1Q13 for the first time in Korea, implying the data traffic migration from PC to mobile is on par or above the average of developed countries. Nevertheless, mobile ad monetization has been slower relative to global peers. The mobile ad revenue as a percentage of total ad revenue remains 14% for Naver and 11% for Daum, well below global leading peers’average, which we believe remains a potential catalyst to drive stronger growth of mobile ad revenue in 2014 and onward. Naver and Daum are well positioned to capitalize on the potential upside of mobile ad monetization, in our view.
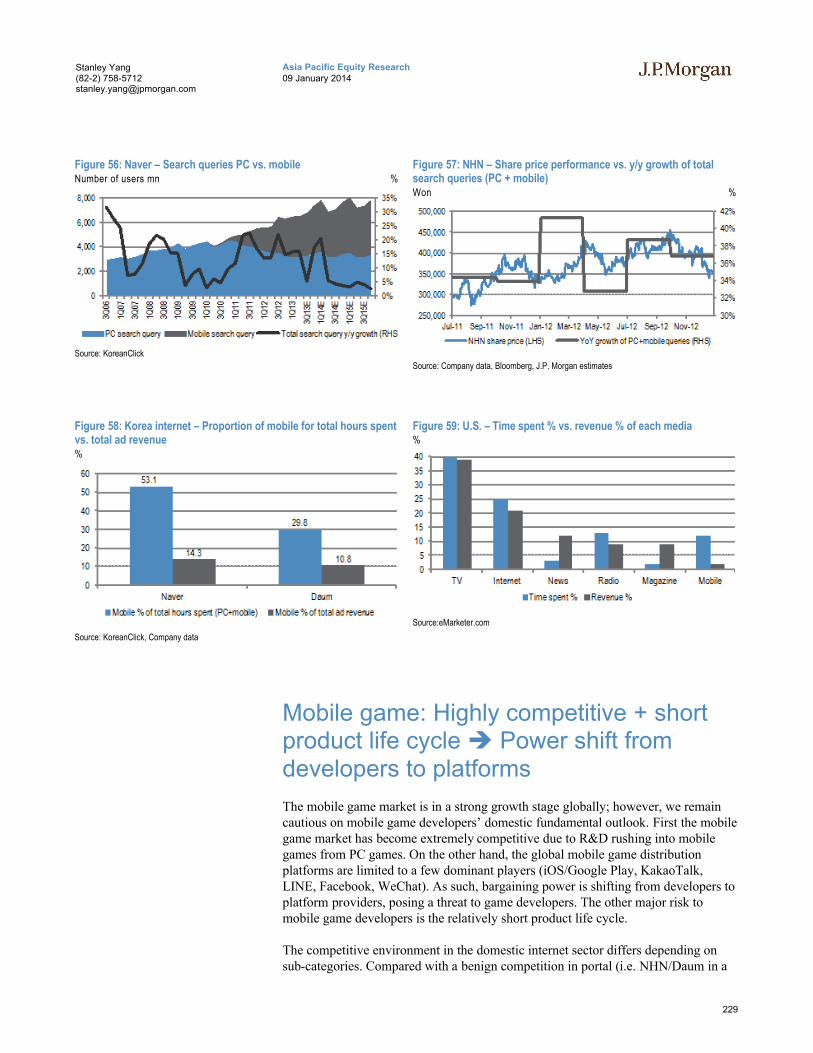
229
Asia Pacific Equity Research09 January 2014
Stanley Yang(82-2) [email protected]
Figure 56: Naver – Search queries PC vs. mobileNumber of users mn %
Source: KoreanClick
Figure 57: NHN – Share price performance vs. y/y growth of total search queries (PC + mobile)Won %
Source: Company data, Bloomberg, J.P. Morgan estimates
Figure 58: Korea internet – Proportion of mobile for total hours spent vs. total ad revenue%
Source: KoreanClick, Company data
Figure 59: U.S. – Time spent % vs. revenue % of each media %
Source:eMarketer.com
Mobile game: Highly competitive + short product life cycle Power shift from developers to platforms
The mobile game market is in a strong growth stage globally; however, we remain cautious on mobile game developers’ domestic fundamental outlook. First the mobile game market has become extremely competitive due to R&D rushing into mobile games from PC games. On the other hand, the global mobile game distribution platforms are limited to a few dominant players (iOS/Google Play, KakaoTalk, LINE, Facebook, WeChat). As such, bargaining power is shifting from developers to platform providers, posing a threat to game developers. The other major risk to mobile game developers is the relatively short product life cycle.
The competitive environment in the domestic internet sector differs depending on sub-categories. Compared with a benign competition in portal (i.e. NHN/Daum in a
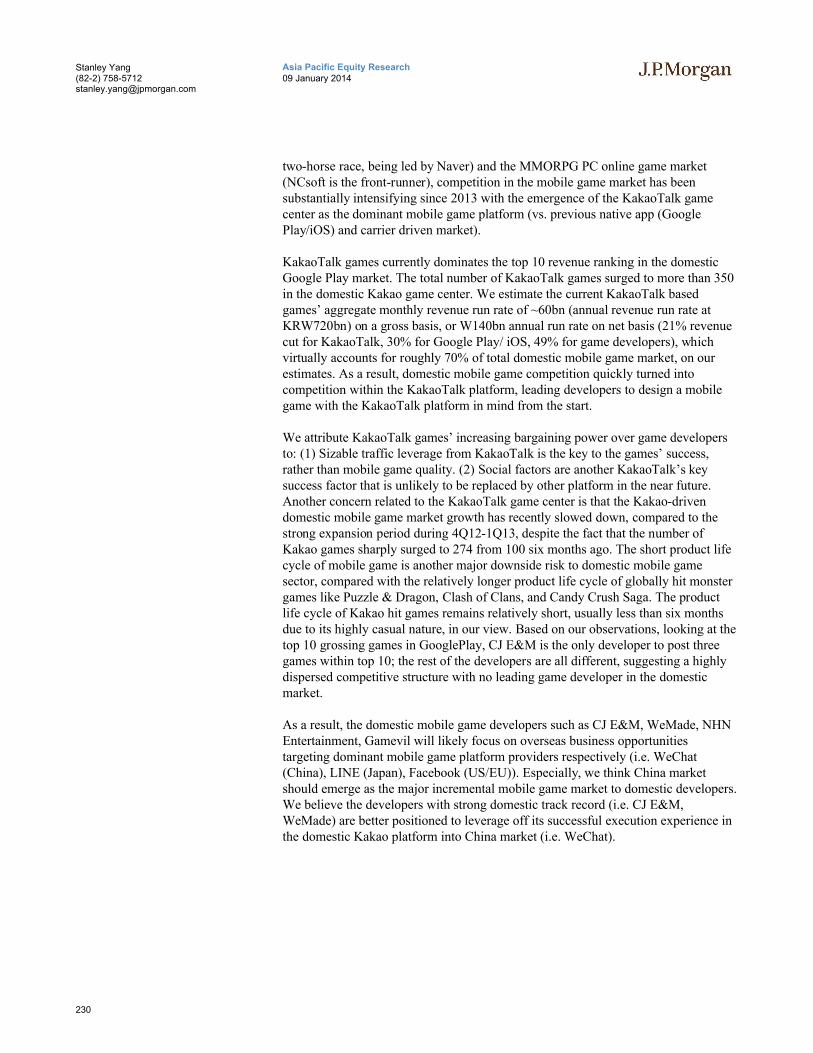
230
Asia Pacific Equity Research09 January 2014
Stanley Yang(82-2) [email protected]
two-horse race, being led by Naver) and the MMORPG PC online game market (NCsoft is the front-runner), competition in the mobile game market has been substantially intensifying since 2013 with the emergence of the KakaoTalk game center as the dominant mobile game platform (vs. previous native app (Google Play/iOS) and carrier driven market).
KakaoTalk games currently dominates the top 10 revenue ranking in the domestic Google Play market. The total number of KakaoTalk games surged to more than 350 in the domestic Kakao game center. We estimate the current KakaoTalk based games’ aggregate monthly revenue run rate of ~60bn (annual revenue run rate at KRW720bn) on a gross basis, or W140bn annual run rate on net basis (21% revenue cut for KakaoTalk, 30% for Google Play/ iOS, 49% for game developers), which virtually accounts for roughly 70% of total domestic mobile game market, on our estimates. As a result, domestic mobile game competition quickly turned into competition within the KakaoTalk platform, leading developers to design a mobile game with the KakaoTalk platform in mind from the start.
We attribute KakaoTalk games’ increasing bargaining power over game developersto: (1) Sizable traffic leverage from KakaoTalk is the key to the games’ success, rather than mobile game quality. (2) Social factors are another KakaoTalk’s key success factor that is unlikely to be replaced by other platform in the near future. Another concern related to the KakaoTalk game center is that the Kakao-driven domestic mobile game market growth has recently slowed down, compared to the strong expansion period during 4Q12-1Q13, despite the fact that the number ofKakao games sharply surged to 274 from 100 six months ago. The short product life cycle of mobile game is another major downside risk to domestic mobile game sector, compared with the relatively longer product life cycle of globally hit monster games like Puzzle & Dragon, Clash of Clans, and Candy Crush Saga. The product life cycle of Kakao hit games remains relatively short, usually less than six months due to its highly casual nature, in our view. Based on our observations, looking at the top 10 grossing games in GooglePlay, CJ E&M is the only developer to post threegames within top 10; the rest of the developers are all different, suggesting a highly dispersed competitive structure with no leading game developer in the domestic market.
As a result, the domestic mobile game developers such as CJ E&M, WeMade, NHN Entertainment, Gamevil will likely focus on overseas business opportunities targeting dominant mobile game platform providers respectively (i.e. WeChat (China), LINE (Japan), Facebook (US/EU)). Especially, we think China market should emerge as the major incremental mobile game market to domestic developers. We believe the developers with strong domestic track record (i.e. CJ E&M, WeMade) are better positioned to leverage off its successful execution experience in the domestic Kakao platform into China market (i.e. WeChat).
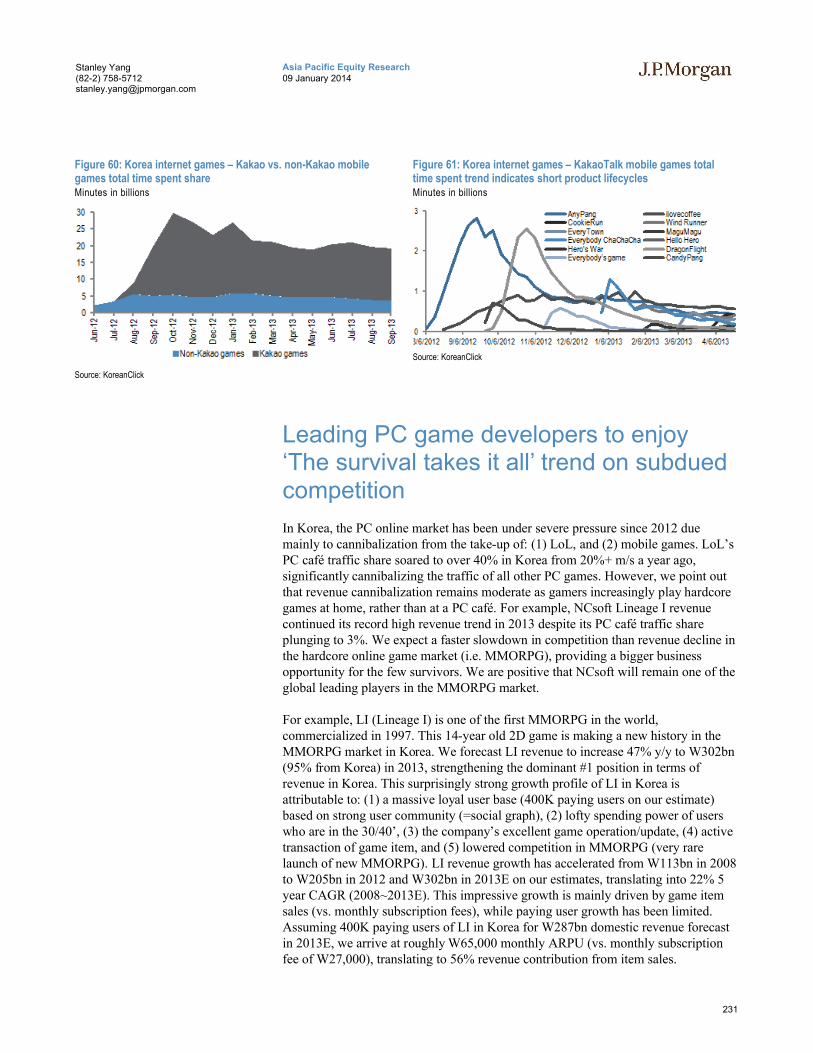
231
Asia Pacific Equity Research09 January 2014
Stanley Yang(82-2) [email protected]
Figure 60: Korea internet games – Kakao vs. non-Kakao mobile games total time spent shareMinutes in billions
Source: KoreanClick
Figure 61: Korea internet games – KakaoTalk mobile games total time spent trend indicates short product lifecyclesMinutes in billions
Source: KoreanClick
Leading PC game developers to enjoy ‘The survival takes it all’ trend on subdued competition
In Korea, the PC online market has been under severe pressure since 2012 duemainly to cannibalization from the take-up of: (1) LoL, and (2) mobile games. LoL’s PC café traffic share soared to over 40% in Korea from 20%+ m/s a year ago, significantly cannibalizing the traffic of all other PC games. However, we point out that revenue cannibalization remains moderate as gamers increasingly play hardcore games at home, rather than at a PC café. For example, NCsoft Lineage I revenue continued its record high revenue trend in 2013 despite its PC café traffic share plunging to 3%. We expect a faster slowdown in competition than revenue decline in the hardcore online game market (i.e. MMORPG), providing a bigger business opportunity for the few survivors. We are positive that NCsoft will remain one of the global leading players in the MMORPG market.
For example, LI (Lineage I) is one of the first MMORPG in the world, commercialized in 1997. This 14-year old 2D game is making a new history in the MMORPG market in Korea. We forecast LI revenue to increase 47% y/y to W302bn (95% from Korea) in 2013, strengthening the dominant #1 position in terms of revenue in Korea. This surprisingly strong growth profile of LI in Korea is attributable to: (1) a massive loyal user base (400K paying users on our estimate) based on strong user community (=social graph), (2) lofty spending power of users who are in the 30/40’, (3) the company’s excellent game operation/update, (4) active transaction of game item, and (5) lowered competition in MMORPG (very rare launch of new MMORPG). LI revenue growth has accelerated from W113bn in 2008 to W205bn in 2012 and W302bn in 2013E on our estimates, translating into 22% 5 year CAGR (2008~2013E). This impressive growth is mainly driven by game item sales (vs. monthly subscription fees), while paying user growth has been limited. Assuming 400K paying users of LI in Korea for W287bn domestic revenue forecast in 2013E, we arrive at roughly W65,000 monthly ARPU (vs. monthly subscription fee of W27,000), translating to 56% revenue contribution from item sales.
232
Asia Pacific Equity Research09 January 2014
Stanley Yang(82-2) [email protected]
We expect investors to give increasing franchise value to NCsoft’s LI on the following reasons: (1) Much longer-than-expected life cycle of LI, (2) the increasing counter-cyclical merit, (3) lucrative margin (our estimate OPM of LI is over 60%), (4) probably most importantly, the implication that a few survivors can take an even bigger piece of the market when the market declines. We attribute the latest growth of LI to lowered competition in MMORPG/PC online game market in Korea and increased entry barriers for new player given that MMORPG users do not seem to pursue new product, due to their increased satisfaction to LI in Korea. We also believe the increasing preference for PC games as gamers are aging in Korea.
Another important implication is that blockbuster game will unlikely be cannibalized from the mega change of industry. As a matter of fact, the dramatic growth of mobile games and the emergence of dominant PC online game, LoL, significantly cannibalized PC online games in Korea. However, LI was exceptional. The R&D shift from PC online game to mobile online game will continue, given the declining PC online game market in Korea, which will strengthen LI's position in Korea, in ourview. The growing value of LI should enhance the investment merit of NCSoft, in our view.
We also point out Korea PC online game developers remain as one of the major contents providers in Chinese PC online game market. We expect NCsoft’s Blade & Soul (published by Tencent) to emerge as another major PC game title in China in 2014 in addition to existing Korea made games including Cross Fire and DnF. The competitive edge of Korean PC games relative to local games in China will likely be maintained in a foreseeable future.
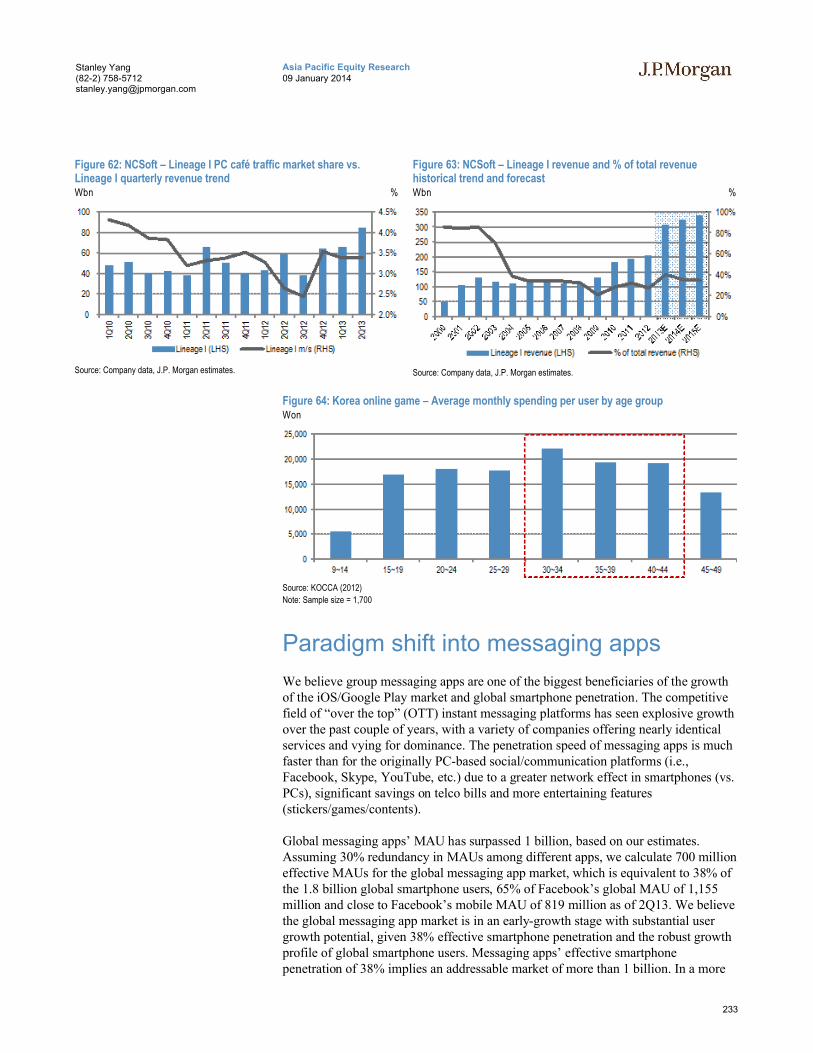
233
Asia Pacific Equity Research09 January 2014
Stanley Yang(82-2) [email protected]
Figure 62: NCSoft – Lineage I PC café traffic market share vs. Lineage I quarterly revenue trendWbn %
Source: Company data, J.P. Morgan estimates.
Figure 63: NCSoft – Lineage I revenue and % of total revenue historical trend and forecastWbn %
Source: Company data, J.P. Morgan estimates.
Figure 64: Korea online game – Average monthly spending per user by age groupWon
Source: KOCCA (2012)
Note: Sample size = 1,700
Paradigm shift into messaging apps
We believe group messaging apps are one of the biggest beneficiaries of the growth of the iOS/Google Play market and global smartphone penetration. The competitive field of “over the top” (OTT) instant messaging platforms has seen explosive growth over the past couple of years, with a variety of companies offering nearly identical services and vying for dominance. The penetration speed of messaging apps is much faster than for the originally PC-based social/communication platforms (i.e., Facebook, Skype, YouTube, etc.) due to a greater network effect in smartphones (vs. PCs), significant savings on telco bills and more entertaining features (stickers/games/contents).
Global messaging apps’ MAU has surpassed 1 billion, based on our estimates. Assuming 30% redundancy in MAUs among different apps, we calculate 700 million effective MAUs for the global messaging app market, which is equivalent to 38% of the 1.8 billion global smartphone users, 65% of Facebook’s global MAU of 1,155million and close to Facebook’s mobile MAU of 819 million as of 2Q13. We believe the global messaging app market is in an early-growth stage with substantial user growth potential, given 38% effective smartphone penetration and the robust growth profile of global smartphone users. Messaging apps’ effective smartphone penetration of 38% implies an addressable market of more than 1 billion. In a more
234
Asia Pacific Equity Research09 January 2014
Stanley Yang(82-2) [email protected]
optimistic scenario, the accessible user base could double (to 2 billion) if smartphone users actively use two different messaging apps for different sets of social groups in a more mature stage of penetration.
Messaging apps originated to attain free communication (group messaging/voice calls), replacing the traditional SMS/VoIP market and posing a formidable threat to telcos and Skype types of VoIP providers, in our view. However, the service scope and business models of messaging apps are rapidly evolving into more powerful platforms that integrate communication, SNS, media, entertainment and e-commerce, which could eventually threaten incumbent SNS (e.g., Facebook, Instagram) and wireless portals (Google/Yahoo!). In fact, global messaging appshave already introduced or will soon introduce a variety of new services and business models, such as photo/video sharing, video calls, sponsored ads, local ads, gifts, digital contents distribution, payment services, etc. LINE currently provides a news section, similar to those of portal companies like Yahoo! Japan and Naver Korea. LINE recently announced that it would soon introduce LINE Music (a music distribution platform) and LINE Mall (content distribution), which would create another sub-ecosystem (iOS/Google Play > LINE Music/Mall/Game > contentproviders).
From a user perspective, messaging apps are becoming more like closed SNS, as “staying in touch” social platforms that include sharing photos/videos, the trademark function of Facebook-type SNS. LINE, for example, is servicing Timeline (a Facebook-style timeline), which recorded 64 million MAU as of August (53% of its total MAU). KakaoTalk also provides Facebook-style SNS Kakao Story, which is as popular as Facebook in Korea.
In this context, messaging apps would not only cannibalize “time share” but also emerge as direct competitors of existing SNS/wireless portals, in our view. To countermeasure, Facebook and Google have recently put more work into their mobile applications for group messaging. Facebook has released a standalone app called Facebook Messenger with a novel interface for keeping active conversations on the screen. Google has released a standalone app for Google Hangouts, integrating Google Talk and Gmail chat. However, we have not yet heard success stories from them, and we do not believe these offerings will stop the rapid user base growth of messaging apps such as WhatsApp and LINE.
KakaoTalk remains dominant messaging app in Korea. KakaoTalk is #1 messaging app in Korea with very active usage rate. The innovative introduction of ‘ranking based’ game distribution now represents 70% of Korean mobile game distribution. It has a partnership with Japan, but showing slower pace of global user growth compared to its competitors.
According to KoreanClick data, KakaoTalk’s time spent is equivalent to Naver’s mobile time spent, positioning as a dominant messaging app in domestic market, thanks to its first mover advantage, network effect and innovative product development leadership. After a huge success in game center, KakaoTalk focused diversifying its business model into digital contents market place (Kakao Page).
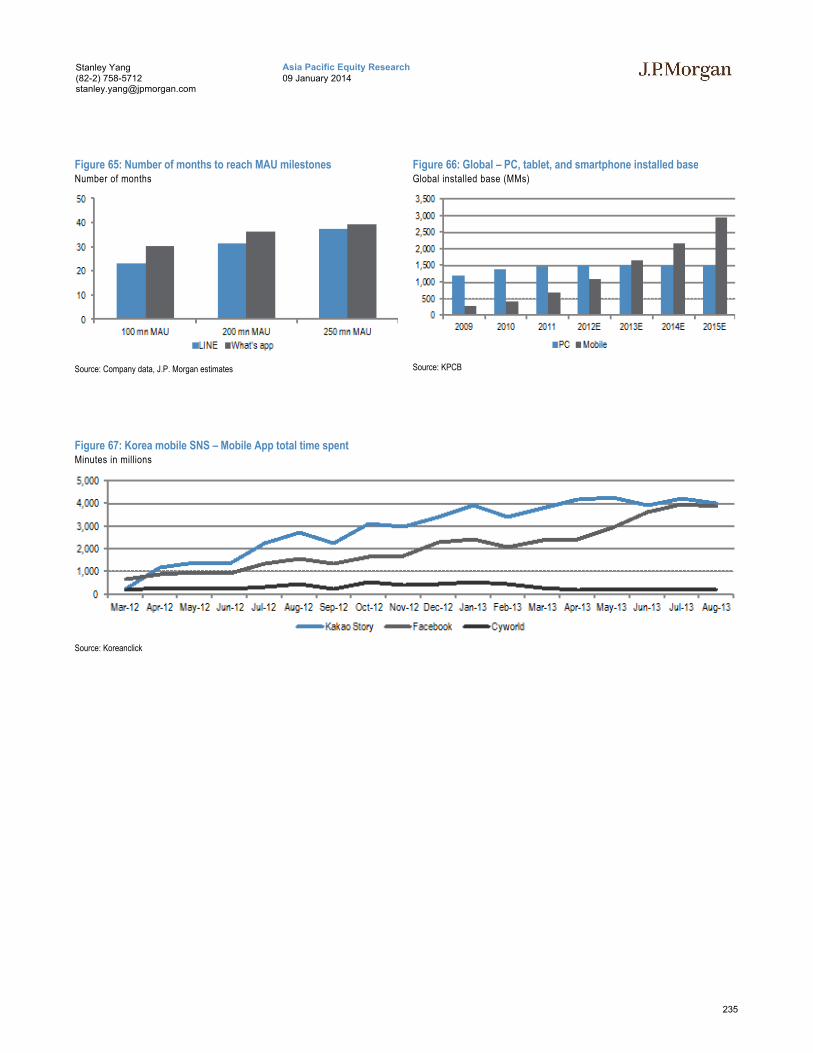
235
Asia Pacific Equity Research09 January 2014
Stanley Yang(82-2) [email protected]
Figure 65: Number of months to reach MAU milestonesNumber of months
Source: Company data, J.P. Morgan estimates
Figure 66: Global – PC, tablet, and smartphone installed baseGlobal installed base (MMs)
Source: KPCB
Figure 67: Korea mobile SNS – Mobile App total time spentMinutes in millions
Source: Koreanclick
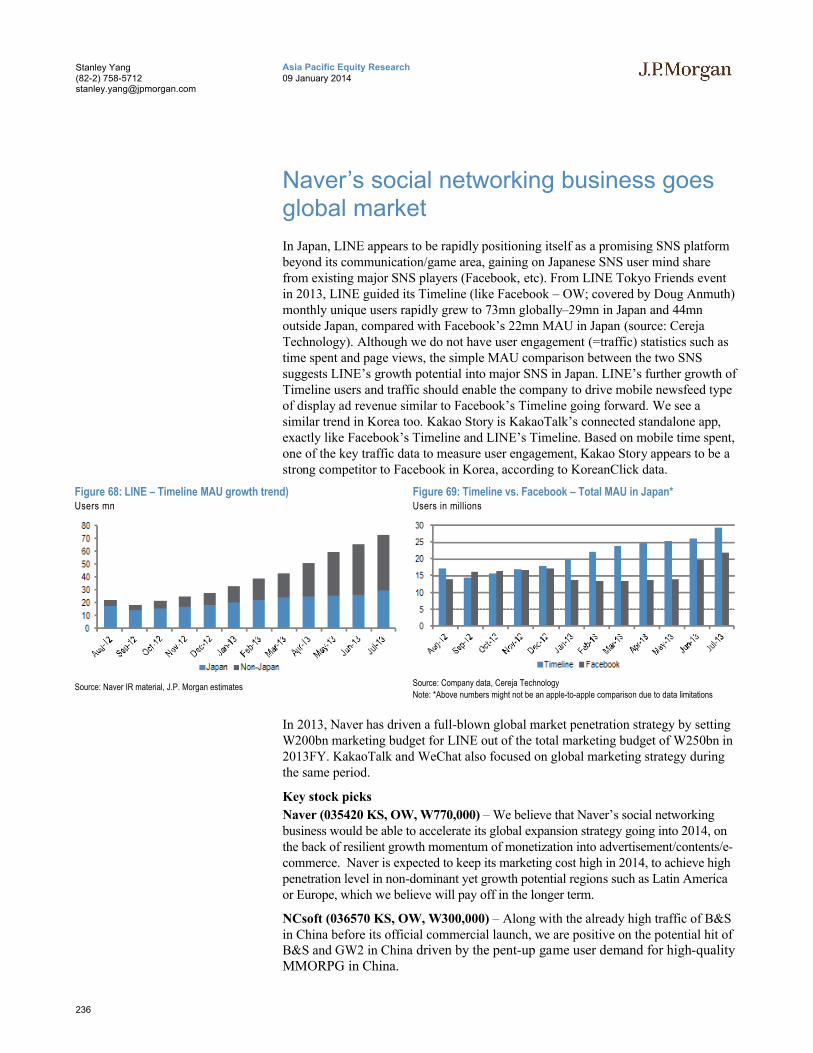
236
Asia Pacific Equity Research09 January 2014
Stanley Yang(82-2) [email protected]
Naver’s social networking business goes global market
In Japan, LINE appears to be rapidly positioning itself as a promising SNS platform beyond its communication/game area, gaining on Japanese SNS user mind share from existing major SNS players (Facebook, etc). From LINE Tokyo Friends event in 2013, LINE guided its Timeline (like Facebook – OW; covered by Doug Anmuth) monthly unique users rapidly grew to 73mn globally–29mn in Japan and 44mn outside Japan, compared with Facebook’s 22mn MAU in Japan (source: Cereja Technology). Although we do not have user engagement (=traffic) statistics such astime spent and page views, the simple MAU comparison between the two SNS suggests LINE’s growth potential into major SNS in Japan. LINE’s further growth of Timeline users and traffic should enable the company to drive mobile newsfeed type of display ad revenue similar to Facebook’s Timeline going forward. We see a similar trend in Korea too. Kakao Story is KakaoTalk’s connected standalone app, exactly like Facebook’s Timeline and LINE’s Timeline. Based on mobile time spent, one of the key traffic data to measure user engagement, Kakao Story appears to be a strong competitor to Facebook in Korea, according to KoreanClick data.
Figure 68: LINE – Timeline MAU growth trend)Users mn
Source: Naver IR material, J.P. Morgan estimates
Figure 69: Timeline vs. Facebook – Total MAU in Japan*Users in millions
Source: Company data, Cereja Technology
Note: *Above numbers might not be an apple-to-apple comparison due to data limitations
In 2013, Naver has driven a full-blown global market penetration strategy by setting W200bn marketing budget for LINE out of the total marketing budget of W250bn in 2013FY. KakaoTalk and WeChat also focused on global marketing strategy during the same period.
Key stock picks
Naver (035420 KS, OW, W770,000) – We believe that Naver’s social networking business would be able to accelerate its global expansion strategy going into 2014, on the back of resilient growth momentum of monetization into advertisement/contents/e-commerce. Naver is expected to keep its marketing cost high in 2014, to achieve high penetration level in non-dominant yet growth potential regions such as Latin America or Europe, which we believe will pay off in the longer term.
NCsoft (036570 KS, OW, W300,000) – Along with the already high traffic of B&S in China before its official commercial launch, we are positive on the potential hit of B&S and GW2 in China driven by the pent-up game user demand for high-qualityMMORPG in China.
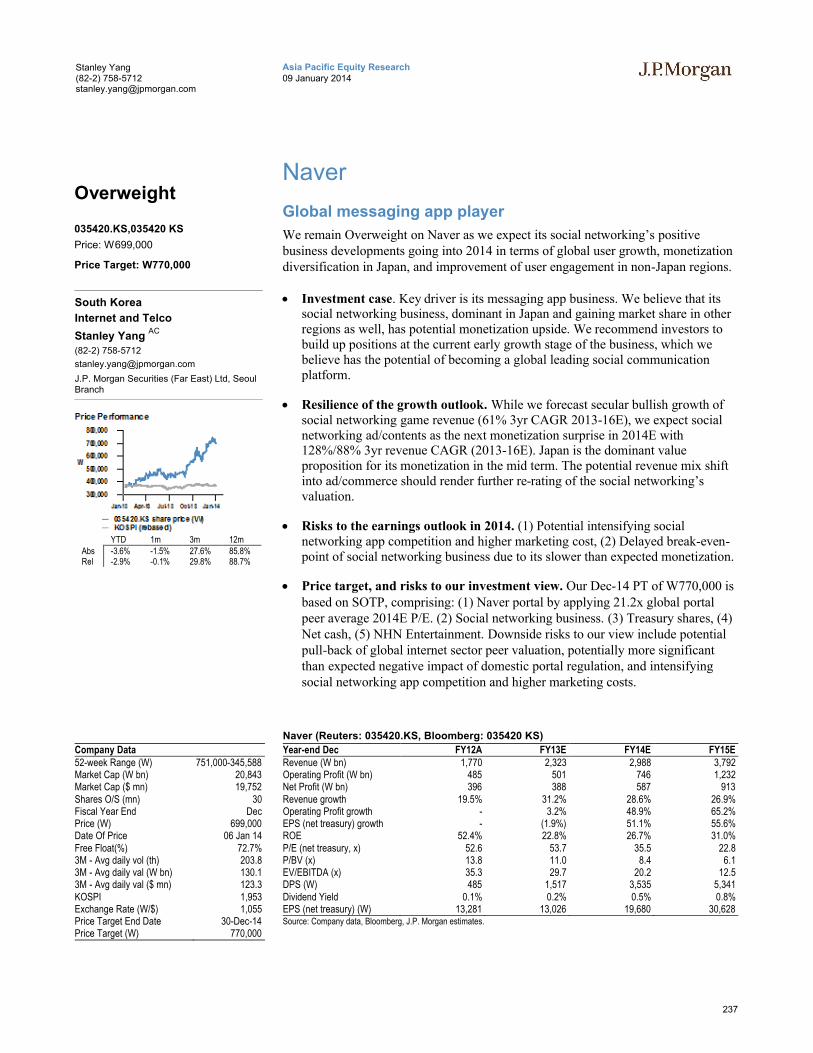
237
Asia Pacific Equity Research09 January 2014
Stanley Yang(82-2) [email protected]
Naver
Global messaging app player
We remain Overweight on Naver as we expect its social networking’s positive business developments going into 2014 in terms of global user growth, monetization diversification in Japan, and improvement of user engagement in non-Japan regions.
Investment case. Key driver is its messaging app business. We believe that its social networking business, dominant in Japan and gaining market share in other regions as well, has potential monetization upside. We recommend investors to build up positions at the current early growth stage of the business, which we believe has the potential of becoming a global leading social communication platform.
Resilience of the growth outlook. While we forecast secular bullish growth ofsocial networking game revenue (61% 3yr CAGR 2013-16E), we expect social networking ad/contents as the next monetization surprise in 2014E with 128%/88% 3yr revenue CAGR (2013-16E). Japan is the dominant value proposition for its monetization in the mid term. The potential revenue mix shift into ad/commerce should render further re-rating of the social networking’s valuation.
Risks to the earnings outlook in 2014. (1) Potential intensifying social networking app competition and higher marketing cost, (2) Delayed break-even-point of social networking business due to its slower than expected monetization.
Price target, and risks to our investment view. Our Dec-14 PT of W770,000 is based on SOTP, comprising: (1) Naver portal by applying 21.2x global portal peer average 2014E P/E. (2) Social networking business. (3) Treasury shares, (4) Net cash, (5) NHN Entertainment. Downside risks to our view include potential pull-back of global internet sector peer valuation, potentially more significant than expected negative impact of domestic portal regulation, and intensifying social networking app competition and higher marketing costs.
Company Data52-week Range (W) 751,000-345,588Market Cap (W bn) 20,843Market Cap ($ mn) 19,752Shares O/S (mn) 30Fiscal Year End DecPrice (W) 699,000Date Of Price 06 Jan 14Free Float(%) 72.7%3M - Avg daily vol (th) 203.83M - Avg daily val (W bn) 130.13M - Avg daily val ($ mn) 123.3KOSPI 1,953Exchange Rate (W/$) 1,055Price Target End Date 30-Dec-14Price Target (W) 770,000
Naver (Reuters: 035420.KS, Bloomberg: 035420 KS)
Year-end Dec FY12A FY13E FY14E FY15ERevenue (W bn) 1,770 2,323 2,988 3,792Operating Profit (W bn) 485 501 746 1,232Net Profit (W bn) 396 388 587 913Revenue growth 19.5% 31.2% 28.6% 26.9%Operating Profit growth - 3.2% 48.9% 65.2%EPS (net treasury) growth - (1.9%) 51.1% 55.6%ROE 52.4% 22.8% 26.7% 31.0%P/E (net treasury, x) 52.6 53.7 35.5 22.8P/BV (x) 13.8 11.0 8.4 6.1EV/EBITDA (x) 35.3 29.7 20.2 12.5DPS (W) 485 1,517 3,535 5,341Dividend Yield 0.1% 0.2% 0.5% 0.8%EPS (net treasury) (W) 13,281 13,026 19,680 30,628Source: Company data, Bloomberg, J.P. Morgan estimates.
Overweight
035420.KS,035420 KS
Price: W699,000
Price Target: W770,000
South Korea
Internet and Telco
Stanley Yang AC
(82-2) 758-5712
J.P. Morgan Securities (Far East) Ltd, Seoul Branch
YTD 1m 3m 12mAbs -3.6% -1.5% 27.6% 85.8%Rel -2.9% -0.1% 29.8% 88.7%

238
Asia Pacific Equity Research09 January 2014
Stanley Yang(82-2) [email protected]
Maintaining estimates
We’re maintaining our estimates for Naver, as seen in the table below:
Figure 70: Naver forecasts Income Statement
W in billions, year end Dec FY12 FY13E FY14E FY15E.Revenue 1,770 2,323 2,988 3,792
Search ad 1,206 1,348 1,501 1,644Display ad 347 337 402 442
Others 217 638 1,086 1,706
Operating expense (1,285) (1,822) (2,243) (2,560)
Labor (476) (541) (610) (698)Commission (404) (682) (885) (1,084)Marketing (76) (262) (364) (364)
D&A (97) (123) (150) (166)Others (232) (214) (234) (247)
Operating profit 485 501 746 1,232
EBITDA 582 623 896 1,398Net non-operating 38 59 62 64
Profit before tax 523 560 807 1,296Income tax (127) (172) (221) (383).
Net profit 396 388 587 913EPS (W, adj., excl. treasury) 13,281 13,026 19,680 30,628EPS (W, reported) 12,014 11,783 17,802 27,706
Source: J.P. Morgan estimates, Company data
Investment Thesis, Valuation and Risks
Naver (Overweight; Price Target: W770,000)
Investment Thesis
We sense that LINE’s global user growth momentum remains strong especially from 2nd tier target markets incl. Spain, Latin America, Indonesia and India going into 2014. We are positive on the strong pick-up of user engagement and monetizationfrom these regions in 2014.
Valuation
Our Dec-14 PT of W770,000 is based on SOTP, comprising: (1) Naver portal by applying 21.2x global portal peer average 2014E P/E, (2) Social networking business, (3) Treasury shares, (4) Net cash, (5) NHN Entertainment.
Risks to Rating and Price Target
Key upside risks to our view include: (1) earlier-than-expected rebound in domestic economic conditions, (2) monetization upside from LINE’s advertising and commerce business in Japan, and (3) potential LINE subscriber growth in US/EU, the mainstream SNS market. Key downside risks to our view include: (1) potentialmore significant-than-expected negative impact from domestic portal regulation, (2) potential pullback of global Internet sector peer valuation, and (3) intensifying messaging app competition and higher marketing costs.

239
Asia Pacific Equity Research09 January 2014
Stanley Yang(82-2) [email protected]
Naver: Summary of FinancialsIncome Statement Cash Flow Statement
W in billions, year end Dec FY12 FY13E FY14E FY15E W in billions, year end Dec FY12 FY13E FY14E FY15E.Revenue 1,770 2,323 2,988 3,792 Cash flows from operating 430 501 727 1,069
Search ad 1,206 1,348 1,501 1,644 Net profit 396 388 587 913Display ad 347 337 402 442 D&A 97 123 150 166
Others 217 638 1,086 1,706 Net working capital & others (63) (10) (10) (10).
Operating expense (1,285) (1,822) (2,243) (2,560) Cash flows from investing (473) (395) (280) (304)
Labor (476) (541) (610) (698) Capital expenditures (192) (350) (230) (250)Commission (404) (682) (885) (1,084) Other investments (281) (45) (50) (54)Marketing (76) (262) (364) (364)
D&A (97) (123) (150) (166) Cash flows from financing 16 0 (67) (126)Others (232) (214) (234) (247) Cash dividend (16) (50) (117) (176)
. Share buyback/sale 0 0 0 0Operating profit 485 501 746 1,232 Other 32 50 50 50
EBITDA 582 623 896 1,398Net non-operating 38 59 62 64 Net change in cash (27) 106 380 639
Profit before tax 523 560 807 1,296 Beginning cash 59 32 138 518Income tax (127) (172) (221) (383) Ending cash 32 138 518 1,157.
Net profit 396 388 587 913 FCF 238 151 497 819EPS (W, adj., excl. treasury) 13,281 13,026 19,680 30,628EPS (W, reported) 12,014 11,783 17,802 27,706
.Balance Sheet Ratio Analysis
W in billions, year end Dec FY12 FY13E FY14E FY15E W in billions, year end Dec FY12 FY13E FY14E FY15E
.Total current assets 777 1,023 1,546 2,288 OP margin 27.4% 21.6% 25.0% 32.5%
Cash & cash eq. 32 138 518 1,157 EBITDA margin 32.9% 26.8% 30.0% 36.9%
ST investments 354 407 468 515 Net profit margin 22.4% 16.7% 19.6% 24.1%Receivables 159 199 239 263Other current asset 233 280 322 354 Sales growth 19.5% 31.2% 28.6% 26.9%
Total fixed assets 1,310 1,484 1,581 1,776 Operating profit growth - 3.2% 48.9% 65.2%Investments 454 570 618 778 EBITDA growth - 7.1% 43.7% 56.1%
Tangible assets 359 380 399 407 Net profit growth - (1.9%) 51.1% 55.6%Intangible assets 39 44 49 56 EPS growth - (1.9%) 51.1% 55.6%Other long-term assets 458 490 515 535
Total assets 2,088 2,508 3,127 4,064 Sales per share (W) 53,699 70,473 90,658 115,024BVPS (W) 50,710 63,736 83,416 114,044
Total current liabilities 494 525 557 582
Accounts payable 87 108 130 143 Shares outstanding (m) 33 33 33 33ST borrowings/CPLTD 100 98 96 94 Net treasury shares O/S (mn) 30 30 30 30
Other current liabilities 307 319 331 345Total LT liabilities 82 82 82 82 Payout ratio 3.7% 11.6% 18.0% 17.4%
LT borrowings/bonds 0 0 0 0 Sales/assets (x) 1.7 1.0 1.1 1.1
Other LT liabilities 82 82 82 82 Assets/equity (x) 1.4 1.3 1.3 1.2Total liabilities 575 607 639 664 ROE 52.4% 22.8% 26.7% 31.0%Shareholder's equity 1,512 1,900 2,487 3,401 ROA 37.9% 16.9% 20.8% 25.4%
Total liabilities and equity 2,088 2,508 3,127 4,064
Source: Company reports and J.P. Morgan estimates.
240
Asia Pacific Equity Research09 January 2014
Stanley Yang(82-2) [email protected]
NCSoft
Accelerating overseas business momentum in 2014
B&S – focus on lofty monetization pace in China. Tencent has expanded B&S servers up to 210, which appear to be largely full at night time. We might see slower server expansion going forward, but we focus on B&S’s lofty monetization matrix, including paying user rate and ARPPU (average revenue per paying users), which appears to be significantly above other Tencent games, and market expectations.
Maintain B&S royalty revenue forecast of W138bn in 2014. As of now, we conservatively estimate 1.2mn PCU, 3.6mn active users, 1.1mn paying users and RMB345 (W60,000) ARPPU, resulting in a W65bn monthly revenue run rate for Tencent, or W19bn monthly royalty revenue for NCsoft in 4Q (vs original W8bn). We expect ample potential upside for B&S's revenue contribution in 2014.
More catalysts to come. The upcoming launches of GW2 in China and Wild Star in the US/EU are expected to serve additional share price catalysts, in our view.
Compelling valuation. Our Dec-14 PT of W300,000 implies 18.8x 2yr avg. fwd P/E, slightly below its historical average of 19.3x. We believe the company deserves a substantial premium over online game peers given its superior R&D driven pipeline value and very strong LI franchise in Korea.
Company Data52-week Range (W) 253,000-125,000Market Cap (W bn) 4,647Market Cap ($ mn) 4,404Shares O/S (mn) 20Fiscal Year End DecPrice (W) 234,000Date Of Price 06 Jan 14Free Float(%) 57.7%3M - Avg daily vol (th) 175.83M - Avg daily val (W bn) 38.63M - Avg daily val ($ mn) 36.6KOSPI 1,953Exchange Rate (W/$) 1,055Price Target (W) 300,000Price Target End Date 30-Dec-14
NCSoft (Reuters: 036570.KS, Bloomberg: 036570 KS)
Year-end Dec FY12A FY13E FY14E FY15ERevenue (W bn) 746 761 945 1,032Operating Profit (W bn) 151 206 351 394Net Profit (W bn) 156 166 306 338Revenue growth 22.5% 2.0% 24.3% 9.1%Operating Profit growth 12.0% 36.1% 70.5% 12.3%EPS (net treasury) growth 29.6% 6.3% 84.7% 10.6%ROE 16.5% 15.4% 23.8% 21.2%P/E (net treasury, x) 29.8 28.1 15.2 13.7P/BV (x) 4.6 4.1 3.2 2.6EV/EBITDA (x) 21.1 16.3 9.8 8.6DPS (W) 599 372 417 770Dividend Yield 0.3% 0.2% 0.2% 0.3%EPS (net treasury) (W) 7,845 8,337 15,396 17,026Source: Company data, Bloomberg, J.P. Morgan estimates.
Overweight
036570.KS,036570 KS
Price: W234,000
Price Target: W300,000
South Korea
Internet and Telco
Stanley Yang AC
(82-2) 758-5712
J.P. Morgan Securities (Far East) Ltd, Seoul Branch
YTD 1m 3m 12mAbs -4.3% -4.9% 24.5% 49.0%Rel -3.6% -3.5% 26.7% 51.9%
241
Asia Pacific Equity Research09 January 2014
Stanley Yang(82-2) [email protected]
Maintaining estimates
We’re maintaining our estimates for NCSoft, as seen in the table below:
Figure 71: NCsoft forecastsIncome Statement
W in billions, year end Dec FY12 FY13E FY14E FY15E.Revenues 746 761 945 1,032
Online game 682 697 748 797Royalty 64 63 197 234
Operating expense (602) (555) (594) (637)Labor (325) (315) (340) (364)Marketing (36) (23) (25) (28)D&A (37) (36) (39) (40)Others (196) (180) (190) (206)
Operating profit 151 206 351 394EBITDA 189 242 390 434Net non-operating 32 19 27 30Profit before tax 183 225 378 424Income tax (29) (52) (72) (85)Minority interest 2 (2) (1) (1)
Net profit 156 166 306 338EPS (W, adj., excl. treasury) 7,845 8,337 15,396 17,026EPS (W, reported) 7,115 7,561 13,963 15,441
Source: J.P. Morgan estimates, Company data
Investment Thesis, Valuation and Risks
NCSoft (Overweight; Price Target: W300,000)
Investment Thesis
In the online game sector, we avoid mobile game developers (WeMade, Gamevil, NHN Entertainment) because we see structural margin pressure from the domestic platform-driven mobile game business environment and short product life cycle. On the other hand, we like NCsoft because competition in the global MMORPG market has significantly eased, enabling the company to capture a larger share of the captive MMORPG market.
Valuation
We set our Dec-14 price target of W300,000 by applying 19.3x target multiple two-year average fwd P/E, a 25% discount to 25.7x historical two-year average fwd P/E over the past five years to our two-year average fwd EPS of W15,390. Our 25% discount to historical valuation reflects the ex-growth stage or declining stage of global hard core MMORPG industry (except for China).
Risks to Rating and Price Target
Upside risks to our view: Potential launch of mobile games; potential operational synergies with Nexon, introduction of new game pipeline. Downside risks to our view: Potential product launch delay, weaker-than-expected traction of B&S in China.
242
Asia Pacific Equity Research09 January 2014
Stanley Yang(82-2) [email protected]
NCSoft: Summary of FinancialsIncome Statement Cash Flow Statement
W in billions, year end Dec FY12 FY13E FY14E FY15E W in billions, year end Dec FY12 FY13E FY14E FY15E.Revenues 746 761 945 1,032 Cash flows from operating 211 209 338 378
Online game 682 697 748 797 Net profit 156 166 306 338Royalty 64 63 197 234 D&A 37 36 39 40
Net working capital & others 25 7 (7) (0)Operating expense (602) (555) (594) (637)
Labor (325) (315) (340) (364) Cash flows from investing (146) (162) (222) (262)
Marketing (36) (23) (25) (28) Capital expenditures (90) (100) (100) (100)D&A (37) (36) (39) (40) Other investments (57) (62) (122) (162)Others (196) (180) (190) (206)
Cash flows from financing 6 (2) (3) (10)Operating profit 151 206 351 394 Cash dividend (12) (7) (8) (15)EBITDA 189 242 390 434 Share buyback/sale 0 5 5 5
Net non-operating 32 19 27 30 Other 17 0 0 0Profit before tax 183 225 378 424
Income tax (29) (52) (72) (85) Net change in cash 64 44 113 106Minority interest 2 (2) (1) (1) Beginning cash 59 123 167 280
Ending cash 123 167 280 386
Net profit 156 166 306 338EPS (W, adj., excl. treasury) 7,845 8,337 15,396 17,026 FCF 121 109 238 278EPS (W, reported) 7,115 7,561 13,963 15,441
.Balance Sheet Ratio Analysis
W in billions, year end Dec FY12 FY13E FY14E FY15E W in billions, year end Dec FY12 FY13E FY14E FY15E
.Total current assets 674 746 966 1,209 OP margin 20.3% 27.1% 37.1% 38.2%
Cash & cash eq. 123 167 280 386 EBITDA margin 25.3% 31.8% 41.3% 42.1%
ST investments 313 333 413 533 Net profit margin 20.9% 21.8% 32.3% 32.8%Receivables 77 76 95 103Other current asset 162 170 178 187 Sales growth 22.5% 2.0% 24.3% 9.1%
Total fixed assets 643 696 796 894 Operating profit growth 12.0% 36.1% 70.5% 12.3%Investments 46 40 48 37 EBITDA growth 15.3% 28.3% 61.1% 11.3%
Tangible assets 426 490 514 524 Net profit growth 30.0% 6.3% 84.7% 10.6%Intangible assets 133 127 190 285 EPS growth 29.6% 6.3% 84.7% 10.6%Other long-term assets 38 40 44 48
Total Assets 1,317 1,443 1,761 2,103 Sales per share (W) 34,051 34,738 43,165 47,109BVPS (W) 51,386 57,223 72,202 88,458
Total current liabilities 236 242 261 276
Accounts payable 25 27 33 36 Shares outstanding (m) 22 22 22 22ST borrowings/CPLTD 12 13 15 16 Net treasury shares O/S (mn) 20 20 20 20
Other current liabilities 198 202 213 224Total LT liabilities 61 64 67 70 Payout ratio 7.6% 4.5% 2.7% 4.5%
LT borrowings/bonds 0 0 0 0 Sales/assets (x) 0.6 0.6 0.6 0.5
Other LT liabilities 61 64 67 70 Assets/equity (x) 1.3 1.3 1.2 1.2Total Liabilities 296 306 327 346 ROE 16.5% 15.4% 23.8% 21.2%Shareholder's equity 1,021 1,137 1,434 1,757 ROA 12.8% 12.0% 19.1% 17.5%
Total liabilities and equity 1,317 1,443 1,761 2,103
Source: Company reports and J.P. Morgan estimates.
243
Asia Pacific Equity Research09 January 2014
Stanley Yang(82-2) [email protected]
Daum
Structural margin pressure continues
We acknowledge Daum has improved its search monetization by transitioning to a 100% in-house search platform strategy. Nevertheless, we see the ongoing margin pressure as more of a structural issue to compete against Naver’s economies of scope, hence limiting margin recovery in the mid term.
Structural margin pressure to continue. We attribute Daum’s ongoing margin pressure to Naver’s superior monetization of user traffic, enabling Naver to invest larger capital to gain portal market leadership. Daum needs to counteract Naver’s investment initiatives on a significantly higher cost per customer basis. We forecast Daum’s OPM to level down to 16% in 2H13 and onward.
Lackluster game business progress. Management originally guided 25-30% y/y growth in game revenue in 2013 driven by its game business investment initiatives. However, the company’s game revenue declined 2% y/y in 1H13 on the back of (1) lackluster mobile game strategy, (2) weaker revenue trend of ONnet.
Successful transition into 100% in-house search platform strategy. We think Daum is well on track to achieve its 40-45% search ad revenue growth target in 2013, despite weak domestic economic conditions. Going into 2014, we expect y/y search ad growth to stabilize at +10%.
Valuation. We set our Dec-14 PT at W93,000 based on a 15% discount to global portal peers' average 21.2x 14P/E. The valuation multiple discount reflects (1) decelerating top line growth outlook in 2014/15E, and (2) structural margin pressure in 2014. Key upside risks to our view include margin recovery on strong cost control, or successful business diversification into SNS. A key downside risk is a slowdown in search ad revenue growth after the substantial growth of 45% in 2013E.
Company Data52-week Range (W) 110,500-77,000Market Cap (W bn) 1,138Market Cap ($ mn) 1,078Shares O/S (mn) 13Fiscal Year End DecPrice (W) 84,700Date Of Price 06 Jan 14Free Float(%) 76.0%3M - Avg daily vol (th) 36.23M - Avg daily val (W bn) 3.23M - Avg daily val ($ mn) 3.0KOSPI 1,953Exchange Rate (W/$) 1,055Price Target End Date 30-Dec-14
Daum (Reuters: 035720.KQ, Bloomberg: 035720 KQ)
Year-end Dec FY11A FY12A FY13E FY14E FY15ERevenue (W bn) 421 453 533 591 650Operating Profit (W bn) 117 102 88 95 105Net Profit (W bn) 108 77 72 78 86EPS (W) 8,077 5,706 5,341 5,830 6,418Revenue growth 20.2% 7.6% 17.6% 10.8% 10.0%Operating Profit growth 21.6% (12.8%) (13.2%) 7.2% 10.6%EPS growth (12.2%) (29.4%) (6.4%) 9.1% 10.1%ROE 26.6% 15.7% 13.1% 12.8% 12.7%P/E (x) 10.5 14.8 15.9 14.5 13.2P/BV (x) 2.5 2.2 2.0 1.8 1.6EV/EBITDA (x) 7.8 7.9 8.2 7.3 6.3DPS (W) 745 1,607 1,084 1,015 1,108Dividend Yield 0.9% 1.9% 1.3% 1.2% 1.3%Source: Company data, Bloomberg, J.P. Morgan estimates.
Neutral
035720.KQ,035720 KQ
Price: W84,700
Price Target: W93,000
South Korea
Internet and Telco
Stanley Yang AC
(82-2) 758-5712
J.P. Morgan Securities (Far East) Ltd, Seoul Branch
YTD 1m 3m 12mAbs -0.4% -2.4% -10.4% -18.3%Rel 0.3% -1.0% -8.2% -15.4%
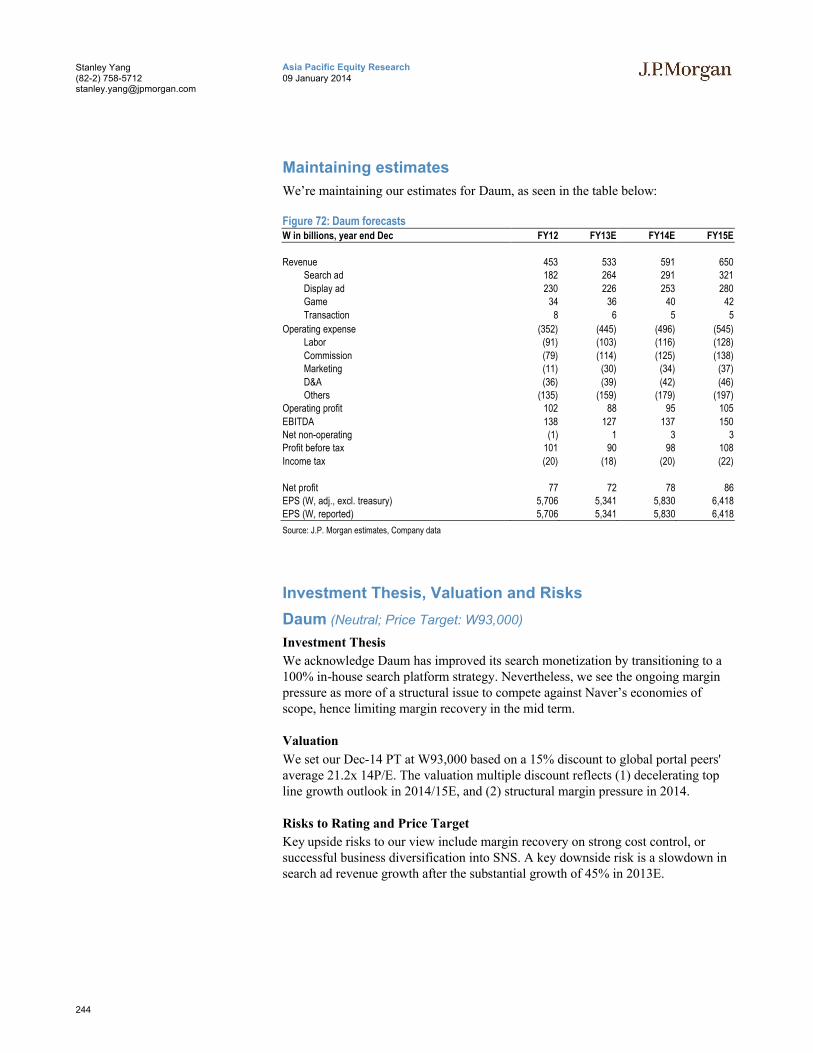
244
Asia Pacific Equity Research09 January 2014
Stanley Yang(82-2) [email protected]
Maintaining estimates
We’re maintaining our estimates for Daum, as seen in the table below:
Figure 72: Daum forecasts W in billions, year end Dec FY12 FY13E FY14E FY15E
.Revenue 453 533 591 650
Search ad 182 264 291 321
Display ad 230 226 253 280Game 34 36 40 42
Transaction 8 6 5 5
Operating expense (352) (445) (496) (545)Labor (91) (103) (116) (128)
Commission (79) (114) (125) (138)Marketing (11) (30) (34) (37)
D&A (36) (39) (42) (46)Others (135) (159) (179) (197)
Operating profit 102 88 95 105
EBITDA 138 127 137 150Net non-operating (1) 1 3 3Profit before tax 101 90 98 108
Income tax (20) (18) (20) (22).
Net profit 77 72 78 86EPS (W, adj., excl. treasury) 5,706 5,341 5,830 6,418EPS (W, reported) 5,706 5,341 5,830 6,418
Source: J.P. Morgan estimates, Company data
Investment Thesis, Valuation and Risks
Daum (Neutral; Price Target: W93,000)
Investment Thesis
We acknowledge Daum has improved its search monetization by transitioning to a 100% in-house search platform strategy. Nevertheless, we see the ongoing margin pressure as more of a structural issue to compete against Naver’s economies of scope, hence limiting margin recovery in the mid term.
Valuation
We set our Dec-14 PT at W93,000 based on a 15% discount to global portal peers' average 21.2x 14P/E. The valuation multiple discount reflects (1) decelerating top line growth outlook in 2014/15E, and (2) structural margin pressure in 2014.
Risks to Rating and Price Target
Key upside risks to our view include margin recovery on strong cost control, or successful business diversification into SNS. A key downside risk is a slowdown in search ad revenue growth after the substantial growth of 45% in 2013E.
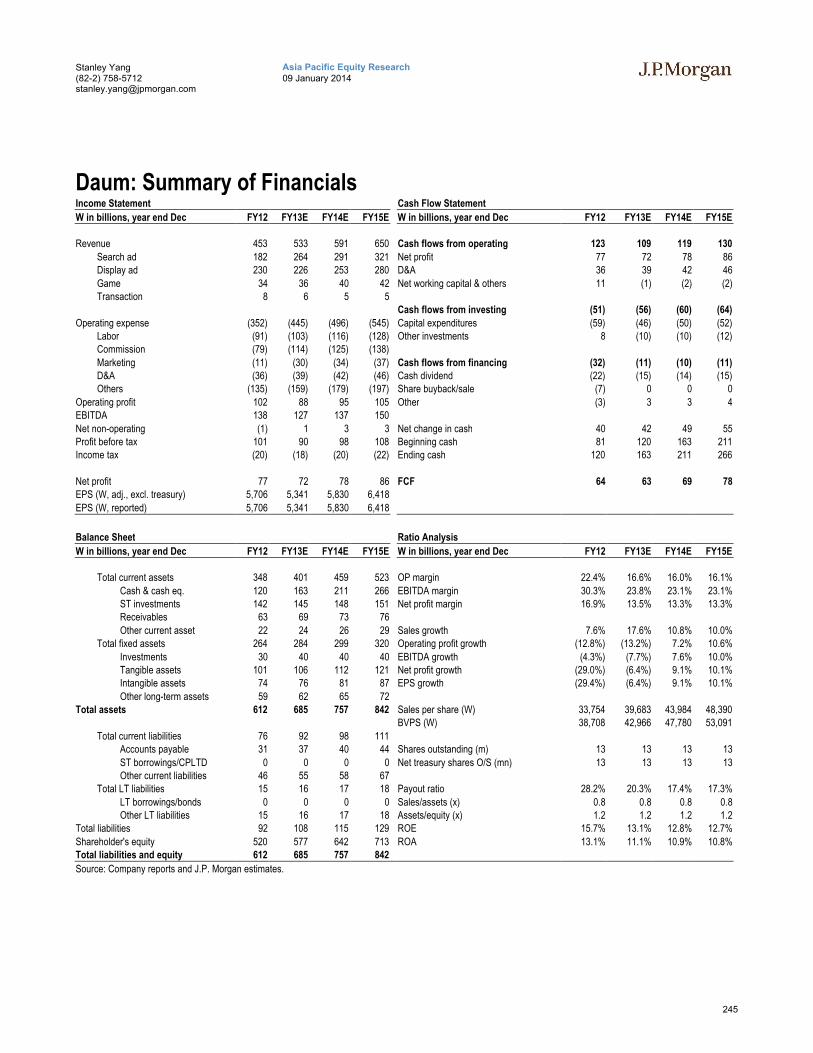
245
Asia Pacific Equity Research09 January 2014
Stanley Yang(82-2) [email protected]
Daum: Summary of FinancialsIncome Statement Cash Flow Statement
W in billions, year end Dec FY12 FY13E FY14E FY15E W in billions, year end Dec FY12 FY13E FY14E FY15E.Revenue 453 533 591 650 Cash flows from operating 123 109 119 130
Search ad 182 264 291 321 Net profit 77 72 78 86Display ad 230 226 253 280 D&A 36 39 42 46
Game 34 36 40 42 Net working capital & others 11 (1) (2) (2)Transaction 8 6 5 5
Cash flows from investing (51) (56) (60) (64)
Operating expense (352) (445) (496) (545) Capital expenditures (59) (46) (50) (52)Labor (91) (103) (116) (128) Other investments 8 (10) (10) (12)Commission (79) (114) (125) (138)
Marketing (11) (30) (34) (37) Cash flows from financing (32) (11) (10) (11)D&A (36) (39) (42) (46) Cash dividend (22) (15) (14) (15)Others (135) (159) (179) (197) Share buyback/sale (7) 0 0 0
Operating profit 102 88 95 105 Other (3) 3 3 4EBITDA 138 127 137 150
Net non-operating (1) 1 3 3 Net change in cash 40 42 49 55Profit before tax 101 90 98 108 Beginning cash 81 120 163 211Income tax (20) (18) (20) (22) Ending cash 120 163 211 266
.Net profit 77 72 78 86 FCF 64 63 69 78EPS (W, adj., excl. treasury) 5,706 5,341 5,830 6,418
EPS (W, reported) 5,706 5,341 5,830 6,418
.Balance Sheet Ratio Analysis
W in billions, year end Dec FY12 FY13E FY14E FY15E W in billions, year end Dec FY12 FY13E FY14E FY15E.
Total current assets 348 401 459 523 OP margin 22.4% 16.6% 16.0% 16.1%
Cash & cash eq. 120 163 211 266 EBITDA margin 30.3% 23.8% 23.1% 23.1%ST investments 142 145 148 151 Net profit margin 16.9% 13.5% 13.3% 13.3%Receivables 63 69 73 76
Other current asset 22 24 26 29 Sales growth 7.6% 17.6% 10.8% 10.0%Total fixed assets 264 284 299 320 Operating profit growth (12.8%) (13.2%) 7.2% 10.6%
Investments 30 40 40 40 EBITDA growth (4.3%) (7.7%) 7.6% 10.0%Tangible assets 101 106 112 121 Net profit growth (29.0%) (6.4%) 9.1% 10.1%Intangible assets 74 76 81 87 EPS growth (29.4%) (6.4%) 9.1% 10.1%
Other long-term assets 59 62 65 72Total assets 612 685 757 842 Sales per share (W) 33,754 39,683 43,984 48,390
BVPS (W) 38,708 42,966 47,780 53,091
Total current liabilities 76 92 98 111Accounts payable 31 37 40 44 Shares outstanding (m) 13 13 13 13
ST borrowings/CPLTD 0 0 0 0 Net treasury shares O/S (mn) 13 13 13 13Other current liabilities 46 55 58 67
Total LT liabilities 15 16 17 18 Payout ratio 28.2% 20.3% 17.4% 17.3%
LT borrowings/bonds 0 0 0 0 Sales/assets (x) 0.8 0.8 0.8 0.8Other LT liabilities 15 16 17 18 Assets/equity (x) 1.2 1.2 1.2 1.2
Total liabilities 92 108 115 129 ROE 15.7% 13.1% 12.8% 12.7%
Shareholder's equity 520 577 642 713 ROA 13.1% 11.1% 10.9% 10.8%Total liabilities and equity 612 685 757 842
Source: Company reports and J.P. Morgan estimates.
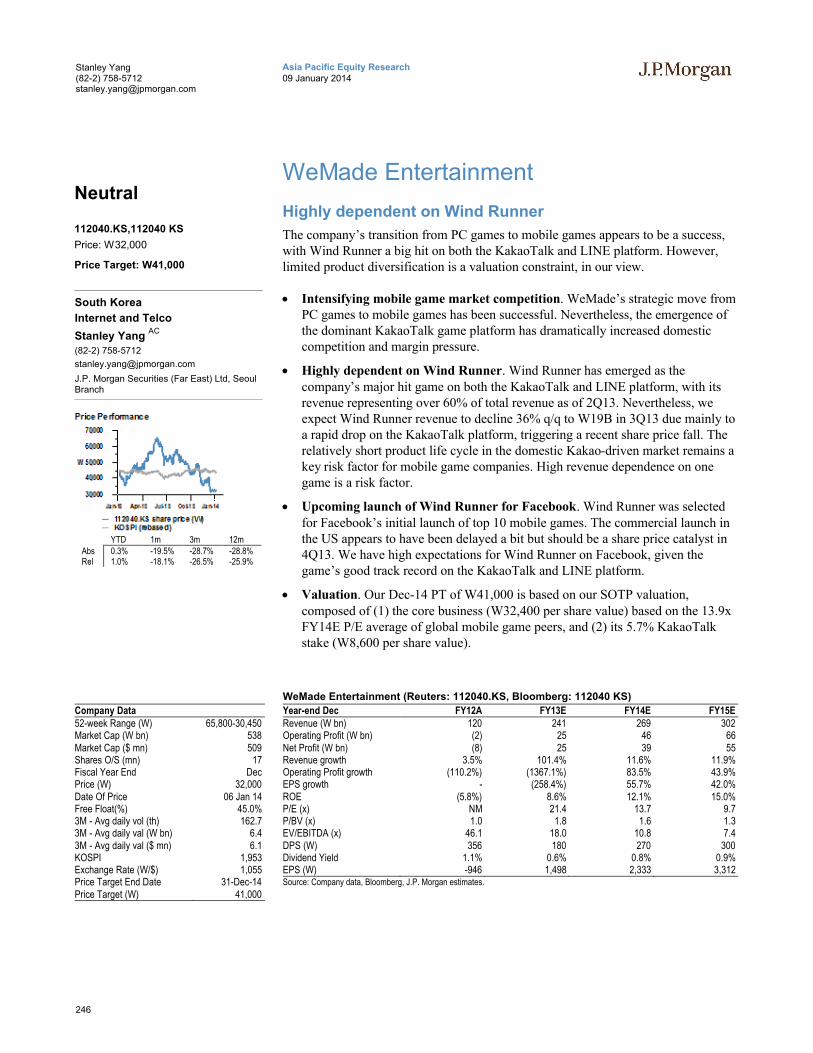
246
Asia Pacific Equity Research09 January 2014
Stanley Yang(82-2) [email protected]
WeMade Entertainment
Highly dependent on Wind Runner
The company’s transition from PC games to mobile games appears to be a success, with Wind Runner a big hit on both the KakaoTalk and LINE platform. However, limited product diversification is a valuation constraint, in our view.
Intensifying mobile game market competition. WeMade’s strategic move from PC games to mobile games has been successful. Nevertheless, the emergence of the dominant KakaoTalk game platform has dramatically increased domestic competition and margin pressure.
Highly dependent on Wind Runner. Wind Runner has emerged as the company’s major hit game on both the KakaoTalk and LINE platform, with its revenue representing over 60% of total revenue as of 2Q13. Nevertheless, we expect Wind Runner revenue to decline 36% q/q to W19B in 3Q13 due mainly to a rapid drop on the KakaoTalk platform, triggering a recent share price fall. The relatively short product life cycle in the domestic Kakao-driven market remains a key risk factor for mobile game companies. High revenue dependence on one game is a risk factor.
Upcoming launch of Wind Runner for Facebook. Wind Runner was selected for Facebook’s initial launch of top 10 mobile games. The commercial launch in the US appears to have been delayed a bit but should be a share price catalyst in 4Q13. We have high expectations for Wind Runner on Facebook, given the game’s good track record on the KakaoTalk and LINE platform.
Valuation. Our Dec-14 PT of W41,000 is based on our SOTP valuation, composed of (1) the core business (W32,400 per share value) based on the 13.9x FY14E P/E average of global mobile game peers, and (2) its 5.7% KakaoTalk stake (W8,600 per share value).
Company Data52-week Range (W) 65,800-30,450Market Cap (W bn) 538Market Cap ($ mn) 509Shares O/S (mn) 17Fiscal Year End DecPrice (W) 32,000Date Of Price 06 Jan 14Free Float(%) 45.0%3M - Avg daily vol (th) 162.73M - Avg daily val (W bn) 6.43M - Avg daily val ($ mn) 6.1KOSPI 1,953Exchange Rate (W/$) 1,055Price Target End Date 31-Dec-14Price Target (W) 41,000
WeMade Entertainment (Reuters: 112040.KS, Bloomberg: 112040 KS)
Year-end Dec FY12A FY13E FY14E FY15ERevenue (W bn) 120 241 269 302Operating Profit (W bn) (2) 25 46 66Net Profit (W bn) (8) 25 39 55Revenue growth 3.5% 101.4% 11.6% 11.9%Operating Profit growth (110.2%) (1367.1%) 83.5% 43.9%EPS growth - (258.4%) 55.7% 42.0%ROE (5.8%) 8.6% 12.1% 15.0%P/E (x) NM 21.4 13.7 9.7P/BV (x) 1.0 1.8 1.6 1.3EV/EBITDA (x) 46.1 18.0 10.8 7.4DPS (W) 356 180 270 300Dividend Yield 1.1% 0.6% 0.8% 0.9%EPS (W) -946 1,498 2,333 3,312Source: Company data, Bloomberg, J.P. Morgan estimates.
Neutral
112040.KS,112040 KS
Price: W32,000
Price Target: W41,000
South Korea
Internet and Telco
Stanley Yang AC
(82-2) 758-5712
J.P. Morgan Securities (Far East) Ltd, Seoul Branch
YTD 1m 3m 12mAbs 0.3% -19.5% -28.7% -28.8%Rel 1.0% -18.1% -26.5% -25.9%
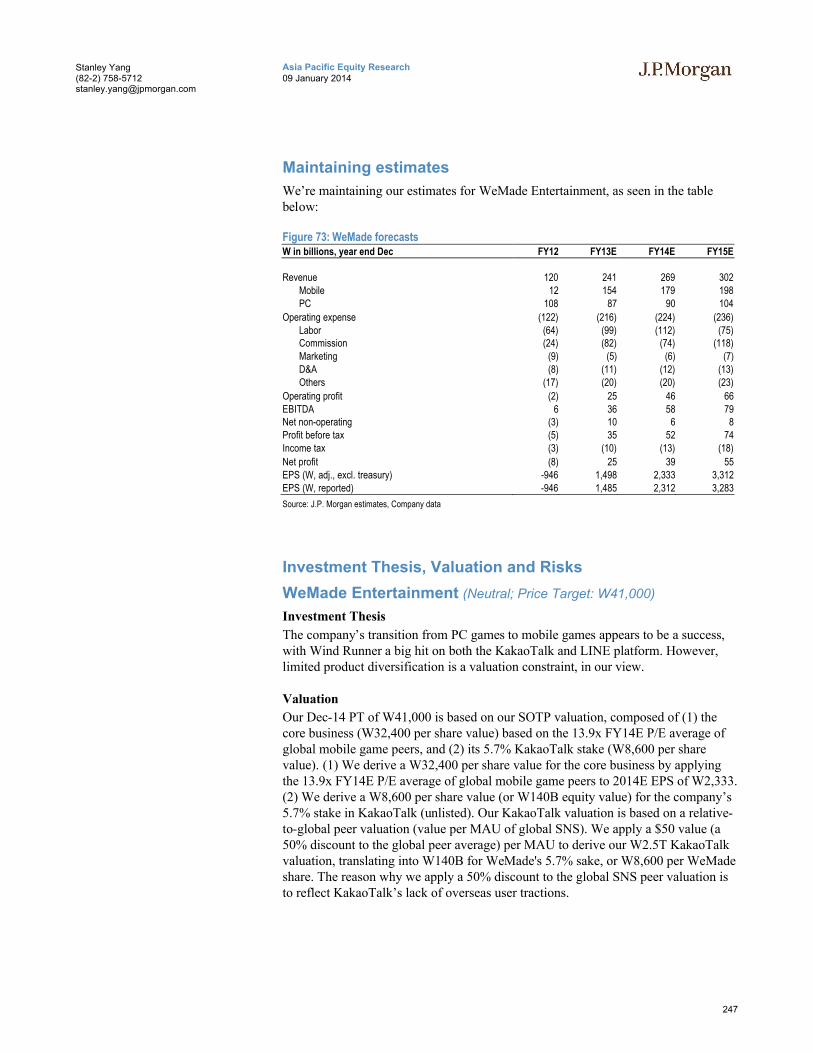
247
Asia Pacific Equity Research09 January 2014
Stanley Yang(82-2) [email protected]
Maintaining estimates
We’re maintaining our estimates for WeMade Entertainment, as seen in the table below:
Figure 73: WeMade forecasts W in billions, year end Dec FY12 FY13E FY14E FY15E.Revenue 120 241 269 302
Mobile 12 154 179 198PC 108 87 90 104
Operating expense (122) (216) (224) (236)Labor (64) (99) (112) (75)Commission (24) (82) (74) (118)Marketing (9) (5) (6) (7)D&A (8) (11) (12) (13)Others (17) (20) (20) (23)
Operating profit (2) 25 46 66EBITDA 6 36 58 79Net non-operating (3) 10 6 8Profit before tax (5) 35 52 74Income tax (3) (10) (13) (18)
Net profit (8) 25 39 55EPS (W, adj., excl. treasury) -946 1,498 2,333 3,312EPS (W, reported) -946 1,485 2,312 3,283
Source: J.P. Morgan estimates, Company data
Investment Thesis, Valuation and Risks
WeMade Entertainment (Neutral; Price Target: W41,000)
Investment Thesis
The company’s transition from PC games to mobile games appears to be a success,with Wind Runner a big hit on both the KakaoTalk and LINE platform. However, limited product diversification is a valuation constraint, in our view.
Valuation
Our Dec-14 PT of W41,000 is based on our SOTP valuation, composed of (1) the core business (W32,400 per share value) based on the 13.9x FY14E P/E average of global mobile game peers, and (2) its 5.7% KakaoTalk stake (W8,600 per share value). (1) We derive a W32,400 per share value for the core business by applying the 13.9x FY14E P/E average of global mobile game peers to 2014E EPS of W2,333. (2) We derive a W8,600 per share value (or W140B equity value) for the company’s 5.7% stake in KakaoTalk (unlisted). Our KakaoTalk valuation is based on a relative-to-global peer valuation (value per MAU of global SNS). We apply a $50 value (a 50% discount to the global peer average) per MAU to derive our W2.5T KakaoTalk valuation, translating into W140B for WeMade's 5.7% sake, or W8,600 per WeMade share. The reason why we apply a 50% discount to the global SNS peer valuation is to reflect KakaoTalk’s lack of overseas user tractions.
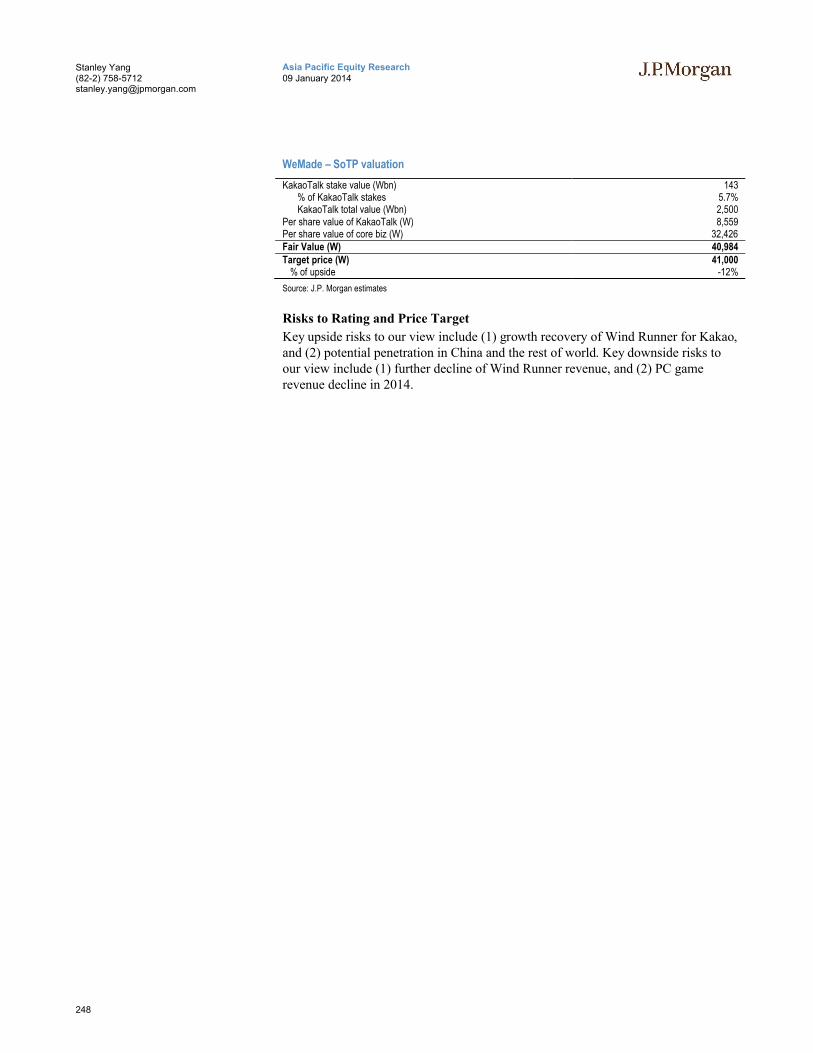
248
Asia Pacific Equity Research09 January 2014
Stanley Yang(82-2) [email protected]
WeMade – SoTP valuation
KakaoTalk stake value (Wbn) 143 % of KakaoTalk stakes 5.7% KakaoTalk total value (Wbn) 2,500 Per share value of KakaoTalk (W) 8,559 Per share value of core biz (W) 32,426Fair Value (W) 40,984 Target price (W) 41,000 % of upside -12%
Source: J.P. Morgan estimates
Risks to Rating and Price Target
Key upside risks to our view include (1) growth recovery of Wind Runner for Kakao, and (2) potential penetration in China and the rest of world. Key downside risks to our view include (1) further decline of Wind Runner revenue, and (2) PC game revenue decline in 2014.
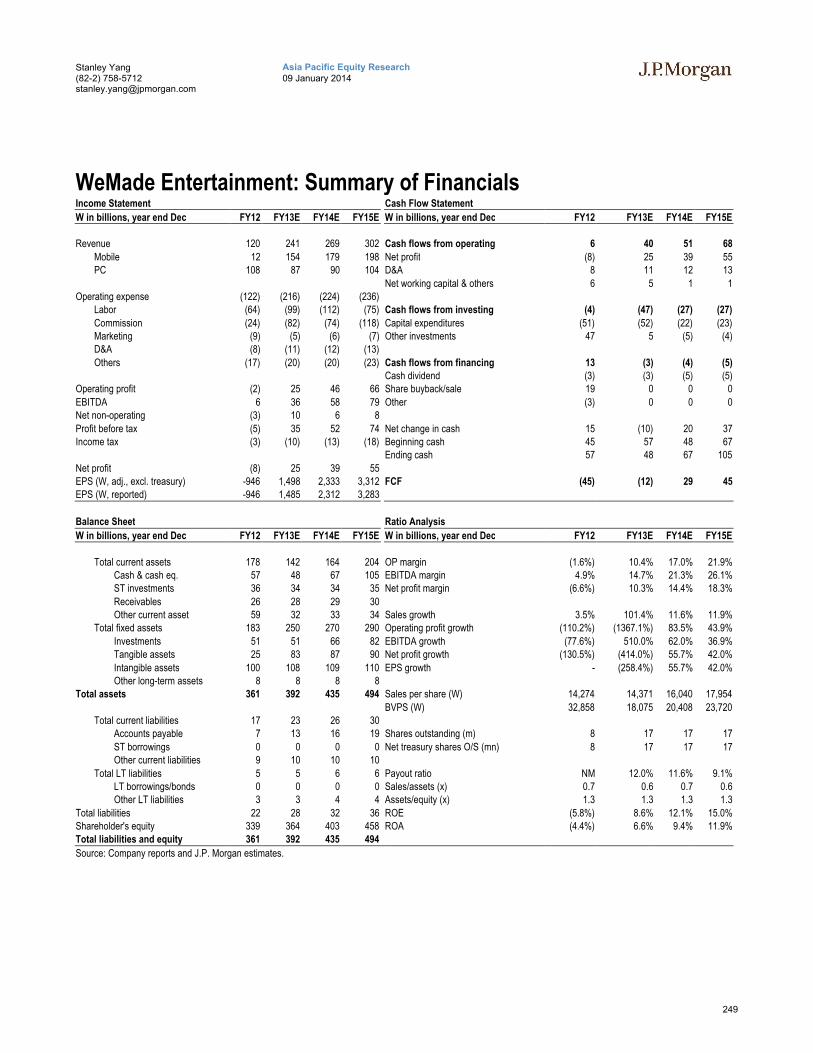
249
Asia Pacific Equity Research09 January 2014
Stanley Yang(82-2) [email protected]
WeMade Entertainment: Summary of FinancialsIncome Statement Cash Flow Statement
W in billions, year end Dec FY12 FY13E FY14E FY15E W in billions, year end Dec FY12 FY13E FY14E FY15E.Revenue 120 241 269 302 Cash flows from operating 6 40 51 68
Mobile 12 154 179 198 Net profit (8) 25 39 55PC 108 87 90 104 D&A 8 11 12 13
Net working capital & others 6 5 1 1Operating expense (122) (216) (224) (236)
Labor (64) (99) (112) (75) Cash flows from investing (4) (47) (27) (27)
Commission (24) (82) (74) (118) Capital expenditures (51) (52) (22) (23)Marketing (9) (5) (6) (7) Other investments 47 5 (5) (4)D&A (8) (11) (12) (13)
Others (17) (20) (20) (23) Cash flows from financing 13 (3) (4) (5)Cash dividend (3) (3) (5) (5)
Operating profit (2) 25 46 66 Share buyback/sale 19 0 0 0
EBITDA 6 36 58 79 Other (3) 0 0 0Net non-operating (3) 10 6 8
Profit before tax (5) 35 52 74 Net change in cash 15 (10) 20 37Income tax (3) (10) (13) (18) Beginning cash 45 57 48 67
Ending cash 57 48 67 105
Net profit (8) 25 39 55EPS (W, adj., excl. treasury) -946 1,498 2,333 3,312 FCF (45) (12) 29 45EPS (W, reported) -946 1,485 2,312 3,283
.Balance Sheet Ratio Analysis
W in billions, year end Dec FY12 FY13E FY14E FY15E W in billions, year end Dec FY12 FY13E FY14E FY15E.
Total current assets 178 142 164 204 OP margin (1.6%) 10.4% 17.0% 21.9%Cash & cash eq. 57 48 67 105 EBITDA margin 4.9% 14.7% 21.3% 26.1%ST investments 36 34 34 35 Net profit margin (6.6%) 10.3% 14.4% 18.3%
Receivables 26 28 29 30Other current asset 59 32 33 34 Sales growth 3.5% 101.4% 11.6% 11.9%
Total fixed assets 183 250 270 290 Operating profit growth (110.2%) (1367.1%) 83.5% 43.9%
Investments 51 51 66 82 EBITDA growth (77.6%) 510.0% 62.0% 36.9%Tangible assets 25 83 87 90 Net profit growth (130.5%) (414.0%) 55.7% 42.0%
Intangible assets 100 108 109 110 EPS growth - (258.4%) 55.7% 42.0%Other long-term assets 8 8 8 8
Total assets 361 392 435 494 Sales per share (W) 14,274 14,371 16,040 17,954
BVPS (W) 32,858 18,075 20,408 23,720Total current liabilities 17 23 26 30
Accounts payable 7 13 16 19 Shares outstanding (m) 8 17 17 17
ST borrowings 0 0 0 0 Net treasury shares O/S (mn) 8 17 17 17Other current liabilities 9 10 10 10
Total LT liabilities 5 5 6 6 Payout ratio NM 12.0% 11.6% 9.1%LT borrowings/bonds 0 0 0 0 Sales/assets (x) 0.7 0.6 0.7 0.6Other LT liabilities 3 3 4 4 Assets/equity (x) 1.3 1.3 1.3 1.3
Total liabilities 22 28 32 36 ROE (5.8%) 8.6% 12.1% 15.0%Shareholder's equity 339 364 403 458 ROA (4.4%) 6.6% 9.4% 11.9%Total liabilities and equity 361 392 435 494
Source: Company reports and J.P. Morgan estimates.
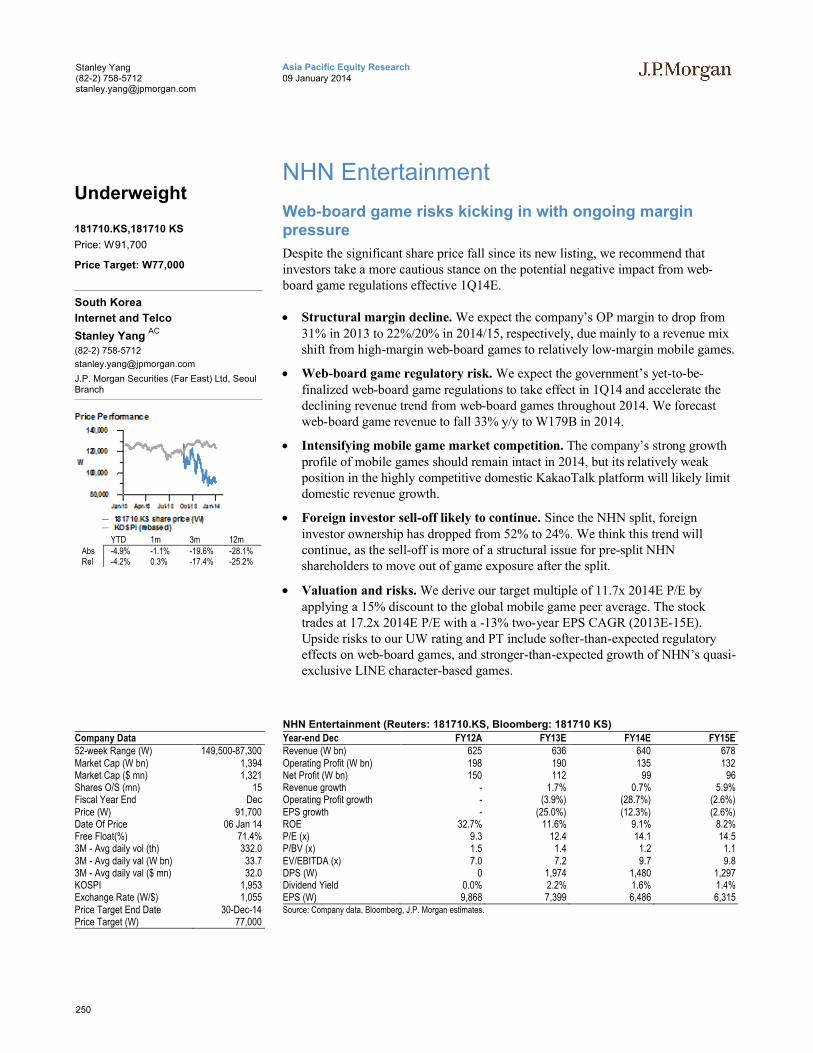
250
Asia Pacific Equity Research09 January 2014
Stanley Yang(82-2) [email protected]
NHN Entertainment
Web-board game risks kicking in with ongoing margin pressure
Despite the significant share price fall since its new listing, we recommend that investors take a more cautious stance on the potential negative impact from web-board game regulations effective 1Q14E.
Structural margin decline. We expect the company’s OP margin to drop from 31% in 2013 to 22%/20% in 2014/15, respectively, due mainly to a revenue mix shift from high-margin web-board games to relatively low-margin mobile games.
Web-board game regulatory risk. We expect the government’s yet-to-be-finalized web-board game regulations to take effect in 1Q14 and accelerate the declining revenue trend from web-board games throughout 2014. We forecast web-board game revenue to fall 33% y/y to W179B in 2014.
Intensifying mobile game market competition. The company’s strong growth profile of mobile games should remain intact in 2014, but its relatively weak position in the highly competitive domestic KakaoTalk platform will likely limit domestic revenue growth.
Foreign investor sell-off likely to continue. Since the NHN split, foreign investor ownership has dropped from 52% to 24%. We think this trend willcontinue, as the sell-off is more of a structural issue for pre-split NHN shareholders to move out of game exposure after the split.
Valuation and risks. We derive our target multiple of 11.7x 2014E P/E by applying a 15% discount to the global mobile game peer average. The stocktrades at 17.2x 2014E P/E with a -13% two-year EPS CAGR (2013E-15E). Upside risks to our UW rating and PT include softer-than-expected regulatory effects on web-board games, and stronger-than-expected growth of NHN’s quasi-exclusive LINE character-based games.
Company Data52-week Range (W) 149,500-87,300Market Cap (W bn) 1,394Market Cap ($ mn) 1,321Shares O/S (mn) 15Fiscal Year End DecPrice (W) 91,700Date Of Price 06 Jan 14Free Float(%) 71.4%3M - Avg daily vol (th) 332.03M - Avg daily val (W bn) 33.73M - Avg daily val ($ mn) 32.0KOSPI 1,953Exchange Rate (W/$) 1,055Price Target End Date 30-Dec-14Price Target (W) 77,000
NHN Entertainment (Reuters: 181710.KS, Bloomberg: 181710 KS)
Year-end Dec FY12A FY13E FY14E FY15ERevenue (W bn) 625 636 640 678Operating Profit (W bn) 198 190 135 132Net Profit (W bn) 150 112 99 96Revenue growth - 1.7% 0.7% 5.9%Operating Profit growth - (3.9%) (28.7%) (2.6%)EPS growth - (25.0%) (12.3%) (2.6%)ROE 32.7% 11.6% 9.1% 8.2%P/E (x) 9.3 12.4 14.1 14.5P/BV (x) 1.5 1.4 1.2 1.1EV/EBITDA (x) 7.0 7.2 9.7 9.8DPS (W) 0 1,974 1,480 1,297Dividend Yield 0.0% 2.2% 1.6% 1.4%EPS (W) 9,868 7,399 6,486 6,315Source: Company data, Bloomberg, J.P. Morgan estimates.
Underweight
181710.KS,181710 KS
Price: W91,700
Price Target: W77,000
South Korea
Internet and Telco
Stanley Yang AC
(82-2) 758-5712
J.P. Morgan Securities (Far East) Ltd, Seoul Branch
YTD 1m 3m 12mAbs -4.9% -1.1% -19.6% -28.1%Rel -4.2% 0.3% -17.4% -25.2%

251
Asia Pacific Equity Research09 January 2014
Stanley Yang(82-2) [email protected]
Maintaining estimates
We’re maintaining our estimates for NHN Entertainment, as seen in the table below:
Figure 74: NHN Entertainment forecasts W in billions, year end Dec FY12 FY13E FY14E FY15E.Revenue 625 636 640 678
Mobile 40 132 213 274PC 557 482 396 372
Others 29 22 31 32Operating expense (428) (446) (505) (546)
Labor (172) (163) (191) (264)Commission (173) (208) (238) (205)Marketing (27) (19) (22) (21)D&A (16) (17) (18) (19)Others (39) (39) (36) (37)
Operating profit 198 190 135 132EBITDA 213 207 153 151Net non-operating (198) (32) (4) (4)Profit before tax 0 158 131 128Income tax 0 (46) (33) (32)Net profit 150 112 99 96EPS (W, adj., excl. treasury) 9,868 7,399 6,486 6,315EPS (W, reported) 9,868 7,399 6,486 6,315Revenue 625 636 640 678
Source: J.P. Morgan estimates, Company data
Investment Thesis, Valuation and Risks
NHN Entertainment (Underweight; Price Target: W77,000)
Investment Thesis
Despite the significant share price fall since its new listing, we recommend that investors take a more cautious stance on the potential negative impact from web-board game regulations effective 1Q14E.
Valuation
We base our Dec-14 PT of W77,000 on a target multiple of 11.7x 2014E P/E. We apply a 15% discount to the global mobile game peer average of 13.7x 2014E P/E to reflect (1) the company’s significant exposure to the web-board game business which is under a regulatory overhang, and (2) the expected profit decline until 2015. The company currently trades at 17.2x 2014E P/E with a -13% two-year EPS CAGR (2013E-15E).
Risks to Rating and Price Target
Upside risks to our UW rating and PT include softer-than-expected regulatory effectson web-board games, and stronger-than-expected growth of NHN’s quasi-exclusiveLINE character-based games.
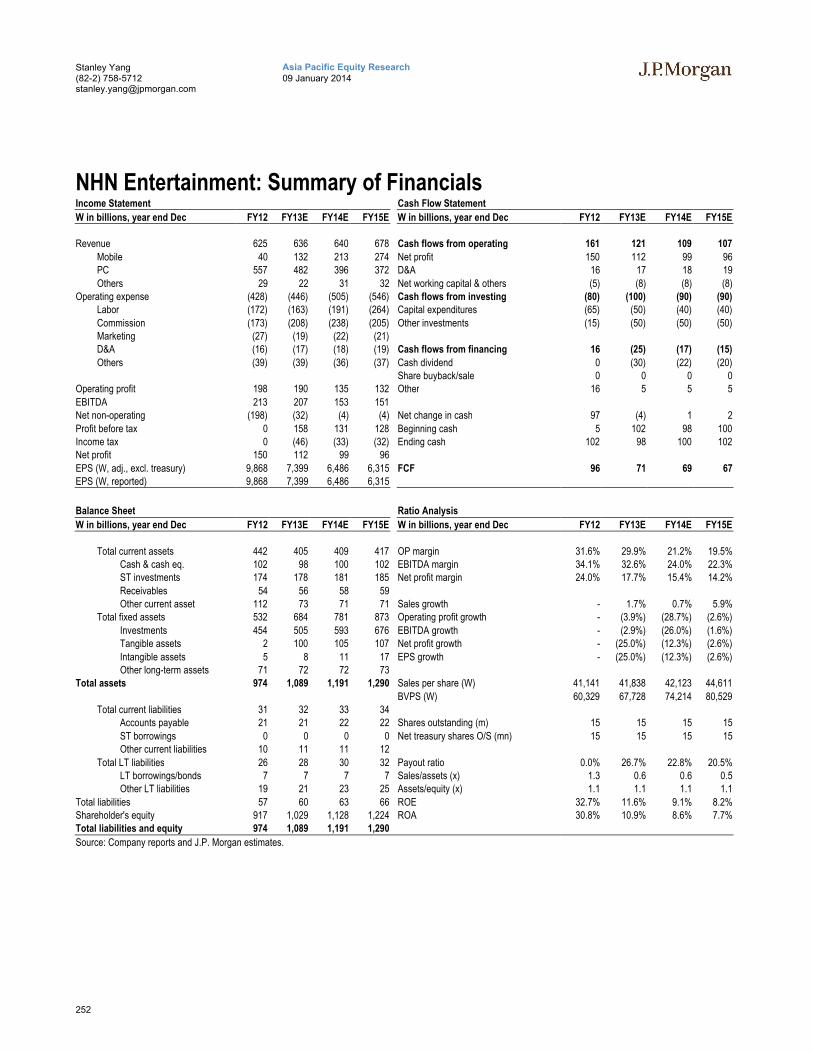
252
Asia Pacific Equity Research09 January 2014
Stanley Yang(82-2) [email protected]
NHN Entertainment: Summary of FinancialsIncome Statement Cash Flow Statement
W in billions, year end Dec FY12 FY13E FY14E FY15E W in billions, year end Dec FY12 FY13E FY14E FY15E.Revenue 625 636 640 678 Cash flows from operating 161 121 109 107
Mobile 40 132 213 274 Net profit 150 112 99 96PC 557 482 396 372 D&A 16 17 18 19
Others 29 22 31 32 Net working capital & others (5) (8) (8) (8)Operating expense (428) (446) (505) (546) Cash flows from investing (80) (100) (90) (90)
Labor (172) (163) (191) (264) Capital expenditures (65) (50) (40) (40)
Commission (173) (208) (238) (205) Other investments (15) (50) (50) (50)Marketing (27) (19) (22) (21)D&A (16) (17) (18) (19) Cash flows from financing 16 (25) (17) (15)
Others (39) (39) (36) (37) Cash dividend 0 (30) (22) (20)Share buyback/sale 0 0 0 0
Operating profit 198 190 135 132 Other 16 5 5 5
EBITDA 213 207 153 151Net non-operating (198) (32) (4) (4) Net change in cash 97 (4) 1 2
Profit before tax 0 158 131 128 Beginning cash 5 102 98 100Income tax 0 (46) (33) (32) Ending cash 102 98 100 102Net profit 150 112 99 96
EPS (W, adj., excl. treasury) 9,868 7,399 6,486 6,315 FCF 96 71 69 67EPS (W, reported) 9,868 7,399 6,486 6,315
.Balance Sheet Ratio Analysis
W in billions, year end Dec FY12 FY13E FY14E FY15E W in billions, year end Dec FY12 FY13E FY14E FY15E.
Total current assets 442 405 409 417 OP margin 31.6% 29.9% 21.2% 19.5%Cash & cash eq. 102 98 100 102 EBITDA margin 34.1% 32.6% 24.0% 22.3%ST investments 174 178 181 185 Net profit margin 24.0% 17.7% 15.4% 14.2%
Receivables 54 56 58 59Other current asset 112 73 71 71 Sales growth - 1.7% 0.7% 5.9%
Total fixed assets 532 684 781 873 Operating profit growth - (3.9%) (28.7%) (2.6%)
Investments 454 505 593 676 EBITDA growth - (2.9%) (26.0%) (1.6%)Tangible assets 2 100 105 107 Net profit growth - (25.0%) (12.3%) (2.6%)
Intangible assets 5 8 11 17 EPS growth - (25.0%) (12.3%) (2.6%)Other long-term assets 71 72 72 73
Total assets 974 1,089 1,191 1,290 Sales per share (W) 41,141 41,838 42,123 44,611
BVPS (W) 60,329 67,728 74,214 80,529Total current liabilities 31 32 33 34
Accounts payable 21 21 22 22 Shares outstanding (m) 15 15 15 15
ST borrowings 0 0 0 0 Net treasury shares O/S (mn) 15 15 15 15Other current liabilities 10 11 11 12
Total LT liabilities 26 28 30 32 Payout ratio 0.0% 26.7% 22.8% 20.5%LT borrowings/bonds 7 7 7 7 Sales/assets (x) 1.3 0.6 0.6 0.5Other LT liabilities 19 21 23 25 Assets/equity (x) 1.1 1.1 1.1 1.1
Total liabilities 57 60 63 66 ROE 32.7% 11.6% 9.1% 8.2%Shareholder's equity 917 1,029 1,128 1,224 ROA 30.8% 10.9% 8.6% 7.7%Total liabilities and equity 974 1,089 1,191 1,290
Source: Company reports and J.P. Morgan estimates.
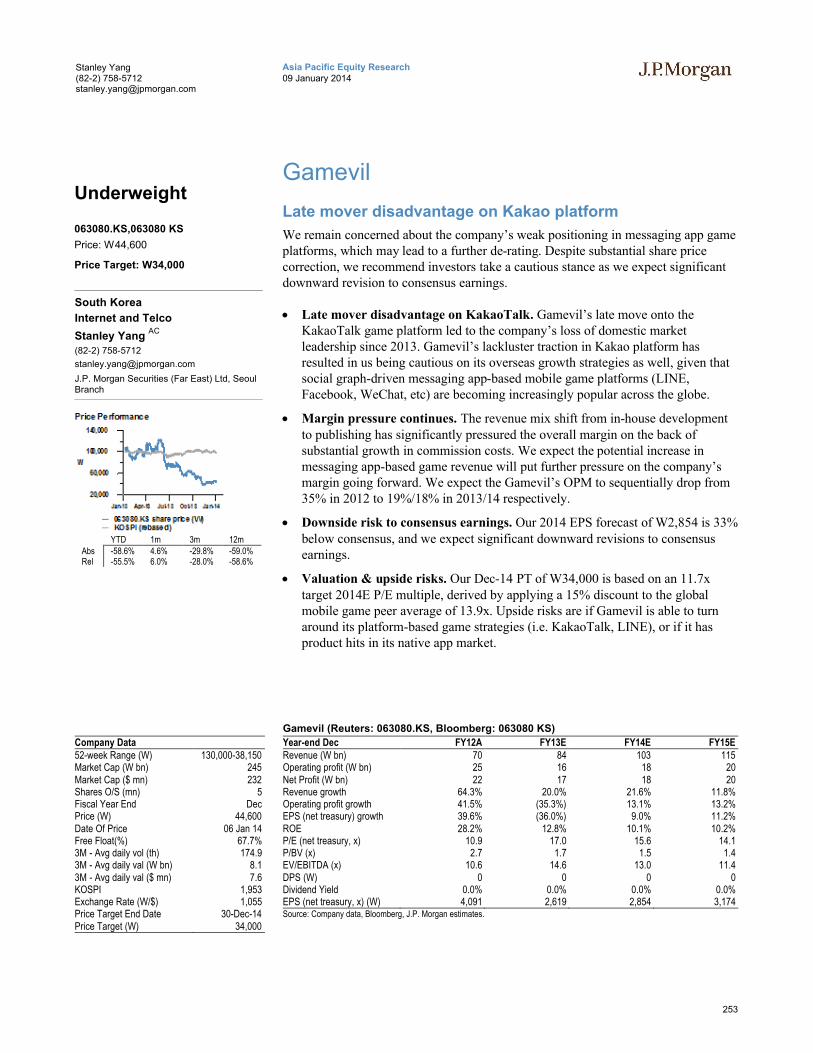
253
Asia Pacific Equity Research09 January 2014
Stanley Yang(82-2) [email protected]
Gamevil
Late mover disadvantage on Kakao platform
We remain concerned about the company’s weak positioning in messaging app game platforms, which may lead to a further de-rating. Despite substantial share price correction, we recommend investors take a cautious stance as we expect significant downward revision to consensus earnings.
Late mover disadvantage on KakaoTalk. Gamevil’s late move onto the KakaoTalk game platform led to the company’s loss of domestic market leadership since 2013. Gamevil’s lackluster traction in Kakao platform has resulted in us being cautious on its overseas growth strategies as well, given that social graph-driven messaging app-based mobile game platforms (LINE, Facebook, WeChat, etc) are becoming increasingly popular across the globe.
Margin pressure continues. The revenue mix shift from in-house development to publishing has significantly pressured the overall margin on the back of substantial growth in commission costs. We expect the potential increase in messaging app-based game revenue will put further pressure on the company’s margin going forward. We expect the Gamevil’s OPM to sequentially drop from 35% in 2012 to 19%/18% in 2013/14 respectively.
Downside risk to consensus earnings. Our 2014 EPS forecast of W2,854 is 33% below consensus, and we expect significant downward revisions to consensus earnings.
Valuation & upside risks. Our Dec-14 PT of W34,000 is based on an 11.7x target 2014E P/E multiple, derived by applying a 15% discount to the global mobile game peer average of 13.9x. Upside risks are if Gamevil is able to turn around its platform-based game strategies (i.e. KakaoTalk, LINE), or if it has product hits in its native app market.
Company Data52-week Range (W) 130,000-38,150Market Cap (W bn) 245Market Cap ($ mn) 232Shares O/S (mn) 5Fiscal Year End DecPrice (W) 44,600Date Of Price 06 Jan 14Free Float(%) 67.7%3M - Avg daily vol (th) 174.93M - Avg daily val (W bn) 8.13M - Avg daily val ($ mn) 7.6KOSPI 1,953Exchange Rate (W/$) 1,055Price Target End Date 30-Dec-14Price Target (W) 34,000
Gamevil (Reuters: 063080.KS, Bloomberg: 063080 KS)
Year-end Dec FY12A FY13E FY14E FY15ERevenue (W bn) 70 84 103 115Operating profit (W bn) 25 16 18 20Net Profit (W bn) 22 17 18 20Revenue growth 64.3% 20.0% 21.6% 11.8%Operating profit growth 41.5% (35.3%) 13.1% 13.2%EPS (net treasury) growth 39.6% (36.0%) 9.0% 11.2%ROE 28.2% 12.8% 10.1% 10.2%P/E (net treasury, x) 10.9 17.0 15.6 14.1P/BV (x) 2.7 1.7 1.5 1.4EV/EBITDA (x) 10.6 14.6 13.0 11.4DPS (W) 0 0 0 0Dividend Yield 0.0% 0.0% 0.0% 0.0%EPS (net treasury, x) (W) 4,091 2,619 2,854 3,174Source: Company data, Bloomberg, J.P. Morgan estimates.
Underweight
063080.KS,063080 KS
Price: W44,600
Price Target: W34,000
South Korea
Internet and Telco
Stanley Yang AC
(82-2) 758-5712
J.P. Morgan Securities (Far East) Ltd, Seoul Branch
YTD 1m 3m 12mAbs -58.6% 4.6% -29.8% -59.0%Rel -55.5% 6.0% -28.0% -58.6%
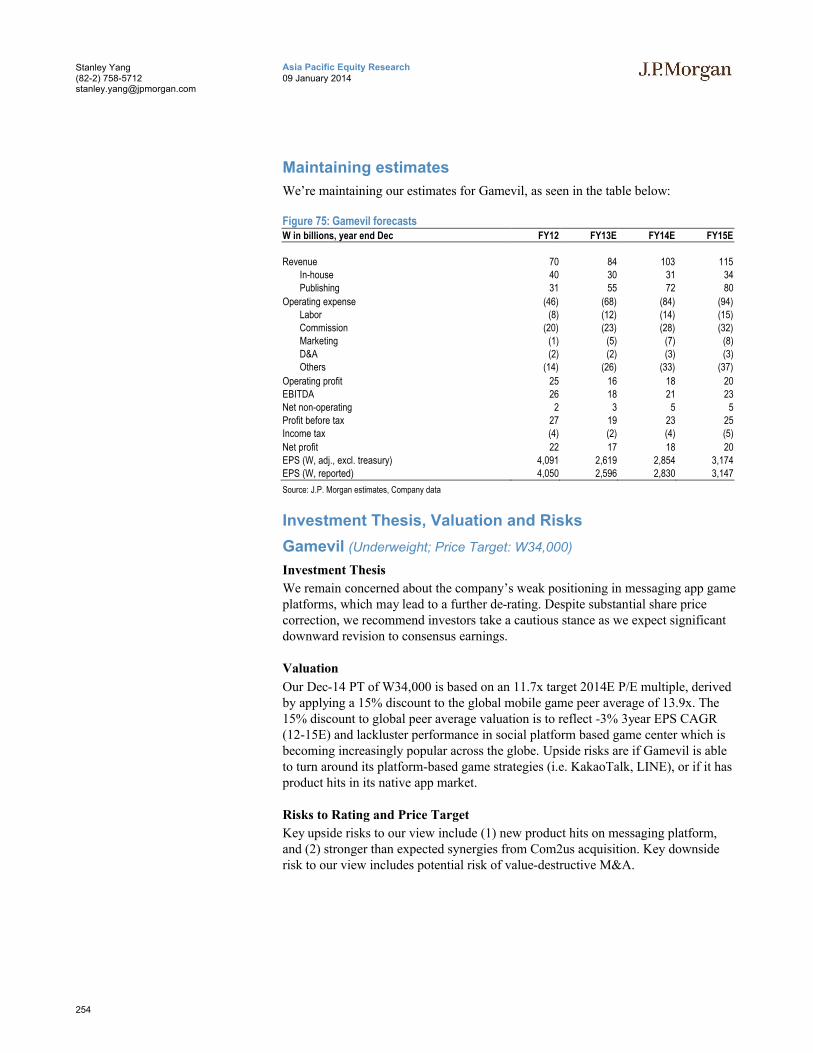
254
Asia Pacific Equity Research09 January 2014
Stanley Yang(82-2) [email protected]
Maintaining estimates
We’re maintaining our estimates for Gamevil, as seen in the table below:
Figure 75: Gamevil forecasts W in billions, year end Dec FY12 FY13E FY14E FY15E.Revenue 70 84 103 115
In-house 40 30 31 34Publishing 31 55 72 80
Operating expense (46) (68) (84) (94)Labor (8) (12) (14) (15)Commission (20) (23) (28) (32)Marketing (1) (5) (7) (8)D&A (2) (2) (3) (3)Others (14) (26) (33) (37)
Operating profit 25 16 18 20EBITDA 26 18 21 23Net non-operating 2 3 5 5Profit before tax 27 19 23 25Income tax (4) (2) (4) (5)
Net profit 22 17 18 20EPS (W, adj., excl. treasury) 4,091 2,619 2,854 3,174EPS (W, reported) 4,050 2,596 2,830 3,147
Source: J.P. Morgan estimates, Company data
Investment Thesis, Valuation and Risks
Gamevil (Underweight; Price Target: W34,000)
Investment Thesis
We remain concerned about the company’s weak positioning in messaging app game platforms, which may lead to a further de-rating. Despite substantial share price correction, we recommend investors take a cautious stance as we expect significant downward revision to consensus earnings.
Valuation
Our Dec-14 PT of W34,000 is based on an 11.7x target 2014E P/E multiple, derived by applying a 15% discount to the global mobile game peer average of 13.9x. The 15% discount to global peer average valuation is to reflect -3% 3year EPS CAGR (12-15E) and lackluster performance in social platform based game center which is becoming increasingly popular across the globe. Upside risks are if Gamevil is able to turn around its platform-based game strategies (i.e. KakaoTalk, LINE), or if it has product hits in its native app market.
Risks to Rating and Price Target
Key upside risks to our view include (1) new product hits on messaging platform, and (2) stronger than expected synergies from Com2us acquisition. Key downside risk to our view includes potential risk of value-destructive M&A.
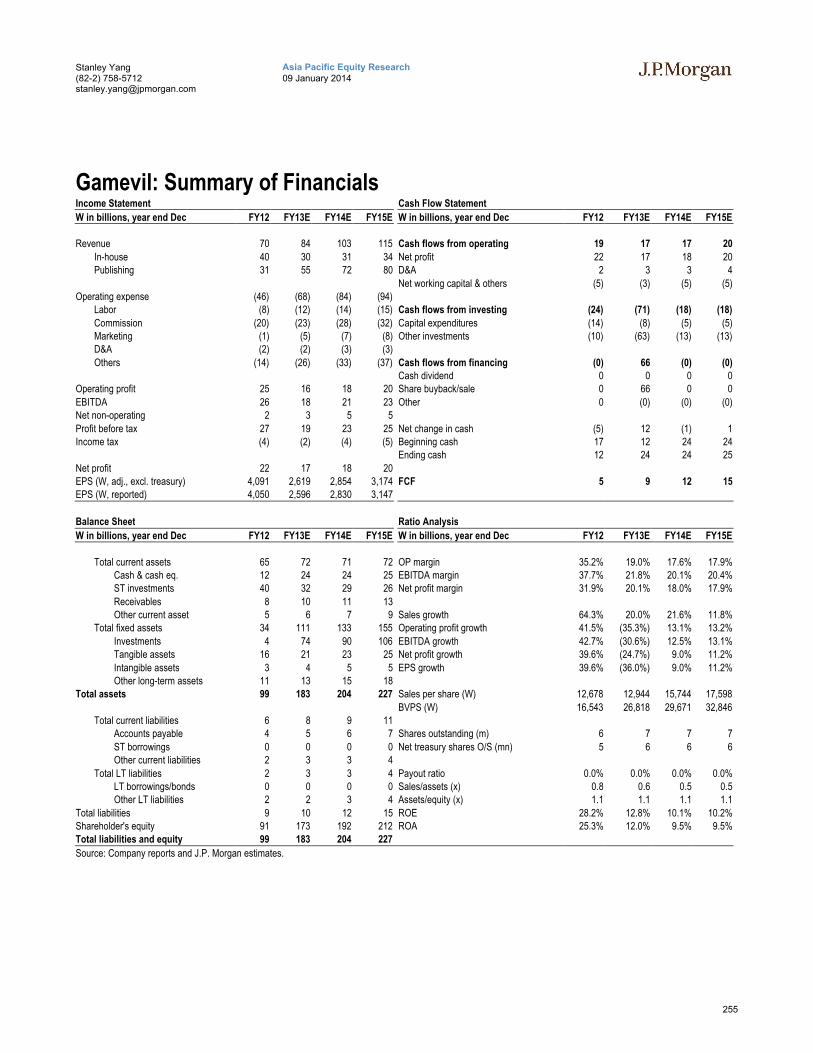
255
Asia Pacific Equity Research09 January 2014
Stanley Yang(82-2) [email protected]
Gamevil: Summary of FinancialsIncome Statement Cash Flow Statement
W in billions, year end Dec FY12 FY13E FY14E FY15E W in billions, year end Dec FY12 FY13E FY14E FY15E.Revenue 70 84 103 115 Cash flows from operating 19 17 17 20
In-house 40 30 31 34 Net profit 22 17 18 20Publishing 31 55 72 80 D&A 2 3 3 4
Net working capital & others (5) (3) (5) (5)Operating expense (46) (68) (84) (94)
Labor (8) (12) (14) (15) Cash flows from investing (24) (71) (18) (18)
Commission (20) (23) (28) (32) Capital expenditures (14) (8) (5) (5)Marketing (1) (5) (7) (8) Other investments (10) (63) (13) (13)D&A (2) (2) (3) (3)
Others (14) (26) (33) (37) Cash flows from financing (0) 66 (0) (0)Cash dividend 0 0 0 0
Operating profit 25 16 18 20 Share buyback/sale 0 66 0 0
EBITDA 26 18 21 23 Other 0 (0) (0) (0)Net non-operating 2 3 5 5
Profit before tax 27 19 23 25 Net change in cash (5) 12 (1) 1Income tax (4) (2) (4) (5) Beginning cash 17 12 24 24
Ending cash 12 24 24 25
Net profit 22 17 18 20EPS (W, adj., excl. treasury) 4,091 2,619 2,854 3,174 FCF 5 9 12 15EPS (W, reported) 4,050 2,596 2,830 3,147
.Balance Sheet Ratio Analysis
W in billions, year end Dec FY12 FY13E FY14E FY15E W in billions, year end Dec FY12 FY13E FY14E FY15E.
Total current assets 65 72 71 72 OP margin 35.2% 19.0% 17.6% 17.9%Cash & cash eq. 12 24 24 25 EBITDA margin 37.7% 21.8% 20.1% 20.4%ST investments 40 32 29 26 Net profit margin 31.9% 20.1% 18.0% 17.9%
Receivables 8 10 11 13Other current asset 5 6 7 9 Sales growth 64.3% 20.0% 21.6% 11.8%
Total fixed assets 34 111 133 155 Operating profit growth 41.5% (35.3%) 13.1% 13.2%
Investments 4 74 90 106 EBITDA growth 42.7% (30.6%) 12.5% 13.1%Tangible assets 16 21 23 25 Net profit growth 39.6% (24.7%) 9.0% 11.2%
Intangible assets 3 4 5 5 EPS growth 39.6% (36.0%) 9.0% 11.2%Other long-term assets 11 13 15 18
Total assets 99 183 204 227 Sales per share (W) 12,678 12,944 15,744 17,598
BVPS (W) 16,543 26,818 29,671 32,846Total current liabilities 6 8 9 11
Accounts payable 4 5 6 7 Shares outstanding (m) 6 7 7 7
ST borrowings 0 0 0 0 Net treasury shares O/S (mn) 5 6 6 6Other current liabilities 2 3 3 4
Total LT liabilities 2 3 3 4 Payout ratio 0.0% 0.0% 0.0% 0.0%LT borrowings/bonds 0 0 0 0 Sales/assets (x) 0.8 0.6 0.5 0.5Other LT liabilities 2 2 3 4 Assets/equity (x) 1.1 1.1 1.1 1.1
Total liabilities 9 10 12 15 ROE 28.2% 12.8% 10.1% 10.2%Shareholder's equity 91 173 192 212 ROA 25.3% 12.0% 9.5% 9.5%Total liabilities and equity 99 183 204 227
Source: Company reports and J.P. Morgan estimates.
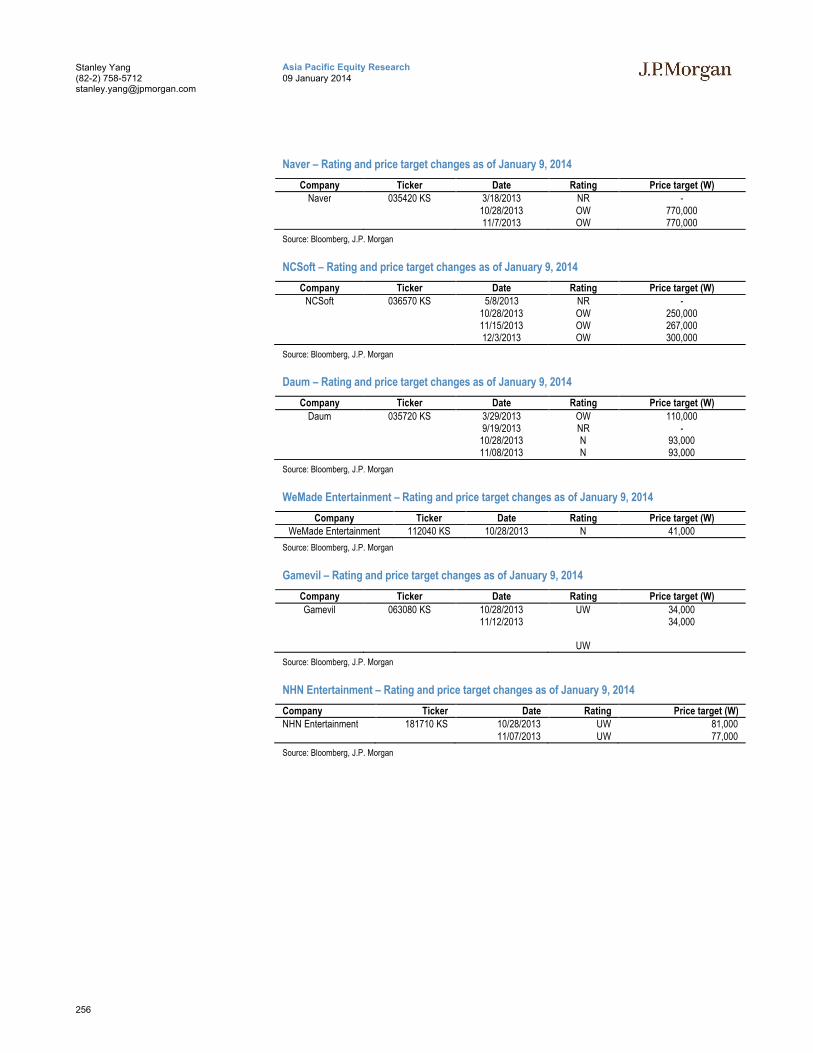
256
Asia Pacific Equity Research09 January 2014
Stanley Yang(82-2) [email protected]
Naver – Rating and price target changes as of January 9, 2014
Company Ticker Date Rating Price target (W)Naver 035420 KS 3/18/2013 NR -
10/28/2013 OW 770,00011/7/2013 OW 770,000
Source: Bloomberg, J.P. Morgan
NCSoft – Rating and price target changes as of January 9, 2014
Company Ticker Date Rating Price target (W)NCSoft 036570 KS 5/8/2013 NR -
10/28/2013 OW 250,00011/15/2013 OW 267,00012/3/2013 OW 300,000
Source: Bloomberg, J.P. Morgan
Daum – Rating and price target changes as of January 9, 2014
Company Ticker Date Rating Price target (W)
Daum 035720 KS 3/29/2013 OW 110,0009/19/2013 NR -
10/28/2013 N 93,00011/08/2013 N 93,000
Source: Bloomberg, J.P. Morgan
WeMade Entertainment – Rating and price target changes as of January 9, 2014
Company Ticker Date Rating Price target (W)WeMade Entertainment 112040 KS 10/28/2013 N 41,000
Source: Bloomberg, J.P. Morgan
Gamevil – Rating and price target changes as of January 9, 2014
Company Ticker Date Rating Price target (W)
Gamevil 063080 KS 10/28/2013 UW 34,00011/12/2013
UW
34,000
Source: Bloomberg, J.P. Morgan
NHN Entertainment – Rating and price target changes as of January 9, 2014
Company Ticker Date Rating Price target (W)NHN Entertainment 181710 KS 10/28/2013 UW 81,000
11/07/2013 UW 77,000
Source: Bloomberg, J.P. Morgan
Japan Equity Research09 January 2014
Japan Internet 2014 Outlook and ThemesE-commerce Market Entering Further Growth Phase
Japan
Games, Internet, Leisure
Haruka Mori AC
(81-3) 6736-8632
Bloomberg JPMA MORI <GO>
JPMorgan Securities Japan Co., Ltd.
Expect continued strong earnings momentum especially from e-commerce: While sector share prices may seem a bit overheated following their strong outperformance over the past six months, we expect continued strong growth momentum in the internet sector as monetization of smartphones ramps up and big data plays an increasing role. We like the e-commerce subsector, where we see a number of factors driving growth, namely Yahoo Japan’s new e-commerce strategy, and expect growth to accelerate and that is reflected in our top large-cap pick Yahoo Japan and top small-cap pick Askul. In addition, we expect some companies to enter a new growth stage by leveraging big data and other technologies to differentiate themselves.
Time to reap rewards from rapid dissemination of smartphones: Although the smartphone penetration rate in Japan has reached roughly 40-50%, with the exception of the mobile games subsector, which got off to an early start, we believe monetization of smartphone users has only just begun. The increase in the number of orders placed from smartphones is driving growth in the e-commerce market. We think the smartphone advertising market is still small and has sizable growth potential. Moreover, we think the online-to-offline (O2O) business and digital content other than mobile games bears close monitoring (We focus on DeNA (2432)'s new services such as educational content and apps that allows users to enjoy live performances).
Yahoo Japan (4689, OW; PT ¥600): Following the shift to an advertising income model, we expect the stock to gradually start pricing in the medium-term potential for e-commerce as investors confirm that growth in the number of store openings boosts product numbers, increases customer pulling power, and expands sales value. However, we expect smartphone advertising and YDN to drive stable growth for core advertising sales for the foreseeable future, and think the stock is very attractive from a risk/reward perspective.
Askul (2678, OW, PT ¥3,700): While valuations look demanding ad the share price appears to have risen on investor expectations, we think LOHACO will gradually start to benefit from Yahoo Japan’s initiatives (which will step up from early 2014) as faster growth in e-commerce provides a tailwind. Specifically, we note (1) benefits in terms of attracting customers, (2) the use of big data, and (3) growth in logistics volumes. We focus on this stock because we think it could be major beneficiary of Yahoo Japan’s new e-commerce strategy.

258
Japan Equity Research09 January 2014
Haruka Mori(81-3) [email protected]
Smartphones Are Changing the World
Smartphone market drivers transition from games to e-commerce to advertising
CyberAgent has greatest exposure to smartphones
CyberAgent has by far the largest exposure to smartphones among the companies in terms of sales. The company has a high exposure to the game market, which was an initial driver of smartphone monetization, and in the past two years has aggressively shifted to smartphone applications with good results to show for it. In smartphone advertising, the company boasts the largest share as an advertising agency business specialized on the Internet and should be well placed to benefit from market growth.
A general comparison of the companies is not possible because each company discloses different information, but in terms of usage (e.g., number of users), 30-40% of users’ access services through smartphones, a proportion largely based on the diffusion of smartphones. As for the internet advertising market, the PC market continues to deliver stable growth, while the scale of smartphone advertising is still limited in proportion to user usage activity.
Figure 76: Ratio of Smartphone Sales: CyberAgent More Exposed to Smartphone Market
19%29%
40%31%
46%40%
62% 61%
78%
45%
70%65%
0%
10%
20%
30%
40%
50%
60%
70%
80%
90%
100%
Ad
reve
nue
Mon
thly
PV
Dai
ly U
B
Kak
aku.
com
use
r
Tab
elog
use
r
uniq
ue u
ser
Con
solid
ated
reve
nue
Am
eba
SA
P
Inte
rnet
ad
Coi
n co
nsum
ptio
n
Coi
n co
nsum
ptio
n
Yahoo(Jul-Sep) Kakaku(Oct.) Gurunavi(12/12) CyberAgent(Jul-Sep) DeNA (Sep.)
GREE (Sep.)
smartphone others
Source: Company data, interviews, J.P. Morgan estimates
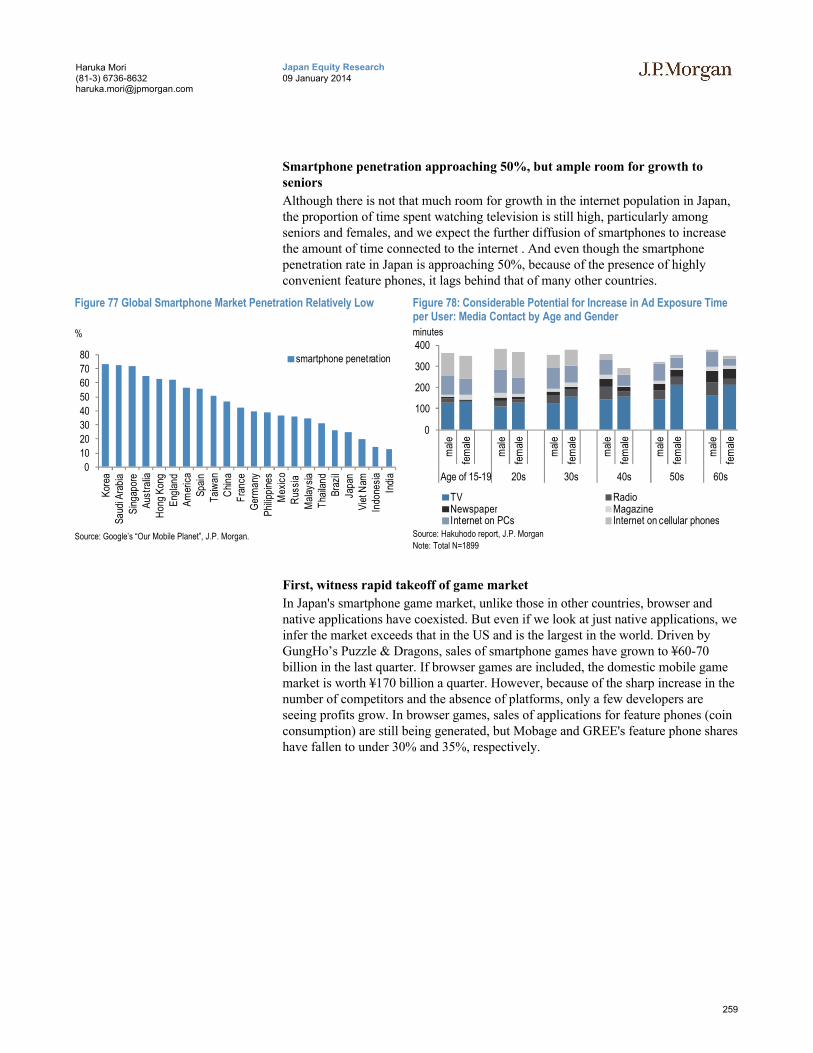
259
Japan Equity Research09 January 2014
Haruka Mori(81-3) [email protected]
Smartphone penetration approaching 50%, but ample room for growth to seniors
Although there is not that much room for growth in the internet population in Japan, the proportion of time spent watching television is still high, particularly among seniors and females, and we expect the further diffusion of smartphones to increase the amount of time connected to the internet . And even though the smartphone penetration rate in Japan is approaching 50%, because of the presence of highly convenient feature phones, it lags behind that of many other countries.
Figure 77 Global Smartphone Market Penetration Relatively Low
%
0
10
20
30
40
50
60
70
80
Kor
eaS
audi
Ara
bia
Sin
gapo
reA
ustr
alia
Hon
g K
ong
Eng
land
Am
eric
aS
pain
Tai
wan
Chi
naF
ranc
eG
erm
any
Phi
lippi
nes
Mex
ico
Rus
sia
Mal
aysi
aT
haila
ndB
razi
l
Japa
nV
iet N
amIn
done
sia
Indi
a
smartphone penetration
Source: Google’s “Our Mobile Planet”, J.P. Morgan.
Figure 78: Considerable Potential for Increase in Ad Exposure Time per User: Media Contact by Age and Genderminutes
0
100
200
300
400
mal
e
fem
ale
mal
e
fem
ale
mal
e
fem
ale
mal
e
fem
ale
mal
e
fem
ale
mal
e
fem
ale
Age of 15-19 20s 30s 40s 50s 60s
TV RadioNewspaper MagazineInternet on PCs Internet on cellular phones
Source: Hakuhodo report, J.P. Morgan
Note: Total N=1899
First, witness rapid takeoff of game market
In Japan's smartphone game market, unlike those in other countries, browser and native applications have coexisted. But even if we look at just native applications, we infer the market exceeds that in the US and is the largest in the world. Driven by GungHo’s Puzzle & Dragons, sales of smartphone games have grown to ¥60-70 billion in the last quarter. If browser games are included, the domestic mobile game market is worth ¥170 billion a quarter. However, because of the sharp increase in the number of competitors and the absence of platforms, only a few developers are seeing profits grow. In browser games, sales of applications for feature phones (coin consumption) are still being generated, but Mobage and GREE's feature phone shares have fallen to under 30% and 35%, respectively.
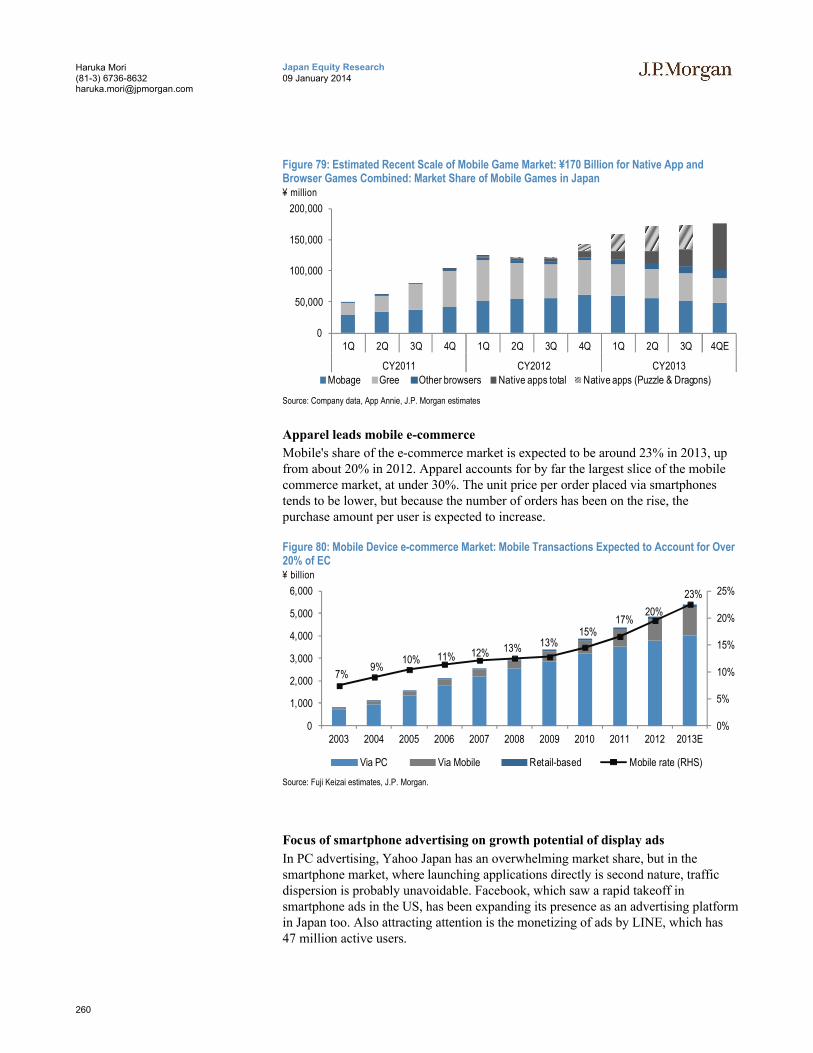
260
Japan Equity Research09 January 2014
Haruka Mori(81-3) [email protected]
Figure 79: Estimated Recent Scale of Mobile Game Market: ¥170 Billion for Native App and Browser Games Combined: Market Share of Mobile Games in Japan¥ million
0
50,000
100,000
150,000
200,000
1Q 2Q 3Q 4Q 1Q 2Q 3Q 4Q 1Q 2Q 3Q 4QE
CY2011 CY2012 CY2013
Mobage Gree Other browsers Native apps total Native apps (Puzzle & Dragons)
Source: Company data, App Annie, J.P. Morgan estimates
Apparel leads mobile e-commerce
Mobile's share of the e-commerce market is expected to be around 23% in 2013, upfrom about 20% in 2012. Apparel accounts for by far the largest slice of the mobile commerce market, at under 30%. The unit price per order placed via smartphones tends to be lower, but because the number of orders has been on the rise, the purchase amount per user is expected to increase.
Figure 80: Mobile Device e-commerce Market: Mobile Transactions Expected to Account for Over 20% of EC¥ billion
7%9%
10% 11% 12% 13% 13%15%
17%20%
23%
0%
5%
10%
15%
20%
25%
0
1,000
2,000
3,000
4,000
5,000
6,000
2003 2004 2005 2006 2007 2008 2009 2010 2011 2012 2013E
Via PC Via Mobile Retail-based Mobile rate (RHS)
Source: Fuji Keizai estimates, J.P. Morgan.
Focus of smartphone advertising on growth potential of display ads
In PC advertising, Yahoo Japan has an overwhelming market share, but in the smartphone market, where launching applications directly is second nature, traffic dispersion is probably unavoidable. Facebook, which saw a rapid takeoff in smartphone ads in the US, has been expanding its presence as an advertising platform in Japan too. Also attracting attention is the monetizing of ads by LINE, which has 47 million active users.
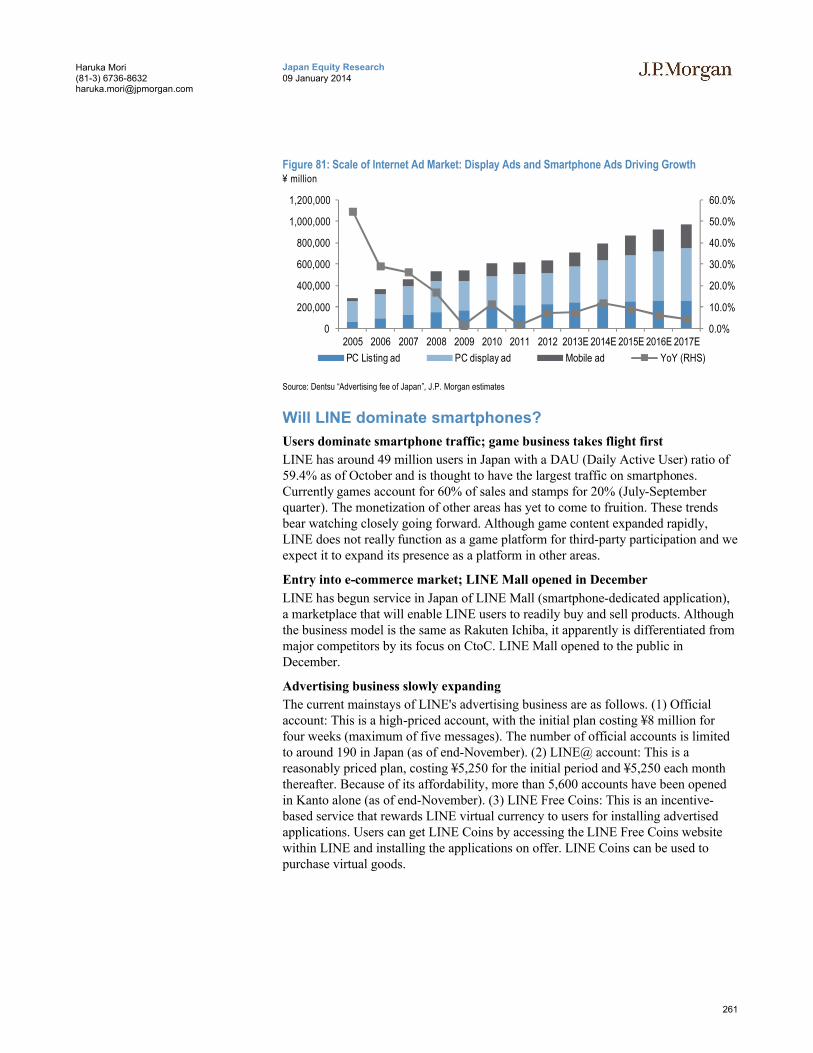
261
Japan Equity Research09 January 2014
Haruka Mori(81-3) [email protected]
Figure 81: Scale of Internet Ad Market: Display Ads and Smartphone Ads Driving Growth¥ million
0.0%
10.0%
20.0%
30.0%
40.0%
50.0%
60.0%
0
200,000
400,000
600,000
800,000
1,000,000
1,200,000
2005 2006 2007 2008 2009 2010 2011 2012 2013E 2014E 2015E 2016E 2017E
PC Listing ad PC display ad Mobile ad YoY (RHS)
Source: Dentsu “Advertising fee of Japan”, J.P. Morgan estimates
Will LINE dominate smartphones?
Users dominate smartphone traffic; game business takes flight first
LINE has around 49 million users in Japan with a DAU (Daily Active User) ratio of 59.4% as of October and is thought to have the largest traffic on smartphones. Currently games account for 60% of sales and stamps for 20% (July-September quarter). The monetization of other areas has yet to come to fruition. These trends bear watching closely going forward. Although game content expanded rapidly, LINE does not really function as a game platform for third-party participation and we expect it to expand its presence as a platform in other areas.
Entry into e-commerce market; LINE Mall opened in December
LINE has begun service in Japan of LINE Mall (smartphone-dedicated application),a marketplace that will enable LINE users to readily buy and sell products. Although the business model is the same as Rakuten Ichiba, it apparently is differentiated from major competitors by its focus on CtoC. LINE Mall opened to the public inDecember.
Advertising business slowly expanding
The current mainstays of LINE's advertising business are as follows. (1) Official account: This is a high-priced account, with the initial plan costing ¥8 million for four weeks (maximum of five messages). The number of official accounts is limited to around 190 in Japan (as of end-November). (2) LINE@ account: This is a reasonably priced plan, costing ¥5,250 for the initial period and ¥5,250 each month thereafter. Because of its affordability, more than 5,600 accounts have been opened in Kanto alone (as of end-November). (3) LINE Free Coins: This is an incentive-based service that rewards LINE virtual currency to users for installing advertised applications. Users can get LINE Coins by accessing the LINE Free Coins website within LINE and installing the applications on offer. LINE Coins can be used to purchase virtual goods.
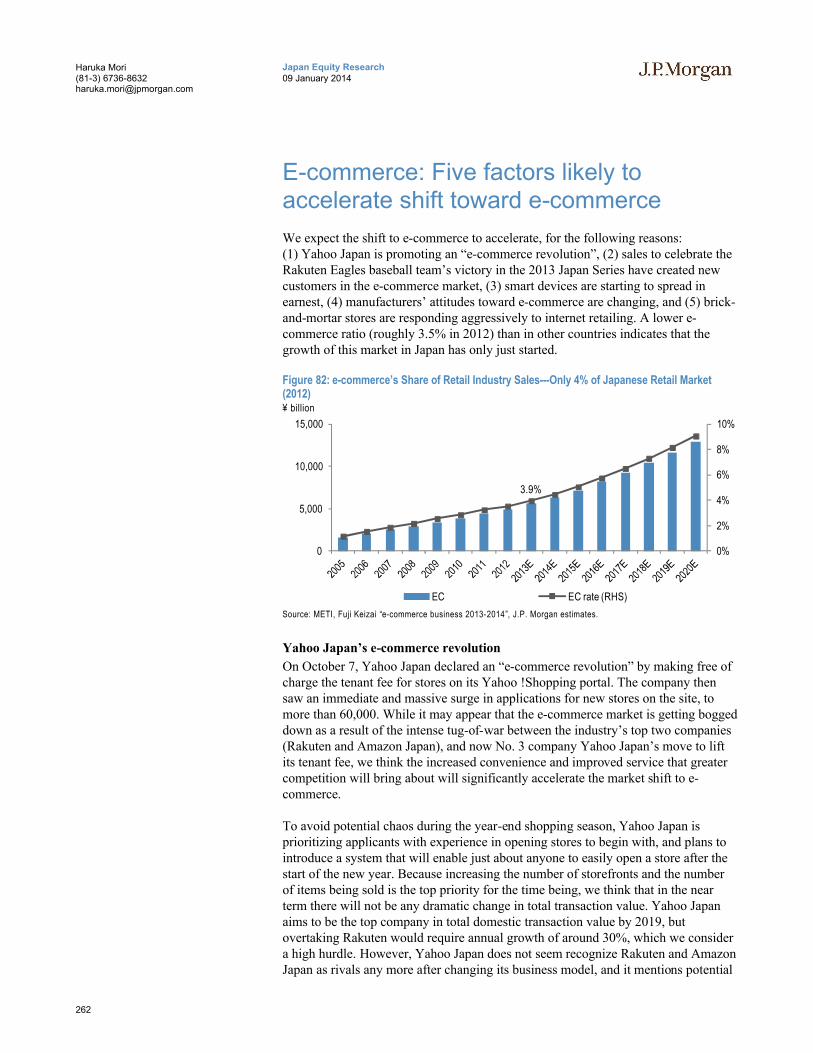
262
Japan Equity Research09 January 2014
Haruka Mori(81-3) [email protected]
E-commerce: Five factors likely to accelerate shift toward e-commerce
We expect the shift to e-commerce to accelerate, for the following reasons: (1) Yahoo Japan is promoting an “e-commerce revolution”, (2) sales to celebrate the Rakuten Eagles baseball team’s victory in the 2013 Japan Series have created new customers in the e-commerce market, (3) smart devices are starting to spread in earnest, (4) manufacturers’ attitudes toward e-commerce are changing, and (5) brick-and-mortar stores are responding aggressively to internet retailing. A lower e-commerce ratio (roughly 3.5% in 2012) than in other countries indicates that the growth of this market in Japan has only just started.
Figure 82: e-commerce’s Share of Retail Industry Sales---Only 4% of Japanese Retail Market(2012)¥ billion
3.9%
0%
2%
4%
6%
8%
10%
0
5,000
10,000
15,000
EC EC rate (RHS)
Source: METI, Fuji Keizai “e-commerce business 2013-2014”, J.P. Morgan estimates.
Yahoo Japan’s e-commerce revolution
On October 7, Yahoo Japan declared an “e-commerce revolution” by making free of charge the tenant fee for stores on its Yahoo !Shopping portal. The company then saw an immediate and massive surge in applications for new stores on the site, to more than 60,000. While it may appear that the e-commerce market is getting bogged down as a result of the intense tug-of-war between the industry’s top two companies (Rakuten and Amazon Japan), and now No. 3 company Yahoo Japan’s move to lift its tenant fee, we think the increased convenience and improved service that greater competition will bring about will significantly accelerate the market shift to e-commerce.
To avoid potential chaos during the year-end shopping season, Yahoo Japan is prioritizing applicants with experience in opening stores to begin with, and plans to introduce a system that will enable just about anyone to easily open a store after the start of the new year. Because increasing the number of storefronts and the number of items being sold is the top priority for the time being, we think that in the near term there will not be any dramatic change in total transaction value. Yahoo Japan aims to be the top company in total domestic transaction value by 2019, but overtaking Rakuten would require annual growth of around 30%, which we consider a high hurdle. However, Yahoo Japan does not seem recognize Rakuten and Amazon Japan as rivals any more after changing its business model, and it mentions potential
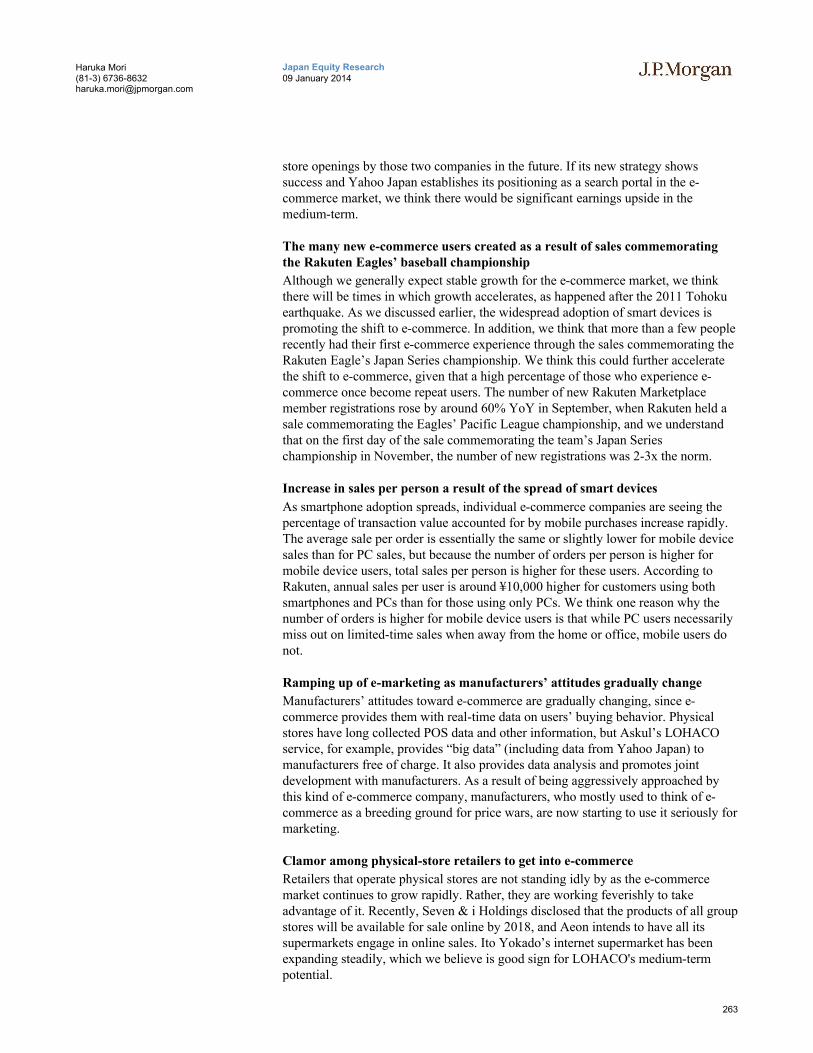
263
Japan Equity Research09 January 2014
Haruka Mori(81-3) [email protected]
store openings by those two companies in the future. If its new strategy shows success and Yahoo Japan establishes its positioning as a search portal in the e-commerce market, we think there would be significant earnings upside in the medium-term.
The many new e-commerce users created as a result of sales commemorating the Rakuten Eagles’ baseball championship
Although we generally expect stable growth for the e-commerce market, we think there will be times in which growth accelerates, as happened after the 2011 Tohoku earthquake. As we discussed earlier, the widespread adoption of smart devices is promoting the shift to e-commerce. In addition, we think that more than a few people recently had their first e-commerce experience through the sales commemorating the Rakuten Eagle’s Japan Series championship. We think this could further accelerate the shift to e-commerce, given that a high percentage of those who experience e-commerce once become repeat users. The number of new Rakuten Marketplace member registrations rose by around 60% YoY in September, when Rakuten held a sale commemorating the Eagles’ Pacific League championship, and we understand that on the first day of the sale commemorating the team’s Japan Series championship in November, the number of new registrations was 2-3x the norm.
Increase in sales per person a result of the spread of smart devices
As smartphone adoption spreads, individual e-commerce companies are seeing the percentage of transaction value accounted for by mobile purchases increase rapidly. The average sale per order is essentially the same or slightly lower for mobile device sales than for PC sales, but because the number of orders per person is higher for mobile device users, total sales per person is higher for these users. According to Rakuten, annual sales per user is around ¥10,000 higher for customers using both smartphones and PCs than for those using only PCs. We think one reason why the number of orders is higher for mobile device users is that while PC users necessarilymiss out on limited-time sales when away from the home or office, mobile users do not.
Ramping up of e-marketing as manufacturers’ attitudes gradually change
Manufacturers’ attitudes toward e-commerce are gradually changing, since e-commerce provides them with real-time data on users’ buying behavior. Physical stores have long collected POS data and other information, but Askul’s LOHACOservice, for example, provides “big data” (including data from Yahoo Japan) to manufacturers free of charge. It also provides data analysis and promotes joint development with manufacturers. As a result of being aggressively approached by this kind of e-commerce company, manufacturers, who mostly used to think of e-commerce as a breeding ground for price wars, are now starting to use it seriously for marketing.
Clamor among physical-store retailers to get into e-commerce
Retailers that operate physical stores are not standing idly by as the e-commerce market continues to grow rapidly. Rather, they are working feverishly to take advantage of it. Recently, Seven & i Holdings disclosed that the products of all group stores will be available for sale online by 2018, and Aeon intends to have all its supermarkets engage in online sales. Ito Yokado’s internet supermarket has been expanding steadily, which we believe is good sign for LOHACO's medium-term potential.
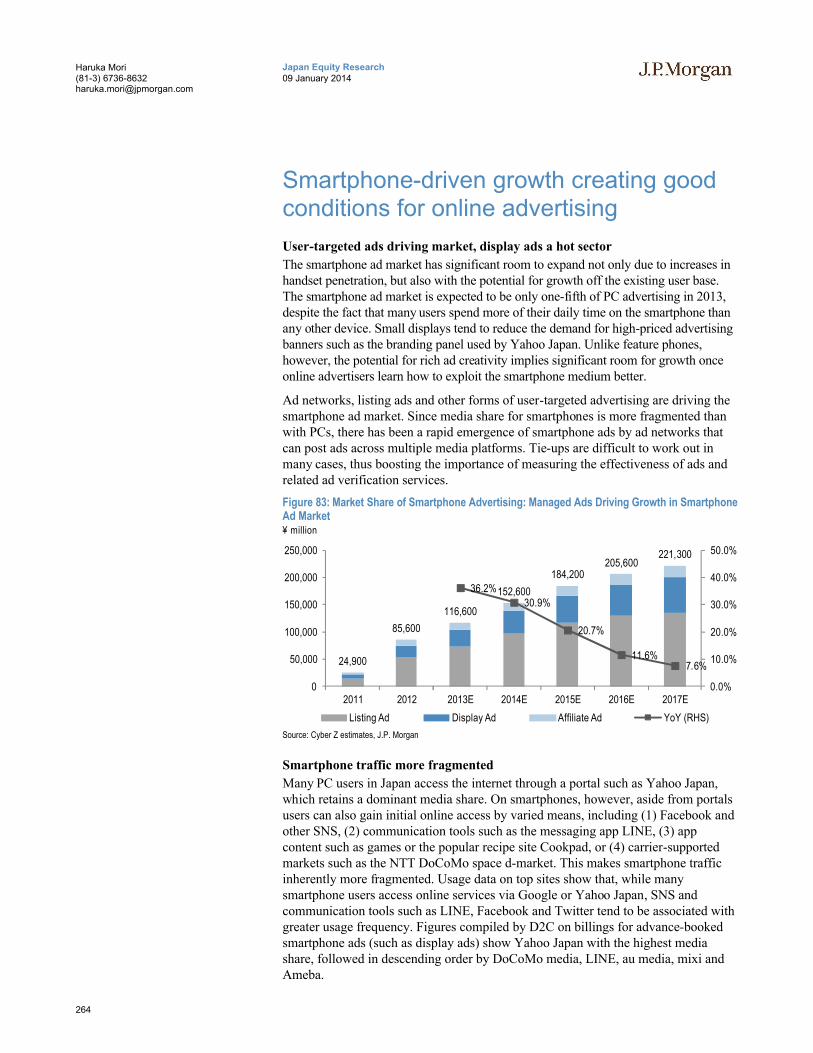
264
Japan Equity Research09 January 2014
Haruka Mori(81-3) [email protected]
Smartphone-driven growth creating good conditions for online advertising
User-targeted ads driving market, display ads a hot sector
The smartphone ad market has significant room to expand not only due to increases in handset penetration, but also with the potential for growth off the existing user base. The smartphone ad market is expected to be only one-fifth of PC advertising in 2013, despite the fact that many users spend more of their daily time on the smartphone than any other device. Small displays tend to reduce the demand for high-priced advertising banners such as the branding panel used by Yahoo Japan. Unlike feature phones, however, the potential for rich ad creativity implies significant room for growth once online advertisers learn how to exploit the smartphone medium better.
Ad networks, listing ads and other forms of user-targeted advertising are driving the smartphone ad market. Since media share for smartphones is more fragmented than with PCs, there has been a rapid emergence of smartphone ads by ad networks that can post ads across multiple media platforms. Tie-ups are difficult to work out in many cases, thus boosting the importance of measuring the effectiveness of ads and related ad verification services.
Figure 83: Market Share of Smartphone Advertising: Managed Ads Driving Growth in Smartphone Ad Market¥ million
24,900
85,600
116,600
152,600
184,200205,600
221,300
36.2%
30.9%
20.7%
11.6%7.6%
0.0%
10.0%
20.0%
30.0%
40.0%
50.0%
0
50,000
100,000
150,000
200,000
250,000
2011 2012 2013E 2014E 2015E 2016E 2017E
Listing Ad Display Ad Affiliate Ad YoY (RHS)
Source: Cyber Z estimates, J.P. Morgan
Smartphone traffic more fragmented
Many PC users in Japan access the internet through a portal such as Yahoo Japan, which retains a dominant media share. On smartphones, however, aside from portals users can also gain initial online access by varied means, including (1) Facebook and other SNS, (2) communication tools such as the messaging app LINE, (3) app content such as games or the popular recipe site Cookpad, or (4) carrier-supported markets such as the NTT DoCoMo space d-market. This makes smartphone traffic inherently more fragmented. Usage data on top sites show that, while many smartphone users access online services via Google or Yahoo Japan, SNS and communication tools such as LINE, Facebook and Twitter tend to be associated with greater usage frequency. Figures compiled by D2C on billings for advance-booked smartphone ads (such as display ads) show Yahoo Japan with the highest media share, followed in descending order by DoCoMo media, LINE, au media, mixi and Ameba.
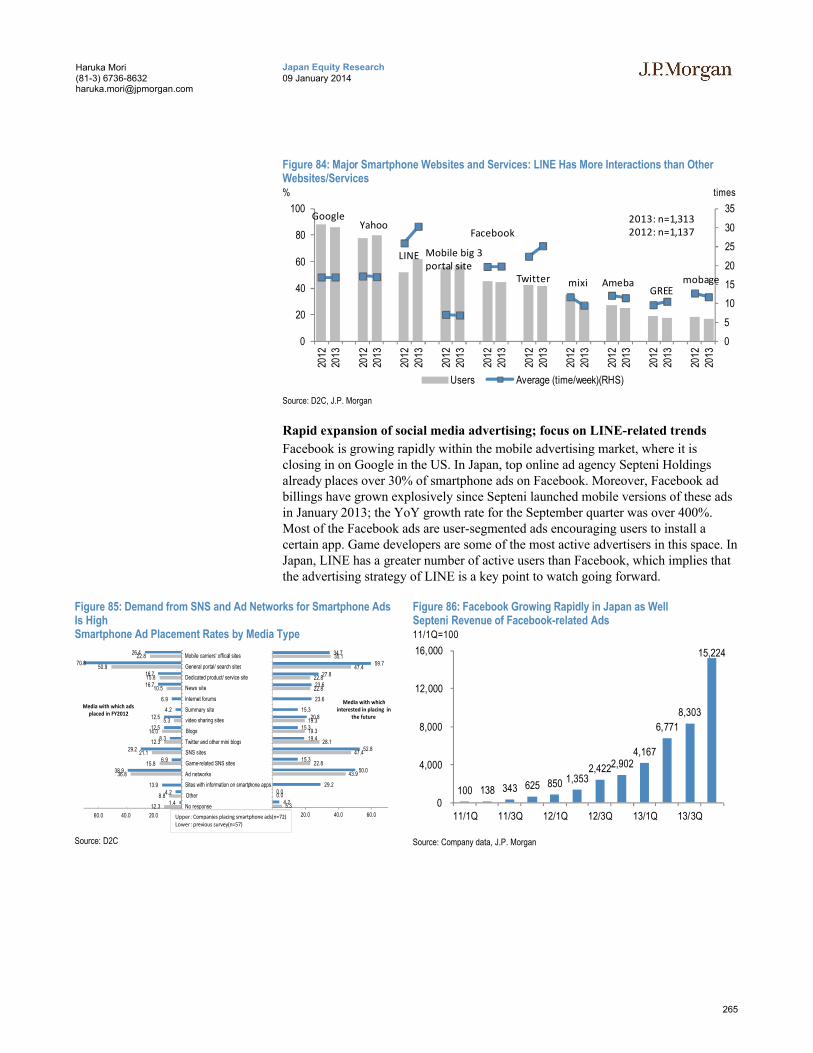
265
Japan Equity Research09 January 2014
Haruka Mori(81-3) [email protected]
Figure 84: Major Smartphone Websites and Services: LINE Has More Interactions than Other Websites/Services% times
0
5
10
15
20
25
30
35
0
20
40
60
80
100
2012
2013
2012
2013
2012
2013
2012
2013
2012
2013
2012
2013
2012
2013
2012
2013
2012
2013
2012
2013
Users Average (time/week)(RHS)
GoogleYahoo
LINE Mobile big 3 portal site
Twitter mixi AmebaGREE
mobage
2013: n=1,3132012: n=1,137
Source: D2C, J.P. Morgan
Rapid expansion of social media advertising; focus on LINE-related trends
Facebook is growing rapidly within the mobile advertising market, where it is closing in on Google in the US. In Japan, top online ad agency Septeni Holdings already places over 30% of smartphone ads on Facebook. Moreover, Facebook ad billings have grown explosively since Septeni launched mobile versions of these ads in January 2013; the YoY growth rate for the September quarter was over 400%. Most of the Facebook ads are user-segmented ads encouraging users to install a certain app. Game developers are some of the most active advertisers in this space. In Japan, LINE has a greater number of active users than Facebook, which implies that the advertising strategy of LINE is a key point to watch going forward.
Figure 85: Demand from SNS and Ad Networks for Smartphone Ads Is HighSmartphone Ad Placement Rates by Media Type
5.34.2
0.00.0
29.2
43.950.0
22.815.3
47.452.8
28.119.419.3
15.319.320.8
15.3
23.6
22.823.622.8
27.847.4
59.735.134.7
0.0 20.0 40.0 60.0
No response
Other
Sites with information on …
Ad networks
Game-related SNS sites
SNS sites
Twitter and other mini blogs
Blogs
video sharing sites
Summary site
Internet forums
News site
Dedicated product/ service site
General portal/ search sites
Mobile carriers' officail sites
Media with which interested in placing in
the future
12.31.4
8.84.2
13.9
36.838.9
15.86.9
21.129.2
12.38.3
14.012.5
5.312.5
4.2
6.9
10.516.715.816.7
50.970.8
22.826.4
0.020.040.060.0
No response
Other
Sites with information on smartphone apps
Ad networks
Game-related SNS sites
SNS sites
Twitter and other mini blogs
Blogs
video sharing sites
Summary site
Internet forums
News site
Dedicated product/ service site
General portal/ search sites
Mobile carriers' officail sites
Media with which ads placed in FY2012
Upper:Companies placing smartphone ads(n=72)Lower:previous survey(n=57)
Source: D2C
Figure 86: Facebook Growing Rapidly in Japan as WellSepteni Revenue of Facebook-related Ads11/1Q=100
100 138 343 625 850 1,353 2,422 2,902
4,167
6,771
8,303
15,224
0
4,000
8,000
12,000
16,000
11/1Q 11/3Q 12/1Q 12/3Q 13/1Q 13/3Q
Source: Company data, J.P. Morgan

266
Japan Equity Research09 January 2014
Haruka Mori(81-3) [email protected]
Yahoo Japan (4689)
Success of new e-commerce strategy unknown, but risk/reward balance looks reasonable
Investment opinion: Since the company’s announcement of its new e-commerce strategy on October 7, the market’s focus has shifted to its shopping operations. Wedo not see the strategy yielding results over the short term. We look for the medium-term potential of the e-commerce business (converted to an advertising revenue model emulating China Taobao) to be gradually priced in as the market confirms its progress, in the following order: (1) increase in store numbers, (2) increase in number of items offered, (3) improvement in customer traffic, and (4) increase in gross transaction value. We see no concerns about the first stage—an increase in store numbers—which is due to pick up after the New Year. But the true test of the strategy’s medium-term potential is what effect this will have on the number of items offered and customer traffic. Meanwhile, we think existing advertising business—the core component of its earnings—should show steady growth over the near term, driven by smartphone advertising and Yahoo Display Ad Network. Given expectations for more rapid growth in the e-commerce market and the risk/reward balance of its strategy, we see Yahoo Japan as an appealing investment.
Key points: We do not foresee any near-term changes in gross transaction value. Our focus will be on the following factors: (1) pace of new store openings after the launch of its new and more simple system in the new year (60,000 applications have already been received), (2) customer traffic in March—the next major shopping season after year-end—when last-minute demand before consumption tax will arise and major promotions are slated to be offered, (3) the number of items offered. Also of note is whether existing stores will respond to its strategy of eliminating store-opening fees for its shopping and auction websites and waiving sales royalties on its shopping site by offering customer reward programs or stepping up advertisement placement. According to the company management, more existing stores appear to be offering free shipping or awarding more loyalty points. On the other hand, there are some concerns about the impact of the surge in store numbers to traffic per store and site safety. In our view, the company’s technical expertise will be put to the test in these areas.
Medium-term outlook: We think there is no question that Yahoo Japan has significant medium-term growth potential in many areas given its status as Japan’s no. 1 portal site and ample cash flow. In the mainstay advertising business, expanding its share in the smart device ad market will be an issue for the medium term. But with its “Smart Device First” strategy driving a steady increase in traffic, we see no reason for excessive pessimism at this point. In the e-commerce business, assuming that Rakuten’s domestic e-commerce operations keep growing at the current pace, Yahoo Japan will need to grow transaction value by around 30% a year in order to catch up, which we think is a high hurdle. However, if this is achieved, we calculate it could boost advertising revenue by at least around ¥100bn in FY3/20 and make management’s plan to double operating profit from the FY3/12 level before 2020 more realistic.
Company DataPrice (¥) 585Date Of Price 07 Jan 14Market Cap (¥ bn) 3,364.08Shares O/S (mn) 5,75152-week Range (¥) 600-284TOPIX 1,283.25DPS (¥) 4.30Dividend Yield 0.7%ROE 20.6%
Yahoo Japan Corporation (Reuters: 4689.T, Bloomberg: 4689 JT)
2012/3 2013/3 2014/3 E 2015/3 E 2016/3 ESales (¥ bn) 302.1 343.0 391.4 421.8 461.7Operating Profit (¥ bn) 165.0 186.4 199.9 213.1 237.5Recurring Profit (¥ bn) 167.3 188.6 200.4 214.4 239.7Net Profit (¥ bn) 100.6 115.0 123.5 129.9 151.0EPS (¥) 17.5 20.0 21.5 22.6 26.3P/E (x) 33.5 29.2 27.2 25.9 22.3P/B (x) 7.2 6.1 5.1 4.4 3.8EV/EBITDA (x) 16.0 13.6 11.9 10.7 9.2Source: Company data, Bloomberg, J.P. Morgan estimates.
Overweight
4689.T,4689 JT
Price: ¥585
Price Target: ¥600
Japan
Games, Internet, Leisure
Haruka Mori AC
(81-3) 6736-8632
Bloomberg JPMA MORI <GO>
JPMorgan Securities Japan Co., Ltd.
250
350
450
550
¥
Jan-13 Apr-13 Jul-13 Oct-13 Jan-14
Price Performance
4689.T share price (¥)
TOPIX (rebased)
YTD 1m 3m 12mAbs 0.0% 10.4% 2.3% 103.1%Rel 1.5% 8.2% -9.5% 57.5%
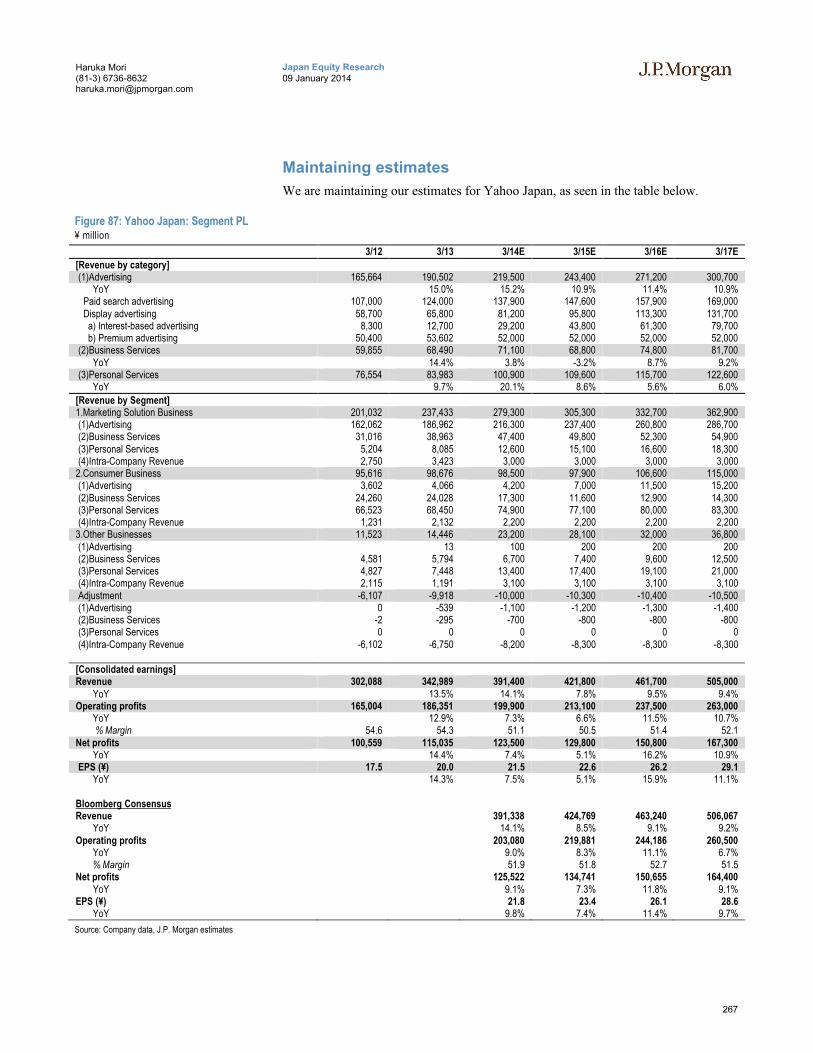
267
Japan Equity Research09 January 2014
Haruka Mori(81-3) [email protected]
Maintaining estimates
We are maintaining our estimates for Yahoo Japan, as seen in the table below.
Figure 87: Yahoo Japan: Segment PL¥ million
3/12 3/13 3/14E 3/15E 3/16E 3/17E
[Revenue by category](1)Advertising 165,664 190,502 219,500 243,400 271,200 300,700
YoY 15.0% 15.2% 10.9% 11.4% 10.9% Paid search advertising 107,000 124,000 137,900 147,600 157,900 169,000 Display advertising 58,700 65,800 81,200 95,800 113,300 131,700 a) Interest-based advertising 8,300 12,700 29,200 43,800 61,300 79,700 b) Premium advertising 50,400 53,602 52,000 52,000 52,000 52,000(2)Business Services 59,855 68,490 71,100 68,800 74,800 81,700
YoY 14.4% 3.8% -3.2% 8.7% 9.2%(3)Personal Services 76,554 83,983 100,900 109,600 115,700 122,600
YoY 9.7% 20.1% 8.6% 5.6% 6.0%
[Revenue by Segment]1.Marketing Solution Business 201,032 237,433 279,300 305,300 332,700 362,900(1)Advertising 162,062 186,962 216,300 237,400 260,800 286,700(2)Business Services 31,016 38,963 47,400 49,800 52,300 54,900(3)Personal Services 5,204 8,085 12,600 15,100 16,600 18,300(4)Intra-Company Revenue 2,750 3,423 3,000 3,000 3,000 3,000
2.Consumer Business 95,616 98,676 98,500 97,900 106,600 115,000(1)Advertising 3,602 4,066 4,200 7,000 11,500 15,200(2)Business Services 24,260 24,028 17,300 11,600 12,900 14,300(3)Personal Services 66,523 68,450 74,900 77,100 80,000 83,300(4)Intra-Company Revenue 1,231 2,132 2,200 2,200 2,200 2,200
3.Other Businesses 11,523 14,446 23,200 28,100 32,000 36,800(1)Advertising 13 100 200 200 200(2)Business Services 4,581 5,794 6,700 7,400 9,600 12,500(3)Personal Services 4,827 7,448 13,400 17,400 19,100 21,000(4)Intra-Company Revenue 2,115 1,191 3,100 3,100 3,100 3,100Adjustment -6,107 -9,918 -10,000 -10,300 -10,400 -10,500(1)Advertising 0 -539 -1,100 -1,200 -1,300 -1,400(2)Business Services -2 -295 -700 -800 -800 -800(3)Personal Services 0 0 0 0 0 0(4)Intra-Company Revenue -6,102 -6,750 -8,200 -8,300 -8,300 -8,300
[Consolidated earnings]Revenue 302,088 342,989 391,400 421,800 461,700 505,000 YoY 13.5% 14.1% 7.8% 9.5% 9.4%Operating profits 165,004 186,351 199,900 213,100 237,500 263,000 YoY 12.9% 7.3% 6.6% 11.5% 10.7% % Margin 54.6 54.3 51.1 50.5 51.4 52.1 Net profits 100,559 115,035 123,500 129,800 150,800 167,300 YoY 14.4% 7.4% 5.1% 16.2% 10.9%EPS (¥) 17.5 20.0 21.5 22.6 26.2 29.1
YoY 14.3% 7.5% 5.1% 15.9% 11.1%
Bloomberg ConsensusRevenue 391,338 424,769 463,240 506,067 YoY 14.1% 8.5% 9.1% 9.2%Operating profits 203,080 219,881 244,186 260,500 YoY 9.0% 8.3% 11.1% 6.7% % Margin 51.9 51.8 52.7 51.5Net profits 125,522 134,741 150,655 164,400 YoY 9.1% 7.3% 11.8% 9.1%EPS (¥) 21.8 23.4 26.1 28.6 YoY 9.8% 7.4% 11.4% 9.7%
Source: Company data, J.P. Morgan estimates
268
Japan Equity Research09 January 2014
Haruka Mori(81-3) [email protected]
Investment Thesis, Valuation and Risks
Investment thesis
While it will take some time before we see the impact of the new e-commerce strategy, we are optimistic regarding the advertising business and, amid expectations of accelerated growth in the EC market, we view the shares as very attractive from a risk/reward perspective.
Valuation
Our DCF-based December 2014 price target is ¥600. We assume a risk-free rate of 1%, market risk premium of 4.5%, beta of 1.2x, and terminal growth rate of 1.0%. Our price target corresponds to a P/E of 27x on our FY3/15 estimates.
Risks
Worse-than-expected advertising demand: While online ad prices are relatively less sensitive to macroeconomic trends, Yahoo Japan’s Brand Panel top page ads, the highest-priced form of advertisement, tend to be more sensitive. Also, a sharp downturn in the economy may reduce demand for advertising, which would have a negative impact. This would represent a downside risk factor for our investment rating.
Weak demand for smartphone ads: Yahoo Japan’s smartphone traffic has shown steady growth, but the growth of Google’s search share as Android devices gain wider usage and the rise of Facebook and other social media ads could hold back Yahoo Japan’s medium-term share growth. The rise of some other form of smartphone media could also keep the company from growing share as expected. This would represent a downside risk factor for our investment rating.
Failure of e-commerce strategy: If the company’s new e-commerce strategy fails, we think it would probably have limited impact on earnings, but could lower expectations for Yahoo’s medium-term growth and thereby push down valuations. This is a downside risk factor for our investment rating.
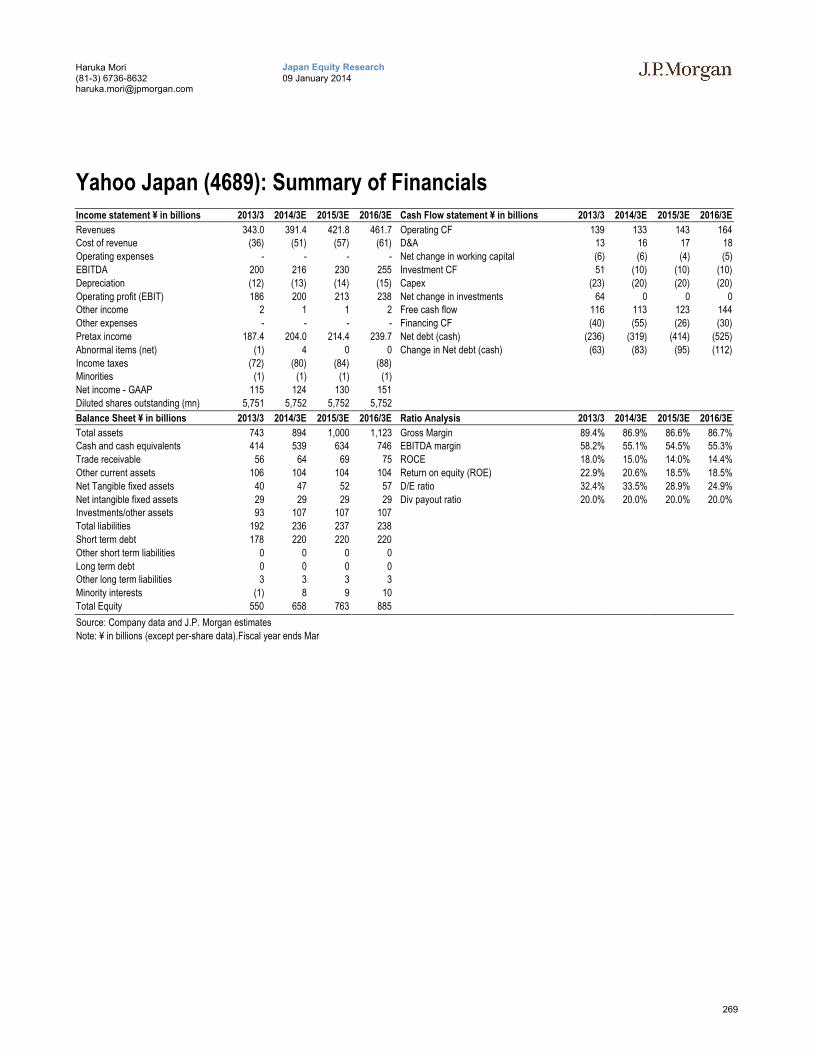
269
Japan Equity Research09 January 2014
Haruka Mori(81-3) [email protected]
Yahoo Japan (4689): Summary of FinancialsIncome statement ¥ in billions 2013/3 2014/3E 2015/3E 2016/3E Cash Flow statement ¥ in billions 2013/3 2014/3E 2015/3E 2016/3E
Revenues 343.0 391.4 421.8 461.7 Operating CF 139 133 143 164Cost of revenue (36) (51) (57) (61) D&A 13 16 17 18
Operating expenses - - - - Net change in working capital (6) (6) (4) (5)
EBITDA 200 216 230 255 Investment CF 51 (10) (10) (10)
Depreciation (12) (13) (14) (15) Capex (23) (20) (20) (20)
Operating profit (EBIT) 186 200 213 238 Net change in investments 64 0 0 0Other income 2 1 1 2 Free cash flow 116 113 123 144
Other expenses - - - - Financing CF (40) (55) (26) (30)
Pretax income 187.4 204.0 214.4 239.7 Net debt (cash) (236) (319) (414) (525)
Abnormal items (net) (1) 4 0 0 Change in Net debt (cash) (63) (83) (95) (112)
Income taxes (72) (80) (84) (88)Minorities (1) (1) (1) (1)
Net income - GAAP 115 124 130 151
Diluted shares outstanding (mn) 5,751 5,752 5,752 5,752
Balance Sheet ¥ in billions 2013/3 2014/3E 2015/3E 2016/3E Ratio Analysis 2013/3 2014/3E 2015/3E 2016/3E
Total assets 743 894 1,000 1,123 Gross Margin 89.4% 86.9% 86.6% 86.7%Cash and cash equivalents 414 539 634 746 EBITDA margin 58.2% 55.1% 54.5% 55.3%
Trade receivable 56 64 69 75 ROCE 18.0% 15.0% 14.0% 14.4%
Other current assets 106 104 104 104 Return on equity (ROE) 22.9% 20.6% 18.5% 18.5%
Net Tangible fixed assets 40 47 52 57 D/E ratio 32.4% 33.5% 28.9% 24.9%
Net intangible fixed assets 29 29 29 29 Div payout ratio 20.0% 20.0% 20.0% 20.0%Investments/other assets 93 107 107 107
Total liabilities 192 236 237 238
Short term debt 178 220 220 220
Other short term liabilities 0 0 0 0
Long term debt 0 0 0 0Other long term liabilities 3 3 3 3
Minority interests (1) 8 9 10
Total Equity 550 658 763 885
Source: Company data and J.P. Morgan estimates
Note: ¥ in billions (except per-share data).Fiscal year ends Mar
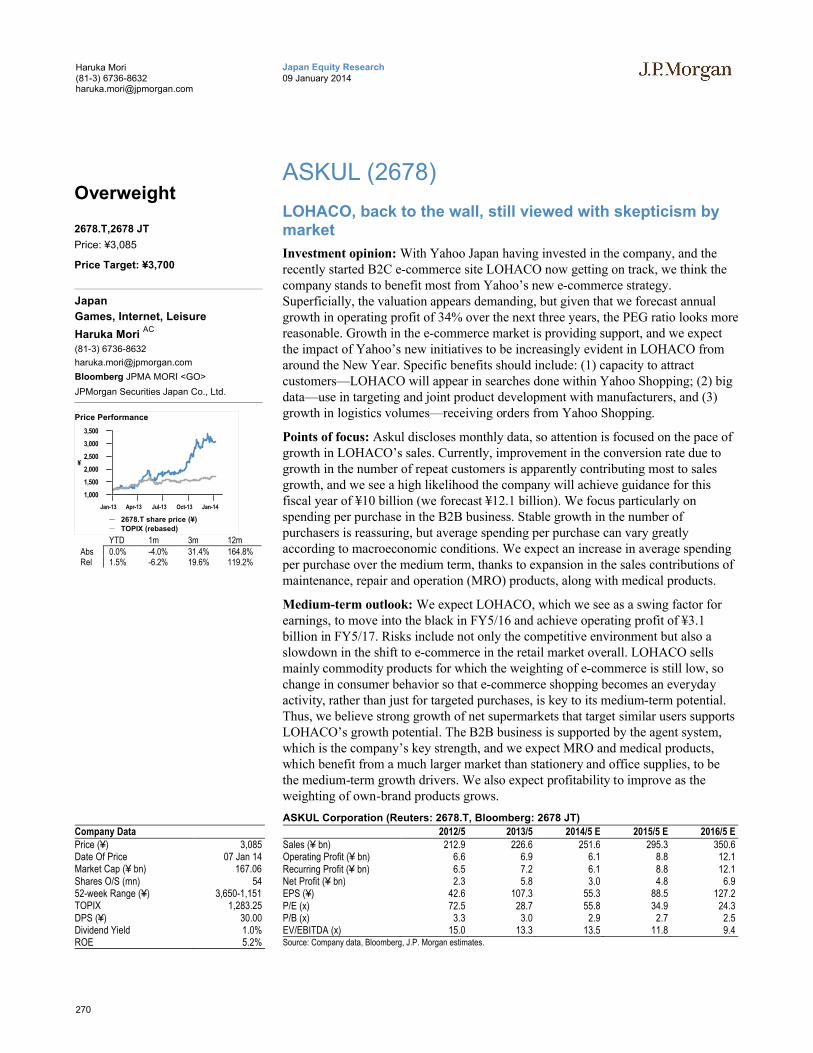
270
Japan Equity Research09 January 2014
Haruka Mori(81-3) [email protected]
ASKUL (2678)
LOHACO, back to the wall, still viewed with skepticism by market
Investment opinion: With Yahoo Japan having invested in the company, and the recently started B2C e-commerce site LOHACO now getting on track, we think the company stands to benefit most from Yahoo’s new e-commerce strategy. Superficially, the valuation appears demanding, but given that we forecast annual growth in operating profit of 34% over the next three years, the PEG ratio looks more reasonable. Growth in the e-commerce market is providing support, and we expect the impact of Yahoo’s new initiatives to be increasingly evident in LOHACO from around the New Year. Specific benefits should include: (1) capacity to attract customers—LOHACO will appear in searches done within Yahoo Shopping; (2) big data—use in targeting and joint product development with manufacturers, and (3) growth in logistics volumes—receiving orders from Yahoo Shopping.
Points of focus: Askul discloses monthly data, so attention is focused on the pace of growth in LOHACO’s sales. Currently, improvement in the conversion rate due to growth in the number of repeat customers is apparently contributing most to sales growth, and we see a high likelihood the company will achieve guidance for this fiscal year of ¥10 billion (we forecast ¥12.1 billion). We focus particularly on spending per purchase in the B2B business. Stable growth in the number of purchasers is reassuring, but average spending per purchase can vary greatly according to macroeconomic conditions. We expect an increase in average spending per purchase over the medium term, thanks to expansion in the sales contributions of maintenance, repair and operation (MRO) products, along with medical products.
Medium-term outlook: We expect LOHACO, which we see as a swing factor for earnings, to move into the black in FY5/16 and achieve operating profit of ¥3.1billion in FY5/17. Risks include not only the competitive environment but also a slowdown in the shift to e-commerce in the retail market overall. LOHACO sells mainly commodity products for which the weighting of e-commerce is still low, so change in consumer behavior so that e-commerce shopping becomes an everyday activity, rather than just for targeted purchases, is key to its medium-term potential. Thus, we believe strong growth of net supermarkets that target similar users supports LOHACO’s growth potential. The B2B business is supported by the agent system, which is the company’s key strength, and we expect MRO and medical products, which benefit from a much larger market than stationery and office supplies, to be the medium-term growth drivers. We also expect profitability to improve as the weighting of own-brand products grows.
Company DataPrice (¥) 3,085Date Of Price 07 Jan 14Market Cap (¥ bn) 167.06Shares O/S (mn) 5452-week Range (¥) 3,650-1,151TOPIX 1,283.25DPS (¥) 30.00Dividend Yield 1.0%ROE 5.2%
ASKUL Corporation (Reuters: 2678.T, Bloomberg: 2678 JT)
2012/5 2013/5 2014/5 E 2015/5 E 2016/5 ESales (¥ bn) 212.9 226.6 251.6 295.3 350.6Operating Profit (¥ bn) 6.6 6.9 6.1 8.8 12.1Recurring Profit (¥ bn) 6.5 7.2 6.1 8.8 12.1Net Profit (¥ bn) 2.3 5.8 3.0 4.8 6.9EPS (¥) 42.6 107.3 55.3 88.5 127.2P/E (x) 72.5 28.7 55.8 34.9 24.3P/B (x) 3.3 3.0 2.9 2.7 2.5EV/EBITDA (x) 15.0 13.3 13.5 11.8 9.4Source: Company data, Bloomberg, J.P. Morgan estimates.
Overweight
2678.T,2678 JT
Price: ¥3,085
Price Target: ¥3,700
Japan
Games, Internet, Leisure
Haruka Mori AC
(81-3) 6736-8632
Bloomberg JPMA MORI <GO>
JPMorgan Securities Japan Co., Ltd.
1,000
1,500
2,000
2,500
3,000
3,500
¥
Jan-13 Apr-13 Jul-13 Oct-13 Jan-14
Price Performance
2678.T share price (¥)
TOPIX (rebased)
YTD 1m 3m 12mAbs 0.0% -4.0% 31.4% 164.8%Rel 1.5% -6.2% 19.6% 119.2%
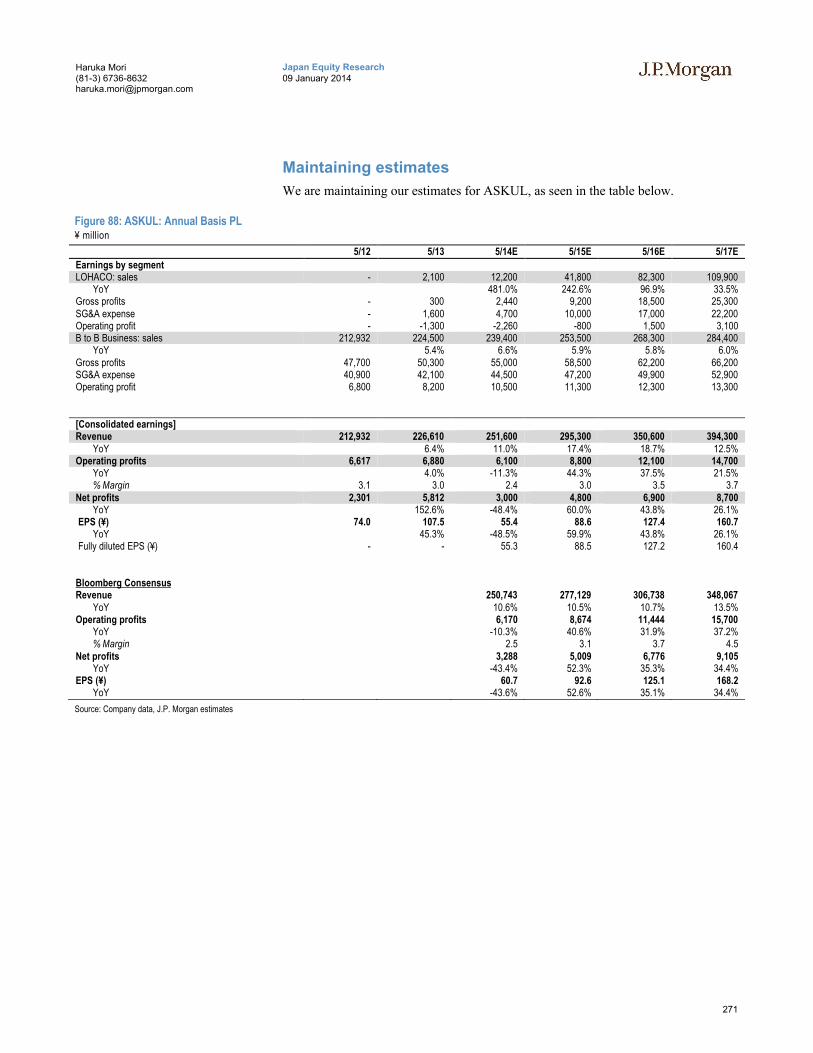
271
Japan Equity Research09 January 2014
Haruka Mori(81-3) [email protected]
Maintaining estimates
We are maintaining our estimates for ASKUL, as seen in the table below.
Figure 88: ASKUL: Annual Basis PL¥ million
5/12 5/13 5/14E 5/15E 5/16E 5/17E
Earnings by segmentLOHACO: sales - 2,100 12,200 41,800 82,300 109,900 YoY 481.0% 242.6% 96.9% 33.5%Gross profits - 300 2,440 9,200 18,500 25,300SG&A expense - 1,600 4,700 10,000 17,000 22,200Operating profit - -1,300 -2,260 -800 1,500 3,100B to B Business: sales 212,932 224,500 239,400 253,500 268,300 284,400 YoY 5.4% 6.6% 5.9% 5.8% 6.0%Gross profits 47,700 50,300 55,000 58,500 62,200 66,200SG&A expense 40,900 42,100 44,500 47,200 49,900 52,900Operating profit 6,800 8,200 10,500 11,300 12,300 13,300
[Consolidated earnings]Revenue 212,932 226,610 251,600 295,300 350,600 394,300 YoY 6.4% 11.0% 17.4% 18.7% 12.5%Operating profits 6,617 6,880 6,100 8,800 12,100 14,700 YoY 4.0% -11.3% 44.3% 37.5% 21.5% % Margin 3.1 3.0 2.4 3.0 3.5 3.7Net profits 2,301 5,812 3,000 4,800 6,900 8,700 YoY 152.6% -48.4% 60.0% 43.8% 26.1%EPS (¥) 74.0 107.5 55.4 88.6 127.4 160.7
YoY 45.3% -48.5% 59.9% 43.8% 26.1%Fully diluted EPS (¥) - - 55.3 88.5 127.2 160.4
Bloomberg ConsensusRevenue 250,743 277,129 306,738 348,067 YoY 10.6% 10.5% 10.7% 13.5%Operating profits 6,170 8,674 11,444 15,700 YoY -10.3% 40.6% 31.9% 37.2% % Margin 2.5 3.1 3.7 4.5Net profits 3,288 5,009 6,776 9,105 YoY -43.4% 52.3% 35.3% 34.4%EPS (¥) 60.7 92.6 125.1 168.2 YoY -43.6% 52.6% 35.1% 34.4%
Source: Company data, J.P. Morgan estimates
272
Japan Equity Research09 January 2014
Haruka Mori(81-3) [email protected]
Investment Thesis, Valuation and Risks
Investment thesis
The stock market still doubts the medium-term potential of LOHACO. However, it could benefit the most from Yahoo Japan’s EC revolution, and we think growth that outpaces market expectations is achievable.
Valuation
Our DCF-based December 2014 price target is ¥3,700. We assume a risk-free rate of 1%, market risk premium of 4.5%, beta of 1.2x, and terminal growth rate of 1.0%. Our price target corresponds to a P/E of 42x on our FY5/15 estimates.
Risks
Slowdown for LOHACO and consequent expansion in losses: LOHACO’s sales have continued to expand steadily, and cooperation with Yahoo should be positive, but if sales were to slow sooner than expected, there would be a risk that deterioration in the outlook combined with increased spending on promotional activities could cause losses to expand, and this would represent a downside risk to our investment opinion.
Slump in B2B business because of rapid deterioration in macroeconomic environment: The B2B business is vulnerable to economic conditions, mainly in the core office supplies direct marketing business, so marked economic slowdown could depress earnings. This would be a downside risk to our investment opinion.
Marked deterioration in competitive environment: Decline in market share due to aggressive pricing strategies by competitions could force the company to lower prices in both the B2C and B2B businesses. This would be a downside risk to our investment opinion.
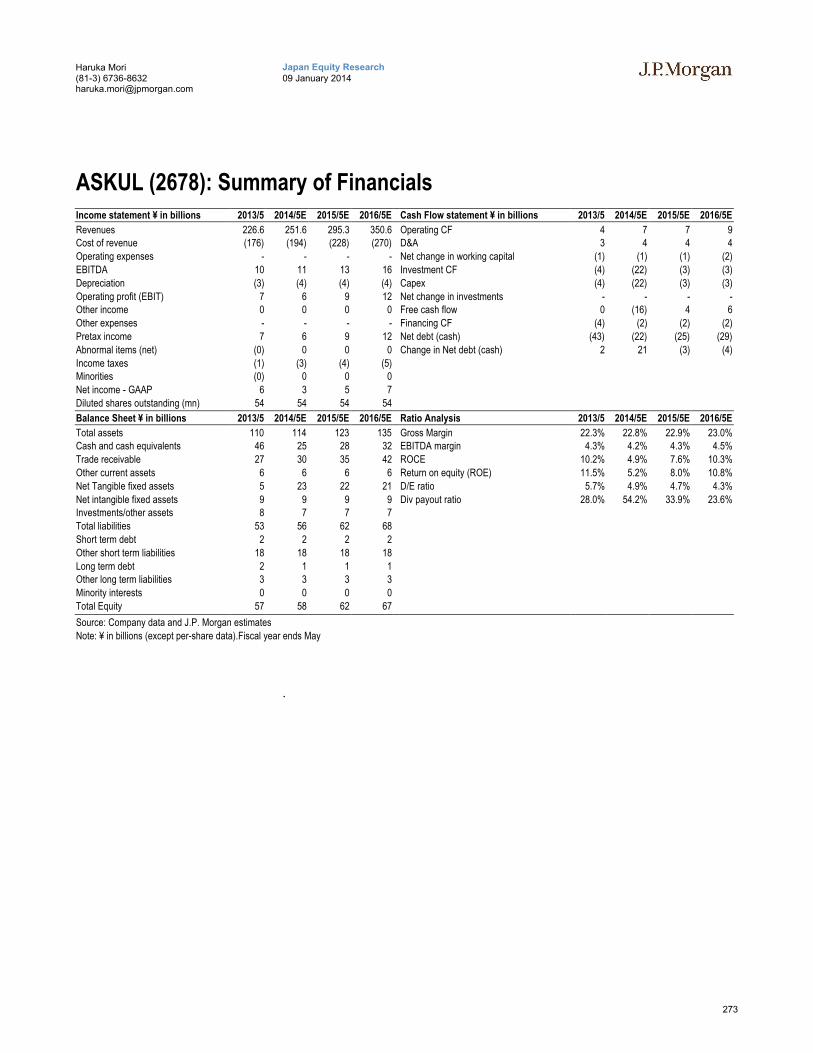
273
Japan Equity Research09 January 2014
Haruka Mori(81-3) [email protected]
ASKUL (2678): Summary of FinancialsIncome statement ¥ in billions 2013/5 2014/5E 2015/5E 2016/5E Cash Flow statement ¥ in billions 2013/5 2014/5E 2015/5E 2016/5E
Revenues 226.6 251.6 295.3 350.6 Operating CF 4 7 7 9Cost of revenue (176) (194) (228) (270) D&A 3 4 4 4
Operating expenses - - - - Net change in working capital (1) (1) (1) (2)
EBITDA 10 11 13 16 Investment CF (4) (22) (3) (3)
Depreciation (3) (4) (4) (4) Capex (4) (22) (3) (3)
Operating profit (EBIT) 7 6 9 12 Net change in investments - - - -Other income 0 0 0 0 Free cash flow 0 (16) 4 6
Other expenses - - - - Financing CF (4) (2) (2) (2)
Pretax income 7 6 9 12 Net debt (cash) (43) (22) (25) (29)
Abnormal items (net) (0) 0 0 0 Change in Net debt (cash) 2 21 (3) (4)
Income taxes (1) (3) (4) (5)Minorities (0) 0 0 0
Net income - GAAP 6 3 5 7
Diluted shares outstanding (mn) 54 54 54 54
Balance Sheet ¥ in billions 2013/5 2014/5E 2015/5E 2016/5E Ratio Analysis 2013/5 2014/5E 2015/5E 2016/5E
Total assets 110 114 123 135 Gross Margin 22.3% 22.8% 22.9% 23.0%Cash and cash equivalents 46 25 28 32 EBITDA margin 4.3% 4.2% 4.3% 4.5%
Trade receivable 27 30 35 42 ROCE 10.2% 4.9% 7.6% 10.3%
Other current assets 6 6 6 6 Return on equity (ROE) 11.5% 5.2% 8.0% 10.8%
Net Tangible fixed assets 5 23 22 21 D/E ratio 5.7% 4.9% 4.7% 4.3%
Net intangible fixed assets 9 9 9 9 Div payout ratio 28.0% 54.2% 33.9% 23.6%Investments/other assets 8 7 7 7
Total liabilities 53 56 62 68
Short term debt 2 2 2 2
Other short term liabilities 18 18 18 18
Long term debt 2 1 1 1Other long term liabilities 3 3 3 3
Minority interests 0 0 0 0
Total Equity 57 58 62 67
Source: Company data and J.P. Morgan estimates
Note: ¥ in billions (except per-share data).Fiscal year ends May
.
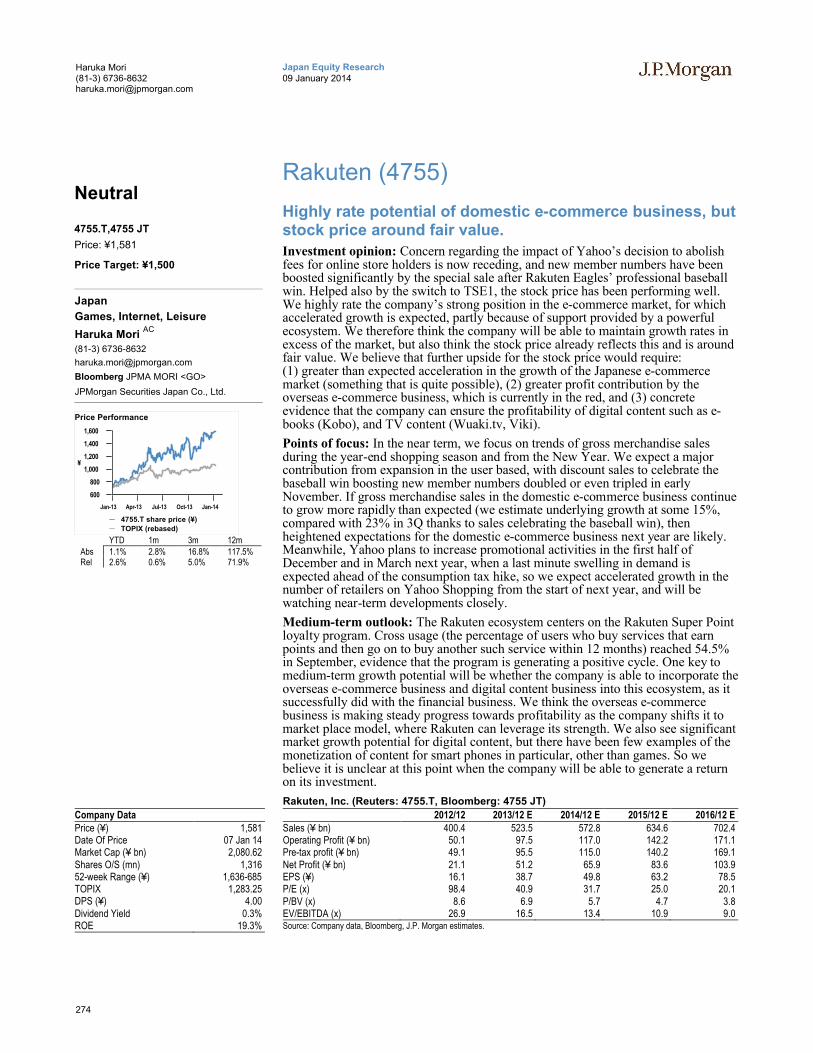
274
Japan Equity Research09 January 2014
Haruka Mori(81-3) [email protected]
Rakuten (4755)
Highly rate potential of domestic e-commerce business, but stock price around fair value.
Investment opinion: Concern regarding the impact of Yahoo’s decision to abolish fees for online store holders is now receding, and new member numbers have been boosted significantly by the special sale after Rakuten Eagles’ professional baseball win. Helped also by the switch to TSE1, the stock price has been performing well.We highly rate the company’s strong position in the e-commerce market, for which accelerated growth is expected, partly because of support provided by a powerful ecosystem. We therefore think the company will be able to maintain growth rates in excess of the market, but also think the stock price already reflects this and is around fair value. We believe that further upside for the stock price would require:(1) greater than expected acceleration in the growth of the Japanese e-commerce market (something that is quite possible), (2) greater profit contribution by the overseas e-commerce business, which is currently in the red, and (3) concrete evidence that the company can ensure the profitability of digital content such as e-books (Kobo), and TV content (Wuaki.tv, Viki).
Points of focus: In the near term, we focus on trends of gross merchandise sales during the year-end shopping season and from the New Year. We expect a major contribution from expansion in the user based, with discount sales to celebrate the baseball win boosting new member numbers doubled or even tripled in early November. If gross merchandise sales in the domestic e-commerce business continue to grow more rapidly than expected (we estimate underlying growth at some 15%, compared with 23% in 3Q thanks to sales celebrating the baseball win), then heightened expectations for the domestic e-commerce business next year are likely. Meanwhile, Yahoo plans to increase promotional activities in the first half of December and in March next year, when a last minute swelling in demand is expected ahead of the consumption tax hike, so we expect accelerated growth in the number of retailers on Yahoo Shopping from the start of next year, and will be watching near-term developments closely.
Medium-term outlook: The Rakuten ecosystem centers on the Rakuten Super Point loyalty program. Cross usage (the percentage of users who buy services that earn points and then go on to buy another such service within 12 months) reached 54.5% in September, evidence that the program is generating a positive cycle. One key to medium-term growth potential will be whether the company is able to incorporate the overseas e-commerce business and digital content business into this ecosystem, as it successfully did with the financial business. We think the overseas e-commerce business is making steady progress towards profitability as the company shifts it to market place model, where Rakuten can leverage its strength. We also see significant market growth potential for digital content, but there have been few examples of the monetization of content for smart phones in particular, other than games. So we believe it is unclear at this point when the company will be able to generate a return on its investment.
Company DataPrice (¥) 1,581Date Of Price 07 Jan 14Market Cap (¥ bn) 2,080.62Shares O/S (mn) 1,31652-week Range (¥) 1,636-685TOPIX 1,283.25DPS (¥) 4.00Dividend Yield 0.3%ROE 19.3%
Rakuten, Inc. (Reuters: 4755.T, Bloomberg: 4755 JT)
2012/12 2013/12 E 2014/12 E 2015/12 E 2016/12 ESales (¥ bn) 400.4 523.5 572.8 634.6 702.4Operating Profit (¥ bn) 50.1 97.5 117.0 142.2 171.1Pre-tax profit (¥ bn) 49.1 95.5 115.0 140.2 169.1Net Profit (¥ bn) 21.1 51.2 65.9 83.6 103.9EPS (¥) 16.1 38.7 49.8 63.2 78.5P/E (x) 98.4 40.9 31.7 25.0 20.1P/BV (x) 8.6 6.9 5.7 4.7 3.8EV/EBITDA (x) 26.9 16.5 13.4 10.9 9.0Source: Company data, Bloomberg, J.P. Morgan estimates.
Neutral
4755.T,4755 JT
Price: ¥1,581
Price Target: ¥1,500
Japan
Games, Internet, Leisure
Haruka Mori AC
(81-3) 6736-8632
Bloomberg JPMA MORI <GO>
JPMorgan Securities Japan Co., Ltd.
600
800
1,000
1,200
1,400
1,600
¥
Jan-13 Apr-13 Jul-13 Oct-13 Jan-14
Price Performance
4755.T share price (¥)
TOPIX (rebased)
YTD 1m 3m 12mAbs 1.1% 2.8% 16.8% 117.5%Rel 2.6% 0.6% 5.0% 71.9%
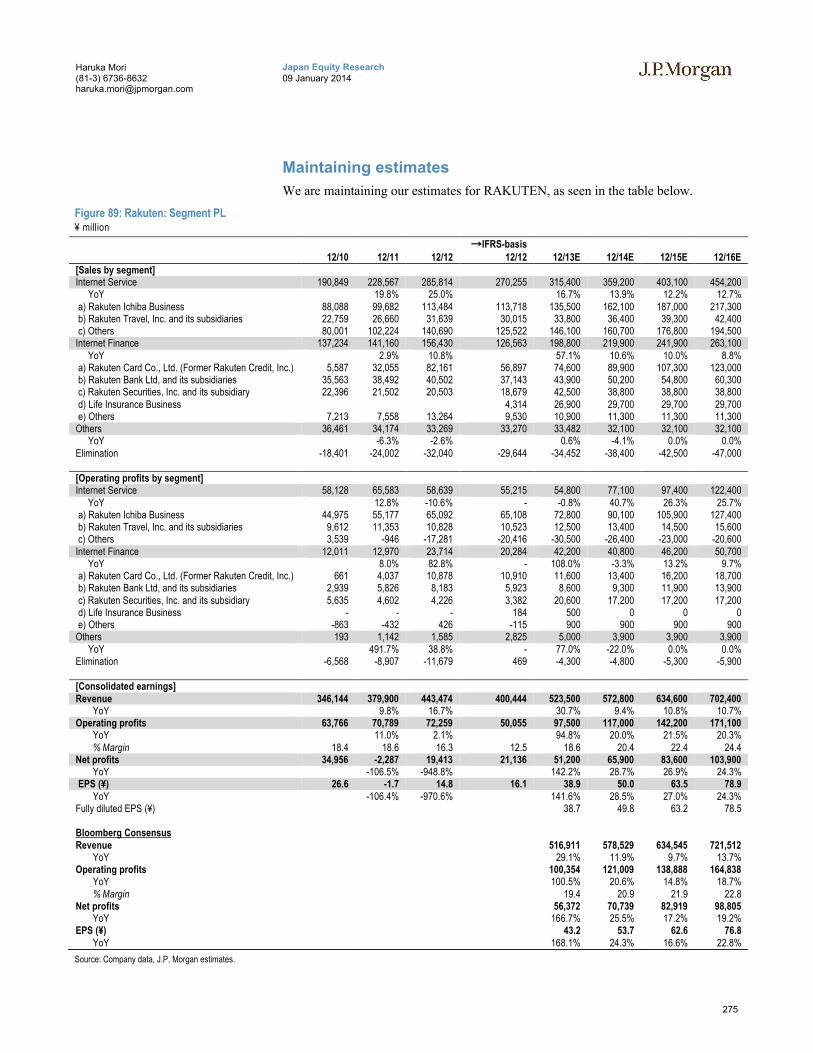
275
Japan Equity Research09 January 2014
Haruka Mori(81-3) [email protected]
Maintaining estimates
We are maintaining our estimates for RAKUTEN, as seen in the table below.
Figure 89: Rakuten: Segment PL¥ million
12/10 12/11 12/12→IFRS-basis
12/12 12/13E 12/14E 12/15E 12/16E[Sales by segment]Internet Service 190,849 228,567 285,814 270,255 315,400 359,200 403,100 454,200 YoY 19.8% 25.0% 16.7% 13.9% 12.2% 12.7%a) Rakuten Ichiba Business 88,088 99,682 113,484 113,718 135,500 162,100 187,000 217,300 b) Rakuten Travel, Inc. and its subsidiaries 22,759 26,660 31,639 30,015 33,800 36,400 39,300 42,400 c) Others 80,001 102,224 140,690 125,522 146,100 160,700 176,800 194,500
Internet Finance 137,234 141,160 156,430 126,563 198,800 219,900 241,900 263,100 YoY 2.9% 10.8% 57.1% 10.6% 10.0% 8.8%a) Rakuten Card Co., Ltd. (Former Rakuten Credit, Inc.) 5,587 32,055 82,161 56,897 74,600 89,900 107,300 123,000 b) Rakuten Bank Ltd, and its subsidiaries 35,563 38,492 40,502 37,143 43,900 50,200 54,800 60,300 c) Rakuten Securities, Inc. and its subsidiary 22,396 21,502 20,503 18,679 42,500 38,800 38,800 38,800 d) Life Insurance Business 4,314 26,900 29,700 29,700 29,700 e) Others 7,213 7,558 13,264 9,530 10,900 11,300 11,300 11,300
Others 36,461 34,174 33,269 33,270 33,482 32,100 32,100 32,100 YoY -6.3% -2.6% 0.6% -4.1% 0.0% 0.0%Elimination -18,401 -24,002 -32,040 -29,644 -34,452 -38,400 -42,500 -47,000
[Operating profits by segment]Internet Service 58,128 65,583 58,639 55,215 54,800 77,100 97,400 122,400 YoY 12.8% -10.6% - -0.8% 40.7% 26.3% 25.7%a) Rakuten Ichiba Business 44,975 55,177 65,092 65,108 72,800 90,100 105,900 127,400 b) Rakuten Travel, Inc. and its subsidiaries 9,612 11,353 10,828 10,523 12,500 13,400 14,500 15,600 c) Others 3,539 -946 -17,281 -20,416 -30,500 -26,400 -23,000 -20,600
Internet Finance 12,011 12,970 23,714 20,284 42,200 40,800 46,200 50,700 YoY 8.0% 82.8% - 108.0% -3.3% 13.2% 9.7%a) Rakuten Card Co., Ltd. (Former Rakuten Credit, Inc.) 661 4,037 10,878 10,910 11,600 13,400 16,200 18,700 b) Rakuten Bank Ltd, and its subsidiaries 2,939 5,826 8,183 5,923 8,600 9,300 11,900 13,900 c) Rakuten Securities, Inc. and its subsidiary 5,635 4,602 4,226 3,382 20,600 17,200 17,200 17,200 d) Life Insurance Business - - - 184 500 0 0 0 e) Others -863 -432 426 -115 900 900 900 900
Others 193 1,142 1,585 2,825 5,000 3,900 3,900 3,900 YoY 491.7% 38.8% - 77.0% -22.0% 0.0% 0.0%Elimination -6,568 -8,907 -11,679 469 -4,300 -4,800 -5,300 -5,900
[Consolidated earnings]Revenue 346,144 379,900 443,474 400,444 523,500 572,800 634,600 702,400 YoY 9.8% 16.7% 30.7% 9.4% 10.8% 10.7%Operating profits 63,766 70,789 72,259 50,055 97,500 117,000 142,200 171,100 YoY 11.0% 2.1% 94.8% 20.0% 21.5% 20.3% % Margin 18.4 18.6 16.3 12.5 18.6 20.4 22.4 24.4Net profits 34,956 -2,287 19,413 21,136 51,200 65,900 83,600 103,900 YoY -106.5% -948.8% 142.2% 28.7% 26.9% 24.3%EPS (¥) 26.6 -1.7 14.8 16.1 38.9 50.0 63.5 78.9
YoY -106.4% -970.6% 141.6% 28.5% 27.0% 24.3%Fully diluted EPS (¥) 38.7 49.8 63.2 78.5
Bloomberg ConsensusRevenue 516,911 578,529 634,545 721,512 YoY 29.1% 11.9% 9.7% 13.7%Operating profits 100,354 121,009 138,888 164,838 YoY 100.5% 20.6% 14.8% 18.7% % Margin 19.4 20.9 21.9 22.8Net profits 56,372 70,739 82,919 98,805 YoY 166.7% 25.5% 17.2% 19.2%EPS (¥) 43.2 53.7 62.6 76.8 YoY 168.1% 24.3% 16.6% 22.8%
Source: Company data, J.P. Morgan estimates.
276
Japan Equity Research09 January 2014
Haruka Mori(81-3) [email protected]
Investment Thesis, Valuation and Risks
Investment thesis
We highly rate the company’s strong position in the e-commerce market, for which accelerated growth is expected, partly because of support provided by a powerful ecosystem. We therefore think the company will be able to maintain growth rates in excess of the market, but also think the stock price already reflects this and is around fair value.
Valuation
Our price target through December 2014 is ¥1,500. We use DCF modeling to value the internet service business, and a comparison with competitors to value the internet finance business. Our DCF assumptions are a risk free rate of 1%, a market risk premium of 4.5%, beta of 1.2% and a terminal growth rate of 1.5%. Our price target equates to 30x our FY2014 EPS projection.
Risks
Greater than expected acceleration/deceleration in growth of Japanese e-commerce market: Given that it has the largest market share, the biggest threat to Rakuten would be a slowdown in the retail market’s shift to e-commerce. e-commerce currently accounts for only 3–4% of the Japanese retail market, so an unexpected slowing in the shift to e-commerce could affect Rakuten’s growth rate, and therefore be a downside risk to our investment opinion. In reverse, a significantly more rapid shift to e-commerce than in the past could be an upside risk to our investment opinion.
Deterioration in competitive environment for Japanese e-commerce market: The success of Yahoo’s e-commerce strategy or a more aggressive stance by Amazon that causes deterioration in the competitive environment could be negative for Rakuten’s earnings. This would be a downside risk to our investment opinion..
Expansion in losses of content business due to aggressive promotion: Given that we think forward looking investment in the digital content business will continue for some time, losses could expand by more than expected due to increased promotional spending. Given equity market concern regarding this business, this could be a downside risk for our investment opinion.
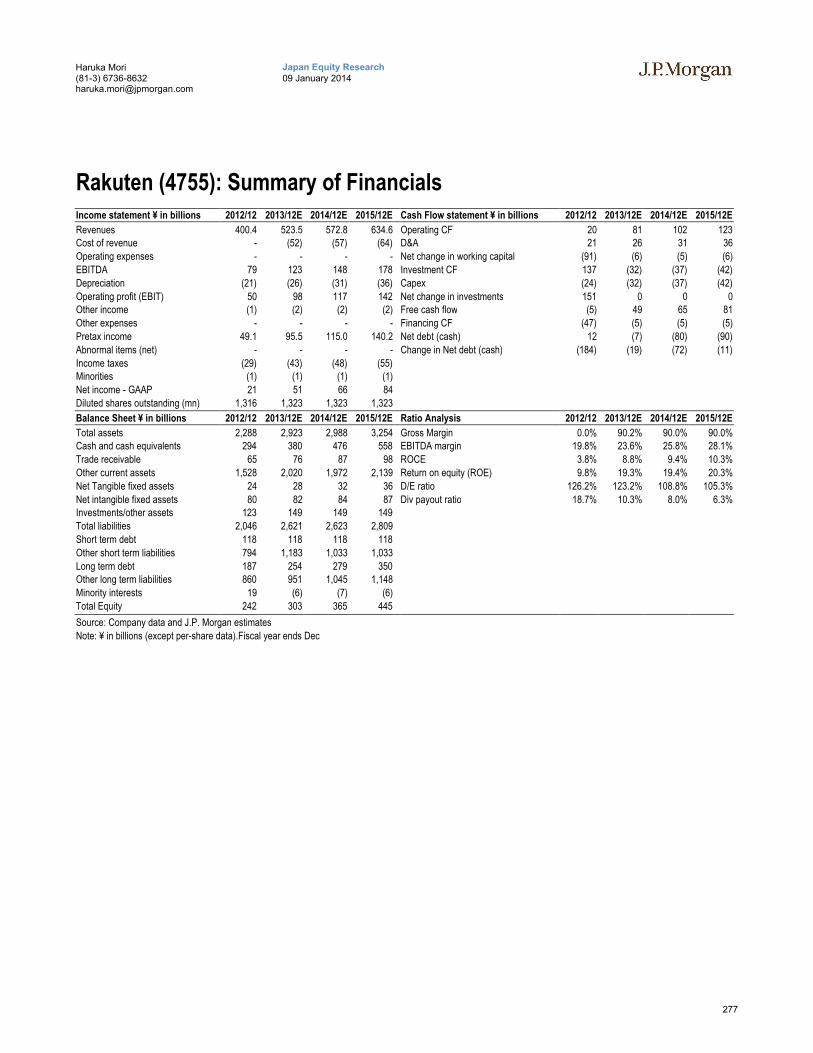
277
Japan Equity Research09 January 2014
Haruka Mori(81-3) [email protected]
Rakuten (4755): Summary of FinancialsIncome statement ¥ in billions 2012/12 2013/12E 2014/12E 2015/12E Cash Flow statement ¥ in billions 2012/12 2013/12E 2014/12E 2015/12E
Revenues 400.4 523.5 572.8 634.6 Operating CF 20 81 102 123Cost of revenue - (52) (57) (64) D&A 21 26 31 36
Operating expenses - - - - Net change in working capital (91) (6) (5) (6)
EBITDA 79 123 148 178 Investment CF 137 (32) (37) (42)
Depreciation (21) (26) (31) (36) Capex (24) (32) (37) (42)
Operating profit (EBIT) 50 98 117 142 Net change in investments 151 0 0 0Other income (1) (2) (2) (2) Free cash flow (5) 49 65 81
Other expenses - - - - Financing CF (47) (5) (5) (5)
Pretax income 49.1 95.5 115.0 140.2 Net debt (cash) 12 (7) (80) (90)
Abnormal items (net) - - - - Change in Net debt (cash) (184) (19) (72) (11)
Income taxes (29) (43) (48) (55)Minorities (1) (1) (1) (1)
Net income - GAAP 21 51 66 84
Diluted shares outstanding (mn) 1,316 1,323 1,323 1,323
Balance Sheet ¥ in billions 2012/12 2013/12E 2014/12E 2015/12E Ratio Analysis 2012/12 2013/12E 2014/12E 2015/12E
Total assets 2,288 2,923 2,988 3,254 Gross Margin 0.0% 90.2% 90.0% 90.0%Cash and cash equivalents 294 380 476 558 EBITDA margin 19.8% 23.6% 25.8% 28.1%
Trade receivable 65 76 87 98 ROCE 3.8% 8.8% 9.4% 10.3%
Other current assets 1,528 2,020 1,972 2,139 Return on equity (ROE) 9.8% 19.3% 19.4% 20.3%
Net Tangible fixed assets 24 28 32 36 D/E ratio 126.2% 123.2% 108.8% 105.3%
Net intangible fixed assets 80 82 84 87 Div payout ratio 18.7% 10.3% 8.0% 6.3%Investments/other assets 123 149 149 149
Total liabilities 2,046 2,621 2,623 2,809
Short term debt 118 118 118 118
Other short term liabilities 794 1,183 1,033 1,033
Long term debt 187 254 279 350Other long term liabilities 860 951 1,045 1,148
Minority interests 19 (6) (7) (6)
Total Equity 242 303 365 445
Source: Company data and J.P. Morgan estimates
Note: ¥ in billions (except per-share data).Fiscal year ends Dec
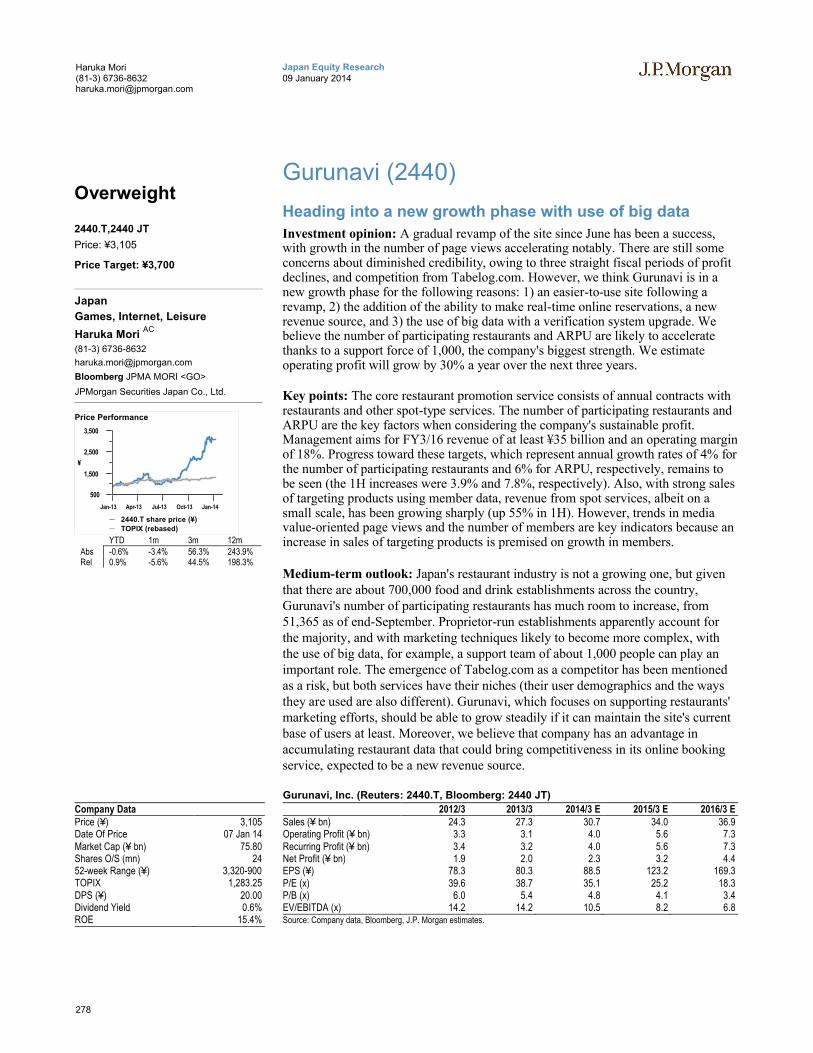
278
Japan Equity Research09 January 2014
Haruka Mori(81-3) [email protected]
Gurunavi (2440)
Heading into a new growth phase with use of big data
Investment opinion: A gradual revamp of the site since June has been a success, with growth in the number of page views accelerating notably. There are still some concerns about diminished credibility, owing to three straight fiscal periods of profit declines, and competition from Tabelog.com. However, we think Gurunavi is in a new growth phase for the following reasons: 1) an easier-to-use site following a revamp, 2) the addition of the ability to make real-time online reservations, a new revenue source, and 3) the use of big data with a verification system upgrade. We believe the number of participating restaurants and ARPU are likely to accelerate thanks to a support force of 1,000, the company's biggest strength. We estimate operating profit will grow by 30% a year over the next three years.
Key points: The core restaurant promotion service consists of annual contracts with restaurants and other spot-type services. The number of participating restaurants and ARPU are the key factors when considering the company's sustainable profit. Management aims for FY3/16 revenue of at least ¥35 billion and an operating margin of 18%. Progress toward these targets, which represent annual growth rates of 4% for the number of participating restaurants and 6% for ARPU, respectively, remains to be seen (the 1H increases were 3.9% and 7.8%, respectively). Also, with strong sales of targeting products using member data, revenue from spot services, albeit on a small scale, has been growing sharply (up 55% in 1H). However, trends in media value-oriented page views and the number of members are key indicators because an increase in sales of targeting products is premised on growth in members.
Medium-term outlook: Japan's restaurant industry is not a growing one, but given that there are about 700,000 food and drink establishments across the country, Gurunavi's number of participating restaurants has much room to increase, from 51,365 as of end-September. Proprietor-run establishments apparently account for the majority, and with marketing techniques likely to become more complex, with the use of big data, for example, a support team of about 1,000 people can play an important role. The emergence of Tabelog.com as a competitor has been mentioned as a risk, but both services have their niches (their user demographics and the ways they are used are also different). Gurunavi, which focuses on supporting restaurants' marketing efforts, should be able to grow steadily if it can maintain the site's current base of users at least. Moreover, we believe that company has an advantage in accumulating restaurant data that could bring competitiveness in its online booking service, expected to be a new revenue source.
Company DataPrice (¥) 3,105Date Of Price 07 Jan 14Market Cap (¥ bn) 75.80Shares O/S (mn) 2452-week Range (¥) 3,320-900TOPIX 1,283.25DPS (¥) 20.00Dividend Yield 0.6%ROE 15.4%
Gurunavi, Inc. (Reuters: 2440.T, Bloomberg: 2440 JT)
2012/3 2013/3 2014/3 E 2015/3 E 2016/3 ESales (¥ bn) 24.3 27.3 30.7 34.0 36.9Operating Profit (¥ bn) 3.3 3.1 4.0 5.6 7.3Recurring Profit (¥ bn) 3.4 3.2 4.0 5.6 7.3Net Profit (¥ bn) 1.9 2.0 2.3 3.2 4.4EPS (¥) 78.3 80.3 88.5 123.2 169.3P/E (x) 39.6 38.7 35.1 25.2 18.3P/B (x) 6.0 5.4 4.8 4.1 3.4EV/EBITDA (x) 14.2 14.2 10.5 8.2 6.8Source: Company data, Bloomberg, J.P. Morgan estimates.
Overweight
2440.T,2440 JT
Price: ¥3,105
Price Target: ¥3,700
Japan
Games, Internet, Leisure
Haruka Mori AC
(81-3) 6736-8632
Bloomberg JPMA MORI <GO>
JPMorgan Securities Japan Co., Ltd.
500
1,500
2,500
3,500
¥
Jan-13 Apr-13 Jul-13 Oct-13 Jan-14
Price Performance
2440.T share price (¥)
TOPIX (rebased)
YTD 1m 3m 12mAbs -0.6% -3.4% 56.3% 243.9%Rel 0.9% -5.6% 44.5% 198.3%
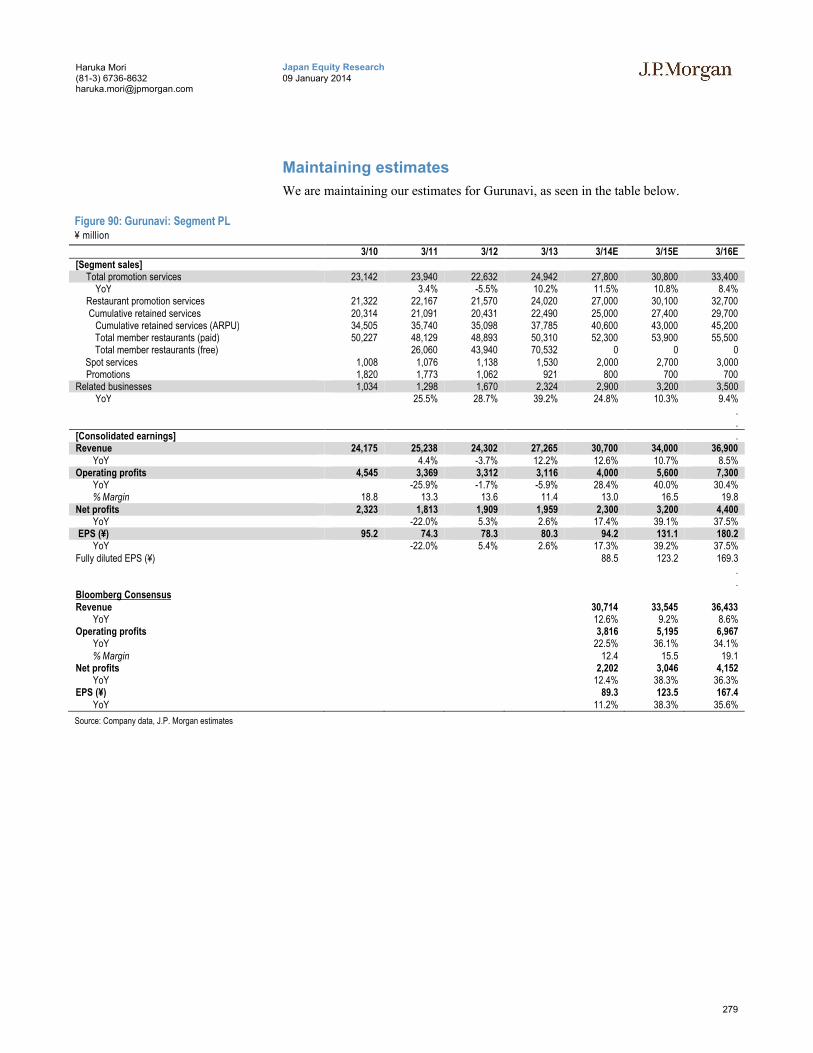
279
Japan Equity Research09 January 2014
Haruka Mori(81-3) [email protected]
Maintaining estimates
We are maintaining our estimates for Gurunavi, as seen in the table below.
Figure 90: Gurunavi: Segment PL¥ million
3/10 3/11 3/12 3/13 3/14E 3/15E 3/16E[Segment sales]
Total promotion services 23,142 23,940 22,632 24,942 27,800 30,800 33,400 YoY 3.4% -5.5% 10.2% 11.5% 10.8% 8.4%
Restaurant promotion services 21,322 22,167 21,570 24,020 27,000 30,100 32,700Cumulative retained services 20,314 21,091 20,431 22,490 25,000 27,400 29,700
Cumulative retained services (ARPU) 34,505 35,740 35,098 37,785 40,600 43,000 45,200 Total member restaurants (paid) 50,227 48,129 48,893 50,310 52,300 53,900 55,500 Total member restaurants (free) 26,060 43,940 70,532 0 0 0 Spot services 1,008 1,076 1,138 1,530 2,000 2,700 3,000
Promotions 1,820 1,773 1,062 921 800 700 700Related businesses 1,034 1,298 1,670 2,324 2,900 3,200 3,500 YoY 25.5% 28.7% 39.2% 24.8% 10.3% 9.4%
.
.[Consolidated earnings] .Revenue 24,175 25,238 24,302 27,265 30,700 34,000 36,900 YoY 4.4% -3.7% 12.2% 12.6% 10.7% 8.5%Operating profits 4,545 3,369 3,312 3,116 4,000 5,600 7,300 YoY -25.9% -1.7% -5.9% 28.4% 40.0% 30.4% % Margin 18.8 13.3 13.6 11.4 13.0 16.5 19.8Net profits 2,323 1,813 1,909 1,959 2,300 3,200 4,400 YoY -22.0% 5.3% 2.6% 17.4% 39.1% 37.5%EPS (¥) 95.2 74.3 78.3 80.3 94.2 131.1 180.2
YoY -22.0% 5.4% 2.6% 17.3% 39.2% 37.5%Fully diluted EPS (¥) 88.5 123.2 169.3
.
.Bloomberg ConsensusRevenue 30,714 33,545 36,433 YoY 12.6% 9.2% 8.6%Operating profits 3,816 5,195 6,967 YoY 22.5% 36.1% 34.1% % Margin 12.4 15.5 19.1Net profits 2,202 3,046 4,152 YoY 12.4% 38.3% 36.3%EPS (¥) 89.3 123.5 167.4 YoY 11.2% 38.3% 35.6%
Source: Company data, J.P. Morgan estimates
280
Japan Equity Research09 January 2014
Haruka Mori(81-3) [email protected]
Investment Thesis, Valuation and Risks
Investment thesis
We think Gurunavi is in a new growth phase for the following reasons: 1) an easier-to-use site following a revamp, 2) the addition of the ability to make real-time online reservations, a new revenue source, and 3) the use of big data with a verification system upgrade. Therefore, we estimate operating profit will grow by 30% a year over the next three years.
Valuation
We base our price target of ¥3,700 (by December 2014) on a DCF model using assumptions of a 1% risk free rate, a 4.5% market risk premium, a beta of 1.2, and a terminal growth rate of 0%. Our price target works out to 30x our FY3/15 EPS estimate.
Risks
Sharp deterioration in macro conditions: A downside risk for our rating and earnings is a sharp deterioration in macro conditions, since the company's business is affected by restaurant market trends. When many restaurants went out of business after the global financial crisis and the March 2011 earthquake, the number of paying participating restaurants declined. A slight deterioration in economic trends would not necessarily have a negative impact, though, because restaurants have strong marketing needs.
Intense competition: The company's main competitors are kakaku.com's Tabelog site and Recruit's Hot Pepper site. Previously, concerns rose about the company's growth because of gains made by Tabelog.com. Groundbreaking services such as Tabelog.com are a downside risk for our rating, as they can lead to a sharp decline in page views.
System problems and breaches of private information: Website problems can lead to a loss of credibility among users and participating restaurants. It is difficult for the reputations of online services to recover once they worsen as a result of word of mouth or other factors. Breaches of members' private information that has been built up and other privacy protection problems represent another risk.
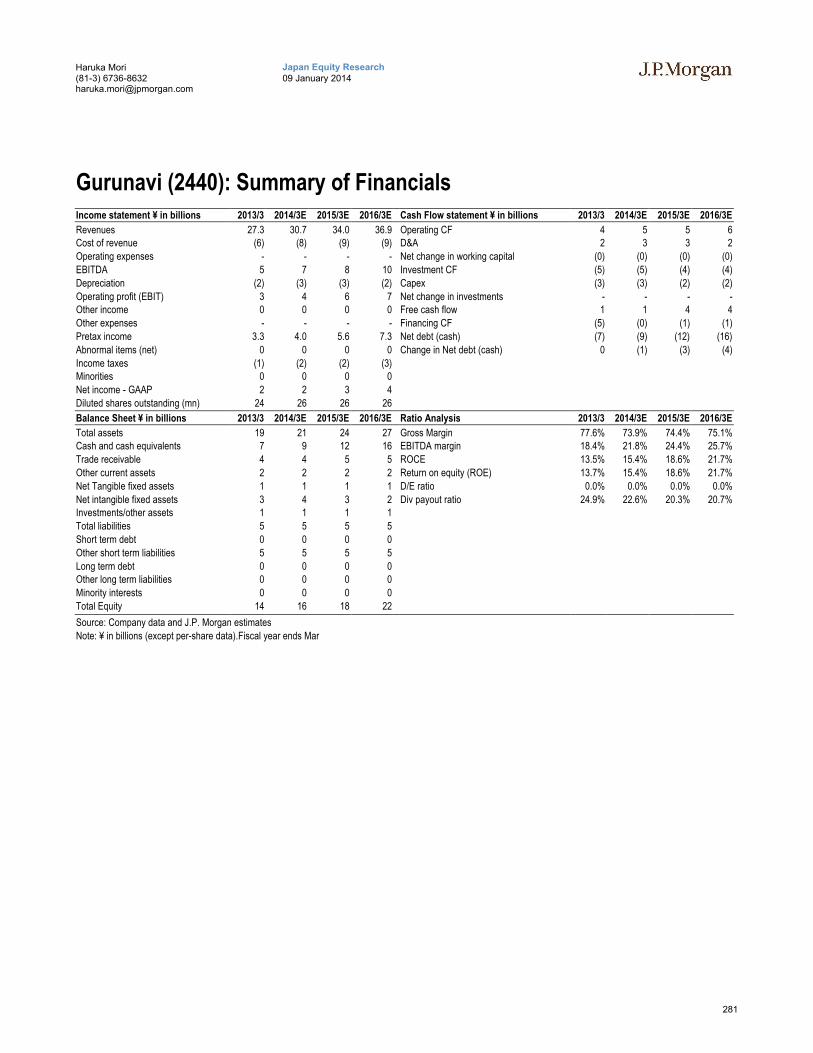
281
Japan Equity Research09 January 2014
Haruka Mori(81-3) [email protected]
Gurunavi (2440): Summary of FinancialsIncome statement ¥ in billions 2013/3 2014/3E 2015/3E 2016/3E Cash Flow statement ¥ in billions 2013/3 2014/3E 2015/3E 2016/3E
Revenues 27.3 30.7 34.0 36.9 Operating CF 4 5 5 6Cost of revenue (6) (8) (9) (9) D&A 2 3 3 2
Operating expenses - - - - Net change in working capital (0) (0) (0) (0)
EBITDA 5 7 8 10 Investment CF (5) (5) (4) (4)
Depreciation (2) (3) (3) (2) Capex (3) (3) (2) (2)
Operating profit (EBIT) 3 4 6 7 Net change in investments - - - -Other income 0 0 0 0 Free cash flow 1 1 4 4
Other expenses - - - - Financing CF (5) (0) (1) (1)
Pretax income 3.3 4.0 5.6 7.3 Net debt (cash) (7) (9) (12) (16)
Abnormal items (net) 0 0 0 0 Change in Net debt (cash) 0 (1) (3) (4)
Income taxes (1) (2) (2) (3)Minorities 0 0 0 0
Net income - GAAP 2 2 3 4
Diluted shares outstanding (mn) 24 26 26 26
Balance Sheet ¥ in billions 2013/3 2014/3E 2015/3E 2016/3E Ratio Analysis 2013/3 2014/3E 2015/3E 2016/3E
Total assets 19 21 24 27 Gross Margin 77.6% 73.9% 74.4% 75.1%Cash and cash equivalents 7 9 12 16 EBITDA margin 18.4% 21.8% 24.4% 25.7%
Trade receivable 4 4 5 5 ROCE 13.5% 15.4% 18.6% 21.7%
Other current assets 2 2 2 2 Return on equity (ROE) 13.7% 15.4% 18.6% 21.7%
Net Tangible fixed assets 1 1 1 1 D/E ratio 0.0% 0.0% 0.0% 0.0%
Net intangible fixed assets 3 4 3 2 Div payout ratio 24.9% 22.6% 20.3% 20.7%Investments/other assets 1 1 1 1
Total liabilities 5 5 5 5
Short term debt 0 0 0 0
Other short term liabilities 5 5 5 5
Long term debt 0 0 0 0Other long term liabilities 0 0 0 0
Minority interests 0 0 0 0
Total Equity 14 16 18 22
Source: Company data and J.P. Morgan estimates
Note: ¥ in billions (except per-share data).Fiscal year ends Mar
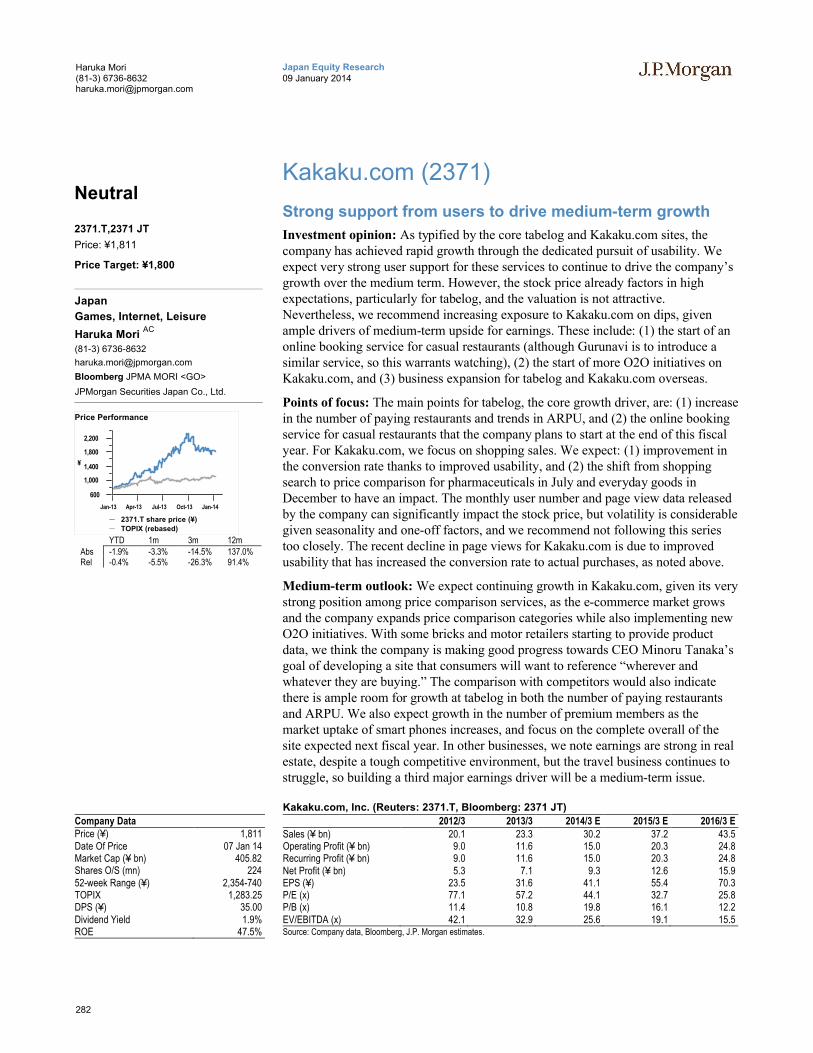
282
Japan Equity Research09 January 2014
Haruka Mori(81-3) [email protected]
Kakaku.com (2371)
Strong support from users to drive medium-term growth
Investment opinion: As typified by the core tabelog and Kakaku.com sites, the company has achieved rapid growth through the dedicated pursuit of usability. We expect very strong user support for these services to continue to drive the company’s growth over the medium term. However, the stock price already factors in high expectations, particularly for tabelog, and the valuation is not attractive. Nevertheless, we recommend increasing exposure to Kakaku.com on dips, given ample drivers of medium-term upside for earnings. These include: (1) the start of an online booking service for casual restaurants (although Gurunavi is to introduce a similar service, so this warrants watching), (2) the start of more O2O initiatives on Kakaku.com, and (3) business expansion for tabelog and Kakaku.com overseas.
Points of focus: The main points for tabelog, the core growth driver, are: (1) increase in the number of paying restaurants and trends in ARPU, and (2) the online booking service for casual restaurants that the company plans to start at the end of this fiscal year. For Kakaku.com, we focus on shopping sales. We expect: (1) improvement in the conversion rate thanks to improved usability, and (2) the shift from shopping search to price comparison for pharmaceuticals in July and everyday goods in December to have an impact. The monthly user number and page view data released by the company can significantly impact the stock price, but volatility is considerable given seasonality and one-off factors, and we recommend not following this series too closely. The recent decline in page views for Kakaku.com is due to improved usability that has increased the conversion rate to actual purchases, as noted above.
Medium-term outlook: We expect continuing growth in Kakaku.com, given its very strong position among price comparison services, as the e-commerce market grows and the company expands price comparison categories while also implementing new O2O initiatives. With some bricks and motor retailers starting to provide product data, we think the company is making good progress towards CEO Minoru Tanaka’s goal of developing a site that consumers will want to reference “wherever and whatever they are buying.” The comparison with competitors would also indicate there is ample room for growth at tabelog in both the number of paying restaurants and ARPU. We also expect growth in the number of premium members as the market uptake of smart phones increases, and focus on the complete overall of the site expected next fiscal year. In other businesses, we note earnings are strong in real estate, despite a tough competitive environment, but the travel business continues to struggle, so building a third major earnings driver will be a medium-term issue.
Company DataPrice (¥) 1,811Date Of Price 07 Jan 14Market Cap (¥ bn) 405.82Shares O/S (mn) 22452-week Range (¥) 2,354-740TOPIX 1,283.25DPS (¥) 35.00Dividend Yield 1.9%ROE 47.5%
Kakaku.com, Inc. (Reuters: 2371.T, Bloomberg: 2371 JT)
2012/3 2013/3 2014/3 E 2015/3 E 2016/3 ESales (¥ bn) 20.1 23.3 30.2 37.2 43.5Operating Profit (¥ bn) 9.0 11.6 15.0 20.3 24.8Recurring Profit (¥ bn) 9.0 11.6 15.0 20.3 24.8Net Profit (¥ bn) 5.3 7.1 9.3 12.6 15.9EPS (¥) 23.5 31.6 41.1 55.4 70.3P/E (x) 77.1 57.2 44.1 32.7 25.8P/B (x) 11.4 10.8 19.8 16.1 12.2EV/EBITDA (x) 42.1 32.9 25.6 19.1 15.5Source: Company data, Bloomberg, J.P. Morgan estimates.
Neutral
2371.T,2371 JT
Price: ¥1,811
Price Target: ¥1,800
Japan
Games, Internet, Leisure
Haruka Mori AC
(81-3) 6736-8632
Bloomberg JPMA MORI <GO>
JPMorgan Securities Japan Co., Ltd.
600
1,000
1,400
1,800
2,200
¥
Jan-13 Apr-13 Jul-13 Oct-13 Jan-14
Price Performance
2371.T share price (¥)
TOPIX (rebased)
YTD 1m 3m 12mAbs -1.9% -3.3% -14.5% 137.0%Rel -0.4% -5.5% -26.3% 91.4%

283
Japan Equity Research09 January 2014
Haruka Mori(81-3) [email protected]
Maintaining estimates
We are maintaining our estimates for Kakaku.com, as seen in the table below.
Figure 91: Kakaku.com: Segment PL¥ million
3/10 3/11 3/12 3/13 3/14E 3/15E 3/16E 3/17E
[Segment sales]Internet, Media 12,582 16,317 19,502 22,636 29,450 36,190 42,300 48,340 YoY 29.7% 19.5% 16.1% 30.1% 22.9% 16.9% 14.3%Shopping (Kakaku.com) 4,581 6,043 6,445 7,342 8,630 9,280 9,990 10,700 % of total 35.1 36.0 32.1 31.5 28.6 25.0 23.0 21.5Service (Kakaku.com) 2,951 3,426 4,520 6,160 7,600 8,500 9,050 9,670 % of total 22.6 20.4 22.5 26.5 25.1 22.9 20.8 19.4Advertising (Kakaku.com) 2,271 2,848 2,988 3,269 3,590 3,710 3,710 3,710 % of total 17.4 16.9 14.9 14.0 11.9 10.0 8.5 7.5Tabelog 541 1,584 2,539 4,136 7,570 12,250 16,670 20,980 % of total 4.1 9.4 12.6 17.8 25.0 32.9 38.3 42.1Travel/Real Estate 844 1,213 1,384 1,726 2,060 2,450 2,880 3,280 % of total 6.5 7.2 6.9 7.4 6.8 6.6 6.6 6.6
4Travel 401 413 496 551 480 600 700 700YoyaQ 120 165 202 301 300 300 300 300
Mansion DB, Sumaity 202 502 545 724 1,090 1,310 1,570 1,880eiga.com 109 117 131 141 180 230 300 390Others 1 6 1 1 10 10 10 10
Finance 466 487 585 641 770 1,000 1,200 1,440 YoY 4.5% 20.1% 9.6% 20.1% 29.9% 20.0% 20.0%
[Consolidated earnings]Revenue 13,048 16,803 20,087 23,277 30,220 37,190 43,500 49,780 YoY 28.8% 19.5% 15.9% 29.8% 23.1% 17.0% 14.4%Operating profits 5,457 7,854 9,011 11,616 15,020 20,280 24,760 28,900 YoY 43.9% 14.7% 28.9% 29.3% 35.0% 22.1% 16.7% % Margin 41.8 46.7 44.9 49.9 49.7 54.5 56.9 58.1Net profits 3,187 4,579 5,268 7,090 9,310 12,570 15,940 18,600 YoY 43.7% 15.0% 34.6% 31.3% 35.0% 26.8% 16.7%EPS (¥) 27.7 19.7 23.5 31.6 41.5 56.1 71.1 83.0
YoY -28.9% 19.3% 34.5% 31.3% 35.2% 26.7% 16.7%Fully diluted EPS (¥) 41.1 55.4 70.3 82.0
Bloomberg ConsensusRevenue 30,095 38,192 46,551 57,205 YoY 29.3% 26.9% 21.9% 22.9%Operating profits 15,216 19,932 24,815 344,032 YoY 31.0% 31.0% 24.5% 1286.4% % Margin 50.6 52.2 53.3 601.4Net profits 9,325 12,384 15,635 20,975 YoY 31.5% 32.8% 26.3% 34.2%EPS (¥) 41.1 54.1 67.8 94.2 YoY 30.0% 31.8% 25.3% 39.0%
Source: Company data, J.P. Morgan estimates
284
Japan Equity Research09 January 2014
Haruka Mori(81-3) [email protected]
Investment Thesis, Valuation and Risks
Investment thesis
We expect very strong user support for these services to continue to drive the company’s growth over the medium term. However, the stock price already factors in high expectations, particularly for tabelog, and the valuation is not attractive.
Valuation
Our price target through December 2014, which is based on DCF modeling, is ¥1,800. Our DCF assumptions are a risk free rate of 1%, a market risk premium of 4.5%, beta of 1.2% and a terminal growth rate of 1.5%. Our price target equates to 32x our FY3/15 EPS projection.
Risks
Intensification of competition for core price comparison site: There are multiple services competing with the company’s core price comparison site, and Yahoo’s recent acquisition of coneco.com is seen as a risk factor. Kakaku.com could lose market share if competing services start to dominate, and this would be a downside risk to our investment opinion.
Slowdown for tabelog, the key growth driver: tabelog also faces multiple competitors, led by Gurunavi, and although each company’s strategy differs, we point out the competitive environment is not easy. A slowdown in growth at tabelog would be a downside risk to our investment opinion as it is currently the main growth driver. Marked deterioration in the macro environment would present the risk of deterioration in the earnings of this business.
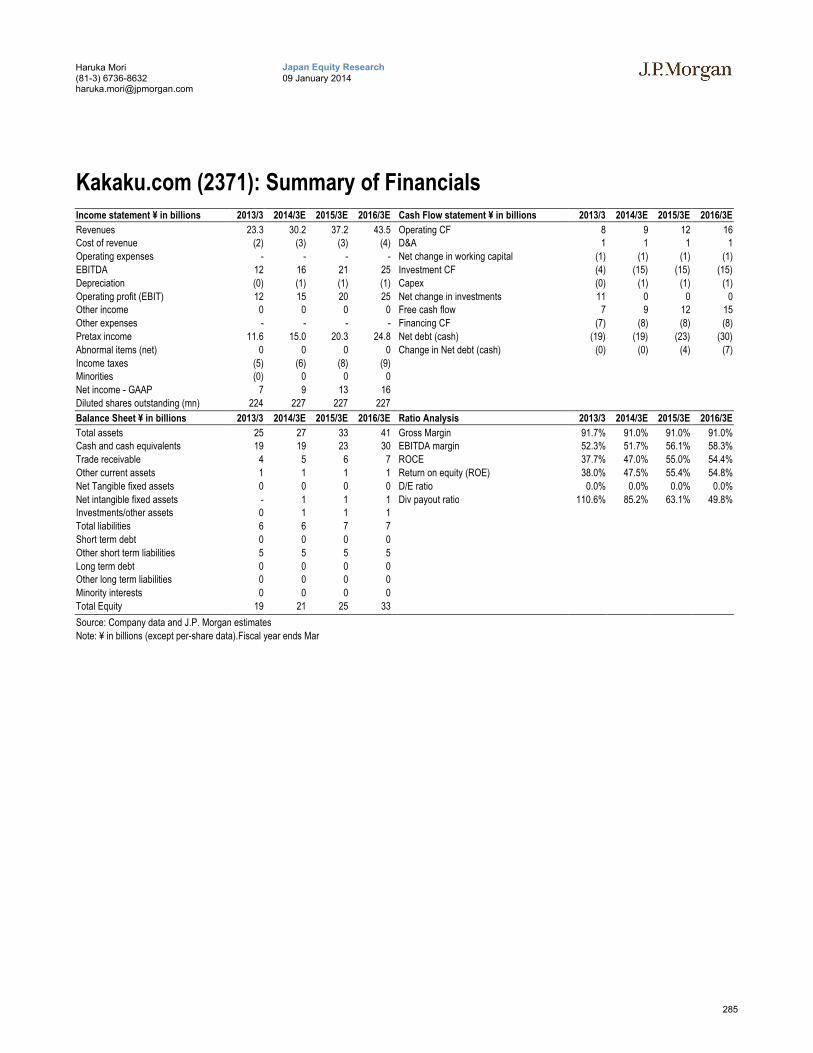
285
Japan Equity Research09 January 2014
Haruka Mori(81-3) [email protected]
Kakaku.com (2371): Summary of FinancialsIncome statement ¥ in billions 2013/3 2014/3E 2015/3E 2016/3E Cash Flow statement ¥ in billions 2013/3 2014/3E 2015/3E 2016/3E
Revenues 23.3 30.2 37.2 43.5 Operating CF 8 9 12 16Cost of revenue (2) (3) (3) (4) D&A 1 1 1 1
Operating expenses - - - - Net change in working capital (1) (1) (1) (1)
EBITDA 12 16 21 25 Investment CF (4) (15) (15) (15)
Depreciation (0) (1) (1) (1) Capex (0) (1) (1) (1)
Operating profit (EBIT) 12 15 20 25 Net change in investments 11 0 0 0Other income 0 0 0 0 Free cash flow 7 9 12 15
Other expenses - - - - Financing CF (7) (8) (8) (8)
Pretax income 11.6 15.0 20.3 24.8 Net debt (cash) (19) (19) (23) (30)
Abnormal items (net) 0 0 0 0 Change in Net debt (cash) (0) (0) (4) (7)
Income taxes (5) (6) (8) (9)Minorities (0) 0 0 0
Net income - GAAP 7 9 13 16
Diluted shares outstanding (mn) 224 227 227 227
Balance Sheet ¥ in billions 2013/3 2014/3E 2015/3E 2016/3E Ratio Analysis 2013/3 2014/3E 2015/3E 2016/3E
Total assets 25 27 33 41 Gross Margin 91.7% 91.0% 91.0% 91.0%Cash and cash equivalents 19 19 23 30 EBITDA margin 52.3% 51.7% 56.1% 58.3%
Trade receivable 4 5 6 7 ROCE 37.7% 47.0% 55.0% 54.4%
Other current assets 1 1 1 1 Return on equity (ROE) 38.0% 47.5% 55.4% 54.8%
Net Tangible fixed assets 0 0 0 0 D/E ratio 0.0% 0.0% 0.0% 0.0%
Net intangible fixed assets - 1 1 1 Div payout ratio 110.6% 85.2% 63.1% 49.8%Investments/other assets 0 1 1 1
Total liabilities 6 6 7 7
Short term debt 0 0 0 0
Other short term liabilities 5 5 5 5
Long term debt 0 0 0 0Other long term liabilities 0 0 0 0
Minority interests 0 0 0 0
Total Equity 19 21 25 33
Source: Company data and J.P. Morgan estimates
Note: ¥ in billions (except per-share data).Fiscal year ends Mar
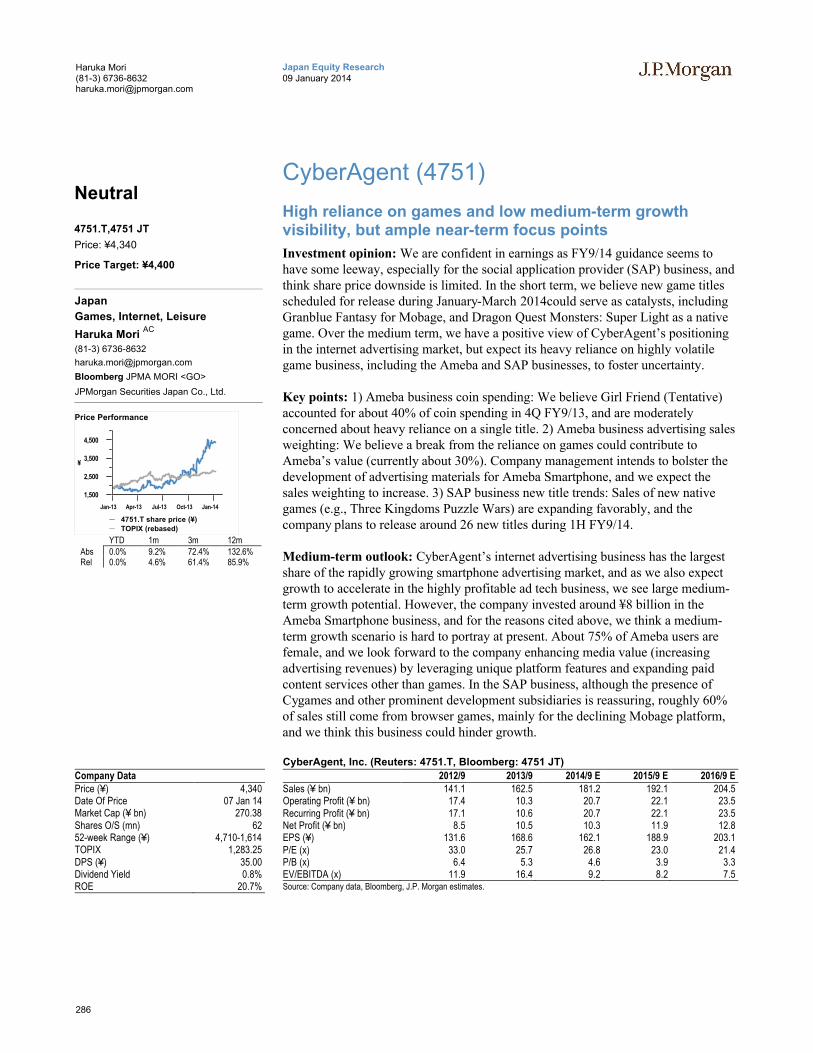
286
Japan Equity Research09 January 2014
Haruka Mori(81-3) [email protected]
CyberAgent (4751)
High reliance on games and low medium-term growth visibility, but ample near-term focus points
Investment opinion: We are confident in earnings as FY9/14 guidance seems to have some leeway, especially for the social application provider (SAP) business, and think share price downside is limited. In the short term, we believe new game titles scheduled for release during January-March 2014could serve as catalysts, including Granblue Fantasy for Mobage, and Dragon Quest Monsters: Super Light as a native game. Over the medium term, we have a positive view of CyberAgent’s positioning in the internet advertising market, but expect its heavy reliance on highly volatile game business, including the Ameba and SAP businesses, to foster uncertainty.
Key points: 1) Ameba business coin spending: We believe Girl Friend (Tentative) accounted for about 40% of coin spending in 4Q FY9/13, and are moderately concerned about heavy reliance on a single title. 2) Ameba business advertising sales weighting: We believe a break from the reliance on games could contribute to Ameba’s value (currently about 30%). Company management intends to bolster the development of advertising materials for Ameba Smartphone, and we expect the sales weighting to increase. 3) SAP business new title trends: Sales of new native games (e.g., Three Kingdoms Puzzle Wars) are expanding favorably, and the company plans to release around 26 new titles during 1H FY9/14.
Medium-term outlook: CyberAgent’s internet advertising business has the largest share of the rapidly growing smartphone advertising market, and as we also expect growth to accelerate in the highly profitable ad tech business, we see large medium-term growth potential. However, the company invested around ¥8 billion in the Ameba Smartphone business, and for the reasons cited above, we think a medium-term growth scenario is hard to portray at present. About 75% of Ameba users are female, and we look forward to the company enhancing media value (increasing advertising revenues) by leveraging unique platform features and expanding paid content services other than games. In the SAP business, although the presence of Cygames and other prominent development subsidiaries is reassuring, roughly 60% of sales still come from browser games, mainly for the declining Mobage platform, and we think this business could hinder growth.
Company DataPrice (¥) 4,340Date Of Price 07 Jan 14Market Cap (¥ bn) 270.38Shares O/S (mn) 6252-week Range (¥) 4,710-1,614TOPIX 1,283.25DPS (¥) 35.00Dividend Yield 0.8%ROE 20.7%
CyberAgent, Inc. (Reuters: 4751.T, Bloomberg: 4751 JT)
2012/9 2013/9 2014/9 E 2015/9 E 2016/9 ESales (¥ bn) 141.1 162.5 181.2 192.1 204.5Operating Profit (¥ bn) 17.4 10.3 20.7 22.1 23.5Recurring Profit (¥ bn) 17.1 10.6 20.7 22.1 23.5Net Profit (¥ bn) 8.5 10.5 10.3 11.9 12.8EPS (¥) 131.6 168.6 162.1 188.9 203.1P/E (x) 33.0 25.7 26.8 23.0 21.4P/B (x) 6.4 5.3 4.6 3.9 3.3EV/EBITDA (x) 11.9 16.4 9.2 8.2 7.5Source: Company data, Bloomberg, J.P. Morgan estimates.
Neutral
4751.T,4751 JT
Price: ¥4,340
Price Target: ¥4,400
Japan
Games, Internet, Leisure
Haruka Mori AC
(81-3) 6736-8632
Bloomberg JPMA MORI <GO>
JPMorgan Securities Japan Co., Ltd.
1,500
2,500
3,500
4,500
¥
Jan-13 Apr-13 Jul-13 Oct-13 Jan-14
Price Performance
4751.T share price (¥)
TOPIX (rebased)
YTD 1m 3m 12mAbs 0.0% 9.2% 72.4% 132.6%Rel 0.0% 4.6% 61.4% 85.9%
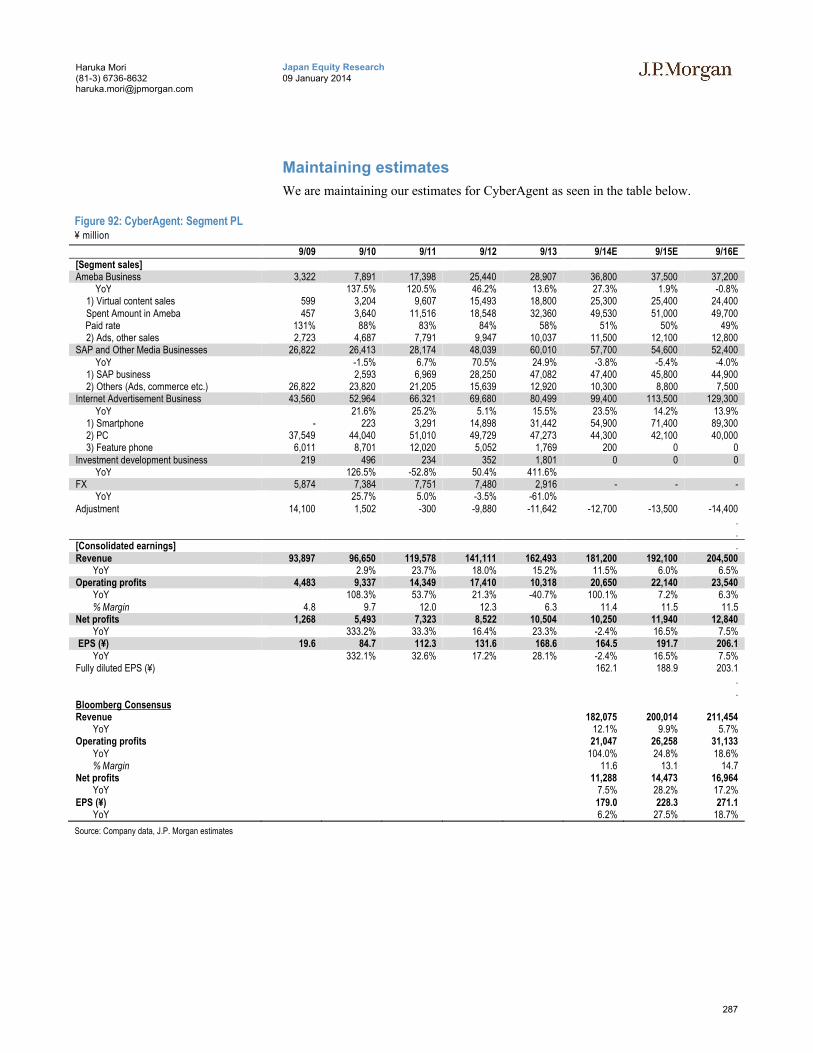
287
Japan Equity Research09 January 2014
Haruka Mori(81-3) [email protected]
Maintaining estimates
We are maintaining our estimates for CyberAgent as seen in the table below.
Figure 92: CyberAgent: Segment PL¥ million
9/09 9/10 9/11 9/12 9/13 9/14E 9/15E 9/16E[Segment sales]Ameba Business 3,322 7,891 17,398 25,440 28,907 36,800 37,500 37,200 YoY 137.5% 120.5% 46.2% 13.6% 27.3% 1.9% -0.8%
1) Virtual content sales 599 3,204 9,607 15,493 18,800 25,300 25,400 24,400Spent Amount in Ameba 457 3,640 11,516 18,548 32,360 49,530 51,000 49,700
Paid rate 131% 88% 83% 84% 58% 51% 50% 49%2) Ads, other sales 2,723 4,687 7,791 9,947 10,037 11,500 12,100 12,800
SAP and Other Media Businesses 26,822 26,413 28,174 48,039 60,010 57,700 54,600 52,400 YoY -1.5% 6.7% 70.5% 24.9% -3.8% -5.4% -4.0%
1) SAP business 2,593 6,969 28,250 47,082 47,400 45,800 44,9002) Others (Ads, commerce etc.) 26,822 23,820 21,205 15,639 12,920 10,300 8,800 7,500
Internet Advertisement Business 43,560 52,964 66,321 69,680 80,499 99,400 113,500 129,300 YoY 21.6% 25.2% 5.1% 15.5% 23.5% 14.2% 13.9%
1) Smartphone - 223 3,291 14,898 31,442 54,900 71,400 89,3002) PC 37,549 44,040 51,010 49,729 47,273 44,300 42,100 40,0003) Feature phone 6,011 8,701 12,020 5,052 1,769 200 0 0
Investment development business 219 496 234 352 1,801 0 0 0 YoY 126.5% -52.8% 50.4% 411.6%FX 5,874 7,384 7,751 7,480 2,916 - - - YoY 25.7% 5.0% -3.5% -61.0%Adjustment 14,100 1,502 -300 -9,880 -11,642 -12,700 -13,500 -14,400
.
.[Consolidated earnings] .Revenue 93,897 96,650 119,578 141,111 162,493 181,200 192,100 204,500 YoY 2.9% 23.7% 18.0% 15.2% 11.5% 6.0% 6.5%Operating profits 4,483 9,337 14,349 17,410 10,318 20,650 22,140 23,540 YoY 108.3% 53.7% 21.3% -40.7% 100.1% 7.2% 6.3% % Margin 4.8 9.7 12.0 12.3 6.3 11.4 11.5 11.5Net profits 1,268 5,493 7,323 8,522 10,504 10,250 11,940 12,840 YoY 333.2% 33.3% 16.4% 23.3% -2.4% 16.5% 7.5%EPS (¥) 19.6 84.7 112.3 131.6 168.6 164.5 191.7 206.1
YoY 332.1% 32.6% 17.2% 28.1% -2.4% 16.5% 7.5%Fully diluted EPS (¥) 162.1 188.9 203.1
.
.Bloomberg ConsensusRevenue 182,075 200,014 211,454 YoY 12.1% 9.9% 5.7%Operating profits 21,047 26,258 31,133 YoY 104.0% 24.8% 18.6% % Margin 11.6 13.1 14.7Net profits 11,288 14,473 16,964 YoY 7.5% 28.2% 17.2%EPS (¥) 179.0 228.3 271.1 YoY 6.2% 27.5% 18.7%
Source: Company data, J.P. Morgan estimates
288
Japan Equity Research09 January 2014
Haruka Mori(81-3) [email protected]
Investment Thesis, Valuation and Risks
Investment thesis
We think share price downside is limited and believe new game titles scheduled for release during January-March 2014 could serve as catalysts in the short term. However, over the medium term, we expect the heavy reliance on the highly volatile game business, including the Ameba and SAP businesses, to foster uncertainty.
Valuation
We set a December 2014 price target of ¥4,400 based on DCF. We assume a risk free rate of 1%, market risk premium of 4.5%, and beta of 1.2. We assume a terminal growth rate of 0% in view of heavy reliance on highly volatile game business. Our price target equates to a P/E of 27x based on our FY9/14 EPS estimate.
Risks
Possibility of bolstering Ameba promotions again: CyberAgent spent around ¥8 billion in advertising expenditures for Ameba Smartphone promotions in FY9/13. Although it intends to hold annual expenditures to around ¥5 billion from FY9/14, we see risk that it could again bolster promotions if user acquisition and coin spending do not advance as expected. This scenario would be a downside risk for our investment opinion.
Presence or absence of hit games in SAP business: In the mobile game market, development and promotional costs are rising rapidly at all companies due to a shift to native apps. We see risk that earnings could deteriorate more than expected in the absence of hit titles. The presence or absence of major hit titles has a significant impact on earnings, and is an upside/downside risk for our investment opinion.

289
Japan Equity Research09 January 2014
Haruka Mori(81-3) [email protected]
CyberAgent (4751): Summary of FinancialsIncome statement ¥ in billions 2013/9 2014/9E 2015/9E 2016/9E Cash Flow statement ¥ in billions 2013/9 2014/9E 2015/9E 2016/9E
Revenues 162.5 181.2 192.1 204.5 Operating CF 5 14 15 16Cost of revenue (105) (121) (128) (136) D&A 5 4 4 4
Operating expenses - - - - Net change in working capital 0 (1) (1) (1)
EBITDA 15 25 26 27 Investment CF 11 (2) (2) (2)
Depreciation (4) (4) (4) (3) Capex (2) (2) (2) (2)
Operating profit (EBIT) 10 21 22 24 Net change in investments 21 - - -Other income 0 0 0 0 Free cash flow 3 11 13 14
Other expenses - - - - Financing CF (7) (2) (2) (2)
Pretax income 21.0 19.5 22.1 23.5 Net debt (cash) (28) (48) (59) (71)
Abnormal items (net) 10 (1) 0 0 Change in Net debt (cash) (9) (19) (11) (12)
Income taxes (10) (8) (9) (9)Minorities (1) (1) (1) (1)
Net income - GAAP 11 10 12 13
Diluted shares outstanding (mn) 62 63 63 63
Balance Sheet ¥ in billions 2013/9 2014/9E 2015/9E 2016/9E Ratio Analysis 2013/9 2014/9E 2015/9E 2016/9E
Total assets 81 92 103 116 Gross Margin 35.4% 33.5% 33.5% 33.6%Cash and cash equivalents 28 48 59 71 EBITDA margin 9.2% 13.8% 13.7% 13.4%
Trade receivable 23 26 27 29 ROCE 2.0% 22.7% 20.4% 18.8%
Other current assets 9 9 9 9 Return on equity (ROE) 0.2% 20.7% 20.6% 18.9%
Net Tangible fixed assets 4 3 2 1 D/E ratio 0.1% 0.1% 0.1% 0.1%
Net intangible fixed assets 0 0 0 Div payout ratio 20.8% 21.6% 21.2% 19.7%Investments/other assets 6 6 6 6
Total liabilities 31 32 33 35
Short term debt 0 0 0 0
Other short term liabilities 16 16 16 16
Long term debt 0 0 0 0Other long term liabilities 1 1 1 1
Minority interests 5 6 7 8
Total Equity 50 59 70 82
Source: Company data and J.P. Morgan estimates
Note: ¥ in billions (except per-share data).Fiscal year ends Sep
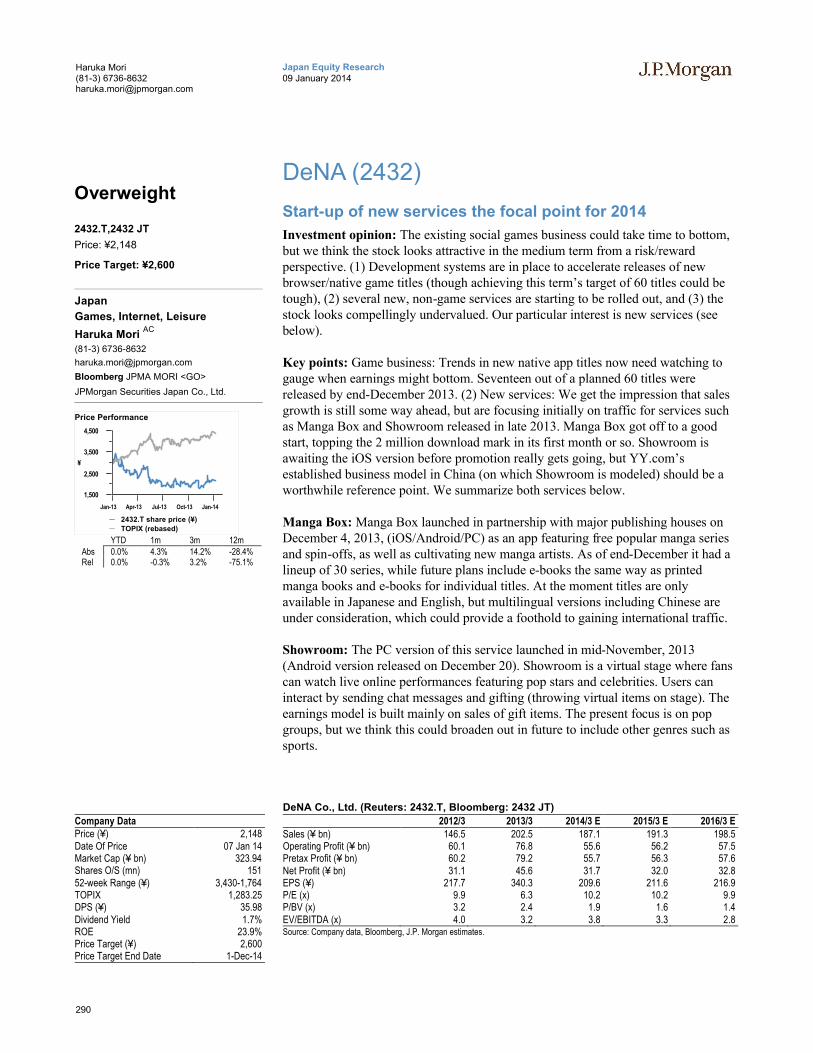
290
Japan Equity Research09 January 2014
Haruka Mori(81-3) [email protected]
DeNA (2432)
Start-up of new services the focal point for 2014
Investment opinion: The existing social games business could take time to bottom, but we think the stock looks attractive in the medium term from a risk/reward perspective. (1) Development systems are in place to accelerate releases of new browser/native game titles (though achieving this term’s target of 60 titles could be tough), (2) several new, non-game services are starting to be rolled out, and (3) the stock looks compellingly undervalued. Our particular interest is new services (see below).
Key points: Game business: Trends in new native app titles now need watching to gauge when earnings might bottom. Seventeen out of a planned 60 titles were released by end-December 2013. (2) New services: We get the impression that sales growth is still some way ahead, but are focusing initially on traffic for services such as Manga Box and Showroom released in late 2013. Manga Box got off to a good start, topping the 2 million download mark in its first month or so. Showroom is awaiting the iOS version before promotion really gets going, but YY.com’s established business model in China (on which Showroom is modeled) should be a worthwhile reference point. We summarize both services below.
Manga Box: Manga Box launched in partnership with major publishing houses on December 4, 2013, (iOS/Android/PC) as an app featuring free popular manga series and spin-offs, as well as cultivating new manga artists. As of end-December it had a lineup of 30 series, while future plans include e-books the same way as printedmanga books and e-books for individual titles. At the moment titles are only available in Japanese and English, but multilingual versions including Chinese are under consideration, which could provide a foothold to gaining international traffic.
Showroom: The PC version of this service launched in mid-November, 2013 (Android version released on December 20). Showroom is a virtual stage where fans can watch live online performances featuring pop stars and celebrities. Users can interact by sending chat messages and gifting (throwing virtual items on stage). The earnings model is built mainly on sales of gift items. The present focus is on pop groups, but we think this could broaden out in future to include other genres such as sports.
Company DataPrice (¥) 2,148Date Of Price 07 Jan 14Market Cap (¥ bn) 323.94Shares O/S (mn) 15152-week Range (¥) 3,430-1,764TOPIX 1,283.25DPS (¥) 35.98Dividend Yield 1.7%ROE 23.9%Price Target (¥) 2,600Price Target End Date 1-Dec-14
DeNA Co., Ltd. (Reuters: 2432.T, Bloomberg: 2432 JT)
2012/3 2013/3 2014/3 E 2015/3 E 2016/3 ESales (¥ bn) 146.5 202.5 187.1 191.3 198.5Operating Profit (¥ bn) 60.1 76.8 55.6 56.2 57.5Pretax Profit (¥ bn) 60.2 79.2 55.7 56.3 57.6Net Profit (¥ bn) 31.1 45.6 31.7 32.0 32.8EPS (¥) 217.7 340.3 209.6 211.6 216.9P/E (x) 9.9 6.3 10.2 10.2 9.9P/BV (x) 3.2 2.4 1.9 1.6 1.4EV/EBITDA (x) 4.0 3.2 3.8 3.3 2.8Source: Company data, Bloomberg, J.P. Morgan estimates.
Overweight
2432.T,2432 JT
Price: ¥2,148
Price Target: ¥2,600
Japan
Games, Internet, Leisure
Haruka Mori AC
(81-3) 6736-8632
Bloomberg JPMA MORI <GO>
JPMorgan Securities Japan Co., Ltd.
1,500
2,500
3,500
4,500
¥
Jan-13 Apr-13 Jul-13 Oct-13 Jan-14
Price Performance
2432.T share price (¥)
TOPIX (rebased)
YTD 1m 3m 12mAbs 0.0% 4.3% 14.2% -28.4%Rel 0.0% -0.3% 3.2% -75.1%
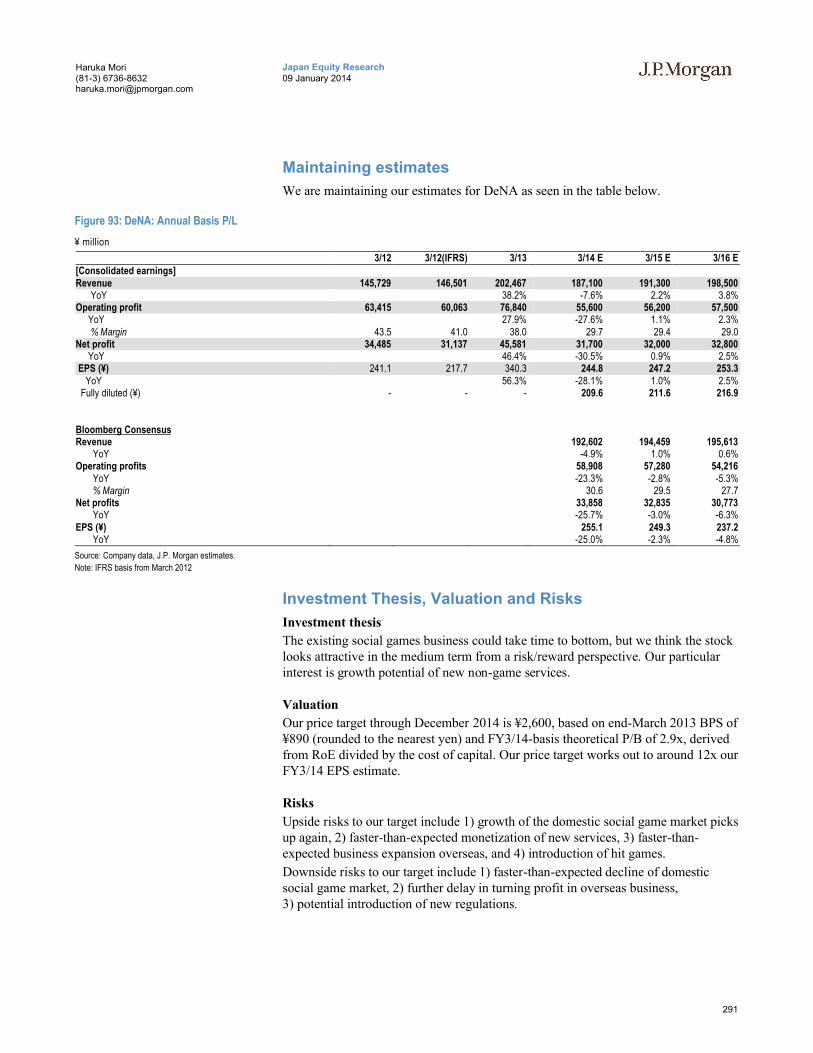
291
Japan Equity Research09 January 2014
Haruka Mori(81-3) [email protected]
Maintaining estimates
We are maintaining our estimates for DeNA as seen in the table below.
Figure 93: DeNA: Annual Basis P/L
¥ million
3/12 3/12(IFRS) 3/13 3/14 E 3/15 E 3/16 E[Consolidated earnings]Revenue 145,729 146,501 202,467 187,100 191,300 198,500 YoY 38.2% -7.6% 2.2% 3.8%Operating profit 63,415 60,063 76,840 55,600 56,200 57,500 YoY 27.9% -27.6% 1.1% 2.3% % Margin 43.5 41.0 38.0 29.7 29.4 29.0Net profit 34,485 31,137 45,581 31,700 32,000 32,800 YoY 46.4% -30.5% 0.9% 2.5%EPS (¥) 241.1 217.7 340.3 244.8 247.2 253.3
YoY 56.3% -28.1% 1.0% 2.5% Fully diluted (¥) - - - 209.6 211.6 216.9
Bloomberg ConsensusRevenue 192,602 194,459 195,613 YoY -4.9% 1.0% 0.6%Operating profits 58,908 57,280 54,216 YoY -23.3% -2.8% -5.3% % Margin 30.6 29.5 27.7Net profits 33,858 32,835 30,773 YoY -25.7% -3.0% -6.3%EPS (¥) 255.1 249.3 237.2 YoY -25.0% -2.3% -4.8%
Source: Company data, J.P. Morgan estimates.
Note: IFRS basis from March 2012
Investment Thesis, Valuation and Risks
Investment thesis
The existing social games business could take time to bottom, but we think the stock looks attractive in the medium term from a risk/reward perspective. Our particular interest is growth potential of new non-game services.
Valuation
Our price target through December 2014 is ¥2,600, based on end-March 2013 BPS of ¥890 (rounded to the nearest yen) and FY3/14-basis theoretical P/B of 2.9x, derived from RoE divided by the cost of capital. Our price target works out to around 12x our FY3/14 EPS estimate.
Risks
Upside risks to our target include 1) growth of the domestic social game market picks up again, 2) faster-than-expected monetization of new services, 3) faster-than-expected business expansion overseas, and 4) introduction of hit games.
Downside risks to our target include 1) faster-than-expected decline of domestic social game market, 2) further delay in turning profit in overseas business, 3) potential introduction of new regulations.
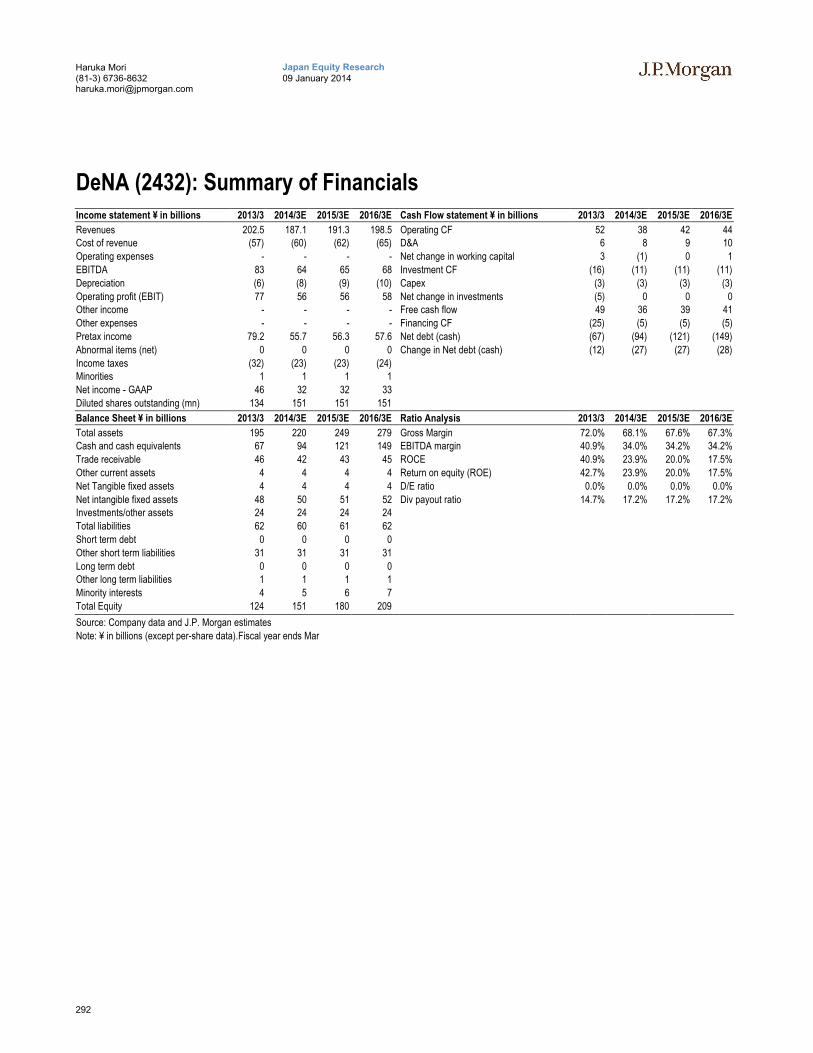
292
Japan Equity Research09 January 2014
Haruka Mori(81-3) [email protected]
DeNA (2432): Summary of FinancialsIncome statement ¥ in billions 2013/3 2014/3E 2015/3E 2016/3E Cash Flow statement ¥ in billions 2013/3 2014/3E 2015/3E 2016/3E
Revenues 202.5 187.1 191.3 198.5 Operating CF 52 38 42 44Cost of revenue (57) (60) (62) (65) D&A 6 8 9 10
Operating expenses - - - - Net change in working capital 3 (1) 0 1
EBITDA 83 64 65 68 Investment CF (16) (11) (11) (11)
Depreciation (6) (8) (9) (10) Capex (3) (3) (3) (3)
Operating profit (EBIT) 77 56 56 58 Net change in investments (5) 0 0 0Other income - - - - Free cash flow 49 36 39 41
Other expenses - - - - Financing CF (25) (5) (5) (5)
Pretax income 79.2 55.7 56.3 57.6 Net debt (cash) (67) (94) (121) (149)
Abnormal items (net) 0 0 0 0 Change in Net debt (cash) (12) (27) (27) (28)
Income taxes (32) (23) (23) (24)Minorities 1 1 1 1
Net income - GAAP 46 32 32 33
Diluted shares outstanding (mn) 134 151 151 151
Balance Sheet ¥ in billions 2013/3 2014/3E 2015/3E 2016/3E Ratio Analysis 2013/3 2014/3E 2015/3E 2016/3E
Total assets 195 220 249 279 Gross Margin 72.0% 68.1% 67.6% 67.3%Cash and cash equivalents 67 94 121 149 EBITDA margin 40.9% 34.0% 34.2% 34.2%
Trade receivable 46 42 43 45 ROCE 40.9% 23.9% 20.0% 17.5%
Other current assets 4 4 4 4 Return on equity (ROE) 42.7% 23.9% 20.0% 17.5%
Net Tangible fixed assets 4 4 4 4 D/E ratio 0.0% 0.0% 0.0% 0.0%
Net intangible fixed assets 48 50 51 52 Div payout ratio 14.7% 17.2% 17.2% 17.2%Investments/other assets 24 24 24 24
Total liabilities 62 60 61 62
Short term debt 0 0 0 0
Other short term liabilities 31 31 31 31
Long term debt 0 0 0 0Other long term liabilities 1 1 1 1
Minority interests 4 5 6 7
Total Equity 124 151 180 209
Source: Company data and J.P. Morgan estimates
Note: ¥ in billions (except per-share data).Fiscal year ends Mar
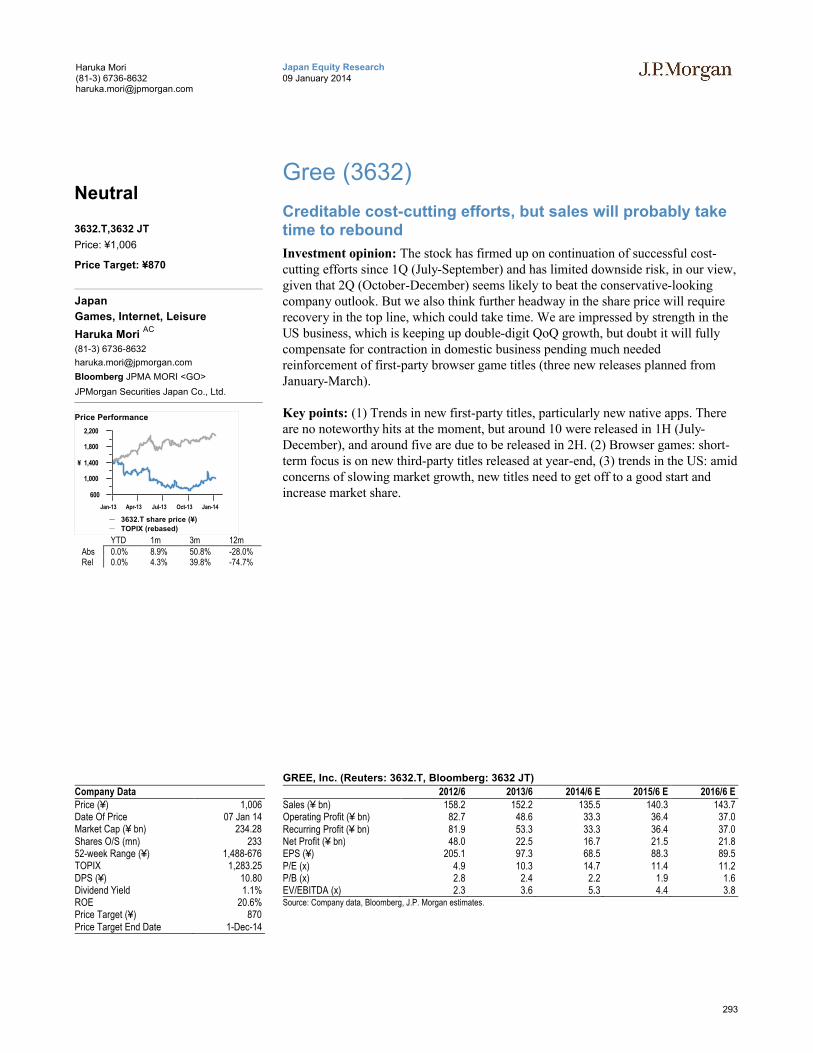
293
Japan Equity Research09 January 2014
Haruka Mori(81-3) [email protected]
Gree (3632)
Creditable cost-cutting efforts, but sales will probably take time to rebound
Investment opinion: The stock has firmed up on continuation of successful cost-cutting efforts since 1Q (July-September) and has limited downside risk, in our view, given that 2Q (October-December) seems likely to beat the conservative-looking company outlook. But we also think further headway in the share price will require recovery in the top line, which could take time. We are impressed by strength in the US business, which is keeping up double-digit QoQ growth, but doubt it will fully compensate for contraction in domestic business pending much needed reinforcement of first-party browser game titles (three new releases planned from January-March).
Key points: (1) Trends in new first-party titles, particularly new native apps. There are no noteworthy hits at the moment, but around 10 were released in 1H (July-December), and around five are due to be released in 2H. (2) Browser games: short-term focus is on new third-party titles released at year-end, (3) trends in the US: amid concerns of slowing market growth, new titles need to get off to a good start and increase market share.
Company DataPrice (¥) 1,006Date Of Price 07 Jan 14Market Cap (¥ bn) 234.28Shares O/S (mn) 23352-week Range (¥) 1,488-676TOPIX 1,283.25DPS (¥) 10.80Dividend Yield 1.1%ROE 20.6%Price Target (¥) 870Price Target End Date 1-Dec-14
GREE, Inc. (Reuters: 3632.T, Bloomberg: 3632 JT)
2012/6 2013/6 2014/6 E 2015/6 E 2016/6 ESales (¥ bn) 158.2 152.2 135.5 140.3 143.7Operating Profit (¥ bn) 82.7 48.6 33.3 36.4 37.0Recurring Profit (¥ bn) 81.9 53.3 33.3 36.4 37.0Net Profit (¥ bn) 48.0 22.5 16.7 21.5 21.8EPS (¥) 205.1 97.3 68.5 88.3 89.5P/E (x) 4.9 10.3 14.7 11.4 11.2P/B (x) 2.8 2.4 2.2 1.9 1.6EV/EBITDA (x) 2.3 3.6 5.3 4.4 3.8Source: Company data, Bloomberg, J.P. Morgan estimates.
Neutral
3632.T,3632 JT
Price: ¥1,006
Price Target: ¥870
Japan
Games, Internet, Leisure
Haruka Mori AC
(81-3) 6736-8632
Bloomberg JPMA MORI <GO>
JPMorgan Securities Japan Co., Ltd.
600
1,000
1,400
1,800
2,200
¥
Jan-13 Apr-13 Jul-13 Oct-13 Jan-14
Price Performance
3632.T share price (¥)
TOPIX (rebased)
YTD 1m 3m 12mAbs 0.0% 8.9% 50.8% -28.0%Rel 0.0% 4.3% 39.8% -74.7%
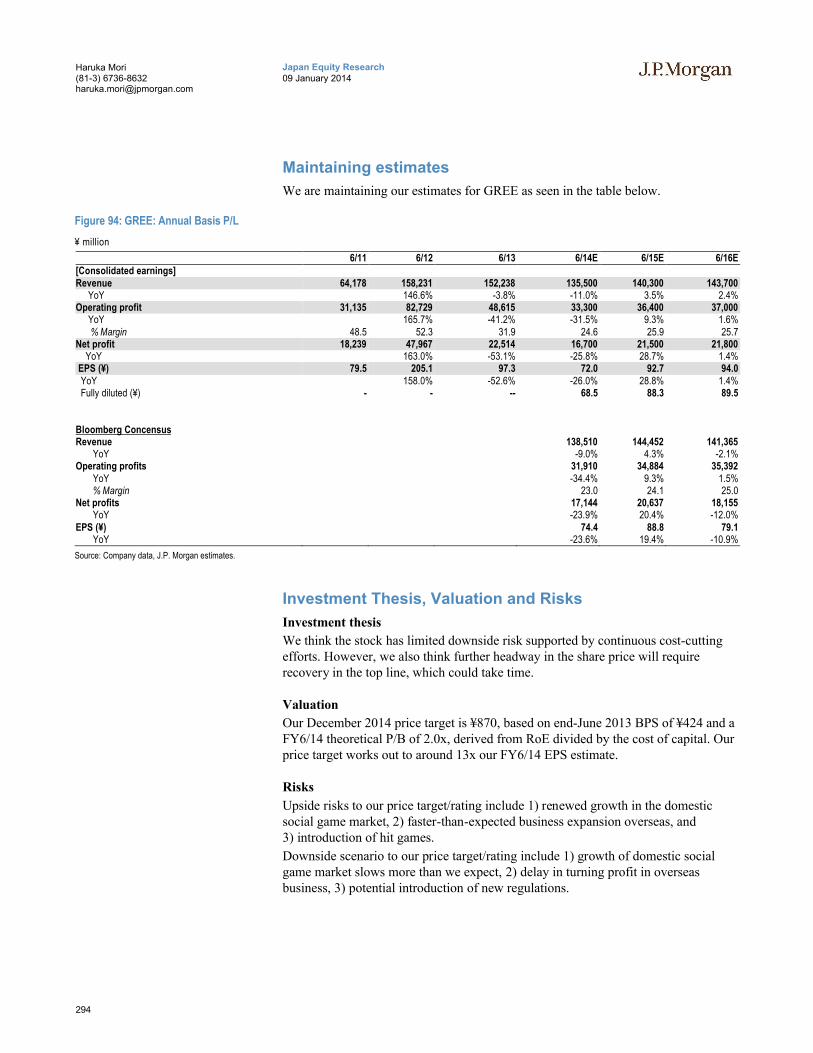
294
Japan Equity Research09 January 2014
Haruka Mori(81-3) [email protected]
Maintaining estimates
We are maintaining our estimates for GREE as seen in the table below.
Figure 94: GREE: Annual Basis P/L
¥ million
6/11 6/12 6/13 6/14E 6/15E 6/16E[Consolidated earnings]Revenue 64,178 158,231 152,238 135,500 140,300 143,700 YoY 146.6% -3.8% -11.0% 3.5% 2.4%Operating profit 31,135 82,729 48,615 33,300 36,400 37,000 YoY 165.7% -41.2% -31.5% 9.3% 1.6% % Margin 48.5 52.3 31.9 24.6 25.9 25.7Net profit 18,239 47,967 22,514 16,700 21,500 21,800 YoY 163.0% -53.1% -25.8% 28.7% 1.4%EPS (¥) 79.5 205.1 97.3 72.0 92.7 94.0YoY 158.0% -52.6% -26.0% 28.8% 1.4%
Fully diluted (¥) - - -- 68.5 88.3 89.5
Bloomberg ConcensusRevenue 138,510 144,452 141,365 YoY -9.0% 4.3% -2.1%Operating profits 31,910 34,884 35,392 YoY -34.4% 9.3% 1.5% % Margin 23.0 24.1 25.0Net profits 17,144 20,637 18,155 YoY -23.9% 20.4% -12.0%EPS (¥) 74.4 88.8 79.1 YoY -23.6% 19.4% -10.9%
Source: Company data, J.P. Morgan estimates.
Investment Thesis, Valuation and Risks
Investment thesis
We think the stock has limited downside risk supported by continuous cost-cutting efforts. However, we also think further headway in the share price will require recovery in the top line, which could take time.
Valuation
Our December 2014 price target is ¥870, based on end-June 2013 BPS of ¥424 and aFY6/14 theoretical P/B of 2.0x, derived from RoE divided by the cost of capital. Ourprice target works out to around 13x our FY6/14 EPS estimate.
Risks
Upside risks to our price target/rating include 1) renewed growth in the domestic social game market, 2) faster-than-expected business expansion overseas, and 3) introduction of hit games.
Downside scenario to our price target/rating include 1) growth of domestic social game market slows more than we expect, 2) delay in turning profit in overseas business, 3) potential introduction of new regulations.
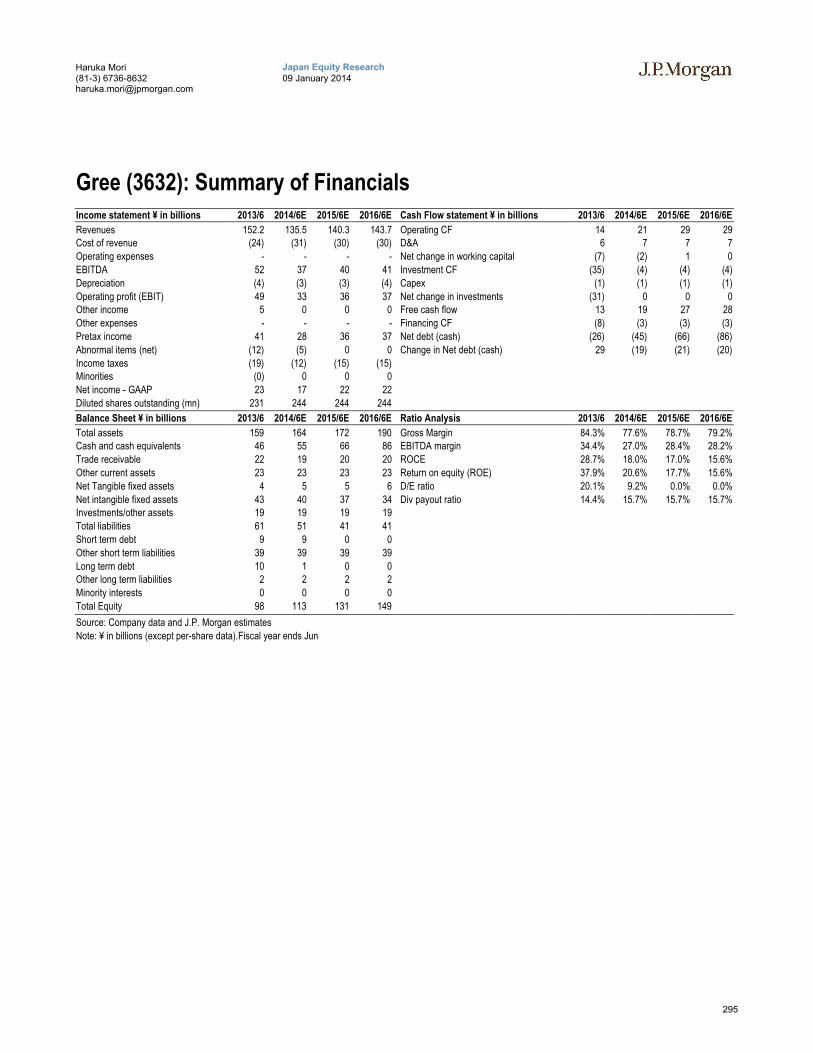
295
Japan Equity Research09 January 2014
Haruka Mori(81-3) [email protected]
Gree (3632): Summary of FinancialsIncome statement ¥ in billions 2013/6 2014/6E 2015/6E 2016/6E Cash Flow statement ¥ in billions 2013/6 2014/6E 2015/6E 2016/6E
Revenues 152.2 135.5 140.3 143.7 Operating CF 14 21 29 29Cost of revenue (24) (31) (30) (30) D&A 6 7 7 7
Operating expenses - - - - Net change in working capital (7) (2) 1 0
EBITDA 52 37 40 41 Investment CF (35) (4) (4) (4)
Depreciation (4) (3) (3) (4) Capex (1) (1) (1) (1)
Operating profit (EBIT) 49 33 36 37 Net change in investments (31) 0 0 0Other income 5 0 0 0 Free cash flow 13 19 27 28
Other expenses - - - - Financing CF (8) (3) (3) (3)
Pretax income 41 28 36 37 Net debt (cash) (26) (45) (66) (86)
Abnormal items (net) (12) (5) 0 0 Change in Net debt (cash) 29 (19) (21) (20)
Income taxes (19) (12) (15) (15)Minorities (0) 0 0 0
Net income - GAAP 23 17 22 22
Diluted shares outstanding (mn) 231 244 244 244
Balance Sheet ¥ in billions 2013/6 2014/6E 2015/6E 2016/6E Ratio Analysis 2013/6 2014/6E 2015/6E 2016/6E
Total assets 159 164 172 190 Gross Margin 84.3% 77.6% 78.7% 79.2%Cash and cash equivalents 46 55 66 86 EBITDA margin 34.4% 27.0% 28.4% 28.2%
Trade receivable 22 19 20 20 ROCE 28.7% 18.0% 17.0% 15.6%
Other current assets 23 23 23 23 Return on equity (ROE) 37.9% 20.6% 17.7% 15.6%
Net Tangible fixed assets 4 5 5 6 D/E ratio 20.1% 9.2% 0.0% 0.0%
Net intangible fixed assets 43 40 37 34 Div payout ratio 14.4% 15.7% 15.7% 15.7%Investments/other assets 19 19 19 19
Total liabilities 61 51 41 41
Short term debt 9 9 0 0
Other short term liabilities 39 39 39 39
Long term debt 10 1 0 0Other long term liabilities 2 2 2 2
Minority interests 0 0 0 0
Total Equity 98 113 131 149
Source: Company data and J.P. Morgan estimates
Note: ¥ in billions (except per-share data).Fiscal year ends Jun
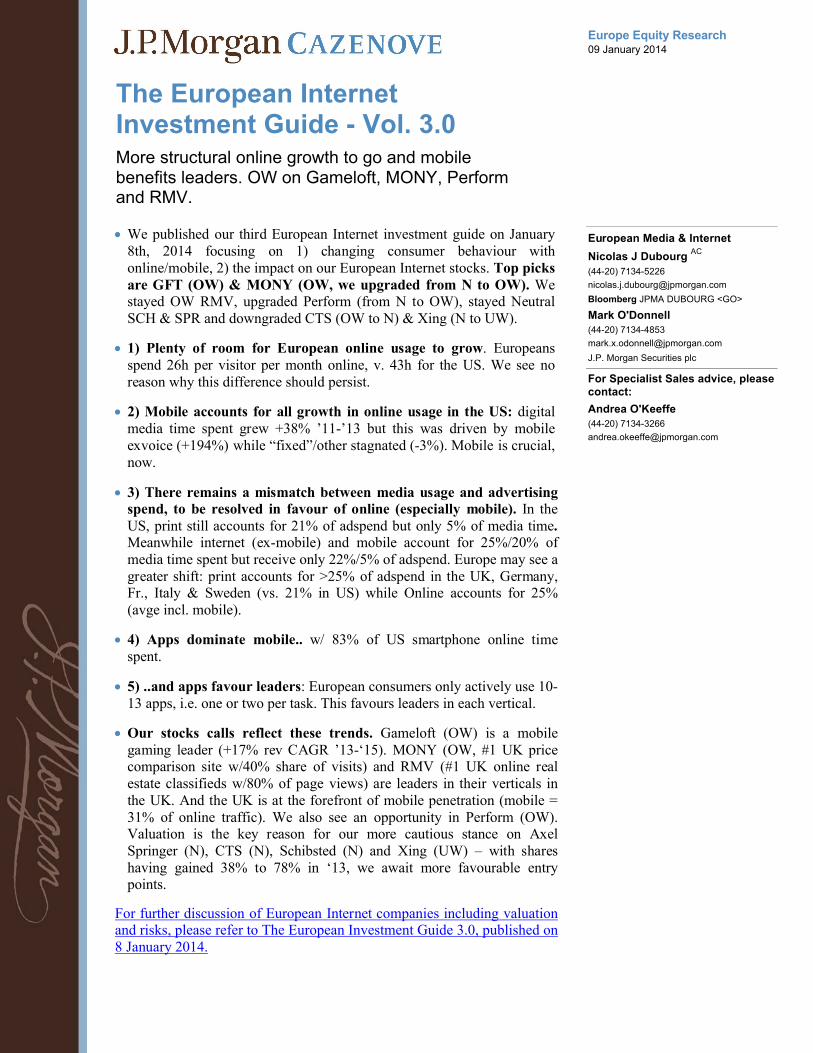
Europe Equity Research09 January 2014
The European Internet Investment Guide - Vol. 3.0More structural online growth to go and mobile benefits leaders. OW on Gameloft, MONY, Perform and RMV.
European Media & Internet
Nicolas J Dubourg AC
(44-20) 7134-5226
Bloomberg JPMA DUBOURG <GO>
Mark O'Donnell
(44-20) 7134-4853
J.P. Morgan Securities plc
For Specialist Sales advice, please contact:
Andrea O'Keeffe
(44-20) 7134-3266
We published our third European Internet investment guide on January 8th, 2014 focusing on 1) changing consumer behaviour with online/mobile, 2) the impact on our European Internet stocks. Top picks are GFT (OW) & MONY (OW, we upgraded from N to OW). We stayed OW RMV, upgraded Perform (from N to OW), stayed Neutral SCH & SPR and downgraded CTS (OW to N) & Xing (N to UW).
1) Plenty of room for European online usage to grow. Europeans spend 26h per visitor per month online, v. 43h for the US. We see no reason why this difference should persist.
2) Mobile accounts for all growth in online usage in the US: digital media time spent grew +38% ’11-’13 but this was driven by mobile exvoice (+194%) while “fixed”/other stagnated (-3%). Mobile is crucial, now.
3) There remains a mismatch between media usage and advertising spend, to be resolved in favour of online (especially mobile). In the US, print still accounts for 21% of adspend but only 5% of media time. Meanwhile internet (ex-mobile) and mobile account for 25%/20% of media time spent but receive only 22%/5% of adspend. Europe may see a greater shift: print accounts for >25% of adspend in the UK, Germany, Fr., Italy & Sweden (vs. 21% in US) while Online accounts for 25% (avge incl. mobile).
4) Apps dominate mobile.. w/ 83% of US smartphone online time spent.
5) ..and apps favour leaders: European consumers only actively use 10-13 apps, i.e. one or two per task. This favours leaders in each vertical.
Our stocks calls reflect these trends. Gameloft (OW) is a mobile gaming leader (+17% rev CAGR ’13-‘15). MONY (OW, #1 UK price comparison site w/40% share of visits) and RMV (#1 UK online real estate classifieds w/80% of page views) are leaders in their verticals in the UK. And the UK is at the forefront of mobile penetration (mobile = 31% of online traffic). We also see an opportunity in Perform (OW). Valuation is the key reason for our more cautious stance on Axel Springer (N), CTS (N), Schibsted (N) and Xing (UW) – with shares having gained 38% to 78% in ‘13, we await more favourable entry points.
For further discussion of European Internet companies including valuation and risks, please refer to The European Investment Guide 3.0, published on 8 January 2014.

297
Europe Equity Research09 January 2014
Nicolas J Dubourg(44-20) [email protected]
Please see below from our European Internet Investment guide – Vol 3.0 published 8 January 2014:
Table 22: Summary of our stock calls (part 1)
Stock Investment thesisAxel Springer (N)
We remain Neutral. We reflect i) the latest M&A and ii) peers’ recent share price appreciation in our SoP valuation multiples, we raised our target price from €40 to €47.7. Our valuation implies 9.8x EV/EBITDA’14 (for +8% EBITDA growth in ‘15) and is in line with the current share price.
On the positive side, Axel Springer vastly increased its exposure to digital in 2013, both through i) the divestments of regional German print activities and Czech print activities and ii) the acquisitions of the N24 news channel and further online classifieds in the jobs vertical. We now see digital contributing 59% of group revenues and 68% of group EBITDA in FY14 (vs. 37% in 2012), confirming Axel Springer’s status as a digital player.
However we see current value as fair given i) remaining exposure to print and ii) the nature of the group’s digital footprint, which is not just high-margin online classifieds: online newspapers/portals contributed 35% of digital EBITDA in 9M13, performance marketing 7% and Digital Classifieds 59%. Within Digital Classifieds, key assets SeLoger (French real estate) and StepStone (jobs) face competitive markets & tough macro.
CTS Eventim(N)
We continue to see CTS Eventim as well-placed to benefit from the shift of ticketing to online and we raised our Dec'14 price target from €39 to €42 reflecting good growth in 9M13. However, after a good recent run and with 14.5x EV/EBITDA’13 for +11.2% EBITDA CAGR ’13-’15, valuation no longer appears compelling and we reduced our recommendation to Neutral.
The CTS investment case is about the increasing share of tickets sold online. Consumers pay the same price for a ticket independent of the distribution channel. However, for a ticket sold offline, CTS receives on avg only €1/ticket system fee while the box office owner (CTS does not own box offices) receives a service charge of c.€6 on avg. In contrast, for a ticket sold online, CTS receives both the service and system fee (i.e. €7 on average), and therefore the migration of tickets towards online has a big effect on revenues.
Only 40% of tickets are sold online/mobile in continental Europe while this share is already 70% in the UK and 80% in the U.S. The drop-through of online sold tickets is significant – the company is guiding to 20-25% EBITDA margin per ticket for offline generated revenues while online generated revenues lead to a 55% EBITDA margin. We forecast CTS’s EBITDA margin to increase from 22.7% in 2012 to 25.4% in 2015E.
Gameloft(OW)
We remain Overweight on Gameloft with an unchanged target price of €9.50. Gameloft is one of the leading developers of games for digital platforms such as mobile phones, smartphones and tablets and, in our view, an ideal play on soaring mobile device sales along with freemium games across the globe.
The future for the online game industry looks bright: the number of smartphone subscriptions is set to triple to 5.6bn by 2019, with APAC reaching 4.7bn. Within mobile use, gaming is the 3rd most popular activity (6h per month, source: Ericsson mobility report, November).
And Gameloft is likely to be a key beneficiary due to 1) unparalleled mobile exposure: games on smartphones and tablets made up 69% of Gameloft’s revenues in Q313 (mobile 98% of Q2 in total), 2) great geographical exposure: LatAm and APAC already made up 36% of revenues in Q3, 3) focus on freemium: sales of virtual goods and advertising within games accounted for 80% of Gameloft’s Q3 smartphone revenues, offering access to gamers at lower price points and recurring revenues from a given game, 4) limited single-game risk: no game contributes over 10% of revenues, so Gameloft is not dependent on one hit.
On our estimates, +17% revenues CAGR’13-’15 translates into +37% EBITDA CAGR even as, we assume c.60% of adj. operating costs are fixed (i.e. growing at c.7% p.a. to FY15), with the remainder growing in line with sales. Gameloft stopped hiring in August 2012 (having significantly built up its game developing capacity) and signaled that up to 80% of costs are fixed. H113 results/FY13 guidance then confirmed operating leverage is kicking in. Gameloft may further boost profitability as it reduces its annual slate to 15-20 games by 2014 (vs. FY13’s 22) and focuses on evolving successful games.
Gameloft shares are trading on 12.7x 2013E EV/EBITDA which we see as attractive given Gameloft’s 13E-15E EBITDA CAGR of +37%. We left our estimates unchanged and our EBIT estimate is +10% ahead of BBG consensus in ‘14.
Moneysupermarket(OW)
We returned to an O/W position on the leader in UK online price comparison (from N) as i) ST uncertainty is reduced (Q3 results and FY13 guidance have shown some stabilization/recovery since the flat y/y revenues of July) ii) the Money vertical (c.30% of revs revs’12) will no longer suffer from tough comparables from Q413/Q114 and iii) the structural growth opportunity remains: more customers could switch providers and do so online: switches/new purchases still make up only 26%/13%/16% of yearly market volumes in the key home insurance, cards and energy verticals and only 55%/56%/32% of those purchases occur online, vs. 44%/81% for motor insurance. The next catalyst will be the Q4 post close update on January 14.
Energy is providing a case study to support the structural growth view: prospects for Energy price comparison websites have boomed with i) recent increases in UK Energy prices, which have prompted 900k households to switch providers in Oct/Nov’13 and ii) the end of doorstep-selling in 2012, which leaves more space for online sales. We see Energy contributing £20m to MONY revenues in FY13 (c.9% of group revenues, vs. £8-9m in FY12), rising progressively thereafter. Our MONY Energy revenue estimate for 2016 is consistent with i) 5.6m Energy customers switching providers overall in the UK (no change vs. 2012) ii) 50% doing so online (vs. 32% for Energy in 2012 and 55% for Home Insurance) iii) MONY taking a 16% market share of online switches (more than the c.9% we estimate for 2012 but less than MONY’s apparent share in October’13), at JPMe c.£60 fee per switch
We also see increasing mobile adoption favouring MONY. MONY is the market leader in the financial price comparison market (>40% share of visits) and we expect their app to be the leader. Mobile users have only a few apps they use on a regular base- this creates significant barriers to entry and increases market share.
We raised our EPS estimates by +4%/+2% in ‘13/’14 and are in line/+5% ahead of BBG. We removed our 5% discount to fair value for low operating visibility and raised our Dec-14E DCF-based PT (WACC of 9%, g 2%) from 192p to 211p. MONY trades at 12.6x EV/EBITDA’13 for 9% EBITDA CAGR’13-’15 but also a highly competitive 6.3% Equity FCF yield ’14 & 4.1% dividend yield ’14. Our Bull case offers a DCF value of 236p and 28% upside.
Source: J.P. Morgan estimates, Bloomberg, COB 3 January 2013
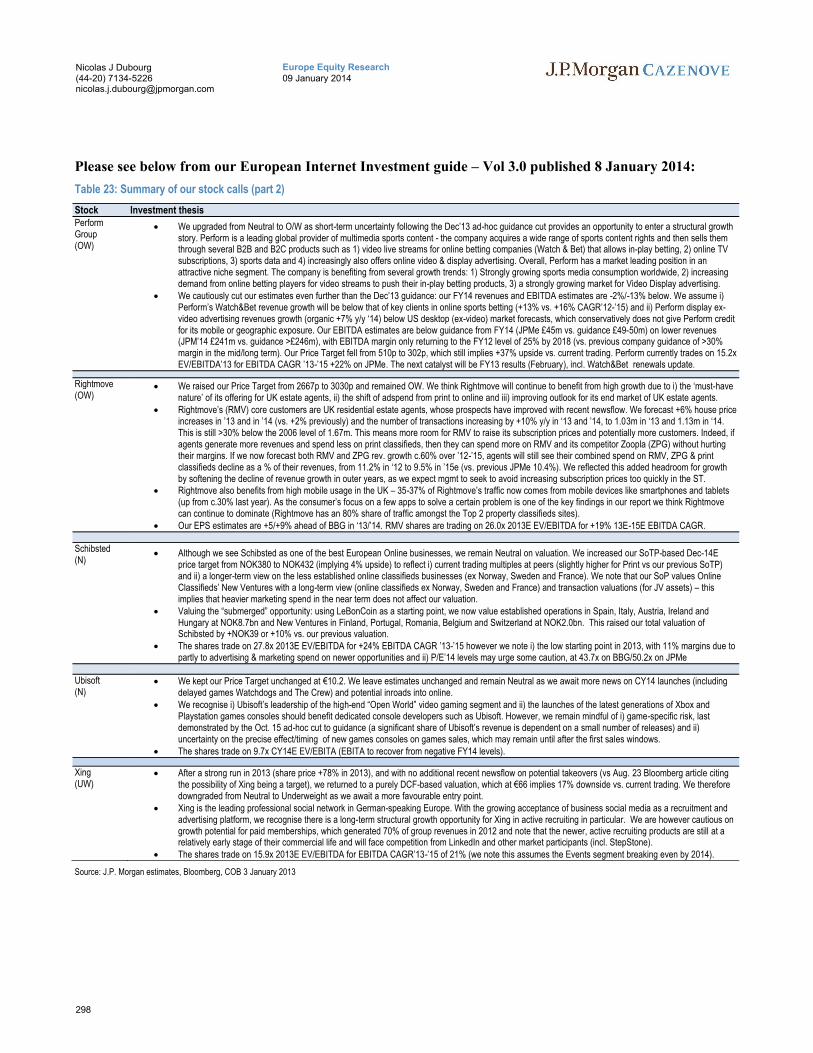
298
Europe Equity Research09 January 2014
Nicolas J Dubourg(44-20) [email protected]
Please see below from our European Internet Investment guide – Vol 3.0 published 8 January 2014:
Table 23: Summary of our stock calls (part 2)
Stock Investment thesisPerform Group(OW)
We upgraded from Neutral to O/W as short-term uncertainty following the Dec’13 ad-hoc guidance cut provides an opportunity to enter a structural growth story. Perform is a leading global provider of multimedia sports content - the company acquires a wide range of sports content rights and then sells them through several B2B and B2C products such as 1) video live streams for online betting companies (Watch & Bet) that allows in-play betting, 2) online TV subscriptions, 3) sports data and 4) increasingly also offers online video & display advertising. Overall, Perform has a market leading position in an attractive niche segment. The company is benefiting from several growth trends: 1) Strongly growing sports media consumption worldwide, 2) increasing demand from online betting players for video streams to push their in-play betting products, 3) a strongly growing market for Video Display advertising.
We cautiously cut our estimates even further than the Dec’13 guidance: our FY14 revenues and EBITDA estimates are -2%/-13% below. We assume i) Perform’s Watch&Bet revenue growth will be below that of key clients in online sports betting (+13% vs. +16% CAGR’12-’15) and ii) Perform display ex-video advertising revenues growth (organic +7% y/y ‘14) below US desktop (ex-video) market forecasts, which conservatively does not give Perform credit for its mobile or geographic exposure. Our EBITDA estimates are below guidance from FY14 (JPMe £45m vs. guidance £49-50m) on lower revenues (JPM’14 £241m vs. guidance >£246m), with EBITDA margin only returning to the FY12 level of 25% by 2018 (vs. previous company guidance of >30% margin in the mid/long term). Our Price Target fell from 510p to 302p, which still implies +37% upside vs. current trading. Perform currently trades on 15.2x EV/EBITDA’13 for EBITDA CAGR ’13-’15 +22% on JPMe. The next catalyst will be FY13 results (February), incl. Watch&Bet renewals update.
Rightmove(OW)
We raised our Price Target from 2667p to 3030p and remained OW. We think Rightmove will continue to benefit from high growth due to i) the ‘must-have nature’ of its offering for UK estate agents, ii) the shift of adspend from print to online and iii) improving outlook for its end market of UK estate agents.
Rightmove’s (RMV) core customers are UK residential estate agents, whose prospects have improved with recent newsflow. We forecast +6% house price increases in ’13 and in ’14 (vs. +2% previously) and the number of transactions increasing by +10% y/y in ‘13 and ’14, to 1.03m in ‘13 and 1.13m in ‘14. This is still >30% below the 2006 level of 1.67m. This means more room for RMV to raise its subscription prices and potentially more customers. Indeed, if agents generate more revenues and spend less on print classifieds, then they can spend more on RMV and its competitor Zoopla (ZPG) without hurting their margins. If we now forecast both RMV and ZPG rev. growth c.60% over ’12-’15, agents will still see their combined spend on RMV, ZPG & print classifieds decline as a % of their revenues, from 11.2% in ‘12 to 9.5% in ’15e (vs. previous JPMe 10.4%). We reflected this added headroom for growth by softening the decline of revenue growth in outer years, as we expect mgmt to seek to avoid increasing subscription prices too quickly in the ST.
Rightmove also benefits from high mobile usage in the UK – 35-37% of Rightmove’s traffic now comes from mobile devices like smartphones and tablets (up from c.30% last year). As the consumer’s focus on a few apps to solve a certain problem is one of the key findings in our report we think Rightmove can continue to dominate (Rightmove has an 80% share of traffic amongst the Top 2 property classifieds sites).
Our EPS estimates are +5/+9% ahead of BBG in ‘13/’14. RMV shares are trading on 26.0x 2013E EV/EBITDA for +19% 13E-15E EBITDA CAGR.
Schibsted(N)
Although we see Schibsted as one of the best European Online businesses, we remain Neutral on valuation. We increased our SoTP-based Dec-14E price target from NOK380 to NOK432 (implying 4% upside) to reflect i) current trading multiples at peers (slightly higher for Print vs our previous SoTP) and ii) a longer-term view on the less established online classifieds businesses (ex Norway, Sweden and France). We note that our SoP values Online Classifieds’ New Ventures with a long-term view (online classifieds ex Norway, Sweden and France) and transaction valuations (for JV assets) – this implies that heavier marketing spend in the near term does not affect our valuation.
Valuing the “submerged” opportunity: using LeBonCoin as a starting point, we now value established operations in Spain, Italy, Austria, Ireland and Hungary at NOK8.7bn and New Ventures in Finland, Portugal, Romania, Belgium and Switzerland at NOK2.0bn. This raised our total valuation of Schibsted by +NOK39 or +10% vs. our previous valuation.
The shares trade on 27.8x 2013E EV/EBITDA for +24% EBITDA CAGR ’13-’15 however we note i) the low starting point in 2013, with 11% margins due to partly to advertising & marketing spend on newer opportunities and ii) P/E’14 levels may urge some caution, at 43.7x on BBG/50.2x on JPMe
Ubisoft(N)
We kept our Price Target unchanged at €10.2. We leave estimates unchanged and remain Neutral as we await more news on CY14 launches (including delayed games Watchdogs and The Crew) and potential inroads into online.
We recognise i) Ubisoft’s leadership of the high-end “Open World” video gaming segment and ii) the launches of the latest generations of Xbox and Playstation games consoles should benefit dedicated console developers such as Ubisoft. However, we remain mindful of i) game-specific risk, last demonstrated by the Oct. 15 ad-hoc cut to guidance (a significant share of Ubisoft’s revenue is dependent on a small number of releases) and ii) uncertainty on the precise effect/timing of new games consoles on games sales, which may remain until after the first sales windows.
The shares trade on 9.7x CY14E EV/EBITA (EBITA to recover from negative FY14 levels).
Xing(UW)
After a strong run in 2013 (share price +78% in 2013), and with no additional recent newsflow on potential takeovers (vs Aug. 23 Bloomberg article citing the possibility of Xing being a target), we returned to a purely DCF-based valuation, which at €66 implies 17% downside vs. current trading. We therefore downgraded from Neutral to Underweight as we await a more favourable entry point.
Xing is the leading professional social network in German-speaking Europe. With the growing acceptance of business social media as a recruitment and advertising platform, we recognise there is a long-term structural growth opportunity for Xing in active recruiting in particular. We are however cautious on growth potential for paid memberships, which generated 70% of group revenues in 2012 and note that the newer, active recruiting products are still at a relatively early stage of their commercial life and will face competition from LinkedIn and other market participants (incl. StepStone).
The shares trade on 15.9x 2013E EV/EBITDA for EBITDA CAGR’13-’15 of 21% (we note this assumes the Events segment breaking even by 2014).
Source: J.P. Morgan estimates, Bloomberg, COB 3 January 2013
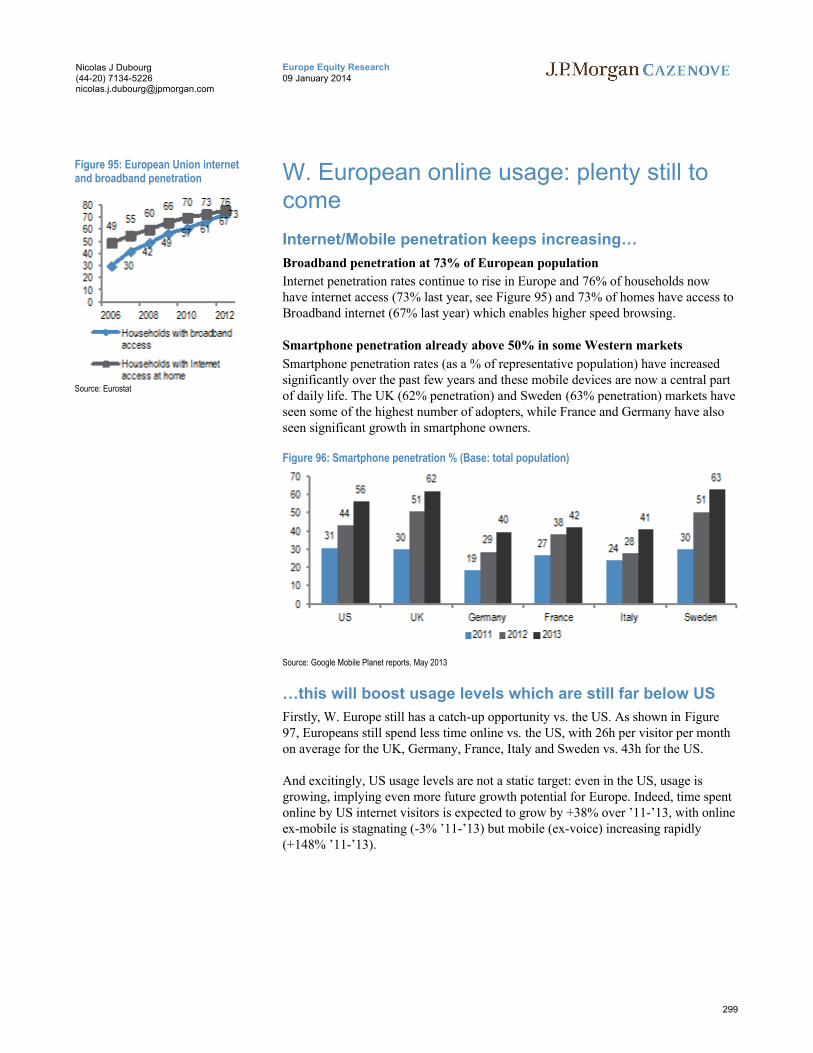
299
Europe Equity Research09 January 2014
Nicolas J Dubourg(44-20) [email protected]
W. European online usage: plenty still to come
Internet/Mobile penetration keeps increasing…
Broadband penetration at 73% of European population
Internet penetration rates continue to rise in Europe and 76% of households now have internet access (73% last year, see Figure 95) and 73% of homes have access to Broadband internet (67% last year) which enables higher speed browsing.
Smartphone penetration already above 50% in some Western markets
Smartphone penetration rates (as a % of representative population) have increased significantly over the past few years and these mobile devices are now a central part of daily life. The UK (62% penetration) and Sweden (63% penetration) markets have seen some of the highest number of adopters, while France and Germany have also seen significant growth in smartphone owners.
Figure 96: Smartphone penetration % (Base: total population)
Source: Google Mobile Planet reports, May 2013
…this will boost usage levels which are still far below US
Firstly, W. Europe still has a catch-up opportunity vs. the US. As shown in Figure 97, Europeans still spend less time online vs. the US, with 26h per visitor per month on average for the UK, Germany, France, Italy and Sweden vs. 43h for the US.
And excitingly, US usage levels are not a static target: even in the US, usage is growing, implying even more future growth potential for Europe. Indeed, time spent online by US internet visitors is expected to grow by +38% over ’11-’13, with online ex-mobile is stagnating (-3% ’11-’13) but mobile (ex-voice) increasing rapidly (+148% ’11-’13).
Figure 95: European Union internet and broadband penetration
Source: Eurostat
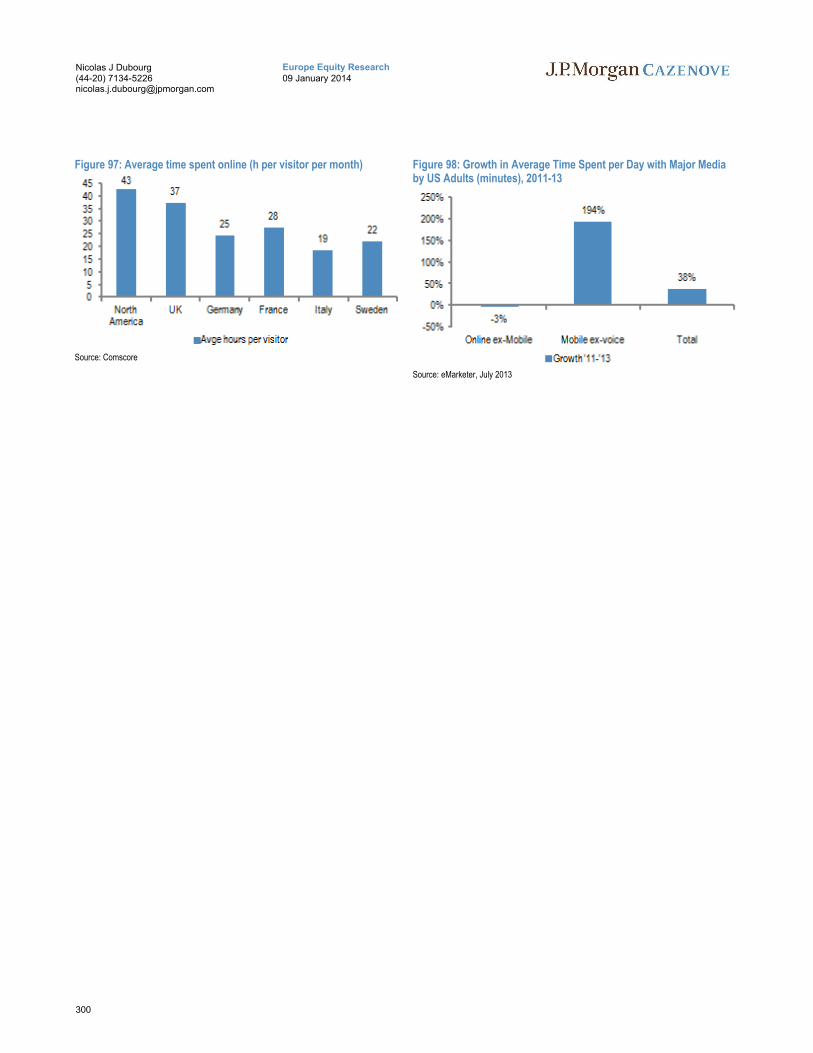
300
Europe Equity Research09 January 2014
Nicolas J Dubourg(44-20) [email protected]
Figure 97: Average time spent online (h per visitor per month)
Source: Comscore
Figure 98: Growth in Average Time Spent per Day with Major Media by US Adults (minutes), 2011-13
Source: eMarketer, July 2013
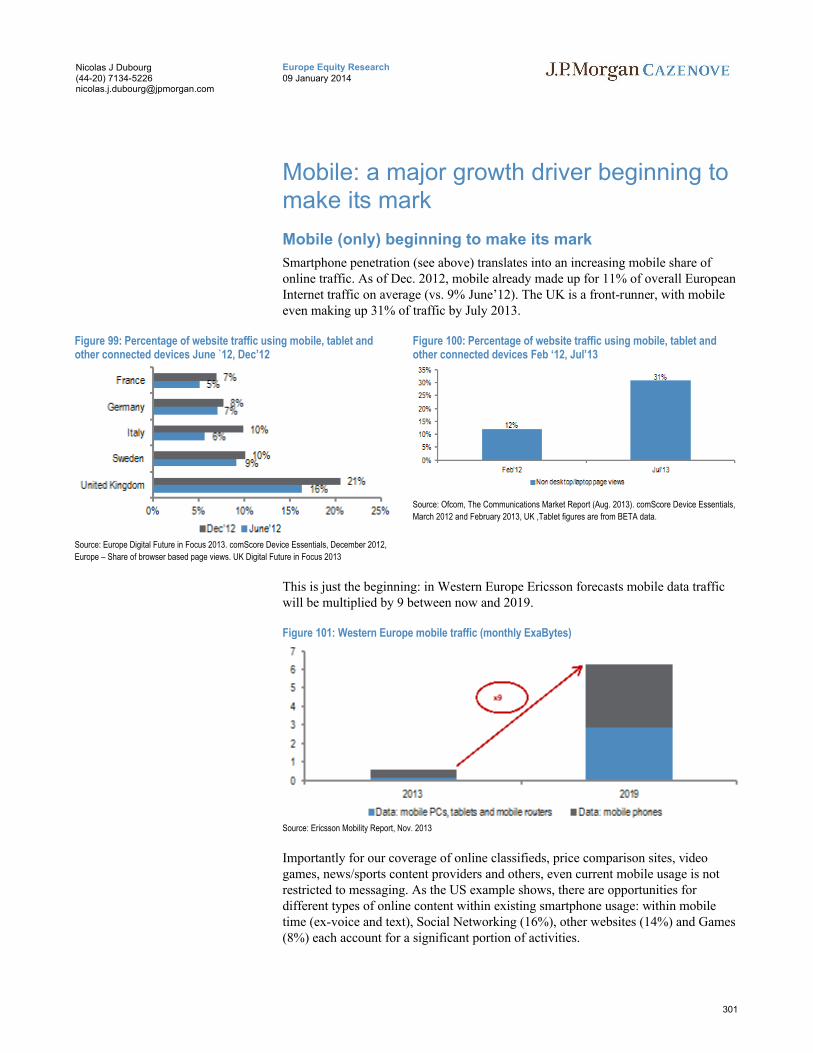
301
Europe Equity Research09 January 2014
Nicolas J Dubourg(44-20) [email protected]
Mobile: a major growth driver beginning tomake its mark
Mobile (only) beginning to make its mark
Smartphone penetration (see above) translates into an increasing mobile share of online traffic. As of Dec. 2012, mobile already made up for 11% of overall European Internet traffic on average (vs. 9% June’12). The UK is a front-runner, with mobile even making up 31% of traffic by July 2013.
Figure 99: Percentage of website traffic using mobile, tablet and other connected devices June `12, Dec’12
Source: Europe Digital Future in Focus 2013. comScore Device Essentials, December 2012,
Europe – Share of browser based page views. UK Digital Future in Focus 2013
Figure 100: Percentage of website traffic using mobile, tablet and other connected devices Feb ‘12, Jul’13
Source: Ofcom, The Communications Market Report (Aug. 2013). comScore Device Essentials,
March 2012 and February 2013, UK ,Tablet figures are from BETA data.
This is just the beginning: in Western Europe Ericsson forecasts mobile data trafficwill be multiplied by 9 between now and 2019.
Figure 101: Western Europe mobile traffic (monthly ExaBytes)
Source: Ericsson Mobility Report, Nov. 2013
Importantly for our coverage of online classifieds, price comparison sites, video games, news/sports content providers and others, even current mobile usage is not restricted to messaging. As the US example shows, there are opportunities for different types of online content within existing smartphone usage: within mobile time (ex-voice and text), Social Networking (16%), other websites (14%) and Games (8%) each account for a significant portion of activities.
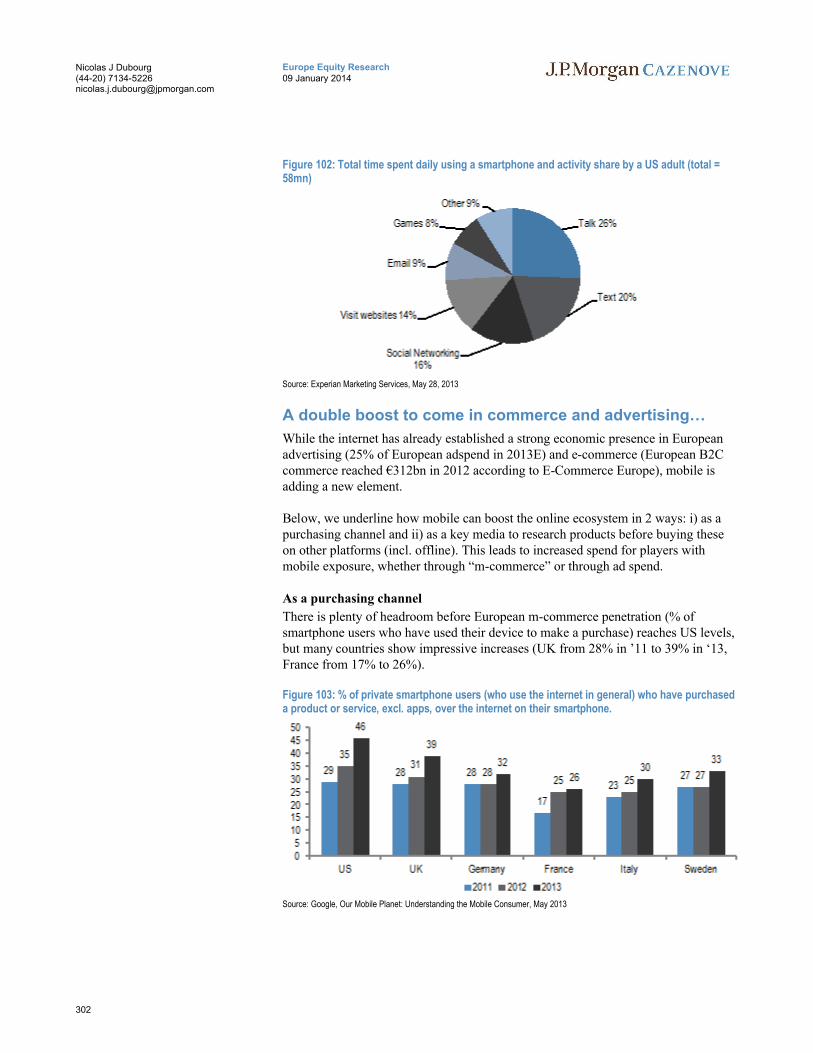
302
Europe Equity Research09 January 2014
Nicolas J Dubourg(44-20) [email protected]
Figure 102: Total time spent daily using a smartphone and activity share by a US adult (total = 58mn)
Source: Experian Marketing Services, May 28, 2013
A double boost to come in commerce and advertising…
While the internet has already established a strong economic presence in European advertising (25% of European adspend in 2013E) and e-commerce (European B2C commerce reached €312bn in 2012 according to E-Commerce Europe), mobile is adding a new element.
Below, we underline how mobile can boost the online ecosystem in 2 ways: i) as a purchasing channel and ii) as a key media to research products before buying these on other platforms (incl. offline). This leads to increased spend for players with mobile exposure, whether through “m-commerce” or through ad spend.
As a purchasing channel
There is plenty of headroom before European m-commerce penetration (% of smartphone users who have used their device to make a purchase) reaches US levels, but many countries show impressive increases (UK from 28% in ’11 to 39% in ‘13, France from 17% to 26%).
Figure 103: % of private smartphone users (who use the internet in general) who have purchased a product or service, excl. apps, over the internet on their smartphone.
Source: Google, Our Mobile Planet: Understanding the Mobile Consumer, May 2013
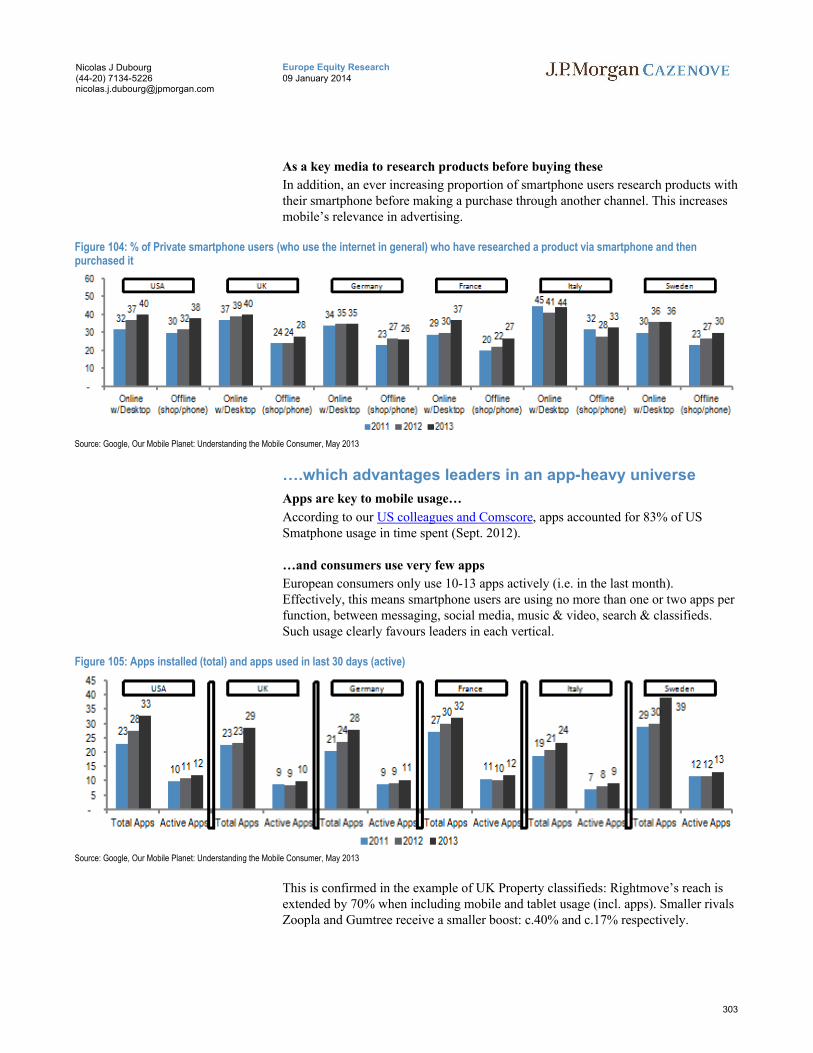
303
Europe Equity Research09 January 2014
Nicolas J Dubourg(44-20) [email protected]
As a key media to research products before buying these
In addition, an ever increasing proportion of smartphone users research products with their smartphone before making a purchase through another channel. This increases mobile’s relevance in advertising.
Figure 104: % of Private smartphone users (who use the internet in general) who have researched a product via smartphone and then purchased it
Source: Google, Our Mobile Planet: Understanding the Mobile Consumer, May 2013
….which advantages leaders in an app-heavy universe
Apps are key to mobile usage…
According to our US colleagues and Comscore, apps accounted for 83% of US Smatphone usage in time spent (Sept. 2012).
…and consumers use very few apps
European consumers only use 10-13 apps actively (i.e. in the last month). Effectively, this means smartphone users are using no more than one or two apps per function, between messaging, social media, music & video, search & classifieds. Such usage clearly favours leaders in each vertical.
Figure 105: Apps installed (total) and apps used in last 30 days (active)
Source: Google, Our Mobile Planet: Understanding the Mobile Consumer, May 2013
This is confirmed in the example of UK Property classifieds: Rightmove’s reach is extended by 70% when including mobile and tablet usage (incl. apps). Smaller rivals Zoopla and Gumtree receive a smaller boost: c.40% and c.17% respectively.
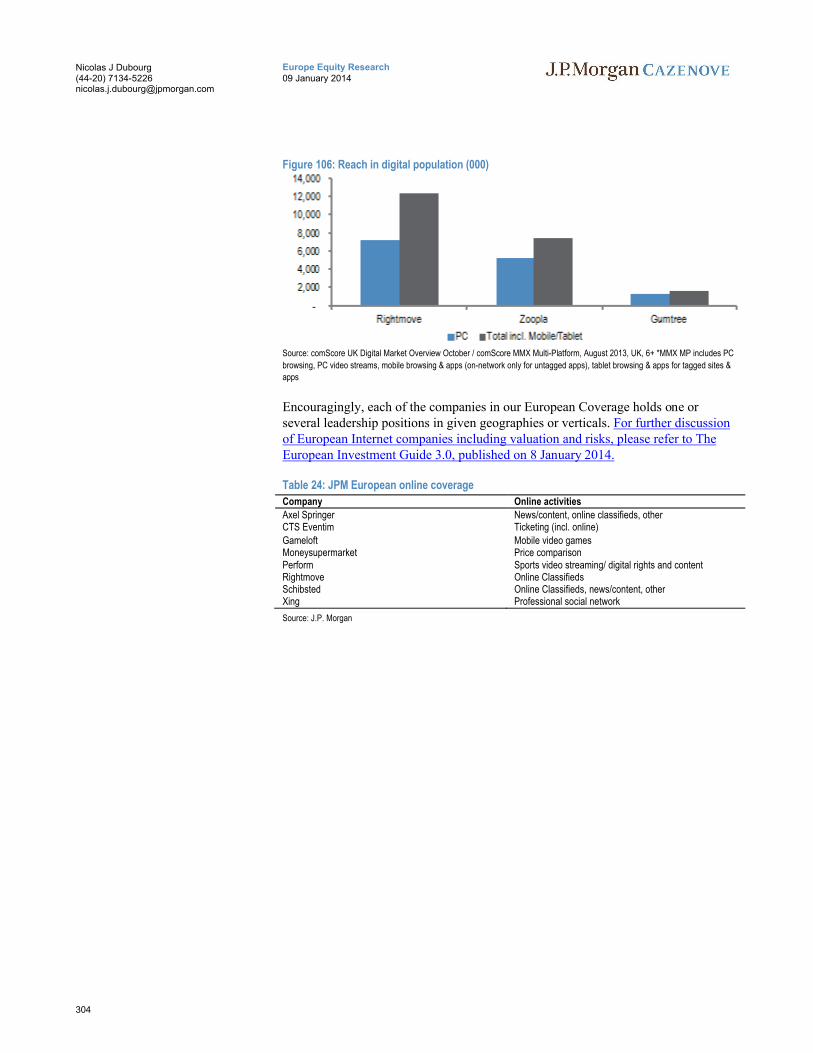
304
Europe Equity Research09 January 2014
Nicolas J Dubourg(44-20) [email protected]
Figure 106: Reach in digital population (000)
Source: comScore UK Digital Market Overview October / comScore MMX Multi-Platform, August 2013, UK, 6+ *MMX MP includes PC
browsing, PC video streams, mobile browsing & apps (on-network only for untagged apps), tablet browsing & apps for tagged sites &
apps
Encouragingly, each of the companies in our European Coverage holds one or several leadership positions in given geographies or verticals. For further discussion of European Internet companies including valuation and risks, please refer to The European Investment Guide 3.0, published on 8 January 2014.
Table 24: JPM European online coverage
Company Online activities
Axel Springer News/content, online classifieds, otherCTS Eventim Ticketing (incl. online)
Gameloft Mobile video gamesMoneysupermarket Price comparisonPerform Sports video streaming/ digital rights and contentRightmove Online ClassifiedsSchibsted Online Classifieds, news/content, otherXing Professional social network
Source: J.P. Morgan
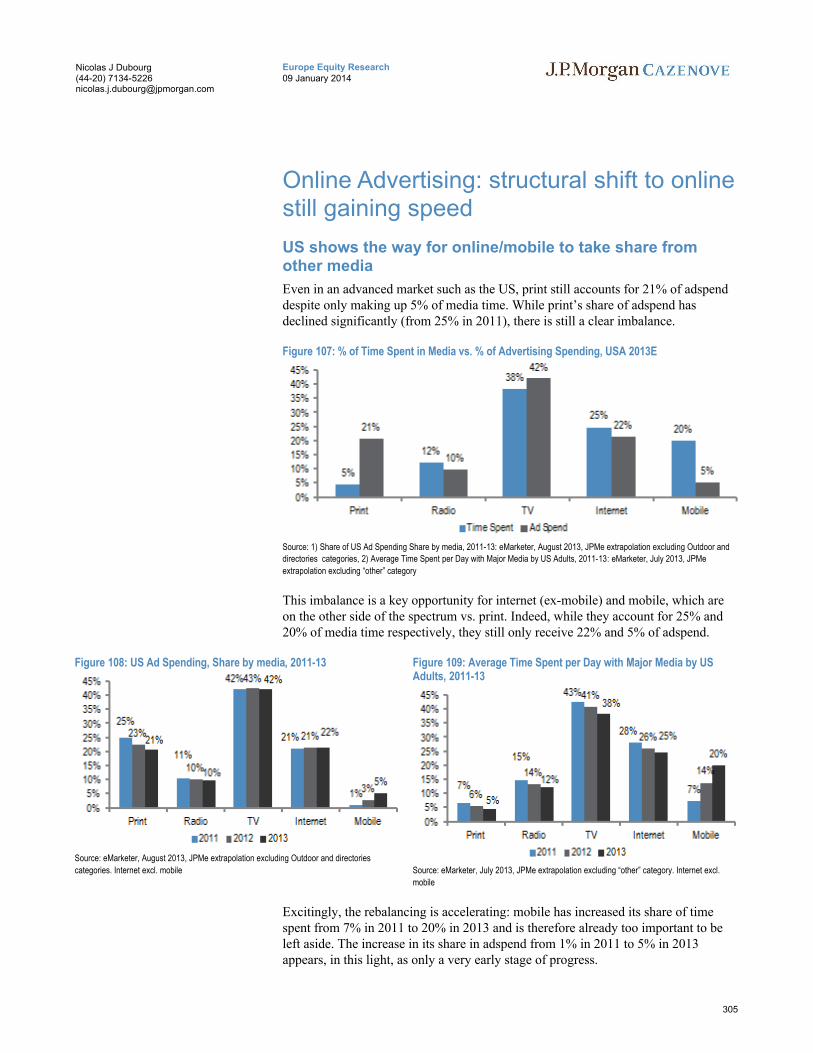
305
Europe Equity Research09 January 2014
Nicolas J Dubourg(44-20) [email protected]
Online Advertising: structural shift to online still gaining speed
US shows the way for online/mobile to take share from other media
Even in an advanced market such as the US, print still accounts for 21% of adspend despite only making up 5% of media time. While print’s share of adspend has declined significantly (from 25% in 2011), there is still a clear imbalance.
Figure 107: % of Time Spent in Media vs. % of Advertising Spending, USA 2013E
Source: 1) Share of US Ad Spending Share by media, 2011-13: eMarketer, August 2013, JPMe extrapolation excluding Outdoor and
directories categories, 2) Average Time Spent per Day with Major Media by US Adults, 2011-13: eMarketer, July 2013, JPMe
extrapolation excluding “other” category
This imbalance is a key opportunity for internet (ex-mobile) and mobile, which are on the other side of the spectrum vs. print. Indeed, while they account for 25% and 20% of media time respectively, they still only receive 22% and 5% of adspend.
Figure 108: US Ad Spending, Share by media, 2011-13
Source: eMarketer, August 2013, JPMe extrapolation excluding Outdoor and directories
categories. Internet excl. mobile
Figure 109: Average Time Spent per Day with Major Media by US Adults, 2011-13
Source: eMarketer, July 2013, JPMe extrapolation excluding “other” category. Internet excl.
mobile
Excitingly, the rebalancing is accelerating: mobile has increased its share of time spent from 7% in 2011 to 20% in 2013 and is therefore already too important to be left aside. The increase in its share in adspend from 1% in 2011 to 5% in 2013 appears, in this light, as only a very early stage of progress.
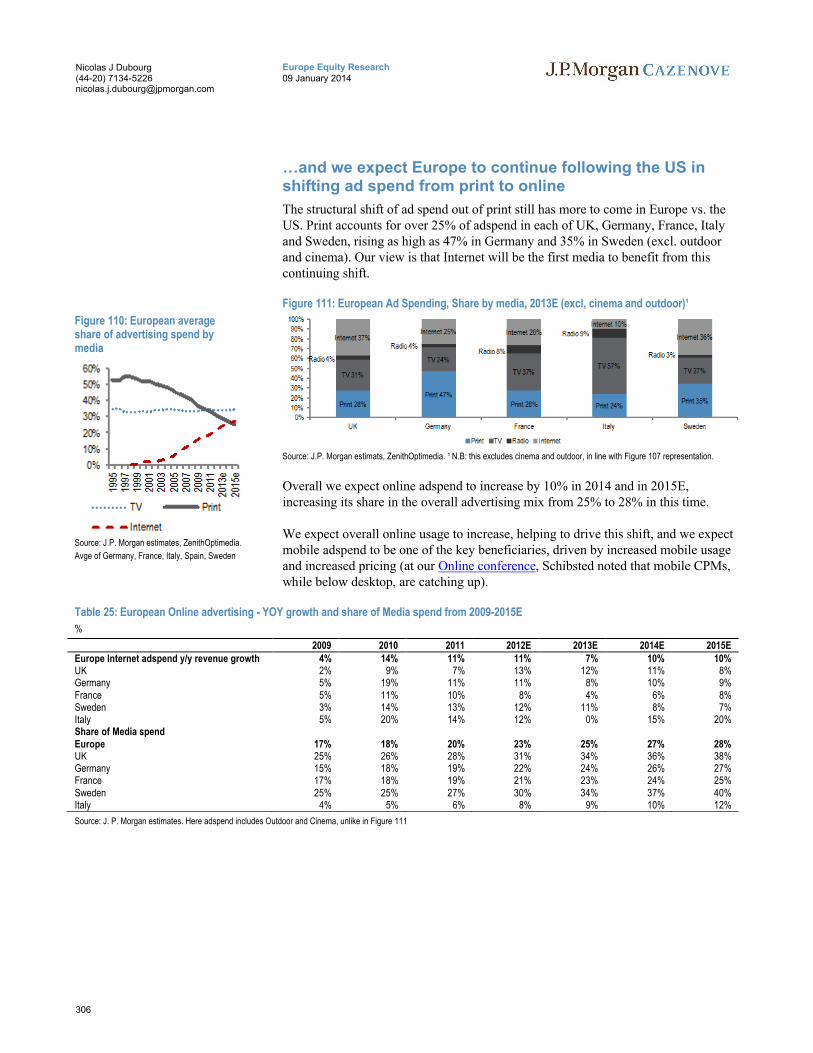
306
Europe Equity Research09 January 2014
Nicolas J Dubourg(44-20) [email protected]
…and we expect Europe to continue following the US in shifting ad spend from print to online
The structural shift of ad spend out of print still has more to come in Europe vs. the US. Print accounts for over 25% of adspend in each of UK, Germany, France, Italy and Sweden, rising as high as 47% in Germany and 35% in Sweden (excl. outdoor and cinema). Our view is that Internet will be the first media to benefit from this continuing shift.
Figure 111: European Ad Spending, Share by media, 2013E (excl, cinema and outdoor)¹
Source: J.P. Morgan estimats, ZenithOptimedia. ¹ N.B: this excludes cinema and outdoor, in line with Figure 107 representation.
Overall we expect online adspend to increase by 10% in 2014 and in 2015E, increasing its share in the overall advertising mix from 25% to 28% in this time.
We expect overall online usage to increase, helping to drive this shift, and we expect mobile adspend to be one of the key beneficiaries, driven by increased mobile usage and increased pricing (at our Online conference, Schibsted noted that mobile CPMs,while below desktop, are catching up).
Table 25: European Online advertising - YOY growth and share of Media spend from 2009-2015E
%
2009 2010 2011 2012E 2013E 2014E 2015EEurope Internet adspend y/y revenue growth 4% 14% 11% 11% 7% 10% 10%UK 2% 9% 7% 13% 12% 11% 8%Germany 5% 19% 11% 11% 8% 10% 9%France 5% 11% 10% 8% 4% 6% 8%Sweden 3% 14% 13% 12% 11% 8% 7%Italy 5% 20% 14% 12% 0% 15% 20%Share of Media spendEurope 17% 18% 20% 23% 25% 27% 28%UK 25% 26% 28% 31% 34% 36% 38%Germany 15% 18% 19% 22% 24% 26% 27%France 17% 18% 19% 21% 23% 24% 25%Sweden 25% 25% 27% 30% 34% 37% 40%Italy 4% 5% 6% 8% 9% 10% 12%
Source: J. P. Morgan estimates. Here adspend includes Outdoor and Cinema, unlike in Figure 111
Figure 110: European average share of advertising spend by media
Source: J.P. Morgan estimates, ZenithOptimedia.
Avge of Germany, France, Italy, Spain, Sweden
CEEMEA Equity Research09 January 2014
Equity Ratings and Price Targets
Mkt Cap Rating Price TargetCompany Ticker ($ mn) Price ($) Cur Prev Cur PrevMail.ru Group MAIL LI 8,894.83 42.64 OW n/c 44.00 n/cYandex YNDX US 13,982.34 42.91 OW n/c 50.00 n/cSource: Company data, Bloomberg, J.P. Morgan estimates. n/c = no change. All prices as of 6 Jan 14.
Russian Internet2014 Internet Outlook
CEEMEA Media & Telecoms
Alexei Gogolev AC
(7-495) 967-1029
Bloomberg JPMA GOGOLEV <GO>
J.P. Morgan Bank International LLC
Despite having become Europe’s largest internet market by number of users in 2011, internet penetration in Russia and actual internet ad spend per capita remains just a fraction of that in the West. We believe ad spend per capita and internet penetration rates will continue to grow and believe Yandex and Mail.ru Group, two of Russia’s largest publically traded platforms with exposure to advertising, ecommerce, gaming and social networks, will be major beneficiaries.
Yandex is the leading advertising platform in Russia with over 300K+ advertisers in 1H13, accounting for c57% of the Russia online ad market. Yandex is also #1 internet destination, with c55 mn unique monthly visitors. Yandex is leveraging its platform and has become #1 comparison shopping destination, used by 40% of Russian online shoppers (Source: AKAR). Yandex in Turkey: while its search market share remains in the low-single digits, the company plans to start monetize its product. We continue to prefer Yandex among the Russian TMT space and see the stock as an attractive long-term play on Russian consumption and internet roll-out. We believe the name deserves a premium valuation due to strong fundamentals, well-regarded corporate governance and high share liquidity. Any announcement on dividend could well extend the share price rally.
Mail.ru Group has successfully positioned itself as the largest media platform in Russian online with 28% market share in the Russian MMO market and roughly a third of the online display ad market. According to comScore, Mail’s sites reach over 85% of Russian internet users. Mail.ru Group sold its entire stakes in US online assets and currently holds ~$1 bn in cash on its balance sheet. The holding company also has ~11% economic ownership in Qiwi, worth c$0.25 bn, and a 40% stake in VK. Mail.ru Group, through its media platform, benefits from a relatively diversified revenue stream. Among the key catalysts for the stock we see: 1) the sale of its remaining stake in Qiwi (expected post SPO lock-up in late Dec 2013); 2) should Mail.ru successfully dispose of its stake in Qiwi, the holding company may consider distributing some of its cash holdings to shareholders -announcement of the size and timing of potential shareholder remuneration would be a positive catalyst in our view; 3) stronger than expected FY13 revenue growth, ahead of both BBG consensus and management guidance would be well received; 4) good usage traction of key games within Mail's portfolio, including WarFace, Pirate Code and Jungle Heat as well as better monetization of IVAS customers.
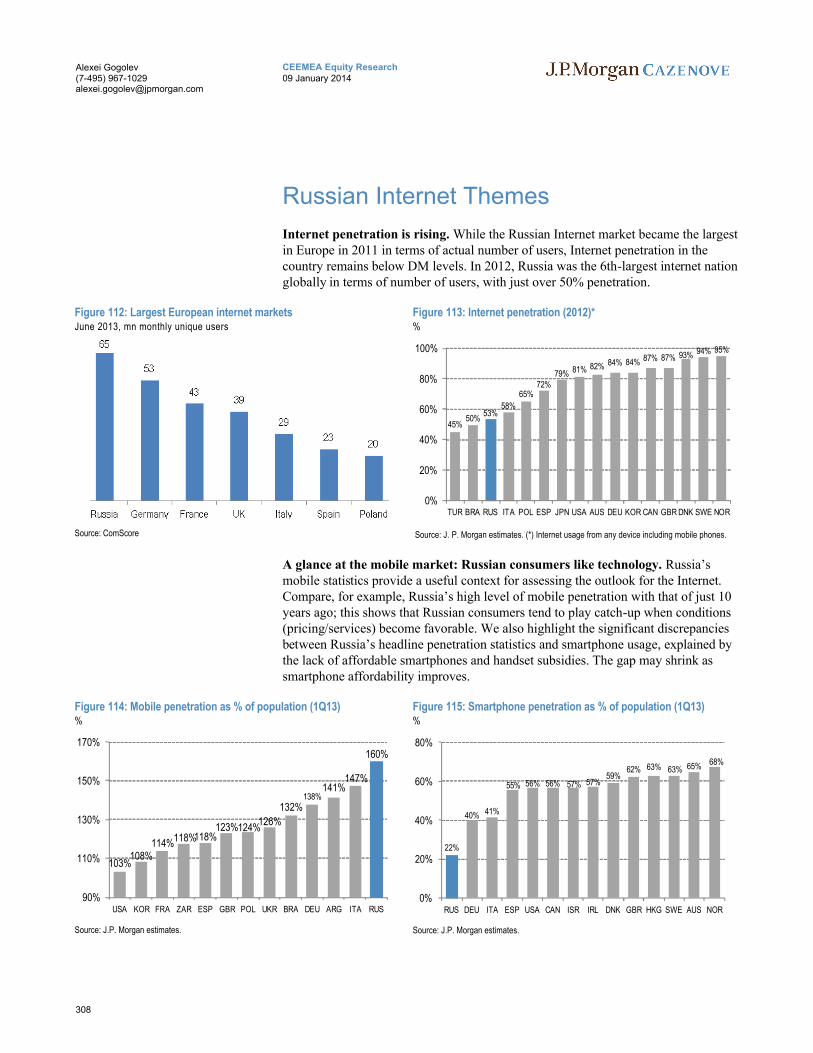
308
CEEMEA Equity Research09 January 2014
Alexei Gogolev(7-495) [email protected]
Russian Internet Themes
Internet penetration is rising. While the Russian Internet market became the largest in Europe in 2011 in terms of actual number of users, Internet penetration in the country remains below DM levels. In 2012, Russia was the 6th-largest internet nation globally in terms of number of users, with just over 50% penetration.
Figure 112: Largest European internet marketsJune 2013, mn monthly unique users
Source: ComScore
Figure 113: Internet penetration (2012)*%
45%50%
53%58%
65%72%
79% 81% 82% 84% 84% 87% 87% 93% 94% 95%
0%
20%
40%
60%
80%
100%
TUR BRA RUS ITA POL ESP JPN USA AUS DEU KOR CAN GBR DNK SWE NOR
Source: J. P. Morgan estimates. (*) Internet usage from any device including mobile phones.
A glance at the mobile market: Russian consumers like technology. Russia’s mobile statistics provide a useful context for assessing the outlook for the Internet. Compare, for example, Russia’s high level of mobile penetration with that of just 10 years ago; this shows that Russian consumers tend to play catch-up when conditions (pricing/services) become favorable. We also highlight the significant discrepancies between Russia’s headline penetration statistics and smartphone usage, explained by the lack of affordable smartphones and handset subsidies. The gap may shrink as smartphone affordability improves.
Figure 114: Mobile penetration as % of population (1Q13)%
103%108%
114%118%118%123%124%
126%
132%138%
141%147%
160%
90%
110%
130%
150%
170%
USA KOR FRA ZAR ESP GBR POL UKR BRA DEU ARG ITA RUS
Source: J.P. Morgan estimates.
Figure 115: Smartphone penetration as % of population (1Q13)%
22%
40% 41%
55% 56% 56% 57% 57%59%
62% 63% 63% 65%68%
0%
20%
40%
60%
80%
RUS DEU ITA ESP USA CAN ISR IRL DNK GBR HKG SWE AUS NOR
Source: J.P. Morgan estimates.
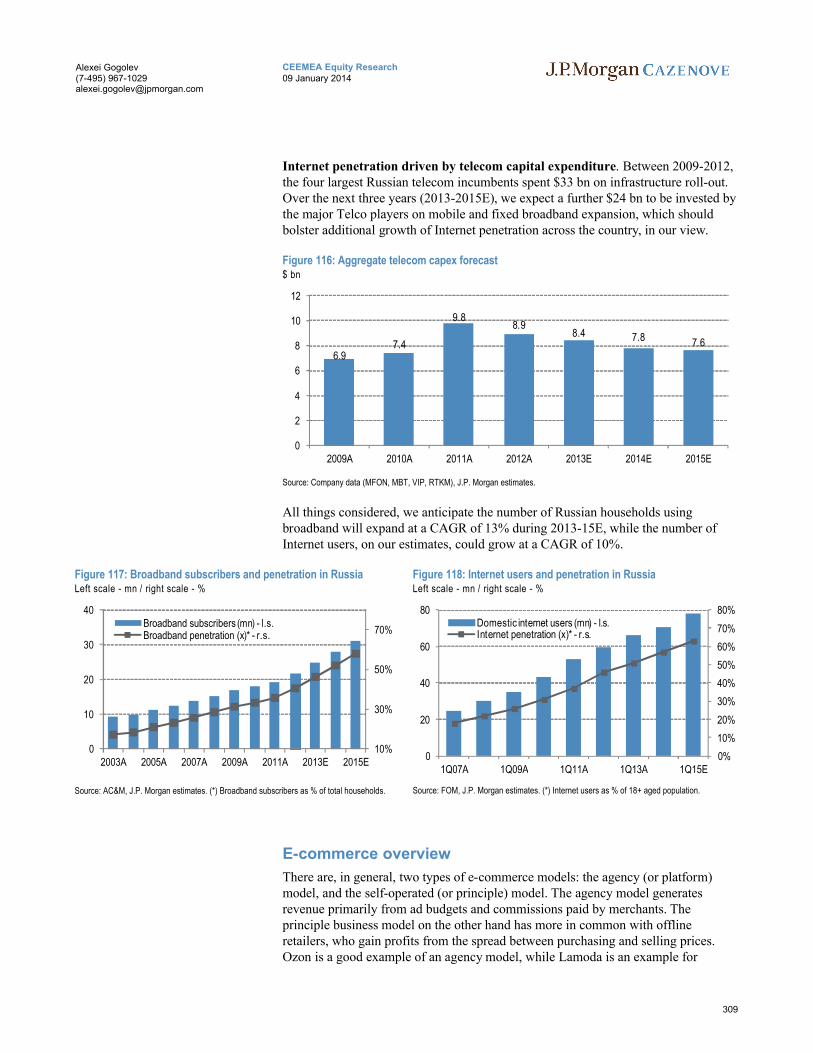
309
CEEMEA Equity Research09 January 2014
Alexei Gogolev(7-495) [email protected]
Internet penetration driven by telecom capital expenditure. Between 2009-2012, the four largest Russian telecom incumbents spent $33 bn on infrastructure roll-out. Over the next three years (2013-2015E), we expect a further $24 bn to be invested by the major Telco players on mobile and fixed broadband expansion, which should bolster additional growth of Internet penetration across the country, in our view.
Figure 116: Aggregate telecom capex forecast$ bn
6.97.4
9.88.9
8.4 7.8 7.6
0
2
4
6
8
10
12
2009A 2010A 2011A 2012A 2013E 2014E 2015E
Source: Company data (MFON, MBT, VIP, RTKM), J.P. Morgan estimates.
All things considered, we anticipate the number of Russian households using broadband will expand at a CAGR of 13% during 2013-15E, while the number of Internet users, on our estimates, could grow at a CAGR of 10%.
Figure 117: Broadband subscribers and penetration in RussiaLeft scale - mn / right scale - %
10%
30%
50%
70%
0
10
20
30
40
2003A 2005A 2007A 2009A 2011A 2013E 2015E
Broadband subscribers (mn) - l.s.Broadband penetration (x)* - r.s.
Source: AC&M, J.P. Morgan estimates. (*) Broadband subscribers as % of total households.
Figure 118: Internet users and penetration in RussiaLeft scale - mn / right scale - %
0%
10%
20%
30%
40%
50%
60%
70%
80%
0
20
40
60
80
1Q07A 1Q09A 1Q11A 1Q13A 1Q15E
Domestic internet users (mn) - l.s.Internet penetration (x)* - r.s.
Source: FOM, J.P. Morgan estimates. (*) Internet users as % of 18+ aged population.
E-commerce overview
There are, in general, two types of e-commerce models: the agency (or platform) model, and the self-operated (or principle) model. The agency model generates revenue primarily from ad budgets and commissions paid by merchants. The principle business model on the other hand has more in common with offline retailers, who gain profits from the spread between purchasing and selling prices. Ozon is a good example of an agency model, while Lamoda is an example for
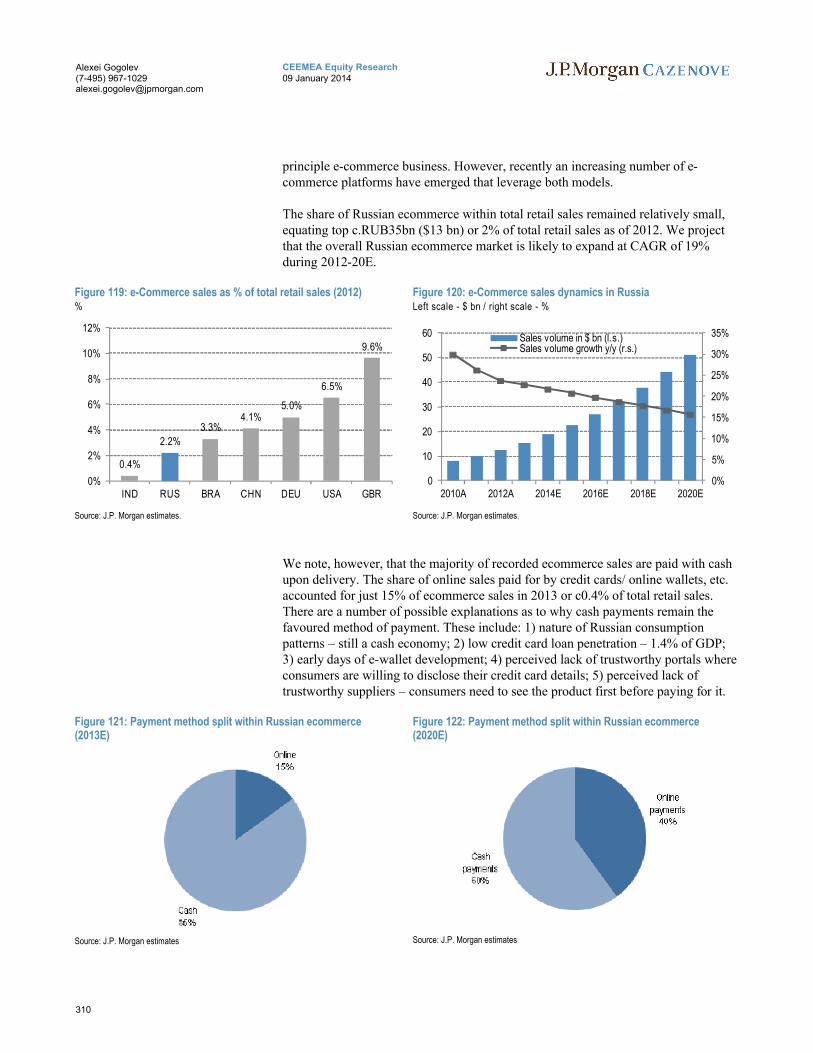
310
CEEMEA Equity Research09 January 2014
Alexei Gogolev(7-495) [email protected]
principle e-commerce business. However, recently an increasing number of e-commerce platforms have emerged that leverage both models.
The share of Russian ecommerce within total retail sales remained relatively small, equating top c.RUB35bn ($13 bn) or 2% of total retail sales as of 2012. We project that the overall Russian ecommerce market is likely to expand at CAGR of 19% during 2012-20E.
Figure 119: e-Commerce sales as % of total retail sales (2012)%
0.4%
2.2%
3.3%4.1%
5.0%
6.5%
9.6%
0%
2%
4%
6%
8%
10%
12%
IND RUS BRA CHN DEU USA GBR
Source: J.P. Morgan estimates.
Figure 120: e-Commerce sales dynamics in RussiaLeft scale - $ bn / right scale - %
0%
5%
10%
15%
20%
25%
30%
35%
0
10
20
30
40
50
60
2010A 2012A 2014E 2016E 2018E 2020E
Sales volume in $ bn (l.s.)Sales volume growth y/y (r.s.)
Source: J.P. Morgan estimates.
We note, however, that the majority of recorded ecommerce sales are paid with cash upon delivery. The share of online sales paid for by credit cards/ online wallets, etc. accounted for just 15% of ecommerce sales in 2013 or c0.4% of total retail sales. There are a number of possible explanations as to why cash payments remain the favoured method of payment. These include: 1) nature of Russian consumption patterns – still a cash economy; 2) low credit card loan penetration – 1.4% of GDP; 3) early days of e-wallet development; 4) perceived lack of trustworthy portals where consumers are willing to disclose their credit card details; 5) perceived lack of trustworthy suppliers – consumers need to see the product first before paying for it.
Figure 121: Payment method split within Russian ecommerce (2013E)
Source: J.P. Morgan estimates
Figure 122: Payment method split within Russian ecommerce (2020E)
Source: J.P. Morgan estimates
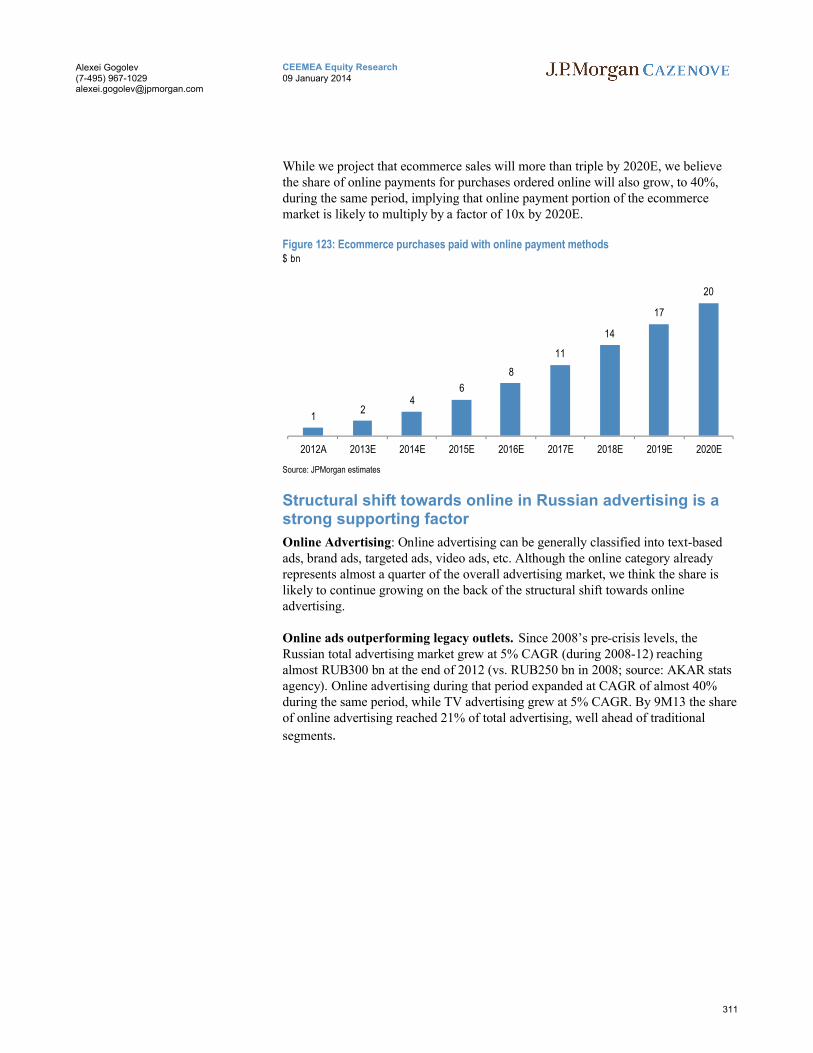
311
CEEMEA Equity Research09 January 2014
Alexei Gogolev(7-495) [email protected]
While we project that ecommerce sales will more than triple by 2020E, we believe the share of online payments for purchases ordered online will also grow, to 40%, during the same period, implying that online payment portion of the ecommerce market is likely to multiply by a factor of 10x by 2020E.
Figure 123: Ecommerce purchases paid with online payment methods$ bn
12
46
8
11
14
17
20
2012A 2013E 2014E 2015E 2016E 2017E 2018E 2019E 2020E
Source: JPMorgan estimates
Structural shift towards online in Russian advertising is a strong supporting factor
Online Advertising: Online advertising can be generally classified into text-basedads, brand ads, targeted ads, video ads, etc. Although the online category already represents almost a quarter of the overall advertising market, we think the share is likely to continue growing on the back of the structural shift towards online advertising.
Online ads outperforming legacy outlets. Since 2008’s pre-crisis levels, the Russian total advertising market grew at 5% CAGR (during 2008-12) reachingalmost RUB300 bn at the end of 2012 (vs. RUB250 bn in 2008; source: AKAR stats agency). Online advertising during that period expanded at CAGR of almost 40% during the same period, while TV advertising grew at 5% CAGR. By 9M13 the share of online advertising reached 21% of total advertising, well ahead of traditional
segments.

312
CEEMEA Equity Research09 January 2014
Alexei Gogolev(7-495) [email protected]
Figure 124: Russian Advertising market breakdown (2008)
Source: AKAR
Figure 125: Russian Advertising market breakdown (9M13)
Source: AKAR
While the share of internet advertising within total Russian advertising has alreadyreached a level close to DM, the actual internet ad spend per capita remains only a fraction of what it is in the West and we think it is likely to continue growing going forward.
Figure 126: Share of online advertising as % of total (2012)
Source: JPMorgan estimates, AKAR
Figure 127: Internet advertising spend per capita ($, 2012)
Source: JPMorgan estimates, AKAR
The conclusion for Russian advertising supports our assumption of accelerated shift towards online advertising vs. traditional media. Despite relatively unexciting growth of the Russian total ad market, we believe online properties will likely continue to report robust growth trends as ad budget allocations grow together with consumption.
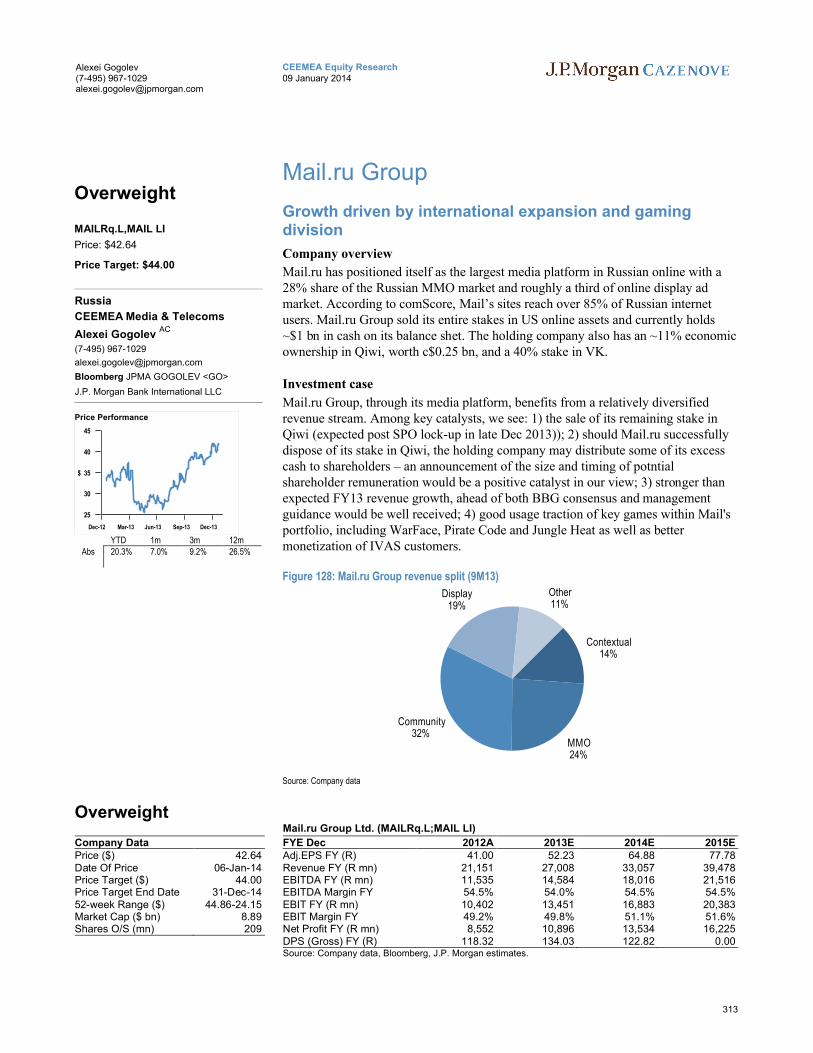
313
CEEMEA Equity Research09 January 2014
Alexei Gogolev(7-495) [email protected]
Mail.ru Group
Growth driven by international expansion and gaming division
Company overview
Mail.ru has positioned itself as the largest media platform in Russian online with a 28% share of the Russian MMO market and roughly a third of online display ad market. According to comScore, Mail’s sites reach over 85% of Russian internet users. Mail.ru Group sold its entire stakes in US online assets and currently holds ~$1 bn in cash on its balance shet. The holding company also has an ~11% economic ownership in Qiwi, worth c$0.25 bn, and a 40% stake in VK.
Investment case
Mail.ru Group, through its media platform, benefits from a relatively diversifiedrevenue stream. Among key catalysts, we see: 1) the sale of its remaining stake in Qiwi (expected post SPO lock-up in late Dec 2013)); 2) should Mail.ru successfully dispose of its stake in Qiwi, the holding company may distribute some of its excess cash to shareholders – an announcement of the size and timing of potntial shareholder remuneration would be a positive catalyst in our view; 3) stronger than expected FY13 revenue growth, ahead of both BBG consensus and management guidance would be well received; 4) good usage traction of key games within Mail's portfolio, including WarFace, Pirate Code and Jungle Heat as well as better monetization of IVAS customers.
Figure 128: Mail.ru Group revenue split (9M13)
Contextual14%
MMO24%
Community32%
Display19%
Other 11%
Source: Company data
Overweight
Company DataPrice ($) 42.64Date Of Price 06-Jan-14Price Target ($) 44.00Price Target End Date 31-Dec-1452-week Range ($) 44.86-24.15Market Cap ($ bn) 8.89Shares O/S (mn) 209
Mail.ru Group Ltd. (MAILRq.L;MAIL LI)
FYE Dec 2012A 2013E 2014E 2015EAdj.EPS FY (R) 41.00 52.23 64.88 77.78Revenue FY (R mn) 21,151 27,008 33,057 39,478EBITDA FY (R mn) 11,535 14,584 18,016 21,516EBITDA Margin FY 54.5% 54.0% 54.5% 54.5%EBIT FY (R mn) 10,402 13,451 16,883 20,383EBIT Margin FY 49.2% 49.8% 51.1% 51.6%Net Profit FY (R mn) 8,552 10,896 13,534 16,225DPS (Gross) FY (R) 118.32 134.03 122.82 0.00Source: Company data, Bloomberg, J.P. Morgan estimates.
Overweight
MAILRq.L,MAIL LI
Price: $42.64
Price Target: $44.00
Russia
CEEMEA Media & Telecoms
Alexei Gogolev AC
(7-495) 967-1029
Bloomberg JPMA GOGOLEV <GO>
J.P. Morgan Bank International LLC
25
30
35
40
45
$
Dec-12 Mar-13 Jun-13 Sep-13 Dec-13
Price Performance
YTD 1m 3m 12mAbs 20.3% 7.0% 9.2% 26.5%
314
CEEMEA Equity Research09 January 2014
Alexei Gogolev(7-495) [email protected]
Investment Thesis, Valuation and Risks
Mail.ru Group (Overweight; Price Target: $44.00)
Investment Thesis
We reiterate OW on Mail.ru Group and our PT to $44/GDR. We believe the share price rally could extend further once Mail.ru discloses the timing and size of a potential special dividend.
Valuation
Our PT assumption is based on a discount terminal value calculation, which at our PT implies 2014E EV/EBITDA of 13x and P/E of 22x. We discount back the terminal value at the cost of equity of 13% (standard for Russian names). We think that the multiple of 15x that we use for the terminal value at year-end 2018E appears reasonable in light of the longer-term growth prospects at Mail.ru Group.
Risks to Rating and Price Target
Mail.ru could perform below our expectations if: 1) management is unable to maintain its leading position (mitigated by the likely significant stickiness of the mail/IM/SNS platforms); 2) competitive pressures increase in the social networking space; and 3) there is further deceleration of IVAS revenue growth.
Risks to the earnings outlook in 2014
Among the key risks for Mail.ru Group shares we see: 1) possible further share overhang from anchor shareholders; 2) stronger competition from Facebook as one of main concerns (although Russian social networks, including those owned by Mail.ru, appear to have much higher user engagement vs. Facebook; 3) there appears to be no clarity on potential consolidation of VK (Russia’s largest social network); any indications of possible M&A at inflated valuations would likely be seen as negative by the market; 4) further macro growth deceleration, which could lead to poor performance of Mail’s jobs business – HeadHunter.
Growth fuelled by international platform
In mid 2013, Mail.ru Group launched an online platform called My.com outside of Russia and CIS. So far the plan is to launch services in English-speaking countries (including the US), but Mail intends to turn My.com into a global platform. The platform currently offers a number of promising casual games, email aggregator and IM product, but eventually Mail.ru Group intends to promote all of its successful products on My.com. We believe the platform could become a significant contributor to Mail’s consolidated revenues and fuel topline growth.
Gaming division picking up
In 2013, growth MMO revenues at Mail.ru Group began to pick up. We think this was driven by change of the approach at Mail.ru: Mail currently has 59 games in total, down from 120 games two years ago; top-6 AAA MMO games contribute 67-68% of revenues. Mail.ru Group also had a number of successful releases during 2013, including WarFace. Up to five more releases are planned for 2014 according to management, which could further improve monetization levels of Mail’s gaming platform (currently at ~9%).
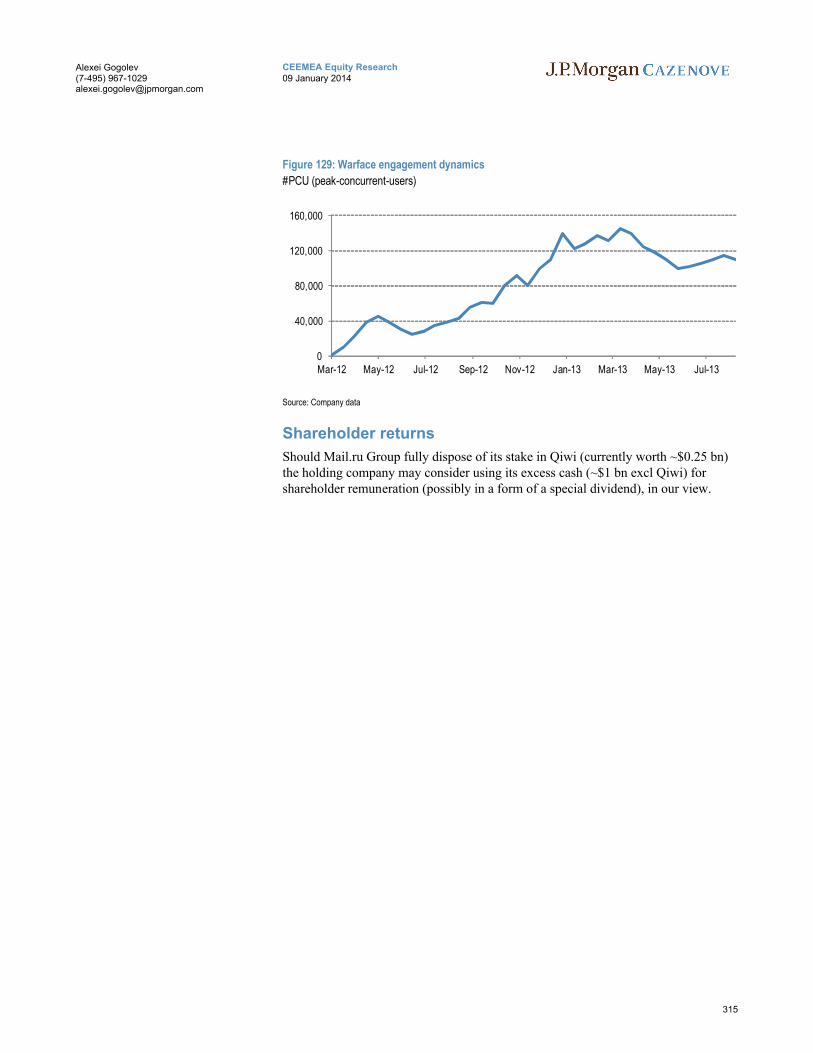
315
CEEMEA Equity Research09 January 2014
Alexei Gogolev(7-495) [email protected]
Figure 129: Warface engagement dynamics
#PCU (peak-concurrent-users)
0
40,000
80,000
120,000
160,000
Mar-12 May-12 Jul-12 Sep-12 Nov-12 Jan-13 Mar-13 May-13 Jul-13
Source: Company data
Shareholder returns
Should Mail.ru Group fully dispose of its stake in Qiwi (currently worth ~$0.25 bn) the holding company may consider using its excess cash (~$1 bn excl Qiwi) for shareholder remuneration (possibly in a form of a special dividend), in our view.
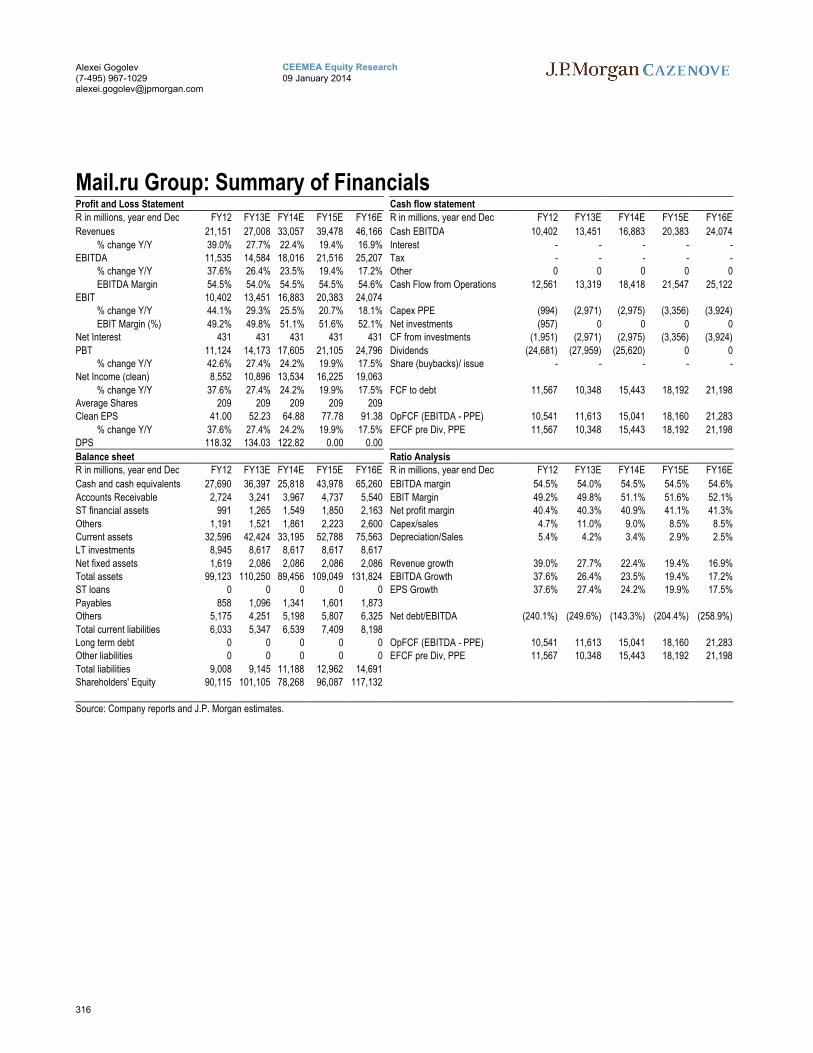
316
CEEMEA Equity Research09 January 2014
Alexei Gogolev(7-495) [email protected]
Mail.ru Group: Summary of FinancialsProfit and Loss Statement Cash flow statement
R in millions, year end Dec FY12 FY13E FY14E FY15E FY16E R in millions, year end Dec FY12 FY13E FY14E FY15E FY16E
Revenues 21,151 27,008 33,057 39,478 46,166 Cash EBITDA 10,402 13,451 16,883 20,383 24,074
% change Y/Y 39.0% 27.7% 22.4% 19.4% 16.9% Interest - - - - -EBITDA 11,535 14,584 18,016 21,516 25,207 Tax - - - - -
% change Y/Y 37.6% 26.4% 23.5% 19.4% 17.2% Other 0 0 0 0 0
EBITDA Margin 54.5% 54.0% 54.5% 54.5% 54.6% Cash Flow from Operations 12,561 13,319 18,418 21,547 25,122EBIT 10,402 13,451 16,883 20,383 24,074
% change Y/Y 44.1% 29.3% 25.5% 20.7% 18.1% Capex PPE (994) (2,971) (2,975) (3,356) (3,924)
EBIT Margin (%) 49.2% 49.8% 51.1% 51.6% 52.1% Net investments (957) 0 0 0 0Net Interest 431 431 431 431 431 CF from investments (1,951) (2,971) (2,975) (3,356) (3,924)
PBT 11,124 14,173 17,605 21,105 24,796 Dividends (24,681) (27,959) (25,620) 0 0% change Y/Y 42.6% 27.4% 24.2% 19.9% 17.5% Share (buybacks)/ issue - - - - -
Net Income (clean) 8,552 10,896 13,534 16,225 19,063
% change Y/Y 37.6% 27.4% 24.2% 19.9% 17.5% FCF to debt 11,567 10,348 15,443 18,192 21,198Average Shares 209 209 209 209 209Clean EPS 41.00 52.23 64.88 77.78 91.38 OpFCF (EBITDA - PPE) 10,541 11,613 15,041 18,160 21,283
% change Y/Y 37.6% 27.4% 24.2% 19.9% 17.5% EFCF pre Div, PPE 11,567 10,348 15,443 18,192 21,198DPS 118.32 134.03 122.82 0.00 0.00
Balance sheet Ratio AnalysisR in millions, year end Dec FY12 FY13E FY14E FY15E FY16E R in millions, year end Dec FY12 FY13E FY14E FY15E FY16E
Cash and cash equivalents 27,690 36,397 25,818 43,978 65,260 EBITDA margin 54.5% 54.0% 54.5% 54.5% 54.6%
Accounts Receivable 2,724 3,241 3,967 4,737 5,540 EBIT Margin 49.2% 49.8% 51.1% 51.6% 52.1%ST financial assets 991 1,265 1,549 1,850 2,163 Net profit margin 40.4% 40.3% 40.9% 41.1% 41.3%
Others 1,191 1,521 1,861 2,223 2,600 Capex/sales 4.7% 11.0% 9.0% 8.5% 8.5%Current assets 32,596 42,424 33,195 52,788 75,563 Depreciation/Sales 5.4% 4.2% 3.4% 2.9% 2.5%LT investments 8,945 8,617 8,617 8,617 8,617
Net fixed assets 1,619 2,086 2,086 2,086 2,086 Revenue growth 39.0% 27.7% 22.4% 19.4% 16.9%Total assets 99,123 110,250 89,456 109,049 131,824 EBITDA Growth 37.6% 26.4% 23.5% 19.4% 17.2%ST loans 0 0 0 0 0 EPS Growth 37.6% 27.4% 24.2% 19.9% 17.5%
Payables 858 1,096 1,341 1,601 1,873Others 5,175 4,251 5,198 5,807 6,325 Net debt/EBITDA (240.1%) (249.6%) (143.3%) (204.4%) (258.9%)
Total current liabilities 6,033 5,347 6,539 7,409 8,198Long term debt 0 0 0 0 0 OpFCF (EBITDA - PPE) 10,541 11,613 15,041 18,160 21,283Other liabilities 0 0 0 0 0 EFCF pre Div, PPE 11,567 10,348 15,443 18,192 21,198
Total liabilities 9,008 9,145 11,188 12,962 14,691Shareholders' Equity 90,115 101,105 78,268 96,087 117,132
Source: Company reports and J.P. Morgan estimates.
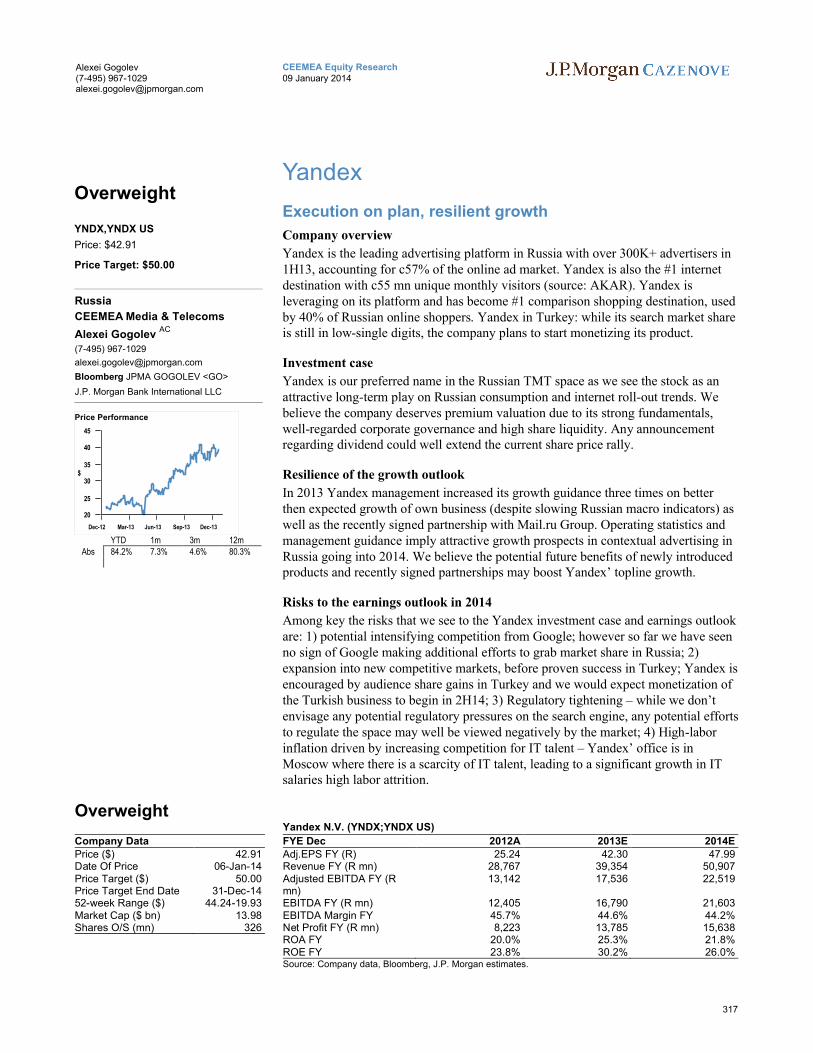
317
CEEMEA Equity Research09 January 2014
Alexei Gogolev(7-495) [email protected]
Yandex
Execution on plan, resilient growth
Company overview
Yandex is the leading advertising platform in Russia with over 300K+ advertisers in 1H13, accounting for c57% of the online ad market. Yandex is also the #1 internet destination with c55 mn unique monthly visitors (source: AKAR). Yandex is leveraging on its platform and has become #1 comparison shopping destination, used by 40% of Russian online shoppers. Yandex in Turkey: while its search market share is still in low-single digits, the company plans to start monetizing its product.
Investment case
Yandex is our preferred name in the Russian TMT space as we see the stock as an attractive long-term play on Russian consumption and internet roll-out trends. We believe the company deserves premium valuation due to its strong fundamentals, well-regarded corporate governance and high share liquidity. Any announcement regarding dividend could well extend the current share price rally.
Resilience of the growth outlook
In 2013 Yandex management increased its growth guidance three times on better then expected growth of own business (despite slowing Russian macro indicators) as well as the recently signed partnership with Mail.ru Group. Operating statistics and management guidance imply attractive growth prospects in contextual advertising in Russia going into 2014. We believe the potential future benefits of newly introduced products and recently signed partnerships may boost Yandex’ topline growth.
Risks to the earnings outlook in 2014
Among key the risks that we see to the Yandex investment case and earnings outlook are: 1) potential intensifying competition from Google; however so far we have seen no sign of Google making additional efforts to grab market share in Russia; 2) expansion into new competitive markets, before proven success in Turkey; Yandex is encouraged by audience share gains in Turkey and we would expect monetization of the Turkish business to begin in 2H14; 3) Regulatory tightening – while we don’t envisage any potential regulatory pressures on the search engine, any potential efforts to regulate the space may well be viewed negatively by the market; 4) High-labor inflation driven by increasing competition for IT talent – Yandex’ office is in Moscow where there is a scarcity of IT talent, leading to a significant growth in IT salaries high labor attrition.
Overweight
Company DataPrice ($) 42.91Date Of Price 06-Jan-14Price Target ($) 50.00Price Target End Date 31-Dec-1452-week Range ($) 44.24-19.93Market Cap ($ bn) 13.98Shares O/S (mn) 326
Yandex N.V. (YNDX;YNDX US)
FYE Dec 2012A 2013E 2014EAdj.EPS FY (R) 25.24 42.30 47.99Revenue FY (R mn) 28,767 39,354 50,907Adjusted EBITDA FY (R mn)
13,142 17,536 22,519
EBITDA FY (R mn) 12,405 16,790 21,603EBITDA Margin FY 45.7% 44.6% 44.2%Net Profit FY (R mn) 8,223 13,785 15,638ROA FY 20.0% 25.3% 21.8%ROE FY 23.8% 30.2% 26.0%Source: Company data, Bloomberg, J.P. Morgan estimates.
Overweight
YNDX,YNDX US
Price: $42.91
Price Target: $50.00
Russia
CEEMEA Media & Telecoms
Alexei Gogolev AC
(7-495) 967-1029
Bloomberg JPMA GOGOLEV <GO>
J.P. Morgan Bank International LLC
20
25
30
35
40
45
$
Dec-12 Mar-13 Jun-13 Sep-13 Dec-13
Price Performance
YTD 1m 3m 12mAbs 84.2% 7.3% 4.6% 80.3%
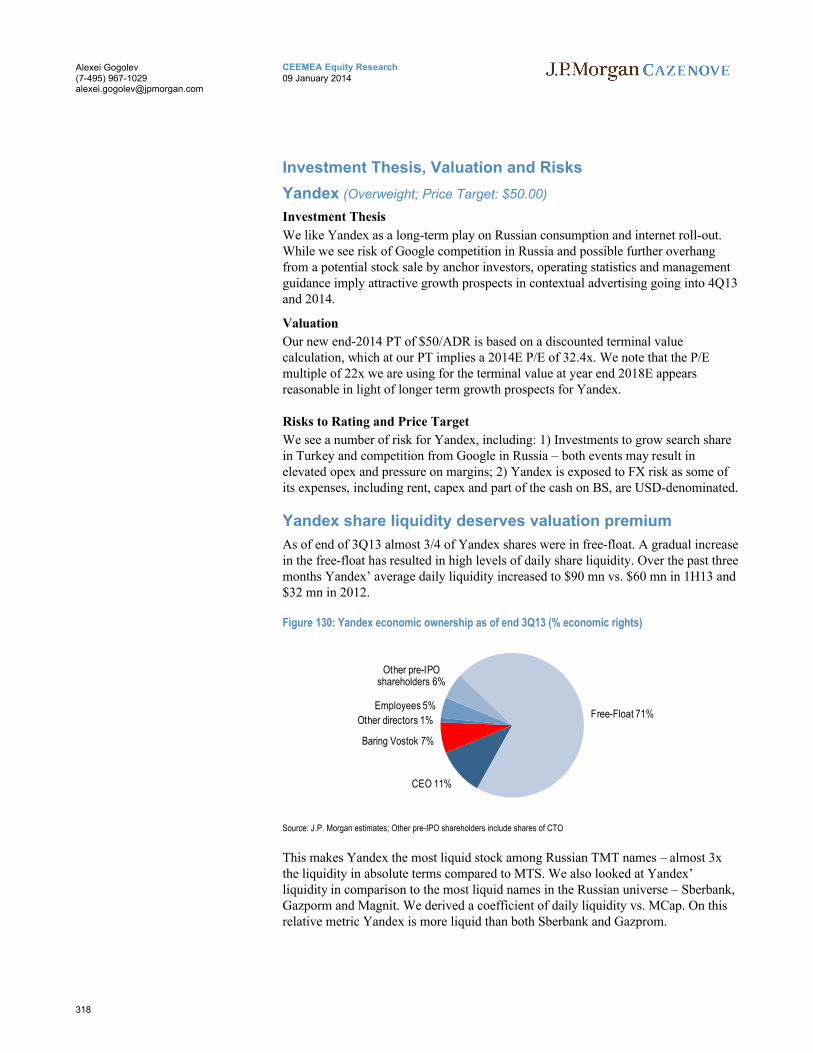
318
CEEMEA Equity Research09 January 2014
Alexei Gogolev(7-495) [email protected]
Investment Thesis, Valuation and Risks
Yandex (Overweight; Price Target: $50.00)
Investment Thesis
We like Yandex as a long-term play on Russian consumption and internet roll-out. While we see risk of Google competition in Russia and possible further overhang from a potential stock sale by anchor investors, operating statistics and management guidance imply attractive growth prospects in contextual advertising going into 4Q13 and 2014.
Valuation
Our new end-2014 PT of $50/ADR is based on a discounted terminal value calculation, which at our PT implies a 2014E P/E of 32.4x. We note that the P/E multiple of 22x we are using for the terminal value at year end 2018E appears reasonable in light of longer term growth prospects for Yandex.
Risks to Rating and Price Target
We see a number of risk for Yandex, including: 1) Investments to grow search share in Turkey and competition from Google in Russia – both events may result in elevated opex and pressure on margins; 2) Yandex is exposed to FX risk as some of its expenses, including rent, capex and part of the cash on BS, are USD-denominated.
Yandex share liquidity deserves valuation premium
As of end of 3Q13 almost 3/4 of Yandex shares were in free-float. A gradual increase in the free-float has resulted in high levels of daily share liquidity. Over the past three months Yandex’ average daily liquidity increased to $90 mn vs. $60 mn in 1H13 and $32 mn in 2012.
Figure 130: Yandex economic ownership as of end 3Q13 (% economic rights)
CEO 11%
Baring Vostok 7%
Other directors 1%
Employees 5%
Other pre-IPO shareholders 6%
Free-Float 71%
Source: J.P. Morgan estimates; Other pre-IPO shareholders include shares of CTO
This makes Yandex the most liquid stock among Russian TMT names – almost 3x the liquidity in absolute terms compared to MTS. We also looked at Yandex’ liquidity in comparison to the most liquid names in the Russian universe – Sberbank, Gazporm and Magnit. We derived a coefficient of daily liquidity vs. MCap. On this relative metric Yandex is more liquid than both Sberbank and Gazprom.
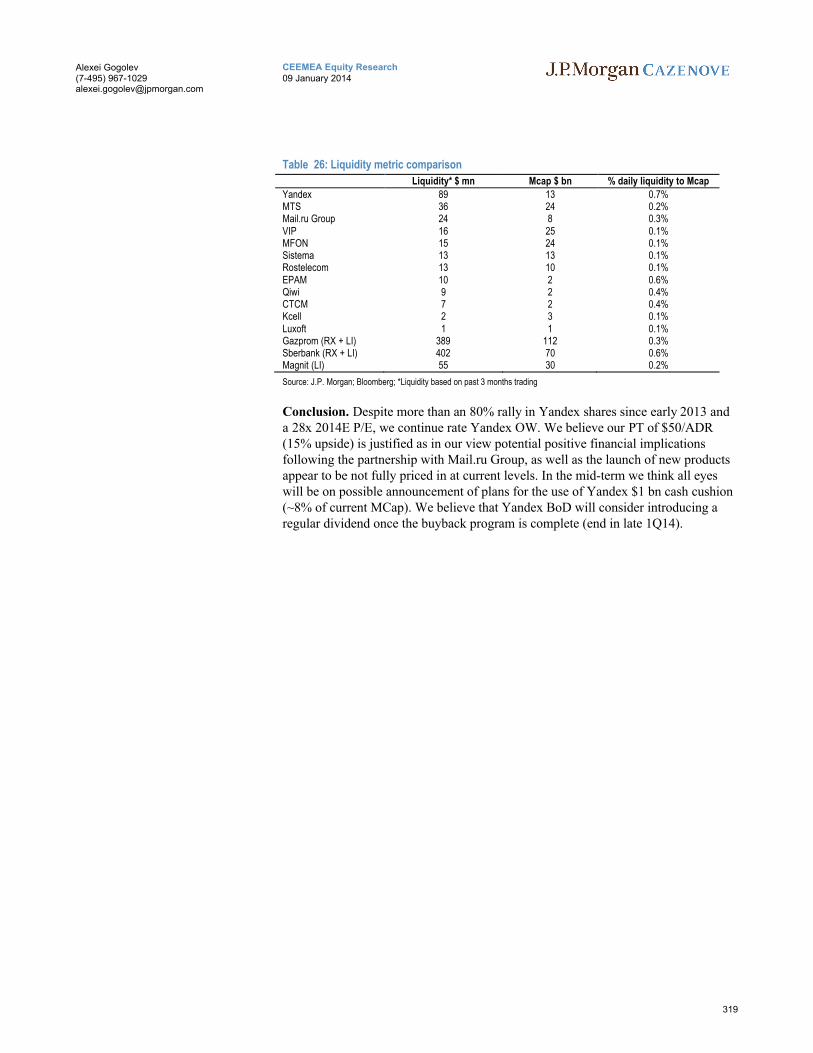
319
CEEMEA Equity Research09 January 2014
Alexei Gogolev(7-495) [email protected]
Table 26: Liquidity metric comparison
Liquidity* $ mn Mcap $ bn % daily liquidity to Mcap
Yandex 89 13 0.7%MTS 36 24 0.2%Mail.ru Group 24 8 0.3%VIP 16 25 0.1%MFON 15 24 0.1%Sistema 13 13 0.1%Rostelecom 13 10 0.1%EPAM 10 2 0.6%Qiwi 9 2 0.4%CTCM 7 2 0.4%Kcell 2 3 0.1%Luxoft 1 1 0.1%Gazprom (RX + LI) 389 112 0.3%Sberbank (RX + LI) 402 70 0.6%Magnit (LI) 55 30 0.2%
Source: J.P. Morgan; Bloomberg; *Liquidity based on past 3 months trading
Conclusion. Despite more than an 80% rally in Yandex shares since early 2013 anda 28x 2014E P/E, we continue rate Yandex OW. We believe our PT of $50/ADR (15% upside) is justified as in our view potential positive financial implications following the partnership with Mail.ru Group, as well as the launch of new productsappear to be not fully priced in at current levels. In the mid-term we think all eyes will be on possible announcement of plans for the use of Yandex $1 bn cash cushion (~8% of current MCap). We believe that Yandex BoD will consider introducing a regular dividend once the buyback program is complete (end in late 1Q14).
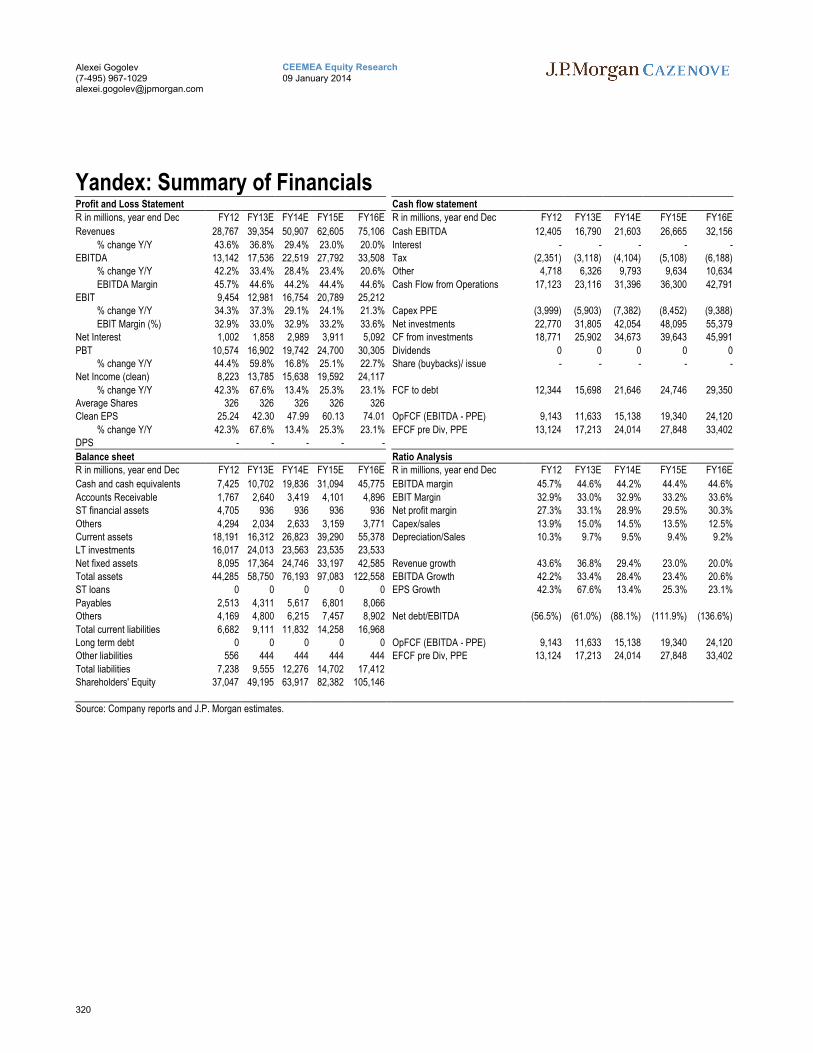
320
CEEMEA Equity Research09 January 2014
Alexei Gogolev(7-495) [email protected]
Yandex: Summary of FinancialsProfit and Loss Statement Cash flow statement
R in millions, year end Dec FY12 FY13E FY14E FY15E FY16E R in millions, year end Dec FY12 FY13E FY14E FY15E FY16E
Revenues 28,767 39,354 50,907 62,605 75,106 Cash EBITDA 12,405 16,790 21,603 26,665 32,156
% change Y/Y 43.6% 36.8% 29.4% 23.0% 20.0% Interest - - - - -EBITDA 13,142 17,536 22,519 27,792 33,508 Tax (2,351) (3,118) (4,104) (5,108) (6,188)
% change Y/Y 42.2% 33.4% 28.4% 23.4% 20.6% Other 4,718 6,326 9,793 9,634 10,634
EBITDA Margin 45.7% 44.6% 44.2% 44.4% 44.6% Cash Flow from Operations 17,123 23,116 31,396 36,300 42,791EBIT 9,454 12,981 16,754 20,789 25,212
% change Y/Y 34.3% 37.3% 29.1% 24.1% 21.3% Capex PPE (3,999) (5,903) (7,382) (8,452) (9,388)
EBIT Margin (%) 32.9% 33.0% 32.9% 33.2% 33.6% Net investments 22,770 31,805 42,054 48,095 55,379Net Interest 1,002 1,858 2,989 3,911 5,092 CF from investments 18,771 25,902 34,673 39,643 45,991
PBT 10,574 16,902 19,742 24,700 30,305 Dividends 0 0 0 0 0% change Y/Y 44.4% 59.8% 16.8% 25.1% 22.7% Share (buybacks)/ issue - - - - -
Net Income (clean) 8,223 13,785 15,638 19,592 24,117
% change Y/Y 42.3% 67.6% 13.4% 25.3% 23.1% FCF to debt 12,344 15,698 21,646 24,746 29,350Average Shares 326 326 326 326 326Clean EPS 25.24 42.30 47.99 60.13 74.01 OpFCF (EBITDA - PPE) 9,143 11,633 15,138 19,340 24,120
% change Y/Y 42.3% 67.6% 13.4% 25.3% 23.1% EFCF pre Div, PPE 13,124 17,213 24,014 27,848 33,402DPS - - - - -
Balance sheet Ratio AnalysisR in millions, year end Dec FY12 FY13E FY14E FY15E FY16E R in millions, year end Dec FY12 FY13E FY14E FY15E FY16E
Cash and cash equivalents 7,425 10,702 19,836 31,094 45,775 EBITDA margin 45.7% 44.6% 44.2% 44.4% 44.6%
Accounts Receivable 1,767 2,640 3,419 4,101 4,896 EBIT Margin 32.9% 33.0% 32.9% 33.2% 33.6%ST financial assets 4,705 936 936 936 936 Net profit margin 27.3% 33.1% 28.9% 29.5% 30.3%
Others 4,294 2,034 2,633 3,159 3,771 Capex/sales 13.9% 15.0% 14.5% 13.5% 12.5%Current assets 18,191 16,312 26,823 39,290 55,378 Depreciation/Sales 10.3% 9.7% 9.5% 9.4% 9.2%LT investments 16,017 24,013 23,563 23,535 23,533
Net fixed assets 8,095 17,364 24,746 33,197 42,585 Revenue growth 43.6% 36.8% 29.4% 23.0% 20.0%Total assets 44,285 58,750 76,193 97,083 122,558 EBITDA Growth 42.2% 33.4% 28.4% 23.4% 20.6%ST loans 0 0 0 0 0 EPS Growth 42.3% 67.6% 13.4% 25.3% 23.1%
Payables 2,513 4,311 5,617 6,801 8,066Others 4,169 4,800 6,215 7,457 8,902 Net debt/EBITDA (56.5%) (61.0%) (88.1%) (111.9%) (136.6%)
Total current liabilities 6,682 9,111 11,832 14,258 16,968Long term debt 0 0 0 0 0 OpFCF (EBITDA - PPE) 9,143 11,633 15,138 19,340 24,120Other liabilities 556 444 444 444 444 EFCF pre Div, PPE 13,124 17,213 24,014 27,848 33,402
Total liabilities 7,238 9,555 12,276 14,702 17,412Shareholders' Equity 37,047 49,195 63,917 82,382 105,146
Source: Company reports and J.P. Morgan estimates.
322
Global Equity Research09 January 2014
Doug Anmuth(1-212) [email protected]
Analyst Certification: The research analyst(s) denoted by an “AC” on the cover of this report certifies (or, where multiple research analysts are primarily responsible for this report, the research analyst denoted by an “AC” on the cover or within the document individually certifies, with respect to each security or issuer that the research analyst covers in this research) that: (1) all of the views expressed in this report accurately reflect his or her personal views about any and all of the subject securities or issuers; and (2) no part of any of the research analyst's compensation was, is, or will be directly or indirectly related to the specific recommendations or views expressed by the research analyst(s) in this report. For all Korea-based research analysts listed on the front cover, they also certify, as per KOFIA requirements, that their analysis was made in good faith and that the views reflect their own opinion, without undue influence or intervention.
In compliance with Instruction 483 issued by Comissao de Valores Mobiliarios (the Brazilian securities commission) on July 6, 2010, the Brazilian primary analyst signing this report declares: (1) that all the views expressed herein accurately reflect his or her personal views about the securities and issuers; (2) that all recommendations issued by him or her were independently produced, including from the entity in which he or she is an employee; and (3) that he or she will set forth any situation or conflict of interest believed to impact the impartiality of the recommendations herein, as per article 17, II of Instruction 483.
Important Disclosures
Market Maker: JPMS makes a market in the stock of Google, Amazon.com, Facebook, eBay, Inc, Priceline.com, Yahoo Inc, LinkedIn Corp, Netflix Inc, TripAdvisor, Inc., Expedia, Inc., Groupon, HomeAway Inc, Zynga Inc, Criteo, OpenTable Inc, QuinStreet, Inc., ReachLocal, CafePress, Inc., Baidu.com, NetEase, Ctrip.com International, Ltd, Sina Corp, Sohu.Com, MercadoLibre, Inc., Yandex.
Market Maker/ Liquidity Provider: J.P. Morgan Securities plc and/or an affiliate is a market maker and/or liquidity provider in Schibsted, Axel Springer, Rightmove, CTS Eventim, Ubisoft, Moneysupermarket, Gameloft, Perform, XING, Yandex, Mail.ru Group.
Lead or Co-manager: J.P. Morgan acted as lead or co-manager in a public offering of equity and/or debt securities for Facebook, Twitter, Inc., Yahoo Inc, LinkedIn Corp, Netflix Inc, Groupon, Pandora Media Inc, HomeAway Inc, Criteo, Trulia Inc., Chegg, Inc., Baidu.com, Ctrip.com International, Ltd, SouFun Holdings Ltd, Vipshop, YY Inc, Forgame Holdings Ltd, Sungy Mobile Limited, Axel Springer, Yandex, Mail.ru Group within the past 12 months.
Client: J.P. Morgan currently has, or had within the past 12 months, the following company(ies) as clients: Google, Amazon.com, Facebook, eBay, Inc, Priceline.com, Twitter, Inc., Yahoo Inc, LinkedIn Corp, Netflix Inc, TripAdvisor, Inc., Expedia, Inc., Groupon, Pandora Media Inc, Yelp Inc., HomeAway Inc, Zynga Inc, Criteo, OpenTable Inc, Bankrate Inc, Trulia Inc., Chegg, Inc., QuinStreet, Inc., ReachLocal, CafePress, Inc., Tencent, Baidu.com, NetEase, Ctrip.com International, Ltd, SouFun Holdings Ltd, Vipshop, YY Inc,Sohu.Com, Forgame Holdings Ltd, Sungy Mobile Limited, Naver, NCSoft, Yahoo Japan (4689), Rakuten (4755), CyberAgent (4751), Gree (3632), ASKUL (2678), Schibsted, Axel Springer, Rightmove, Ubisoft, MercadoLibre, Inc., Yandex, Mail.ru Group.
Client/Investment Banking: J.P. Morgan currently has, or had within the past 12 months, the following company(ies) as investment banking clients: Google, Facebook, eBay, Inc, Priceline.com, Twitter, Inc., Yahoo Inc, LinkedIn Corp, Netflix Inc, TripAdvisor, Inc., Expedia, Inc., Groupon, Pandora Media Inc, HomeAway Inc, Criteo, Trulia Inc., Chegg, Inc., Tencent, Baidu.com, Ctrip.com International, Ltd, SouFun Holdings Ltd, Vipshop, YY Inc, Forgame Holdings Ltd, Sungy Mobile Limited, Naver, Axel Springer, Yandex, Mail.ru Group.
Client/Non-Investment Banking, Securities-Related: J.P. Morgan currently has, or had within the past 12 months, the following company(ies) as clients, and the services provided were non-investment-banking, securities-related: Google, Amazon.com, Facebook, eBay, Inc, Priceline.com, Yahoo Inc, LinkedIn Corp, Netflix Inc, TripAdvisor, Inc., Expedia, Inc., Groupon, Pandora Media Inc, Yelp Inc., QuinStreet, Inc., ReachLocal, Tencent, Ctrip.com International, Ltd, Sohu.Com, CyberAgent (4751), ASKUL (2678), Axel Springer, Mail.ru Group.
Client/Non-Securities-Related: J.P. Morgan currently has, or had within the past 12 months, the following company(ies) as clients, and the services provided were non-securities-related: Google, Amazon.com, Facebook, eBay, Inc, Priceline.com, Twitter, Inc., Yahoo Inc, TripAdvisor, Inc., Expedia, Inc., Groupon, Pandora Media Inc, Zynga Inc, Bankrate Inc, Chegg, Inc., QuinStreet, Inc., Sohu.Com.
Investment Banking (past 12 months): J.P. Morgan received in the past 12 months compensation from investment banking Google, Facebook, eBay, Inc, Priceline.com, Twitter, Inc., Yahoo Inc, LinkedIn Corp, Netflix Inc, TripAdvisor, Inc., Expedia, Inc., Groupon, Pandora Media Inc, HomeAway Inc, Criteo, Trulia Inc., Chegg, Inc., Tencent, Baidu.com, Ctrip.com International, Ltd, SouFun Holdings Ltd, Vipshop, YY Inc, Forgame Holdings Ltd, Sungy Mobile Limited, Naver, Axel Springer, Yandex, Mail.ru Group.
Investment Banking (next 3 months): J.P. Morgan expects to receive, or intends to seek, compensation for investment banking services in the next three months from Google, Facebook, eBay, Inc, Priceline.com, Twitter, Inc., Yahoo Inc, LinkedIn Corp, Netflix Inc, TripAdvisor, Inc., Expedia, Inc., Groupon, Pandora Media Inc, HomeAway Inc, Criteo, Trulia Inc., Chegg, Inc., Tencent, Baidu.com, Ctrip.com International, Ltd, SouFun Holdings Ltd, Vipshop, YY Inc, Forgame Holdings Ltd, Sungy Mobile Limited, Naver, Schibsted, Axel Springer, MercadoLibre, Inc., Yandex, Mail.ru Group.
Non-Investment Banking Compensation: J.P. Morgan has received compensation in the past 12 months for products or services other than investment banking from Google, Amazon.com, Facebook, eBay, Inc, Priceline.com, Yahoo Inc, LinkedIn Corp, Netflix Inc,

323
Global Equity Research09 January 2014
Doug Anmuth(1-212) [email protected]
TripAdvisor, Inc., Expedia, Inc., Groupon, Pandora Media Inc, Yelp Inc., QuinStreet, Inc., ReachLocal, Tencent, Ctrip.com International, Ltd, Sohu.Com, CyberAgent (4751), ASKUL (2678), Axel Springer, Mail.ru Group.
J.P. Morgan Securities LLC (“J.P. Morgan”) is acting as a joint bookrunner to Soufun Holdings Ltd in respect of its convertible bond offering as announced on 04 December 2013. J.P. Morgan will be receiving fees for so acting. J.P. Morgan and its affiliates may perform, or may seek to perform, other financial or advisory services for Soufun Holdings Ltd or its affiliates and may have other interests in or relationships with Soufun Holdings Ltd or its affiliates, and receive fees, commissions or other compensation in such capacities. This research report and the information herein is not intended to serve as an endorsement of the proposed transaction or result in procurement, withholding or revocation of a proxy or any other action by a security holder. This report is based solely on publicly available information. No representation is made that it is accurate or complete.
J.P. Morgan is acting as advisor to Axel Springer on the sale of a 30% stake in its online classifieds division (SeLoger, StepStone and Immonet assets) to General Atlantic.
Company-Specific Disclosures: Important disclosures, including price charts, are available for compendium reports and all J.P. Morgan–covered companies by visiting https://jpmm.com/research/disclosures, calling 1-800-477-0406, or e-mailing [email protected] with your request. J.P. Morgan’s Strategy, Technical, and Quantitative Research teams may screen companies not covered by J.P. Morgan. For important disclosures for these companies, please call 1-800-477-0406 or e-mail [email protected].
Explanation of Equity Research Ratings, Designations and Analyst(s) Coverage Universe: J.P. Morgan uses the following rating system: Overweight [Over the next six to twelve months, we expect this stock will outperform the average total return of the stocks in the analyst’s (or the analyst’s team’s) coverage universe.] Neutral [Over the next six to twelve months, we expect this stock will perform in line with the average total return of the stocks in the analyst’s (or the analyst’s team’s) coverage universe.] Underweight [Over the next six to twelve months, we expect this stock will underperform the average total return of the stocks in the analyst’s (or the analyst’s team’s) coverage universe.] Not Rated (NR): J.P. Morgan has removed the rating and, if applicable, the price target, for this stock because of either a lack of a sufficient fundamental basis or for legal, regulatory or policy reasons. The previous rating and, if applicable, the price target, no longer should be relied upon. An NR designation is not a recommendation or a rating. In our Asia (ex-Australia) and U.K. small- and mid-cap equity research, each stock’s expected total return is compared to the expected total return of a benchmark country market index, not to those analysts’ coverage universe. If it does not appear in the Important Disclosures section of this report, the certifying analyst’s coverage universe can be found on J.P. Morgan’s research website, www.jpmorganmarkets.com.
Coverage Universe: Anmuth, Doug: Amazon.com (AMZN), Bankrate Inc (RATE), CafePress, Inc. (PRSS), Chegg, Inc. (CHGG), Criteo (CRTO), Expedia, Inc. (EXPE), Facebook (FB), Google (GOOG), Groupon (GRPN), HomeAway Inc (AWAY), LinkedIn Corp (LNKD), Netflix Inc (NFLX), Pandora Media Inc (P), Priceline.com (PCLN), QuinStreet, Inc. (QNST), ReachLocal (RLOC), TripAdvisor, Inc. (TRIP), Trulia Inc. (TRLA), Twitter, Inc. (TWTR), Yahoo Inc (YHOO), Zynga Inc (ZNGA), eBay, Inc (EBAY)
Gotla, Kaizad: OpenTable Inc (OPEN), Yelp Inc. (YELP)
Yao, Alex: Baidu.com (BIDU), Ctrip.com International, Ltd (CTRP), Dangdang (DANG), Forgame Holdings Ltd (0484.HK), NetEase (NTES), Phoenix New Media Ltd (FENG), Qihoo 360 Technology Co. Ltd (QIHU), Shanda Games (GAME), Sina Corp (SINA), Sohu.Com (SOHU), SouFun Holdings Ltd (SFUN), Sungy Mobile Limited (GOMO), Tencent (0700.HK), Vipshop (VIPS), YY Inc (YY), Youku Tudou Inc. (YOKU), iSoftstone (ISS)
Yang, Stanley: CJ Hellovision (037560.KS), Daum (035720.KQ), Gamevil (063080.KS), KT Corp. (030200.KS), LG Uplus (032640.KS), NCSoft (036570.KS), NHN Entertainment (181710.KS), Naver (035420.KS), SK Broadband (033630.KS), SK Telecom (017670.KS), WeMade Entertainment (112040.KS)
Mori, Haruka: ASKUL (2678) (2678.T), CAPCOM (9697) (9697.T), CyberAgent (4751) (4751.T), DeNA (2432) (2432.T), Gree (3632) (3632.T), Gurunavi (2440) (2440.T), KONAMI (9766) (9766.T), Kakaku.com (2371) (2371.T), NAMCO BANDAI Holdings (7832) (7832.T), Nexon (3659) (3659.T), Nintendo (7974) (7974.T), Oriental Land (4661) (4661.T), Rakuten (4755) (4755.T), SQUARE ENIX HOLDINGS (9684) (9684.T), Yahoo Japan (4689) (4689.T)
Dubourg, Nicolas J: Axel Springer (SPRGn.DE), CTS Eventim (EVDG.DE), Daily Mail & General Trust (DMGOa.L), Gameloft (GLFT.PA), GfK (GFK.F), Ipsos (ISOS.PA), Mecom (MEC.L), Moneysupermarket (MONY.L), Perform (PER.L), Rightmove (RMV.L), Schibsted (SBST.OL), Ströer (SAXG.DE), Ubisoft (UBIP.PA), XING (OBCGn.DE)
Gogolev, Alexei M: AFK Sistema (SSAq.L), CTC Media (CTCM), Luxoft (LXFT), Mail.ru Group (MAILRq.L), MegaFon (MFON.L), Mobile Telesystems (MBT), QIWI (QIWI), Rostelecom (RTKM.MM), Rostelecom (Preferred) (RTKM_p.MM), T-HT (HT.ZA), Yandex (YNDX)
Baggio, Andre: America Movil (AMX), Entel (ENT.SN), Megacable (MEGACPO.MX), MercadoLibre, Inc. (MELI), NII Holdings (NIHD), Oi (OIBR4.SA), Positivo Informatica (POSI3.SA), TIM Participacoes (TIMP3.SA), Telecom Argentina (TEO), Telefonica Brasil (VIVT4.SA), Televisa (TV), Totvs (TOTS3.SA)
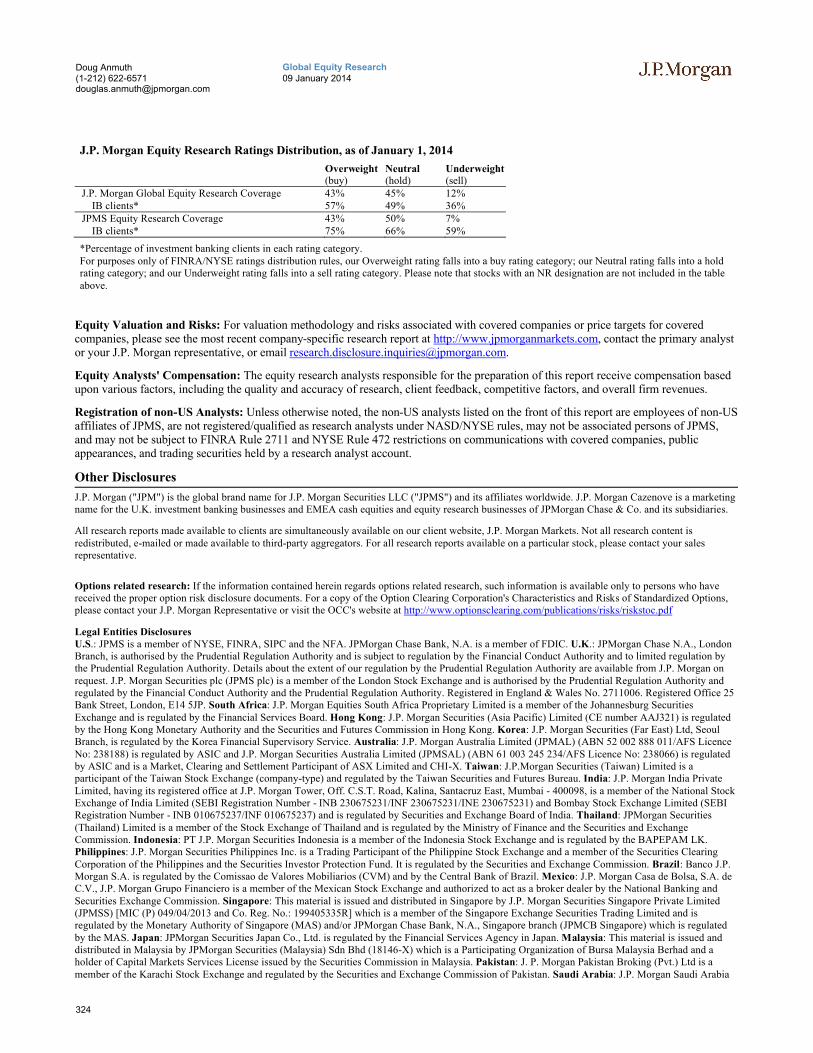
324
Global Equity Research09 January 2014
Doug Anmuth(1-212) [email protected]
J.P. Morgan Equity Research Ratings Distribution, as of January 1, 2014
Overweight(buy)
Neutral(hold)
Underweight(sell)
J.P. Morgan Global Equity Research Coverage 43% 45% 12% IB clients* 57% 49% 36%JPMS Equity Research Coverage 43% 50% 7% IB clients* 75% 66% 59%
*Percentage of investment banking clients in each rating category.For purposes only of FINRA/NYSE ratings distribution rules, our Overweight rating falls into a buy rating category; our Neutral rating falls into a hold rating category; and our Underweight rating falls into a sell rating category. Please note that stocks with an NR designation are not included in the table above.
Equity Valuation and Risks: For valuation methodology and risks associated with covered companies or price targets for covered companies, please see the most recent company-specific research report at http://www.jpmorganmarkets.com, contact the primary analyst or your J.P. Morgan representative, or email [email protected].
Equity Analysts' Compensation: The equity research analysts responsible for the preparation of this report receive compensation based upon various factors, including the quality and accuracy of research, client feedback, competitive factors, and overall firm revenues.
Registration of non-US Analysts: Unless otherwise noted, the non-US analysts listed on the front of this report are employees of non-US affiliates of JPMS, are not registered/qualified as research analysts under NASD/NYSE rules, may not be associated persons of JPMS, and may not be subject to FINRA Rule 2711 and NYSE Rule 472 restrictions on communications with covered companies, public appearances, and trading securities held by a research analyst account.
Other Disclosures
J.P. Morgan ("JPM") is the global brand name for J.P. Morgan Securities LLC ("JPMS") and its affiliates worldwide. J.P. Morgan Cazenove is a marketing name for the U.K. investment banking businesses and EMEA cash equities and equity research businesses of JPMorgan Chase & Co. and its subsidiaries.
All research reports made available to clients are simultaneously available on our client website, J.P. Morgan Markets. Not all research content is redistributed, e-mailed or made available to third-party aggregators. For all research reports available on a particular stock, please contact your sales representative.
Options related research: If the information contained herein regards options related research, such information is available only to persons who have received the proper option risk disclosure documents. For a copy of the Option Clearing Corporation's Characteristics and Risks of Standardized Options, please contact your J.P. Morgan Representative or visit the OCC's website at http://www.optionsclearing.com/publications/risks/riskstoc.pdf
Legal Entities Disclosures U.S.: JPMS is a member of NYSE, FINRA, SIPC and the NFA. JPMorgan Chase Bank, N.A. is a member of FDIC. U.K.: JPMorgan Chase N.A., London Branch, is authorised by the Prudential Regulation Authority and is subject to regulation by the Financial Conduct Authority and to limited regulation by the Prudential Regulation Authority. Details about the extent of our regulation by the Prudential Regulation Authority are available from J.P. Morgan on request. J.P. Morgan Securities plc (JPMS plc) is a member of the London Stock Exchange and is authorised by the Prudential Regulation Authority and regulated by the Financial Conduct Authority and the Prudential Regulation Authority. Registered in England & Wales No. 2711006. Registered Office 25 Bank Street, London, E14 5JP. South Africa: J.P. Morgan Equities South Africa Proprietary Limited is a member of the Johannesburg Securities Exchange and is regulated by the Financial Services Board. Hong Kong: J.P. Morgan Securities (Asia Pacific) Limited (CE number AAJ321) is regulated by the Hong Kong Monetary Authority and the Securities and Futures Commission in Hong Kong. Korea: J.P. Morgan Securities (Far East) Ltd, Seoul Branch, is regulated by the Korea Financial Supervisory Service. Australia: J.P. Morgan Australia Limited (JPMAL) (ABN 52 002 888 011/AFS Licence No: 238188) is regulated by ASIC and J.P. Morgan Securities Australia Limited (JPMSAL) (ABN 61 003 245 234/AFS Licence No: 238066) is regulated by ASIC and is a Market, Clearing and Settlement Participant of ASX Limited and CHI-X. Taiwan: J.P.Morgan Securities (Taiwan) Limited is a participant of the Taiwan Stock Exchange (company-type) and regulated by the Taiwan Securities and Futures Bureau. India: J.P. Morgan India Private Limited, having its registered office at J.P. Morgan Tower, Off. C.S.T. Road, Kalina, Santacruz East, Mumbai - 400098, is a member of the National Stock Exchange of India Limited (SEBI Registration Number - INB 230675231/INF 230675231/INE 230675231) and Bombay Stock Exchange Limited (SEBI Registration Number - INB 010675237/INF 010675237) and is regulated by Securities and Exchange Board of India. Thailand: JPMorgan Securities (Thailand) Limited is a member of the Stock Exchange of Thailand and is regulated by the Ministry of Finance and the Securities and Exchange Commission. Indonesia: PT J.P. Morgan Securities Indonesia is a member of the Indonesia Stock Exchange and is regulated by the BAPEPAM LK. Philippines: J.P. Morgan Securities Philippines Inc. is a Trading Participant of the Philippine Stock Exchange and a member of the Securities Clearing Corporation of the Philippines and the Securities Investor Protection Fund. It is regulated by the Securities and Exchange Commission. Brazil: Banco J.P. Morgan S.A. is regulated by the Comissao de Valores Mobiliarios (CVM) and by the Central Bank of Brazil. Mexico: J.P. Morgan Casa de Bolsa, S.A. de C.V., J.P. Morgan Grupo Financiero is a member of the Mexican Stock Exchange and authorized to act as a broker dealer by the National Banking and Securities Exchange Commission. Singapore: This material is issued and distributed in Singapore by J.P. Morgan Securities Singapore Private Limited (JPMSS) [MIC (P) 049/04/2013 and Co. Reg. No.: 199405335R] which is a member of the Singapore Exchange Securities Trading Limited and is regulated by the Monetary Authority of Singapore (MAS) and/or JPMorgan Chase Bank, N.A., Singapore branch (JPMCB Singapore) which is regulated by the MAS. Japan: JPMorgan Securities Japan Co., Ltd. is regulated by the Financial Services Agency in Japan. Malaysia: This material is issued and distributed in Malaysia by JPMorgan Securities (Malaysia) Sdn Bhd (18146-X) which is a Participating Organization of Bursa Malaysia Berhad and a holder of Capital Markets Services License issued by the Securities Commission in Malaysia. Pakistan: J. P. Morgan Pakistan Broking (Pvt.) Ltd is a member of the Karachi Stock Exchange and regulated by the Securities and Exchange Commission of Pakistan. Saudi Arabia: J.P. Morgan Saudi Arabia
325
Global Equity Research09 January 2014
Doug Anmuth(1-212) [email protected]
Ltd. is authorized by the Capital Market Authority of the Kingdom of Saudi Arabia (CMA) to carry out dealing as an agent, arranging, advising and custody, with respect to securities business under licence number 35-07079 and its registered address is at 8th Floor, Al-Faisaliyah Tower, King FahadRoad, P.O. Box 51907, Riyadh 11553, Kingdom of Saudi Arabia. Dubai: JPMorgan Chase Bank, N.A., Dubai Branch is regulated by the Dubai Financial Services Authority (DFSA) and its registered address is Dubai International Financial Centre - Building 3, Level 7, PO Box 506551, Dubai, UAE.
Country and Region Specific Disclosures U.K. and European Economic Area (EEA): Unless specified to the contrary, issued and approved for distribution in the U.K. and the EEA by JPMS plc. Investment research issued by JPMS plc has been prepared in accordance with JPMS plc's policies for managing conflicts of interest arising as a result of publication and distribution of investment research. Many European regulators require a firm to establish, implement and maintain such a policy. This report has been issued in the U.K. only to persons of a kind described in Article 19 (5), 38, 47 and 49 of the Financial Services and Markets Act 2000 (Financial Promotion) Order 2005 (all such persons being referred to as "relevant persons"). This document must not be acted on or relied on by persons who are not relevant persons. Any investment or investment activity to which this document relates is only available to relevant persons and will be engaged in only with relevant persons. In other EEA countries, the report has been issued to persons regarded as professional investors (or equivalent) in their home jurisdiction. Australia: This material is issued and distributed by JPMSAL in Australia to "wholesale clients" only. This material does not take into account the specific investment objectives, financial situation or particular needs of the recipient. The recipient of this material must not distribute it to any third party or outside Australia without the prior written consent of JPMSAL. For the purposes of this paragraph the term "wholesale client" has the meaning given in section 761G of the Corporations Act 2001. Germany: This material is distributed in Germany by J.P. Morgan Securities plc, Frankfurt Branch and J.P.Morgan Chase Bank, N.A., Frankfurt Branch which are regulated by the Bundesanstalt für Finanzdienstleistungsaufsicht. Hong Kong: The 1% ownership disclosure as of the previous month end satisfies the requirements under Paragraph 16.5(a) of the Hong Kong Code of Conduct for Persons Licensed by or Registered with the Securities and Futures Commission. (For research published within the first ten days of the month, the disclosure may be based on the month end data from two months prior.) J.P. Morgan Broking (Hong Kong) Limited is the liquidity provider/market maker for derivative warrants, callable bull bear contracts and stock options listed on the Stock Exchange of Hong Kong Limited. An updated list can be found on HKEx website: http://www.hkex.com.hk. Japan: There is a risk that a loss may occur due to a change in the price of the shares in the case of share trading, and that a loss may occur due to the exchange rate in the case of foreign share trading. In the case of share trading, JPMorgan Securities Japan Co., Ltd., will be receiving a brokerage fee and consumption tax (shouhizei) calculated by multiplying the executed price by the commission rate which was individually agreed between JPMorgan Securities Japan Co., Ltd., and the customer in advance. Financial Instruments Firms: JPMorgan Securities Japan Co., Ltd., Kanto Local Finance Bureau (kinsho) No. 82 Participating Association / Japan Securities Dealers Association, The Financial Futures Association of Japan, Type II Financial Instruments Firms Association and Japan Investment Advisers Association. Korea: This report may have been edited or contributed to from time to time by affiliates of J.P. Morgan Securities (Far East) Ltd, Seoul Branch. Singapore: JPMSS and/or its affiliates may have a holding in any of the securities discussed in this report; for securities where the holding is 1% or greater, the specific holding is disclosed in the Important Disclosures section above. India: For private circulation only, not for sale. Pakistan: For private circulation only, not for sale. New Zealand: This material is issued and distributed by JPMSAL in New Zealand only to persons whose principal business is the investment of money or who, in the course of and for the purposes of their business, habitually invest money. JPMSAL does not issue or distribute this material to members of "the public" as determined in accordance with section 3 of the Securities Act 1978. The recipient of this material must not distribute it to any third party or outside New Zealand without the prior written consent of JPMSAL. Canada: The information contained herein is not, and under no circumstances is to be construed as, a prospectus, an advertisement, a public offering, an offer to sell securities described herein, or solicitation of an offer to buy securities described herein, in Canada or any province or territory thereof. Any offer or sale of the securities described herein in Canada will be made only under an exemption from the requirements to file a prospectus with the relevant Canadian securities regulators and only by a dealer properly registered under applicable securities laws or, alternatively, pursuant to an exemption from the dealer registration requirement in the relevant province or territory of Canada in which such offer or sale is made. The information contained herein is under no circumstances to be construed as investment advice in any province or territory of Canada and is not tailored to the needs of the recipient. To the extent that the information contained herein references securities of an issuer incorporated, formed or created under the laws of Canada or a province or territory of Canada, any trades in such securities must be conducted through a dealer registered in Canada. No securities commission or similar regulatory authority in Canada has reviewed or in any way passed judgment upon these materials, the information contained herein or the merits of the securities described herein, and any representation to the contrary is an offence. Dubai: This report has been issued to persons regarded as professional clients as defined under the DFSA rules. Brazil: Ombudsman J.P. Morgan: 0800-7700847 / [email protected].
General: Additional information is available upon request. Information has been obtained from sources believed to be reliable but JPMorgan Chase & Co. or its affiliates and/or subsidiaries (collectively J.P. Morgan) do not warrant its completeness or accuracy except with respect to any disclosures relative to JPMS and/or its affiliates and the analyst's involvement with the issuer that is the subject of the research. All pricing is as of the close of market for the securities discussed, unless otherwise stated. Opinions and estimates constitute our judgment as of the date of this material and are subject to change without notice. Past performance is not indicative of future results. This material is not intended as an offer or solicitation for the purchase or sale of any financial instrument. The opinions and recommendations herein do not take into account individual client circumstances, objectives, or needs and are not intended as recommendations of particular securities, financial instruments or strategies to particular clients. The recipient of this report must make its own independent decisions regarding any securities or financial instruments mentioned herein. JPMS distributes in the U.S. research published by non-U.S. affiliates and accepts responsibility for its contents. Periodic updates may be provided on companies/industries based on company specific developments or announcements, market conditions or any other publicly available information. Clients should contact analysts and execute transactions through a J.P. Morgan subsidiary or affiliate in their home jurisdiction unless governing law permits otherwise.
"Other Disclosures" last revised December 7, 2013.
Copyright 2014 JPMorgan Chase & Co. All rights reserved. This report or any portion hereof may not be reprinted, sold or redistributed without the written consent of J.P. Morgan. #$J&098$#*P#*P