Jeffrey F. Paniati Associate Administrator for Operations Federal Highway Administration Department...
23
Jeffrey F. Paniati Associate Administrator for Operations Federal Highway Administration Department of Transportation Enabling Congestion Pricing in the United States ITS World Congress and Exhibition on Intelligent Transport Systems and Services London, UNITED KINGDOM October 2006 SS 12 – “Strategies for Future Funding: Enabling Road Pricing and Congestion Management”
-
date post
21-Dec-2015 -
Category
Documents
-
view
217 -
download
0
Transcript of Jeffrey F. Paniati Associate Administrator for Operations Federal Highway Administration Department...
Jeffrey F. Paniati
Associate Administrator for Operations
Federal Highway Administration
Department of Transportation
Enabling Congestion Pricing in the United States
ITS World Congress and Exhibition on Intelligent Transport Systems and Services
London, UNITED KINGDOMOctober 2006
SS 12 – “Strategies for Future Funding: Enabling Road Pricing and Congestion Management”
2
Presentation Outline
• Congestion in the U.S.
• Congestion Pricing as a solution
• U.S. Congestion Initiative - Moving forward on pricing
3
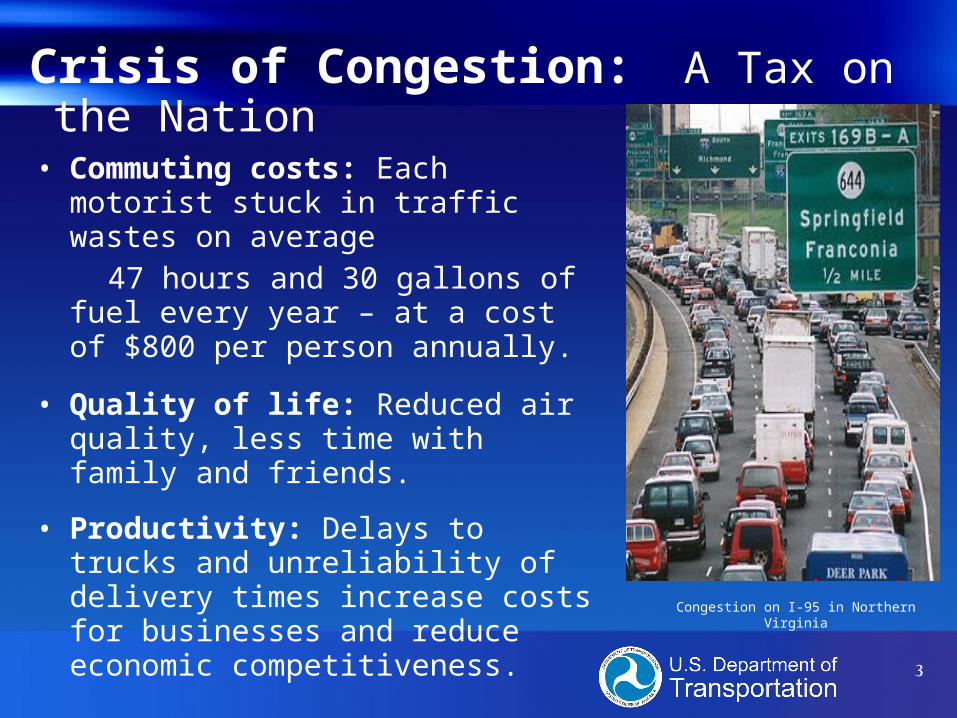
Congestion on I-95 in Northern Virginia
Crisis of Congestion: A Tax on the Nation
• Commuting costs: Each motorist stuck in traffic wastes on average
47 hours and 30 gallons of fuel every year – at a cost of $800 per person annually.
• Quality of life: Reduced air quality, less time with family and friends.
• Productivity: Delays to trucks and unreliability of delivery times increase costs for businesses and reduce economic competitiveness.
4
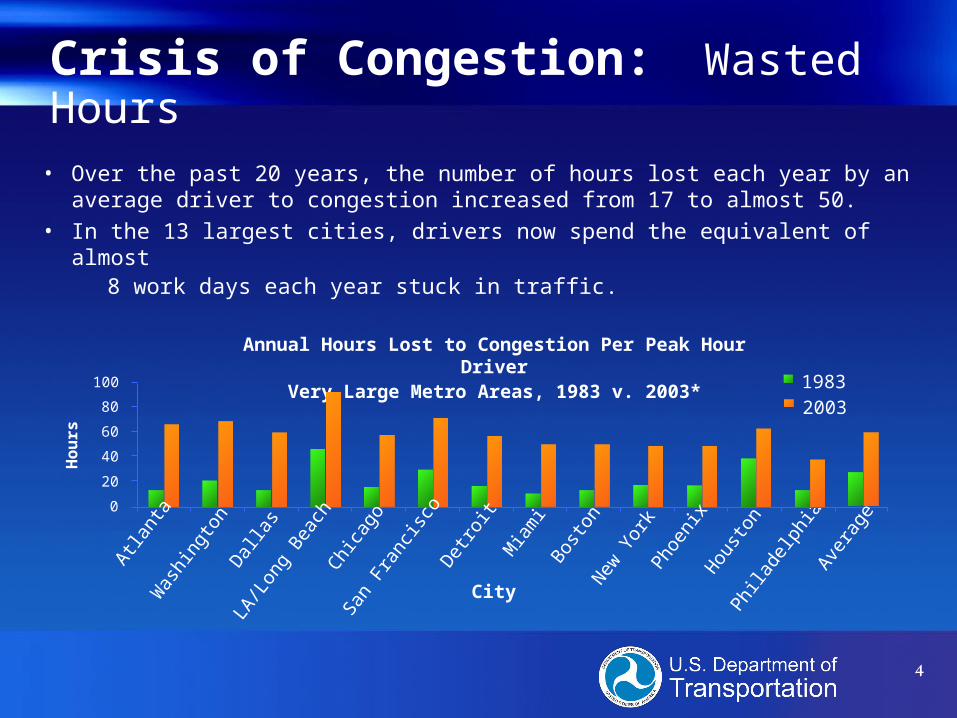
• Over the past 20 years, the number of hours lost each year by an average driver to congestion increased from 17 to almost 50.
• In the 13 largest cities, drivers now spend the equivalent of almost 8 work days each year stuck in traffic.
Annual Hours Lost to Congestion Per Peak Hour DriverVery Large Metro Areas, 1983 v. 2003*
Phila
delp
hia
Ho
urs
100
80
60
40
20
0
19832003
Atla
nta
Was
hing
ton
Dal
las
LA/L
ong
Beach
Chi
cago
San
Fran
cisc
o
Det
roit
Mia
mi
Bost
onN
ew Y
ork
Phoe
nix
Hou
ston
City
Aver
age
Crisis of Congestion: Wasted Hours
5
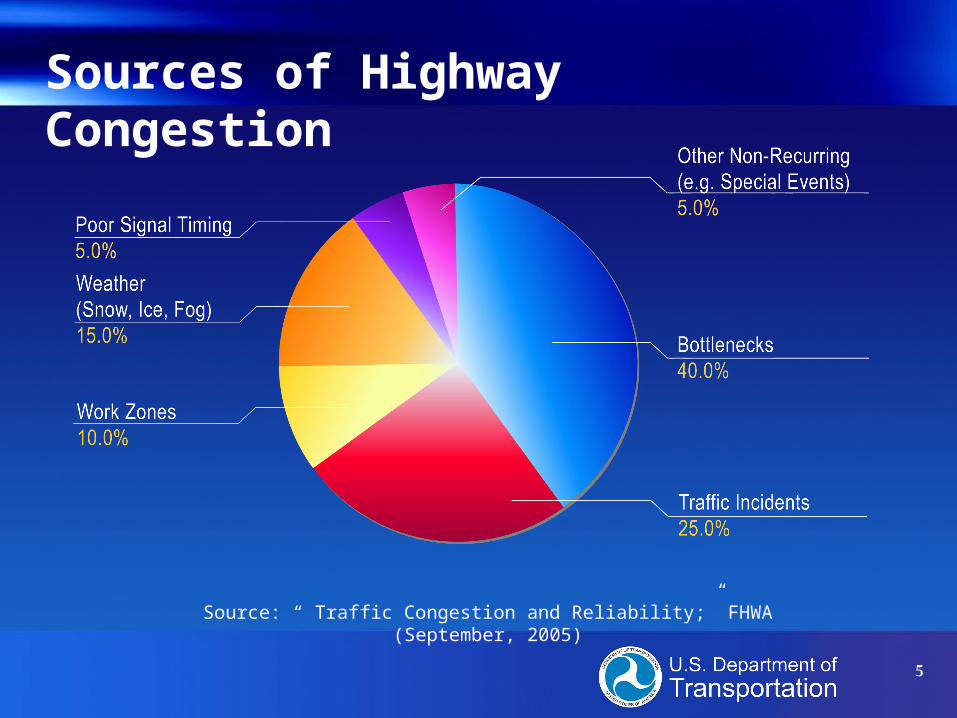
Sources of Highway Congestion
Source: “ Traffic Congestion and Reliability;” FHWA (September, 2005)
6
Challenges in Reducing Highway Congestion
• The price of highway travel (gas taxes, registration fees, etc.) bears little or no relationship to the cost of congestion.
• Unlike other public utilities, the public expectation is that the “service” is free or does not change with changes in demand.
• The highway industry has a long tradition of infrastructure building and has only recently begun to embrace the importance of system management and operations.
7
1. Relieve urban congestion.
2. Unleash private sector investment resources.
3. Promote operational and technological improvements.
4. Establish a “Corridors of the Future” competition.
5. Target major freight bottlenecks and expand freight policy outreach.
6. Accelerate major aviation capacity projects and provide a future funding framework.
A Six Point Plan
8
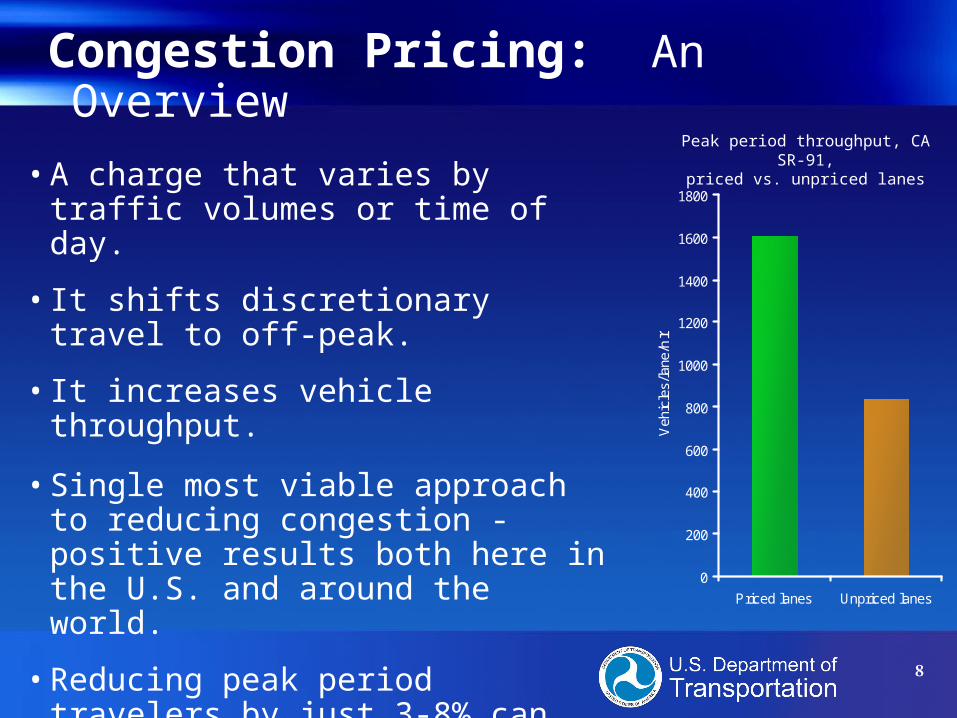
Peak period throughput, CA SR-91,priced vs. unpriced lanes
0
200
400
600
800
1000
1200
1400
1600
1800
Priced lanes Unpriced lanes
Veh
icle
s/la
ne/h
r
Congestion Pricing: An Overview
• A charge that varies by traffic volumes or time of day.
• It shifts discretionary travel to off-peak.
• It increases vehicle throughput.
• Single most viable approach to reducing congestion - positive results both here in the U.S. and around the world.
• Reducing peak period travelers by just 3-8% can reduce delays by up to 50%.
9
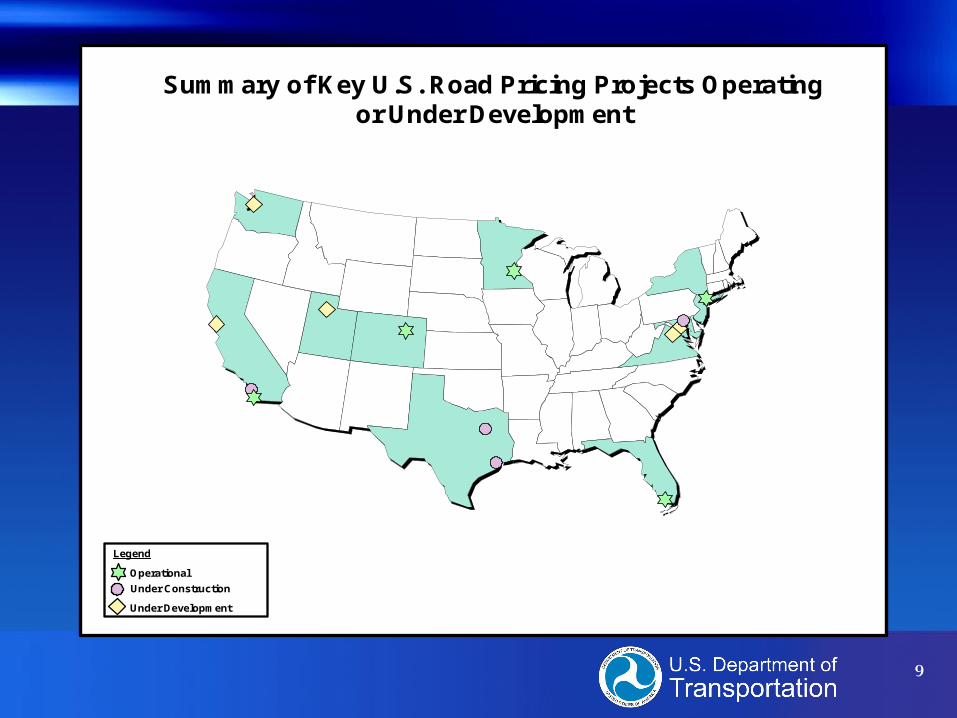
Summary of Key U.S. Road Pricing Projects Operating or Under Development
Under Development
Operational
Under Construction
Legend
10
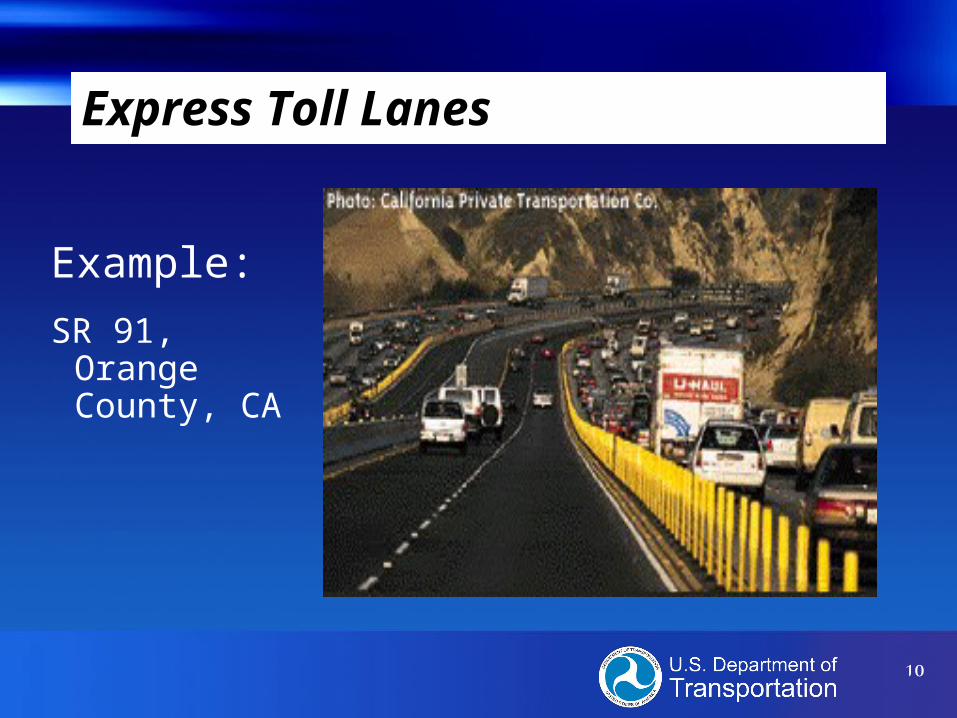
Express Toll Lanes
Example:
SR 91, Orange County, CA
11
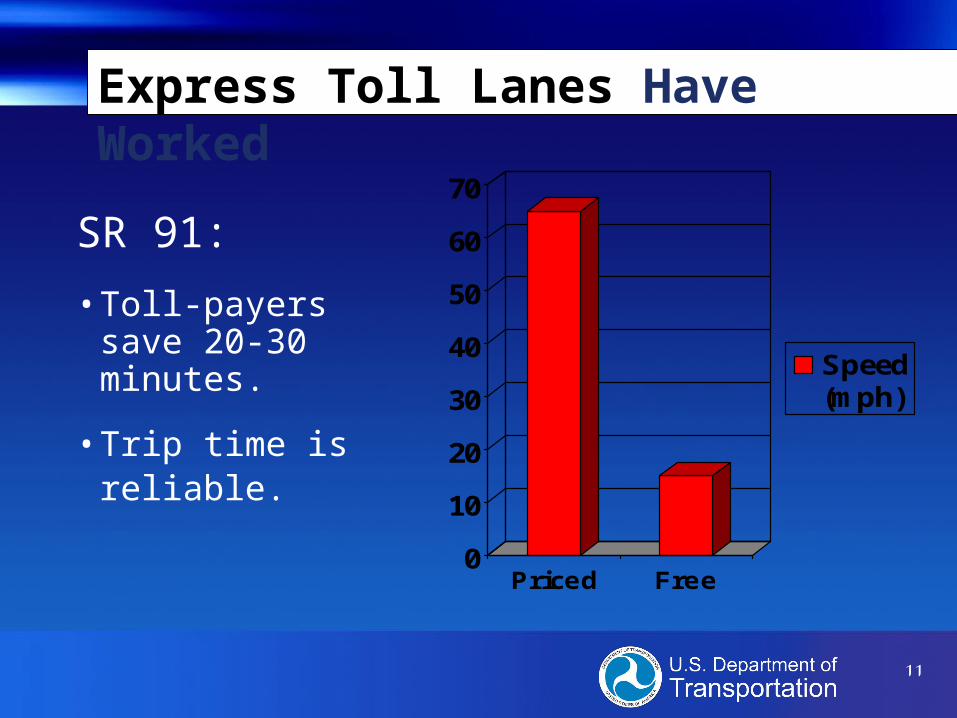
Express Toll Lanes Have Worked
0
10
20
30
40
50
60
70
Priced Free
Speed(mph)
SR 91:
• Toll-payers save 20-30 minutes.
• Trip time is reliable.
12
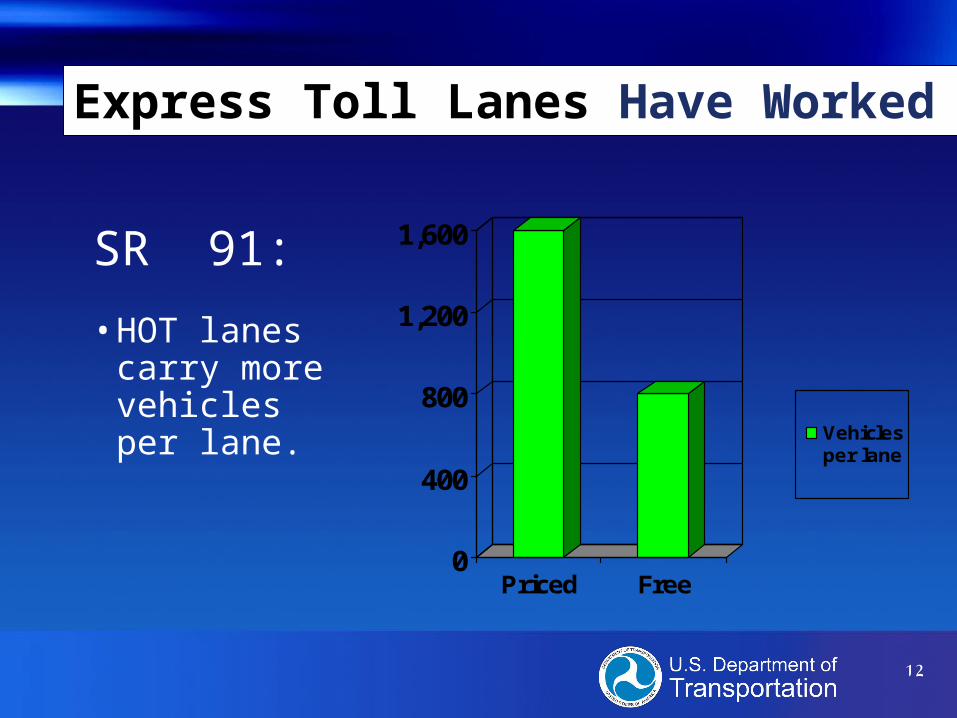
Express Toll Lanes Have Worked
0
400
800
1,200
1,600
Priced Free
Vehiclesper lane
SR 91:
• HOT lanes carry more vehicles per lane.
13
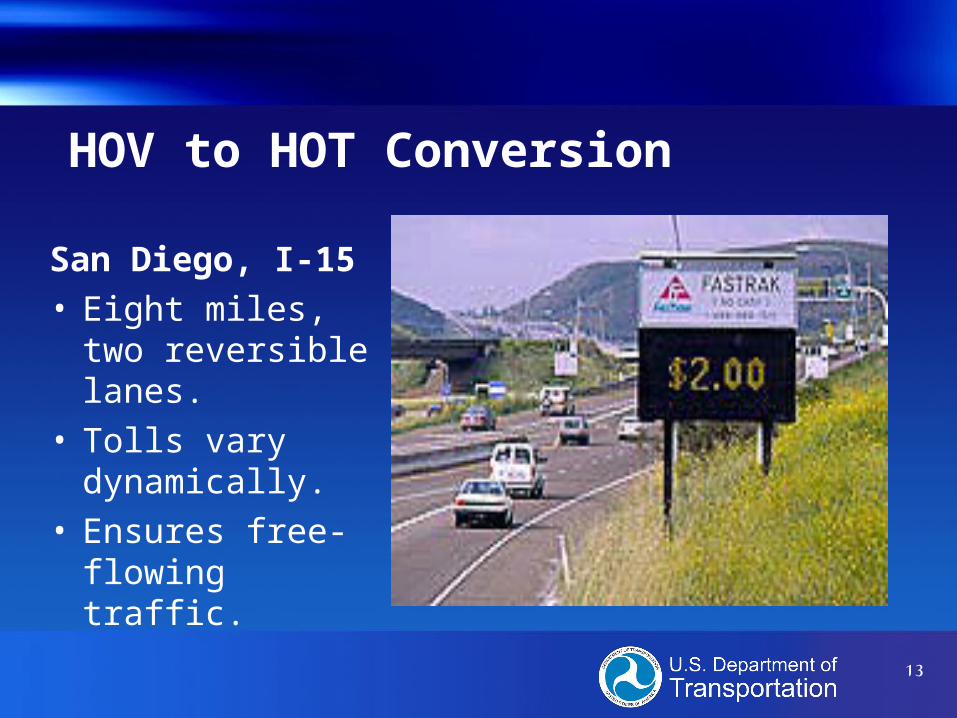
HOV to HOT Conversion
San Diego, I-15• Eight miles, two
reversible lanes. • Tolls vary
dynamically.• Ensures free-
flowing traffic.
14
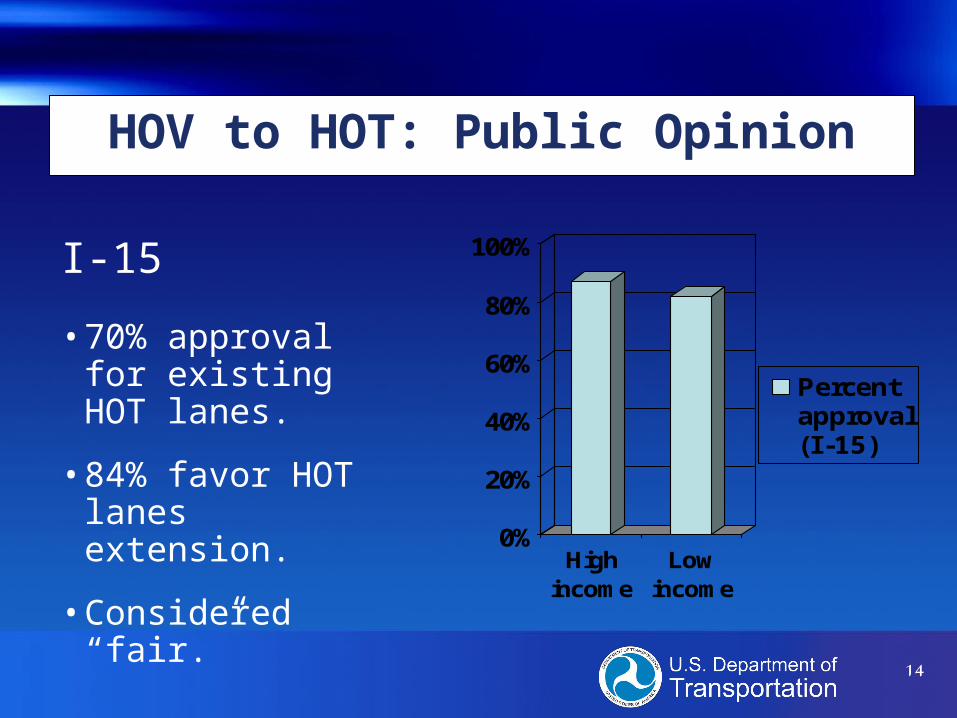
HOV to HOT: Public Opinion
0%
20%
40%
60%
80%
100%
Highincome
Lowincome
Percentapproval(I-15)
I-15
• 70% approval for existing HOT lanes.
• 84% favor HOT lanes extension.
• Considered “fair.”
15
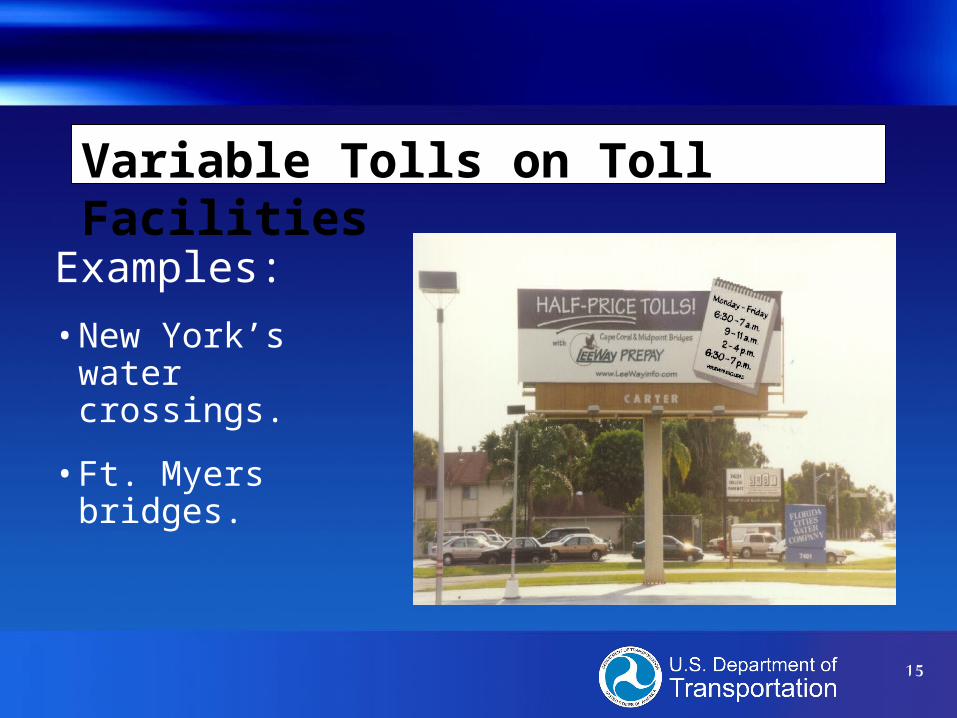
Variable Tolls on Toll Facilities
Examples:
• New York’s water crossings.
• Ft. Myers bridges.
16
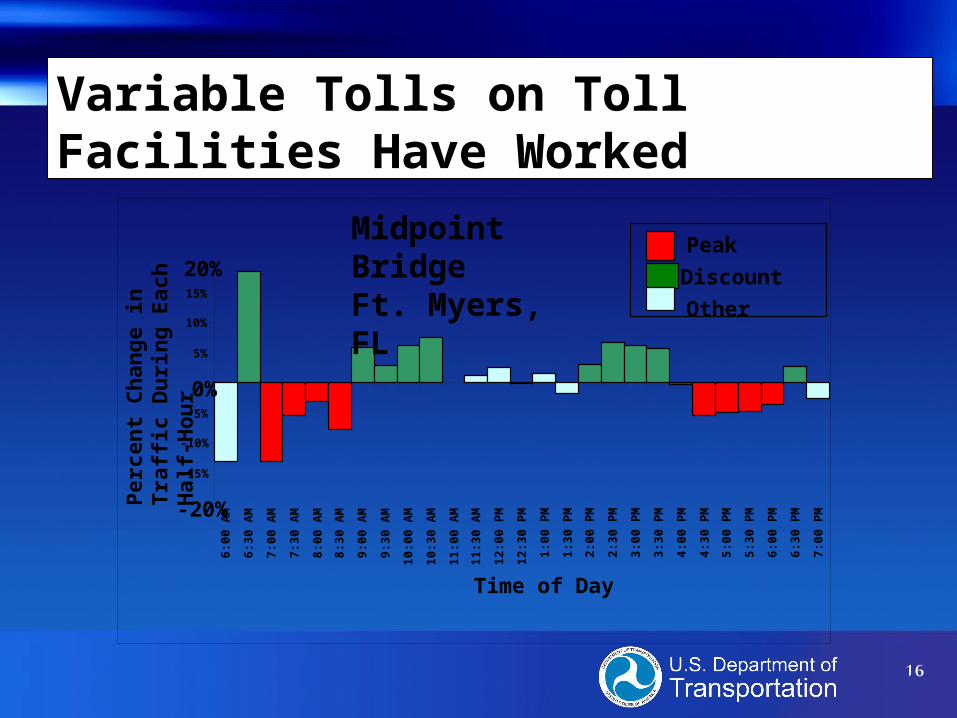
Variable Tolls on Toll Facilities Have Worked
Midpoint BridgeFt. Myers, FL
-20%
-15%
-10%
-5%
0%
5%
10%
15%
20%
6:00
AM
6:30
AM
7:00
AM
7:30
AM
8:00
AM
8:30
AM
9:00
AM
9:30
AM
10:0
0 A
M
10:3
0 A
M
11:0
0 A
M
11:3
0 A
M
12:0
0 P
M
12:3
0 P
M
1:00
PM
1:30
PM
2:00
PM
2:30
PM
3:00
PM
3:30
PM
4:00
PM
4:30
PM
5:00
PM
5:30
PM
6:00
PM
6:30
PM
7:00
PM
Time of Day
Per
cen
t C
han
ge
in T
raff
ic
Du
rin
g E
ach
Hal
f-H
ou
r Discount
Other
Peak
17
Challenges with Pricing Strategies: Public Acceptance
• Public acceptance issues:– Geographic, income, and user equity.– Public attitudes – double taxation, tolling
existing lanes, trust in government to use revenues “wisely.”
• Strategies to address issues:– Toll discounts or credits based on income.– Reduce existing tax burdens.– Increase public understanding of traffic
management benefits.
18
Challenges with Pricing Strategies: Technical
• Issues:– Costs and financial feasibility– Enforcement– Traffic operations
• Strategies to address issues:– Improve financial feasibility by tolling some
existing capacity.– If all vehicles pay, enforcement is easier.– New technologies are helping solve
operations and enforcement concerns.
19
Moving Forward: Urban Partnership Agreements
• The Objective:
To advance the U.S. Congestion Initiative by enabling cities to systematically progress towards implementation of broad congestion pricing over the course of the next three years.
20
US DOT Congestion Mitigation Initiative - Urban Partnerships
• Four components:– Broad congestion pricing– New or expanded bus rapid transit– Expanded telecommuting/flexible work
schedules– Technology/operations strategies
• Plus:– Expedited completion of key capacity projects
21
Moving Forward through the Value Pricing Pilot Program
Target Projects:• Pricing of existing major roadways
in a broad area• Priced Managed Lane Networks• Cordon Pricing• Parking Pricing
Phases:• Constituency Building/Public Outreach• Project Development/PPP• Implementation/Evaluation
22
Moving Forward with HOT Lanes and Express Toll Lanes
Target Projects:• Existing HOV lanes that are underutilized.
• Existing HOV lanes that have degraded service levels due to high traffic volumes.
• Proposed new HOV lanes.
• Proposed freeway expansion projects.
23
“Congestion is not a fact of life. We need a new approach, and we need it now.”
Secretary of Transportation Norman Y. Mineta
May 2006