Japan – The Peoples’ Greener Choice · Lucy Cotter Associate London : EXECUTIVE SUMMARY •...
49
Japan: The Peoples’ Greener Choice 1 Japan – The Peoples’ Greener Choice August, 2011 Mark Fulton Managing Director Global Head of Climate Change Investment Research, New York Michael Carboy Head of China Research Hong Kong Jane Cao (曹瑱) Research Associate Beijing Lucy Cotter Associate London EXECUTIVE SUMMARY • Post Fukushima crisis, Japanese society is seeking ways to dramatically reduce or eliminate nuclear generation while maintaining carbon budgets and improving energy security. Logically, this can only be achieved using conservation and efficiency measures and natural gas as a transition fuel as renewable energy capacity is aggressively built. • Electricity conservation and efficiency measures are the main bridge during the nuclear shutdown crisis and we estimate can contribute up to 17 GW of savings by 2030, increasing Electricity Intensity improvements to 2.2% per year, up from 1.5% in pre-earthquake government plans; • Our Scenario 1, “Practical Nuclear Reduction,” would reduce nuclear power in 2030 by 72%, convert all coal generation to natural gas and reach 228 GW of renewable capacity including nearly 60 GW of new wind capacity, nearly 100 GW of new solar capacity and 15 GW of new hydro capacity. Electricity from intermittent resources would account for 25% of estimated 2030 electricity production; • Our Scenario 2, “100% Nuclear Reduction,” examines achieving elimination of nuclear power by 2030 (closure of 49 GW of current nuclear capacity and cancellation of prospective planned 19 GW). We estimate in Scenario 2 Japan would need to reach 317 GW of total renewables capacity including 125 GW of wind capacity, 125 GW of solar capacity and 60 GW of hydro capacity. Electricity from intermittent resources would account for 42% of estimated 2030 electricity production; • Any significant renewables scenario will require Japan to simultaneously undertake a substantial “smart grid” program to increase transmission capacity and facilitate intermittent generation management; • The recently announced feed-in tariff (FiT) legislation is the first step toward the repowering of Japan. Following the tragic consequences of the March 2011 earthquake and tsunami, Japan has before it unprecedented challenges and opportunities for the country’s electricity infrastructure. In addition to physical destruction or damage to power generation facilities, in particular the Fukushima Dai-ichi facility, intense political and social debate has begun as the country considers eliminating nuclear power from the electricity sector. The country now faces the difficult short-term where 15% - 25% energy conservation measures must be adhered to given the impaired generation capacity. Despite this outlook, Japan now has a remarkable opportunity to aggressively expand renewables development and overhaul the electricity transmission grid as a means to achieve the country’s goal of reducing nuclear generation and increasing energy security.
Transcript of Japan – The Peoples’ Greener Choice · Lucy Cotter Associate London : EXECUTIVE SUMMARY •...
Japan: The Peoples’ Greener Choice
1
Japan – The Peoples’ Greener Choice August, 2011 Mark Fulton Managing Director Global Head of Climate Change Investment Research, New York
Michael Carboy Head of China Research Hong Kong
Jane Cao (曹瑱) Research Associate Beijing Lucy Cotter Associate London
EXECUTIVE SUMMARY • Post Fukushima crisis, Japanese society is seeking ways to dramatically reduce or eliminate nuclear generation
while maintaining carbon budgets and improving energy security. Logically, this can only be achieved using conservation and efficiency measures and natural gas as a transition fuel as renewable energy capacity is aggressively built.
• Electricity conservation and efficiency measures are the main bridge during the nuclear shutdown crisis and we estimate can contribute up to 17 GW of savings by 2030, increasing Electricity Intensity improvements to 2.2% per year, up from 1.5% in pre-earthquake government plans;
• Our Scenario 1, “Practical Nuclear Reduction,” would reduce nuclear power in 2030 by 72%, convert all coal generation to natural gas and reach 228 GW of renewable capacity including nearly 60 GW of new wind capacity, nearly 100 GW of new solar capacity and 15 GW of new hydro capacity. Electricity from intermittent resources would account for 25% of estimated 2030 electricity production;
• Our Scenario 2, “100% Nuclear Reduction,” examines achieving elimination of nuclear power by 2030 (closure of 49 GW of current nuclear capacity and cancellation of prospective planned 19 GW). We estimate in Scenario 2 Japan would need to reach 317 GW of total renewables capacity including 125 GW of wind capacity, 125 GW of solar capacity and 60 GW of hydro capacity. Electricity from intermittent resources would account for 42% of estimated 2030 electricity production;
• Any significant renewables scenario will require Japan to simultaneously undertake a substantial “smart grid” program to increase transmission capacity and facilitate intermittent generation management;
• The recently announced feed-in tariff (FiT) legislation is the first step toward the repowering of Japan.
Following the tragic consequences of the March 2011 earthquake and tsunami, Japan has before it unprecedented challenges and opportunities for the country’s electricity infrastructure. In addition to physical destruction or damage to power generation facilities, in particular the Fukushima Dai-ichi facility, intense political and social debate has begun as the country considers eliminating nuclear power from the electricity sector. The country now faces the difficult short-term where 15% - 25% energy conservation measures must be adhered to given the impaired generation capacity. Despite this outlook, Japan now has a remarkable opportunity to aggressively expand renewables development and overhaul the electricity transmission grid as a means to achieve the country’s goal of reducing nuclear generation and increasing energy security.
2 Japan: The Peoples’ Greener Choice
By our estimation, Japan’s ability to develop the substantial renewables opportunity is limited by business constraints, grid capacity and the lack of electricity storage as a way to mitigate the intermittency of wind and solar electricity production. In the near and medium-term, we believe the Japanese people can find incremental energy savings through a combination of conservation, efficiency and simple upgrades that could reduce electricity demand by ~12 - 15% and help the country bridge the energy gap. In Scenario 1, by 2030, we assume aggressive energy conservation and efficiency gains can be maintained and grid expansion and upgrade to a “smart” level can be accomplished. We then swap all coal-fired electricity production for natural gas electricity production and increase renewables electricity production to 44% of total production (19% from non-intermittent Hydro, Geothermal and Biomass and 25% from intermittent wind power (13%) and solar power (12%)). We chose to limit the level of intermittent renewables to 25% of electricity production in order to maintain grid stability. Thus, Japan may only need up to 19 GW of nuclear generation capacity in 2030 to supplement a substantial estimated 228 GW installed base of renewables generation by 2030. This installed base would comprise 100 GW of solar PV, 60 GW of wind power, 60 GW of hydro power and 8 GW of geothermal and biomass, combined.
DBCCA Scenario 1: “Practical Nuclear Reduction” – Increase Renewables to Manageable Levels by 2030
Fuel Mix
Electricity Production (TWHR)
Installed Generation Capacity (GW)
Gvt. Base Case (1) % Scenario 1 % Gvt. Base
Case (1) % Scenario 1 %
Coal 113 11% 0 0% 35 11% 0 0%
Gas 136 13% 327 37% 52 16% 87 23%
Oil 21 2% 21 2% 43 14% 43 11%
Nuclear 537 53% 151 17% 68 21% 19 5%
Hydro 107 10% 137 15% 47 15% 60 16%
Geothermal 10 1% 13 1% 2 0% 2 1%
Wind 19 2% 116 13% 10 3% 60 16%
Solar 59 6% 105 12% 56 18% 100 27%
Biomass 19 2% 19 2% 6 2% 6 1%
Sub Total – RE 214 21% 389 44% 120 38% 228 60%
Total 1021 100% 888 100% 318 100% 377 100% Source: Japan government documents and DBCCA estimates (2011).
Note 1: Reflects the expected 2030 conditions estimated by the Japan government’s pre-earthquake 2010 Basic Energy Plan (Gvt. Base Case)
Red – Reflects changes compared to Gvt. Base Case. Green – Reflects total renewable quantities.
In comparison to Japan’s 2030 Base Case estimated electricity portfolio, our Scenario 1 “Practical Nuclear Reduction” represents a material change, including a 72% reduction in the role of nuclear power and a 13% reduction in electricity production. The Japan government’s pre-earthquake Basic Energy Plan (the “Base Case”) envisaged 68 GW of nuclear generation producing 53% of the nation’s electricity, coal continuing to produce 11% of electricity and renewables producing 21% (6% from solar, 10% from hydro, 2% from wind and 2% from biomass). In the Base Case, electricity production from intermittent resources would have accounted for 8% of TWHR produced compared to 25% in our Scenario 1.
3 Japan: The Peoples’ Greener Choice
In terms of aggregate net differences between the Base Case and our Scenario 1 “Practical Nuclear Reduction,” we depict the estimated net changes to Japan’s electricity system in Figure 1. We believe that Japan can eliminate 49 GW of nuclear generation capacity and all coal-fired generation capacity moving aggressively beyond the 2030 goals in the Base Case reflected in the pre-earthquake Basic Energy Plan targets. Of particular interest is the estimated 17 GW of nuclear equivalent capacity reductions attributable to the combined influence of electricity conservation measures and energy efficiency gains. The net effect of this 17 GW savings is to increase the annual rate of improvement in Japan’s Electricity Intensity by 70 bp to a 2.2% annual improvement rate, up from the 1.5% annual improvement rate implicit in the Base Case. Figure 1: Summary of Changes to Japan Electricity System – Scenario 1 “Practical Nuclear Reduction” vs. Base Case
Source: DBCCA estimates (2011).
If the Japanese people ultimately decided to eliminate all nuclear electricity production by 2030, we estimate in our Scenario 2 “100% Nuclear Reduction” that Japan would need approximately 317 GW of renewables installed capacity (125 GW, each, of wind capacity and solar capacity). Were such a transformation to occur, electricity produced by intermittent renewables generation capacity would account for 42% of total electricity production in 2030. The government has recently passed significant legislation authorizing FiT programs for renewables energy, in particular in the wind, solar, geothermal and biomass areas. We have spoken before about the need for transparency, longevity and certainty [TLC] in formulating effective renewables policy. This legislation is a major step in that direction. Details of the FiT program addressing tariff rates, program caps and durations are not yet available, making it hard to estimate marginal electricity costs which is compounded by the need to radically overhaul the transmission grid to accommodate the greater contributions from renewables. The grid challenge must address not just access, capacity and frequency conversion upgrades, but also requires transition a to a “smart grid” architecture. Although we believe current renewables costs are likely to decline materially given the scale of Japan’s investment, grid overhaul costs are uncertain and we are unable to estimate the total incremental costs associated with higher natural gas usage. Based strictly on current renewables costs, the cost of repowering Japan with green energy sources as a way to minimize nuclear generation operation would exceed the cost of “denuclearizing” with fossil fuels. Although a fossil fuel solution may appear cheaper, there is more at stake because externalities like carbon commitments, security
-49
-35
3544
50
13
-17
-60
-40
-20
0
20
40
60
Nuclear Coal Natural Gas Solar PV Wind Power HydroPower
Efficiency & Conservation
GW
's o
f Ins
talle
d Ca
paci
ty
Scenario 1 - Net Changes to Electricity SystemCompared to Government Base Case, 2030
4 Japan: The Peoples’ Greener Choice
issues and the prospect of future cheaper renewables technologies should not be ignored. Ultimately a trade-off between costs, security, externalities like GHG commitments and the desire to continue using some amount of nuclear generated electricity is the complex choice before the people of Japan. INVESTMENT CONCLUSIONS Given what we think will be a green repowering of Japan, several different areas may be fertile ground for investment activity. During the near-term transition period, we believe opportunities will be found in markets touched directly by energy conservation and energy efficiency needs. Such areas could include the consumer white goods (such as refrigerators, air conditioners and other household appliances), electronics and lighting areas as consumers replace and upgrade less efficient appliances and incandescent light bulbs. Both equipment manufacturers, providers of high efficiency sub-components and distribution channel players could be areas for attractive investment returns. On the supply side, vendors supplying large scale back-up power systems and necessary electricity infrastructure components (such as switchgear and cabling) could prosper. In the medium term and beyond, wind and solar power systems and grid infrastructure expansion would likely create opportunities for project financing as well as demand for the renewable generation equipment, construction equipment and related component makers including switchgear and transmission component vendors and cable manufacturers. As renewable generation systems commence operation, we believe demand for operations and maintenance service providers is likely to follow. Development of “smart grid” aspects of the transmission and distribution grid would likely create opportunities for systems and customer management software, electricity meter vendors and resource (wind and sunlight) forecasting services and software.
5 Japan: The Peoples’ Greener Choice
Introduction
Beyond the immeasurable human suffering, the tragedy of Japan’s March earthquake and tsunami is having considerable impact on both the country’s current energy situation and future energy development plans. Broad societal concerns over “nuclear” or perhaps we think really “nuclear management,” have lead to political actions that suggest dramatic curtailments to Japan’s nuclear ambitions. Having already set significant goals in the pre-earthquake Basic Energy Plan to add substantial renewables (wind power and solar power) to the energy profile, Japan had planned to achieve 70% energy self-sufficiency by 2030, up from a 2009 level of 38%. Part of this effort would have seen “zero emissions” fuel sources accounting for 70% of electricity generation by 2030, up from 34% in 2009 while concomitantly cutting CO2 emissions from “daily life activities” by 50% from 2009 levels. To accomplish these environmental and energy security goals, the Japanese government’s pre-earthquake plans, compared to 2007 installed generation capacities, envisaged an incremental 70 GW of renewables and 19 GW of nuclear by 2030 while reducing coal, LNG and oil-fired generating capacity by 3 GW, 6 GW and 4 GW, respectively. In addition to annual goals to improve energy efficiency, lower energy intensity/GDP metrics were planned. Japan had set out an ambitious plan to decarbonize their energy infrastructure while enhancing energy security. Then the March 2011 earthquake and tsunami occurred… These unprecedented disasters destroyed or materially impaired operation of substantial portions of the Japan’s electricity infrastructure. In a few short moments, at least 32 GW (comprising 16 GW of nuclear and 16 GW of thermal installed generation capacity) of the nation’s 237 GW installed generation capacity ceased functioning. While most thermal units have returned to service, as of August 2011, 39 of Japan’s 54 nuclear reactors, representing 33 GW of installed capacity were shutdown and, pending political action may remain shutdown. It is conceivable that by May 2012, all of Japan’s 49 GW of nuclear generator capacity may be offline, an amount representing approximately 25% of the entire installed generation capacity and 30% of electricity company production. This is a dramatic reduction in resources further compounded by grid limitations unique to Japan that severely exacerbate the problem. Japan is now faced with having to develop rapidly a new energy plan to achieve multiple goals in the realms of climate change mitigation, politics and economics. To date, the Japanese citizens have shouldered an enormous burden, committing to behavioral changes to reduce energy consumption by 15%; Tokyo and the immediate vicinity have been asked to trim power demands by 25%. Such reductions in load could represent an amount approximating 9 GW of installed generation capacity in the Tokyo region alone and 17GW nationally. Despite the difficulties, disruptions and discomforts, the Japanese have reduced their power usage, generally avoiding mass blackouts. We salute the remarkable efforts in the face of such adversity. While we cannot forecast human behaviors, we hope to show how significant portions of the energy conservation and efficiency efforts now being made will be sustained and become routine behaviors contributing up to 133 TWHRs of reduced electricity consumption on an annual basis. Such an amount is equivalent to the annual electricity produced by 17 GW of nuclear installed generation capacity. This paper explores the issues facing the country as it plans for the future, a large part of which could be significantly greener and more energy secure than might have been expected at the beginning of 2011.
6 Japan: The Peoples’ Greener Choice
Japan’s Electricity Infrastructure Before the March 2011 Great Earthquake
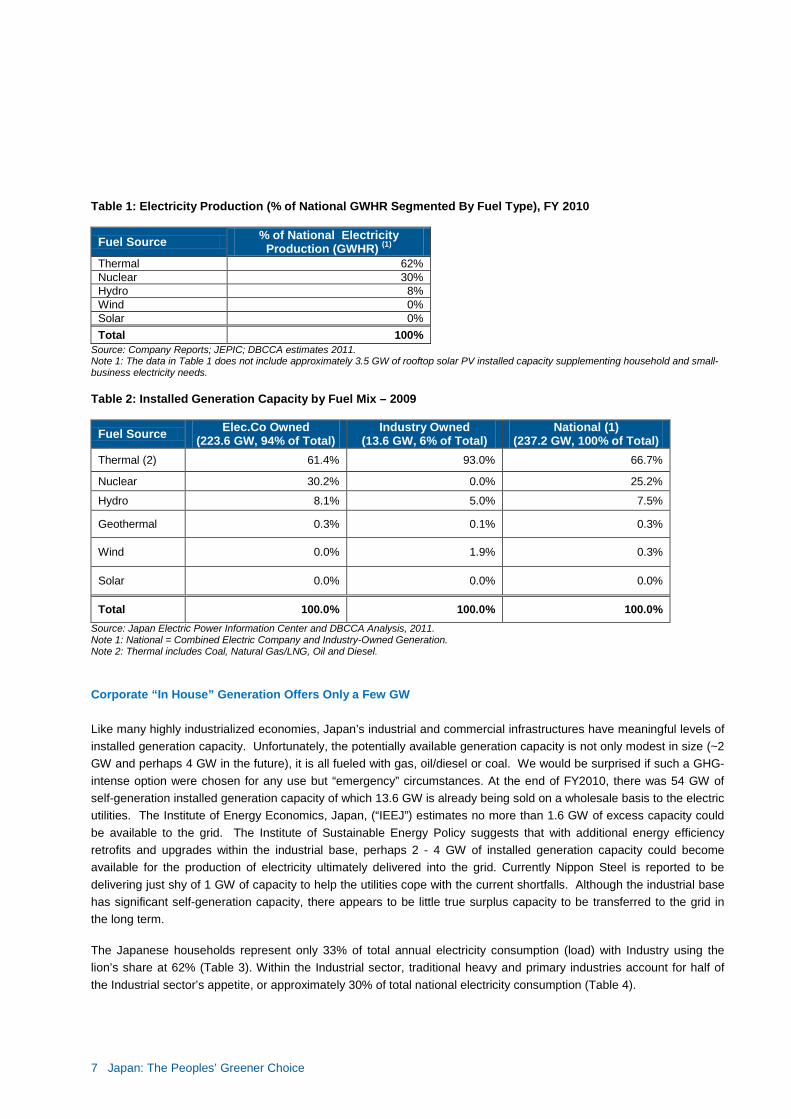
Overview of Japan’s Electricity and Grid Infrastructure To appreciate the problem facing Japan as the result of the earthquake and tsunami, we believe a quick overview of Japan’s power infrastructure is necessary to frame the discussion of future planning in a world constrained by national politics, global emissions commitments, economics and operational practicalities. In terms of electricity production (Table 1), Japan produces 62% of its electricity from thermal sources including coal, natural gas, fuel and diesel oil. Nuclear power represents 30% of total generated power. Table 2 provides detail on the relative contribution of installed generation capacity by electric companies and industry-owned and other wholesale generators in order to reach this level of actual generated or produced electricity given capacity factors. The data in Table 1 does not include approximately 3.5 GW of rooftop solar PV installed capacity supplementing household and small-business electricity needs.
Before delving into the technical details of Japan’s electricity infrastructure, we define several concepts. The Installed Generation Capacity of an electricity generation system is measured in terms such as kilowatt (KW), megawatt (MW) [=1,000 KW] and gigawatt (GW) [= 1,000 MW]. It is the maximum amount of power, under design conditions, the system is supposed to be capable of producing at any instant. It is a measure that is conceptually comparable to the horsepower rating of the engine in a car. The quantity of electricity produced/generated/consumed, sometimes referred to as Load, occurs over a period of time is measured in terms like kilowatt-hour (KWHR), megawatt-hour(MWHR), gigawatt-hour (GWHR) and terawatt-hour (TWHR). The link between the installed generation capacity and the amount of electricity produced is a combination of time and what is known as the Capacity Factor (sometimes dispatch factor) which measures in effect how much of the installed generation capacity is available over time. When used, capacity factor typically refers to annual availability. Installed generation capacity can be segmented into highly reliable resources like fossil fueled or nuclear powered systems. These systems are able to produce power under almost all circumstances so long as fuel is available. Electricity production from renewable resources like wind power or solar power installed generation capacity is dependent on wind and sunshine which are variable in nature. This leads to the concepts of “base load” for fossil fuels and nuclear as they are generally reliably available and “intermittent” for renewables where the sun shines and wind blows with less predictably . With discovery and development of economical utility-scale electricity storage, the intermittent nature of renewables will decrease and the significant difference between current capacity factors for highly-reliable base loads (~80%) and intermittent (15%-30%) will likely contract. Load or consumption is also affected by three main drivers: growth in the economy offset by either conservation which is behavioral change or efficiency which is improving the use of energy in the economy. The net effect of all these influences, both conservation and efficiency, is described as Electricity Intensity, typically expressed per unit of GDP.
7 Japan: The Peoples’ Greener Choice
Table 1: Electricity Production (% of National GWHR Segmented By Fuel Type), FY 2010
Fuel Source % of National Electricity Production (GWHR) (1)
Thermal 62% Nuclear 30% Hydro 8% Wind 0% Solar 0% Total 100%
Source: Company Reports; JEPIC; DBCCA estimates 2011. Note 1: The data in Table 1 does not include approximately 3.5 GW of rooftop solar PV installed capacity supplementing household and small-business electricity needs. Table 2: Installed Generation Capacity by Fuel Mix – 2009
Fuel Source Elec.Co Owned (223.6 GW, 94% of Total)
Industry Owned (13.6 GW, 6% of Total)
National (1) (237.2 GW, 100% of Total)
Thermal (2) 61.4% 93.0% 66.7%
Nuclear 30.2% 0.0% 25.2%
Hydro 8.1% 5.0% 7.5%
Geothermal 0.3% 0.1% 0.3%
Wind 0.0% 1.9% 0.3%
Solar 0.0% 0.0% 0.0%
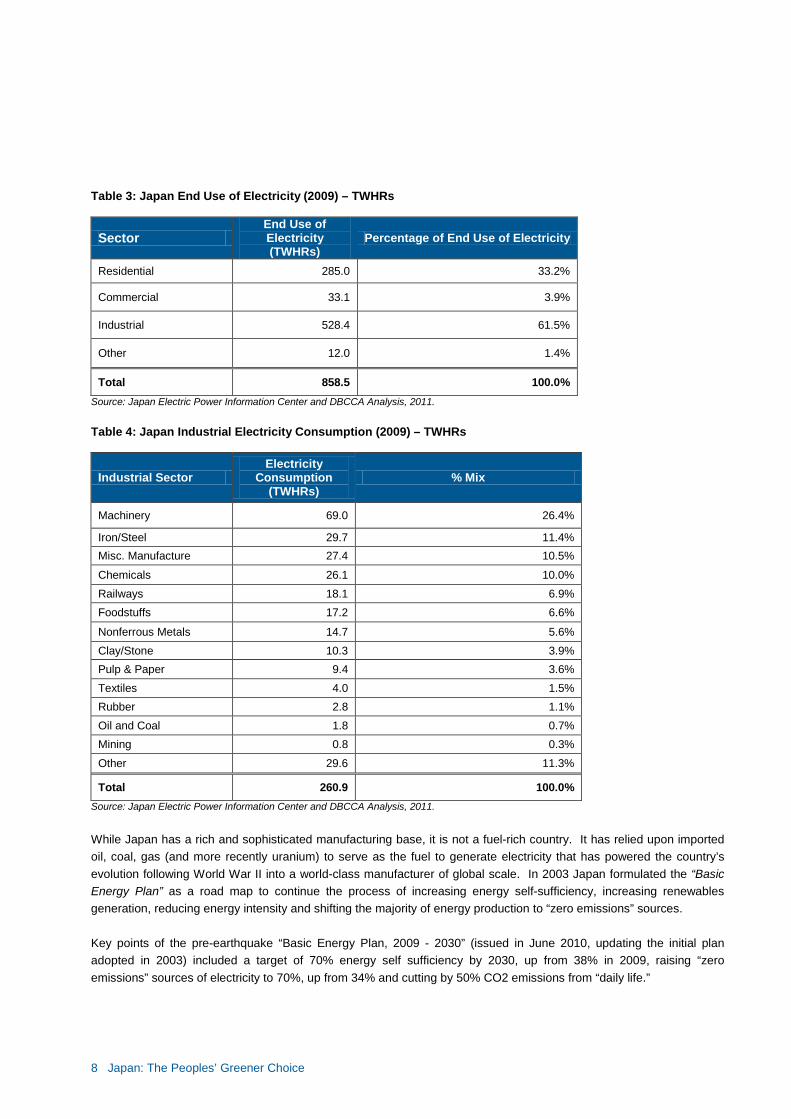
Total 100.0% 100.0% 100.0% Source: Japan Electric Power Information Center and DBCCA Analysis, 2011. Note 1: National = Combined Electric Company and Industry-Owned Generation. Note 2: Thermal includes Coal, Natural Gas/LNG, Oil and Diesel. Corporate “In House” Generation Offers Only a Few GW Like many highly industrialized economies, Japan’s industrial and commercial infrastructures have meaningful levels of installed generation capacity. Unfortunately, the potentially available generation capacity is not only modest in size (~2 GW and perhaps 4 GW in the future), it is all fueled with gas, oil/diesel or coal. We would be surprised if such a GHG-intense option were chosen for any use but “emergency” circumstances. At the end of FY2010, there was 54 GW of self-generation installed generation capacity of which 13.6 GW is already being sold on a wholesale basis to the electric utilities. The Institute of Energy Economics, Japan, (“IEEJ”) estimates no more than 1.6 GW of excess capacity could be available to the grid. The Institute of Sustainable Energy Policy suggests that with additional energy efficiency retrofits and upgrades within the industrial base, perhaps 2 - 4 GW of installed generation capacity could become available for the production of electricity ultimately delivered into the grid. Currently Nippon Steel is reported to be delivering just shy of 1 GW of capacity to help the utilities cope with the current shortfalls. Although the industrial base has significant self-generation capacity, there appears to be little true surplus capacity to be transferred to the grid in the long term. The Japanese households represent only 33% of total annual electricity consumption (load) with Industry using the lion’s share at 62% (Table 3). Within the Industrial sector, traditional heavy and primary industries account for half of the Industrial sector’s appetite, or approximately 30% of total national electricity consumption (Table 4).
8 Japan: The Peoples’ Greener Choice
Table 3: Japan End Use of Electricity (2009) – TWHRs
Sector End Use of Electricity (TWHRs)
Percentage of End Use of Electricity
Residential 285.0 33.2%
Commercial 33.1 3.9%
Industrial 528.4 61.5%
Other 12.0 1.4%
Total 858.5 100.0% Source: Japan Electric Power Information Center and DBCCA Analysis, 2011. Table 4: Japan Industrial Electricity Consumption (2009) – TWHRs
Industrial Sector Electricity
Consumption (TWHRs)
% Mix
Machinery 69.0 26.4%
Iron/Steel 29.7 11.4% Misc. Manufacture 27.4 10.5%
Chemicals 26.1 10.0% Railways 18.1 6.9% Foodstuffs 17.2 6.6%
Nonferrous Metals 14.7 5.6% Clay/Stone 10.3 3.9% Pulp & Paper 9.4 3.6% Textiles 4.0 1.5% Rubber 2.8 1.1% Oil and Coal 1.8 0.7% Mining 0.8 0.3%
Other 29.6 11.3%
Total 260.9 100.0% Source: Japan Electric Power Information Center and DBCCA Analysis, 2011. While Japan has a rich and sophisticated manufacturing base, it is not a fuel-rich country. It has relied upon imported oil, coal, gas (and more recently uranium) to serve as the fuel to generate electricity that has powered the country’s evolution following World War II into a world-class manufacturer of global scale. In 2003 Japan formulated the “Basic Energy Plan” as a road map to continue the process of increasing energy self-sufficiency, increasing renewables generation, reducing energy intensity and shifting the majority of energy production to “zero emissions” sources. Key points of the pre-earthquake “Basic Energy Plan, 2009 - 2030” (issued in June 2010, updating the initial plan adopted in 2003) included a target of 70% energy self sufficiency by 2030, up from 38% in 2009, raising “zero emissions” sources of electricity to 70%, up from 34% and cutting by 50% CO2 emissions from “daily life.”
9 Japan: The Peoples’ Greener Choice
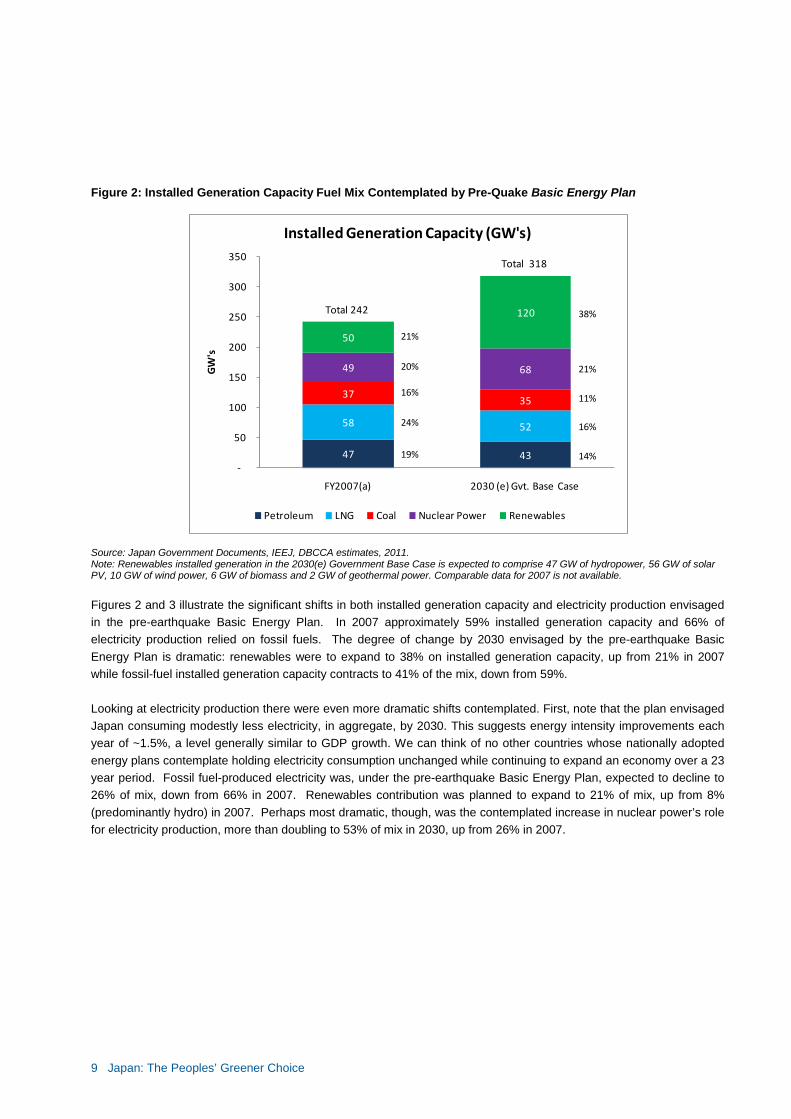
Figure 2: Installed Generation Capacity Fuel Mix Contemplated by Pre-Quake Basic Energy Plan
Source: Japan Government Documents, IEEJ, DBCCA estimates, 2011. Note: Renewables installed generation in the 2030(e) Government Base Case is expected to comprise 47 GW of hydropower, 56 GW of solar PV, 10 GW of wind power, 6 GW of biomass and 2 GW of geothermal power. Comparable data for 2007 is not available. Figures 2 and 3 illustrate the significant shifts in both installed generation capacity and electricity production envisaged in the pre-earthquake Basic Energy Plan. In 2007 approximately 59% installed generation capacity and 66% of electricity production relied on fossil fuels. The degree of change by 2030 envisaged by the pre-earthquake Basic Energy Plan is dramatic: renewables were to expand to 38% on installed generation capacity, up from 21% in 2007 while fossil-fuel installed generation capacity contracts to 41% of the mix, down from 59%. Looking at electricity production there were even more dramatic shifts contemplated. First, note that the plan envisaged Japan consuming modestly less electricity, in aggregate, by 2030. This suggests energy intensity improvements each year of ~1.5%, a level generally similar to GDP growth. We can think of no other countries whose nationally adopted energy plans contemplate holding electricity consumption unchanged while continuing to expand an economy over a 23 year period. Fossil fuel-produced electricity was, under the pre-earthquake Basic Energy Plan, expected to decline to 26% of mix, down from 66% in 2007. Renewables contribution was planned to expand to 21% of mix, up from 8% (predominantly hydro) in 2007. Perhaps most dramatic, though, was the contemplated increase in nuclear power’s role for electricity production, more than doubling to 53% of mix in 2030, up from 26% in 2007.
47 43
58 52
37 35
49 68
50
120
-
50
100
150
200
250
300
350
FY2007(a) 2030 (e) Gvt. Base Case
GW
's
Installed Generation Capacity (GW's)
Petroleum LNG Coal Nuclear Power Renewables
Total 242
Total 318
21%
20%
16%
24%
19%
38%
21%
11%
16%
14%
10 Japan: The Peoples’ Greener Choice
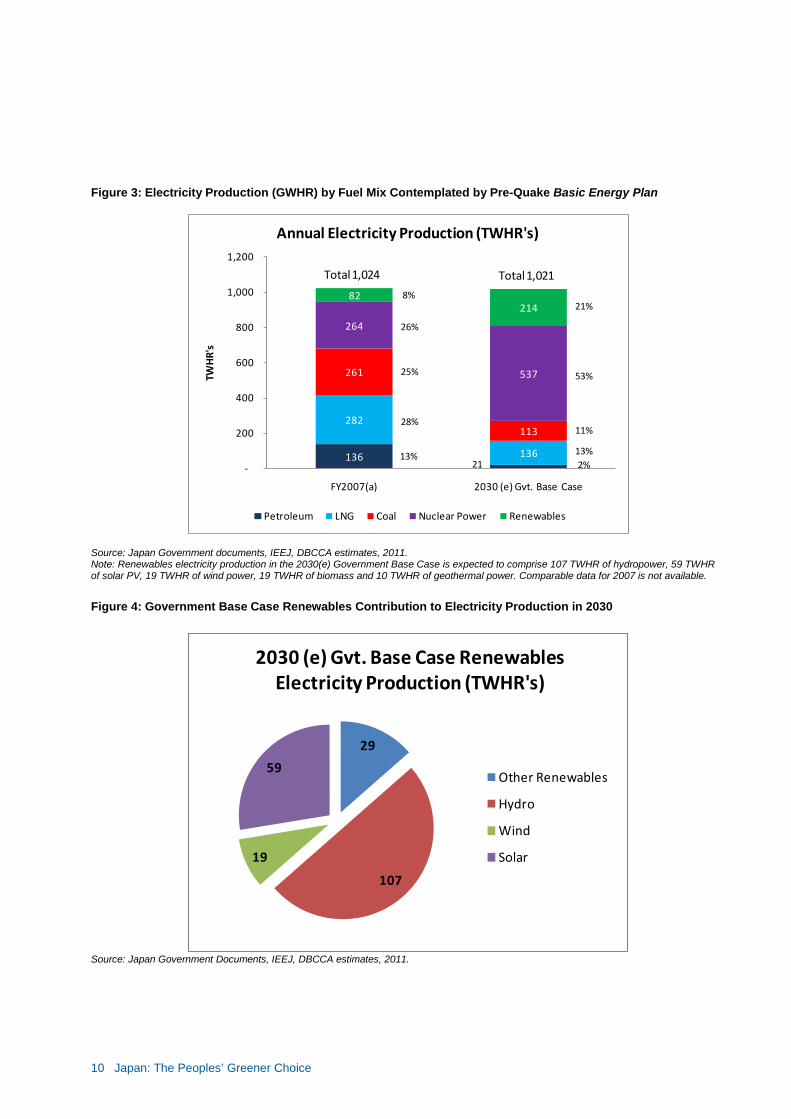
Figure 3: Electricity Production (GWHR) by Fuel Mix Contemplated by Pre-Quake Basic Energy Plan
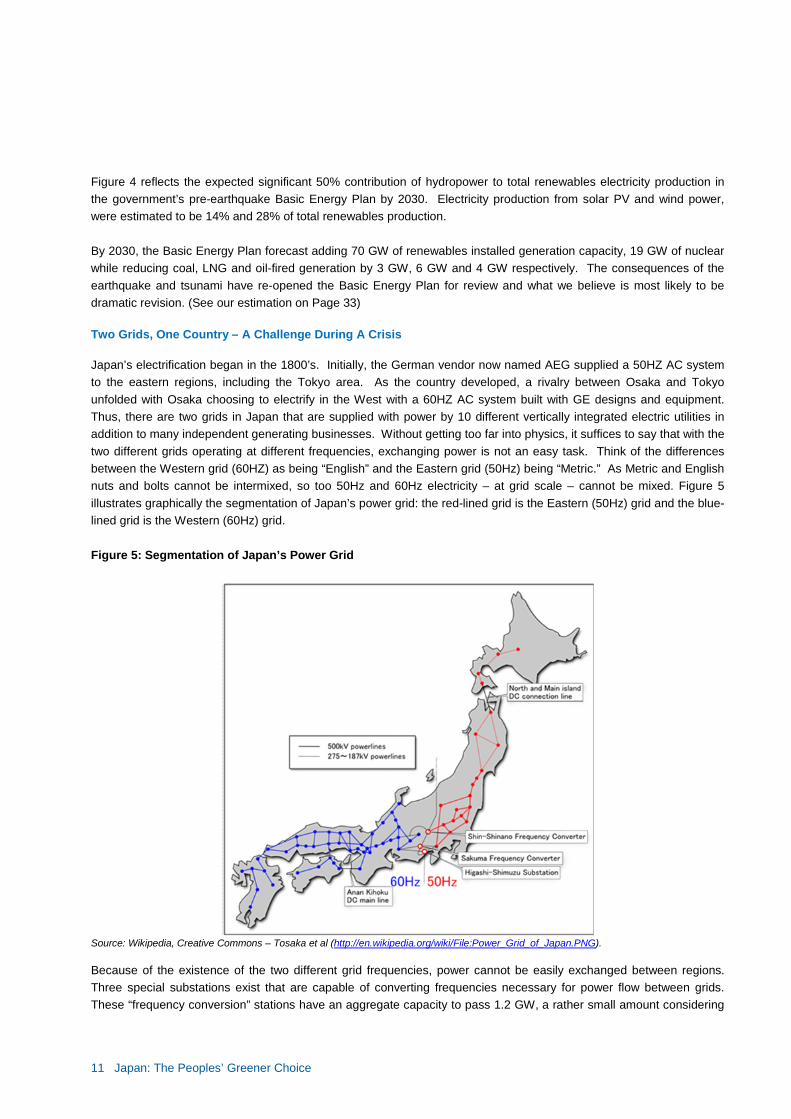
Source: Japan Government documents, IEEJ, DBCCA estimates, 2011. Note: Renewables electricity production in the 2030(e) Government Base Case is expected to comprise 107 TWHR of hydropower, 59 TWHR of solar PV, 19 TWHR of wind power, 19 TWHR of biomass and 10 TWHR of geothermal power. Comparable data for 2007 is not available. Figure 4: Government Base Case Renewables Contribution to Electricity Production in 2030
Source: Japan Government Documents, IEEJ, DBCCA estimates, 2011.
136
282
136
261
113
264
537
82 214
-
200
400
600
800
1,000
1,200
FY2007(a) 2030 (e) Gvt. Base Case
TWH
R's
Annual Electricity Production (TWHR's)
Petroleum LNG Coal Nuclear Power Renewables
Total 1,024 Total 1,021
21
8%
26%
25%
28%
13%
21%
53%
11%
13%2%
29
107
19
59
2030 (e) Gvt. Base Case Renewables Electricity Production (TWHR's)
Other Renewables
Hydro
Wind
Solar
11 Japan: The Peoples’ Greener Choice
Figure 4 reflects the expected significant 50% contribution of hydropower to total renewables electricity production in the government’s pre-earthquake Basic Energy Plan by 2030. Electricity production from solar PV and wind power, were estimated to be 14% and 28% of total renewables production. By 2030, the Basic Energy Plan forecast adding 70 GW of renewables installed generation capacity, 19 GW of nuclear while reducing coal, LNG and oil-fired generation by 3 GW, 6 GW and 4 GW respectively. The consequences of the earthquake and tsunami have re-opened the Basic Energy Plan for review and what we believe is most likely to be dramatic revision. (See our estimation on Page 33) Two Grids, One Country – A Challenge During A Crisis Japan’s electrification began in the 1800’s. Initially, the German vendor now named AEG supplied a 50HZ AC system to the eastern regions, including the Tokyo area. As the country developed, a rivalry between Osaka and Tokyo unfolded with Osaka choosing to electrify in the West with a 60HZ AC system built with GE designs and equipment. Thus, there are two grids in Japan that are supplied with power by 10 different vertically integrated electric utilities in addition to many independent generating businesses. Without getting too far into physics, it suffices to say that with the two different grids operating at different frequencies, exchanging power is not an easy task. Think of the differences between the Western grid (60HZ) as being “English” and the Eastern grid (50Hz) being “Metric.” As Metric and English nuts and bolts cannot be intermixed, so too 50Hz and 60Hz electricity – at grid scale – cannot be mixed. Figure 5 illustrates graphically the segmentation of Japan’s power grid: the red-lined grid is the Eastern (50Hz) grid and the blue-lined grid is the Western (60Hz) grid. Figure 5: Segmentation of Japan’s Power Grid
Source: Wikipedia, Creative Commons – Tosaka et al (http://en.wikipedia.org/wiki/File:Power_Grid_of_Japan.PNG). Because of the existence of the two different grid frequencies, power cannot be easily exchanged between regions. Three special substations exist that are capable of converting frequencies necessary for power flow between grids. These “frequency conversion” stations have an aggregate capacity to pass 1.2 GW, a rather small amount considering
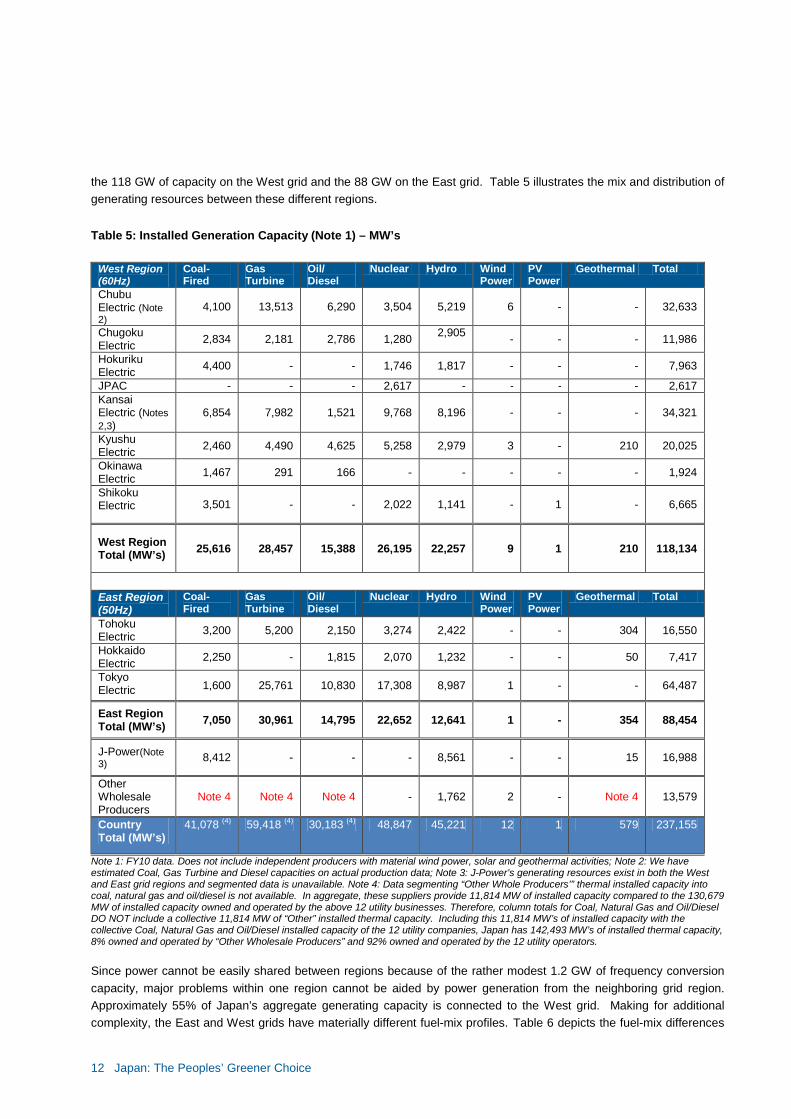
12 Japan: The Peoples’ Greener Choice
the 118 GW of capacity on the West grid and the 88 GW on the East grid. Table 5 illustrates the mix and distribution of generating resources between these different regions.
Table 5: Installed Generation Capacity (Note 1) – MW’s
West Region (60Hz)
Coal-Fired
Gas Turbine
Oil/ Diesel
Nuclear Hydro Wind Power
PV Power
Geothermal Total
Chubu Electric (Note 2)
4,100 13,513 6,290 3,504 5,219 6 - - 32,633
Chugoku Electric 2,834 2,181 2,786 1,280 2,905
- - - 11,986
Hokuriku Electric 4,400 - - 1,746 1,817 - - - 7,963
JPAC - - - 2,617 - - - - 2,617 Kansai Electric (Notes 2,3)
6,854 7,982 1,521 9,768 8,196 - - - 34,321
Kyushu Electric 2,460 4,490 4,625 5,258 2,979 3 - 210 20,025
Okinawa Electric 1,467 291 166 - - - - - 1,924
Shikoku Electric 3,501 - - 2,022 1,141 - 1 - 6,665
West Region Total (MW’s) 25,616 28,457 15,388 26,195 22,257 9 1 210 118,134
East Region (50Hz)
Coal-Fired
Gas Turbine
Oil/ Diesel
Nuclear Hydro Wind Power
PV Power
Geothermal Total
Tohoku Electric 3,200 5,200 2,150 3,274 2,422 - - 304 16,550
Hokkaido Electric 2,250 - 1,815 2,070 1,232 - - 50 7,417
Tokyo Electric 1,600 25,761 10,830 17,308 8,987 1 - - 64,487
East Region Total (MW’s) 7,050 30,961 14,795 22,652 12,641 1 - 354 88,454
J-Power(Note 3) 8,412 - - - 8,561 - - 15 16,988
Other Wholesale Producers
Note 4 Note 4 Note 4 - 1,762 2 - Note 4 13,579
Country Total (MW’s)
41,078 (4) 59,418 (4) 30,183 (4) 48,847 45,221 12 1 579 237,155
Note 1: FY10 data. Does not include independent producers with material wind power, solar and geothermal activities; Note 2: We have estimated Coal, Gas Turbine and Diesel capacities on actual production data; Note 3: J-Power’s generating resources exist in both the West and East grid regions and segmented data is unavailable. Note 4: Data segmenting “Other Whole Producers’” thermal installed capacity into coal, natural gas and oil/diesel is not available. In aggregate, these suppliers provide 11,814 MW of installed capacity compared to the 130,679 MW of installed capacity owned and operated by the above 12 utility businesses. Therefore, column totals for Coal, Natural Gas and Oil/Diesel DO NOT include a collective 11,814 MW of “Other” installed thermal capacity. Including this 11,814 MW’s of installed capacity with the collective Coal, Natural Gas and Oil/Diesel installed capacity of the 12 utility companies, Japan has 142,493 MW’s of installed thermal capacity, 8% owned and operated by “Other Wholesale Producers” and 92% owned and operated by the 12 utility operators.
Since power cannot be easily shared between regions because of the rather modest 1.2 GW of frequency conversion capacity, major problems within one region cannot be aided by power generation from the neighboring grid region. Approximately 55% of Japan’s aggregate generating capacity is connected to the West grid. Making for additional complexity, the East and West grids have materially different fuel-mix profiles. Table 6 depicts the fuel-mix differences
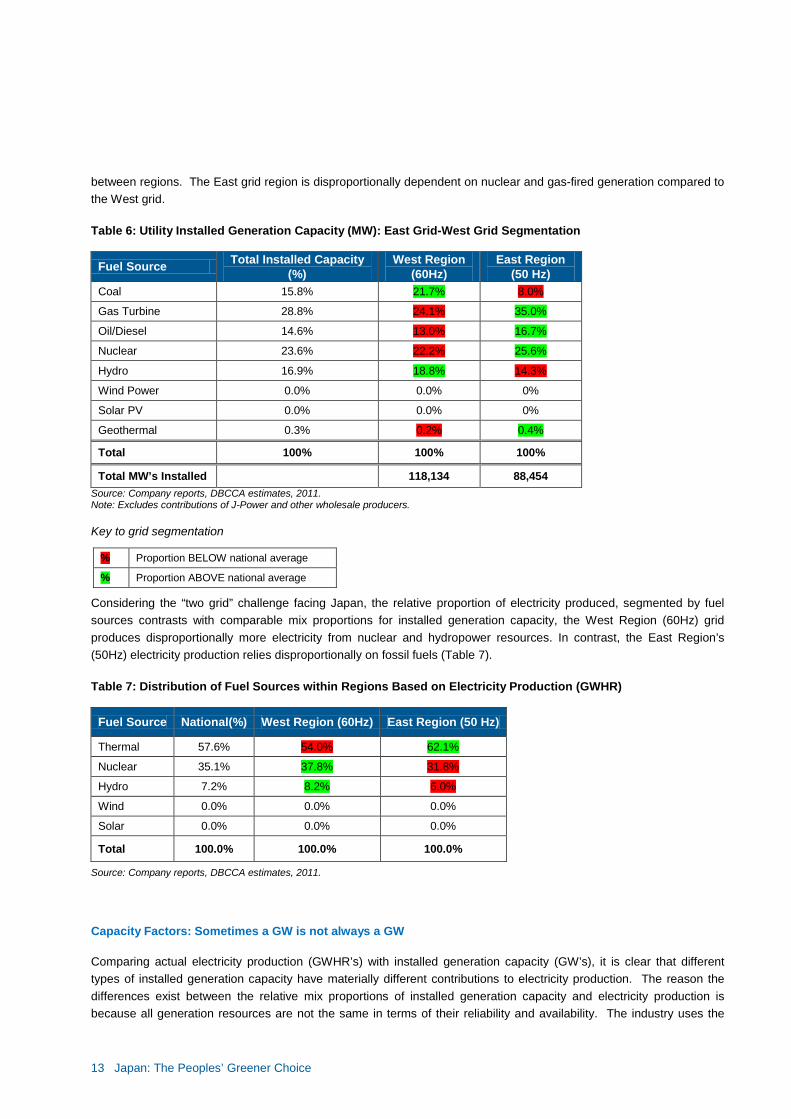
13 Japan: The Peoples’ Greener Choice
between regions. The East grid region is disproportionally dependent on nuclear and gas-fired generation compared to the West grid. Table 6: Utility Installed Generation Capacity (MW): East Grid-West Grid Segmentation
Fuel Source Total Installed Capacity (%)
West Region (60Hz)
East Region (50 Hz)
Coal 15.8% 21.7% 8.0%
Gas Turbine 28.8% 24.1% 35.0%
Oil/Diesel 14.6% 13.0% 16.7%
Nuclear 23.6% 22.2% 25.6%
Hydro 16.9% 18.8% 14.3%
Wind Power 0.0% 0.0% 0%
Solar PV 0.0% 0.0% 0%
Geothermal 0.3% 0.2% 0.4%
Total 100% 100% 100%
Total MW’s Installed 118,134 88,454 Source: Company reports, DBCCA estimates, 2011. Note: Excludes contributions of J-Power and other wholesale producers. Key to grid segmentation
Considering the “two grid” challenge facing Japan, the relative proportion of electricity produced, segmented by fuel sources contrasts with comparable mix proportions for installed generation capacity, the West Region (60Hz) grid produces disproportionally more electricity from nuclear and hydropower resources. In contrast, the East Region’s (50Hz) electricity production relies disproportionally on fossil fuels (Table 7). Table 7: Distribution of Fuel Sources within Regions Based on Electricity Production (GWHR)
Fuel Source National(%) West Region (60Hz) East Region (50 Hz)
Thermal 57.6% 54.0% 62.1%
Nuclear 35.1% 37.8% 31.8%
Hydro 7.2% 8.2% 6.0%
Wind 0.0% 0.0% 0.0%
Solar 0.0% 0.0% 0.0%
Total 100.0% 100.0% 100.0%
Source: Company reports, DBCCA estimates, 2011.
Capacity Factors: Sometimes a GW is not always a GW Comparing actual electricity production (GWHR’s) with installed generation capacity (GW’s), it is clear that different types of installed generation capacity have materially different contributions to electricity production. The reason the differences exist between the relative mix proportions of installed generation capacity and electricity production is because all generation resources are not the same in terms of their reliability and availability. The industry uses the
% Proportion BELOW national average
% Proportion ABOVE national average
14 Japan: The Peoples’ Greener Choice
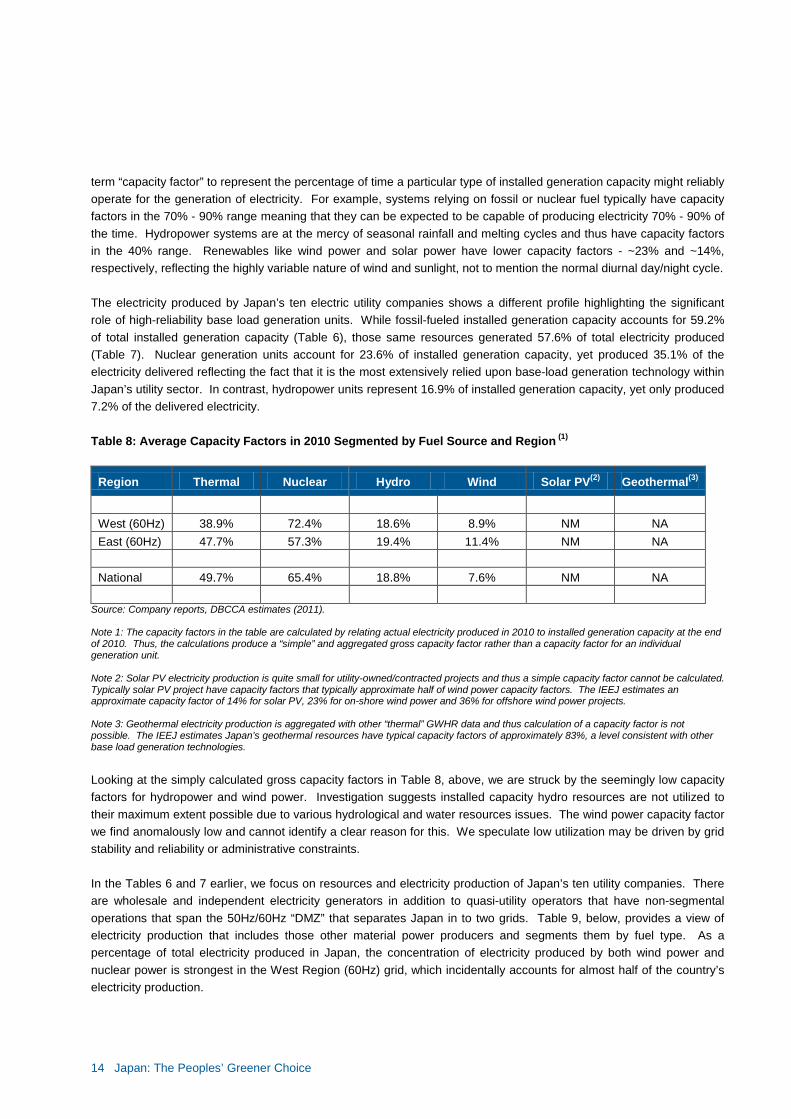
term “capacity factor” to represent the percentage of time a particular type of installed generation capacity might reliably operate for the generation of electricity. For example, systems relying on fossil or nuclear fuel typically have capacity factors in the 70% - 90% range meaning that they can be expected to be capable of producing electricity 70% - 90% of the time. Hydropower systems are at the mercy of seasonal rainfall and melting cycles and thus have capacity factors in the 40% range. Renewables like wind power and solar power have lower capacity factors - ~23% and ~14%, respectively, reflecting the highly variable nature of wind and sunlight, not to mention the normal diurnal day/night cycle. The electricity produced by Japan’s ten electric utility companies shows a different profile highlighting the significant role of high-reliability base load generation units. While fossil-fueled installed generation capacity accounts for 59.2% of total installed generation capacity (Table 6), those same resources generated 57.6% of total electricity produced (Table 7). Nuclear generation units account for 23.6% of installed generation capacity, yet produced 35.1% of the electricity delivered reflecting the fact that it is the most extensively relied upon base-load generation technology within Japan’s utility sector. In contrast, hydropower units represent 16.9% of installed generation capacity, yet only produced 7.2% of the delivered electricity. Table 8: Average Capacity Factors in 2010 Segmented by Fuel Source and Region (1)
Region Thermal Nuclear Hydro Wind Solar PV(2) Geothermal(3)
West (60Hz) 38.9% 72.4% 18.6% 8.9% NM NA East (60Hz) 47.7% 57.3% 19.4% 11.4% NM NA National 49.7% 65.4% 18.8% 7.6% NM NA
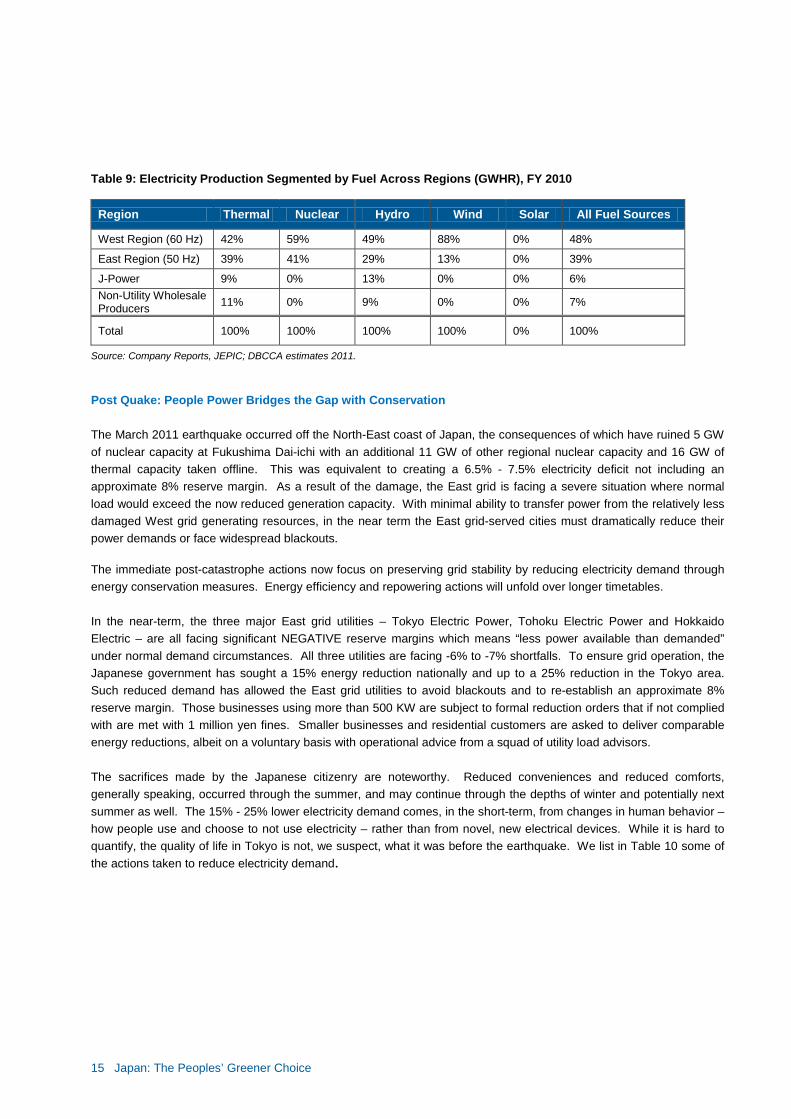
Source: Company reports, DBCCA estimates (2011). Note 1: The capacity factors in the table are calculated by relating actual electricity produced in 2010 to installed generation capacity at the end of 2010. Thus, the calculations produce a “simple” and aggregated gross capacity factor rather than a capacity factor for an individual generation unit. Note 2: Solar PV electricity production is quite small for utility-owned/contracted projects and thus a simple capacity factor cannot be calculated. Typically solar PV project have capacity factors that typically approximate half of wind power capacity factors. The IEEJ estimates an approximate capacity factor of 14% for solar PV, 23% for on-shore wind power and 36% for offshore wind power projects. Note 3: Geothermal electricity production is aggregated with other “thermal” GWHR data and thus calculation of a capacity factor is not possible. The IEEJ estimates Japan’s geothermal resources have typical capacity factors of approximately 83%, a level consistent with other base load generation technologies. Looking at the simply calculated gross capacity factors in Table 8, above, we are struck by the seemingly low capacity factors for hydropower and wind power. Investigation suggests installed capacity hydro resources are not utilized to their maximum extent possible due to various hydrological and water resources issues. The wind power capacity factor we find anomalously low and cannot identify a clear reason for this. We speculate low utilization may be driven by grid stability and reliability or administrative constraints. In the Tables 6 and 7 earlier, we focus on resources and electricity production of Japan’s ten utility companies. There are wholesale and independent electricity generators in addition to quasi-utility operators that have non-segmental operations that span the 50Hz/60Hz “DMZ” that separates Japan in to two grids. Table 9, below, provides a view of electricity production that includes those other material power producers and segments them by fuel type. As a percentage of total electricity produced in Japan, the concentration of electricity produced by both wind power and nuclear power is strongest in the West Region (60Hz) grid, which incidentally accounts for almost half of the country’s electricity production.
15 Japan: The Peoples’ Greener Choice
Table 9: Electricity Production Segmented by Fuel Across Regions (GWHR), FY 2010
Region Thermal Nuclear Hydro Wind Solar All Fuel Sources
West Region (60 Hz) 42% 59% 49% 88% 0% 48%
East Region (50 Hz) 39% 41% 29% 13% 0% 39%
J-Power 9% 0% 13% 0% 0% 6% Non-Utility Wholesale Producers 11% 0% 9% 0% 0% 7%
Total 100% 100% 100% 100% 0% 100%
Source: Company Reports, JEPIC; DBCCA estimates 2011. Post Quake: People Power Bridges the Gap with Conservation The March 2011 earthquake occurred off the North-East coast of Japan, the consequences of which have ruined 5 GW of nuclear capacity at Fukushima Dai-ichi with an additional 11 GW of other regional nuclear capacity and 16 GW of thermal capacity taken offline. This was equivalent to creating a 6.5% - 7.5% electricity deficit not including an approximate 8% reserve margin. As a result of the damage, the East grid is facing a severe situation where normal load would exceed the now reduced generation capacity. With minimal ability to transfer power from the relatively less damaged West grid generating resources, in the near term the East grid-served cities must dramatically reduce their power demands or face widespread blackouts. The immediate post-catastrophe actions now focus on preserving grid stability by reducing electricity demand through energy conservation measures. Energy efficiency and repowering actions will unfold over longer timetables. In the near-term, the three major East grid utilities – Tokyo Electric Power, Tohoku Electric Power and Hokkaido Electric – are all facing significant NEGATIVE reserve margins which means “less power available than demanded” under normal demand circumstances. All three utilities are facing -6% to -7% shortfalls. To ensure grid operation, the Japanese government has sought a 15% energy reduction nationally and up to a 25% reduction in the Tokyo area. Such reduced demand has allowed the East grid utilities to avoid blackouts and to re-establish an approximate 8% reserve margin. Those businesses using more than 500 KW are subject to formal reduction orders that if not complied with are met with 1 million yen fines. Smaller businesses and residential customers are asked to deliver comparable energy reductions, albeit on a voluntary basis with operational advice from a squad of utility load advisors. The sacrifices made by the Japanese citizenry are noteworthy. Reduced conveniences and reduced comforts, generally speaking, occurred through the summer, and may continue through the depths of winter and potentially next summer as well. The 15% - 25% lower electricity demand comes, in the short-term, from changes in human behavior – how people use and choose to not use electricity – rather than from novel, new electrical devices. While it is hard to quantify, the quality of life in Tokyo is not, we suspect, what it was before the earthquake. We list in Table 10 some of the actions taken to reduce electricity demand.
16 Japan: The Peoples’ Greener Choice
Table 10: Energy Savings Actions Being Practiced
Behavioral Changes
• Increase office temperatures to 28°C-30°C (82°F-84°F ) • Reduce office and home air-conditioning usage • Reduce lighting – home and office • Reduce elevator and escalator operation • Reduce automatic door operation • Reduce public space cooling and lighting • Disconnect A/V equipment; disable standby power • Shift work schedules intraday (4AM factory starts) • Shift workdays intraweek (Saturday factory operation) • Run computers on battery power during peak load periods • Relocate server farms or shift server processing to other regions • Limit printer and copy machine operation in offices • Home washing and cleaning at night time • Turn off electric toilet seat features • Relaxed dress code • Mandatory holidays during high-load periods • Large businesses provide surplus self-generated power to the local utility when possible
Source: Various Japan Government bulletins, documents, utility advisories and DBCCA estimates, 2011.
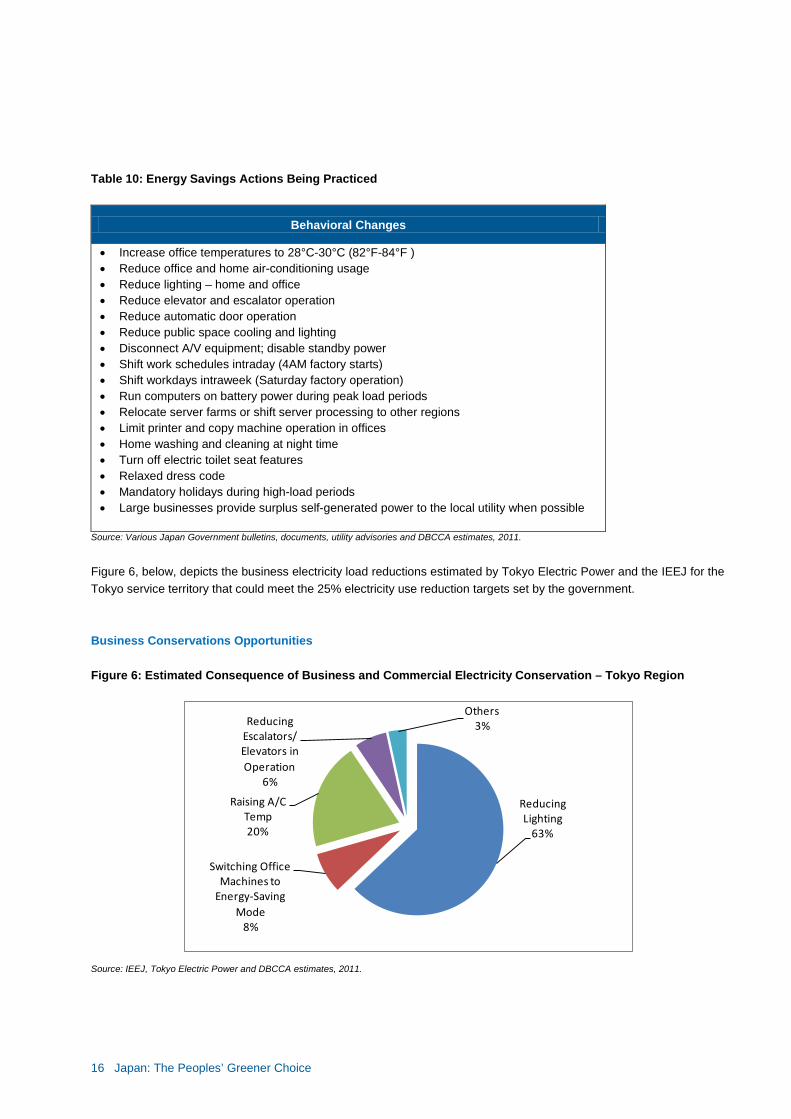
Figure 6, below, depicts the business electricity load reductions estimated by Tokyo Electric Power and the IEEJ for the Tokyo service territory that could meet the 25% electricity use reduction targets set by the government. Business Conservations Opportunities Figure 6: Estimated Consequence of Business and Commercial Electricity Conservation – Tokyo Region
Source: IEEJ, Tokyo Electric Power and DBCCA estimates, 2011.
Reducing Lighting
63%
Switching Office Machines to
Energy-Saving Mode
8%
Raising A/C Temp20%
Reducing Escalators/Elevators in Operation
6%
Others3%
17 Japan: The Peoples’ Greener Choice
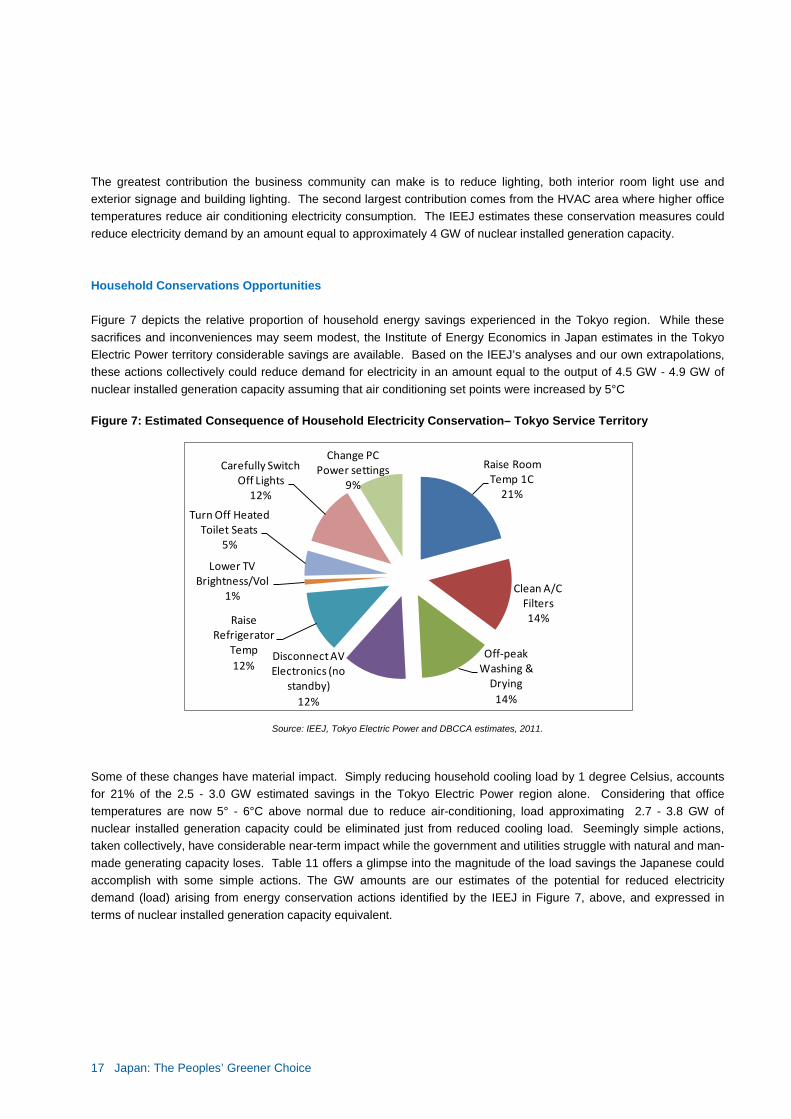
The greatest contribution the business community can make is to reduce lighting, both interior room light use and exterior signage and building lighting. The second largest contribution comes from the HVAC area where higher office temperatures reduce air conditioning electricity consumption. The IEEJ estimates these conservation measures could reduce electricity demand by an amount equal to approximately 4 GW of nuclear installed generation capacity. Household Conservations Opportunities Figure 7 depicts the relative proportion of household energy savings experienced in the Tokyo region. While these sacrifices and inconveniences may seem modest, the Institute of Energy Economics in Japan estimates in the Tokyo Electric Power territory considerable savings are available. Based on the IEEJ’s analyses and our own extrapolations, these actions collectively could reduce demand for electricity in an amount equal to the output of 4.5 GW - 4.9 GW of nuclear installed generation capacity assuming that air conditioning set points were increased by 5°C Figure 7: Estimated Consequence of Household Electricity Conservation– Tokyo Service Territory
Source: IEEJ, Tokyo Electric Power and DBCCA estimates, 2011.
Some of these changes have material impact. Simply reducing household cooling load by 1 degree Celsius, accounts for 21% of the 2.5 - 3.0 GW estimated savings in the Tokyo Electric Power region alone. Considering that office temperatures are now 5° - 6°C above normal due to reduce air-conditioning, load approximating 2.7 - 3.8 GW of nuclear installed generation capacity could be eliminated just from reduced cooling load. Seemingly simple actions, taken collectively, have considerable near-term impact while the government and utilities struggle with natural and man-made generating capacity loses. Table 11 offers a glimpse into the magnitude of the load savings the Japanese could accomplish with some simple actions. The GW amounts are our estimates of the potential for reduced electricity demand (load) arising from energy conservation actions identified by the IEEJ in Figure 7, above, and expressed in terms of nuclear installed generation capacity equivalent.
Raise Room Temp 1C
21%
Clean A/C Filters14%
Off-peak Washing &
Drying14%
Disconnect AV Electronics (no
standby)12%
Raise Refrigerator
Temp12%
Lower TV Brightness/Vol
1%
Turn Off Heated Toilet Seats
5%
Carefully Switch Off Lights
12%
Change PC Power settings
9%
18 Japan: The Peoples’ Greener Choice
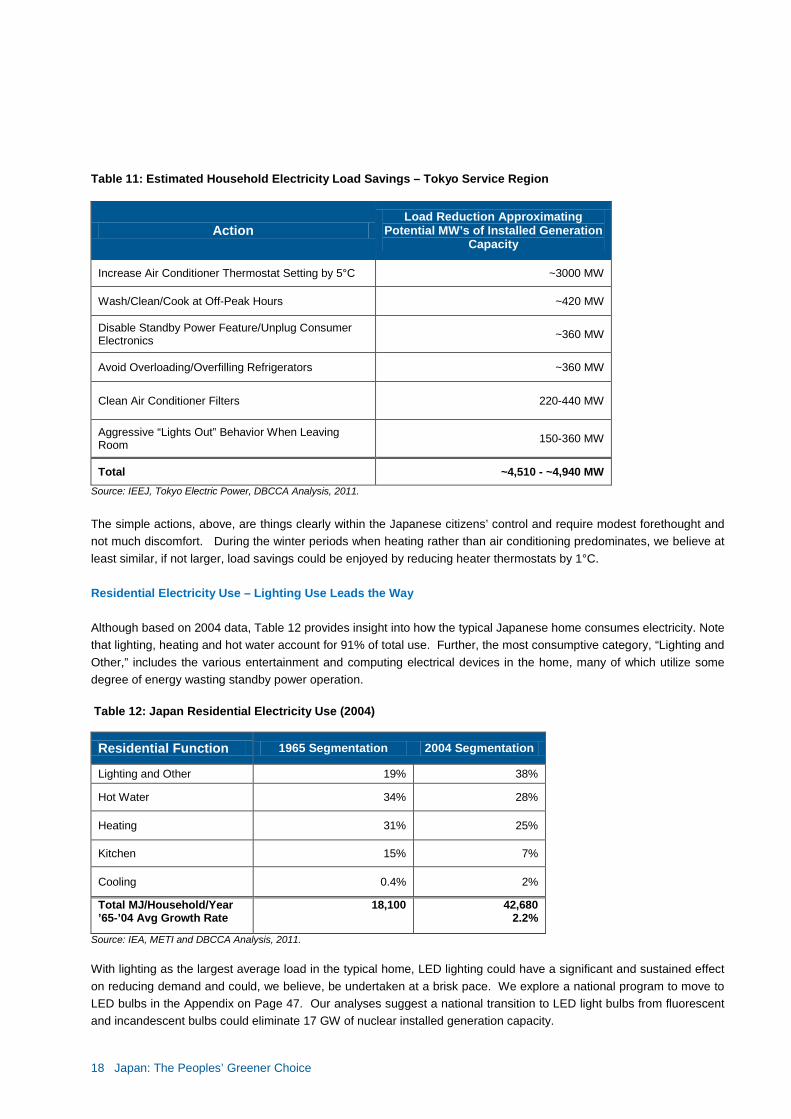
Table 11: Estimated Household Electricity Load Savings – Tokyo Service Region
Action Load Reduction Approximating
Potential MW’s of Installed Generation Capacity
Increase Air Conditioner Thermostat Setting by 5°C ~3000 MW
Wash/Clean/Cook at Off-Peak Hours ~420 MW
Disable Standby Power Feature/Unplug Consumer Electronics ~360 MW
Avoid Overloading/Overfilling Refrigerators ~360 MW
Clean Air Conditioner Filters 220-440 MW
Aggressive “Lights Out” Behavior When Leaving Room 150-360 MW
Total ~4,510 - ~4,940 MW Source: IEEJ, Tokyo Electric Power, DBCCA Analysis, 2011. The simple actions, above, are things clearly within the Japanese citizens’ control and require modest forethought and not much discomfort. During the winter periods when heating rather than air conditioning predominates, we believe at least similar, if not larger, load savings could be enjoyed by reducing heater thermostats by 1°C. Residential Electricity Use – Lighting Use Leads the Way Although based on 2004 data, Table 12 provides insight into how the typical Japanese home consumes electricity. Note that lighting, heating and hot water account for 91% of total use. Further, the most consumptive category, “Lighting and Other,” includes the various entertainment and computing electrical devices in the home, many of which utilize some degree of energy wasting standby power operation. Table 12: Japan Residential Electricity Use (2004)
Residential Function 1965 Segmentation 2004 Segmentation
Lighting and Other 19% 38%
Hot Water 34% 28%
Heating 31% 25%
Kitchen 15% 7%
Cooling 0.4% 2%
Total MJ/Household/Year ’65-’04 Avg Growth Rate
18,100 42,680 2.2%
Source: IEA, METI and DBCCA Analysis, 2011. With lighting as the largest average load in the typical home, LED lighting could have a significant and sustained effect on reducing demand and could, we believe, be undertaken at a brisk pace. We explore a national program to move to LED bulbs in the Appendix on Page 47. Our analyses suggest a national transition to LED light bulbs from fluorescent and incandescent bulbs could eliminate 17 GW of nuclear installed generation capacity.
19 Japan: The Peoples’ Greener Choice
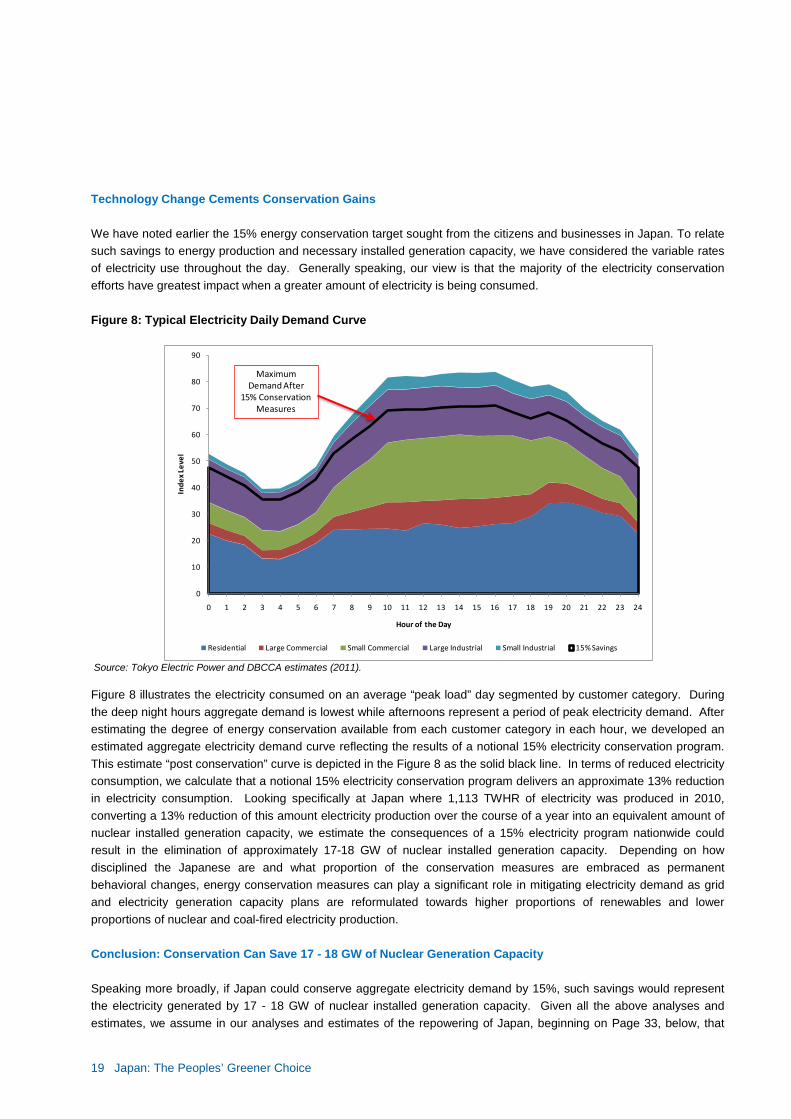
Technology Change Cements Conservation Gains We have noted earlier the 15% energy conservation target sought from the citizens and businesses in Japan. To relate such savings to energy production and necessary installed generation capacity, we have considered the variable rates of electricity use throughout the day. Generally speaking, our view is that the majority of the electricity conservation efforts have greatest impact when a greater amount of electricity is being consumed. Figure 8: Typical Electricity Daily Demand Curve
Source: Tokyo Electric Power and DBCCA estimates (2011). Figure 8 illustrates the electricity consumed on an average “peak load” day segmented by customer category. During the deep night hours aggregate demand is lowest while afternoons represent a period of peak electricity demand. After estimating the degree of energy conservation available from each customer category in each hour, we developed an estimated aggregate electricity demand curve reflecting the results of a notional 15% electricity conservation program. This estimate “post conservation” curve is depicted in the Figure 8 as the solid black line. In terms of reduced electricity consumption, we calculate that a notional 15% electricity conservation program delivers an approximate 13% reduction in electricity consumption. Looking specifically at Japan where 1,113 TWHR of electricity was produced in 2010, converting a 13% reduction of this amount electricity production over the course of a year into an equivalent amount of nuclear installed generation capacity, we estimate the consequences of a 15% electricity program nationwide could result in the elimination of approximately 17-18 GW of nuclear installed generation capacity. Depending on how disciplined the Japanese are and what proportion of the conservation measures are embraced as permanent behavioral changes, energy conservation measures can play a significant role in mitigating electricity demand as grid and electricity generation capacity plans are reformulated towards higher proportions of renewables and lower proportions of nuclear and coal-fired electricity production. Conclusion: Conservation Can Save 17 - 18 GW of Nuclear Generation Capacity Speaking more broadly, if Japan could conserve aggregate electricity demand by 15%, such savings would represent the electricity generated by 17 - 18 GW of nuclear installed generation capacity. Given all the above analyses and estimates, we assume in our analyses and estimates of the repowering of Japan, beginning on Page 33, below, that
0
10
20
30
40
50
60
70
80
90
0 1 2 3 4 5 6 7 8 9 10 11 12 13 14 15 16 17 18 19 20 21 22 23 24
Inde
x Le
vel
Hour of the Day
Residential Large Commercial Small Commercial Large Industrial Small Industrial 15% Savings
MaximumDemand After
15% ConservationMeasures
20 Japan: The Peoples’ Greener Choice
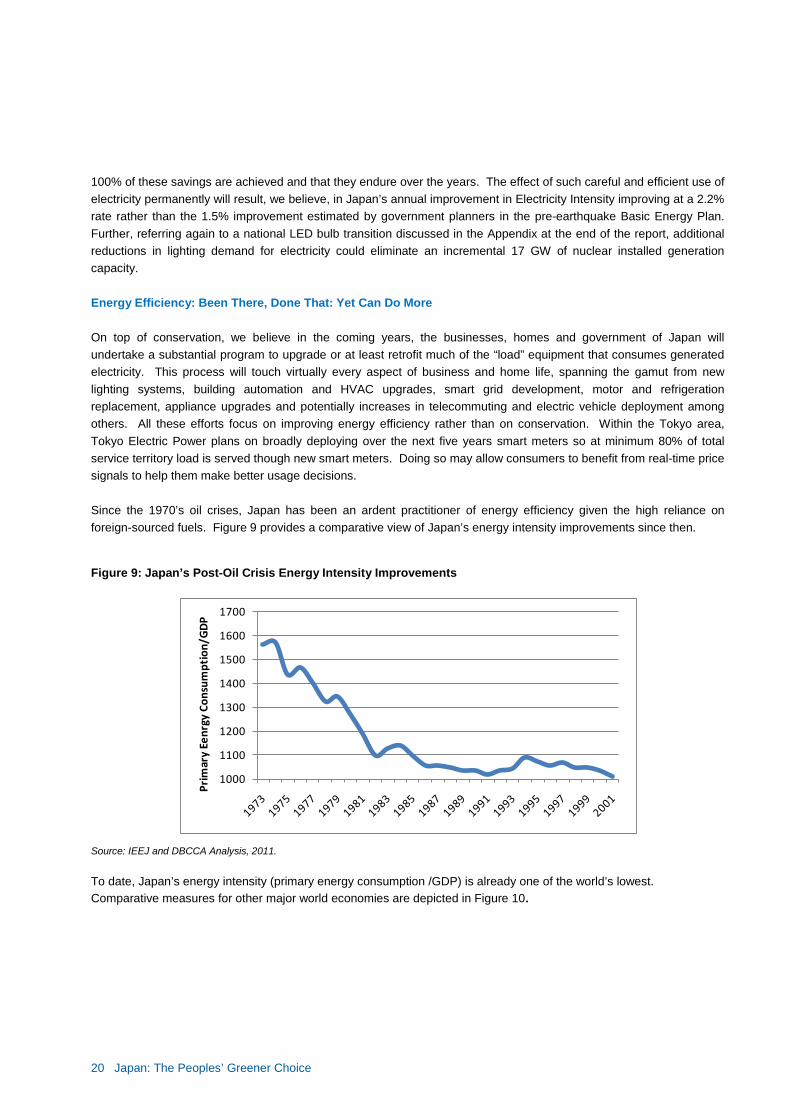
100% of these savings are achieved and that they endure over the years. The effect of such careful and efficient use of electricity permanently will result, we believe, in Japan’s annual improvement in Electricity Intensity improving at a 2.2% rate rather than the 1.5% improvement estimated by government planners in the pre-earthquake Basic Energy Plan. Further, referring again to a national LED bulb transition discussed in the Appendix at the end of the report, additional reductions in lighting demand for electricity could eliminate an incremental 17 GW of nuclear installed generation capacity. Energy Efficiency: Been There, Done That: Yet Can Do More On top of conservation, we believe in the coming years, the businesses, homes and government of Japan will undertake a substantial program to upgrade or at least retrofit much of the “load” equipment that consumes generated electricity. This process will touch virtually every aspect of business and home life, spanning the gamut from new lighting systems, building automation and HVAC upgrades, smart grid development, motor and refrigeration replacement, appliance upgrades and potentially increases in telecommuting and electric vehicle deployment among others. All these efforts focus on improving energy efficiency rather than on conservation. Within the Tokyo area, Tokyo Electric Power plans on broadly deploying over the next five years smart meters so at minimum 80% of total service territory load is served though new smart meters. Doing so may allow consumers to benefit from real-time price signals to help them make better usage decisions. Since the 1970’s oil crises, Japan has been an ardent practitioner of energy efficiency given the high reliance on foreign-sourced fuels. Figure 9 provides a comparative view of Japan’s energy intensity improvements since then. Figure 9: Japan’s Post-Oil Crisis Energy Intensity Improvements
Source: IEEJ and DBCCA Analysis, 2011. To date, Japan’s energy intensity (primary energy consumption /GDP) is already one of the world’s lowest. Comparative measures for other major world economies are depicted in Figure 10.
1000
1100
1200
1300
1400
1500
1600
1700
Prim
ary
Eenr
gy C
onsu
mpt
ion/
GD
P
21 Japan: The Peoples’ Greener Choice
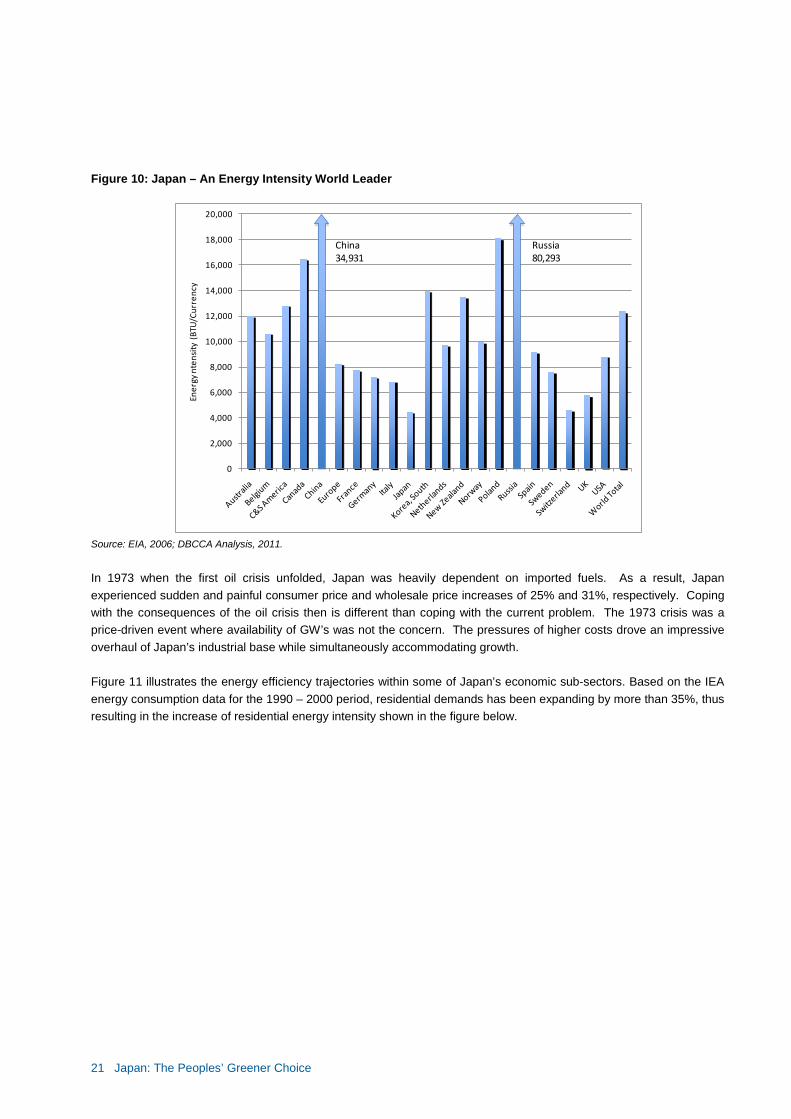
Figure 10: Japan – An Energy Intensity World Leader
Source: EIA, 2006; DBCCA Analysis, 2011.
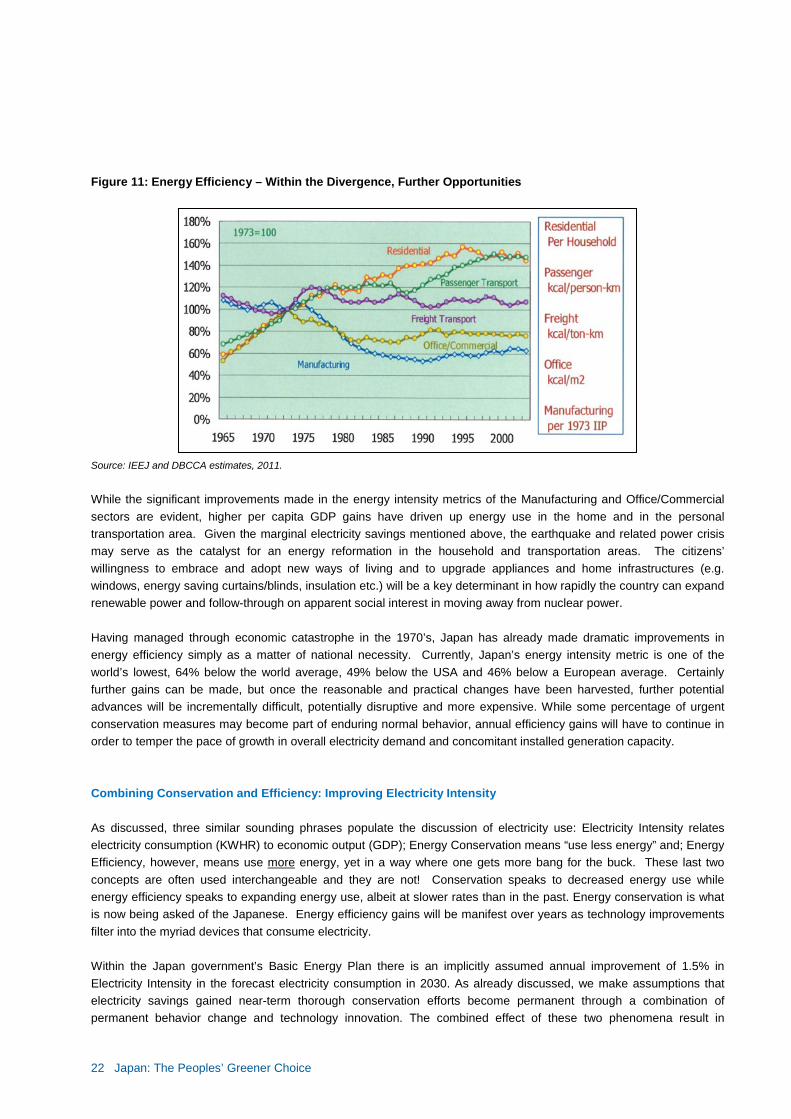
In 1973 when the first oil crisis unfolded, Japan was heavily dependent on imported fuels. As a result, Japan experienced sudden and painful consumer price and wholesale price increases of 25% and 31%, respectively. Coping with the consequences of the oil crisis then is different than coping with the current problem. The 1973 crisis was a price-driven event where availability of GW’s was not the concern. The pressures of higher costs drove an impressive overhaul of Japan’s industrial base while simultaneously accommodating growth. Figure 11 illustrates the energy efficiency trajectories within some of Japan’s economic sub-sectors. Based on the IEA energy consumption data for the 1990 – 2000 period, residential demands has been expanding by more than 35%, thus resulting in the increase of residential energy intensity shown in the figure below.
0
2,000
4,000
6,000
8,000
10,000
12,000
14,000
16,000
18,000
20,000
Ener
gy n
tens
ity (
BTU
/Cur
renc
y
China34,931
Russia80,293
22 Japan: The Peoples’ Greener Choice
Figure 11: Energy Efficiency – Within the Divergence, Further Opportunities
Source: IEEJ and DBCCA estimates, 2011.
While the significant improvements made in the energy intensity metrics of the Manufacturing and Office/Commercial sectors are evident, higher per capita GDP gains have driven up energy use in the home and in the personal transportation area. Given the marginal electricity savings mentioned above, the earthquake and related power crisis may serve as the catalyst for an energy reformation in the household and transportation areas. The citizens’ willingness to embrace and adopt new ways of living and to upgrade appliances and home infrastructures (e.g. windows, energy saving curtains/blinds, insulation etc.) will be a key determinant in how rapidly the country can expand renewable power and follow-through on apparent social interest in moving away from nuclear power. Having managed through economic catastrophe in the 1970’s, Japan has already made dramatic improvements in energy efficiency simply as a matter of national necessity. Currently, Japan’s energy intensity metric is one of the world’s lowest, 64% below the world average, 49% below the USA and 46% below a European average. Certainly further gains can be made, but once the reasonable and practical changes have been harvested, further potential advances will be incrementally difficult, potentially disruptive and more expensive. While some percentage of urgent conservation measures may become part of enduring normal behavior, annual efficiency gains will have to continue in order to temper the pace of growth in overall electricity demand and concomitant installed generation capacity. Combining Conservation and Efficiency: Improving Electricity Intensity As discussed, three similar sounding phrases populate the discussion of electricity use: Electricity Intensity relates electricity consumption (KWHR) to economic output (GDP); Energy Conservation means “use less energy” and; Energy Efficiency, however, means use more energy, yet in a way where one gets more bang for the buck. These last two concepts are often used interchangeable and they are not! Conservation speaks to decreased energy use while energy efficiency speaks to expanding energy use, albeit at slower rates than in the past. Energy conservation is what is now being asked of the Japanese. Energy efficiency gains will be manifest over years as technology improvements filter into the myriad devices that consume electricity. Within the Japan government’s Basic Energy Plan there is an implicitly assumed annual improvement of 1.5% in Electricity Intensity in the forecast electricity consumption in 2030. As already discussed, we make assumptions that electricity savings gained near-term thorough conservation efforts become permanent through a combination of permanent behavior change and technology innovation. The combined effect of these two phenomena result in
23 Japan: The Peoples’ Greener Choice
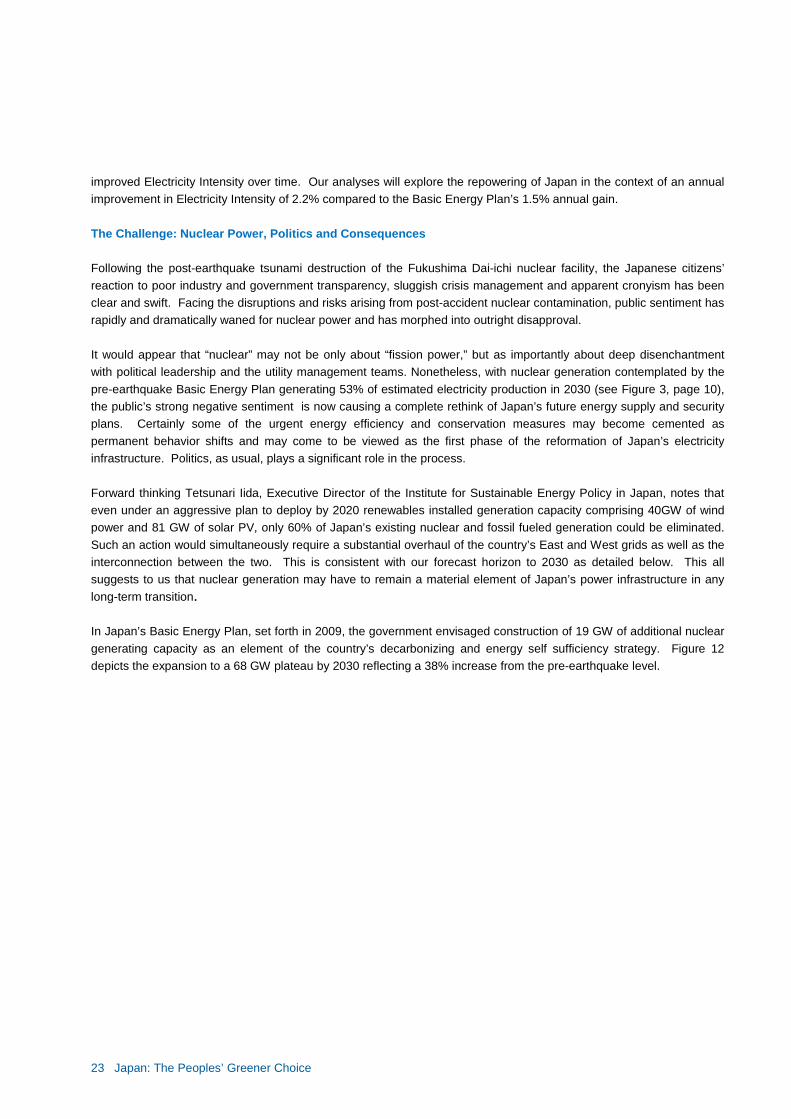
improved Electricity Intensity over time. Our analyses will explore the repowering of Japan in the context of an annual improvement in Electricity Intensity of 2.2% compared to the Basic Energy Plan’s 1.5% annual gain. The Challenge: Nuclear Power, Politics and Consequences Following the post-earthquake tsunami destruction of the Fukushima Dai-ichi nuclear facility, the Japanese citizens’ reaction to poor industry and government transparency, sluggish crisis management and apparent cronyism has been clear and swift. Facing the disruptions and risks arising from post-accident nuclear contamination, public sentiment has rapidly and dramatically waned for nuclear power and has morphed into outright disapproval. It would appear that “nuclear” may not be only about “fission power,” but as importantly about deep disenchantment with political leadership and the utility management teams. Nonetheless, with nuclear generation contemplated by the pre-earthquake Basic Energy Plan generating 53% of estimated electricity production in 2030 (see Figure 3, page 10), the public’s strong negative sentiment is now causing a complete rethink of Japan’s future energy supply and security plans. Certainly some of the urgent energy efficiency and conservation measures may become cemented as permanent behavior shifts and may come to be viewed as the first phase of the reformation of Japan’s electricity infrastructure. Politics, as usual, plays a significant role in the process. Forward thinking Tetsunari Iida, Executive Director of the Institute for Sustainable Energy Policy in Japan, notes that even under an aggressive plan to deploy by 2020 renewables installed generation capacity comprising 40GW of wind power and 81 GW of solar PV, only 60% of Japan’s existing nuclear and fossil fueled generation could be eliminated. Such an action would simultaneously require a substantial overhaul of the country’s East and West grids as well as the interconnection between the two. This is consistent with our forecast horizon to 2030 as detailed below. This all suggests to us that nuclear generation may have to remain a material element of Japan’s power infrastructure in any long-term transition. In Japan’s Basic Energy Plan, set forth in 2009, the government envisaged construction of 19 GW of additional nuclear generating capacity as an element of the country’s decarbonizing and energy self sufficiency strategy. Figure 12 depicts the expansion to a 68 GW plateau by 2030 reflecting a 38% increase from the pre-earthquake level.
24 Japan: The Peoples’ Greener Choice
Figure 12: Projected nuclear capacity under Japan’s “pre-earthquake” 2010 Long-Term Energy Plan (GW)
Source: METI, Bloomberg New Energy Finance and DBCCA estimates, 2011.
In May 2011, Japan’s then Prime Minister Kan, seeming to bow to public sentiment, announced plans to move Japan away from nuclear power – a remarkable statement indeed for a country with modest fossil-fuel resources. The now former Prime Minister announced then that Japan will cease constructing new plants and for those plants now shutdown for routine maintenance or quake repair, completion of a “stress test” would be required prior to restarting them. It remains unclear exactly what the utility operators are to do and how the government regulators and prefecture governors will assess those tests results and certify restarting the reactors. This new “stress test” requirement creates considerable uncertainty regarding Japan’s nuclear fleet trajectory because as plants enter their normal maintenance shutdown every 13 months, there is the clear prospect they may not be allowed to restart.
2.3
14.7
31.26
4549
6468
0
10
20
30
40
50
60
70
80
1970 1980 1990 2000 2010 2020(e) 2030 (e)
GW
's o
f Nuc
lear
Inst
alle
d C
apac
ity
Japan's Nuclear Installed CapacityHistorical and Forecast(1)
25 Japan: The Peoples’ Greener Choice
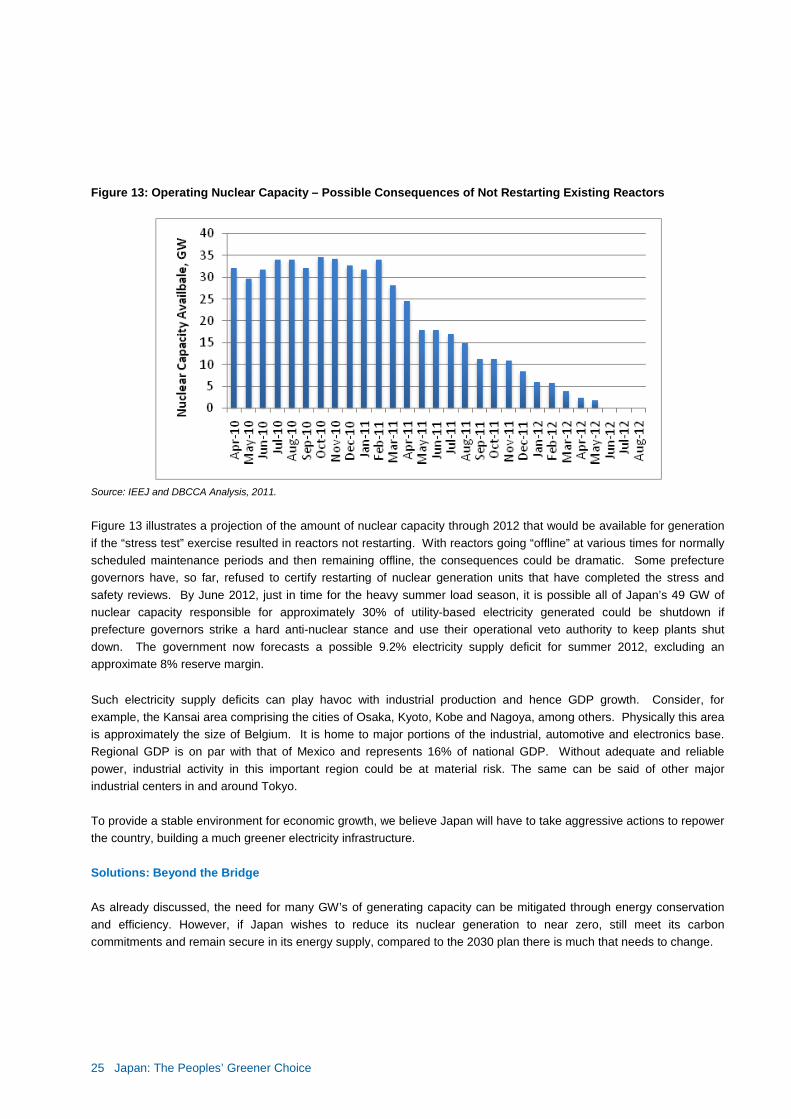
Figure 13: Operating Nuclear Capacity – Possible Consequences of Not Restarting Existing Reactors
Source: IEEJ and DBCCA Analysis, 2011.
Figure 13 illustrates a projection of the amount of nuclear capacity through 2012 that would be available for generation if the “stress test” exercise resulted in reactors not restarting. With reactors going “offline” at various times for normally scheduled maintenance periods and then remaining offline, the consequences could be dramatic. Some prefecture governors have, so far, refused to certify restarting of nuclear generation units that have completed the stress and safety reviews. By June 2012, just in time for the heavy summer load season, it is possible all of Japan’s 49 GW of nuclear capacity responsible for approximately 30% of utility-based electricity generated could be shutdown if prefecture governors strike a hard anti-nuclear stance and use their operational veto authority to keep plants shut down. The government now forecasts a possible 9.2% electricity supply deficit for summer 2012, excluding an approximate 8% reserve margin. Such electricity supply deficits can play havoc with industrial production and hence GDP growth. Consider, for example, the Kansai area comprising the cities of Osaka, Kyoto, Kobe and Nagoya, among others. Physically this area is approximately the size of Belgium. It is home to major portions of the industrial, automotive and electronics base. Regional GDP is on par with that of Mexico and represents 16% of national GDP. Without adequate and reliable power, industrial activity in this important region could be at material risk. The same can be said of other major industrial centers in and around Tokyo. To provide a stable environment for economic growth, we believe Japan will have to take aggressive actions to repower the country, building a much greener electricity infrastructure. Solutions: Beyond the Bridge As already discussed, the need for many GW’s of generating capacity can be mitigated through energy conservation and efficiency. However, if Japan wishes to reduce its nuclear generation to near zero, still meet its carbon commitments and remain secure in its energy supply, compared to the 2030 plan there is much that needs to change.
26 Japan: The Peoples’ Greener Choice
The Grid: Part of the Problem, Must be Part of the Solution In addition to wrestling with choosing new installed generation capacity, Japan will, we believe, also have to address serious operational bottlenecks within and between their two electricity grids. We have discussed earlier the historical reasons for the existence of two grids. As accelerated investment in renewables is considered, “fixing” the grid will be as important and simultaneously necessary a step as selecting the types of renewables generation. For example, achieving the pre-earthquake Basic Energy Plan initial 10% renewables goal alone would be a considerable task. Japanese grid expert Yasuhiro Hayashi, Director of the Research Institute of Advanced Network Technology, Waseda University and head of METI’s smart meter advisory panel, estimates that Japan’s current grid infrastructure can handle up to 10 GW of wind and solar PV installed generation capacity, so aiming for the government pre-earthquake Basic Energy Plan target of 120 GW of wind, solar, hydro and geothermal capacity by 2030 will likely require considerable grid investment. Grid experts acknowledge that in addition to building grid transmission capacity to support development of dispersed renewables, the intra-regional frequency conversion bottleneck must also be eliminated. Until Japan redrafts and adopts a new energy plan, no one knows for certain where to locate and how much frequency conversion capacity and new transmission capacity will be needed. Some grid experts suggest no more than 10 GW of conversion capacity, but this could be inadequate depending on the magnitude and location of renewables deployment. We would not be surprised if a higher proportion of renewables and reduced traditional base load (fossil and nuclear) would result in an even greater necessary investment in frequency conversion resources in order to ensure smooth grid operation. The cost of frequency conversion systems is not high, but the cost of transmission lines to knit together the West and East grids exceeds the cost of the conversion substations. Dr. Akihiko Yokoyama, Professor of Electrical Engineering in University of Tokyo’s Department of Advanced Energy believes a 1 GW frequency conversion site would cost between US$600 million and US$720 million, depending on technologies selected. The cost of transmission lines for such a station is estimated to be on the order of US$1.4 – US$2 billion. Construction time for such stations has typically taken 18 - 24 months. Mr. Kent Hora, Executive Vice President of Mitsubishi Electric Power Products believe projects could be completed in less than 12 months if the Japanese government was able to streamline the permitting and construction of additional transmission lines and frequency conversion stations with minimal public resistance. We believe any comprehensive repowering process will have to simultaneously address grid constraints and bottlenecks and thus transmission planning issues will be part of the balancing act between social interests, political possibilities and economic realities. Given the scope of the grid improvements and scale of expansion, we believe such efforts must take lead slightly or occur simultaneously with renewables deployment. Future Directions: Balancing Desires and Trade-offs Following the March earthquake and May announcements calling into question the future role of nuclear power in Japan, the pre-earthquake Basic Energy Plan now requires substantial revision. In parallel with developing a new energy plan, government and industry have been operating an informal phased triage response to the complex process of electricity management and planning. Phase I addresses the short-term period spanning 2011 - 2014, Phase II addresses the 2015 - 2020 period while the long-term Phase III plans for the period 2020 - 2050. Phase I is very much focused with immediate tactical actions needed to keep the engine of the economy running. Since power generation systems take years to build, the near-term actions mostly involve behavioral changes supplemented in later years by upgrading of less efficient appliances and industrial devices. Phase II can address renewables expansion, grid overhaul and what may become of nuclear while Phase III will address long-term energy planning. Against the backdrop of developing a new basic energy plan and triaged operational management of the
27 Japan: The Peoples’ Greener Choice
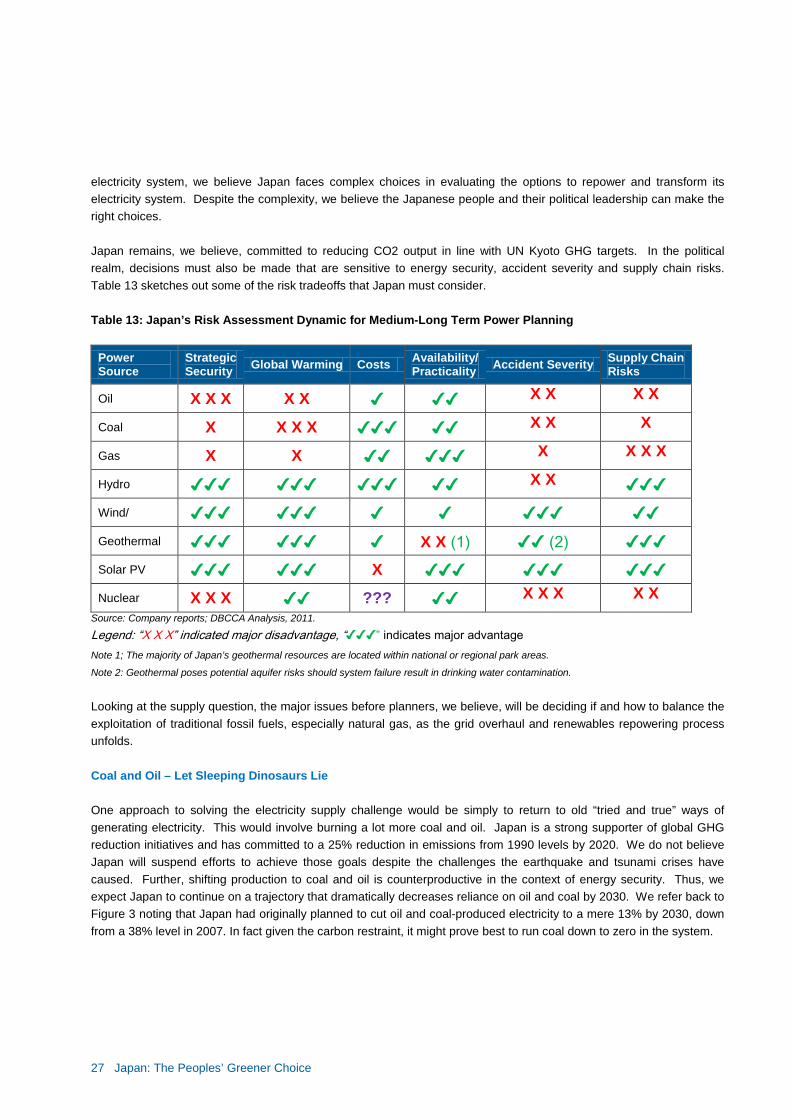
electricity system, we believe Japan faces complex choices in evaluating the options to repower and transform its electricity system. Despite the complexity, we believe the Japanese people and their political leadership can make the right choices. Japan remains, we believe, committed to reducing CO2 output in line with UN Kyoto GHG targets. In the political realm, decisions must also be made that are sensitive to energy security, accident severity and supply chain risks. Table 13 sketches out some of the risk tradeoffs that Japan must consider. Table 13: Japan’s Risk Assessment Dynamic for Medium-Long Term Power Planning
Power Source
Strategic Security Global Warming Costs Availability/
Practicality Accident Severity Supply Chain Risks
Oil X X X X X ✔ ✔✔ X X X X
Coal X X X X ✔✔✔ ✔✔ X X X
Gas X X ✔✔ ✔✔✔ X X X X
Hydro ✔✔✔ ✔✔✔ ✔✔✔ ✔✔ X X ✔✔✔ Wind/ ✔✔✔ ✔✔✔ ✔ ✔ ✔✔✔ ✔✔ Geothermal ✔✔✔ ✔✔✔ ✔ X X (1) ✔✔ (2) ✔✔✔ Solar PV ✔✔✔ ✔✔✔ X ✔✔✔ ✔✔✔ ✔✔✔ Nuclear X X X ✔✔ ??? ✔✔ X X X X X
Source: Company reports; DBCCA Analysis, 2011.
Legend: “X X X” indicated major disadvantage, “✔✔✔” indicates major advantage Note 1; The majority of Japan’s geothermal resources are located within national or regional park areas.
Note 2: Geothermal poses potential aquifer risks should system failure result in drinking water contamination.
Looking at the supply question, the major issues before planners, we believe, will be deciding if and how to balance the exploitation of traditional fossil fuels, especially natural gas, as the grid overhaul and renewables repowering process unfolds. Coal and Oil – Let Sleeping Dinosaurs Lie One approach to solving the electricity supply challenge would be simply to return to old “tried and true” ways of generating electricity. This would involve burning a lot more coal and oil. Japan is a strong supporter of global GHG reduction initiatives and has committed to a 25% reduction in emissions from 1990 levels by 2020. We do not believe Japan will suspend efforts to achieve those goals despite the challenges the earthquake and tsunami crises have caused. Further, shifting production to coal and oil is counterproductive in the context of energy security. Thus, we expect Japan to continue on a trajectory that dramatically decreases reliance on oil and coal by 2030. We refer back to Figure 3 noting that Japan had originally planned to cut oil and coal-produced electricity to a mere 13% by 2030, down from a 38% level in 2007. In fact given the carbon restraint, it might prove best to run coal down to zero in the system.
28 Japan: The Peoples’ Greener Choice
Natural Gas – Security and Long Term Carbon Constraints With natural gas in common use for electricity generation, increased use of natural gas might be one interim solution as increased renewables capacity is planned and as the pace and direction of nuclear power is decided. Using natural gas to fire boilers or turbines to generate electricity is a proven technology and one that, on the surface, can be rapidly expanded with modest physical footprints. GHG generation is less than half that of coal-fired electricity but still is not zero. Japan’s unique natural characteristics come into to play. Unlike the United States or Australia or Indonesia, Japan does not have material natural gas reserves. This certainly means material “foreign dependency” risk for Japan. There are also infrastructure implications. Natural gas never developed as a broadly in Japan as in the West as a fuel and is used more in the production of electricity and as an input into the chemical and other industrial sectors than for residential or small commercial heating applications. Thus, Japan’s natural gas pipeline and distribution networks are modest compared to those countries that use natural gas broadly across their economies. Looking then at the 2030 plan, replacing nuclear with gas is better than using coal, but still leaves a higher carbon footprint, discussed below, and may influence energy security risks. Therefore planners will need to balance these issues and we will address them in our outlook. The natural gas used in Japan arrives mostly by tanker in the form of liquefied natural gas (“LNG”), purchased from foreign countries including Indonesia, Malaysia, Australia and Qatar, among others. Japan is the largest consumer of LNG consuming ~65% of shipments into the Asia-Pacific region and ~ 35% of worldwide shipments. Once converted back into gas in “gasification plants” adjacent to the tanker ports, the gas is then piped to nearby power generation stations and industrial users. Dramatically increasing near and medium term reliance on natural gas comes with some financial, operational, supply chain and foreign dependency risks. Since the Fukushima Dai-ichi meltdown, increased LNG demand in Japan has caused a 50% increase in spot prices to the US$15/mmBTU level. More LNG?: US$115+ Billion For Starters and What May Be Needed As an illustration, should Japan choose to replace all 49 GW of current nuclear installed generation capacity with gas turbines relying on LNG, then the incremental demand in the global LNG market might approximate 35 - 36 million metric tons of LNG per year representing 16% of global LNG shipped in 2010. Such an increase in demand has consequences not only for onshore distribution pipelines, but also for the supply chain that would bring the LNG to Japan: (1) the liquefaction and loading terminals, (2) the LNG carriers and (3) the receiving terminals and re-gasifying systems.
• LNG Carriers – We Estimate Possible Incremental Need for 20 at US$4.4 Billion According to Lloyds Shipping Economist, the current global LNG fleet (as of July 2011) comprises 332 LNG carriers with aggregate capacity of 49 million metric tons. There are approximately 21 new carriers now on order with combined capacity of 3.6 million metric tons. A transition to natural gas for 49 GW of nuclear installed generation capacity appears to likely require substantial investment in the LNG supply chain. Given routine “round-trip voyage” and processing times, we estimate such a transition by Japan could require an additional 20 tankers of the new very large Q-Max design, each costing approximately US$220 million.
• Terminals – Liquefying and Degasifying at US$9 - 11 Billion
Cost for liquefaction and loading terminals are reported to approximate US$1.2 - US$2 billion for 8 - 8.5 million metric tons per year sites. On the receiving end, unloading and gasifying terminals are estimated to cost US$400 million for 3.7 million – 7.4 million metric tons of processing capacity.
29 Japan: The Peoples’ Greener Choice
• Pipelines – No Cost Estimate We are unable to estimate the incremental onshore pipeline costs to deliver an incremental 35 - 36 million metric tons of natural gas to gas turbine generators distributed around Japan.
• Generation Units – Preliminary Estimate of US$50 - 100 Billion Based on capital cost data from both the United States Energy Information Agency and Japan’s Institute for Energy Economics, advanced gas turbines are estimated to have a nominal capital cost of between US$1 - $2 million per MW (EIA/IEEJ, respectively). If an incremental 49 GW of natural gas turbines were needed, the costs could range between US$50 - $100 billion at a US$/¥ exchange rate of 77.
From a financial standpoint alone, a Japanese decision to speed deployment of 49 GW of natural gas-fired turbines would require an approximate investment of US$113 billion - US$115 billion to be made by the many supply chain participants over the course of several years. Lloyds Shipping Economist further noted that since the 2009 credit market crisis, the industry pace of capital additions has fallen behind and prospective Basel III bank requirements are expected to make the cost of future project financing more expensive. We cannot, however, estimate those cost increases. While natural gas may be logical option for Japan, the magnitude of a rapid and sizeable shift toward that fossil fuel appears to be neither a speedy, energy secure or “Capex-lite” option. An Immediate Fossil Fuel Response: Carbon Commitments - Brother Where Art Thou? If Japan chooses to focus on natural gas and coal-fired power to replace any forgone nuclear capacity, research by the Institute of Energy Economics suggests that Japan’s GHG emissions could rise between 23 million – 90 million metric tons per year depending on the fuel mix selected and the rapidity and degree of nuclear phase out. In 2012, cessation of all nuclear generation could have a substantial and potentially expensive impact on the economy despite energy conservation measures. Figure 14 illustrates the estimated 42% increase in fossil fuel requirements in 2012 necessary to replace Japan’s entire 49 GW of installed nuclear generation capacity were the entire fleet to be shut down by summer 2012. Figure 14: Fossil Fuel Requirements Spike 42% in 2012 on Full Nuclear Shutdown
Source: IEEJ, DBCCA Analysis, 2011.
60 66
1235
55
79
2010 2012
Mill
ions
of
Tons
, Oil
Equi
valn
et
Potential Fossil Fuel Requirements
Coal Oil LNG
127
180
30 Japan: The Peoples’ Greener Choice
As a result of this possible fuel mix shift, households could face electricity bills up to 18% higher in 2012, while businesses are estimated to face an approximate 36% increase if they did not alter their behavior and remain vigilant conservationists next summer. Overall, the aggregate effect of these higher prices is estimated by the Ministry of Economy, Trade and Industry to be a 0.2% - 0.25% drag on GDP and to drive a 0.7% increase in overall energy costs (~¥3 trillion annually). Coal appears readily available and logistics systems appear adequate to facilitate delivers yet are counterproductive from GHG emissions perspective. In the very short-term, natural gas, in particular LNG, may be more troublesome as tanker capacities and gasification plants may prove to be bottlenecks in the face of large and sudden demand increases. A sudden and substantial shift to either fuel source creates GHG generation problems for Japan vis a vis commitments made to reduce CO2 generation rates and shift energy security risks. Carbon capture and sequestration (“CCS”) technologies might be thought of as a way to deal with the higher GHG generation that would arise from suddenly replacing foregone nuclear generation with fossil fuel-fired power as renewables expansion and necessary grid overhaul programs unfold. In Japan’s case, not only is CCS impractical, it is also expensive. Japan’s geologic structure and frequency of tectonic activity make it an unsuitable place for deep well injection of CO2. Costs seem prohibitive as well, currently estimated by the government to be on the order of US$800 - US$1,000 per ton sequestered. Should Japan continue with plans to mothball the entire nuclear fleet and rely on fossil fuels in the short-term while renewables capacity is expanding, there seems to be a reasonable chance of higher electricity prices filtering through the entire domestic and export economy regardless of what replacement power sources – natural gas or renewables – are chosen. The country’s GHG commitments may be strained as well. Hence this should only be a short term option.
Japan Likely Greener with Greater Renewables Emphasis It appears to us that Japan is in a rather tight spot when one considers the political, energy, security and decarbonizing dynamics that must be faced simultaneously. Near-term, the citizens’ efforts to implement energy saving measures can reduce electricity demand and avert blackouts. Solutions beyond just conservation and efficiency will be necessary for a country where energy growth is a necessary element of macroeconomic expansion. The choice we see before the Japanese in the medium-term is whether to (1) make substantial investment in natural gas-fired electricity generation to replace rapidly decommissioned nuclear generation capacity while tacitly moving onto a trajectory that will result in breaking GHG reduction commitments or, (2) instead, while using some gas particularly to replace coal, tempering and slowing the phase-out of nuclear generation capacity while simultaneously embracing additional energy conservation and efficiency measures and accelerating grid overhaul and renewables expansion. In the medium term, we suspect as citizens balance energy conservation and energy efficiency practices, they will increasingly demand of their leaders an updated energy plan with even greater emphasis on a strategy that synthesizes the gains of conservation and efficiency initiatives with a increase in the future role of renewable power. Despite the loud public sentiment “against nuclear” and what we see as political theatrics, we believe that the only way for Japan to deliver on its GHG reduction commitments and not impair the economy is to substantially expand gas power, wind power, solar power and geothermal and hydro power while also stepping back from the brink and deciding to keep some portion of the nuclear fleet operational in a long-term transition. This may involve upgrades or accelerated shifts to safer nuclear reactor designs. Considering energy security, the benefit of reduced uranium oxide reactor fuel must be weighed against the strategic risks of possible higher natural gas use. The redraft of the Basic Energy Plan is now underway. A new FiT package has been approved by the government and precise program details are expected in the autumn. We expect to see greater emphasis, sooner, on all forms of renewables and measures to spur additional efforts to lower energy intensity in some narrow sub-sectors where gains of the 1970’s have slipped, for example in the residential and transportation sectors.
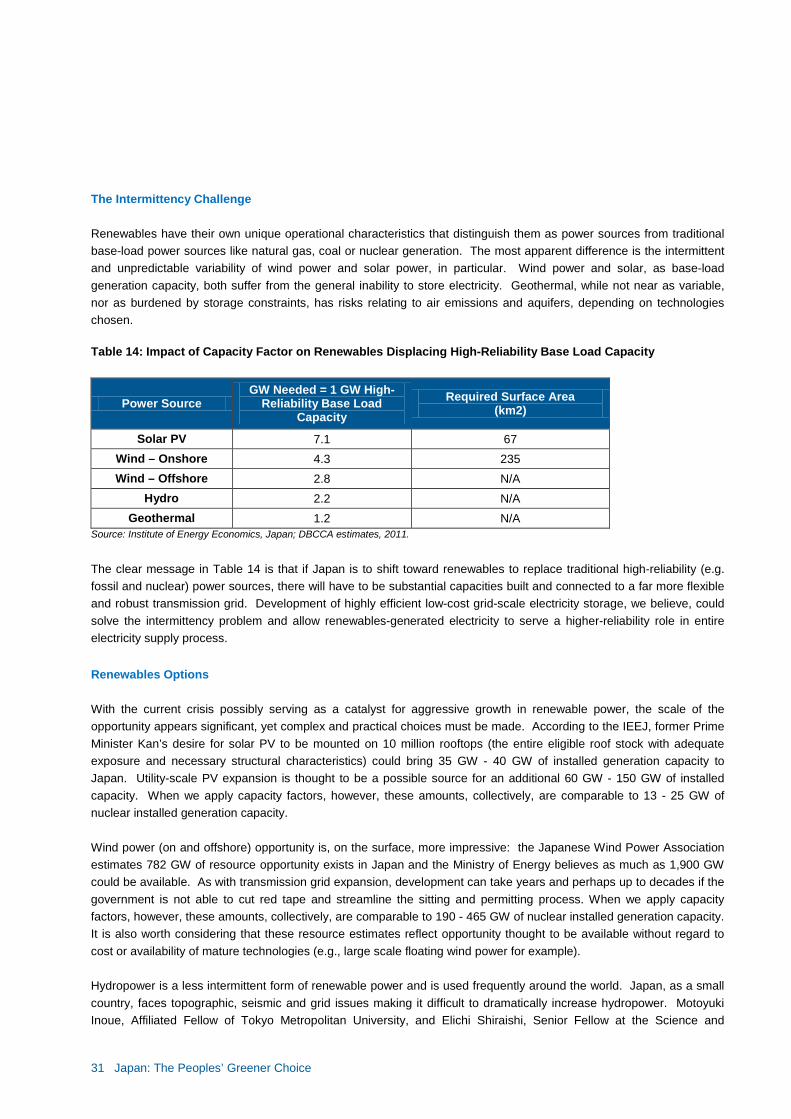
31 Japan: The Peoples’ Greener Choice
The Intermittency Challenge Renewables have their own unique operational characteristics that distinguish them as power sources from traditional base-load power sources like natural gas, coal or nuclear generation. The most apparent difference is the intermittent and unpredictable variability of wind power and solar power, in particular. Wind power and solar, as base-load generation capacity, both suffer from the general inability to store electricity. Geothermal, while not near as variable, nor as burdened by storage constraints, has risks relating to air emissions and aquifers, depending on technologies chosen. Table 14: Impact of Capacity Factor on Renewables Displacing High-Reliability Base Load Capacity
Power Source GW Needed = 1 GW High-
Reliability Base Load Capacity
Required Surface Area (km2)
Solar PV 7.1 67 Wind – Onshore 4.3 235 Wind – Offshore 2.8 N/A
Hydro 2.2 N/A Geothermal 1.2 N/A
Source: Institute of Energy Economics, Japan; DBCCA estimates, 2011.
The clear message in Table 14 is that if Japan is to shift toward renewables to replace traditional high-reliability (e.g. fossil and nuclear) power sources, there will have to be substantial capacities built and connected to a far more flexible and robust transmission grid. Development of highly efficient low-cost grid-scale electricity storage, we believe, could solve the intermittency problem and allow renewables-generated electricity to serve a higher-reliability role in entire electricity supply process.
Renewables Options With the current crisis possibly serving as a catalyst for aggressive growth in renewable power, the scale of the opportunity appears significant, yet complex and practical choices must be made. According to the IEEJ, former Prime Minister Kan’s desire for solar PV to be mounted on 10 million rooftops (the entire eligible roof stock with adequate exposure and necessary structural characteristics) could bring 35 GW - 40 GW of installed generation capacity to Japan. Utility-scale PV expansion is thought to be a possible source for an additional 60 GW - 150 GW of installed capacity. When we apply capacity factors, however, these amounts, collectively, are comparable to 13 - 25 GW of nuclear installed generation capacity. Wind power (on and offshore) opportunity is, on the surface, more impressive: the Japanese Wind Power Association estimates 782 GW of resource opportunity exists in Japan and the Ministry of Energy believes as much as 1,900 GW could be available. As with transmission grid expansion, development can take years and perhaps up to decades if the government is not able to cut red tape and streamline the sitting and permitting process. When we apply capacity factors, however, these amounts, collectively, are comparable to 190 - 465 GW of nuclear installed generation capacity. It is also worth considering that these resource estimates reflect opportunity thought to be available without regard to cost or availability of mature technologies (e.g., large scale floating wind power for example). Hydropower is a less intermittent form of renewable power and is used frequently around the world. Japan, as a small country, faces topographic, seismic and grid issues making it difficult to dramatically increase hydropower. Motoyuki Inoue, Affiliated Fellow of Tokyo Metropolitan University, and Elichi Shiraishi, Senior Fellow at the Science and
32 Japan: The Peoples’ Greener Choice
Technology Foresight Center, suggest 12 - 15 GW of incremental hydro capacity might be developed compared to the 45 GW now in operation. 99% of the remaining untapped capacity is estimated to offer less than 3 MW per site and could prove expensive given unfavorable site and hydrological conditions and grid interconnection costs. Geothermal power may have considerable opportunity in Japan given the country’s unique geology and access to geothermal resources. According to Bloomberg New Energy Finance, Japan now has approximately 537MW of geothermal generation installed. Japan’s National Academy of Sciences estimates 80 GW of possible geothermal resources; unfortunately, substantial portions of this opportunity are located within protected national or regional park areas and the ability to exploit this potential renewable resource will be complicated by social and political sentiments. It remains “early days” for geothermal in Japan and we believe as the government develops a new version of the Basic Energy Plan and as utility company resistance is overcome: broad feed-in tariffs will be necessary and effective in creating the policy transparency, longevity and certainty necessary for renewables growth to satisfy national strategic goals.
Using FiT to Achieve Volume Growth Goals: How Much Will It Cost On 26 August, the Japanese Diet approved FiT legislation as part of a deal to smooth the exit of now former Prime Minister Naoto Kan. This legislation creates the legal framework for a renewables FiT and authorizes the implementation of one. Unfortunately the legislation does not provide much detail with regard to actual feed-in tariff rates, program caps or other limitations. The legislation authorizes the creation of a parliamentary panel of experts who will draft these details. The FiT legislation contemplates the programs coming into effect in July 2012. Since the precise terms of the tariffs and programs have not been defined in the legislation, we believe there will be much lobbying by various interests, for and against, prospective tariffs and program terms that could supercharge the solar, wind and geothermal deployment necessary to dramatically reduce or eliminate nuclear generation in Japan. The Kaidanren industrial federation and utility interests are concerned that expanding renewable power development will increase power costs and weaken the political influence of the utility companies.
What We Know • Legislation establishes purchase and grid connection requirements; • 30 GW of aggregate renewables is targeted by 2020 representing 2x increase compared to the
government’s pre-earthquake Basic Energy Plan; • The tariffs will be based on actual generation costs rather than lower “avoided” costs.
What We Do Not Know
• Duration of FiT program, although many politicians and industry experts suggest 15 - 20 years; • Eligible technology cutoffs or thresholds; • Precise tariff rates, digression rates, payment structures or program caps; • Estimated increase in electricity costs for end-users.
So How Much? The key details of the plan are expected to be hashed out by the parliamentary committee of experts sometime in the autumn of 2011. Once further details are available, we will provide our updated thoughts on the fully crystallized FiT program. Given the scale and scope of the renewables transformation primed to unfold in Japan, the costs, based on current cost structures, may prove as sizeable as Japan’s ambitions. While the analyses below offer our estimates of how much solar PV and wind power might be deployed in the service of reducing nuclear generation to the minimum practical
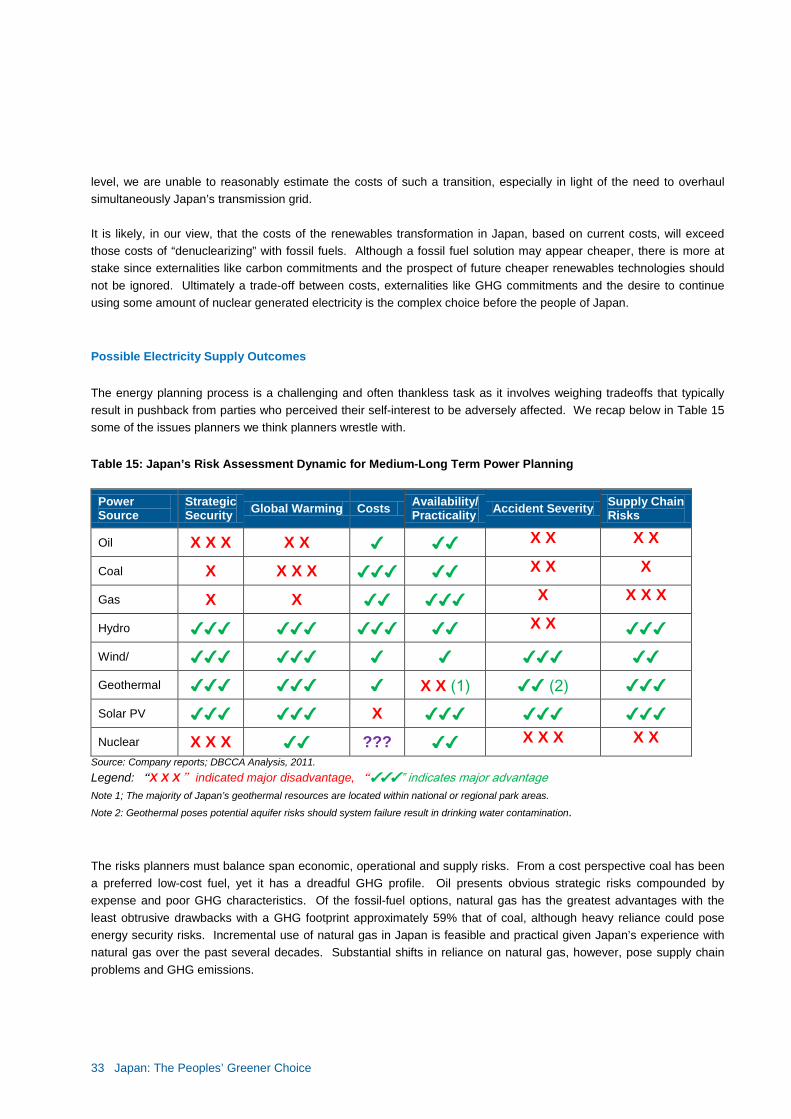
33 Japan: The Peoples’ Greener Choice
level, we are unable to reasonably estimate the costs of such a transition, especially in light of the need to overhaul simultaneously Japan’s transmission grid. It is likely, in our view, that the costs of the renewables transformation in Japan, based on current costs, will exceed those costs of “denuclearizing” with fossil fuels. Although a fossil fuel solution may appear cheaper, there is more at stake since externalities like carbon commitments and the prospect of future cheaper renewables technologies should not be ignored. Ultimately a trade-off between costs, externalities like GHG commitments and the desire to continue using some amount of nuclear generated electricity is the complex choice before the people of Japan.
Possible Electricity Supply Outcomes
The energy planning process is a challenging and often thankless task as it involves weighing tradeoffs that typically result in pushback from parties who perceived their self-interest to be adversely affected. We recap below in Table 15 some of the issues planners we think planners wrestle with.
Table 15: Japan’s Risk Assessment Dynamic for Medium-Long Term Power Planning
Power Source
Strategic Security Global Warming Costs Availability/
Practicality Accident Severity Supply Chain Risks
Oil X X X X X ✔ ✔✔ X X X X
Coal X X X X ✔✔✔ ✔✔ X X X
Gas X X ✔✔ ✔✔✔ X X X X
Hydro ✔✔✔ ✔✔✔ ✔✔✔ ✔✔ X X ✔✔✔ Wind/ ✔✔✔ ✔✔✔ ✔ ✔ ✔✔✔ ✔✔ Geothermal ✔✔✔ ✔✔✔ ✔ X X (1) ✔✔ (2) ✔✔✔ Solar PV ✔✔✔ ✔✔✔ X ✔✔✔ ✔✔✔ ✔✔✔ Nuclear X X X ✔✔ ??? ✔✔ X X X X X
Source: Company reports; DBCCA Analysis, 2011. Legend: “X X X” indicated major disadvantage, “✔✔✔” indicates major advantage Note 1; The majority of Japan’s geothermal resources are located within national or regional park areas.
Note 2: Geothermal poses potential aquifer risks should system failure result in drinking water contamination.
The risks planners must balance span economic, operational and supply risks. From a cost perspective coal has been a preferred low-cost fuel, yet it has a dreadful GHG profile. Oil presents obvious strategic risks compounded by expense and poor GHG characteristics. Of the fossil-fuel options, natural gas has the greatest advantages with the least obtrusive drawbacks with a GHG footprint approximately 59% that of coal, although heavy reliance could pose energy security risks. Incremental use of natural gas in Japan is feasible and practical given Japan’s experience with natural gas over the past several decades. Substantial shifts in reliance on natural gas, however, pose supply chain problems and GHG emissions.

34 Japan: The Peoples’ Greener Choice
Differences between the different renewables options similarly exist, although primarily in the cost and operational realms. Certainly the various forms of renewables have very appealing GHG, safety, risk and strategic security advantages.
For planners in Japan, the first focus must be on taking steps to capture for the long-term as much of the energy conservation efforts as possible. Logically, then focus would shift to expanding high-reliability hydropower and geothermal to the maximum extent practical. Unfortunately, approximately 80% of Japan’s hydro resources have been exploited and due to Japan’s geography, tapping the remaining 20% will be incrementally more expensive and difficult and the vast majority of the significant geothermal resources are located within park areas.
We believe that the next practical step would to replace coal wherever possible with natural gas for electricity production. Since natural gas has 59% of the GHG profile of coal, the system can increase electricity production by 1.7x yet still have comparable aggregate GHG emissions and adhere to the government’s original goals for 2030 GHG reductions.
As a third step, it is necessary for GHG and security reasons to increase intermittent renewables – wind power and solar power to a level limited only by stable and reliable grid operation. In our analyses that follow, we assume wind and solar-generated electricity could rise to 25% of total electricity produced in 2030. This is a level on par with what Germany’s 2010 National Renewable Energy Action Plan contemplated for the German grid 10 years earlier in 2020. Although Germany might be able to expand renewables contribution to higher levels, we note that Germany enjoys grid interconnections with other EU member countries and can rely on those interconnections to manage the intermittency issues that arise from a high proportion of intermittent renewables: Japan, an island, cannot. As a final option, fully replacing nuclear within the carbon constraint requires a further meaningful increase in renewables energy contribution well above that contemplated in Japan’s pre-earthquake Basic Energy Plan.
Our Scenarios for 2030 end point
In analyzing how might a 2030 Japan power sector appear and how the balance between nuclear closure, continued thermal-fueled generation and increasing reliance on expanded renewables might play out, two fundamental questions arose; one addressing electricity demand and the other addressing sources of electricity production. Our demand and supply estimates are predicated on the original 2030 outlook set forth in Japan’s pre-earthquake Basic Energy Plan.
• Demand Estimation: We explored two demand scenarios including review of the pre-existing 2030 plan and then analysis that assumes a permanent adoption (through a mix of behavioral change and technology adoption) of 100% of the recent electricity conservation efforts. In both analyses we used the same GDP growth forecasts: 0.8% annual real growth for 2011 - 2015 and 1.0% annual real growth for 2016 - 2030 and allowed Electricity Intensity to improve at varying rates driven by assumed degrees of electricity conservation and efficiency.
o Demand Scenario 1 reflects the Japanese implicit assumption of an annual 1.5% Electricity Intensity (“EI”) improvement. Cumulatively EI improves by 27% by 2030 from 2009 levels. Estimated 2030 electricity production of approximately 1,021 TWHR;
o Demand Scenario 2 is reflects the notion that the influence of 100% of the current conservation measures either become permanent behavior changes or are captured by technology changes as efficiency gains should human behavior regress. Annual EI improves at 2.2%/year. Cumulatively EI improves by 37% by 2030 compared to 2009 levels. Estimated 2030 electricity production of approximately 888 TWHR.
35 Japan: The Peoples’ Greener Choice
• Supply Estimation: We examined two 2030 supply scenarios, each within the context of the two different Demand Scenarios. These scenarios established possible portfolios of generation capacity subject to thermal fuel mix constraints, carbon constraints, nuclear reduction ambitions and grid stability/reliability constraints. In all cases, the amount of each type of generation was adjusted by capacity factor in calculating possible electricity production (TWHR).
o “Government Pre-Earthquake Base Case - 2030:” Government-planned fuel mix with all fuel types available and with targeted government renewables levels. Thermal generation is fueled by coal and natural gas and the notional carbon limit is in effect at the government target for 270 TWHR of thermal electricity produced;
o 2030 Supply Scenario 1 “Practical Nuclear Reduction - Expand Renewables to Manageable Levels:” hydro expanded to maximum; replace all electricity production from coal with natural gas-fired generation in order to obtain the most electricity without breaching a carbon limit; increase renewables generation capacity to a manageable level (e.g., intermittent renewables TWHR not to exceed 25% of total electricity production) and then use nuclear generation in order to meet electricity demands in the Demand Scenario;
o 2030 Supply Scenario 2 “100% Nuclear Reduction - Expand Renewables to Maximum Deployment:”
all nuclear generation is shutdown by 2030; hydro to maximum, replace all electricity production from coal with natural gas-fired generation in order to obtain the most electricity without breaching a carbon limit; then increase renewables generation capacity to achieve target electricity production in the Demand Scenario.
We present in the following Tables 16, 17 and 18 and Figures 15 - 18 the key assumptions and results that arise from linking our various Demand and Supply Scenarios.
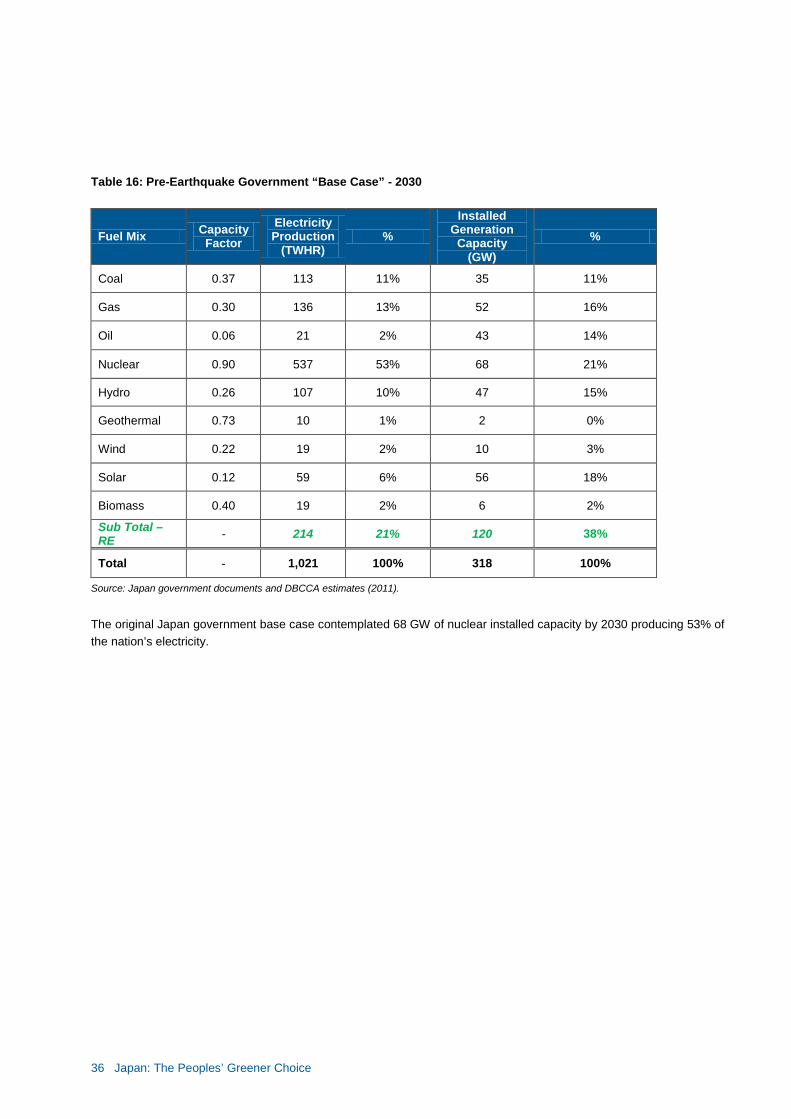
36 Japan: The Peoples’ Greener Choice
Table 16: Pre-Earthquake Government “Base Case” - 2030
Fuel Mix Capacity Factor
Electricity Production
(TWHR) %
Installed Generation
Capacity (GW)
%
Coal 0.37 113 11% 35 11%
Gas 0.30 136 13% 52 16%
Oil 0.06 21 2% 43 14%
Nuclear 0.90 537 53% 68 21%
Hydro 0.26 107 10% 47 15%
Geothermal 0.73 10 1% 2 0%
Wind 0.22 19 2% 10 3%
Solar 0.12 59 6% 56 18%
Biomass 0.40 19 2% 6 2%
Sub Total – RE - 214 21% 120 38%
Total - 1,021 100% 318 100%
Source: Japan government documents and DBCCA estimates (2011).
The original Japan government base case contemplated 68 GW of nuclear installed capacity by 2030 producing 53% of the nation’s electricity.

37 Japan: The Peoples’ Greener Choice
Table 17: 2030 Scenario 1: “Practical Nuclear Reduction” – Increase Renewables to Manageable Levels
Fuel Mix Capacity Factor
Electricity Production
(TWHR) %
Installed Generation
Capacity (GW)
%
Coal 0.37 - 0% 0 0%
Gas 0.43 327 37% 87 23%
Oil 0.06 21 2% 43 11%
Nuclear 0.90 151 17% 19 5%
Hydro 0.26 137 15% 60 16%
Geothermal 0.73 13 1% 2 1%
Wind 0.22 116 13% 60 16%
Solar 0.12 105 12% 100 27%
Biomass 0.40 19 2% 6 1%
Sub Total – RE - 389 44% 228 60%
Total - 888 100% 377 100%
Source: Japan government documents and DBCCA estimates (2011).
In 2030 Scenario 1, “Practical Nuclear Reduction,”, we assumed the following actions:
1. Maximum energy conservation and energy efficiency gains sustained as described in Demand Scenario 2. As a result, we forecast Japan’s Electricity Intensity declining at a 2.2% annual rate through 2030 compared to the government’s Base Case assumption of 1.5% annual improvement.
2. Switch coal-fired generation to natural gas-fired and maintain compliance with 2030 GHG targets. 3. Increase intermittent renewables electricity production is 25% of total electricity production with “all
renewables” generation accounting for 44% of total electricity production. 4. We find keeping 19 GW of nuclear installed generation capacity is necessary to generate 17% of the nation’s
electricity demand, even under the most aggressive energy conservation and energy efficiency assumptions.
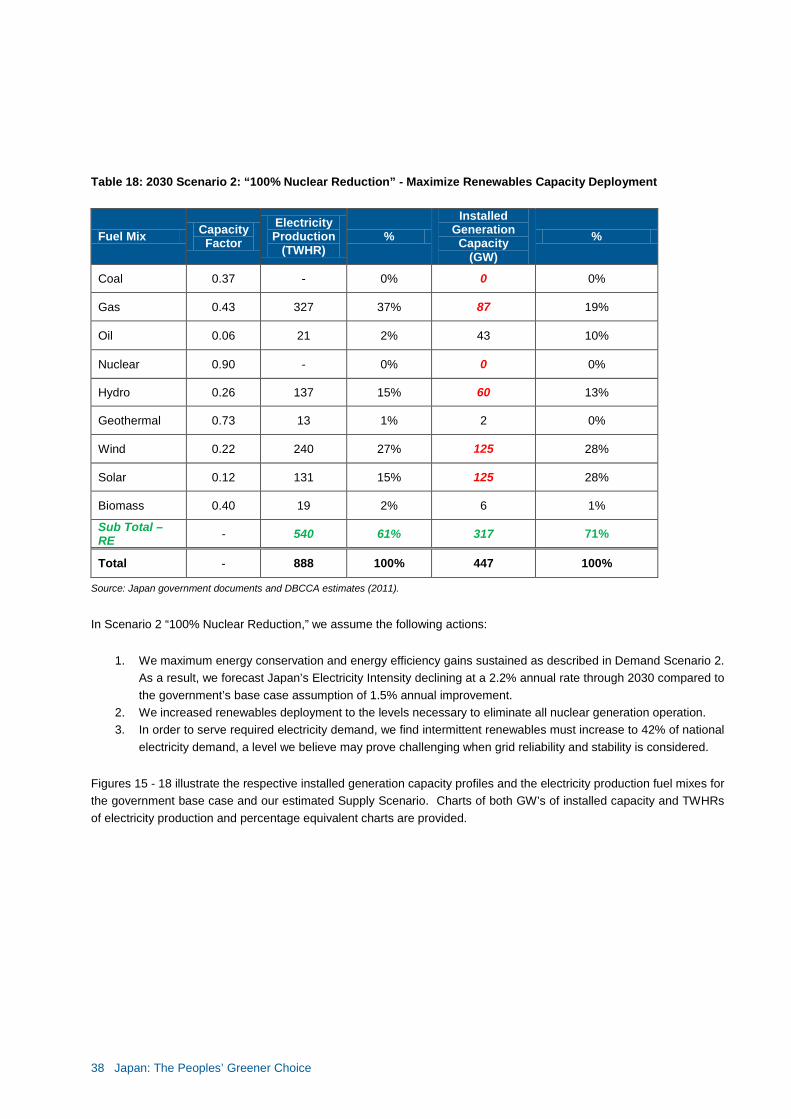
38 Japan: The Peoples’ Greener Choice
Table 18: 2030 Scenario 2: “100% Nuclear Reduction” - Maximize Renewables Capacity Deployment
Fuel Mix Capacity Factor
Electricity Production
(TWHR) %
Installed Generation
Capacity (GW)
%
Coal 0.37 - 0% 0 0%
Gas 0.43 327 37% 87 19%
Oil 0.06 21 2% 43 10%
Nuclear 0.90 - 0% 0 0%
Hydro 0.26 137 15% 60 13%
Geothermal 0.73 13 1% 2 0%
Wind 0.22 240 27% 125 28%
Solar 0.12 131 15% 125 28%
Biomass 0.40 19 2% 6 1%
Sub Total – RE - 540 61% 317 71%
Total - 888 100% 447 100%
Source: Japan government documents and DBCCA estimates (2011).
In Scenario 2 “100% Nuclear Reduction,” we assume the following actions:
1. We maximum energy conservation and energy efficiency gains sustained as described in Demand Scenario 2. As a result, we forecast Japan’s Electricity Intensity declining at a 2.2% annual rate through 2030 compared to the government’s base case assumption of 1.5% annual improvement.
2. We increased renewables deployment to the levels necessary to eliminate all nuclear generation operation. 3. In order to serve required electricity demand, we find intermittent renewables must increase to 42% of national
electricity demand, a level we believe may prove challenging when grid reliability and stability is considered.
Figures 15 - 18 illustrate the respective installed generation capacity profiles and the electricity production fuel mixes for the government base case and our estimated Supply Scenario. Charts of both GW’s of installed capacity and TWHRs of electricity production and percentage equivalent charts are provided.
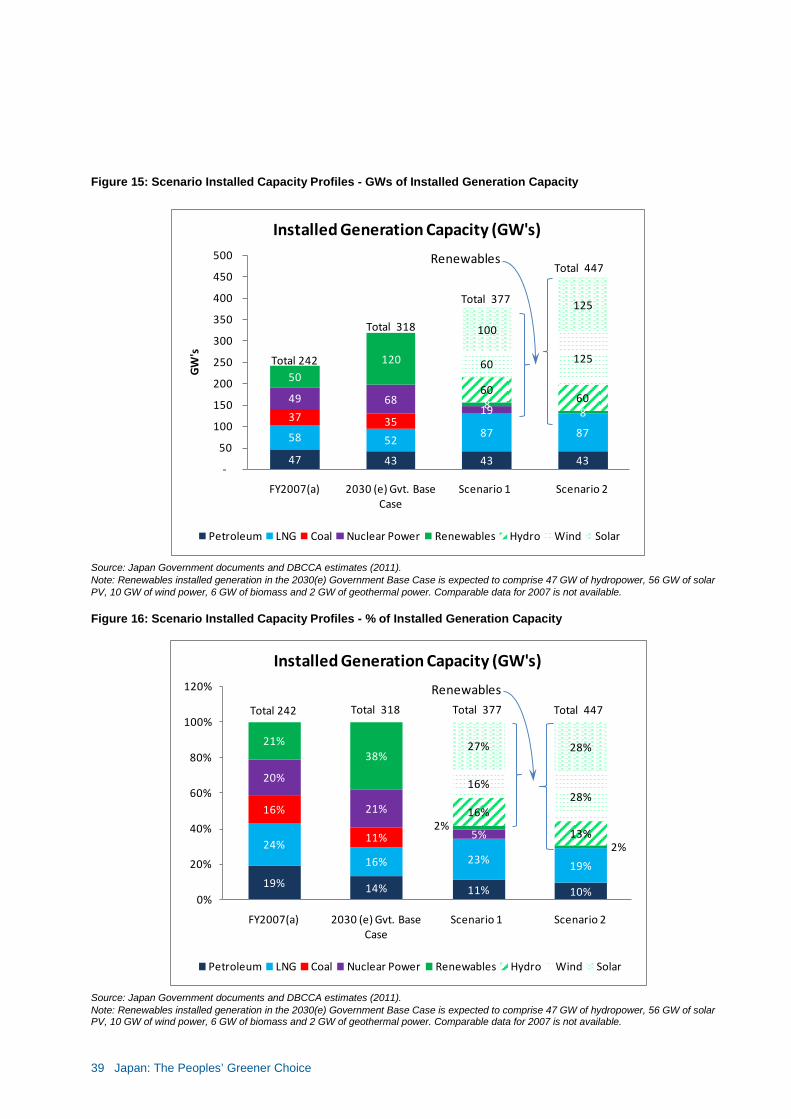
39 Japan: The Peoples’ Greener Choice
Figure 15: Scenario Installed Capacity Profiles - GWs of Installed Generation Capacity
Source: Japan Government documents and DBCCA estimates (2011). Note: Renewables installed generation in the 2030(e) Government Base Case is expected to comprise 47 GW of hydropower, 56 GW of solar PV, 10 GW of wind power, 6 GW of biomass and 2 GW of geothermal power. Comparable data for 2007 is not available. Figure 16: Scenario Installed Capacity Profiles - % of Installed Generation Capacity
Source: Japan Government documents and DBCCA estimates (2011). Note: Renewables installed generation in the 2030(e) Government Base Case is expected to comprise 47 GW of hydropower, 56 GW of solar PV, 10 GW of wind power, 6 GW of biomass and 2 GW of geothermal power. Comparable data for 2007 is not available.
47 43 43 43
58 52 87 87
37 35
49 68 19
50
120
8 8
60 60
60 125
100
125
-
50
100
150
200
250
300
350
400
450
500
FY2007(a) 2030 (e) Gvt. Base Case
Scenario 1 Scenario 2
GW
's
Installed Generation Capacity (GW's)
Petroleum LNG Coal Nuclear Power Renewables Hydro Wind Solar
Total 242
Total 318
Total 447Renewables
Total 377
19% 14% 11% 10%
24%16% 23% 19%
16%
11%
20%
21%
5%
21%38%
2%
2%
16%
13%
16%28%
27% 28%
0%
20%
40%
60%
80%
100%
120%
FY2007(a) 2030 (e) Gvt. Base Case
Scenario 1 Scenario 2
Installed Generation Capacity (GW's)
Petroleum LNG Coal Nuclear Power Renewables Hydro Wind Solar
Total 242 Total 318 Total 447
RenewablesTotal 377
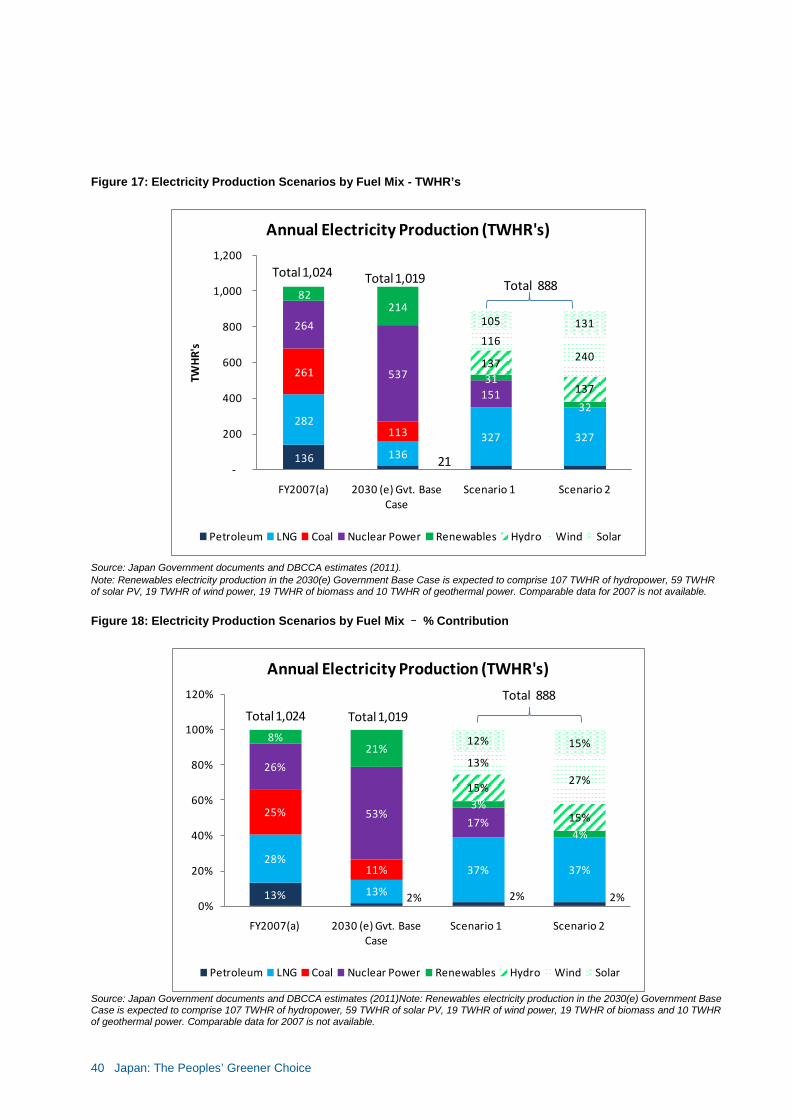
40 Japan: The Peoples’ Greener Choice
Figure 17: Electricity Production Scenarios by Fuel Mix - TWHR’s
Source: Japan Government documents and DBCCA estimates (2011). Note: Renewables electricity production in the 2030(e) Government Base Case is expected to comprise 107 TWHR of hydropower, 59 TWHR of solar PV, 19 TWHR of wind power, 19 TWHR of biomass and 10 TWHR of geothermal power. Comparable data for 2007 is not available. Figure 18: Electricity Production Scenarios by Fuel Mix – % Contribution
Source: Japan Government documents and DBCCA estimates (2011)Note: Renewables electricity production in the 2030(e) Government Base Case is expected to comprise 107 TWHR of hydropower, 59 TWHR of solar PV, 19 TWHR of wind power, 19 TWHR of biomass and 10 TWHR of geothermal power. Comparable data for 2007 is not available.
136
282
136 327 327
261
113
264
537
151
82 214
31
32
137
137
116240
105 131
-
200
400
600
800
1,000
1,200
FY2007(a) 2030 (e) Gvt. Base Case
Scenario 1 Scenario 2
TWH
R's
Annual Electricity Production (TWHR's)
Petroleum LNG Coal Nuclear Power Renewables Hydro Wind Solar
Total 1,024 Total 1,019 Total 888
21
13% 2% 2% 2%
28%
13%
37% 37%
25%
11%
26%
53%17%
8%21%
3%
4%
15%
15%
13%
27%
12% 15%
0%
20%
40%
60%
80%
100%
120%
FY2007(a) 2030 (e) Gvt. Base Case
Scenario 1 Scenario 2
Annual Electricity Production (TWHR's)
Petroleum LNG Coal Nuclear Power Renewables Hydro Wind Solar
Total 1,024 Total 1,019
Total 888
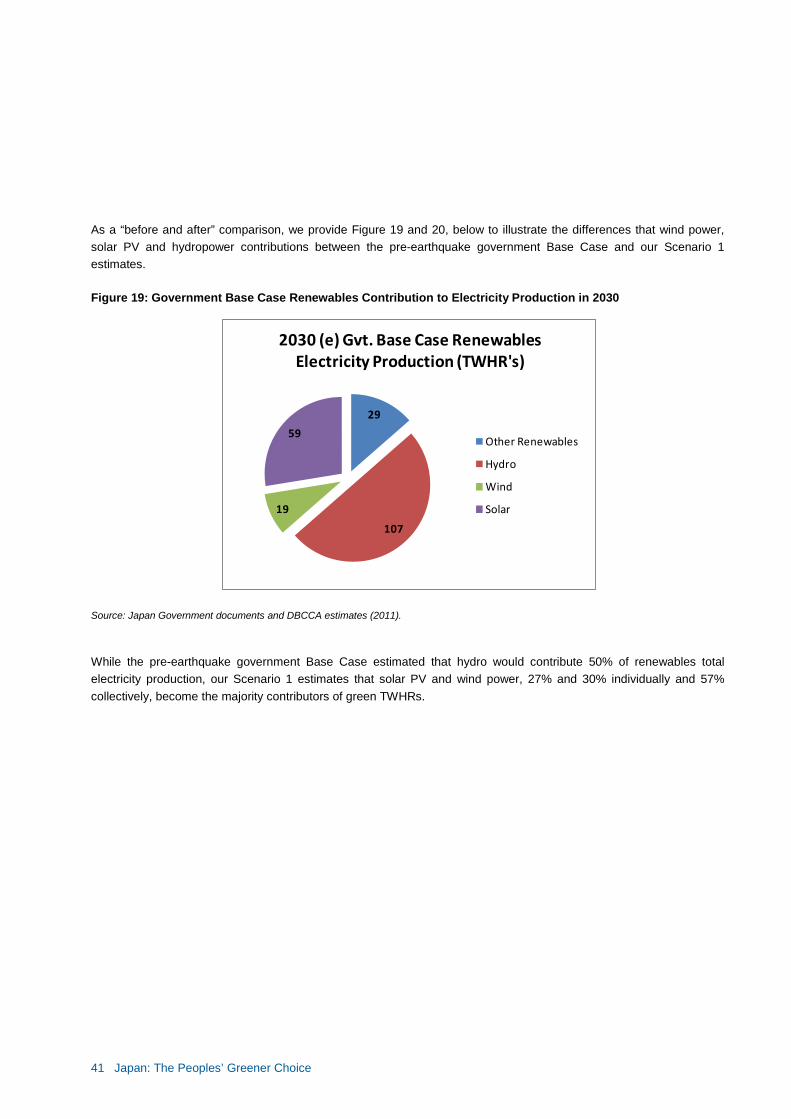
41 Japan: The Peoples’ Greener Choice
As a “before and after” comparison, we provide Figure 19 and 20, below to illustrate the differences that wind power, solar PV and hydropower contributions between the pre-earthquake government Base Case and our Scenario 1 estimates.
Figure 19: Government Base Case Renewables Contribution to Electricity Production in 2030
Source: Japan Government documents and DBCCA estimates (2011).
While the pre-earthquake government Base Case estimated that hydro would contribute 50% of renewables total electricity production, our Scenario 1 estimates that solar PV and wind power, 27% and 30% individually and 57% collectively, become the majority contributors of green TWHRs.
29
107
19
59
2030 (e) Gvt. Base Case Renewables Electricity Production (TWHR's)
Other Renewables
Hydro
Wind
Solar
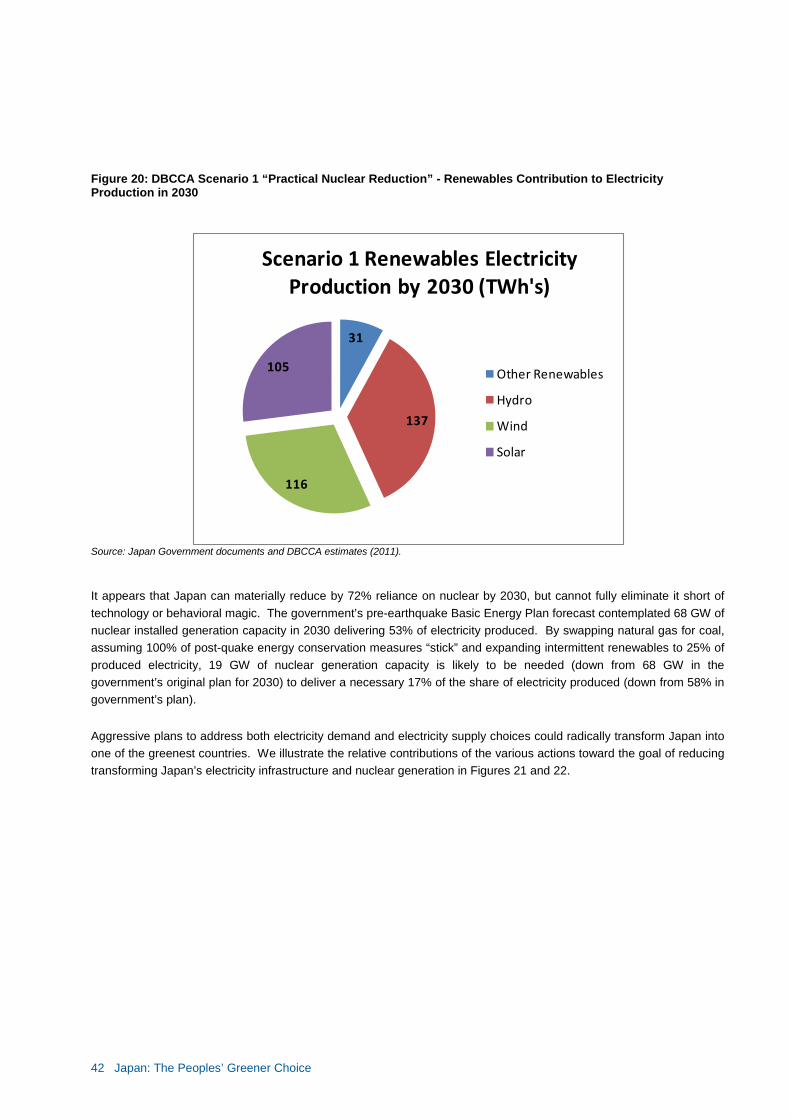
42 Japan: The Peoples’ Greener Choice
Figure 20: DBCCA Scenario 1 “Practical Nuclear Reduction” - Renewables Contribution to Electricity Production in 2030
Source: Japan Government documents and DBCCA estimates (2011). It appears that Japan can materially reduce by 72% reliance on nuclear by 2030, but cannot fully eliminate it short of technology or behavioral magic. The government’s pre-earthquake Basic Energy Plan forecast contemplated 68 GW of nuclear installed generation capacity in 2030 delivering 53% of electricity produced. By swapping natural gas for coal, assuming 100% of post-quake energy conservation measures “stick” and expanding intermittent renewables to 25% of produced electricity, 19 GW of nuclear generation capacity is likely to be needed (down from 68 GW in the government’s original plan for 2030) to deliver a necessary 17% of the share of electricity produced (down from 58% in government’s plan).
Aggressive plans to address both electricity demand and electricity supply choices could radically transform Japan into one of the greenest countries. We illustrate the relative contributions of the various actions toward the goal of reducing transforming Japan’s electricity infrastructure and nuclear generation in Figures 21 and 22.
31
137
116
105
Scenario 1 Renewables Electricity Production by 2030 (TWh's)
Other Renewables
Hydro
Wind
Solar
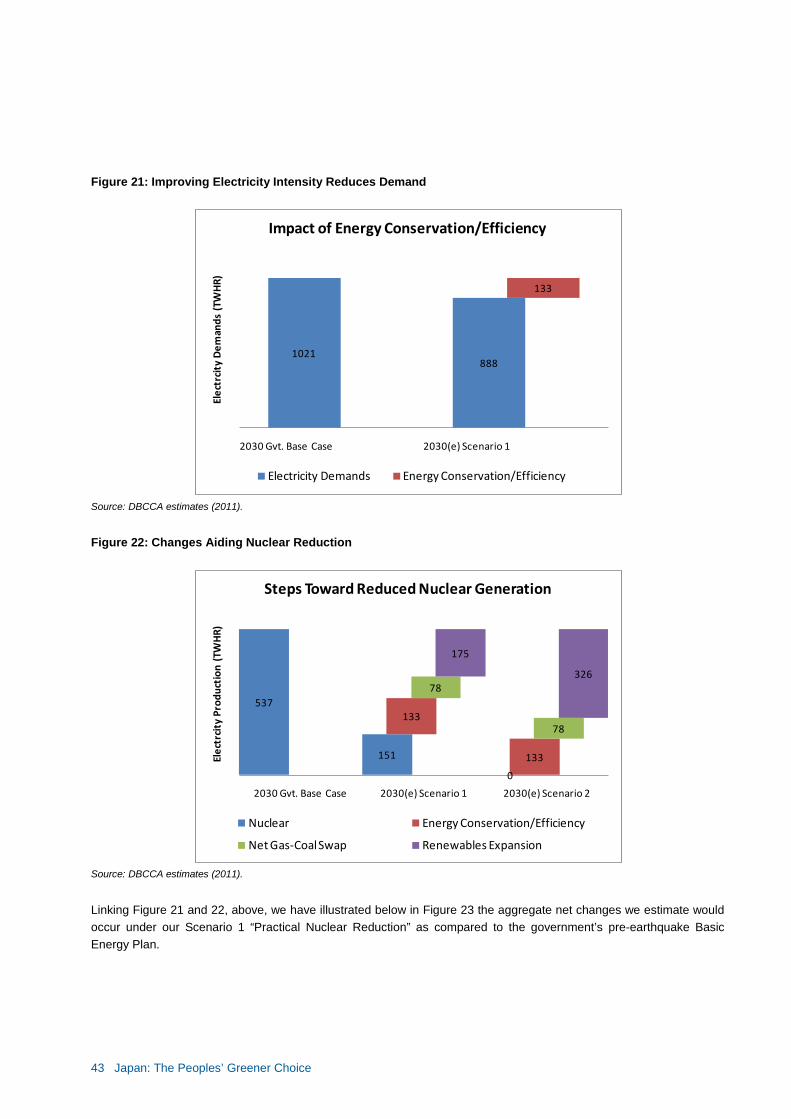
43 Japan: The Peoples’ Greener Choice
Figure 21: Improving Electricity Intensity Reduces Demand
Source: DBCCA estimates (2011).
Figure 22: Changes Aiding Nuclear Reduction
Source: DBCCA estimates (2011).
Linking Figure 21 and 22, above, we have illustrated below in Figure 23 the aggregate net changes we estimate would occur under our Scenario 1 “Practical Nuclear Reduction” as compared to the government’s pre-earthquake Basic Energy Plan.
1021888
133
2030 Gvt. Base Case 2030(e) Scenario 1
Elec
trci
ty D
eman
ds (
TWH
R)Impact of Energy Conservation/Efficiency
Electricity Demands Energy Conservation/Efficiency
537
151
0
133
133
78
78
175
326
2030 Gvt. Base Case 2030(e) Scenario 1 2030(e) Scenario 2
Elec
trci
ty P
rodu
ctio
n (T
WH
R)
Steps Toward Reduced Nuclear Generation
Nuclear Energy Conservation/Efficiency
Net Gas-Coal Swap Renewables Expansion
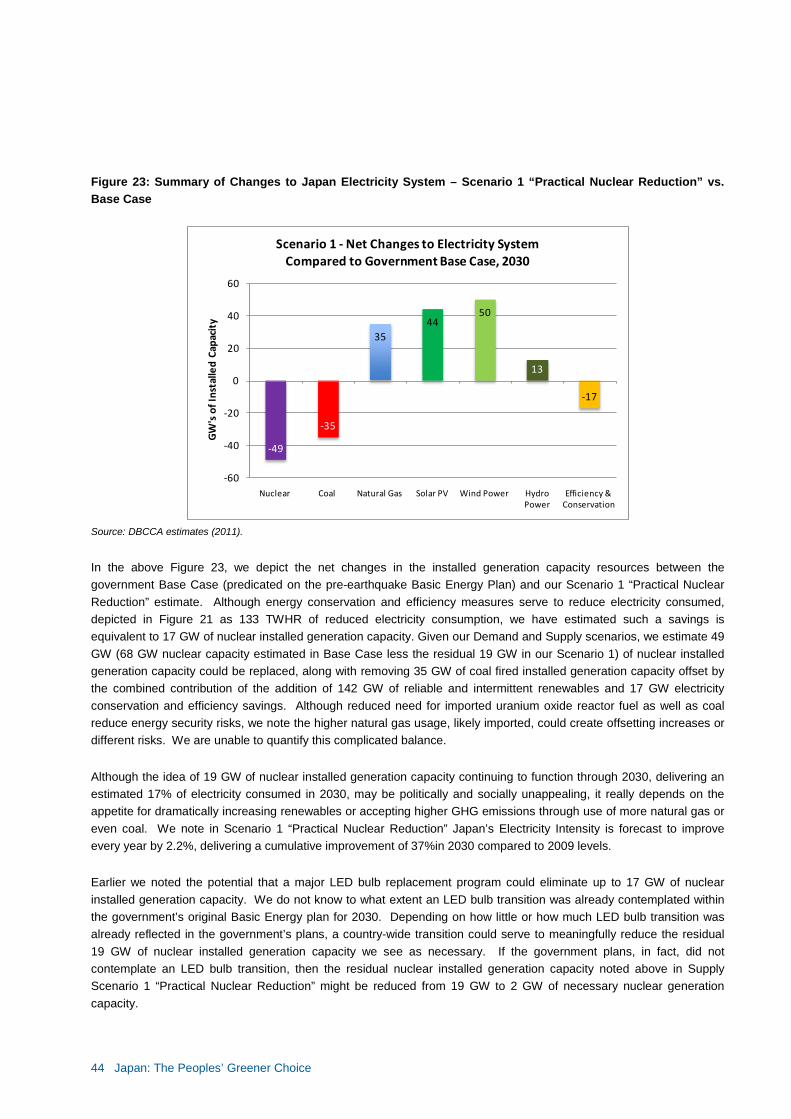
44 Japan: The Peoples’ Greener Choice
Figure 23: Summary of Changes to Japan Electricity System – Scenario 1 “Practical Nuclear Reduction” vs. Base Case
Source: DBCCA estimates (2011).
In the above Figure 23, we depict the net changes in the installed generation capacity resources between the government Base Case (predicated on the pre-earthquake Basic Energy Plan) and our Scenario 1 “Practical Nuclear Reduction” estimate. Although energy conservation and efficiency measures serve to reduce electricity consumed, depicted in Figure 21 as 133 TWHR of reduced electricity consumption, we have estimated such a savings is equivalent to 17 GW of nuclear installed generation capacity. Given our Demand and Supply scenarios, we estimate 49 GW (68 GW nuclear capacity estimated in Base Case less the residual 19 GW in our Scenario 1) of nuclear installed generation capacity could be replaced, along with removing 35 GW of coal fired installed generation capacity offset by the combined contribution of the addition of 142 GW of reliable and intermittent renewables and 17 GW electricity conservation and efficiency savings. Although reduced need for imported uranium oxide reactor fuel as well as coal reduce energy security risks, we note the higher natural gas usage, likely imported, could create offsetting increases or different risks. We are unable to quantify this complicated balance.
Although the idea of 19 GW of nuclear installed generation capacity continuing to function through 2030, delivering an estimated 17% of electricity consumed in 2030, may be politically and socially unappealing, it really depends on the appetite for dramatically increasing renewables or accepting higher GHG emissions through use of more natural gas or even coal. We note in Scenario 1 “Practical Nuclear Reduction” Japan’s Electricity Intensity is forecast to improve every year by 2.2%, delivering a cumulative improvement of 37%in 2030 compared to 2009 levels.
Earlier we noted the potential that a major LED bulb replacement program could eliminate up to 17 GW of nuclear installed generation capacity. We do not know to what extent an LED bulb transition was already contemplated within the government’s original Basic Energy plan for 2030. Depending on how little or how much LED bulb transition was already reflected in the government’s plans, a country-wide transition could serve to meaningfully reduce the residual 19 GW of nuclear installed generation capacity we see as necessary. If the government plans, in fact, did not contemplate an LED bulb transition, then the residual nuclear installed generation capacity noted above in Supply Scenario 1 “Practical Nuclear Reduction” might be reduced from 19 GW to 2 GW of necessary nuclear generation capacity.
-49
-35
3544
50
13
-17
-60
-40
-20
0
20
40
60
Nuclear Coal Natural Gas Solar PV Wind Power HydroPower
Efficiency & Conservation
GW
's o
f Ins
talle
d Ca
paci
ty
Scenario 1 - Net Changes to Electricity SystemCompared to Government Base Case, 2030
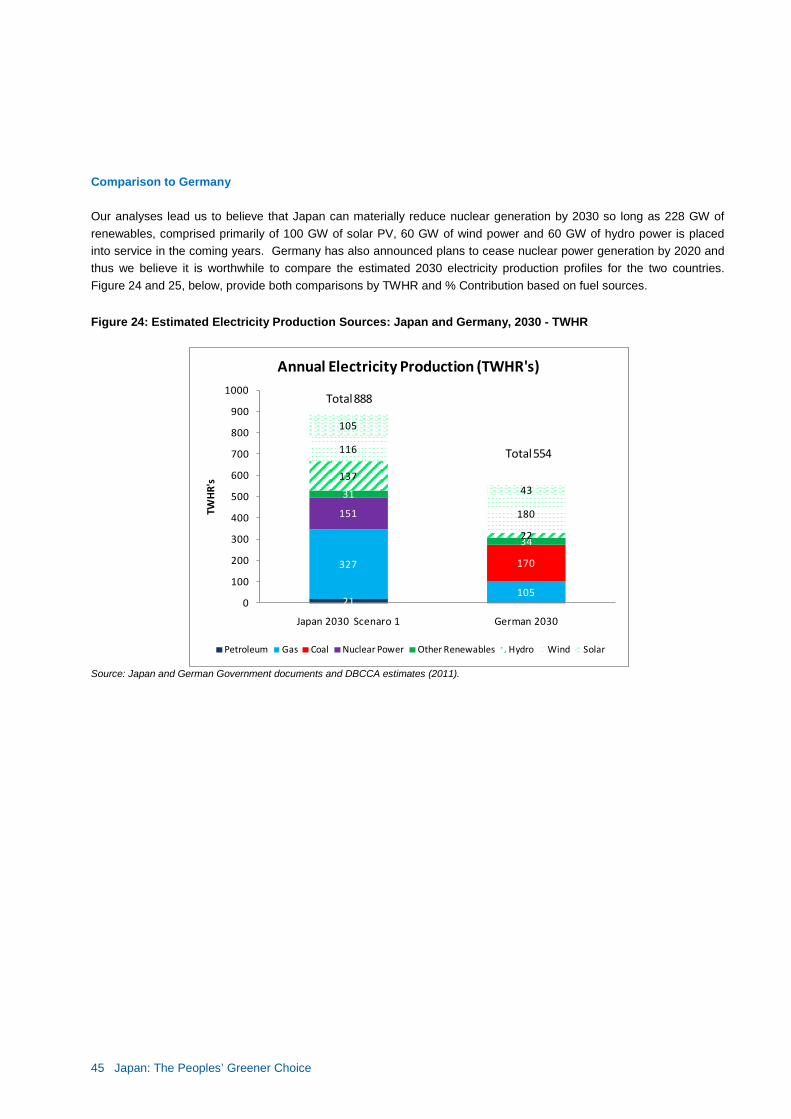
45 Japan: The Peoples’ Greener Choice
Comparison to Germany Our analyses lead us to believe that Japan can materially reduce nuclear generation by 2030 so long as 228 GW of renewables, comprised primarily of 100 GW of solar PV, 60 GW of wind power and 60 GW of hydro power is placed into service in the coming years. Germany has also announced plans to cease nuclear power generation by 2020 and thus we believe it is worthwhile to compare the estimated 2030 electricity production profiles for the two countries. Figure 24 and 25, below, provide both comparisons by TWHR and % Contribution based on fuel sources.
Figure 24: Estimated Electricity Production Sources: Japan and Germany, 2030 - TWHR
Source: Japan and German Government documents and DBCCA estimates (2011).
21
327
105
170
151
31
34
137
22
116
180
105
43
0
100
200
300
400
500
600
700
800
900
1000
Japan 2030 Scenaro 1 German 2030
TWH
R's
Annual Electricity Production (TWHR's)
Petroleum Gas Coal Nuclear Power Other Renewables Hydro Wind Solar
Total 888
Total 554
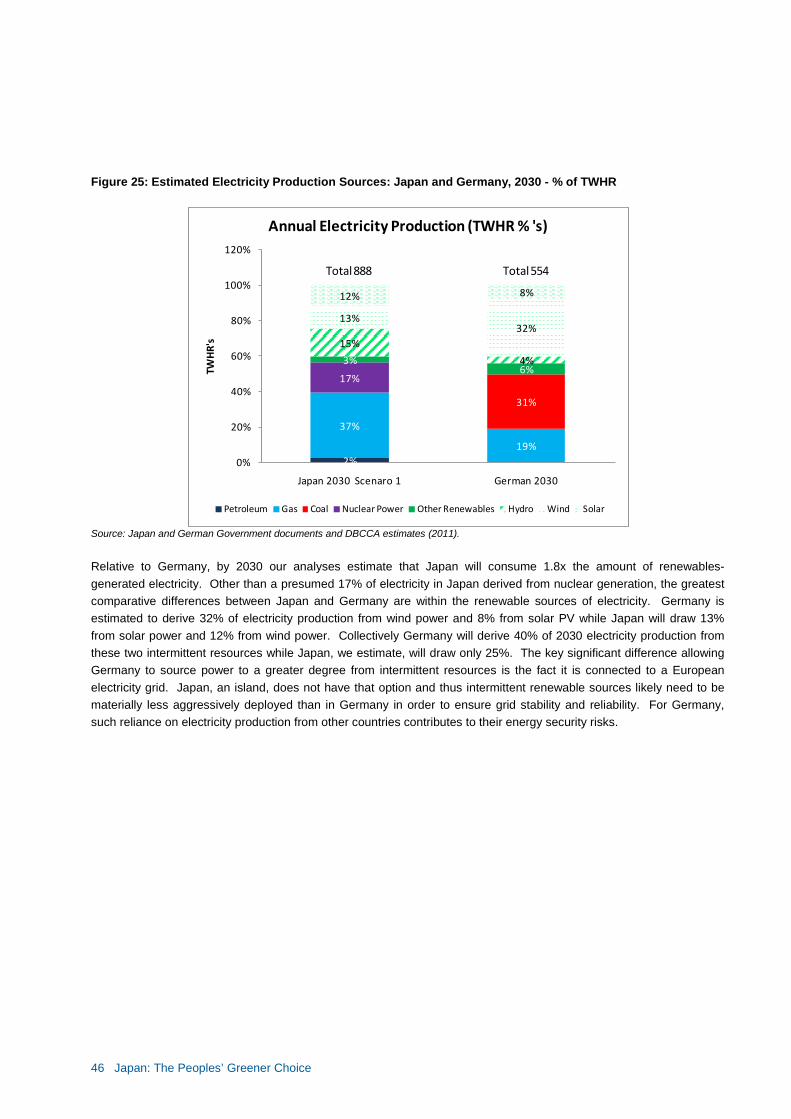
46 Japan: The Peoples’ Greener Choice
Figure 25: Estimated Electricity Production Sources: Japan and Germany, 2030 - % of TWHR
Source: Japan and German Government documents and DBCCA estimates (2011). Relative to Germany, by 2030 our analyses estimate that Japan will consume 1.8x the amount of renewables-generated electricity. Other than a presumed 17% of electricity in Japan derived from nuclear generation, the greatest comparative differences between Japan and Germany are within the renewable sources of electricity. Germany is estimated to derive 32% of electricity production from wind power and 8% from solar PV while Japan will draw 13% from solar power and 12% from wind power. Collectively Germany will derive 40% of 2030 electricity production from these two intermittent resources while Japan, we estimate, will draw only 25%. The key significant difference allowing Germany to source power to a greater degree from intermittent resources is the fact it is connected to a European electricity grid. Japan, an island, does not have that option and thus intermittent renewable sources likely need to be materially less aggressively deployed than in Germany in order to ensure grid stability and reliability. For Germany, such reliance on electricity production from other countries contributes to their energy security risks.
2%
37%
19%
31%
17%
3%6%
15%
4%
13%32%
12% 8%
0%
20%
40%
60%
80%
100%
120%
Japan 2030 Scenaro 1 German 2030
TWH
R's
Annual Electricity Production (TWHR % 's)
Petroleum Gas Coal Nuclear Power Other Renewables Hydro Wind Solar
Total 888 Total 554
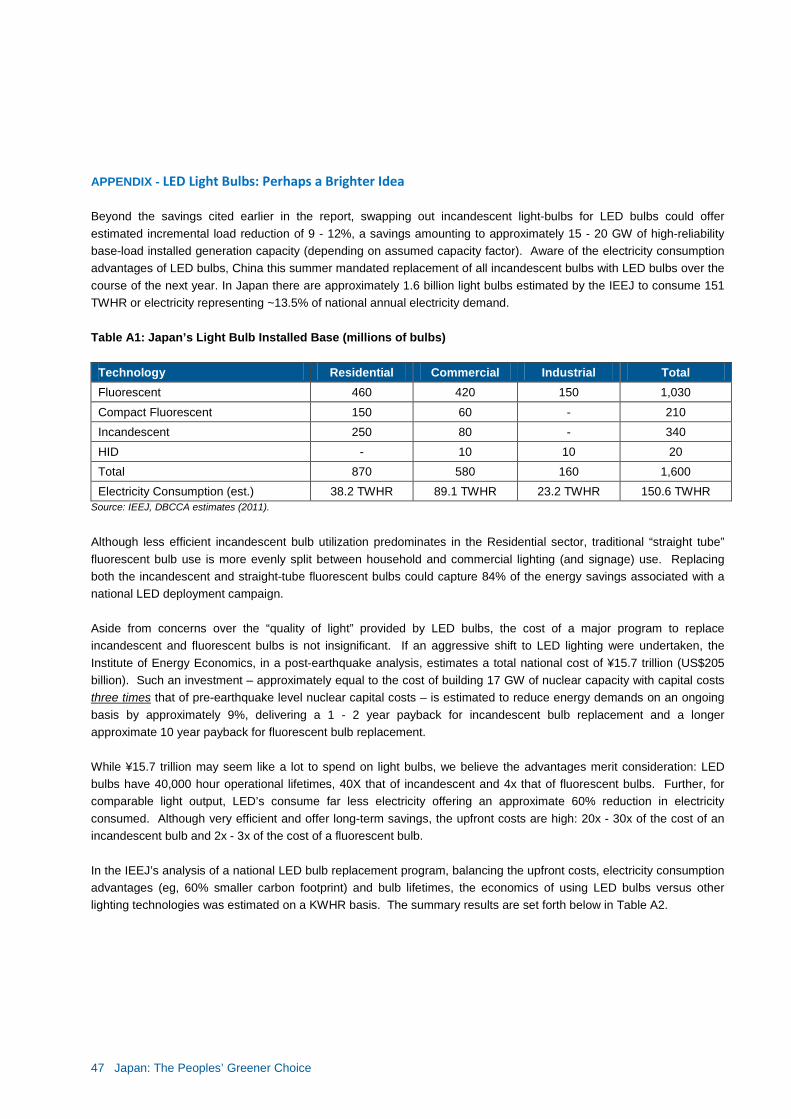
47 Japan: The Peoples’ Greener Choice
APPENDIX - LED Light Bulbs: Perhaps a Brighter Idea Beyond the savings cited earlier in the report, swapping out incandescent light-bulbs for LED bulbs could offer estimated incremental load reduction of 9 - 12%, a savings amounting to approximately 15 - 20 GW of high-reliability base-load installed generation capacity (depending on assumed capacity factor). Aware of the electricity consumption advantages of LED bulbs, China this summer mandated replacement of all incandescent bulbs with LED bulbs over the course of the next year. In Japan there are approximately 1.6 billion light bulbs estimated by the IEEJ to consume 151 TWHR or electricity representing ~13.5% of national annual electricity demand. Table A1: Japan’s Light Bulb Installed Base (millions of bulbs)
Technology Residential Commercial Industrial Total Fluorescent 460 420 150 1,030
Compact Fluorescent 150 60 - 210 Incandescent 250 80 - 340 HID - 10 10 20 Total 870 580 160 1,600 Electricity Consumption (est.) 38.2 TWHR 89.1 TWHR 23.2 TWHR 150.6 TWHR
Source: IEEJ, DBCCA estimates (2011).
Although less efficient incandescent bulb utilization predominates in the Residential sector, traditional “straight tube” fluorescent bulb use is more evenly split between household and commercial lighting (and signage) use. Replacing both the incandescent and straight-tube fluorescent bulbs could capture 84% of the energy savings associated with a national LED deployment campaign. Aside from concerns over the “quality of light” provided by LED bulbs, the cost of a major program to replace incandescent and fluorescent bulbs is not insignificant. If an aggressive shift to LED lighting were undertaken, the Institute of Energy Economics, in a post-earthquake analysis, estimates a total national cost of ¥15.7 trillion (US$205 billion). Such an investment – approximately equal to the cost of building 17 GW of nuclear capacity with capital costs three times that of pre-earthquake level nuclear capital costs – is estimated to reduce energy demands on an ongoing basis by approximately 9%, delivering a 1 - 2 year payback for incandescent bulb replacement and a longer approximate 10 year payback for fluorescent bulb replacement. While ¥15.7 trillion may seem like a lot to spend on light bulbs, we believe the advantages merit consideration: LED bulbs have 40,000 hour operational lifetimes, 40X that of incandescent and 4x that of fluorescent bulbs. Further, for comparable light output, LED’s consume far less electricity offering an approximate 60% reduction in electricity consumed. Although very efficient and offer long-term savings, the upfront costs are high: 20x - 30x of the cost of an incandescent bulb and 2x - 3x of the cost of a fluorescent bulb. In the IEEJ’s analysis of a national LED bulb replacement program, balancing the upfront costs, electricity consumption advantages (eg, 60% smaller carbon footprint) and bulb lifetimes, the economics of using LED bulbs versus other lighting technologies was estimated on a KWHR basis. The summary results are set forth below in Table A2.
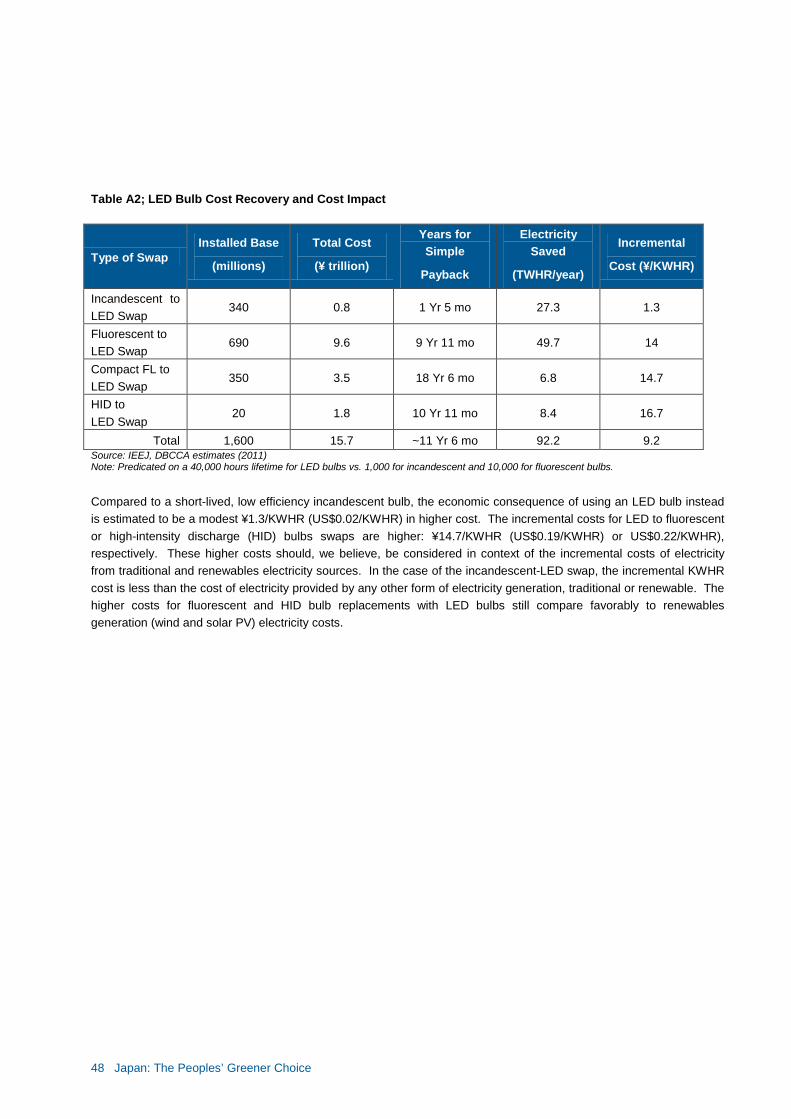
48 Japan: The Peoples’ Greener Choice
Table A2; LED Bulb Cost Recovery and Cost Impact
Type of Swap Installed Base
(millions)
Total Cost
(¥ trillion)
Years for Simple
Payback
Electricity Saved
(TWHR/year)
Incremental
Cost (¥/KWHR)
Incandescent to LED Swap
340 0.8 1 Yr 5 mo 27.3 1.3
Fluorescent to LED Swap
690 9.6 9 Yr 11 mo 49.7 14
Compact FL to LED Swap
350 3.5 18 Yr 6 mo 6.8 14.7
HID to LED Swap
20 1.8 10 Yr 11 mo 8.4 16.7
Total 1,600 15.7 ~11 Yr 6 mo 92.2 9.2 Source: IEEJ, DBCCA estimates (2011) Note: Predicated on a 40,000 hours lifetime for LED bulbs vs. 1,000 for incandescent and 10,000 for fluorescent bulbs.
Compared to a short-lived, low efficiency incandescent bulb, the economic consequence of using an LED bulb instead is estimated to be a modest ¥1.3/KWHR (US$0.02/KWHR) in higher cost. The incremental costs for LED to fluorescent or high-intensity discharge (HID) bulbs swaps are higher: ¥14.7/KWHR (US$0.19/KWHR) or US$0.22/KWHR), respectively. These higher costs should, we believe, be considered in context of the incremental costs of electricity from traditional and renewables electricity sources. In the case of the incandescent-LED swap, the incremental KWHR cost is less than the cost of electricity provided by any other form of electricity generation, traditional or renewable. The higher costs for fluorescent and HID bulb replacements with LED bulbs still compare favorably to renewables generation (wind and solar PV) electricity costs.

Disclaimer
49
DB Climate Change Advisors is the brand name for the institutional climate change investment division of Deutsche Asset Management, the asset management arm of Deutsche Bank AG. In the US, Deutsche Asset Management relates to the asset management activities of Deutsche Bank Trust Company Americas, Deutsche Investment Management Americas Inc. and DWS Trust Company; in Canada, Deutsche Investment Management Americas Inc., and Deutsche Asset Management Canada Limited (Deutsche Asset Management Canada Limited is a wholly owned subsidiary of Deutsche Investment Management Americas Inc); in Germany and Luxembourg: DWS Investment GmbH, DWS Investment S.A., DWS Finanz-Service GmbH, Deutsche Asset Management Investmentgesellschaft GmbH, and Deutsche Asset Management International GmbH; in Australia, Deutsche Asset Management (Australia) Limited (ABN 63 116 232 154) Australian financial services license holder; in Hong Kong, Deutsche Asset Management (Hong Kong) Limited; in Japan, Deutsche Asset Management Limited (Japan); in Singapore, Deutsche Asset Management (Asia) Limited (Company Reg. No. 198701485N); in the United Kingdom, Deutsche Alternative Asset Management (UK) Limited, Deutsche Alternative Asset Management (Global) Limited, and Deutsche Asset Management (UK) Limited; in Denmark, Finland, Iceland, Norway and Sweden, Deutsche Asset Management (UK) Limited; in addition to other regional entities in the Deutsche Bank Group.
This material is intended for informational purposes only and it is not intended that it be relied on to make any investment decision. It does not constitute investment advice or a recommendation or an offer or solicitation and is not the basis for any contract to purchase or sell any security or other instrument, or for Deutsche Bank AG and its affiliates to enter into or arrange any type of transaction as a consequence of any information contained herein. Neither Deutsche Bank AG nor any of its affiliates, gives any warranty as to the accuracy, reliability or completeness of information which is contained in this document. Except insofar as liability under any statute cannot be excluded, no member of the Deutsche Bank Group, the Issuer or any officer, employee or associate of them accepts any liability (whether arising in contract, in tort or negligence or otherwise) for any error or omission in this document or for any resulting loss or damage whether direct, indirect, consequential or otherwise suffered by the recipient of this document or any other person. The views expressed in this document constitute Deutsche Bank AG or its affiliates’ judgment at the time of issue and are subject to change. This document is only for professional investors. This document was prepared without regard to the specific objectives, financial situation or needs of any particular person who may receive it. The value of shares/units and their derived income may fall as well as rise. Past performance or any prediction or forecast is not indicative of future results. No further distribution is allowed without prior written consent of the Issuer. The forecasts provided are based upon our opinion of the market as at this date and are subject to change, dependent on future changes in the market. Any prediction, projection or forecast on the economy, stock market, bond market or the economic trends of the markets is not necessarily indicative of the future or likely performance. For Investors in the United Kingdom Issued in the United Kingdom by Deutsche Asset Management (UK) Limited of One Appold Street, London, EC2A 2UU. Authorised and regulated by the Financial Services Authority. This document is a "non-retail communication" within the meaning of the FSA’s Rules and is directed only at persons satisfying the FSA’s client categorisation criteria for an eligible counterparty or a professional client. This document is not intended for and should not be relied upon by a retail client. When making an investment decision, potential investors should rely solely on the final documentation relating to the investment or service and not the information contained herein. The investments or services mentioned herein may not be appropriate for all investors and before entering into any transaction you should take steps to ensure that you fully understand the transaction and have made an independent assessment of the appropriateness of the transaction in the light of your own objectives and circumstances, including the possible risks and benefits of entering into such transaction. You should also consider seeking advice from your own advisers in making this assessment. If you decide to enter into a transaction with us you do so in reliance on your own judgment. For Investors in Australia In Australia, Issued by Deutsche Asset Management (Australia) Limited (ABN 63 116 232 154), holder of an Australian Financial Services License. This information is only available to persons who are professional, sophisticated, or wholesale investors under the Corporations Act. An investment with Deutsche Asset Management is not a deposit with or any other type of liability of Deutsche Bank AG ARBN 064 165 162, Deutsche Asset Management (Australia) Limited or any other member of the Deutsche Bank AG Group. The capital value of and performance of an investment with Deutsche Asset Management is not guaranteed by Deutsche Bank AG, Deutsche Asset Management (Australia) Limited or any other member of the Deutsche Bank Group. Deutsche Asset Management (Australia) Limited is not an Authorised Deposit taking institution under the Banking Act 1959 nor regulated by the Australian Prudential Authority. Investments are subject to investment risk, including possible delays in repayment and loss of income and principal invested. For Investors in Hong Kong Interests in the funds may not be offered or sold in Hong Kong or other jurisdictions, by means of an advertisement, invitation or any other document, other than to Professional Investors or in circumstances that do not constitute an offering to the public. This document is therefore for the use of Professional Investors only and as such, is not approved under the Securities and Futures Ordinance (SFO) or the Companies Ordinance and shall not be distributed to non-Professional Investors in Hong Kong or to anyone in any other jurisdiction in which such distribution is not authorised. For the purposes of this statement, a Professional investor is defined under the SFO. For Investors in MENA region This information has been provided to you by Deutsche Bank AG Dubai (DIFC) branch, an Authorised Firm regulated by the Dubai Financial Services Authority. It is solely directed at Market Counterparties or Professional Clients of Deutsche Bank AG Dubai (DIFC) branch, which meets the regulatory criteria as established by the Dubai Financial Services Authority and may not be delivered to or acted upon by any other person. I-024023-1.2 Copyright © 2011 Deutsche Bank AG, Frankfurt am Main


![LP%HUHLFK%UDQGVFKXW]XQG5LVLNRPHWKRGHQ · 5htxlvlwlrq,' 3ohdvhdsso\gluhfwo\rqrxuzhevlwhrqzzz gqyjo frp fduhhuv zzz gqyjo frp safer, smarter, greener $xijdehqehuhlfk 0lwduehlwehlghu3odqxqj](https://static.fdocument.pub/doc/165x107/6085c02e8c40a33a890b9d44/lphuhlfkudqgvfkxw-5htxlvlwlrq-3ohdvhdssogluhfworqrxuzhevlwhrqzzz-gqyjo-frp.jpg)