Is North America Coming of Age as NAFTA Turns 21? A Mexican Perspective Pedro Noyola April, 2015.
27
Is North America Coming of Age as NAFTA Turns 21? A Mexican Perspective Pedro Noyola April, 2015
-
Upload
harold-dorsey -
Category
Documents
-
view
217 -
download
0
Transcript of Is North America Coming of Age as NAFTA Turns 21? A Mexican Perspective Pedro Noyola April, 2015.
Is North America Coming of Age as NAFTA Turns 21?
A Mexican Perspective
Pedro NoyolaApril, 2015
Index
2
A. Openness
B. Integration and Competitiveness
C. Competition and Transparency
D. The Future: A Dual Agenda
3
A. Openness
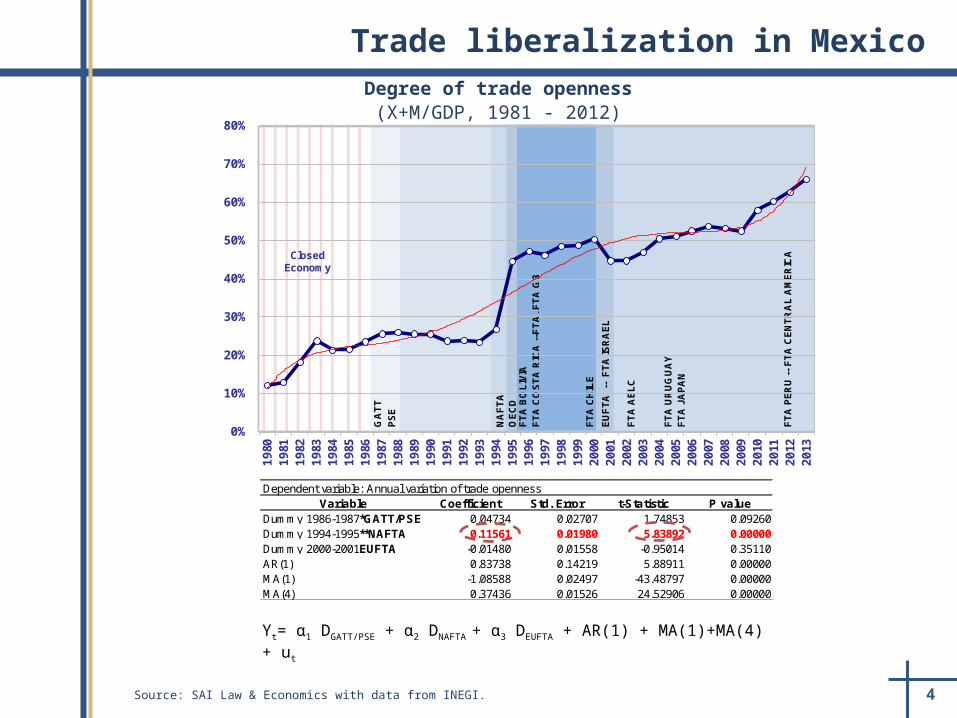
4Source: SAI Law & Economics with data from INEGI.
Trade liberalization in Mexico Degree of trade openness
(X+M/GDP, 1981 - 2012)
Yt= α1 DGATT/PSE + α2 DNAFTA + α3 DEUFTA + AR(1) + MA(1)+MA(4) + ut
Dependent variable: Annual variation of trade opennessVariable Coefficient Std. Error t-Statistic P value
Dummy 1986-1987*GATT/PSE 0.04734 0.02707 1.74853 0.09260Dummy 1994-1995**NAFTA 0.11561 0.01980 5.83892 0.00000Dummy 2000-2001EUFTA -0.01480 0.01558 -0.95014 0.35110AR(1) 0.83738 0.14219 5.88911 0.00000MA(1) -1.08588 0.02497 -43.48797 0.00000MA(4) 0.37436 0.01526 24.52906 0.00000
GA
TT
NA
FT
AO
EC
DF
TA
BO
LIV
IAF
TA
CO
ST
A R
ICA
--F
TA
, FT
A G
3
FT
A U
RU
GU
AY
F
TA
JA
PA
N
PS
E
FT
A P
ER
U -
- F
TA
CE
NT
RA
L A
ME
RIC
A
FT
A C
HIL
E
EU
FT
A -
- F
TA
ISR
AE
L
FT
A A
EL
C
0%
10%
20%
30%
40%
50%
60%
70%
80%
19
801
981
19
821
983
19
841
985
19
861
987
19
881
989
19
901
991
19
921
993
19
941
995
19
961
997
19
981
999
20
002
001
20
022
003
20
042
005
20
062
007
20
082
009
20
102
011
20
122
013
Closed Economy
5
B. Integration and Competitiveness
6
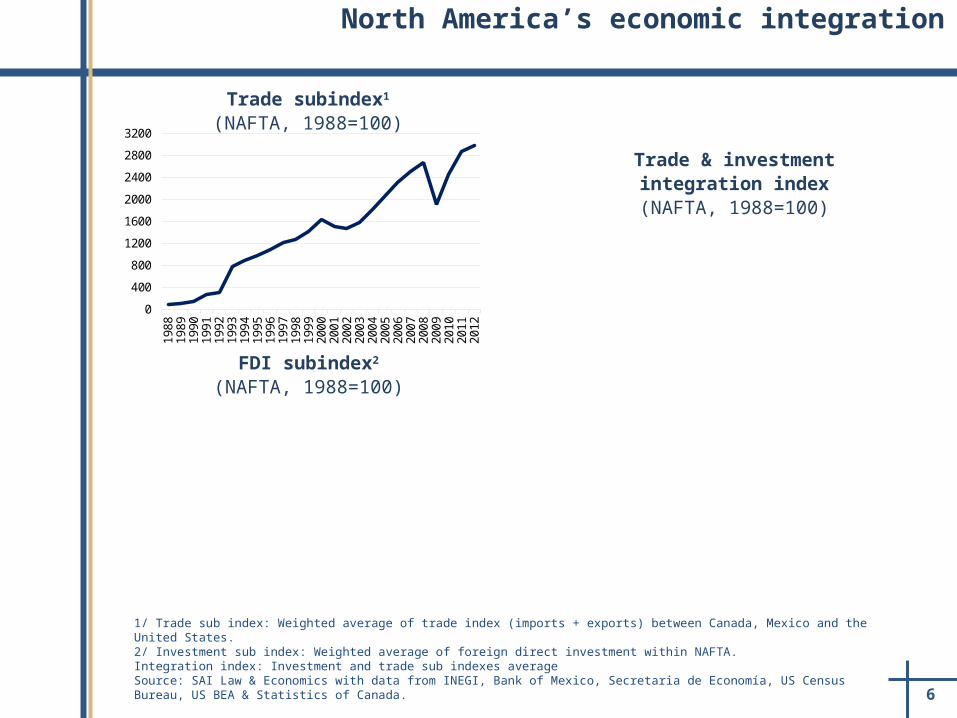
1/ Trade sub index: Weighted average of trade index (imports + exports) between Canada, Mexico and the United States.2/ Investment sub index: Weighted average of foreign direct investment within NAFTA.Integration index: Investment and trade sub indexes average Source: SAI Law & Economics with data from INEGI, Bank of Mexico, Secretaria de Economía, US Census Bureau, US BEA & Statistics of Canada.
Trade subindex1
(NAFTA, 1988=100)
FDI subindex2
(NAFTA, 1988=100)
Trade & investment integration index
(NAFTA, 1988=100)
North America’s economic integration
0
400
800
1200
1600
2000
2400
2800
3200
198
819
89
199
019
91
199
219
93
199
419
95
199
619
97
199
819
99
200
020
01
200
220
03
200
420
05
200
620
07
200
820
09
201
020
11
201
2
China's entry to WTO9/11 Terrorist attack
NAFTA LehmanBrothers Crisis
0
200
400
600
800
1000
1200
1400
1600
1800
1988
1989
1990
1991
1992
1993
1994
1995
1996
1997
1998
1999
2000
2001
2002
2003
2004
2005
2006
2007
2008
2009
2010
2011
China's entry to WTO9/11 Terrorist attack
NAFTA
LehmanBrothers Crisis
050
100150200250300350400450500550
1988
1989
1990
1991
1992
1993
1994
1995
1996
1997
1998
1999
2000
2001
2002
2003
2004
2005
2006
2007
2008
2009
2010
2011
China's entry toWTO9/11 Terroristattack
NAFTA
LehmanBrothers Crisis
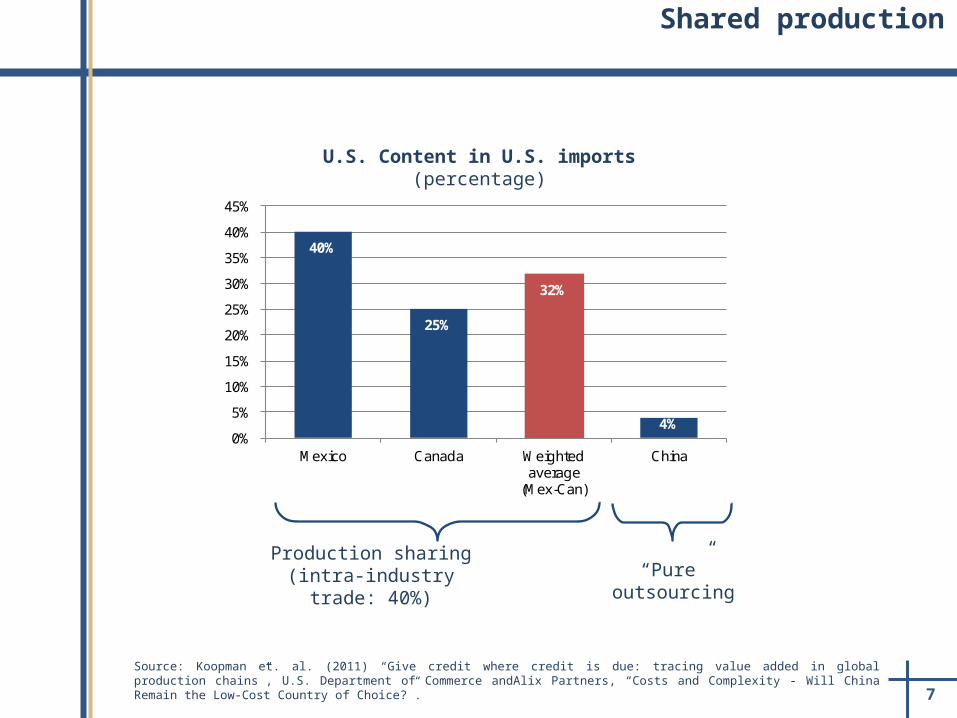
7Source: Koopman et. al. (2011) “Give credit where credit is due: tracing value added in global production chains”, U.S. Department of Commerce andAlix Partners, “Costs and Complexity - Will China Remain the Low-Cost Country of Choice?”.
Shared production
40%
25%
32%
4%0%
5%
10%
15%
20%
25%
30%
35%
40%
45%
Mexico Canada Weighted average
(Mex-Can)
China
“Pure”outsourcing
U.S. Content in U.S. imports(percentage)
Production sharing(intra-industry trade: 40%)
0%
10%
20%
30%
40%
50%
60%
70%
80%
Aug
-93
Apr
-94
Dec
-94
Aug
-95
Apr
-96
Dec
-96
Aug
-97
Apr
-98
Dec
-98
Aug
-99
Apr
-00
Dec
-00
Aug
-01
Apr
-02
Dec
-02
Aug
-03
Apr
-04
Dec
-04
Aug
-05
Apr
-06
Dec
-06
Aug
-07
Apr
-08
Dec
-08
Aug
-09
Apr
-10
Dec
-10
Aug
-11
Apr
-12
Dec
-12
Aug
-13
Mexico
US
Canada
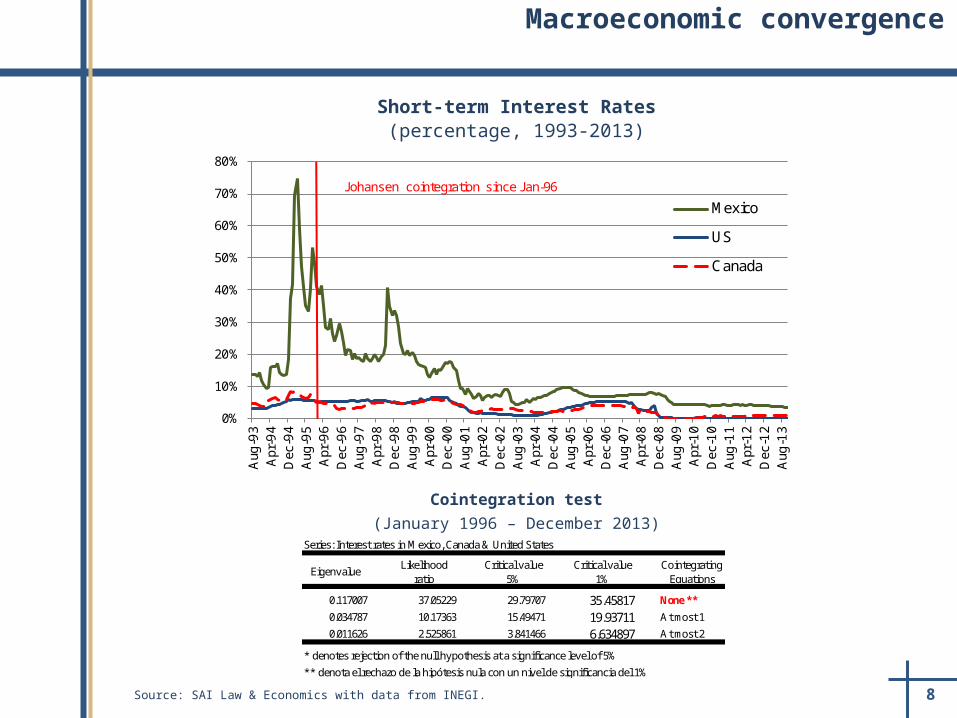
Johansen cointegration since Jan-96
8Source: SAI Law & Economics with data from INEGI.
Cointegration test
(January 1996 – December 2013)
Short-term Interest Rates(percentage, 1993-2013)
Macroeconomic convergence
Series: Interest rates in Mexico, Canada & United States
EigenvalueLikelihood
ratioCritical value
5%Critical value
1%Cointegrating
Equations
0.117007 37.05229 29.79707 35.45817 None **
0.034787 10.17363 15.49471 19.93711 At most 1
0.011626 2.525861 3.841466 6.634897 At most 2
* denotes rejection of the null hypothesis at a significance level of 5%
** denota el rechazo de la hipótesis nula con un nivel de significancia del 1%
-5%0%5%
10%15%20%25%30%35%40%45%50%55%
Aug
-93
Sep
-94
Oct
-95
Dec
-96
Jan-
98
Fe
b-9
9
Apr
-00
Ma
y-01
Jun-
02
Aug
-03
Sep
-04
Oct
-05
Dec
-06
Jan-
08
Fe
b-0
9
Apr
-10
Ma
y-11
Jun-
12
Aug
-13
Mexico
US
Canada
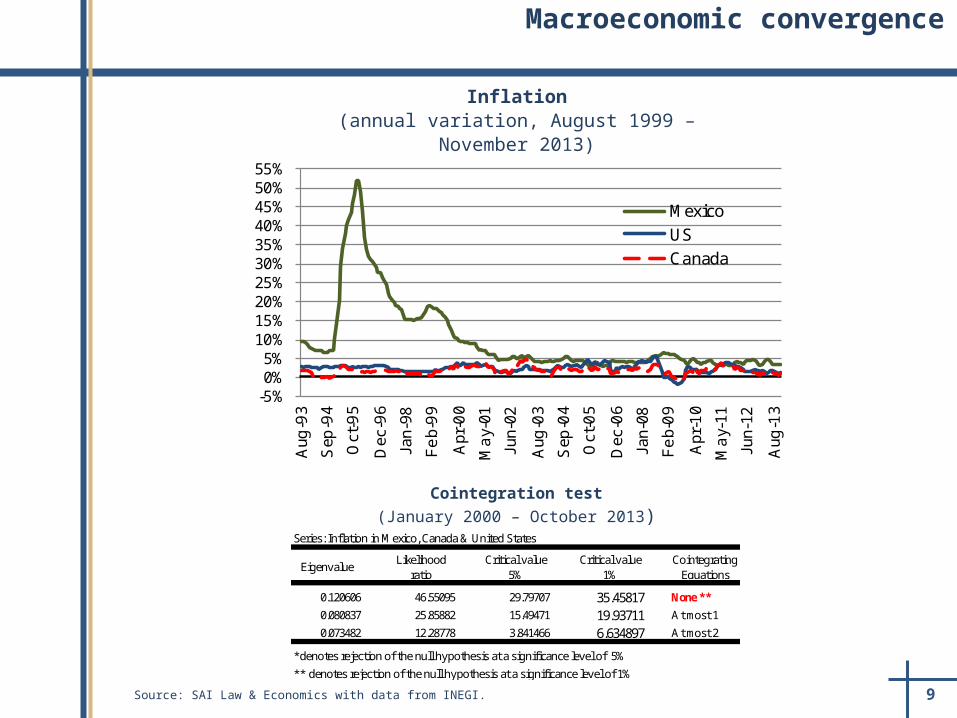
9Source: SAI Law & Economics with data from INEGI.
Cointegration test
(January 2000 – October 2013)
Inflation(annual variation, August 1999 – November 2013)
Macroeconomic convergence
Series: Inflation in Mexico, Canada & United States
EigenvalueLikelihood
ratioCritical value
5%Critical value
1%Cointegrating
Equations
0.120606 46.55095 29.79707 35.45817 None **
0.080837 25.85882 15.49471 19.93711 At most 1
0.073482 12.28778 3.841466 6.634897 At most 2
*denotes rejection of the null hypothesis at a significance level of 5%
** denotes rejection of the null hypothesis at a significance level of 1%
10
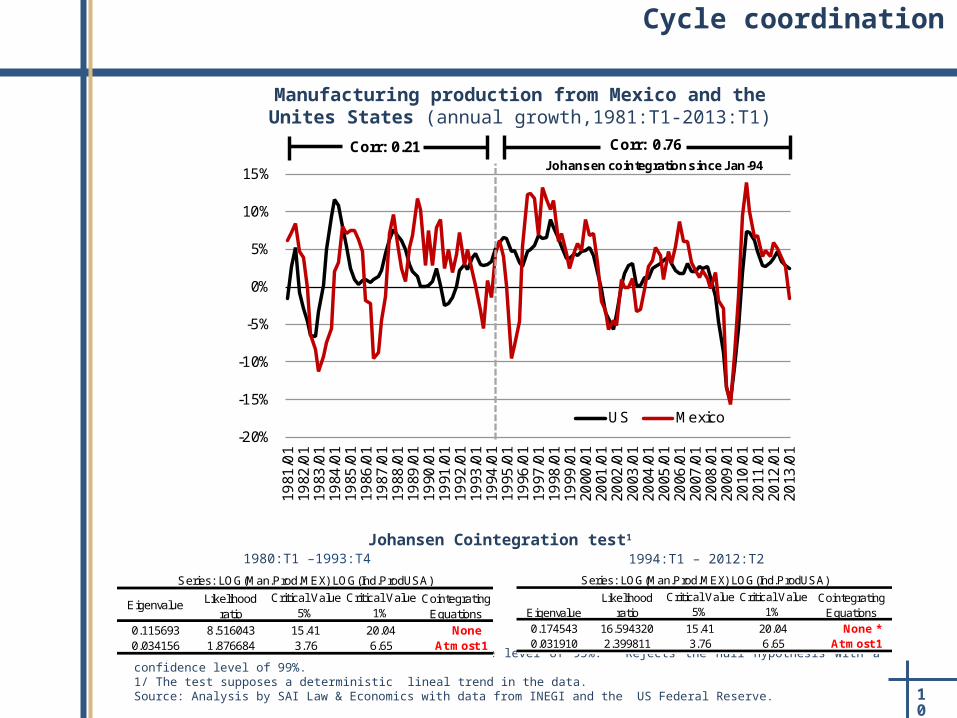
* Rejects the null hypothesis with a confidence level of 95%. **Rejects the null hypothesis with a confidence level of 99%.1/ The test supposes a deterministic lineal trend in the data.Source: Analysis by SAI Law & Economics with data from INEGI and the US Federal Reserve.
Manufacturing production from Mexico and the Unites States (annual growth,1981:T1-2013:T1)
Johansen Cointegration test1
1994:T1 – 2012:T21980:T1 –1993:T4
-20%
-15%
-10%
-5%
0%
5%
10%
15%
1981
/01
1982
/01
1983
/01
1984
/01
1985
/01
1986
/01
1987
/01
1988
/01
1989
/01
1990
/01
1991
/01
1992
/01
1993
/01
1994
/01
1995
/01
1996
/01
1997
/01
1998
/01
1999
/01
2000
/01
2001
/01
2002
/01
2003
/01
2004
/01
2005
/01
2006
/01
2007
/01
2008
/01
2009
/01
2010
/01
2011
/01
2012
/01
2013
/01
US Mexico
Corr: 0.21 Corr: 0.76Johansen cointegration since Jan-94
Cycle coordination
Critical Value Critical Value5% 1%
0.115693 8.516043 15.41 20.04 None0.034156 1.876684 3.76 6.65 At most 1
Series: LOG(Man.Prod.MEX) LOG(Ind.ProdUSA)
Likelihood ratio
Cointegrating Equations
EigenvalueCritical Value Critical Value
5% 1%
0.174543 16.594320 15.41 20.04 None *0.031910 2.399811 3.76 6.65 At most 1
Eigenvalue
Series: LOG(Man.Prod.MEX) LOG(Ind.ProdUSA)
Likelihood ratio
Cointegrating Equations
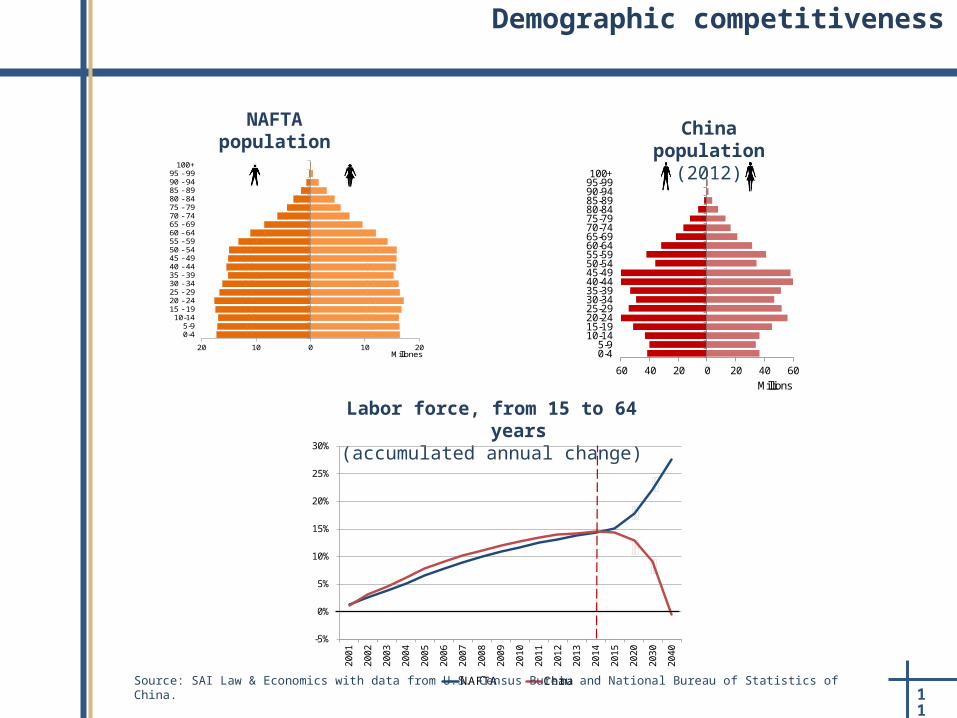
Labor force, from 15 to 64 years(accumulated annual change)
60 40 20 0 20 40 60
0-45-9
10-1415-1920-2425-2930-3435-3940-4445-4950-5455-5960-6465-6970-7475-7980-8485-8990-9495-99100+
Millions
NAFTA population(2012)
China population(2012)
-5%
0%
5%
10%
15%
20%
25%
30%
20
01
20
02
20
03
20
04
20
05
20
06
20
07
20
08
20
09
20
10
20
11
20
12
20
13
20
14
20
15
20
20
20
30
20
40
NAFTA ChinaSource: SAI Law & Economics with data from U.S. Census Bureau and National Bureau of Statistics of China. 11
Demographic competitiveness
20 10 0 10 20
0-45-9
10-1415 - 1920 - 2425 - 2930 - 3435 - 3940 - 4445 - 4950 - 5455 - 5960 - 6465 - 6970 - 7475 - 7980 - 8485 - 8990 - 9495 - 99
100+
Millones
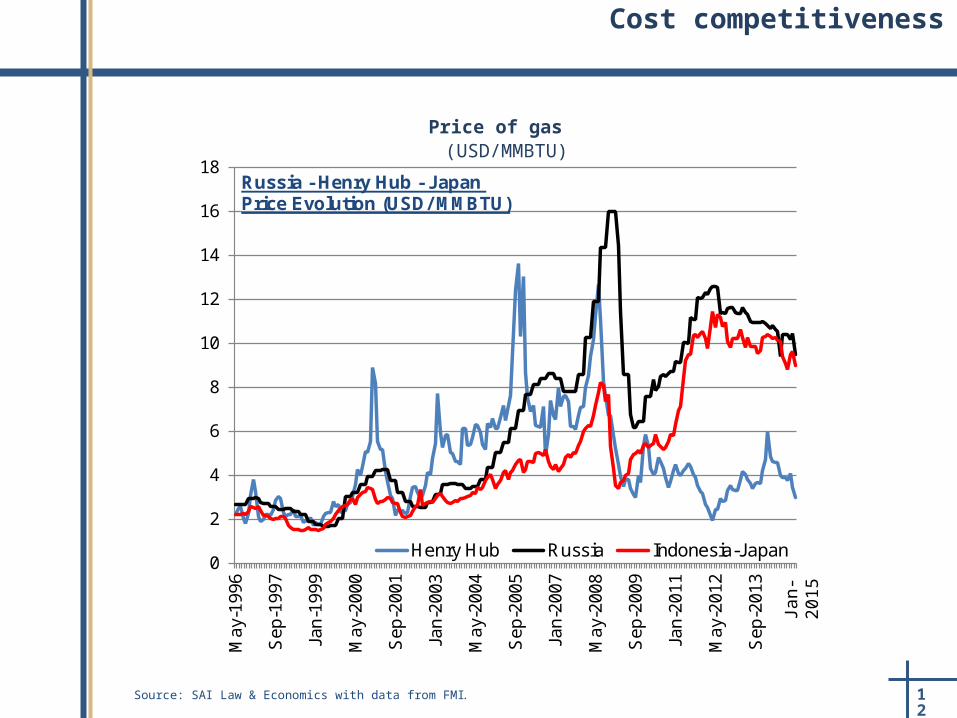
12Source: SAI Law & Economics with data from FMI.
Price of gas (USD/MMBTU)
Cost competitiveness
0
2
4
6
8
10
12
14
16
18
May
-199
6
Sep
-199
7
Jan-
1999
May
-200
0
Sep
-200
1
Jan-
2003
May
-200
4
Sep
-200
5
Jan-
2007
May
-200
8
Sep
-200
9
Jan-
2011
May
-201
2
Sep
-201
3
Ene
-201
5
Henry Hub Russia Indonesia-Japan
Russia - Henry Hub - Japan Price Evolution (USD/ MMBTU)
Jan-
2015
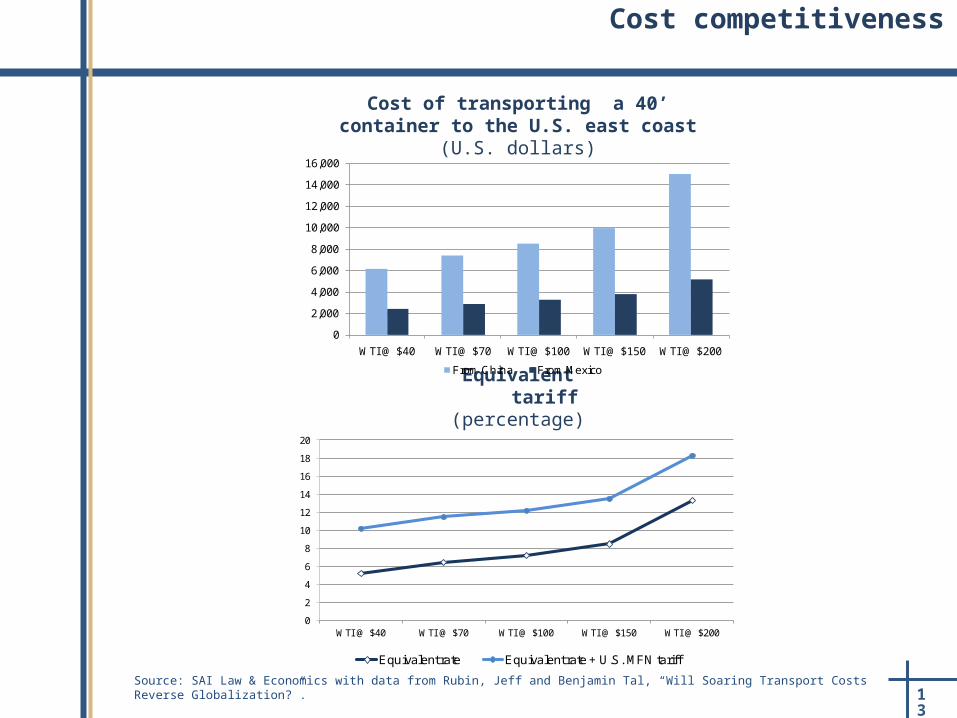
13Source: SAI Law & Economics with data from Rubin, Jeff and Benjamin Tal, “Will Soaring Transport Costs Reverse Globalization?”.
Equivalent tariff(percentage)
Cost of transporting a 40’ container to the U.S. east coast
(U.S. dollars)
0
2,000
4,000
6,000
8,000
10,000
12,000
14,000
16,000
WTI @ $40 WTI @ $70 WTI @ $100 WTI @ $150 WTI @ $200
From China From Mexico
0
2
4
6
8
10
12
14
16
18
20
WTI @ $40 WTI @ $70 WTI @ $100 WTI @ $150 WTI @ $200
Equivalent rate Equivalent rate + U.S. MFN tariff
Cost competitiveness
14Source: SAI Law & Economics with data from The International Energy Agency.
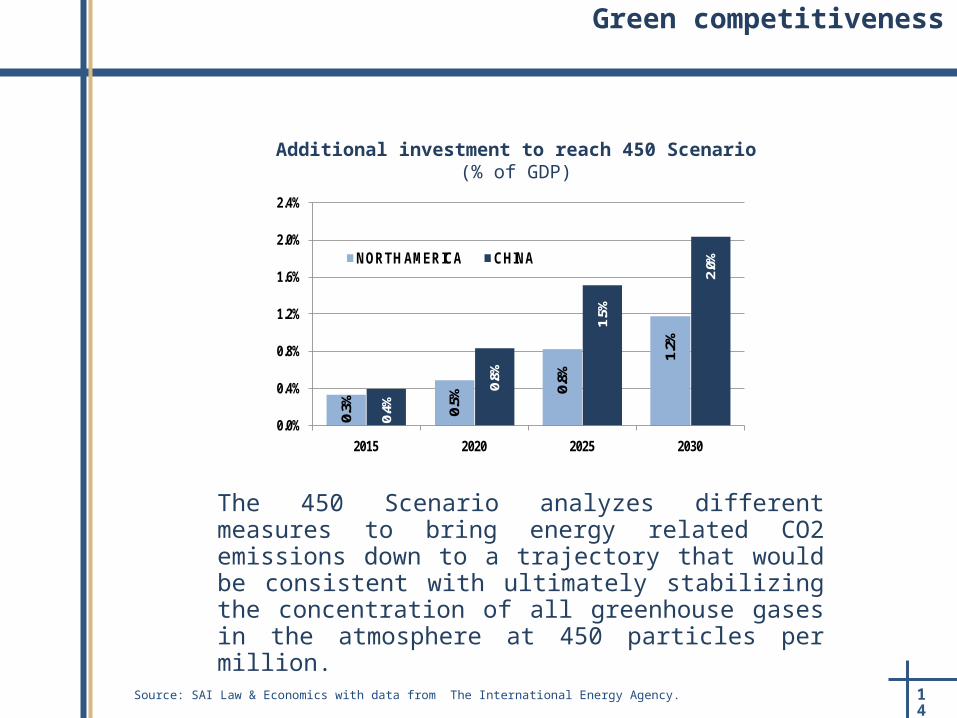
Additional investment to reach 450 Scenario(% of GDP)
The 450 Scenario analyzes different measures to bring energy related CO2 emissions down to a trajectory that would be consistent with ultimately stabilizing the concentration of all greenhouse gases in the atmosphere at 450 particles per million.
0.3% 0.5%
0.8%
1.2%
0.4%
0.8%
1.5%
2.0%
0.0%
0.4%
0.8%
1.2%
1.6%
2.0%
2.4%
2015 2020 2025 2030
NORTH AMERICA CHINA
Green competitiveness
15
C. Competition and Transparency
16
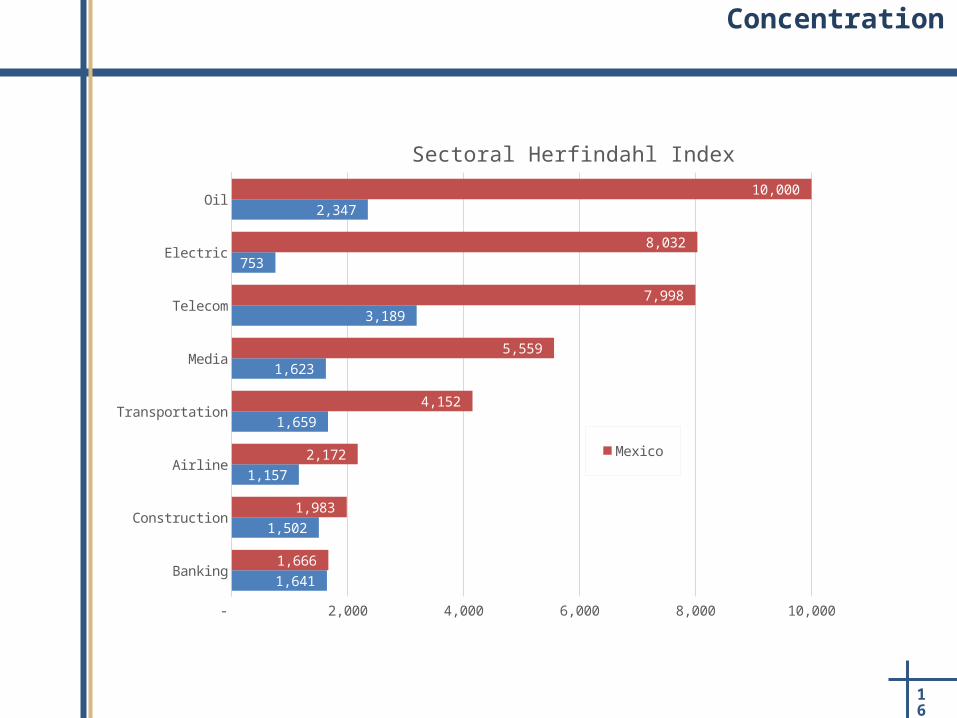
Concentration
Banking
Construction
Airline
Transportation
Media
Telecom
Electric
Oil
- 2,000 4,000 6,000 8,000 10,000
1,641
1,502
1,157
1,659
1,623
3,189
753
2,347
1,666
1,983
2,172
4,152
5,559
7,998
8,032
10,000
Sectoral Herfindahl Index
Mexico
United Sates
17
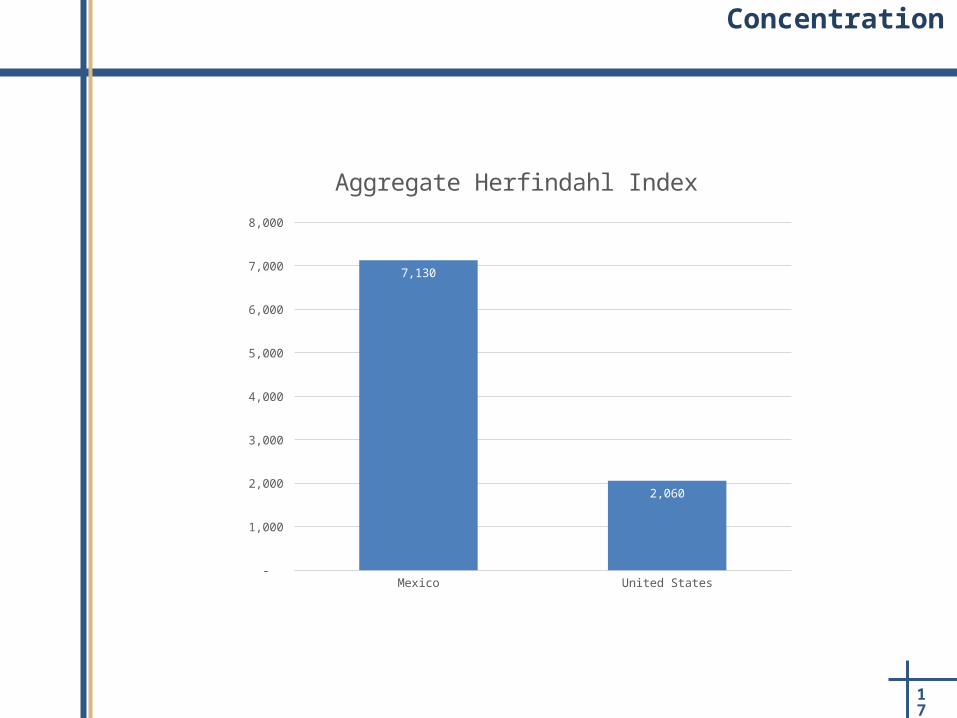
Concentration
Mexico United States -
1,000
2,000
3,000
4,000
5,000
6,000
7,000
8,000
7,130
2,060
Aggregate Herfindahl Index
18
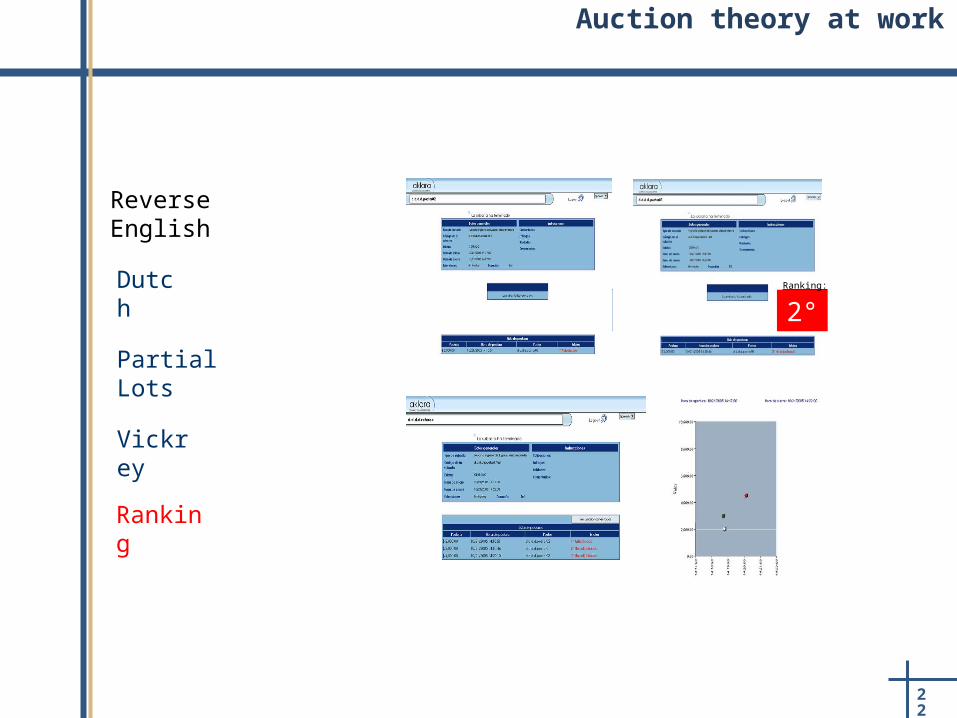
Dutch
Partial Lots
Vickrey
Ranking
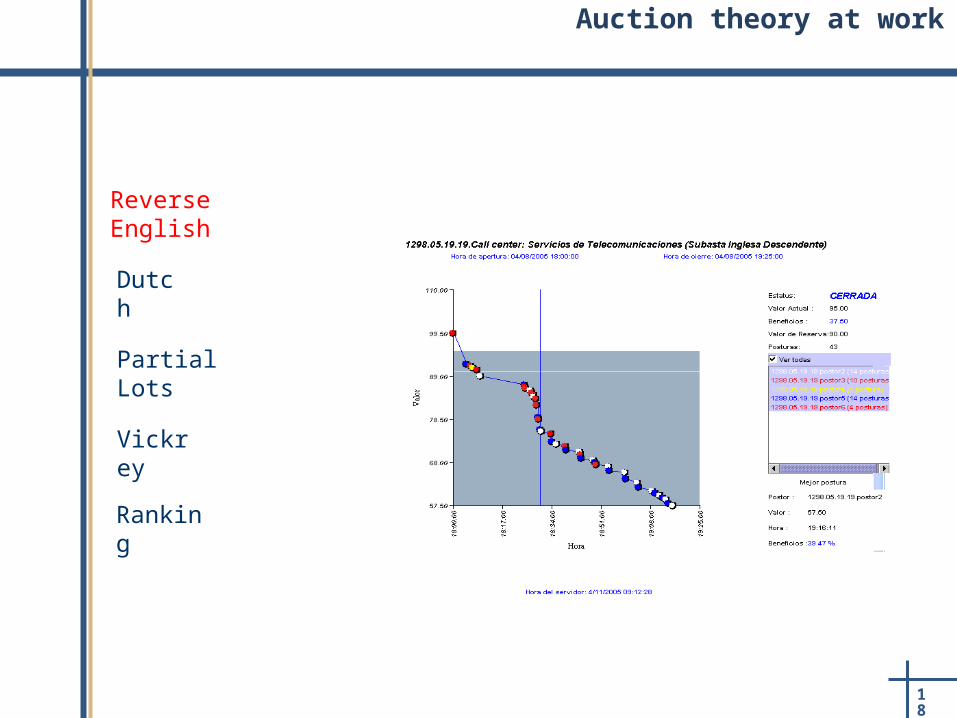
Reverse English
Auction theory at work
19
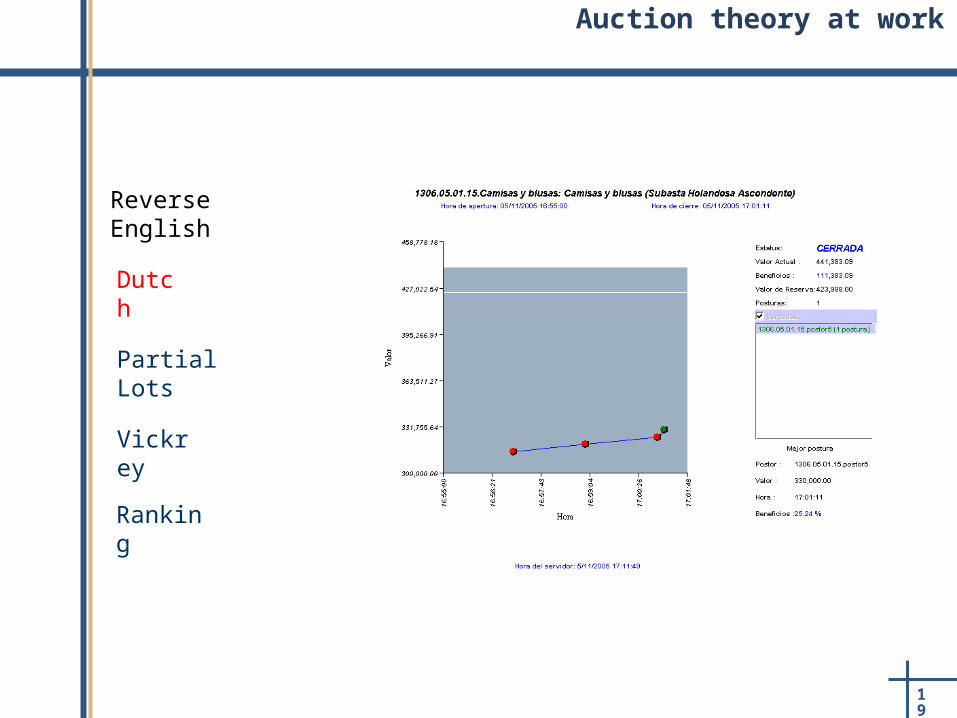
Auction theory at work
Dutch
Partial Lots
Vickrey
Ranking
Reverse English
20
Dutch
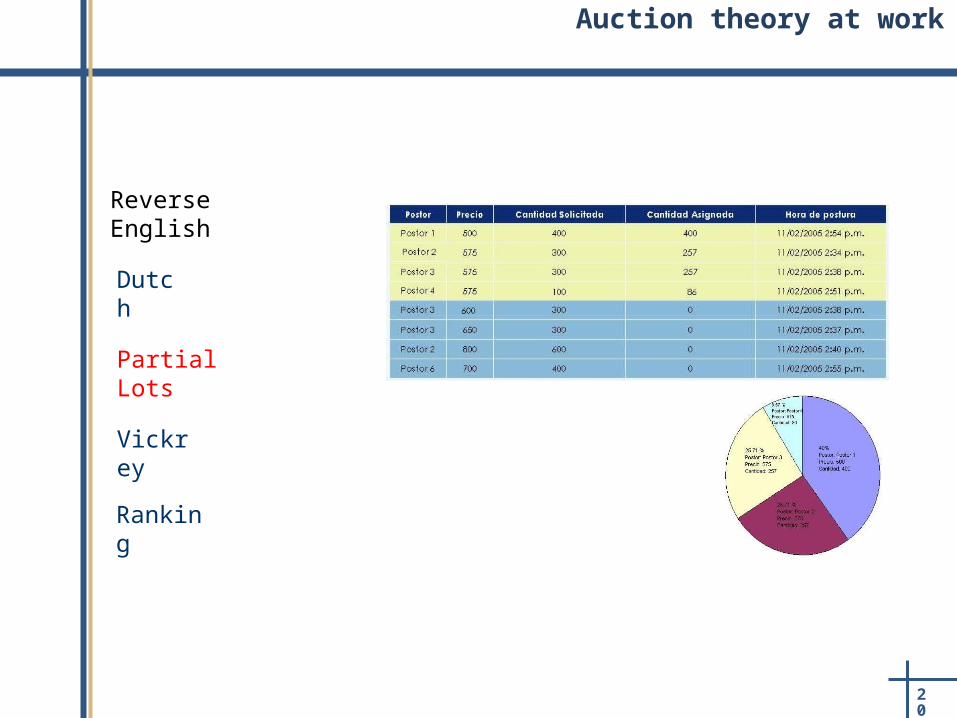
Partial Lots
Vickrey
Ranking
Reverse English
Auction theory at work
21
Dutch
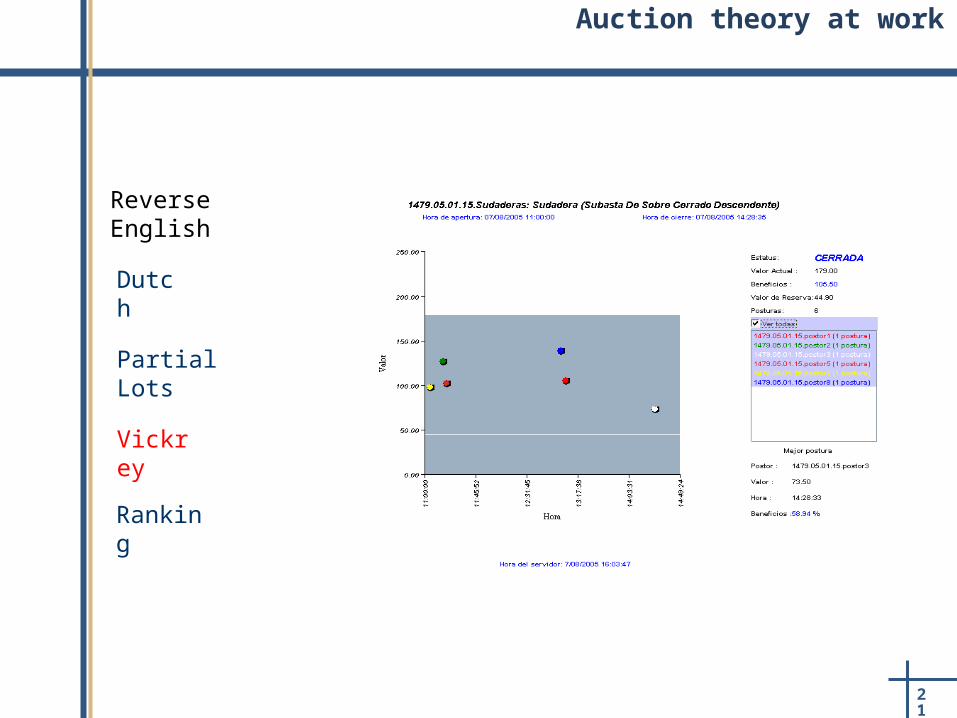
Partial Lots
Vickrey
Ranking
Reverse English
Auction theory at work
22
Dutch
Partial Lots
Vickrey
Ranking
Reverse English
1°Ranking:
2°Ranking:
Auction theory at work
23
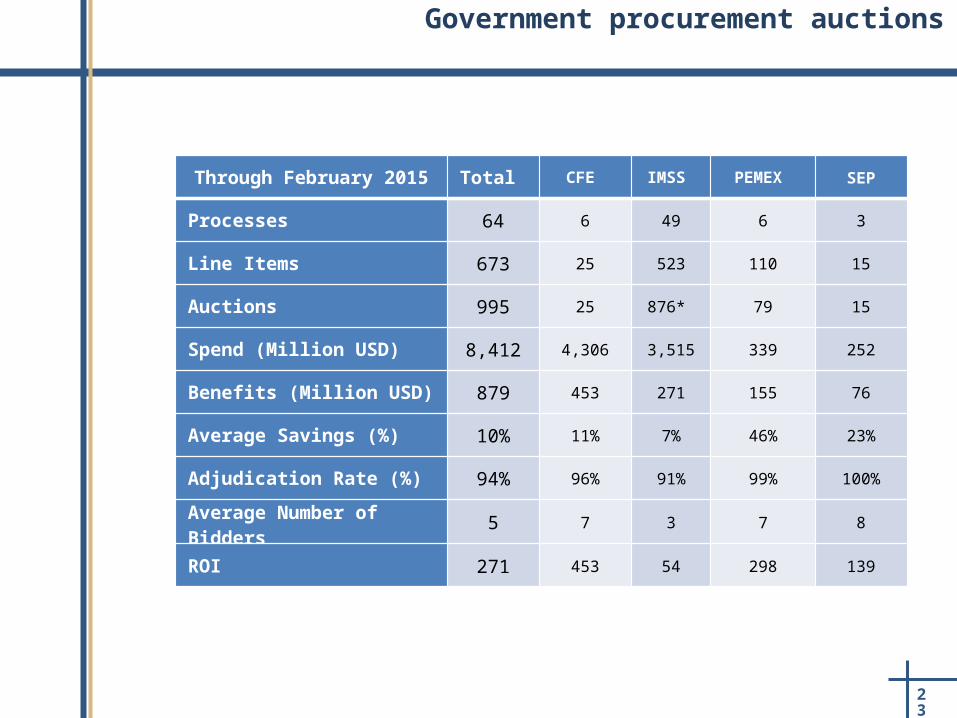
Government procurement auctions
Through February 2015 Total CFE IMSS PEMEX SEP
Processes 64 6 49 6 3
Line Items 673 25 523 110 15
Auctions 995 25 876* 79 15
Spend (Million USD) 8,412 4,306 3,515 339 252
Benefits (Million USD) 879 453 271 155 76
Average Savings (%) 10% 11% 7% 46% 23%
Adjudication Rate (%) 94% 96% 91% 99% 100%
Average Number of Bidders 5 7 3 7 8
ROI 271 453 54 298 139
24
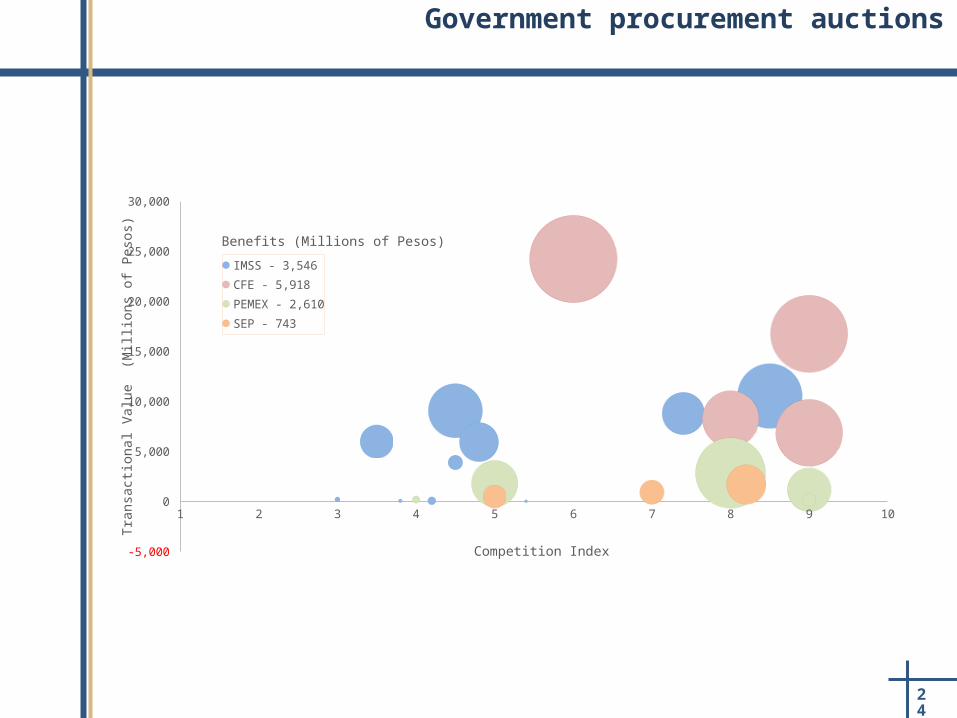
Government procurement auctions
1 2 3 4 5 6 7 8 9 10
-5,000
0
5,000
10,000
15,000
20,000
25,000
30,000
Benefits (Millions of Pesos)
IMSS - 3,546
CFE - 5,918
PEMEX - 2,610
SEP - 743
Competition Index
Tran
sacti
onal
Val
ue (
Mill
ions
of P
esos
)
25
D. The Future: A Dual Agenda
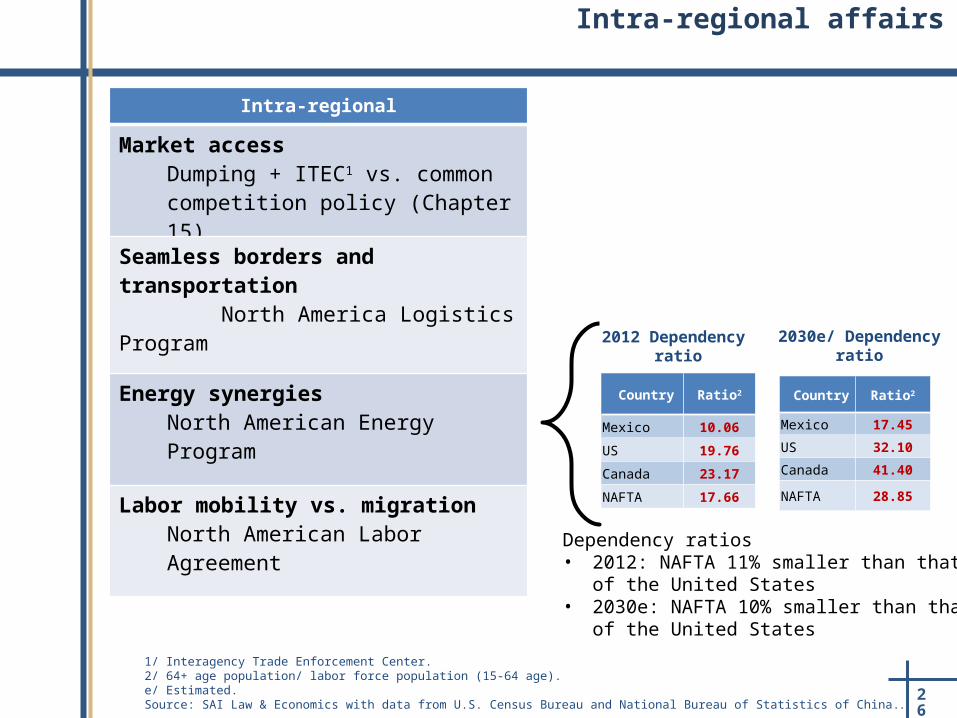
1/ Interagency Trade Enforcement Center.2/ 64+ age population/ labor force population (15-64 age).e/ Estimated.Source: SAI Law & Economics with data from U.S. Census Bureau and National Bureau of Statistics of China..
Intra-regional affairs
Intra-regional
Market accessDumping + ITEC1 vs. common competition policy (Chapter 15)
Seamless borders and transportation North America Logistics Program
Energy synergiesNorth American Energy Program
Labor mobility vs. migrationNorth American Labor Agreement
26
Country Ratio2
Mexico 10.06
US 19.76
Canada 23.17
NAFTA 17.66
2012 Dependency ratio
Country Ratio2
Mexico 17.45
US 32.10
Canada 41.40
NAFTA 28.85
2030e/ Dependency ratio
Dependency ratios• 2012: NAFTA 11% smaller than that of the
United States• 2030e: NAFTA 10% smaller than that of the
United States
Extra-regional affairs
Extra-regional
TPPPreservation of NAFTA for trade and investment flows from North America
TTIPRegional negotiation v.s. convergence
27