
Ions in concentrated electrolytes: from the screening ...
28
Ions in concentrated electrolytes: from the screening length to energy storage Alpha Lee Department of Physics, University of Cambridge [email protected]
Transcript of Ions in concentrated electrolytes: from the screening ...
Ions in concentrated electrolytes: from the screening
length to energy storageAlpha Lee
Department of Physics, University of Cambridge [email protected]

The standard model
DLVO theory
lB =e2
✏kBT
�D = 1/p
4⇡lBc
�U(r) ⇠ Z2 lBre�r/�D
r
12
10
8
6
4
2
0
λ S (n
m)
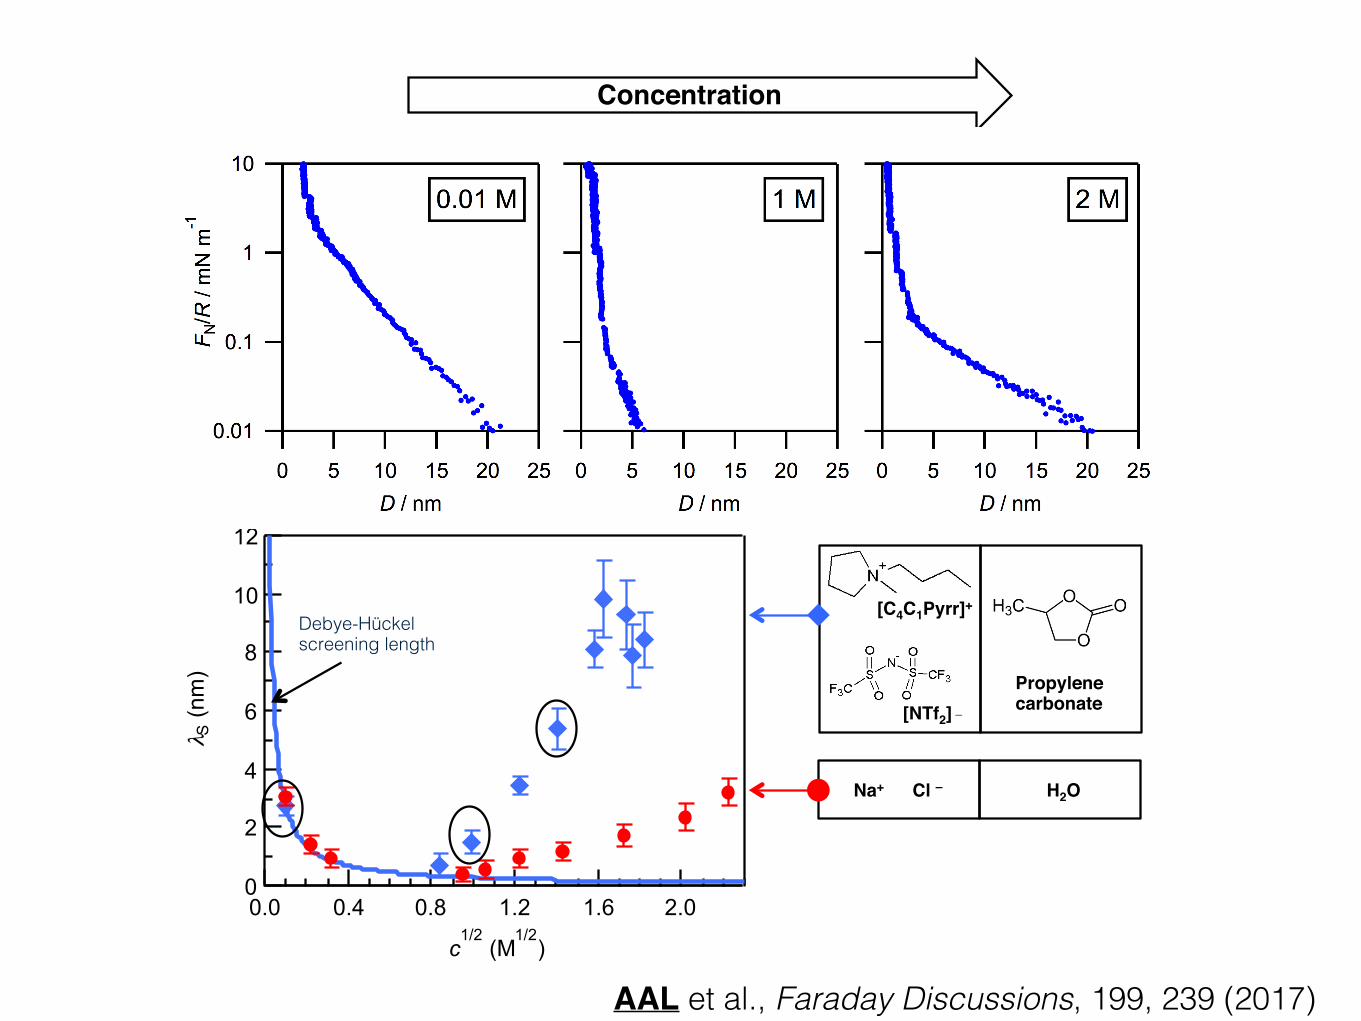
2.01.61.20.80.40.0
c1/2
(M1/2
)
Propylene carbonate
[C4C1Pyrr]+
[NTf2] _
Na+ Cl – H2O
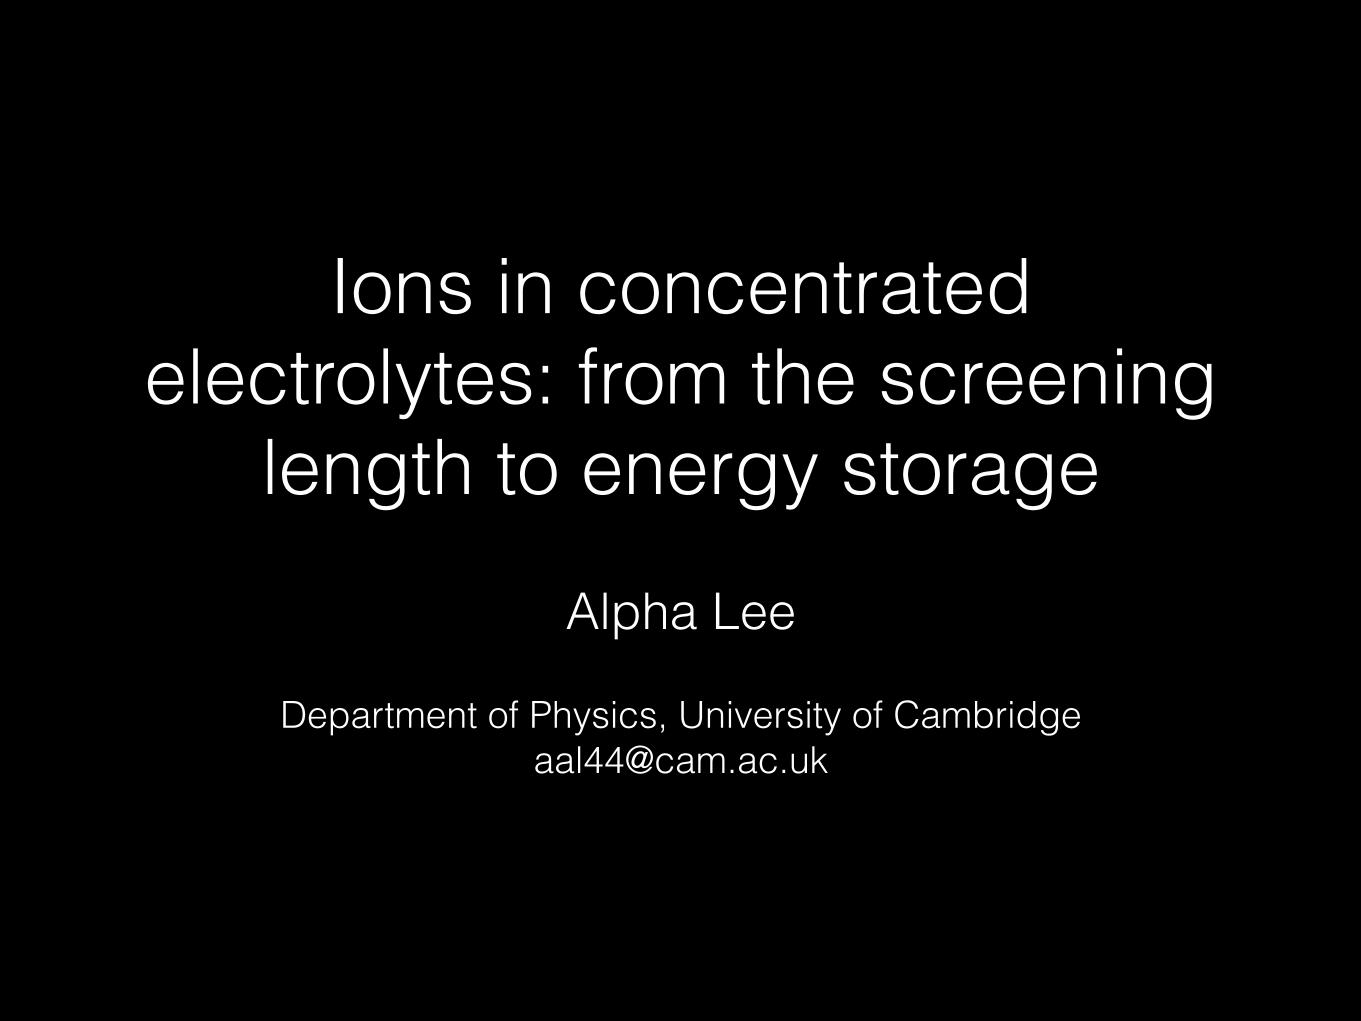
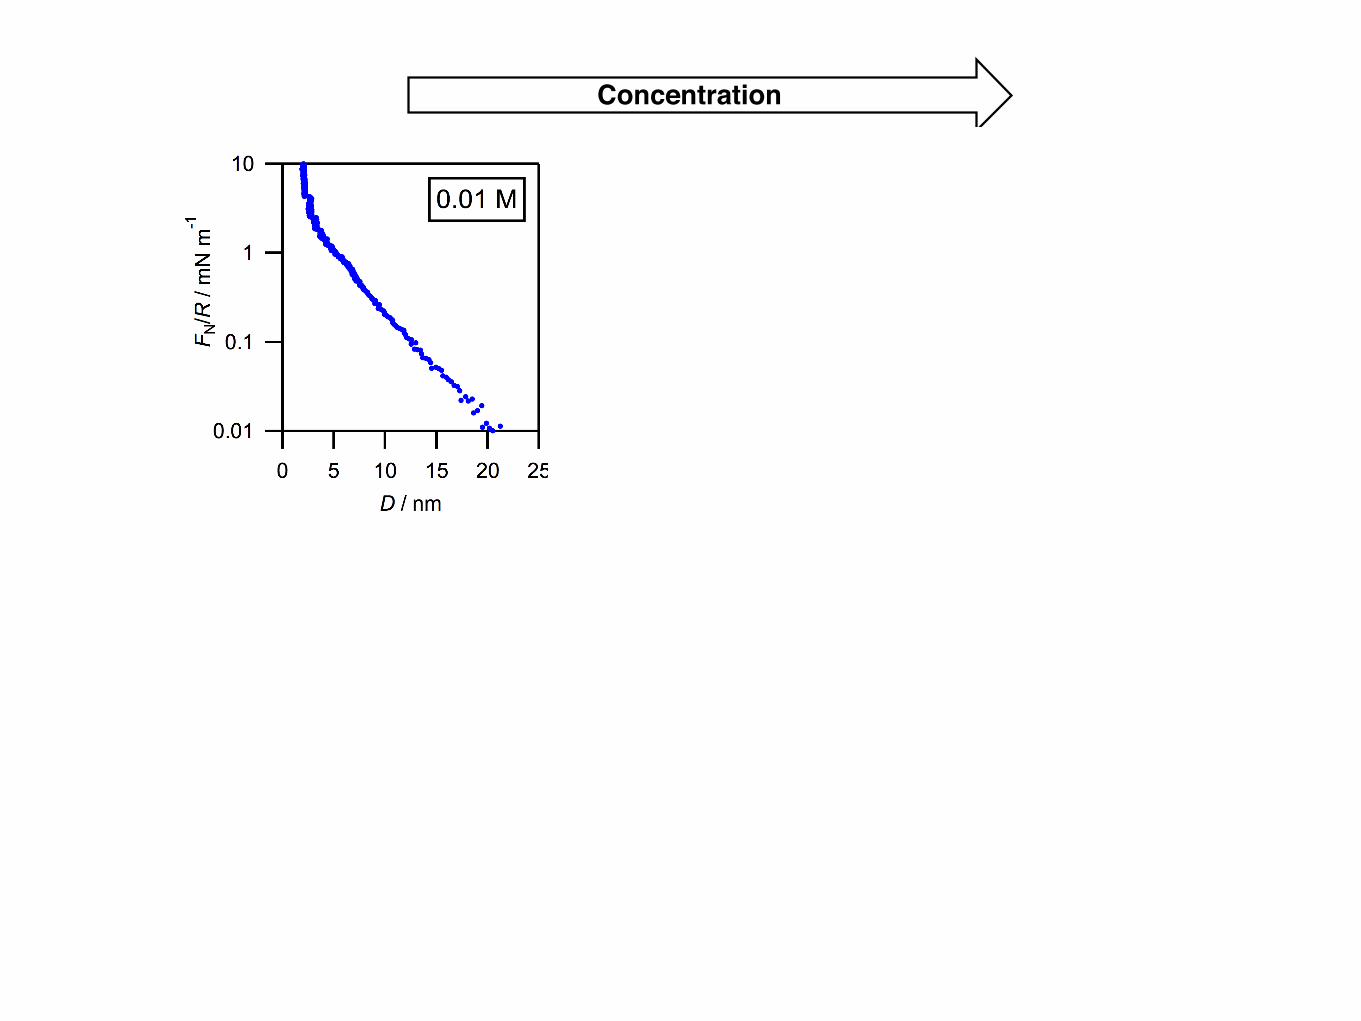
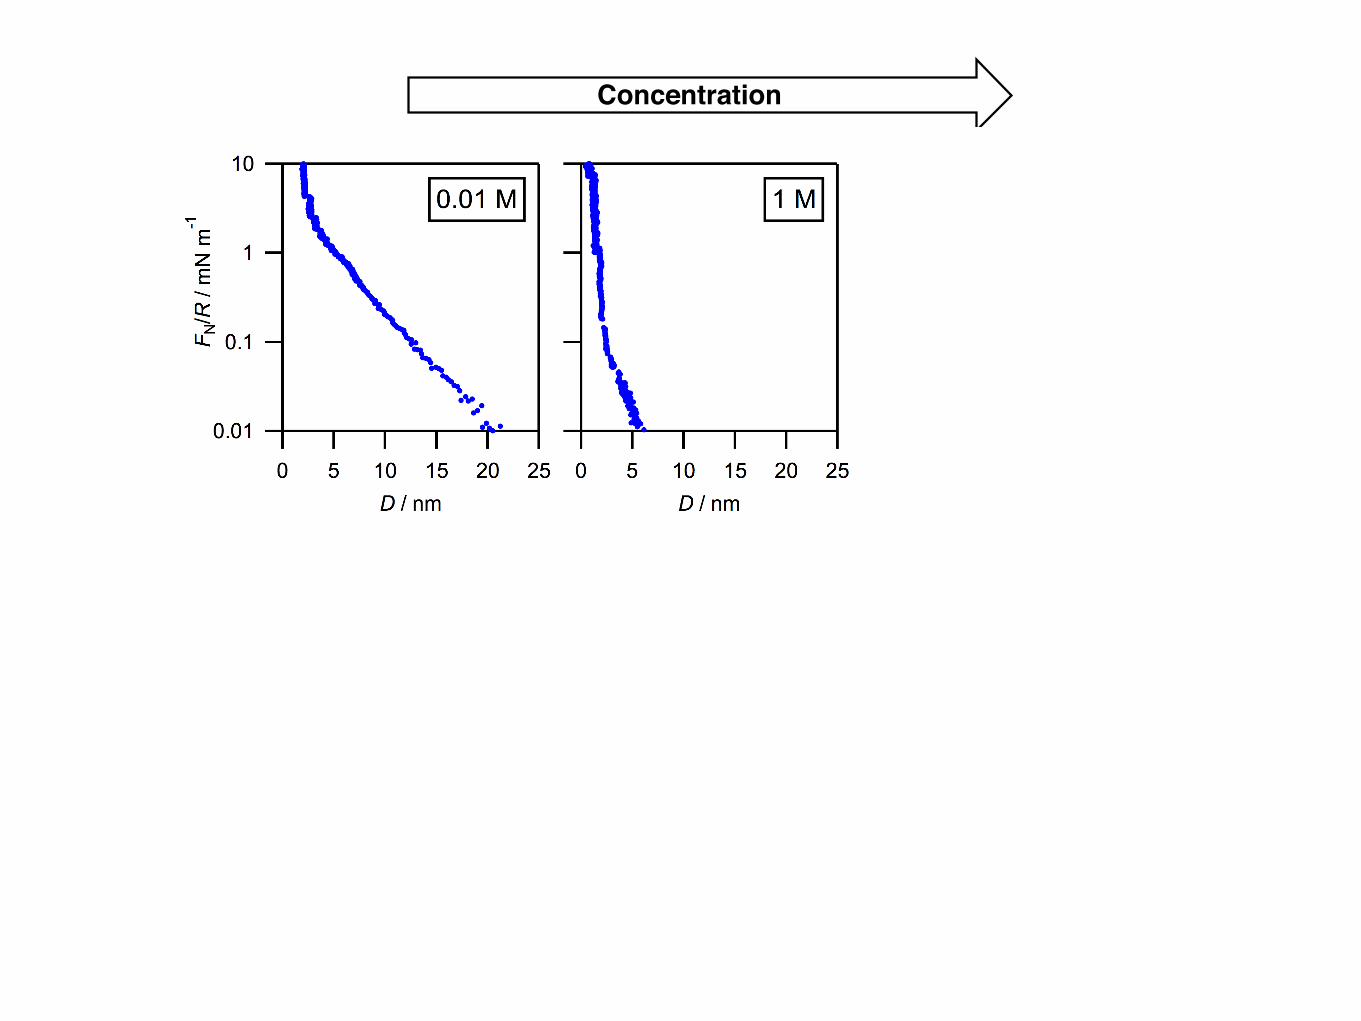
Debye-Hückel screening length!
Concentration
b
a
12
10
8
6
4
2
0
λ S (n
m)
2.01.61.20.80.40.0
c1/2
(M1/2
)
Propylene carbonate
[C4C1Pyrr]+
[NTf2] _
Na+ Cl – H2O
Debye-Hückel screening length!
Concentration
b
a
12
10
8
6
4
2
0
λ S (n
m)
2.01.61.20.80.40.0
c1/2
(M1/2
)
Propylene carbonate
[C4C1Pyrr]+
[NTf2] _
Na+ Cl – H2O
Debye-Hückel screening length!
Concentration
b
a
12
10
8
6
4
2
0
λ S (n
m)
2.01.61.20.80.40.0
c1/2
(M1/2
)
Propylene carbonate
[C4C1Pyrr]+
[NTf2] _
Na+ Cl – H2O
Debye-Hückel screening length!
Concentration
b
a
AAL et al., Faraday Discussions, 199, 239 (2017)

Dimensional analysisSalient length scales:
lB =e2
✏kBTBjerrum length
Debye length �D = 1/p
4⇡lBc
Ion diameter a
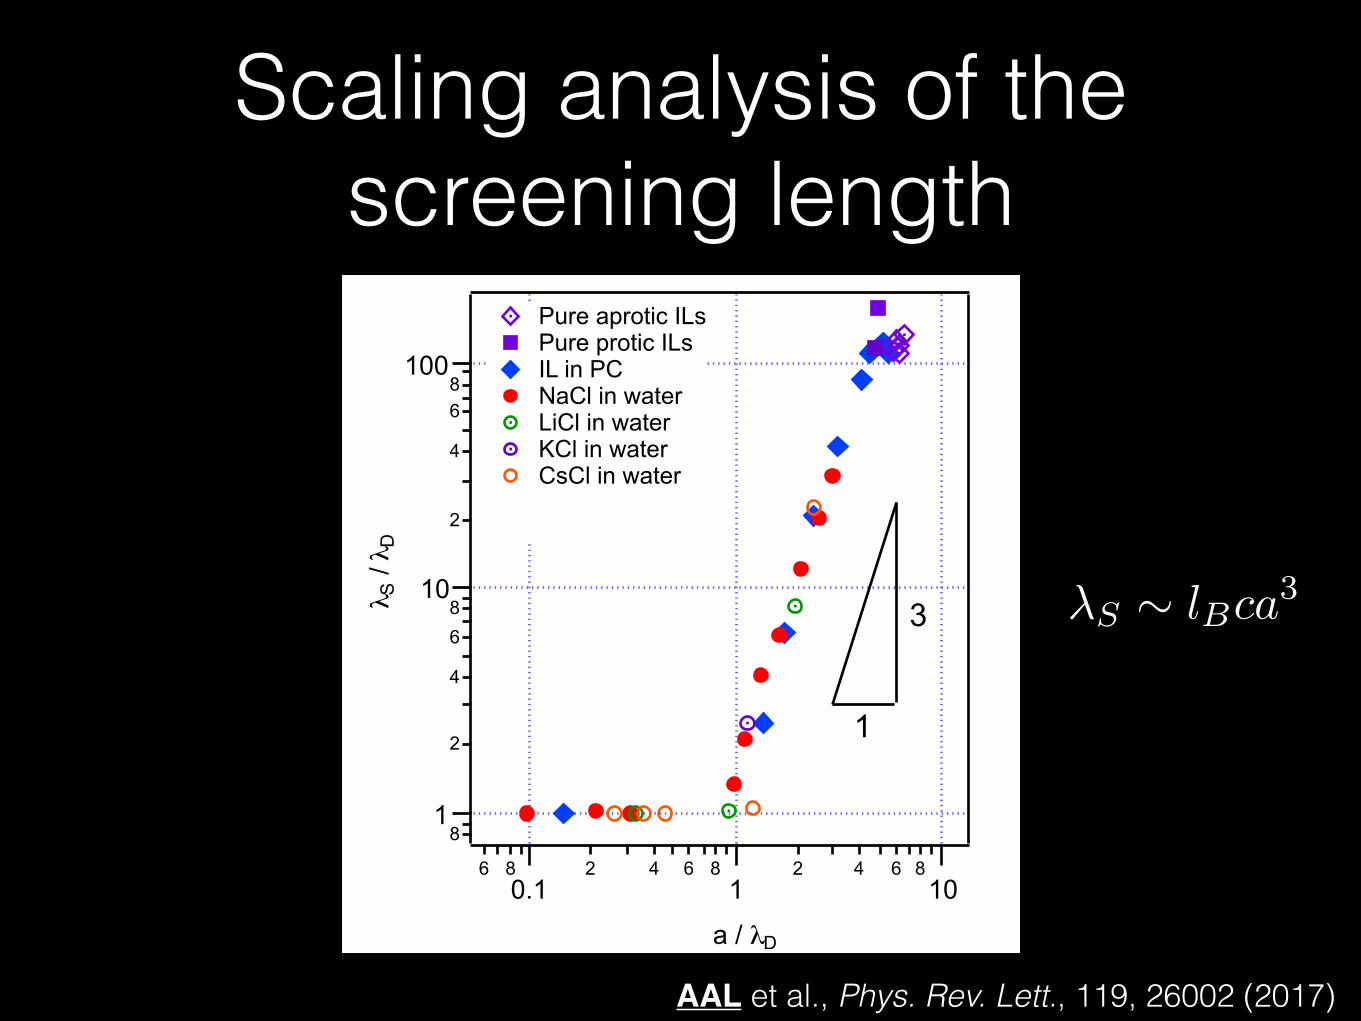
Scaling analysis of the screening length
81
2
4
6
810
2
4
68
100λ S
/ λ D
6 80.1
2 4 6 81
2 4 6 810
a / λD
1
3
Pure aprotic ILs Pure protic ILs IL in PC NaCl in water LiCl in water KCl in water CsCl in water
AAL et al., Phys. Rev. Lett., 119, 26002 (2017)
�S ⇠ lBca3
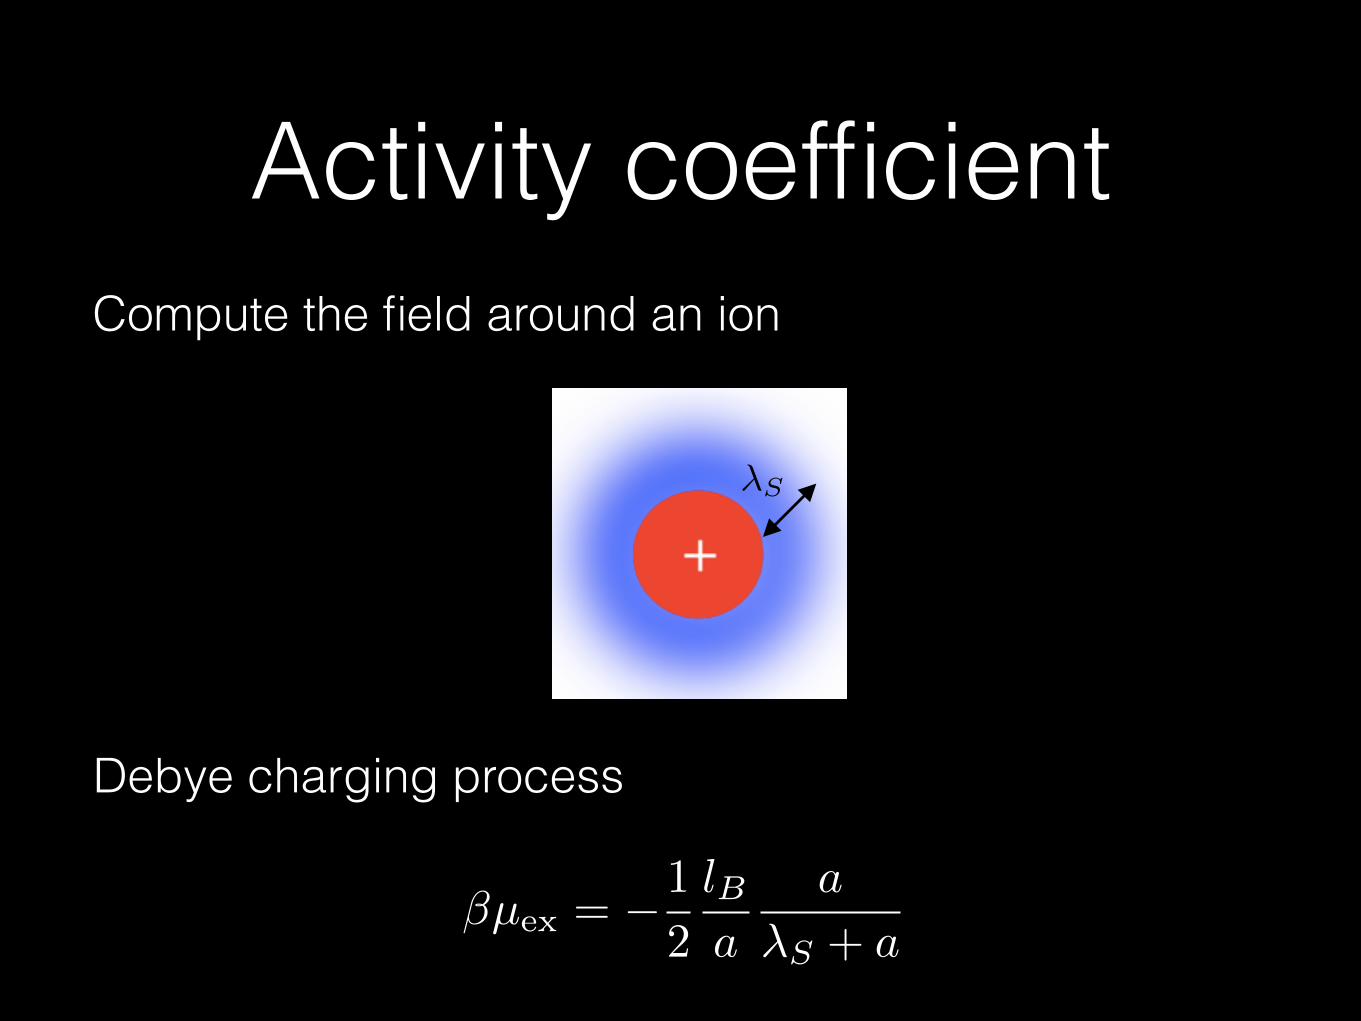
Activity coefficientCompute the field around an ion
Debye charging process
�µex
= �1
2
lBa
a
�S + a
�S
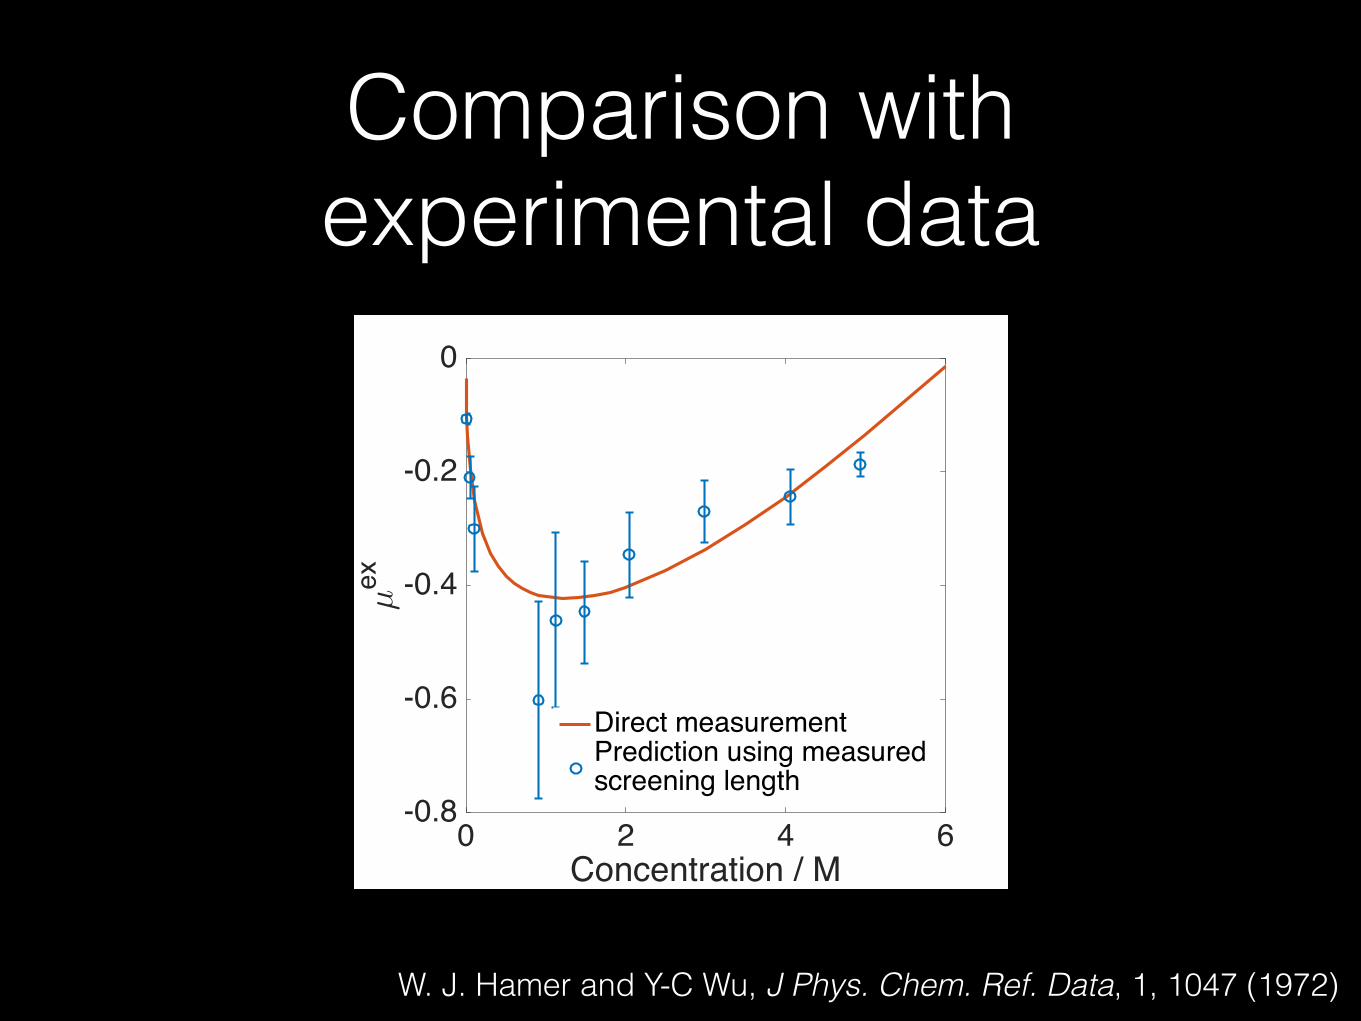
Comparison with experimental data
NaCl in water
W. J. Hamer and Y-C Wu, J Phys. Chem. Ref. Data, 1, 1047 (1972)
0 2 4 6Concentration / M
-0.8
-0.6
-0.4
-0.2
0µ
ex
Direct measurementPrediction using measuredscreening length
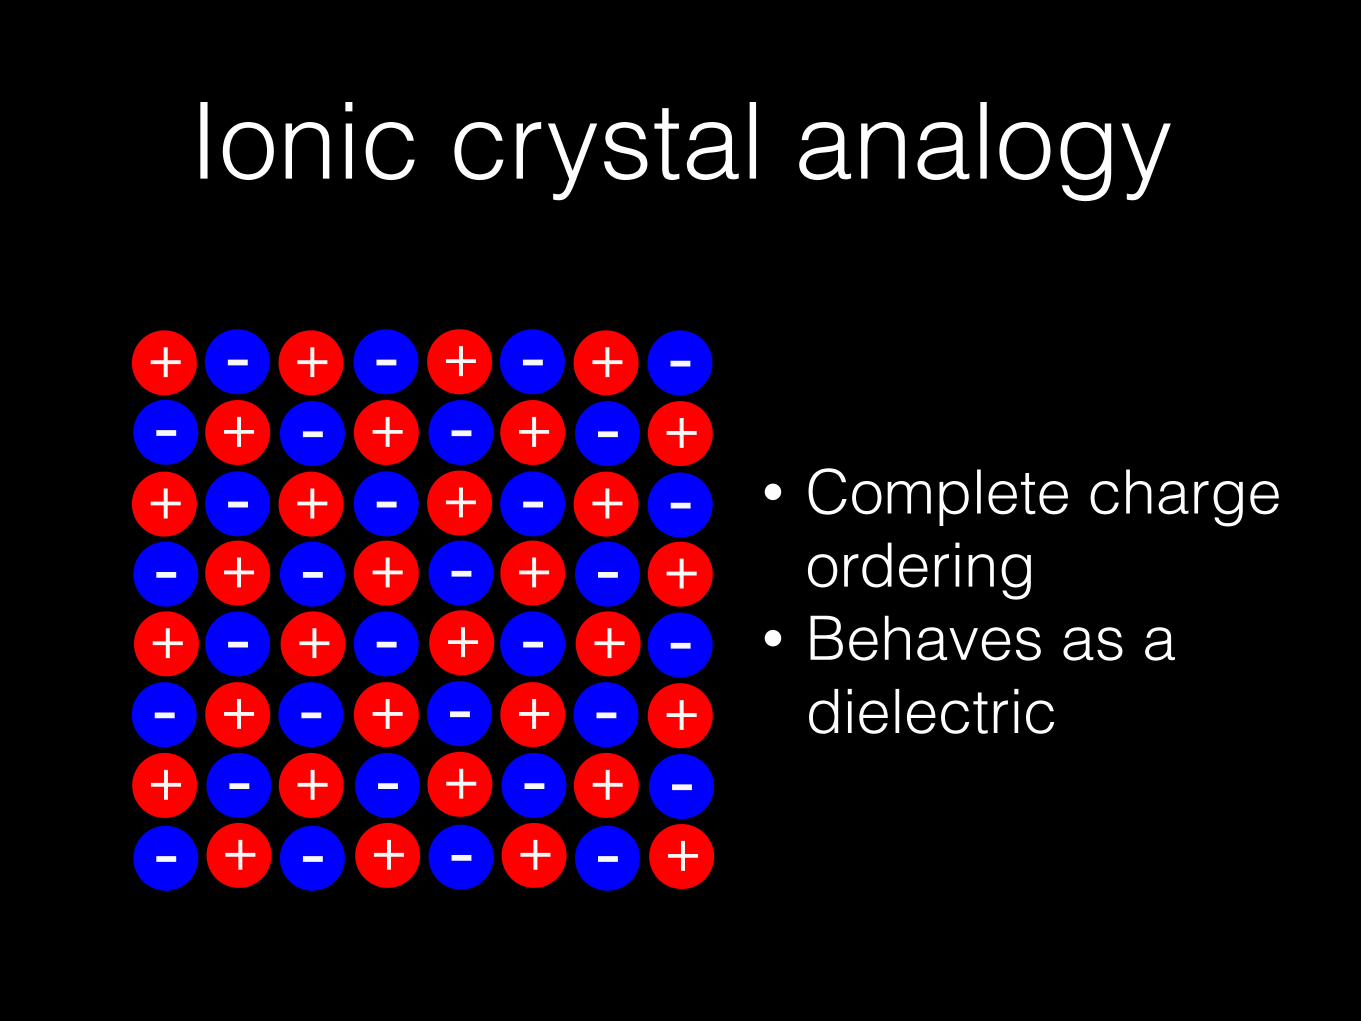
Ionic crystal analogy
+
+
+
+
--
-
-
-
-
-+-
+
+
+
+
--
-
-
-
-
+-+-+
-+-+-+-+
+
+
+
+
-
-
-
-
-+-+-+-+
+
+
+
+
-
-
-
-
-+-+-+-+
• Complete charge ordering
• Behaves as a dielectric

Schottky defects
• Defects behave as charges
• The defects are mobile - Debye screening
+
+
+
+
--
-
-
-
-
-+-
+
+
+
--
-
-
-
-
+-+-+
-+
+-+
+
+
+
+
+
-
-
-
-
-+-+-+-+
+
+
+
-
-
-
-
-+-+-+-+

Concentrated ionic solutions as a defect-laden ionic crystal
• A perturbative theory around a disordered ionic crystal, not a dilute gas
• The role of “defects” played by neutral solvent molecules
• Incompressibility: ctot
= cion
+ cd
�S =
✓4⇡
✏kBT
q2de2cd
◆1/2

What is the effective charge of a defect?
Defect charge determined by a balance between: • Self energy of an ion • Self energy of a defect
+-
+- +-+
-+
-
+-
+
-+
-+-
+
-+-
+-+- +
-+ -
+
-
+-
+- +-+
-+
-
+-
+
-+
-+-
+
-+-
+-+- +
-+ -
+
-

Scaling theory of the fluctuation energies
Energy density of a dilute electrolyte eDH ⇠ ��3D
Energy density of a concentrated electrolyte
eCE ⇠ l�3B
The buffet of length scales: �D, lB , a
Fluctuation energy of a single defect
ed ⇠ q2d
eCEa3 ⇠ ed =) q2d ⇠ (a/lB)
3
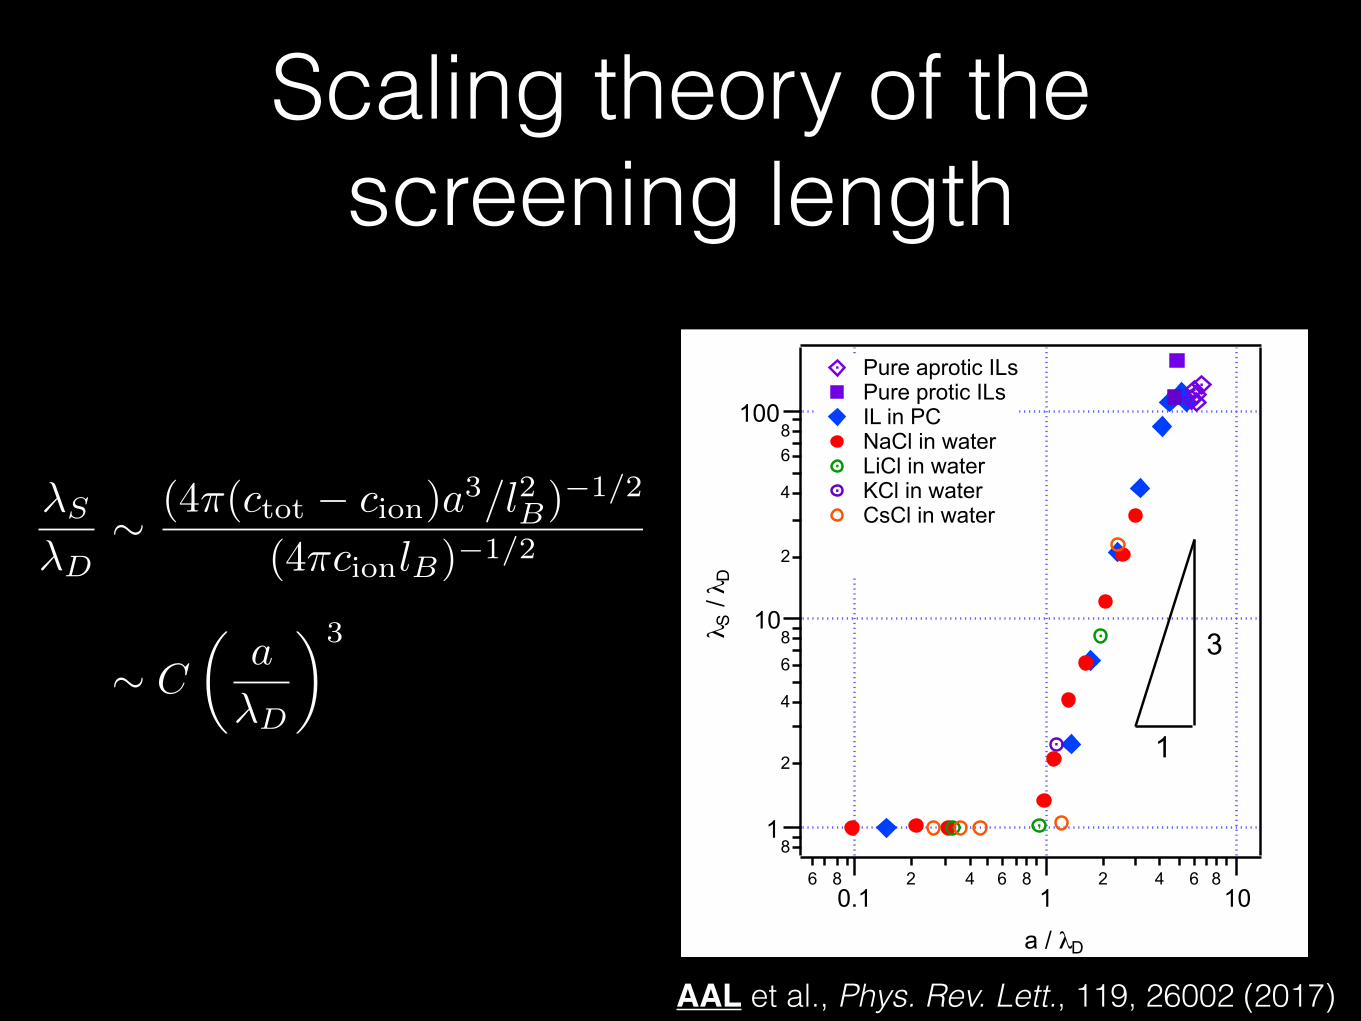
Scaling theory of the screening length
�S
�D⇠ (4⇡(c
tot
� cion
)a3/l2B)�1/2
(4⇡cion
lB)�1/2
⇠ C
✓a
�D
◆3
81
2
4
6
810
2
4
68
100
λ S / λ D
6 80.1
2 4 6 81
2 4 6 810
a / λD
1
3
Pure aprotic ILs Pure protic ILs IL in PC NaCl in water LiCl in water KCl in water CsCl in water
AAL et al., Phys. Rev. Lett., 119, 26002 (2017)
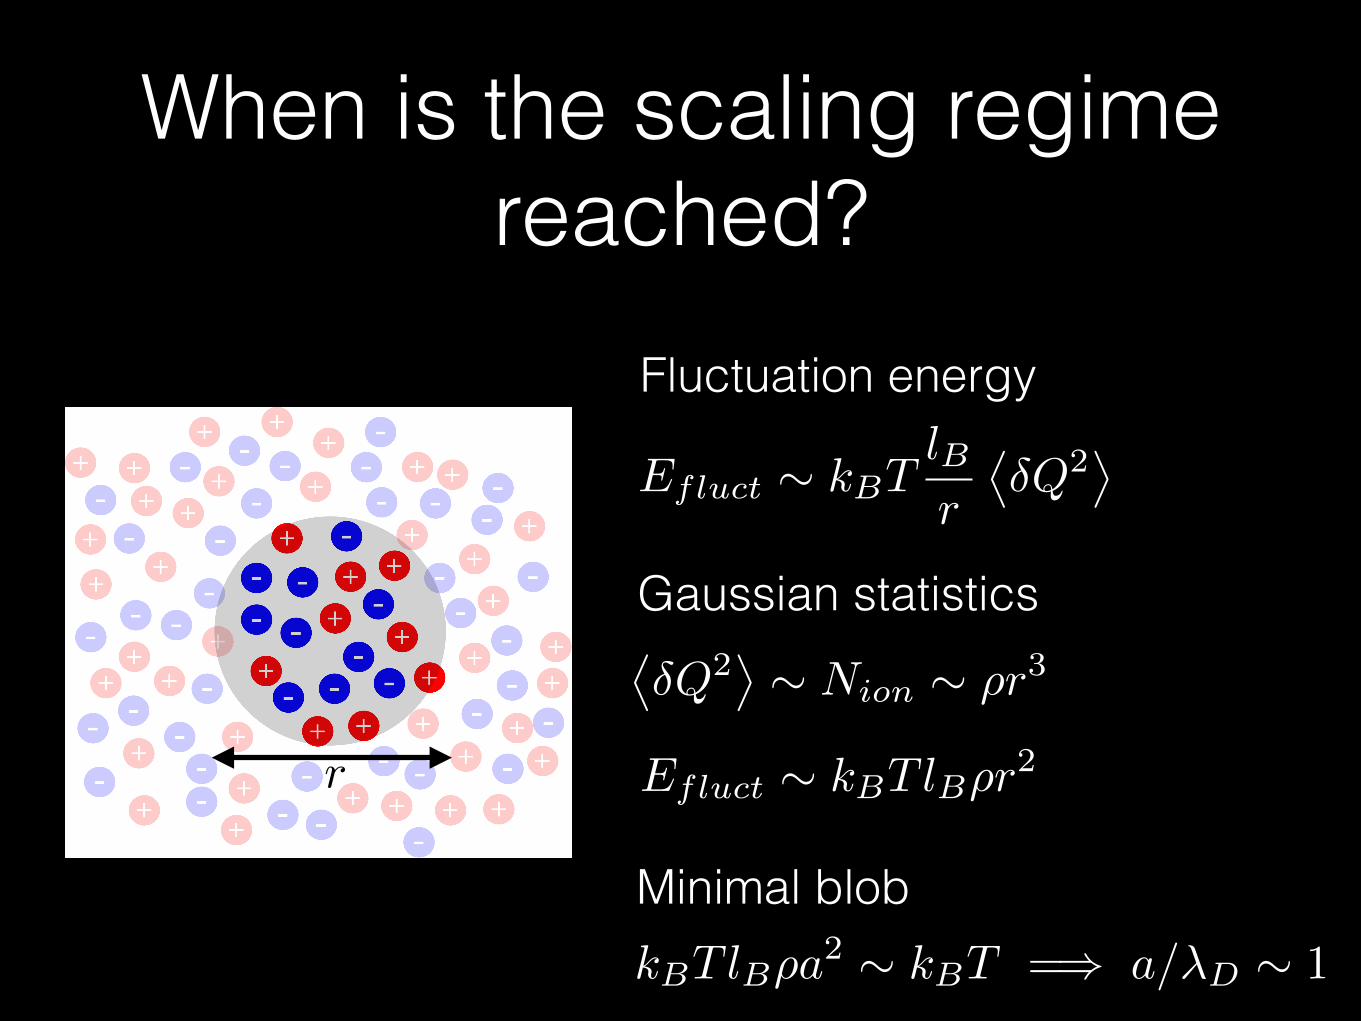
When is the scaling regime reached?
+
- +
-
--
+--+-+
+ --⌦�Q2
↵⇠ N
ion
⇠ ⇢r3
Gaussian statistics
Efluct ⇠ kBTlBr
⌦�Q2
↵Fluctuation energy
Efluct ⇠ kBT lB⇢r2
Minimal blobkBT lB⇢a
2 ⇠ kBT =) a/�D ⇠ 1
r

From the screening length to energy storage
Differential capacitance at zero voltage
C0 =✏
4⇡
1
�s + a
C =@�
@V
1
C=
1
CS+
1
Cd
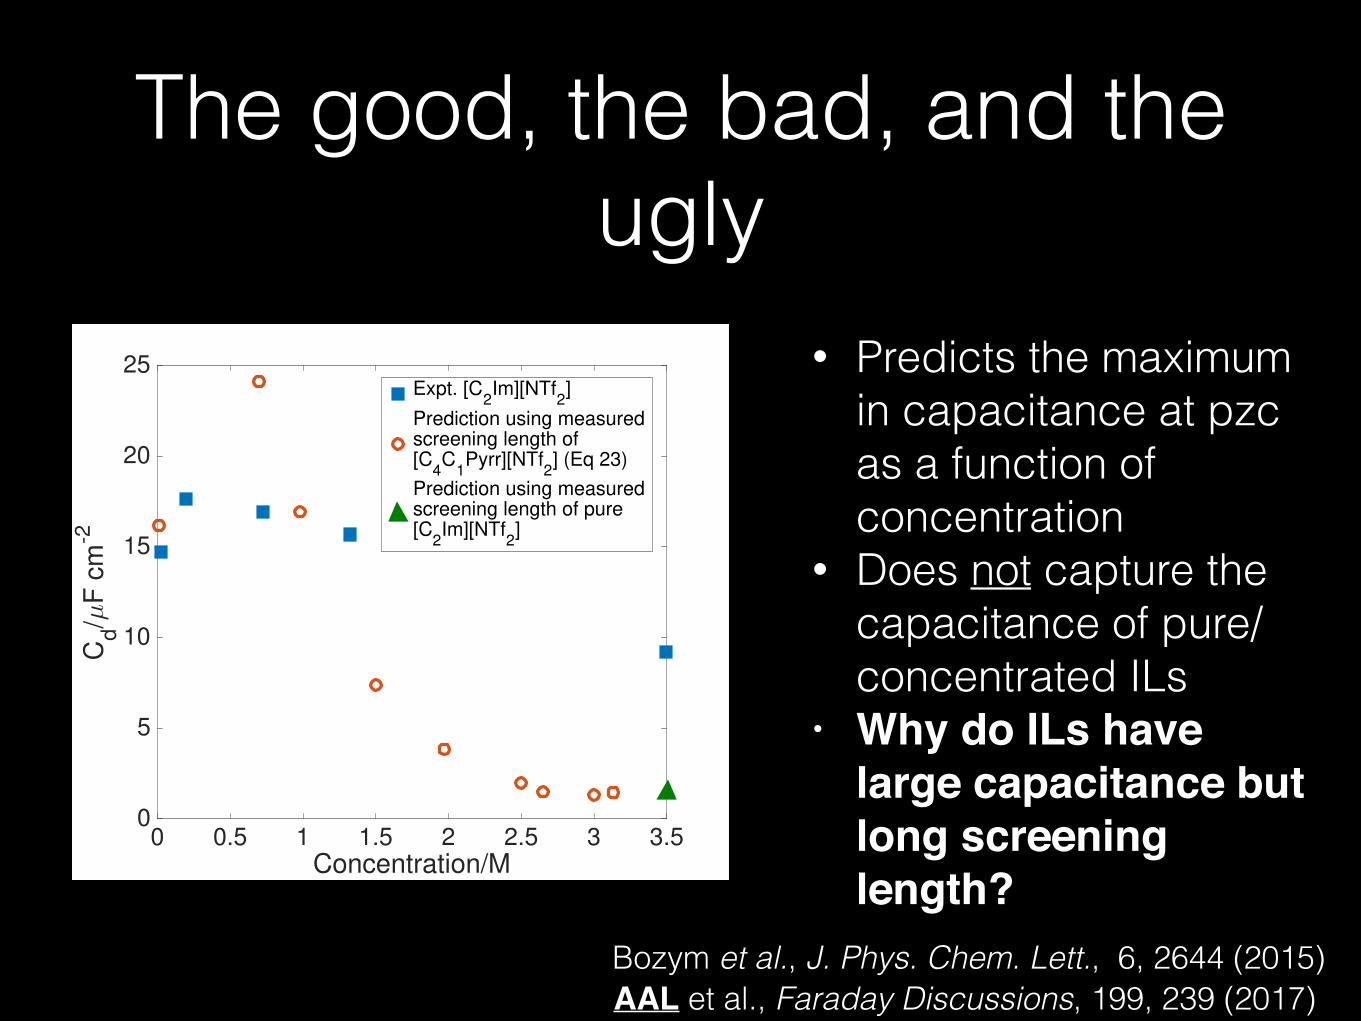
The good, the bad, and the ugly
• Predicts the maximum in capacitance at pzc as a function of concentration
• Does not capture the capacitance of pure/concentrated ILs
• Why do ILs have large capacitance but long screening length?
Bozym et al., J. Phys. Chem. Lett., 6, 2644 (2015)
0 0.5 1 1.5 2 2.5 3 3.5Concentration/M
0
5
10
15
20
25
Cd/µ
F c
m-2
Expt. [C2Im][NTf
2]
Prediction using measured screening length of [C
4C
1Pyrr][NTf
2] (Eq 23)
Prediction using measuredscreening length of pure[C
2Im][NTf
2]
AAL et al., Faraday Discussions, 199, 239 (2017)

The interface matters+V-
----
-
+
+
• Monolayer (Stern) layer of ions adsorbed onto the electrode
• Quasi-2D confinement
• Ion-ion interactions
Uion�ion
⇠ 1/r3
• Ionophilicity Ion-surface interaction energy relative to solvent-surface interaction energy
AAL, S. Perkin, J. Phys. Chem. Lett, 7, 2753 (2016)

Capacitance maximum as a function of dilution
D. J. Bozym et al., J. Phys. Chem. Lett., 6, 2644 (2015)
-5 0 5δ µ
25
30
35
40
45
50
55
CD
(0)/ µ
F c
m-2
“Ionophilicity”

Mean field theory predicts voltage-induced phase transition
0 10 20 30 40 50u
0
0.1
0.2
0.3
0.4
0.5
0.6
0.7
-ca2
Cha
rge
dens
ity
Applied potential
�µ = �2
�µ = 2
�µ = 0
AAL, S. Perkin, J. Phys. Chem. Lett, 7, 2753 (2016)
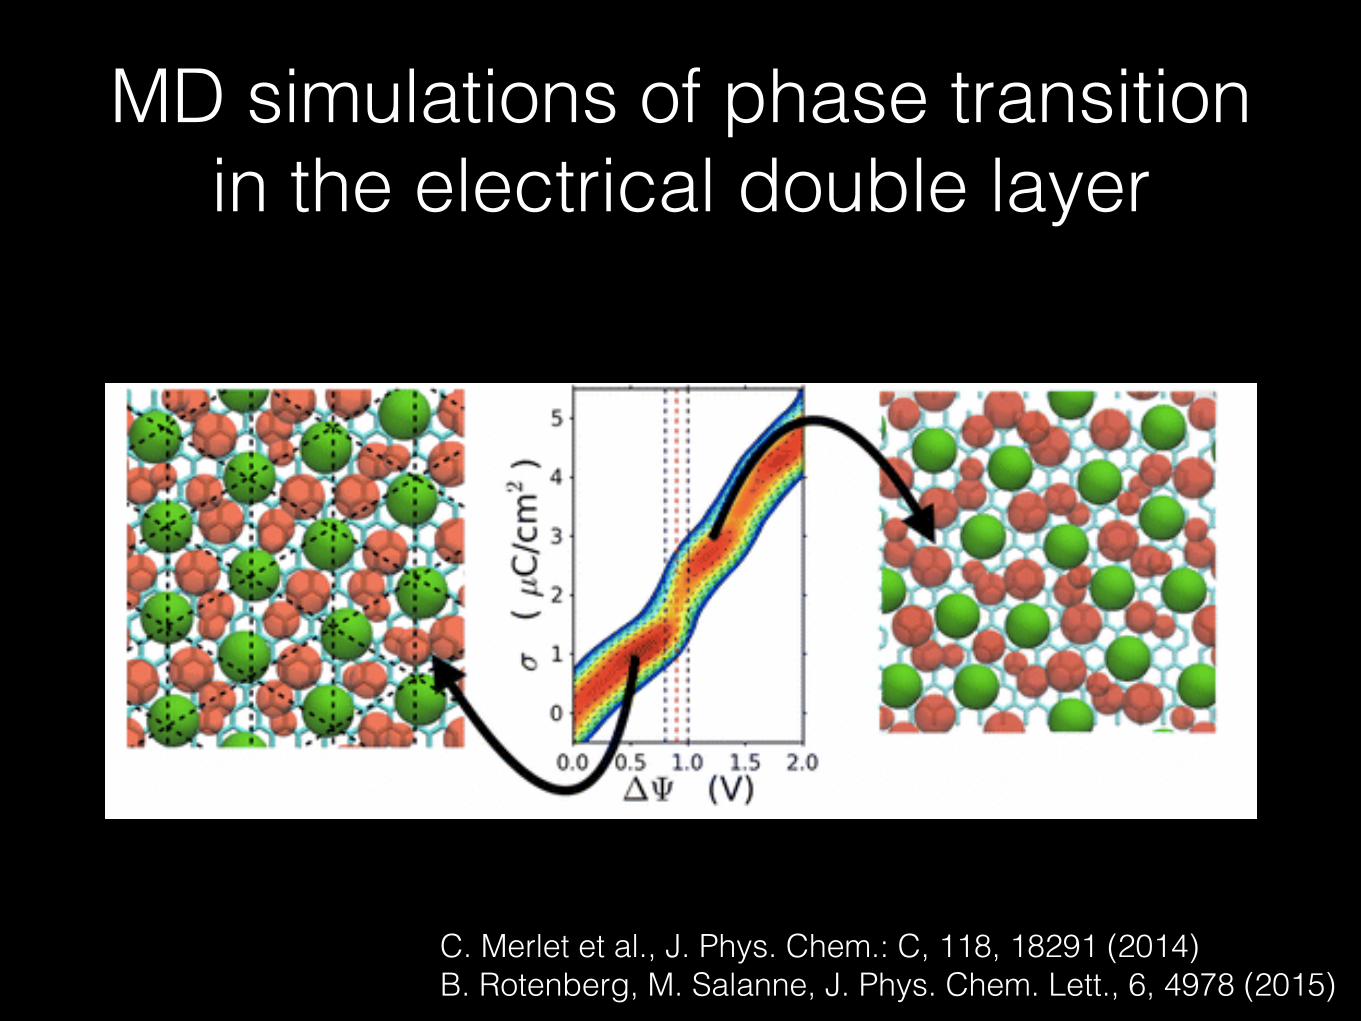
MD simulations of phase transition in the electrical double layer
C. Merlet et al., J. Phys. Chem.: C, 118, 18291 (2014) B. Rotenberg, M. Salanne, J. Phys. Chem. Lett., 6, 4978 (2015)
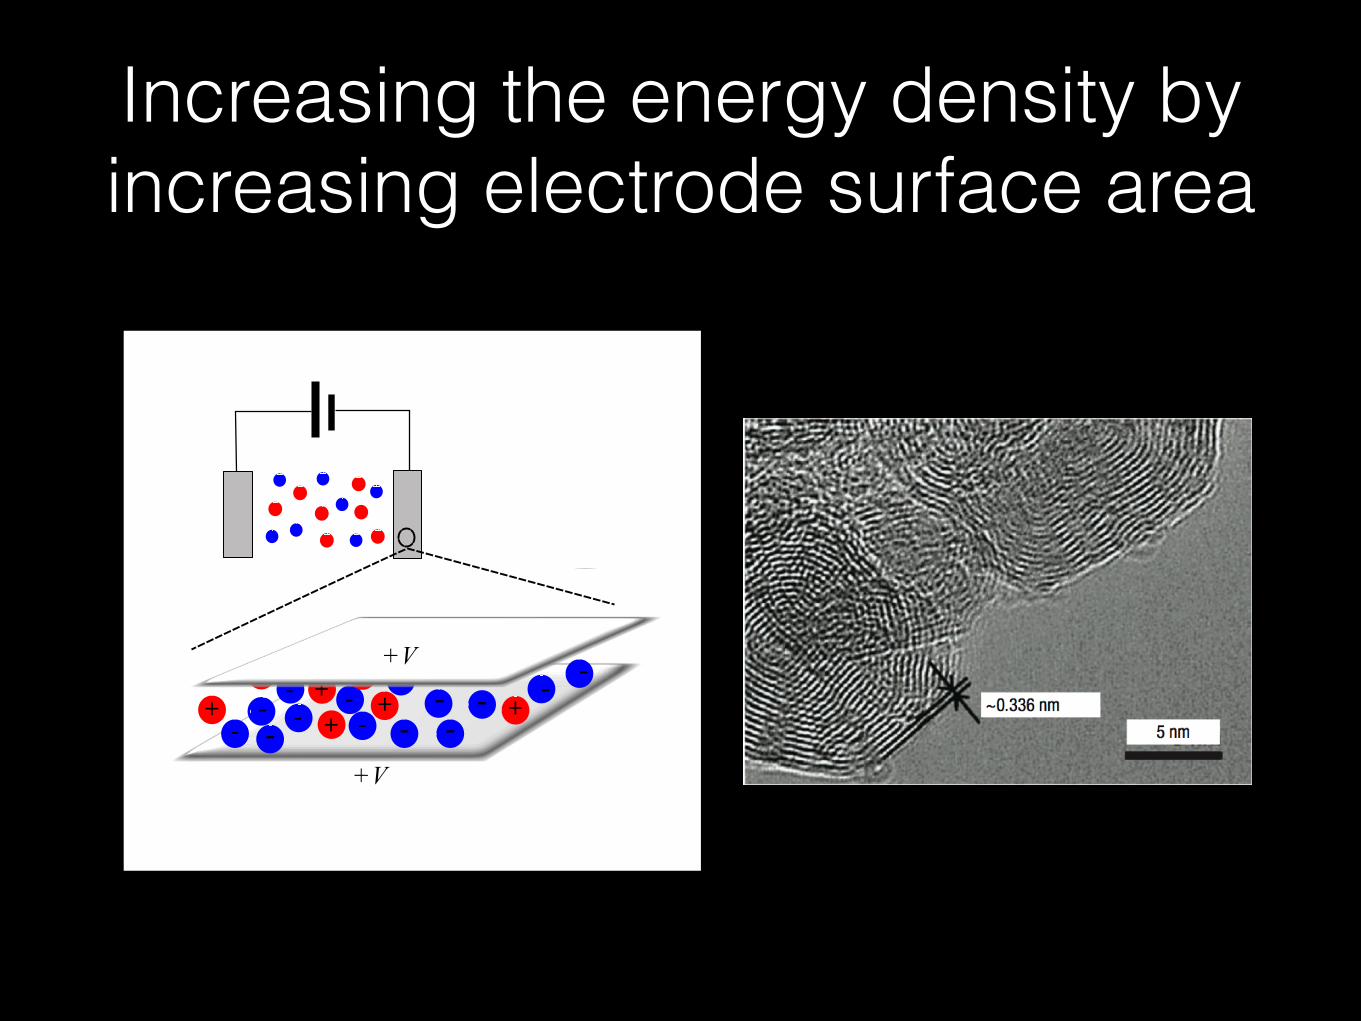
Increasing the energy density by increasing electrode surface area
-+- +
++ --
-
power
capacitance
hysteresis
- +
+V
+V
--- --
--
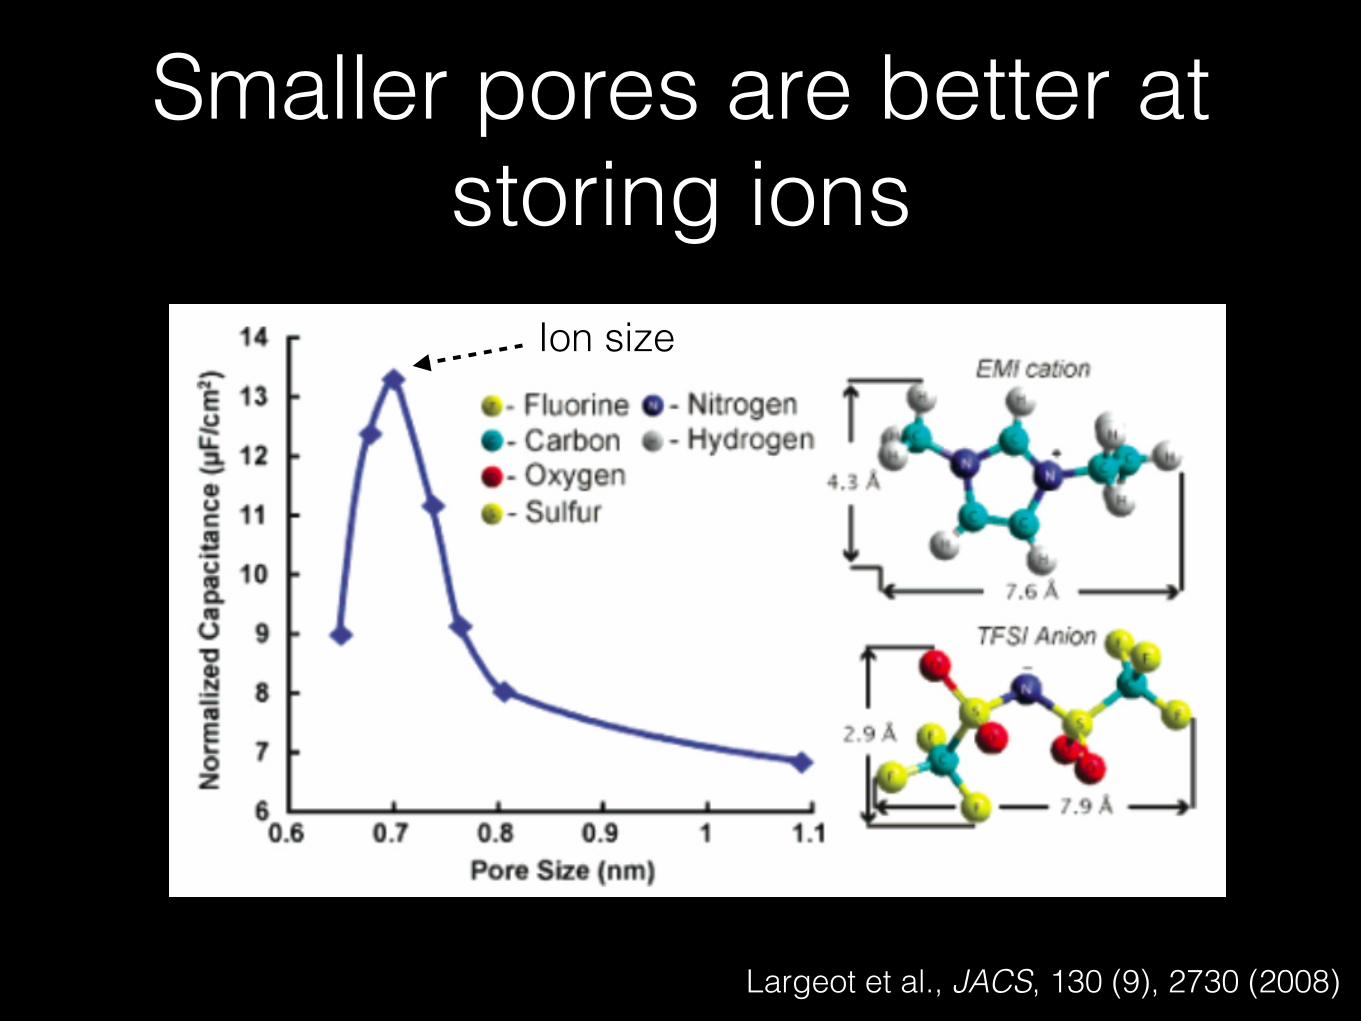
Smaller pores are better at storing ions
Largeot et al., JACS, 130 (9), 2730 (2008)
Ion size
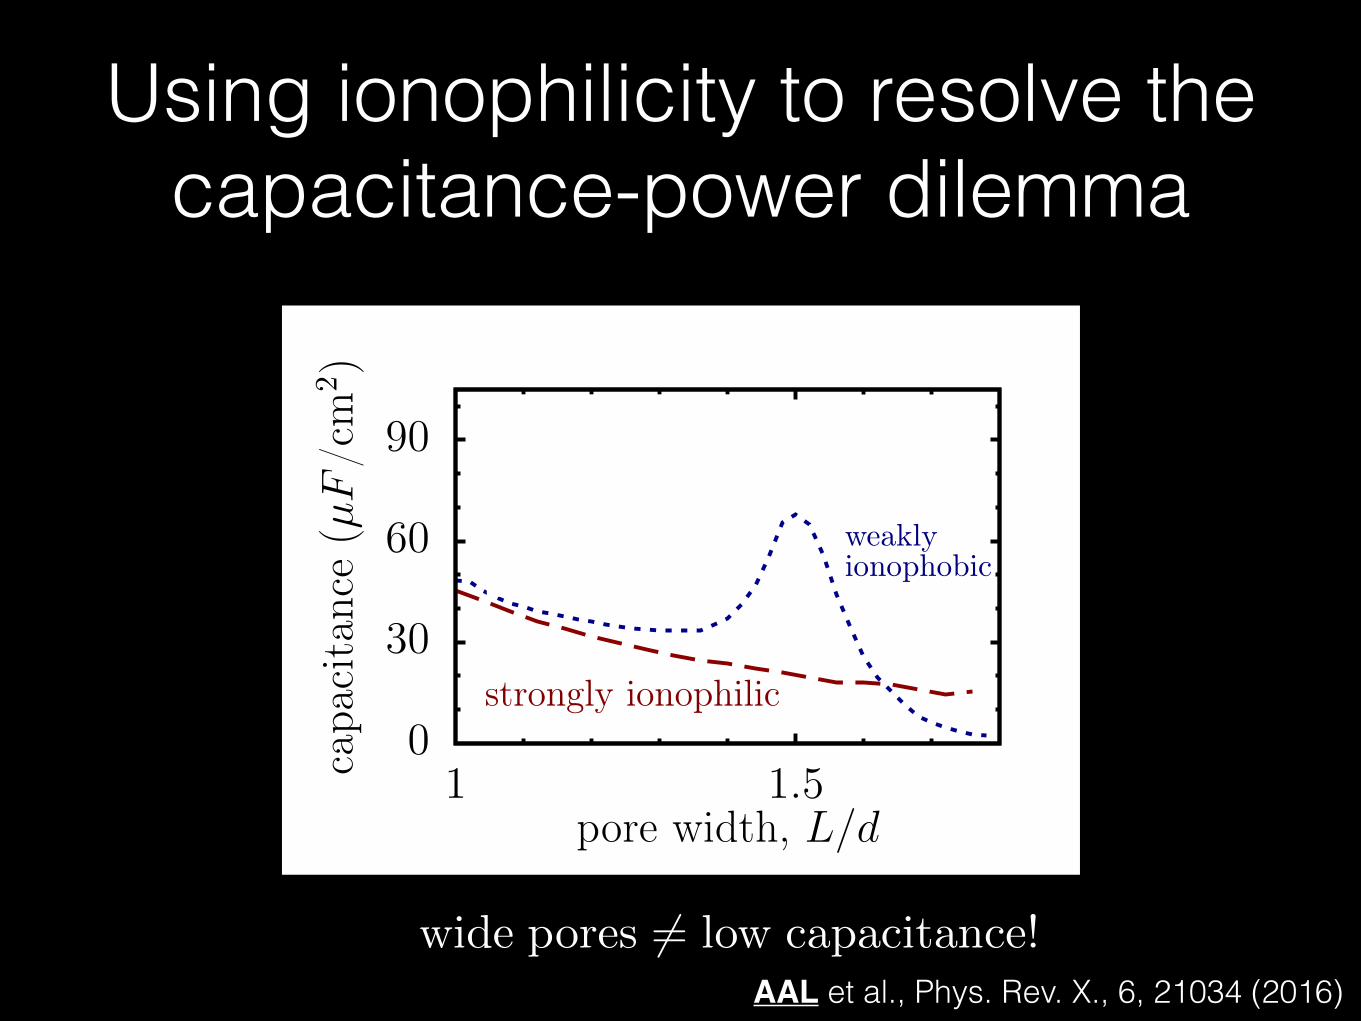
Using ionophilicity to resolve the capacitance-power dilemma
wide pores 6= low capacitance!
0
30
60
90
1 1.5capa
cita
nce
(µF
/cm
2)
pore width, L/d
strongly ionophilic
ionophobicweakly
(a)
0
1
1 1.5
d2ρto
t
pore width
5
10
15
20
1.5 2capa
cita
nce
(µF
/cm
2)
pore width, L/d
d = 0.7nm
(b)
0
0.2
0.4
1.5 2
η 3D
pore width
10
20
30
1.5 2capa
cita
nce
(µF
/cm
2)
pore width, L/d
(c)
0.5nm
0.6nm
0
0.2
0.4
1.5 2
η 3D
pore width
strongly ionophilic weakly ionophobic
AAL et al., Phys. Rev. X., 6, 21034 (2016)
The upshot• Scaling theory derived by considering an ideal crystal
with defects
• The inconsistency between the long screening length and large interfacial capacitance in ILs highlights the role of the interfacial layer
• Ionophilicility controls the structure of the interfacial layer
• Engineering ionophilicity is key to designing nanoporous supercapacitors

Physics of long range correlations also features in machine learning!
Liquid State Theory Meets Deep LearningAlpha A. Lee
Department of Physics, University of Cambridge ([email protected])
A large class of problems in machine learning pertains to making sense of unlabelled data. The challenge lies in separating direct variable-variable interactions (e.g. cause and effect) and transitive correlations. We develop an Ornstein-Zernike approach for data analysis with a closure parameterised by deep learning to disentangle correlations in datasets.
Unsupervised machine learning
Maximum entropy model
Q: What is the probability distribution that generates this dataset?
A: The Ising model is the maximum entropy model that captures the first and second order statistics.
p(�) =1
Zexp
0
@X
i<j
Jij�i�j +
X
i
hi�i
1
A
J matrix Covariance matrix
“Friend of a friend”
The “exact” inference algorithm (Boltzmann learning):
Computationally intractable in the “big data” limit!
hn+1i = hn
i + ⌘⇣h�iidata � h�iihn,Jn
⌘
Jn+1ij = Jn
ij + ⌘⇣h�i�jidata � h�i�jihn,Jn
⌘
Ornstein-Zernike theory
E. T. Jaynes, Physical Review, 106, 620 (1957)D. H. Ackley, G. E. Hinton, and T. J. Sejnowski, Cognitive Science, 9, 147 (1985)
rij
Intermolecular potential:
1 2 3 4r/σ
1
2
3
4
5
g(r)
0
1 r/σ
u(r) ∞
u(rij)
g(rij)Radial distribution function:
The Ornstein-Zernike model defines the direct correlation function
h(rij) = c(rij) +
Zdrk c(rik)c(rkj) +
Zdrk
Zdrl c(rik)c(rkl)c(rlj) + · · ·
= c(rij) +
Zdrk c(rik)c(rkj)
A closure is needed to solve the Ornstein-Zernike equation
u(r) = f [h(r), c(r); ⇢]
The commonly used closures (e.g. MSA, HNC, PY) are local functions (i.e. not functional)
u(r) ⇡ g(h(r), c(r); ⇢)
Deep learning meets Ornstein-Zernike
Covariance matrix Cij h(rij)
Direct correlation function
“Direct coupling” matrix Dij c(rij)
Total correlation function
Cij = Dij +X
k
DikDkj +X
kl
DikDklDlj + · · ·
D = (I� C)�1
Ornstein-Zernike theory for data analysis
Closure parameterised by deep learning on simulations of Ising models using the locality approximation
Jij = F (Cij , [C�1]ij , h�ii , h�ji)
⌘ = 0.47
hi = G
0
@tanh�1 h�ii ,⇥C�1
⇤ii,X
j 6=i
Jij h�ji ,X
j 6=i
Cij h�ji
1
A
Σ
Generative model in biochemical spaceThe deep learning closure is generalisable
1D ferromagnetic Ising model
�J ⇠ uniform(0.5, 2.5)
�h ⇠ uniform(0.5, 2.5)
Jij = Jji ⇠ N (0,�J/pp)
hi ⇠ N (0, 0.3�h)
Training data: 20 independent simulations with
Sherrington-Kirkpatrick model
Virtual screening for drug discovery
HO
HO
OHHN
(0 1 0 1 0 0 1 0 1 0 1 0 …)
C-C C-O C-N C-C-NO-C-O
Chemical structure to binary vector using the Morgan algorithm
Predicting protein function from evolutionary data
Binding to endrogen receptor
Samples from patients
Sequence of HIV Gag protein
A A Lee, arXiv:1706.08466 (2017)
0 0.2 0.4 0.6 0.8 1False positive
0
0.2
0.4
0.6
0.8
1
True
pos
itive
In-sample classification(AUC = 0.88)Out-of-sample classification(AUC = 0.75)
0.5 1 1.5 2 2.5 3 3.5β
00.10.20.30.40.50.60.70.8
RM
S(J ij -
J ijpre d
)
Neural NetworkThouless-Anderson-Palmerapproximation
1 1.5 2 2.5J
0
1
2
3
4
5
6
RM
S(J
- Jpr
ed)
0 0.5 1RC/RCWT
-15
-10
-5
0
EW
T -E
r = 0.86
I will be presenting a poster on liquid state theory and deep learning.
Come find me during the poster session!