Investors’Guide - 日清食品グループ · Investors’Guide Consolidated Results ... Rising...
24
Investors’Guide Consolidated Results for the Fiscal Year Ended March 31, 2007 (FY 2007) May 11, 2007 Code number 2897 URL http://www.nissinfoods.co.jp/
Transcript of Investors’Guide - 日清食品グループ · Investors’Guide Consolidated Results ... Rising...
Investors’Guide
Consolidated Results for the
Fiscal Year Ended March 31, 2007
(FY 2007)
May 11, 2007
Code number 2897
URL http://www.nissinfoods.co.jp/
Contents
PP.NO Page
2. Business Environments in FY2007 1
3. Main Business Activities during FY2007 2
4. Overview of Results for FY2007 (Consolidated) 2
5. Pillow-type Instant Noodles (Consolidated) 3
6. Cup-type Instant Noodles (Consolidated) 3
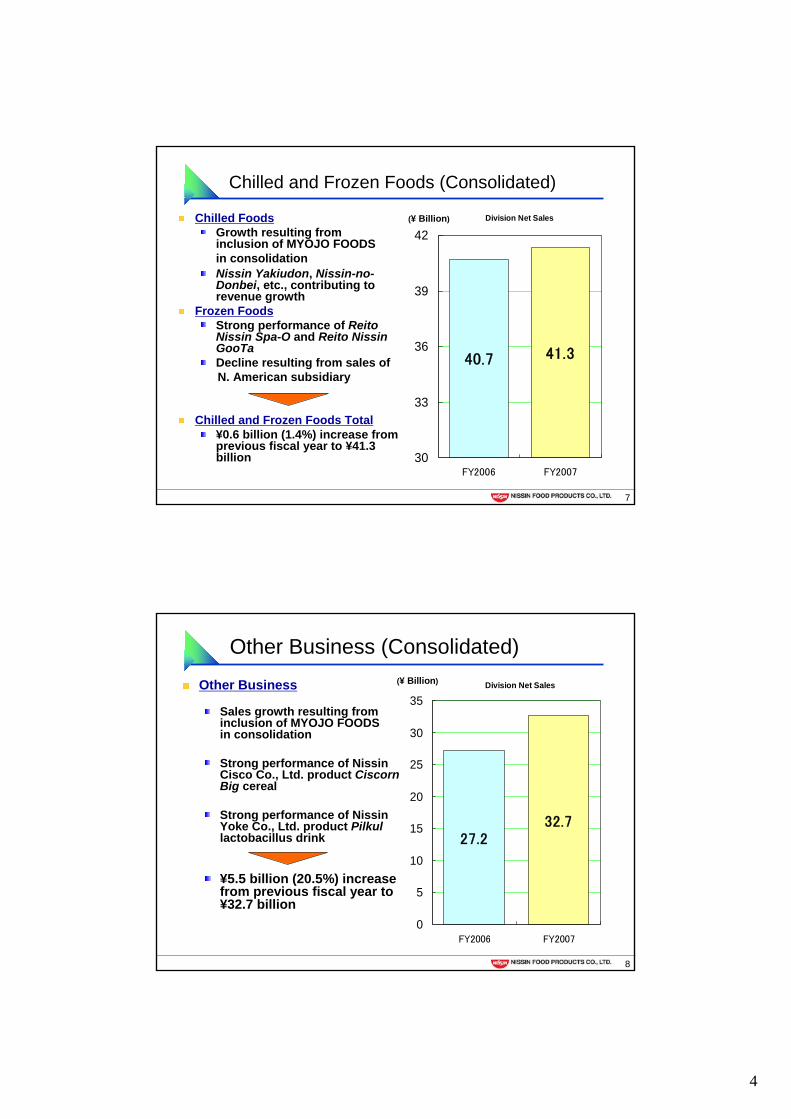
7. Chilled and Frozen Foods (Consolidated) 4
8. Other Business (Consolidated) 4
9. Effect of Accounting for Retirement Benefits (Consolidated) 5
10. Breakdown of Operating Income (Consolidated) 5
11. Breakdown of Ordinary Income/Net Income (Consolidated) 6
12. Acquisition of MYOJO FOODS Co., Ltd. 6
13. Synergy Benefits from Integration 7
14. Segment Information by Geographical Area 7
15. North America Segment 8
16. Business in China 8
17. Equity Method Investment in THAI PRESIDENT FOODS PUBLIC COMPANY LIMITED 9
18. Profile of THAI PRESIDENT FOODS PUBLIC COMPANY LIMITED 9
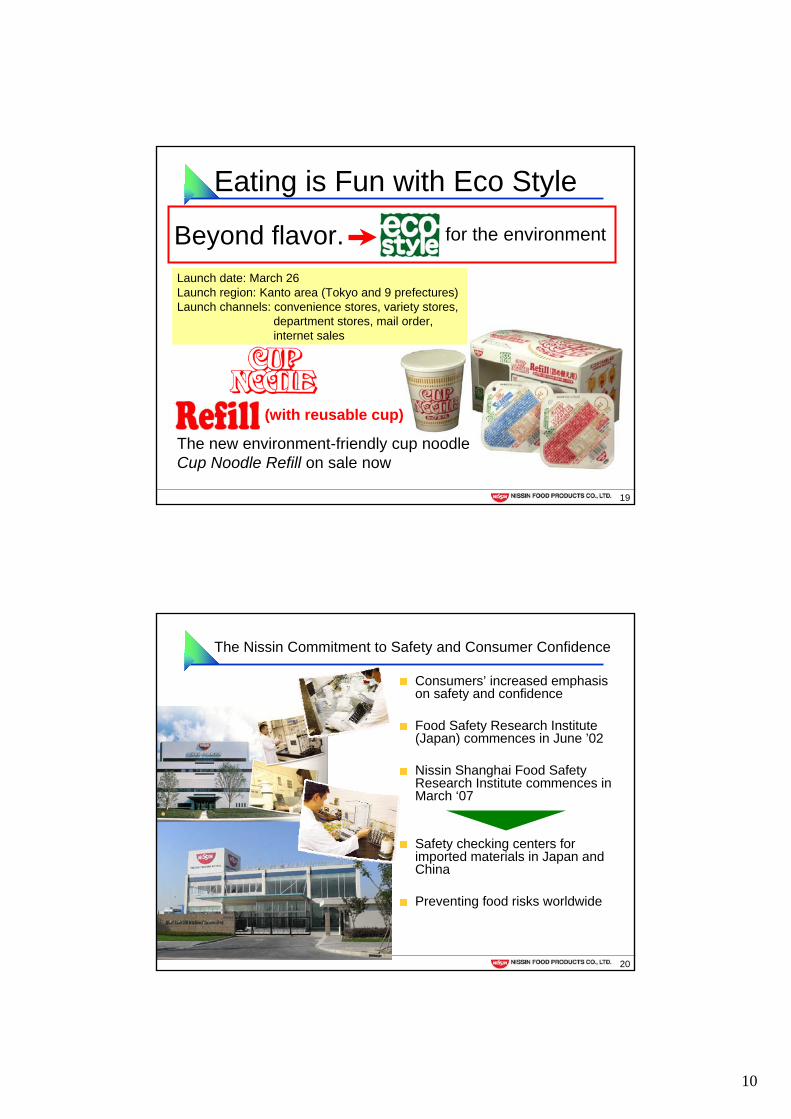
19. Eating is Fun with Eco Style 10
20. The Nissin Commitment to Safety and Consumer Confidence 10
21. Project for the Fiscal Year Ending March 2008 (Consolidated) 11
22. Implementation of Strategic Measures against Large-Scale Purchase of Nissin
Foods Shares 11
23. Cash Dividend Project 12
Supplementary Data ①-⑧
For further information, please contact:
Corporate Communications Division (Tokyo Head Office)
Executive Officer Hideki Hattori
General Manager Katsuhiko Kiyofuji
Assistant Manager Kentaro Onoda
Tel:03-3205-5027 / Fax:03-3205-5259
Regularly updated IR information in English is also available on
Nissin’s web site at http://www.nissinfoods.co.jp/
1
1Code Number 2897
Consolidated Results for the Fiscal Year Ended March 31, 2007
(FY2007) May 11, 2007
2
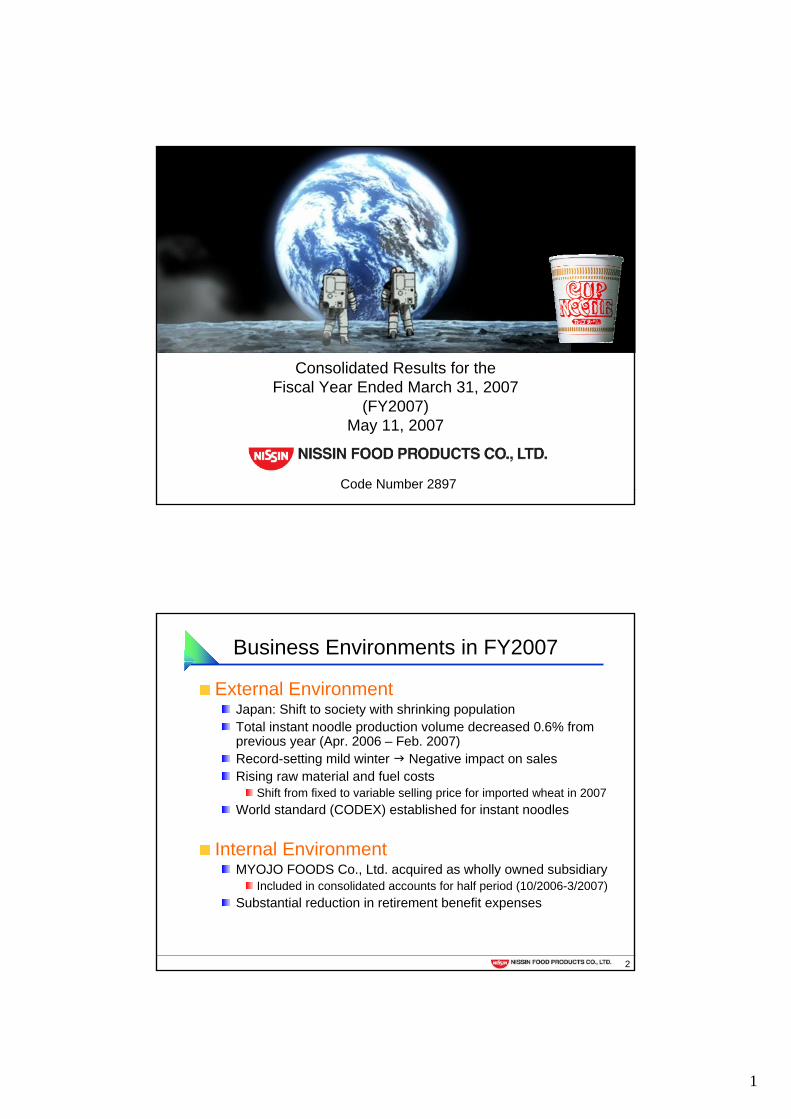
Business Environments in FY2007
External EnvironmentJapan: Shift to society with shrinking populationTotal instant noodle production volume decreased 0.6% from previous year (Apr. 2006 – Feb. 2007)Record-setting mild winter Negative impact on salesRising raw material and fuel costs
Shift from fixed to variable selling price for imported wheat in 2007World standard (CODEX) established for instant noodles
Internal EnvironmentMYOJO FOODS Co., Ltd. acquired as wholly owned subsidiary
Included in consolidated accounts for half period (10/2006-3/2007)Substantial reduction in retirement benefit expenses

2
3
Main Business Activities during FY2007
JapanSuccessful anniversary campaigns for Cup Noodle,
Nissin-no-Donbei and Nissin Yakisoba U.F.O.Dramatic growth in sales of Nissin Men Shokunin (up 127%) Limited-edition sales of Chicken Ramen & Tachikichi White Domburi Set with LidLaunch of environment-friendly Cup Noodle Refill with reusable cup
OverseasNorth American market: Increase in sales volume; new category product established and expandedEquity method applied to THAI PRESIDENT FOODS PUBLIC COMPANY LIMITED
4
Overview of Results for FY2007 (Consolidated)
(¥ Billion)
Amount Ratio (%)
Net Sales 321.7 358.2 36.5 11.4
Operating Income 32.0 33.7 1.7 5.5
Ordinary Income 39.5 37.8 (1.7) (4.3)
Net Income 15.4 19.0 3.6 23.3
Exchange rate ¥/US$ 118.07 119.11
Exchange rate ¥/HK$ 15.23 15.32
Exchange rate ¥/RMB 14.63 15.24
Note: Figures have been rounded to the nearest ¥100 million.
FY2006 FY2007Change
3
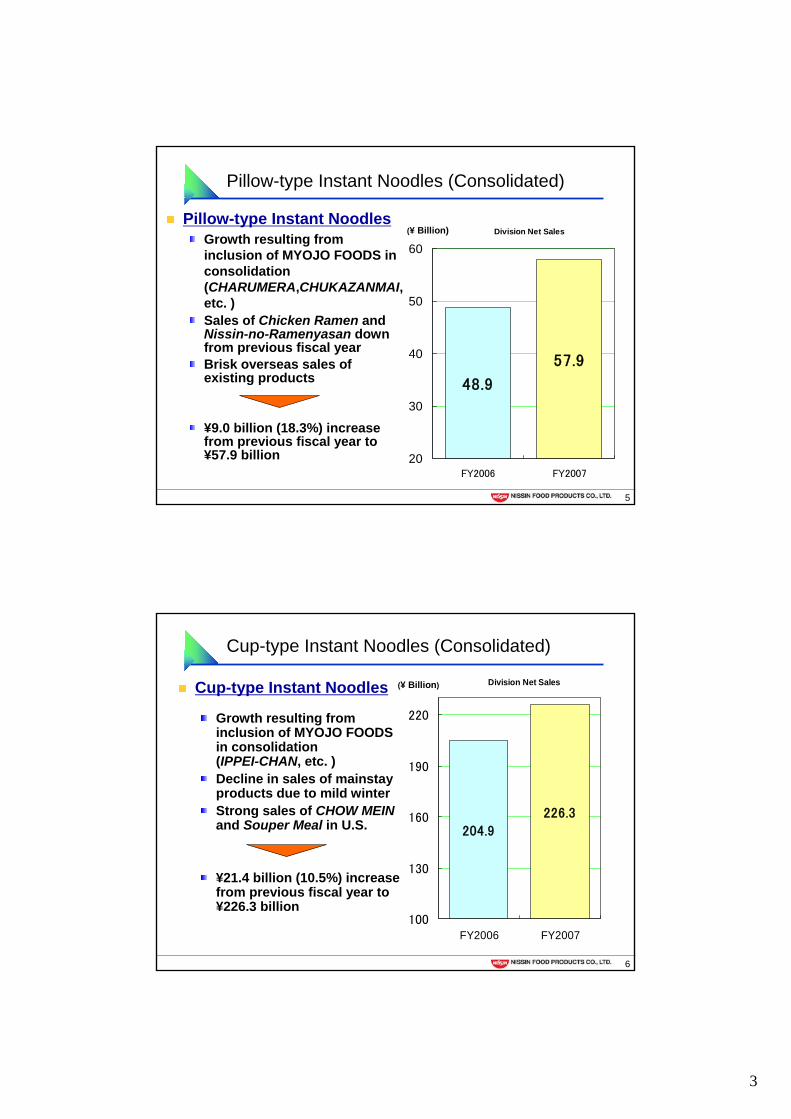
5
Pillow-type Instant NoodlesGrowth resulting from inclusion of MYOJO FOODS in consolidation (CHARUMERA,CHUKAZANMAI, etc. )Sales of Chicken Ramen and Nissin-no-Ramenyasan down from previous fiscal yearBrisk overseas sales of existing products
¥9.0 billion (18.3%) increase from previous fiscal year to ¥57.9 billion
Division Net Sales
48.9
57.9
20
30
40
50
60
FY2006 FY2007
Pillow-type Instant Noodles (Consolidated)
(¥ Billion)
6
Cup-type Instant Noodles
Growth resulting from inclusion of MYOJO FOODS in consolidation (IPPEI-CHAN, etc. )Decline in sales of mainstay products due to mild winterStrong sales of CHOW MEINand Souper Meal in U.S.
¥21.4 billion (10.5%) increase from previous fiscal year to ¥226.3 billion
Cup-type Instant Noodles (Consolidated)
Division Net Sales
226.3
204.9
100
130
160
190
220
FY2006 FY2007
(¥ Billion)
4
7
Chilled FoodsGrowth resulting from inclusion of MYOJO FOODS in consolidationNissin Yakiudon, Nissin-no-Donbei, etc., contributing to revenue growth
Frozen FoodsStrong performance of Reito Nissin Spa-O and Reito Nissin GooTaDecline resulting from sales of N. American subsidiary
Chilled and Frozen Foods Total¥0.6 billion (1.4%) increase from previous fiscal year to ¥41.3 billion
Chilled and Frozen Foods (Consolidated)
Division Net Sales
41.340.7
30
33
36
39
42
FY2006 FY2007
(¥ Billion)
8
Other Business (Consolidated)Division Net Sales
27.232.7
0
5
10
15
20
25
30
35
FY2006 FY2007
Other Business
Sales growth resulting from inclusion of MYOJO FOODS in consolidation
Strong performance of Nissin Cisco Co., Ltd. product Ciscorn Big cereal
Strong performance of Nissin Yoke Co., Ltd. product Pilkullactobacillus drink
¥5.5 billion (20.5%) increase from previous fiscal year to ¥32.7 billion
(¥ Billion)

5
9
Effect of Accounting for Retirement Benefits (Consolidated)
(2.1) 29.6 31.7Operating income excluding effect of accounting for retirement benefits (A + B)
(3.8)(4.1) (0.3)B: Effect of accounting
for retirementbenefits
1.7 33.732.0A: Operating income
Increase (Decrease)FY2007FY2006
Note: Figures have been rounded to the nearest ¥100 million.
(¥ Billion)
10
Breakdown of Operating Income (Consolidated)Operating Income ¥33.7 Billion
(¥1.7 billion increase from previous fiscal year)
1.7
0.1
0.4
1.1
(0.4)
(0.9)
(1.2)
(1.2)
3.8
(6.0) (4.0) (2.0) 0.0 2.0 4.0 6.0 8.0
Decrease in retirement benefit expenses
Decrease in general expenses
Operating income lower due to reduced sales
Increase in promotional expenses ratio
Decrease in advertising expenses
Increase in cost of sales ratio
Amount of increase in operating income
Positivefactors
Negative factors
Increase in distribution expenses ratio
(¥ Billion)
MYOJO FOODS added to consolidation
6
11
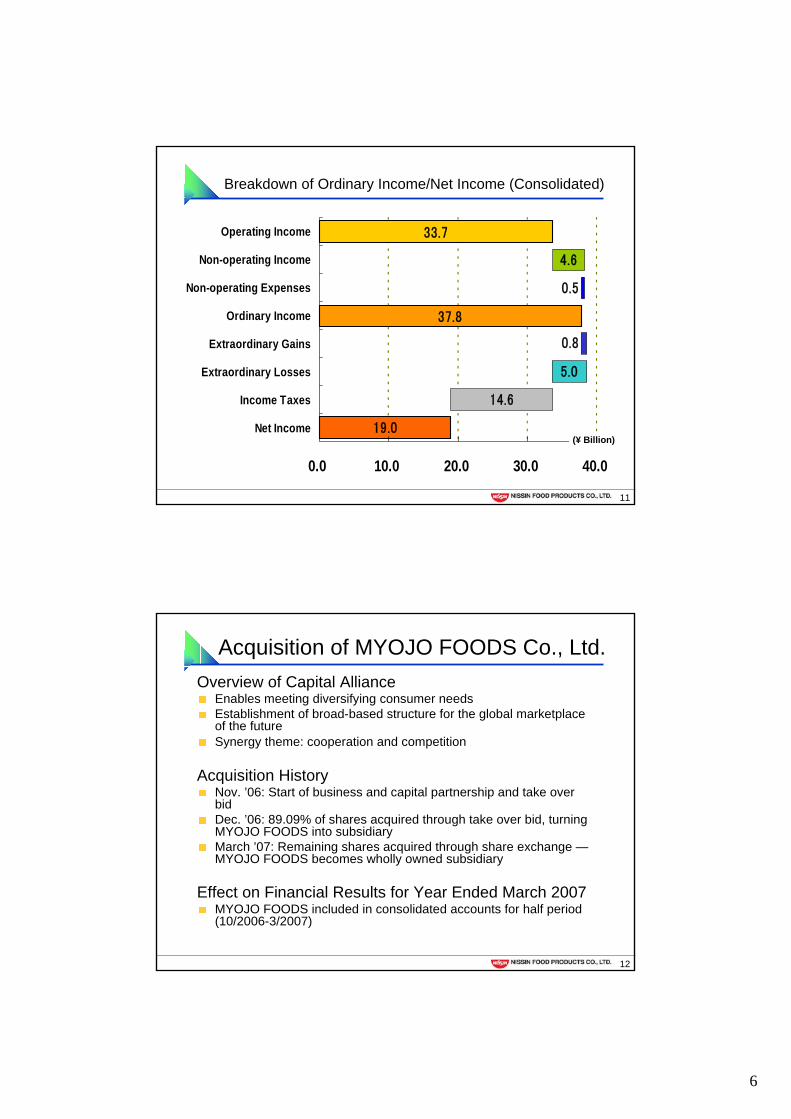
Breakdown of Ordinary Income/Net Income (Consolidated)
19.0
37.8
33.7
14.6
5.0
4.6
0.5
0.8
0.0 10.0 20.0 30.0 40.0
Net Income
Income Taxes
Extraordinary Losses
Extraordinary Gains
Ordinary Income
Non-operating Expenses
Non-operating Income
Operating Income
(¥ Billion)
12
Acquisition of MYOJO FOODS Co., Ltd. Overview of Capital Alliance
Enables meeting diversifying consumer needsEstablishment of broad-based structure for the global marketplace of the futureSynergy theme: cooperation and competition
Acquisition HistoryNov. ’06: Start of business and capital partnership and take over bidDec. ’06: 89.09% of shares acquired through take over bid, turning MYOJO FOODS into subsidiary March ’07: Remaining shares acquired through share exchange —MYOJO FOODS becomes wholly owned subsidiary
Effect on Financial Results for Year Ended March 2007MYOJO FOODS included in consolidated accounts for half period (10/2006-3/2007)
7
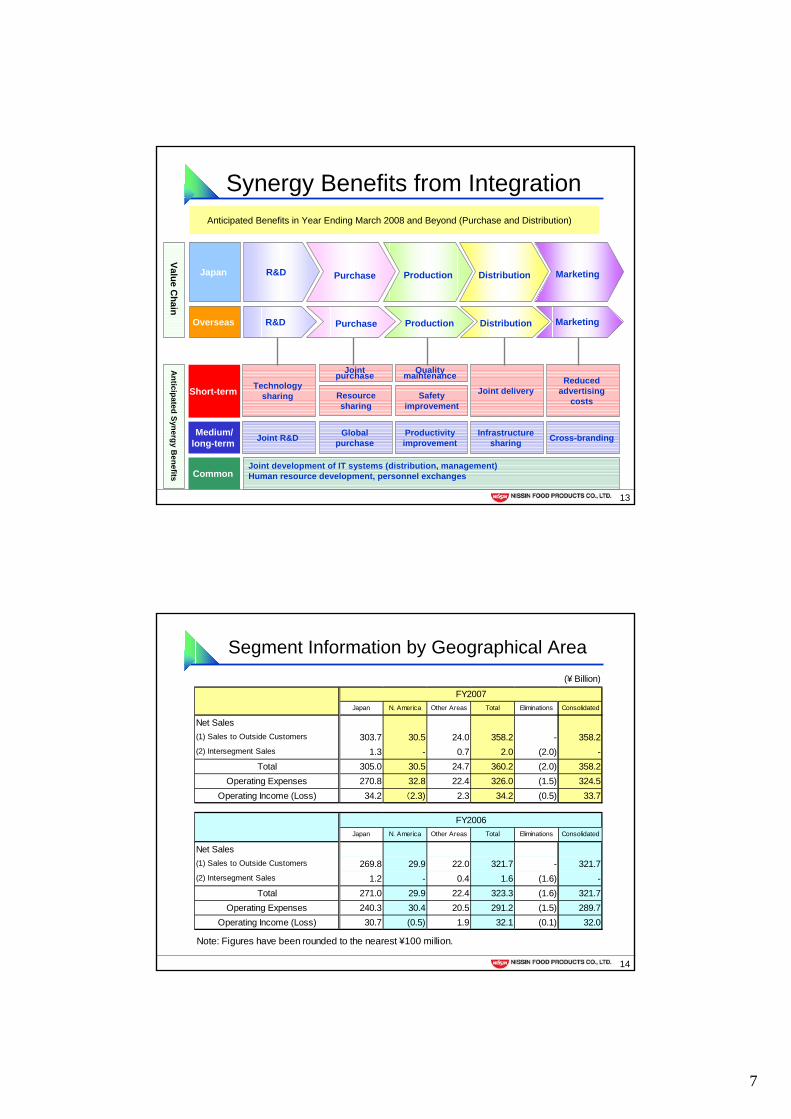
13
Anticipated Synergy B
enefits
Short-term
Joint development of IT systems (distribution, management)Human resource development, personnel exchanges
PurchaseR&D
Resource sharing
Joint R&D Productivity improvement
Infrastructure sharing Cross-branding Global
purchase
Joint purchaseTechnology
sharing
Quality maintenance
Joint deliveryReduced
advertising costs Safety
improvement
PurchaseR&D
Value Chain
Japan
Overseas
Medium/long-term
Common
Synergy Benefits from Integration
Production
Production
Distribution
Distribution Marketing
Marketing
Anticipated Benefits in Year Ending March 2008 and Beyond (Purchase and Distribution)
14
Segment Information by Geographical Area(¥ Billion)
Japan N. America Other Areas Total Eliminations Consolidated
Net Sales(1) Sales to Outside Customers 303.7 30.5 24.0 358.2 - 358.2(2) Intersegment Sales 1.3 - 0.7 2.0 (2.0) -
Total 305.0 30.5 24.7 360.2 (2.0) 358.2Operating Expenses 270.8 32.8 22.4 326.0 (1.5) 324.5
Operating Income (Loss) 34.2 (2.3) 2.3 34.2 (0.5) 33.7
Japan N. America Other Areas Total Eliminations Consolidated
Net Sales(1) Sales to Outside Customers 269.8 29.9 22.0 321.7 - 321.7(2) Intersegment Sales 1.2 - 0.4 1.6 (1.6) -
Total 271.0 29.9 22.4 323.3 (1.6) 321.7Operating Expenses 240.3 30.4 20.5 291.2 (1.5) 289.7
Operating Income (Loss) 30.7 (0.5) 1.9 32.1 (0.1) 32.0
Note: Figures have been rounded to the nearest ¥100 million.
FY2007
FY2006

8
15
Steady growth in total servings of instant noodles soldTotal year-on-year growth in demand in 2006 +2%(Nissin estimate)
Nissin sales volume growth Jan. – Dec. 2006(compared with previous year) U.S. +13% Mexico +0% U.S.
Sales volumes higher, but profitability eroded by sharply higher raw material costs
Steady sales growth of products in new categories:CHOW MEIN launched in Feb. 2004 Souper Meal launched in Sept. 2004 Noodle Soup launched in Nov. 2006
MexicoImproved earnings and income at Nissin Foods de Mexico S. A. de C. V.
Start of local production reduced distribution expenses and other costs
Maintained retail prices and improved earnings and income
North America Segment
16
Business in China Review of Fiscal 2006
Strong sales of pillow- and cup-type products in Hong Kong
Number of servings sold up 1% year-on-year
Sales up 4% year-on-year
Nissin Hualong Foods Co., Ltd. renamed as Jinmailang Foods Co., Ltd.
Number of servings sold steady at 7.2 billion in 2006
Policy for Fiscal 2007
Management strategies for Shanghai Nissin Foods and Guangdong Shunde Nissin Foods
Development of high-quality products to target high-income earners
Emphasis on urban market, especially Shanghai area
9
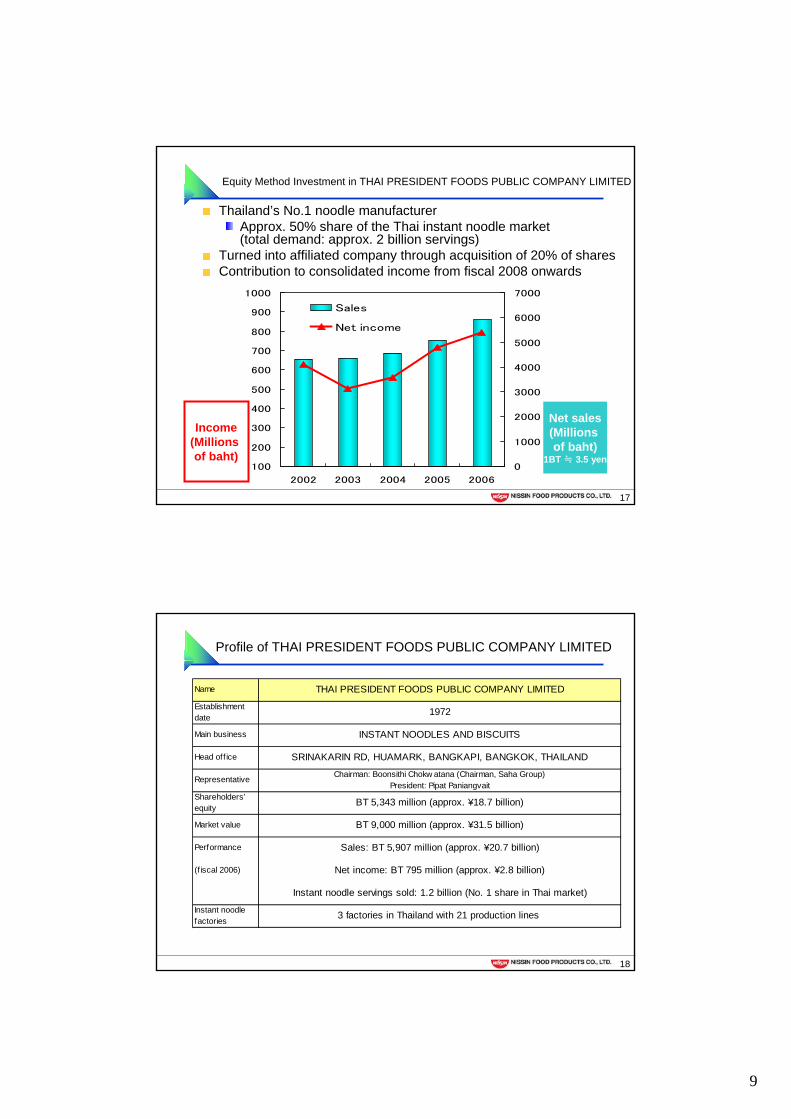
17
Thailand’s No.1 noodle manufacturerApprox. 50% share of the Thai instant noodle market (total demand: approx. 2 billion servings)
Turned into affiliated company through acquisition of 20% of sharesContribution to consolidated income from fiscal 2008 onwards
Equity Method Investment in THAI PRESIDENT FOODS PUBLIC COMPANY LIMITED
Net sales(Millions of baht)
1BT ≒ 3.5 yen100
200
300
400
500
600
700
800
900
1000
2002 2003 2004 2005 2006
0
1000
2000
3000
4000
5000
6000
7000
Sales
Net income
Income(Millions of baht)
18
Profile of THAI PRESIDENT FOODS PUBLIC COMPANY LIMITED
Name THAI PRESIDENT FOODS PUBLIC COMPANY LIMITED
Establishmentdate 1972
Main business INSTANT NOODLES AND BISCUITS
Head off ice SRINAKARIN RD, HUAMARK, BANGKAPI, BANGKOK, THAILAND
Representative Chairman: Boonsithi Chokw atana (Chairman, Saha Group)President: Pipat Paniangvait
Shareholders’equity BT 5,343 million (approx. ¥18.7 billion)
Market value BT 9,000 million (approx. ¥31.5 billion)
Performance Sales: BT 5,907 million (approx. ¥20.7 billion)
(f iscal 2006) Net income: BT 795 million (approx. ¥2.8 billion)
Instant noodle servings sold: 1.2 billion (No. 1 share in Thai market)
Instant noodlefactories 3 factories in Thailand with 21 production lines
10
19
Launch date: March 26 Launch region: Kanto area (Tokyo and 9 prefectures)Launch channels: convenience stores, variety stores,
department stores, mail order, internet sales
Eating is Fun with Eco Style
Beyond flavor. for the environment
(with reusable cup)
The new environment-friendly cup noodle Cup Noodle Refill on sale now
20
The Nissin Commitment to Safety and Consumer Confidence
Consumers’ increased emphasis on safety and confidence
Food Safety Research Institute (Japan) commences in June ’02
Nissin Shanghai Food Safety Research Institute commences in March ‘07
Safety checking centers for imported materials in Japan and China
Preventing food risks worldwide
11
21
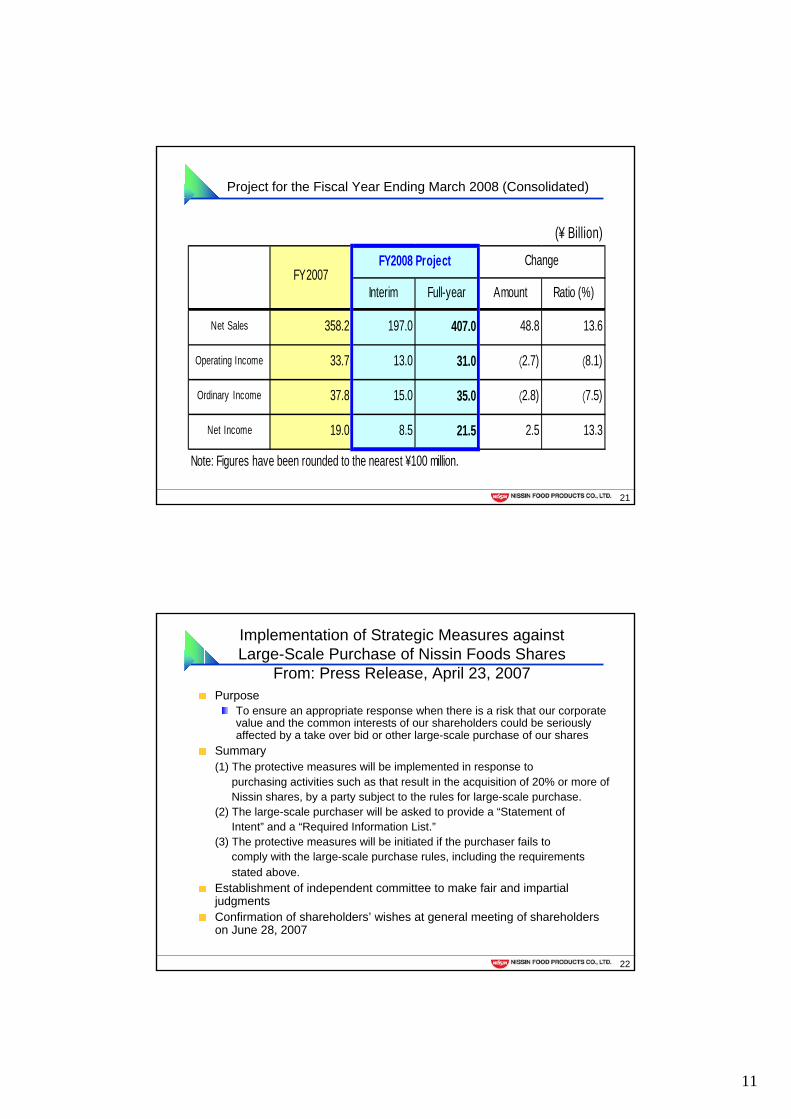
Project for the Fiscal Year Ending March 2008 (Consolidated)
(¥ Billion)
Interim Full-year Amount Ratio (%)
Net Sales 358.2 197.0 407.0 48.8 13.6
Operating Income 33.7 13.0 31.0 (2.7) (8.1)
Ordinary Income 37.8 15.0 35.0 (2.8) (7.5)
Net Income 19.0 8.5 21.5 2.5 13.3
Note: Figures have been rounded to the nearest ¥100 million.
FY2007FY2008 Project Change
22
Implementation of Strategic Measures against Large-Scale Purchase of Nissin Foods Shares
From: Press Release, April 23, 2007Purpose
To ensure an appropriate response when there is a risk that our corporate value and the common interests of our shareholders could be seriously affected by a take over bid or other large-scale purchase of our shares
Summary(1) The protective measures will be implemented in response to
purchasing activities such as that result in the acquisition of 20% or more ofNissin shares, by a party subject to the rules for large-scale purchase.
(2) The large-scale purchaser will be asked to provide a “Statement ofIntent” and a “Required Information List.”
(3) The protective measures will be initiated if the purchaser fails to comply with the large-scale purchase rules, including the requirementsstated above.
Establishment of independent committee to make fair and impartial judgmentsConfirmation of shareholders’ wishes at general meeting of shareholders on June 28, 2007
12
23
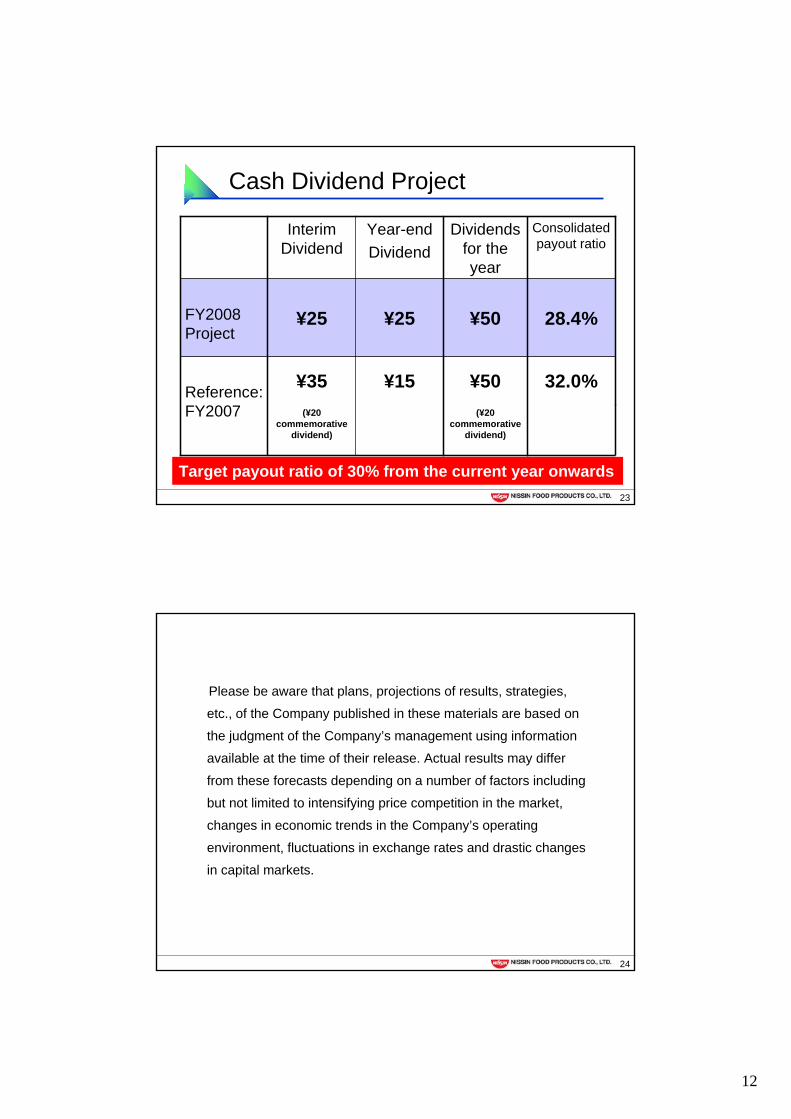
Cash Dividend Project
32.0%¥50¥15¥35Reference: FY2007 (¥20
commemorative dividend)
¥50
Dividends for the year
(¥20 commemorative
dividend)
28.4%¥25¥25FY2008Project
Consolidated payout ratio
Year-endDividend
InterimDividend
Target payout ratio of 30% from the current year onwards
24
Please be aware that plans, projections of results, strategies,
etc., of the Company published in these materials are based on
the judgment of the Company’s management using information
available at the time of their release. Actual results may differ
from these forecasts depending on a number of factors including
but not limited to intensifying price competition in the market,
changes in economic trends in the Company’s operating
environment, fluctuations in exchange rates and drastic changes
in capital markets.

13
25

Supplementary DataConsolidated and Nonconsolidated Resultsfor the Fiscal Year Ended March 31, 2007
May 11 , 2007
NISSIN FOOD PRODUCTS CO., LTD.
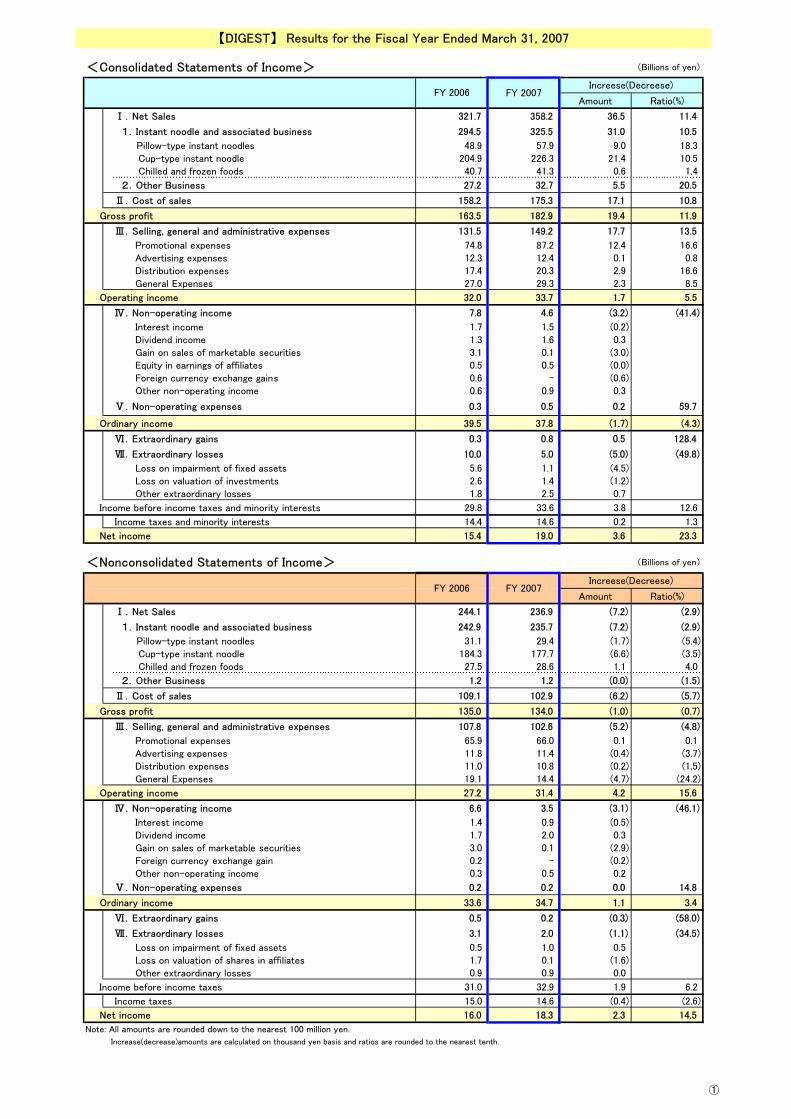
<Consolidated Statements of Income> (Billions of yen)
Amount Ratio(%)
Ⅰ.Net Sales 321.7 358.2 36.5 11.4
1.Instant noodle and associated business 294.5 325.5 31.0 10.5
Pillow-type instant noodles 48.9 57.9 9.0 18.3 Cup-type instant noodle 204.9 226.3 21.4 10.5 Chilled and frozen foods 40.7 41.3 0.6 1.4
2.Other Business 27.2 32.7 5.5 20.5
Ⅱ.Cost of sales 158.2 175.3 17.1 10.8
Gross profit 163.5 182.9 19.4 11.9
Ⅲ.Selling, general and administrative expenses 131.5 149.2 17.7 13.5
Promotional expenses 74.8 87.2 12.4 16.6 Advertising expenses 12.3 12.4 0.1 0.8 Distribution expenses 17.4 20.3 2.9 16.6 General Expenses 27.0 29.3 2.3 8.5
Operating income 32.0 33.7 1.7 5.5
Ⅳ.Non-operating income 7.8 4.6 (3.2) (41.4)
Interest income 1.7 1.5 (0.2) Dividend income 1.3 1.6 0.3 Gain on sales of marketable securities 3.1 0.1 (3.0) Equity in earnings of affiliates 0.5 0.5 (0.0) Foreign currency exchange gains 0.6 - (0.6) Other non-operating income 0.6 0.9 0.3
Ⅴ.Non-operating expenses 0.3 0.5 0.2 59.7
Ordinary income 39.5 37.8 (1.7) (4.3)
Ⅵ.Extraordinary gains 0.3 0.8 0.5 128.4
Ⅶ.Extraordinary losses 10.0 5.0 (5.0) (49.8)
Loss on impairment of fixed assets 5.6 1.1 (4.5) Loss on valuation of investments 2.6 1.4 (1.2) Other extraordinary losses 1.8 2.5 0.7
Income before income taxes and minority interests 29.8 33.6 3.8 12.6
Income taxes and minority interests 14.4 14.6 0.2 1.3
Net income 15.4 19.0 3.6 23.3
<Nonconsolidated Statements of Income> (Billions of yen)
Amount Ratio(%)
Ⅰ.Net Sales 244.1 236.9 (7.2) (2.9)
1.Instant noodle and associated business 242.9 235.7 (7.2) (2.9)
Pillow-type instant noodles 31.1 29.4 (1.7) (5.4) Cup-type instant noodle 184.3 177.7 (6.6) (3.5) Chilled and frozen foods 27.5 28.6 1.1 4.0
2.Other Business 1.2 1.2 (0.0) (1.5)
Ⅱ.Cost of sales 109.1 102.9 (6.2) (5.7)
Gross profit 135.0 134.0 (1.0) (0.7)
Ⅲ.Selling, general and administrative expenses 107.8 102.6 (5.2) (4.8)
Promotional expenses 65.9 66.0 0.1 0.1 Advertising expenses 11.8 11.4 (0.4) (3.7) Distribution expenses 11.0 10.8 (0.2) (1.5) General Expenses 19.1 14.4 (4.7) (24.2)
Operating income 27.2 31.4 4.2 15.6
Ⅳ.Non-operating income 6.6 3.5 (3.1) (46.1)
Interest income 1.4 0.9 (0.5) Dividend income 1.7 2.0 0.3 Gain on sales of marketable securities 3.0 0.1 (2.9) Foreign currency exchange gain 0.2 - (0.2) Other non-operating income 0.3 0.5 0.2
Ⅴ.Non-operating expenses 0.2 0.2 0.0 14.8
Ordinary income 33.6 34.7 1.1 3.4
Ⅵ.Extraordinary gains 0.5 0.2 (0.3) (58.0)
Ⅶ.Extraordinary losses 3.1 2.0 (1.1) (34.5)
Loss on impairment of fixed assets 0.5 1.0 0.5 Loss on valuation of shares in affiliates 1.7 0.1 (1.6) Other extraordinary losses 0.9 0.9 0.0
Income before income taxes 31.0 32.9 1.9 6.2
Income taxes 15.0 14.6 (0.4) (2.6)
Net income 16.0 18.3 2.3 14.5
Note: All amounts are rounded down to the nearest 100 million yen.
Increase(decrease)amounts are calculated on thousand yen basis and ratios are rounded to the nearest tenth.
【DIGEST】 Results for the Fiscal Year Ended March 31, 2007
FY 2006 FY 2007Increese(Decreese)
FY 2006 FY 2007Increese(Decreese)
①
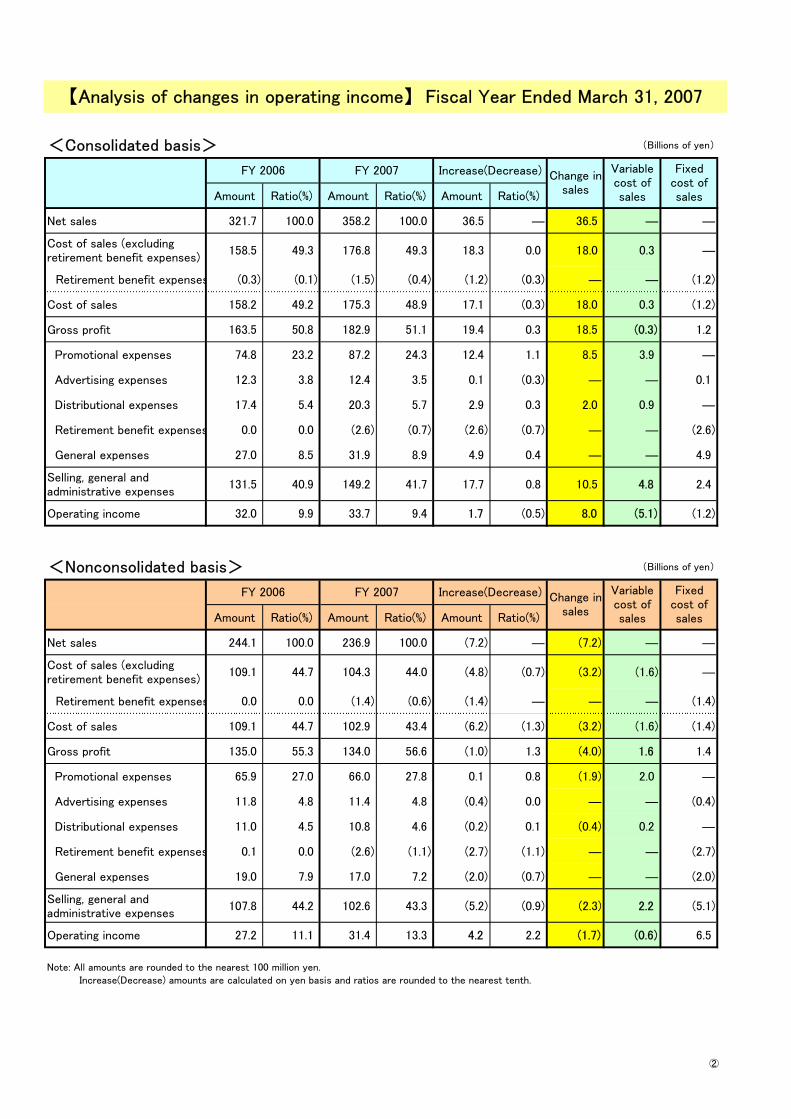
<Consolidated basis> (Billions of yen)
Amount Ratio(%) Amount Ratio(%) Amount Ratio(%)
Net sales 321.7 100.0 358.2 100.0 36.5 ― 36.5 ― ―
Cost of sales (excludingretirement benefit expenses)
158.5 49.3 176.8 49.3 18.3 0.0 18.0 0.3 ―
Retirement benefit expenses (0.3) (0.1) (1.5) (0.4) (1.2) (0.3) ― ― (1.2)
Cost of sales 158.2 49.2 175.3 48.9 17.1 (0.3) 18.0 0.3 (1.2)
Gross profit 163.5 50.8 182.9 51.1 19.4 0.3 18.5 (0.3) 1.2
Promotional expenses 74.8 23.2 87.2 24.3 12.4 1.1 8.5 3.9 ―
Advertising expenses 12.3 3.8 12.4 3.5 0.1 (0.3) ― ― 0.1
Distributional expenses 17.4 5.4 20.3 5.7 2.9 0.3 2.0 0.9 ―
Retirement benefit expenses 0.0 0.0 (2.6) (0.7) (2.6) (0.7) ― ― (2.6)
General expenses 27.0 8.5 31.9 8.9 4.9 0.4 ― ― 4.9
Selling, general andadministrative expenses
131.5 40.9 149.2 41.7 17.7 0.8 10.5 4.8 2.4
Operating income 32.0 9.9 33.7 9.4 1.7 (0.5) 8.0 (5.1) (1.2)
<Nonconsolidated basis> (Billions of yen)
Amount Ratio(%) Amount Ratio(%) Amount Ratio(%)
Net sales 244.1 100.0 236.9 100.0 (7.2) ― (7.2) ― ―
Cost of sales (excludingretirement benefit expenses)
109.1 44.7 104.3 44.0 (4.8) (0.7) (3.2) (1.6) ―
Retirement benefit expenses 0.0 0.0 (1.4) (0.6) (1.4) ― ― ― (1.4)
Cost of sales 109.1 44.7 102.9 43.4 (6.2) (1.3) (3.2) (1.6) (1.4)
Gross profit 135.0 55.3 134.0 56.6 (1.0) 1.3 (4.0) 1.6 1.4
Promotional expenses 65.9 27.0 66.0 27.8 0.1 0.8 (1.9) 2.0 ―
Advertising expenses 11.8 4.8 11.4 4.8 (0.4) 0.0 ― ― (0.4)
Distributional expenses 11.0 4.5 10.8 4.6 (0.2) 0.1 (0.4) 0.2 ―
Retirement benefit expenses 0.1 0.0 (2.6) (1.1) (2.7) (1.1) ― ― (2.7)
General expenses 19.0 7.9 17.0 7.2 (2.0) (0.7) ― ― (2.0)
Selling, general andadministrative expenses
107.8 44.2 102.6 43.3 (5.2) (0.9) (2.3) 2.2 (5.1)
Operating income 27.2 11.1 31.4 13.3 4.2 2.2 (1.7) (0.6) 6.5
Note: All amounts are rounded to the nearest 100 million yen. Increase(Decrease) amounts are calculated on yen basis and ratios are rounded to the nearest tenth.
【Analysis of changes in operating income】 Fiscal Year Ended March 31, 2007
Fixedcost ofsales
FY 2006 FY 2007 Increase(Decrease) Change insales
Variablecost ofsales
Fixedcost ofsales
FY 2006 FY 2007 Increase(Decrease) Change insales
Variablecost ofsales
②
Note: All amounts are rounded down to the nearest million yen.
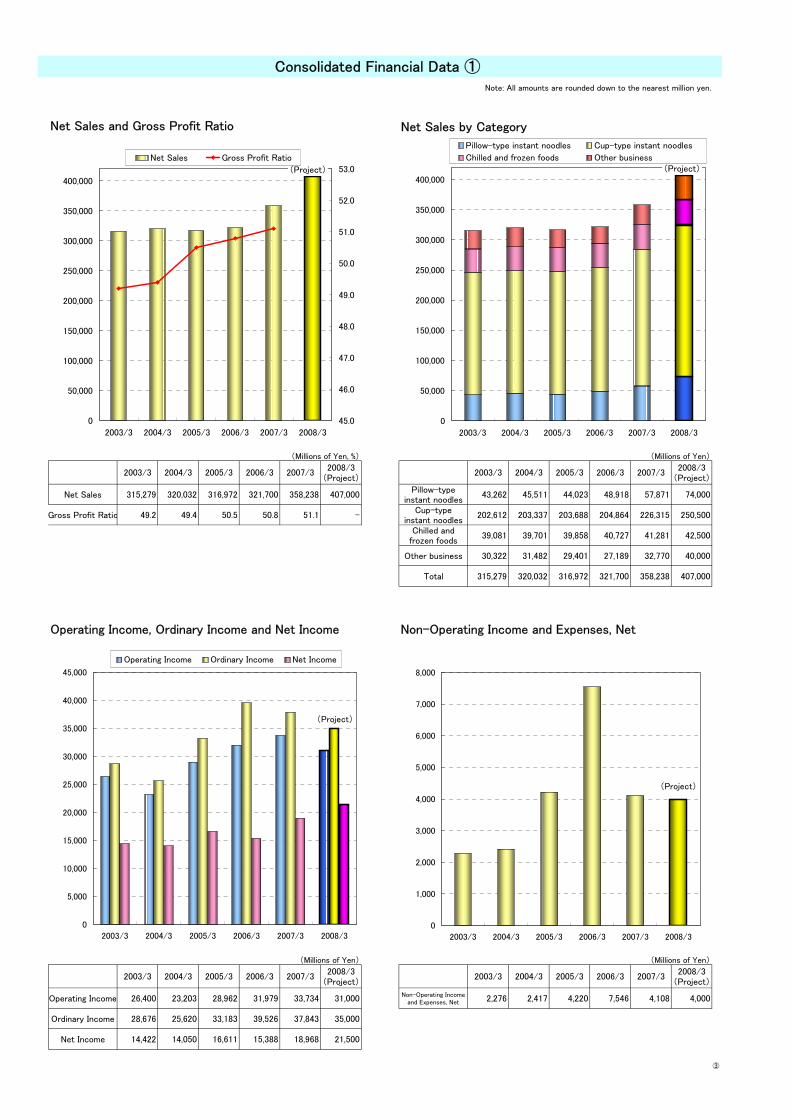
Net Sales and Gross Profit Ratio Net Sales by Category
(Millions of Yen, %) (Millions of Yen)
2008/3 2008/3(Project) (Project)
Net Sales 315,279 320,032 316,972 321,700 358,238 407,000Pillow-type
instant noodles43,262 45,511 44,023 48,918 57,871 74,000
Gross Profit Ratio 49.2 49.4 50.5 50.8 51.1 -Cup-type
instant noodles202,612 203,337 203,688 204,864 226,315 250,500
Chilled andfrozen foods
39,081 39,701 39,858 40,727 41,281 42,500
Other business 30,322 31,482 29,401 27,189 32,770 40,000
Total 315,279 320,032 316,972 321,700 358,238 407,000
Operating Income, Ordinary Income and Net Income Non-Operating Income and Expenses, Net
(Millions of Yen) (Millions of Yen)
2008/3 2008/3(Project) (Project)
Operating Income 26,400 23,203 28,962 31,979 33,734 31,000Non-Operating Income
and Expenses, Net 2,276 2,417 4,220 7,546 4,108 4,000
Ordinary Income 28,676 25,620 33,183 39,526 37,843 35,000
Net Income 14,422 14,050 16,611 15,388 18,968 21,500
Consolidated Financial Data ①
2007/32006/3
2006/3
2007/3 2003/3 2004/3 2005/32003/3 2004/3 2005/3 2006/3
2003/3 2004/3 2005/3 2006/3 2007/32007/3 2003/3 2004/3 2005/3
(Project)
0
50,000
100,000
150,000
200,000
250,000
300,000
350,000
400,000
2003/3 2004/3 2005/3 2006/3 2007/3 2008/3
45.0
46.0
47.0
48.0
49.0
50.0
51.0
52.0
53.0Net Sales Gross Profit Ratio
(Project)
0
50,000
100,000
150,000
200,000
250,000
300,000
350,000
400,000
2003/3 2004/3 2005/3 2006/3 2007/3 2008/3
Pillow-type instant noodles Cup-type instant noodles
Chilled and frozen foods Other business
(Project)
0
5,000
10,000
15,000
20,000
25,000
30,000
35,000
40,000
45,000
2003/3 2004/3 2005/3 2006/3 2007/3 2008/3
Operating Income Ordinary Income Net Income
(Project)
0
1,000
2,000
3,000
4,000
5,000
6,000
7,000
8,000
2003/3 2004/3 2005/3 2006/3 2007/3 2008/3
③

Note: All amounts are rounded down to the nearest million yen.
Operating Income, Ordinary Income and Net Income Advertising, Distribution and PromotionalRatios to Net Sales Expenses Ratios to Net Sales
(Millions of Yen, %) (Millions of Yen, %)
2008/3(Project)
Net Sales 315,279 320,032 316,972 321,700 358,238 407,000 Net Sales 315,279 320,032 316,972 321,700 358,238
Operating IncomeRatio
8.4 7.3 9.1 9.9 9.4 7.6Advertising
Expenses Ratio4.4 4.4 4.1 3.8 3.5
Ordinary IncomeRatio
9.1 8.0 10.5 12.3 10.6 8.6Distribution
Expenses Ratio5.4 5.4 5.5 5.4 5.7
Net Income Ratio 4.6 4.4 5.2 4.8 5.3 5.3Promotional
Expenses Ratio22.8 22.9 23.0 23.2 24.3
Capital Investment, Depreciation & Amortization Total Liabilities and Net Assets, Net Assets andand R&D Expenses Equity Ratio
(Millions of Yen) (Millions of Yen, %)
2008/3(Project)
Capital Investment 6,965 6,765 3,251 3,516 6,151 7,000Total Liabilitiesand Net Assets
331,994 343,644 361,104 366,801 410,407
Depreciation &Amortization
7,459 7,078 6,674 5,976 6,187 8,000 Net assets 233,707 244,439 258,138 263,199 288,476
R&D Expenses 2,757 2,761 2,697 2,726 3,163 - Equity Ratio 70.4 71.1 71.5 71.8 68.7
※1 From the Fiscal Year Ended March 31, 2007, <Shareholders' equity> is changed to <Net assets>, and shows the amount including <Minority interests> of 6,724million yen.
2006/3 2007/32004/3 2005/32003/3
2007/3
2003/3 2004/3 2005/3
2003/3 2004/3 2005/3 2006/3
2006/3
※2 <Shareholders' equity ratio> is also changed to <Equity ratio>.
Consolidated Financial Data ②
2007/32003/3 2004/3 2005/3 2006/3
2007/3
(Project)
0
50,000
100,000
150,000
200,000
250,000
300,000
350,000
400,000
2003/3 2004/3 2005/3 2006/3 2007/3 2008/3
0.0
2.0
4.0
6.0
8.0
10.0
12.0
14.0
16.0
Net Sales Operating Income RatioOrdinary Income Ratio Net Income Ratio
0
50,000
100,000
150,000
200,000
250,000
300,000
350,000
400,000
2003/3 2004/3 2005/3 2006/3 2007/3
0.0
4.0
8.0
12.0
16.0
20.0
24.0
28.0
32.0
Net Sales Advertising Expenses Ratio
Distribution Expenses Ratio Promotional Expenses Ratio
0
50,000
100,000
150,000
200,000
250,000
300,000
350,000
400,000
450,000
2003/3 2004/3 2005/3 2006/3 2007/3
67.0
68.0
69.0
70.0
71.0
72.0
73.0
74.0
75.0
Total Liabilities and Net AssetsNet assetsEquity Ratio
(Project)
0
1,000
2,000
3,000
4,000
5,000
6,000
7,000
8,000
9,000
2003/3 2004/3 2005/3 2006/3 2007/3 2008/3
Capital Investment Depreciation & AmortizationR&D Expenses
④
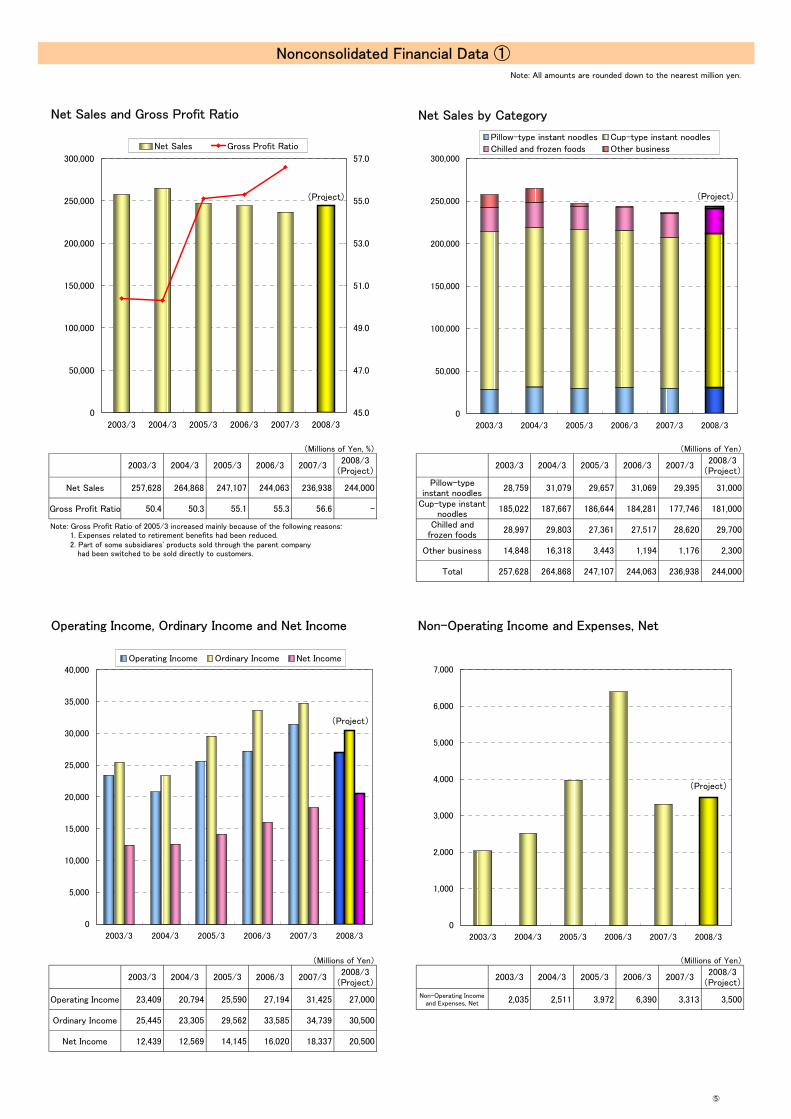
Note: All amounts are rounded down to the nearest million yen.
Net Sales and Gross Profit Ratio Net Sales by Category
(Millions of Yen, %) (Millions of Yen)
2008/3 2008/3(Project) (Project)
Net Sales 257,628 264,868 247,107 244,063 236,938 244,000Pillow-type
instant noodles28,759 31,079 29,657 31,069 29,395 31,000
Gross Profit Ratio 50.4 50.3 55.1 55.3 56.6 -Cup-type instant
noodles185,022 187,667 186,644 184,281 177,746 181,000
Chilled andfrozen foods
28,997 29,803 27,361 27,517 28,620 29,700
Other business 14,848 16,318 3,443 1,194 1,176 2,300
Total 257,628 264,868 247,107 244,063 236,938 244,000
Operating Income, Ordinary Income and Net Income Non-Operating Income and Expenses, Net
(Millions of Yen) (Millions of Yen)
2008/3 2008/3(Project) (Project)
Operating Income 23,409 20,794 25,590 27,194 31,425 27,000Non-Operating Income
and Expenses, Net 2,035 2,511 3,972 6,390 3,313 3,500
Ordinary Income 25,445 23,305 29,562 33,585 34,739 30,500
Net Income 12,439 12,569 14,145 16,020 18,337 20,500
2007/32007/3 2003/3 2004/3 2005/32003/3 2004/3 2005/3 2006/3 2006/3
2007/3 2003/3 2004/3 2005/32003/3 2004/3 2005/3 2006/3
Note: Gross Profit Ratio of 2005/3 increased mainly because of the following reasons: 1. Expenses related to retirement benefits had been reduced. 2. Part of some subsidiares' products sold through the parent company had been switched to be sold directly to customers.
Nonconsolidated Financial Data ①
2007/32006/3
(Project)
0
50,000
100,000
150,000
200,000
250,000
300,000
2003/3 2004/3 2005/3 2006/3 2007/3 2008/3
45.0
47.0
49.0
51.0
53.0
55.0
57.0
Net Sales Gross Profit Ratio
(Project)
0
50,000
100,000
150,000
200,000
250,000
300,000
2003/3 2004/3 2005/3 2006/3 2007/3 2008/3
Pillow-type instant noodles Cup-type instant noodles
Chilled and frozen foods Other business
(Project)
0
5,000
10,000
15,000
20,000
25,000
30,000
35,000
40,000
2003/3 2004/3 2005/3 2006/3 2007/3 2008/3
Operating Income Ordinary Income Net Income
(Project)
0
1,000
2,000
3,000
4,000
5,000
6,000
7,000
2003/3 2004/3 2005/3 2006/3 2007/3 2008/3
⑤

Note: All amounts are rounded down to the nearest million yen.
Operating Income, Ordinary Income and Net Income Advertising, Distribution and PromotionalRatios to Net Sales Expenses Ratios to Net Sales
(Millions of Yen, %) (Millions of Yen, %)
2008/3(Project)
Net Sales 257,628 264,868 247,107 244,063 236,938 244,000 Net Sales 257,628 264,868 247,107 244,063 236,938
Operating IncomeRatio
9.1 7.8 10.4 11.1 13.3 11.1Advertising
Expenses Ratio5.2 5.1 5.0 4.8 4.8
Ordinary IncomeRatio
9.9 8.8 12.0 13.8 14.7 12.5Distribution
Expenses Ratio4.4 4.3 4.7 4.5 4.6
Net Income Ratio 4.8 4.7 5.7 6.6 7.7 8.4Promotional
Expenses Ratio25.0 24.8 26.4 27.0 27.8
Capital Investment, Depreciation & Amortization Total Liabilities and Net Assets, Net Assets andand R&D Expenses Equity Ratio
(Millions of Yen) (Millions of Yen, %)
2008/3(Project)
Capital Investment 4,076 1,265 1,569 1,154 2,279 3,000Total Liabilitiesand Net Assets
290,837 303,711 319,086 319,095 336,091
Depreciation &Amortization
4,349 3,995 3,340 2,873 2,652 3,400 Net assets 218,613 230,640 242,529 244,392 261,565
R&D Expenses 2,396 2,422 2,399 2,364 2,317 - Equity Ratio 75.2 75.9 76.0 76.6 77.8
※1 From the Fiscal Year Ended March 31, 2007, <Shareholders' equity> is changed to <Net assets>,※2 <Shareholders' equity ratio> is also changed to <Equity ratio>.
2007/3 2003/3 2004/3 2005/32003/3 2004/3 2005/3 2006/3
2006/3
Nonconsolidated Financial Data ②
2007/32003/3
2006/3 2007/3
2003/3 2004/3 2005/3 2006/3 2007/3 2004/3 2005/3
(Project)
0
50,000
100,000
150,000
200,000
250,000
300,000
2003/3 2004/3 2005/3 2006/3 2007/3 2008/3
0.0
3.0
6.0
9.0
12.0
15.0
18.0
Net Sales Operating Income RatioOrdinary Income Ratio Net Income Ratio
0
50,000
100,000
150,000
200,000
250,000
300,000
2003/3 2004/3 2005/3 2006/3 2007/3
0.0
5.0
10.0
15.0
20.0
25.0
30.0
Net Sales Advertising Expenses Ratio
Distribution Expenses Ratio Promotional Expenses Ratio
0
50,000
100,000
150,000
200,000
250,000
300,000
350,000
400,000
2003/3 2004/3 2005/3 2006/3 2007/3
72.0
73.0
74.0
75.0
76.0
77.0
78.0
79.0
Total Liabilities and Net AssetsNet assetsEquity Ratio
(Project)
0
500
1,000
1,500
2,000
2,500
3,000
3,500
4,000
4,500
5,000
2003/3 2004/3 2005/3 2006/3 2007/3 2008/3
Capital Investment Depreciation & Amortization
R&D Expenses
⑥
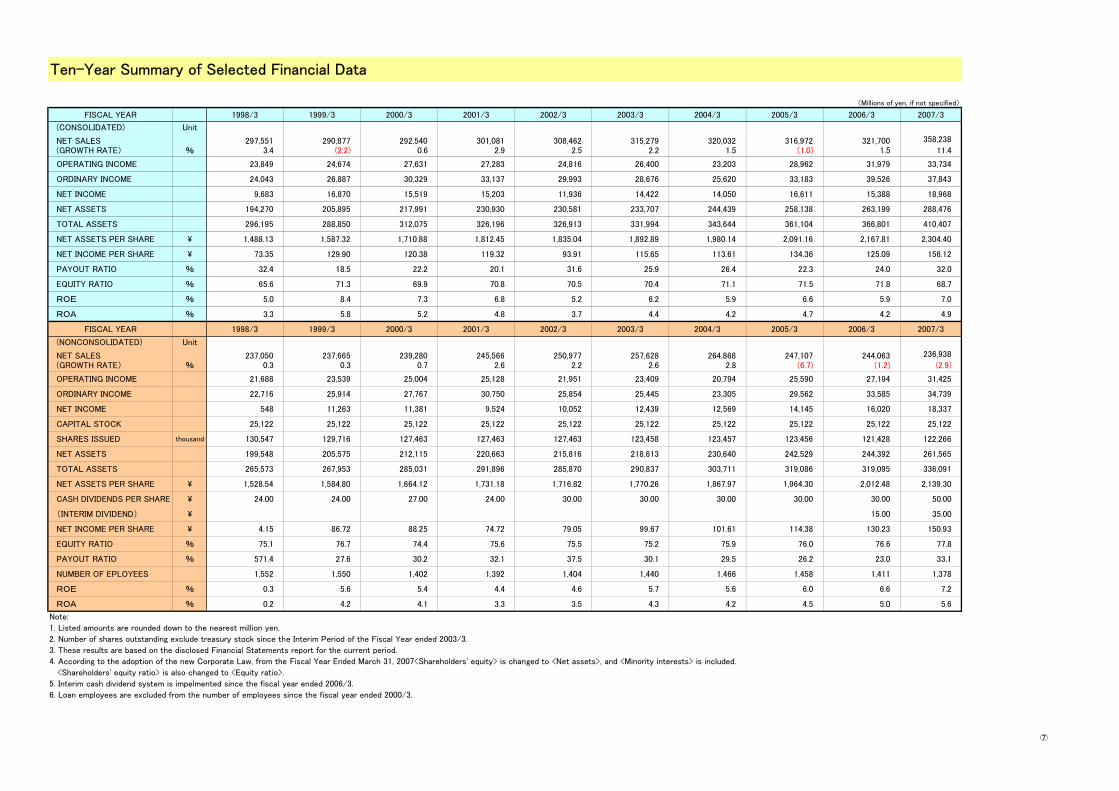
Ten-Year Summary of Selected Financial Data
(Millions of yen, if not specified)
FISCAL YEAR 1998/3 1999/3 2000/3 2001/3 2002/3 2003/3 2004/3 2005/3 2006/3 2007/3
(CONSOLIDATED) Unit
NET SALES 297,551 290,877 292,540 301,081 308,462 315,279 320,032 316,972 321,700 358,238
(GROWTH RATE) % 3.4 (2.2) 0.6 2.9 2.5 2.2 1.5 (1.0) 1.5 11.4
OPERATING INCOME 23,849 24,674 27,631 27,283 24,816 26,400 23,203 28,962 31,979 33,734
ORDINARY INCOME 24,043 26,887 30,329 33,137 29,993 28,676 25,620 33,183 39,526 37,843
NET INCOME 9,683 16,870 15,519 15,203 11,936 14,422 14,050 16,611 15,388 18,968
NET ASSETS 194,270 205,895 217,991 230,930 230,581 233,707 244,439 258,138 263,199 288,476
TOTAL ASSETS 296,195 288,850 312,075 326,196 326,913 331,994 343,644 361,104 366,801 410,407
NET ASSETS PER SHARE \ 1,488.13 1,587.32 1,710.88 1,812.45 1,835.04 1,892.89 1,980.14 2,091.16 2,167.81 2,304.40
NET INCOME PER SHARE \ 73.35 129.90 120.38 119.32 93.91 115.65 113.61 134.36 125.09 156.12
PAYOUT RATIO % 32.4 18.5 22.2 20.1 31.6 25.9 26.4 22.3 24.0 32.0
EQUITY RATIO % 65.6 71.3 69.9 70.8 70.5 70.4 71.1 71.5 71.8 68.7
ROE % 5.0 8.4 7.3 6.8 5.2 6.2 5.9 6.6 5.9 7.0
ROA % 3.3 5.8 5.2 4.8 3.7 4.4 4.2 4.7 4.2 4.9
FISCAL YEAR 1998/3 1999/3 2000/3 2001/3 2002/3 2003/3 2004/3 2005/3 2006/3 2007/3
(NONCONSOLIDATED) Unit
NET SALES 237,050 237,665 239,280 245,566 250,977 257,628 264,868 247,107 244,063 236,938
(GROWTH RATE) % 0.3 0.3 0.7 2.6 2.2 2.6 2.8 (6.7) (1.2) (2.9)
OPERATING INCOME 21,688 23,539 25,004 25,128 21,951 23,409 20,794 25,590 27,194 31,425
ORDINARY INCOME 22,716 25,914 27,767 30,750 25,854 25,445 23,305 29,562 33,585 34,739
NET INCOME 548 11,263 11,381 9,524 10,052 12,439 12,569 14,145 16,020 18,337
CAPITAL STOCK 25,122 25,122 25,122 25,122 25,122 25,122 25,122 25,122 25,122 25,122
SHARES ISSUED thousand 130,547 129,716 127,463 127,463 127,463 123,458 123,457 123,456 121,428 122,266
NET ASSETS 199,548 205,575 212,115 220,663 215,816 218,613 230,640 242,529 244,392 261,565
TOTAL ASSETS 265,573 267,953 285,031 291,896 285,870 290,837 303,711 319,086 319,095 336,091
NET ASSETS PER SHARE \ 1,528.54 1,584.80 1,664.12 1,731.18 1,716.82 1,770.26 1,867.97 1,964.30 2,012.48 2,139.30
CASH DIVIDENDS PER SHARE \ 24.00 24.00 27.00 24.00 30.00 30.00 30.00 30.00 30.00 50.00
(INTERIM DIVIDEND) \ 15.00 35.00
NET INCOME PER SHARE \ 4.15 86.72 88.25 74.72 79.05 99.67 101.61 114.38 130.23 150.93
EQUITY RATIO % 75.1 76.7 74.4 75.6 75.5 75.2 75.9 76.0 76.6 77.8
PAYOUT RATIO % 571.4 27.6 30.2 32.1 37.5 30.1 29.5 26.2 23.0 33.1
NUMBER OF EPLOYEES 1,552 1,550 1,402 1,392 1,404 1,440 1,466 1,458 1,411 1,378
ROE % 0.3 5.6 5.4 4.4 4.6 5.7 5.6 6.0 6.6 7.2
ROA % 0.2 4.2 4.1 3.3 3.5 4.3 4.2 4.5 5.0 5.6
Note:
1. Listed amounts are rounded down to the nearest million yen.
2. Number of shares outstanding exclude treasury stock since the Interim Period of the Fiscal Year ended 2003/3.
3. These results are based on the disclosed Financial Statements report for the current period.
4. According to the adoption of the new Corporate Law, from the Fiscal Year Ended March 31, 2007<Shareholders' equity> is changed to <Net assets>, and <Minority interests> is included.
<Shareholders' equity ratio> is also changed to <Equity ratio>.
5. Interim cash dividend system is impelmented since the fiscal year ended 2006/3.
6. Loan employees are excluded from the number of employees since the fiscal year ended 2000/3.
⑦

(Billions of Yen, %)
Interim period ended Interim period ended March 31,2006 March 31,2007
Amount %
39.9 39.3 (0.6) (1.5)
Ⅱ. Operating income 0.8 0.1 (0.7) (84.0)
Ⅲ. Ordinary income 0.8 0.2 (0.6) (76.0)
Ⅵ.Extraordinary gains 0.4 0.5 0.1
Ⅶ.Extraodinary losses 0.4 1.1 0.7
0.8 (0.4) (1.2) ―
0.3 0.3 (0.0)
Net income 0.5 (0.7) (1.2) ―
Income taxes and minorityinterests
Income before income taxes andminority interests
MYOJO FOODS Selected Financial data for the Interim Period ended March 31, 2007
Ⅰ.Net sales
Increase(decrease)
⑧