INVESTOR PRESENTATION - SNL · oc tober 2015investor presentation ... ess markets non ess markets...
47
INVESTOR PRESENTATION JUNE 2016
Transcript of INVESTOR PRESENTATION - SNL · oc tober 2015investor presentation ... ess markets non ess markets...
O C T O B E R 2 0 1 5INVESTOR PRESENTATIONJ U N E 2 0 1 6

SAFE HARBOR DISCLOSURE Certain statements in this presentation, which are not historical facts, may be considered forward-looking statements within the meaning of the federal
securities laws. The forward looking statements, some of which can be identified by terms and phrases such as “forecast”, “estimate”, “expect”, “anticipate”, “should”, “could”, “may”, and similar expressions, reflect the current views of Essex Property Trust, Inc. (“Essex” or the “Company”) and its affiliates with respect to future events and are subject to risks and uncertainties. Such forward-looking statements involve the risk that actual results could be materially different from those described in such forward-looking statements. Factors that could cause actual results to be materially different are discussed under the caption “Risk Factors” in Item 1A of the Company’s Report on Form 10-K for the year ended December 31, 2015. All forward-looking statements and reasons why results may differ included in this presentation are made of the date hereof, and we assume no obligation to update any such forward-looking statements or reasons why actual results may differ.
ABOUT ESSEX
WEST COAST INVESTMENT STRATEGY
INVESTMENT OVERVIEW
FINANCIAL PERFORMANCE, CAPITAL MANAGEMENT& 2016 GUIDANCE
APPENDIX• TRACK RECORD• WEST COAST OVERVIEW• TECH INDUSTRY: THEN & NOW• ESSEX PORTFOLIO• SUSTAINABIL ITY
PAGE(S)2 – 3
4 – 9
10 – 14
15 – 23
24 25 – 2930 – 33 34 – 3940 – 4344 – 46
TAB LE OF CONTENTS
Pacific Electric Lots, Los Angeles, CA
1

(1) Represents percent of pro rata NOI as of 3/31/16.(2) East Bay includes Alameda and Contra Costa Counties.(3) Multifamily REITs represent the total return of 7 peers through 12/31/15.
ESSEX I S THE ONLY PUB L I C MULTI FAMILY RE I T DEDI CATED EXCLUSI VELY TO THE WEST COAST
Northern CA,39% of NOI(1)
Seattle,17% of NOI(1)
2
Southern CA,44% of NOI(1)
San Francisco MD 9%East Bay(2) 13%Santa Clara 18%
Ventura 5%Los Angeles 20%Orange County 11%San Diego 8%

KEY STRATEG IC OB JEC T I VES
The DylanLos Angeles, CA
3

STRONG WEST COAST FUNDAMENTALS

Trailing 3 Month Job GrowthAs of April 2016
U.S. Avg. = 1.9%
Essex Portfolio Wtd. Avg. = 3.0%(1)
ESS Markets Non ESS Markets
ROB UST WEST COAST JOB G ROWTH
WEST COAST JOB GROWTH OUTPACES THE U.S. AND OTHER MAJOR MSA’S
Source: BLS (not seasonally adjusted)
(1) For those markets included in this graph which represents 99% of Essex’s NOI at the Company’s pro rata share as of 3/31/16.5
0%
1%
2%
3%
4%
5%
San
Fra
nci
sco
San
Jo
se
Seat
tle
Ora
nge
Co
un
ty
San
Die
go
Los
An
gele
s
Oak
lan
d
Was
hin
gto
n D
C
New
Yo
rk
Bo
sto
n
Ven
tura
12
14
16
18
20
22
24
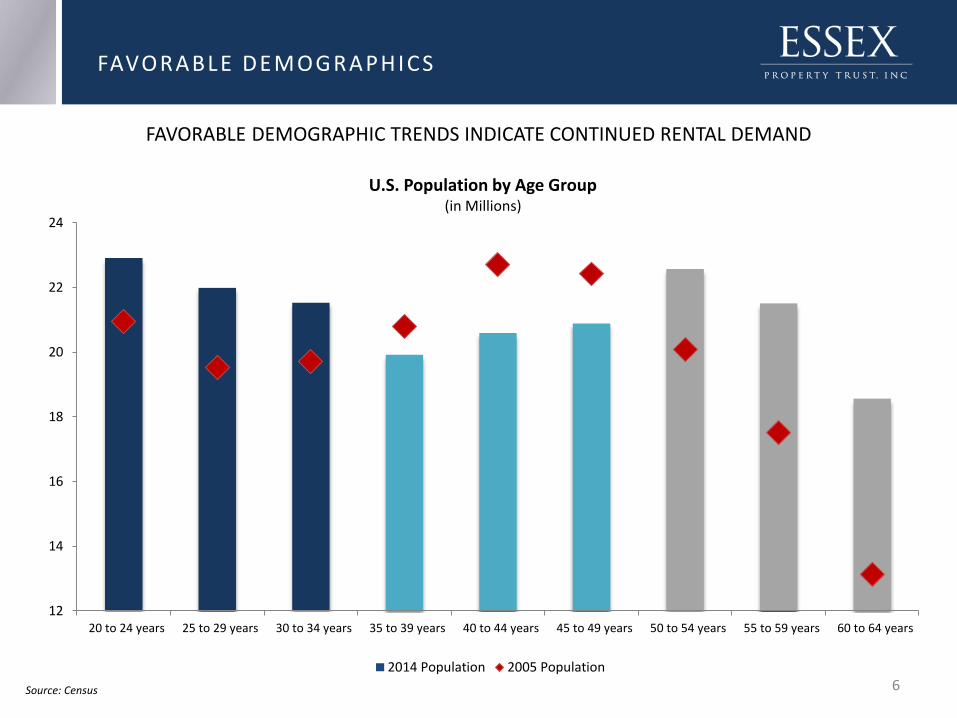
20 to 24 years 25 to 29 years 30 to 34 years 35 to 39 years 40 to 44 years 45 to 49 years 50 to 54 years 55 to 59 years 60 to 64 years
2014 Population 2005 Population
FAVORABLE DEMOGRAPHIC TRENDS INDICATE CONTINUED RENTAL DEMAND
Source: Census
FAVORABLE DEMOG RAPHI CS
U.S. Population by Age Group(in Millions)
6
0%
2%
4%
6%
8%
San
Fra
nci
sco
San
Jo
se
Seat
tle
Los
An
gele
s
Ora
nge
Co
un
ty
Ven
tura
San
Die
go
Oak
lan
d
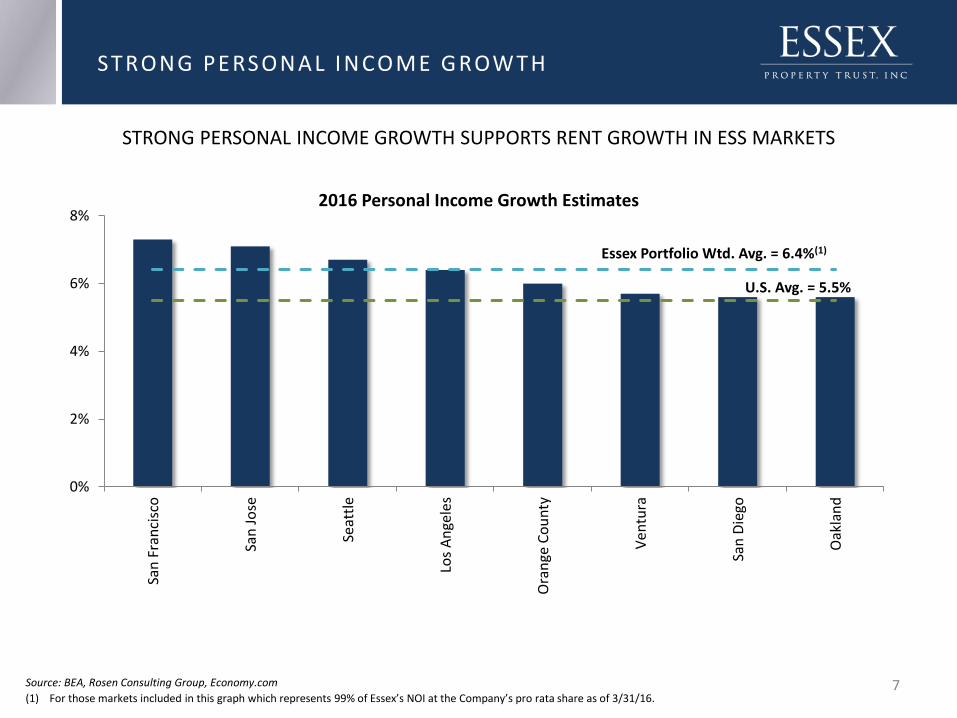
2016 Personal Income Growth Estimates
U.S. Avg. = 5.5%
Essex Portfolio Wtd. Avg. = 6.4%(1)
STRONG PERSONAL INCOME GROWTH SUPPORTS RENT GROWTH IN ESS MARKETS
STRONG PERSONAL I NCOME G ROWTH
Source: BEA, Rosen Consulting Group, Economy.com
(1) For those markets included in this graph which represents 99% of Essex’s NOI at the Company’s pro rata share as of 3/31/16.7
0.0%
0.5%
1.0%
1.5%
2.0%
Dec
-90
Dec
-92
Dec
-94
Dec
-96
Dec
-98
Dec
-00
Dec
-02
Dec
-04
Dec
-06
Dec
-08
Dec
-10
Dec
-12
Dec
-14
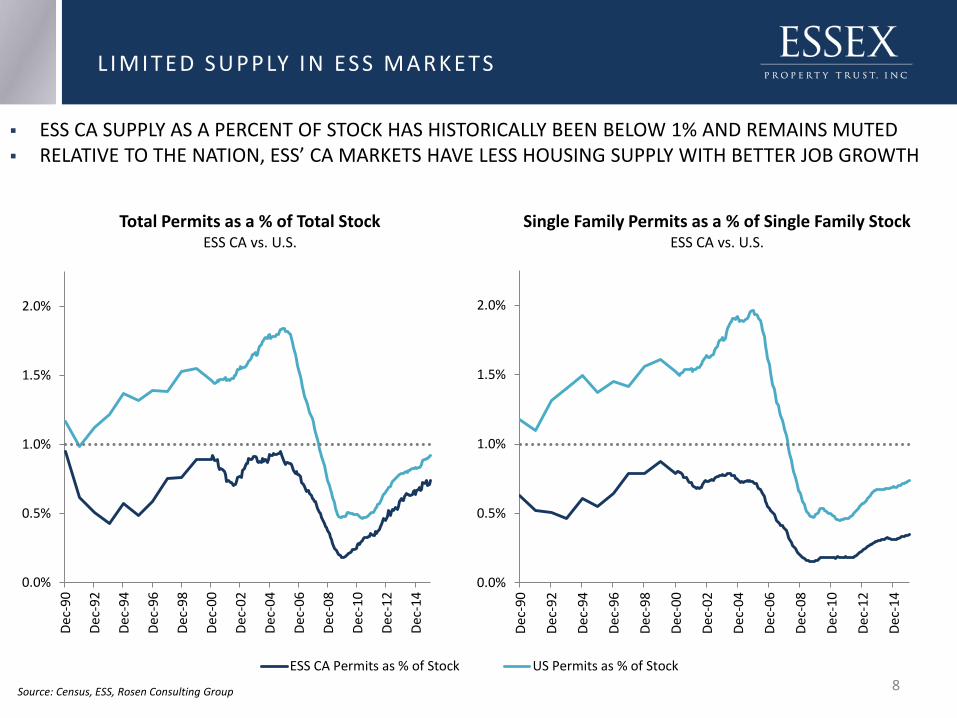
Single Family Permits as a % of Single Family StockESS CA vs. U.S.
ESS CA Permits as % of Stock US Permits as % of Stock
Source: Census, ESS, Rosen Consulting Group
L I MI TED SUPPLY I N ESS MARKETS
ESS CA SUPPLY AS A PERCENT OF STOCK HAS HISTORICALLY BEEN BELOW 1% AND REMAINS MUTED RELATIVE TO THE NATION, ESS’ CA MARKETS HAVE LESS HOUSING SUPPLY WITH BETTER JOB GROWTH
0.0%
0.5%
1.0%
1.5%
2.0%
Dec
-90
Dec
-92
Dec
-94
Dec
-96
Dec
-98
Dec
-00
Dec
-02
Dec
-04
Dec
-06
Dec
-08
Dec
-10
Dec
-12
Dec
-14
Total Permits as a % of Total StockESS CA vs. U.S.
8
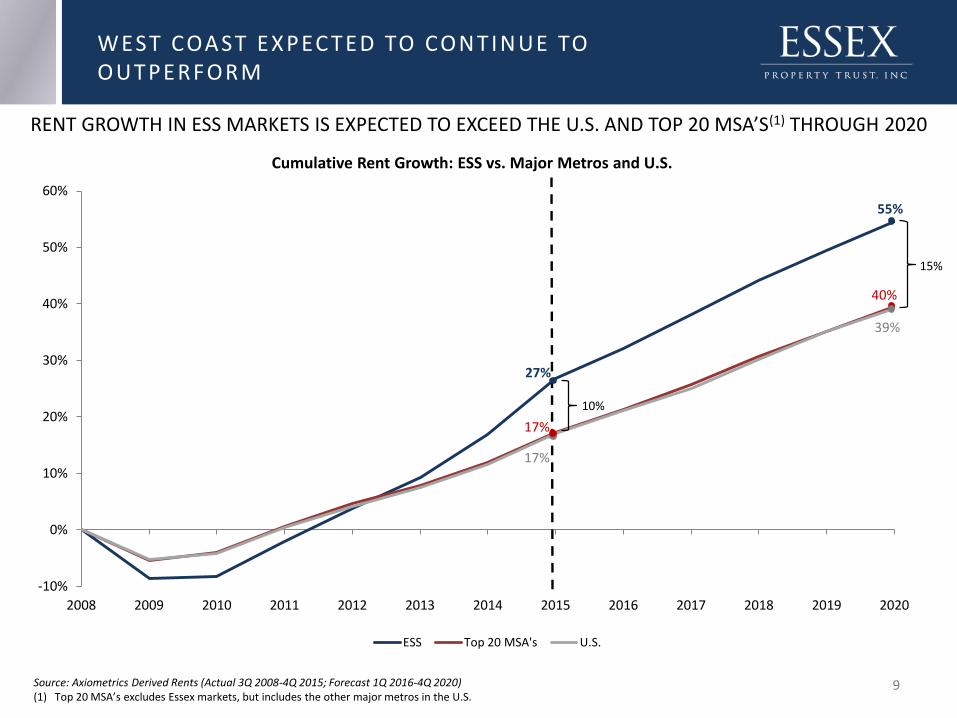
27%
55%
17%
40%
17%
39%
-10%
0%
10%
20%
30%
40%
50%
60%
2008 2009 2010 2011 2012 2013 2014 2015 2016 2017 2018 2019 2020
ESS Top 20 MSA's U.S.
15%
RENT GROWTH IN ESS MARKETS IS EXPECTED TO EXCEED THE U.S. AND TOP 20 MSA’S(1) THROUGH 2020
WEST COAST EXPEC TED TO CONTINUE TO OUTPERFORM
Source: Axiometrics Derived Rents (Actual 3Q 2008-4Q 2015; Forecast 1Q 2016-4Q 2020)(1) Top 20 MSA’s excludes Essex markets, but includes the other major metros in the U.S.
9
Cumulative Rent Growth: ESS vs. Major Metros and U.S.
10%

INVESTMENT OVERVIEW

ACQUISITIONS
Improve the NAV/sh, cash flow/sh and growth prospects of the Company
DEVELOPMENT
Develop high-quality tenant desired apartment homes near transportation nodes
REDEVELOPMENT
Focused on rent justified improvements to maximize NOI and value
CO-INVESTMENT PLATFORM
Facilitates growth via private capital and provides attractive risk adjusted returns
CORE COMPETEN C IES TO C REATE VA LUE
One South Market
Avant
Park 20
Bunker Hill(Rendering)
11

STRATEG IC C A PI TA L A L LOC ATI ON
INVESTMENT ACTIVITY SINCE THE BEGINNING OF 2015
12
82% of acquisition investments have been in Southern California
67% of disposition activity has been in Northern California
Improved portfolio by selling older properties situated in non-core locations
Acquisitions
Property Name LocationYear
AcquiredApartment
HomesAge
ContractPrice
Price/ Home
8th & Hope Southern CA 2015 290 2 $ 200,000 $ 690
The Huxley(1) Southern CA 2015 187 2 $ 48,784 $ 522
The Dylan(1) Southern CA 2015 184 2 $ 51,266 $ 557
Reveal(1) Southern CA 2015 438 6 $ 73,013 $ 337
Avant Southern CA 2015 440 2 $ 172,000 $ 391
Enso Northern CA 2015 183 2 $ 93,000 $ 508
Mio Northern CA 2016 103 1 $ 51,300 $ 498
Form 15 Southern CA 2016 242 2 $ 97,400 $ 402
Total/Wtd. Average 2,067 3 $ 786,763 $ 465
Dispositions
Property Name Location Year SoldApartment
HomesAge
ContractPrice
Price/ Home
Pinnacle S. Mountain Phoenix 2015 552 20 $ 63,750 $ 115
Sharon Green Northern CA 2015 296 46 $ 245,000 $ 828
The Heights(1) Southern CA 2016 332 12 $ 46,900 $ 283
Harvest Park Northern CA 2016 104 12 $ 30,500 $ 293
Canyon Creek(1) Southern CA 2016 200 30 $ 26,750 $ 268
Total/Wtd. Average 1,484 24 $ 412,900 $ 328
Mio
Canyon Creek
(1) Contract price represents the Company’s pro rata share.

YEA R- TO- DATE DEVELOPMENT STARTS
GATEWAY VILLAGE
Location Santa Clara, CA
Apartment Homes 476
Total Cost $226M
Construction Start Q2 2016
Initial Occupancy Q2 2018
13

(1) Total cost in billions and not ESS share. Includes only those projects under construction as of 3/31/16.(2) Based on initial occupancy.(3) As of 3/31/16.
EXPECT TO COMPLETE CONSTRUCTION AND BEGIN LEASING 3 PROJECTS IN 2016 FOR A TOTAL COST OF $270.0M
3 ANTICIPATED DEVELOPMENT STARTS FOR 2016 (1 SHOWN IN THE TABLE BELOW)
Co
st in
mill
ion
s
DEVELOPMEN T P I PEL I N E UPDATE
Delivery of Development Timeline(2)
# of Properties Units Total Cost(1)
2016 3 555 $0.3
2017 2 975 $0.5
2018 2 1,021 $0.6
Total 7 2,551 $1.4
ESS Share(3)
Total Cost $1.0
Unfunded Cost $0.7
Total cost as a % of total market cap. 4.6%
Unfunded cost as a % of total market cap. 3.2%
14
$-
$100
$200
$300
$400
$500
$600
$700
2016 2017 2018
Delivery of Development Pipeline
F INANCIAL PERFORMANCE, CAPITAL MANAGEMENT & 2016 GUIDANCE

9.1%
8.5%
5.6%5.1%
0%
2%
4%
6%
8%
10%
2012-2015 CAGR 2016E
Same-Property NOI Growth
ESS Peer Average
Source: Company Disclosures (1) 2016 is the midpoint of company guidance as of First Quarter 2016 Earnings Releases. (2) Peer average represents 7 multifamily REITs.
CONTI NUED OUTPERFORMANCE VS . PEERS
ESS SAME-PROPERTY NOI GROWTH HAS EXCEEDED THE PEER AVERAGE BY 3.5% ANNUALLY FOR THE LAST 4 YEARS
NOI GROWTH IN 2016 IS PROJECTED TO OUTPERFORM THE PEER GROUP YET AGAIN AND BE THE HIGHEST AMONG THE PEERS
(1)
(2)
16
2 0 1 6 S A M E - P R O P E R T Y R E V E N U E G R O W T H
Same-Property Revenue Growth
Q1 2016Actuals
April/May 2016Actuals
YTD throughMay
Full-Year 2016 Guidance Range
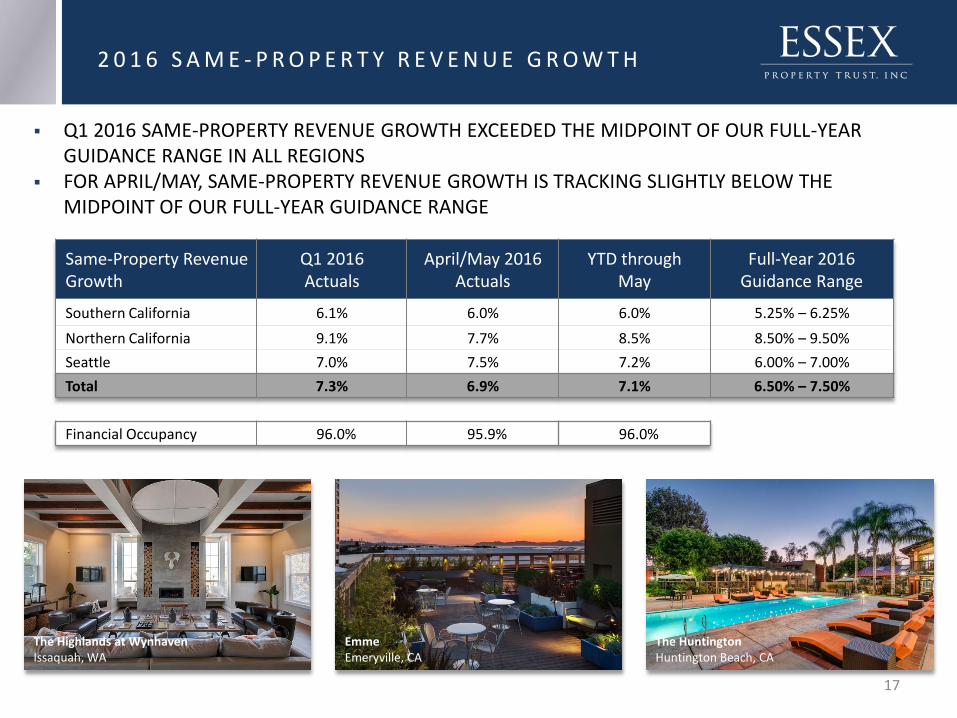
Southern California 6.1% 6.0% 6.0% 5.25% – 6.25%
Northern California 9.1% 7.7% 8.5% 8.50% – 9.50%
Seattle 7.0% 7.5% 7.2% 6.00% – 7.00%
Total 7.3% 6.9% 7.1% 6.50% – 7.50%
Financial Occupancy 96.0% 95.9% 96.0%
Q1 2016 SAME-PROPERTY REVENUE GROWTH EXCEEDED THE MIDPOINT OF OUR FULL-YEAR GUIDANCE RANGE IN ALL REGIONS
FOR APRIL/MAY, SAME-PROPERTY REVENUE GROWTH IS TRACKING SLIGHTLY BELOW THE MIDPOINT OF OUR FULL-YEAR GUIDANCE RANGE
The Highlands at WynhavenIssaquah, WA
EmmeEmeryville, CA
The HuntingtonHuntington Beach, CA
17

(1) Assumes the stock buyback program is balance sheet neutral.(2) Assumes consensus NAV estimate and not the Company’s internal NAV.
Discount to NAV(2)
5.0% 10.0% 15.0% 20.0% 25.0% 30.0%
Dis
po
siti
on
Cap
Rat
e
5.25% ($1.9) ($1.2) ($0.4) $0.5 $1.5 $2.6
5.00% ($1.0) ($0.3) $0.5 $1.4 $2.4 $3.5
4.75% ($0.1) $0.6 $1.4 $2.2 $3.2 $4.4
4.50% $0.8 $1.5 $2.3 $3.1 $4.1 $5.3
4.25% $1.7 $2.4 $3.1 $4.0 $5.0 $6.2
4.00% $2.5 $3.3 $4.0 $4.9 $5.9 $7.1
Portfolio Management
Opportunistic
Strategy
HYPOTHETI CAL CAPI TAL ALLOCATI ON STRATEGY: RUNNI NG THE MACHI NE I N REVERSE
COMPANY HAS A $250M STOCK BUYBACK PROGRAM APPROVED BY THE BOARD OF DIRECTORS
ESTIMATED $ ACCRETION TO CORE FFO FROM EXECUTION OF THE BUYBACK PROGRAM(1)
VALUE CREATION (SHOWN IN TABLE BELOW) IS DEPENDENT ON DISPOSITION OPPORTUNITIES AS WELL AS DISCOUNT TO NAV
$ Value Creation/(Dilution) in Millions
18

$21.3 BILLION TOTAL CAPITALIZATION DEBT SUMMARY ($ MILLION) 3/31/16
Unsecured Debt
Bonds $2,712
Term Loan 225
Line of Credit 164
Total Unsecured Debt 3,101
Mortgage Debt
Fixed Rate 1,960
Variable Rate 292
Total Secured Mortgage Debt 2,252
Total Consolidated Debt $5,353
Source: Company DisclosuresAs of 3/31/16
C A P I TA L S T R U C T U R E & L I Q U I D I T Y P R O F I L E
LIQUIDITY PROFILE ($ MILLION) 3/31/16
Unsecured Credit Facility - Committed $1,025
Balance Outstanding 164
Undrawn Portion of Credit Facility 861
Cash, Cash Equivalents & Marketable Securities 219
Total Liquidity $1,080
Equity,74%
Preferred Stock,<1%
Credit Facility,1%
Unsecured Debt,14%
Secured Debt,11%
Equity Preferred Stock
Credit Facility Unsecured Debt
Secured Debt
19

Source: Company Disclosures(1) Unsecured debt ratio is unsecured assets (excluding investments in joint ventures) divided by unsecured indebtedness.(2) Net Indebtedness is total debt less unamortized premiums, unrestricted cash, and marketable securities.(3) Adjusted EBITDA annualizes the pro forma NOI for current quarter acquisitions and excludes non-routine items in earnings.
SELECT BALANCE SHEET RATIOS 3/31/16 12/31/15 COVENANT TARGETS
Secured Debt / Undepreciated Book 16% 16% < 40% < 16%
Total Debt / Undepreciated Book 38% 38% < 65% < 42%
Interest Coverage 372% 357% > 150% > 300%
Unsecured Debt Ratio(1) 293% 292% > 150% > 250%
Net Indebtedness to Recurring EBITDA(2)(3) 5.7X 5.8X 6.0X – 7.0X
Unencumbered NOI to Total NOI 67% 66% > 65%
CREDIT RATINGS
FITCH: BBB+ (STABLE)MOODY’S: Baa2 (POSITIVE)
S&P: BBB (POSITIVE)
STRONG CREDI T PROFI LE
20
Deb
t M
atu
riti
es in
Mill
ion
s ($
)
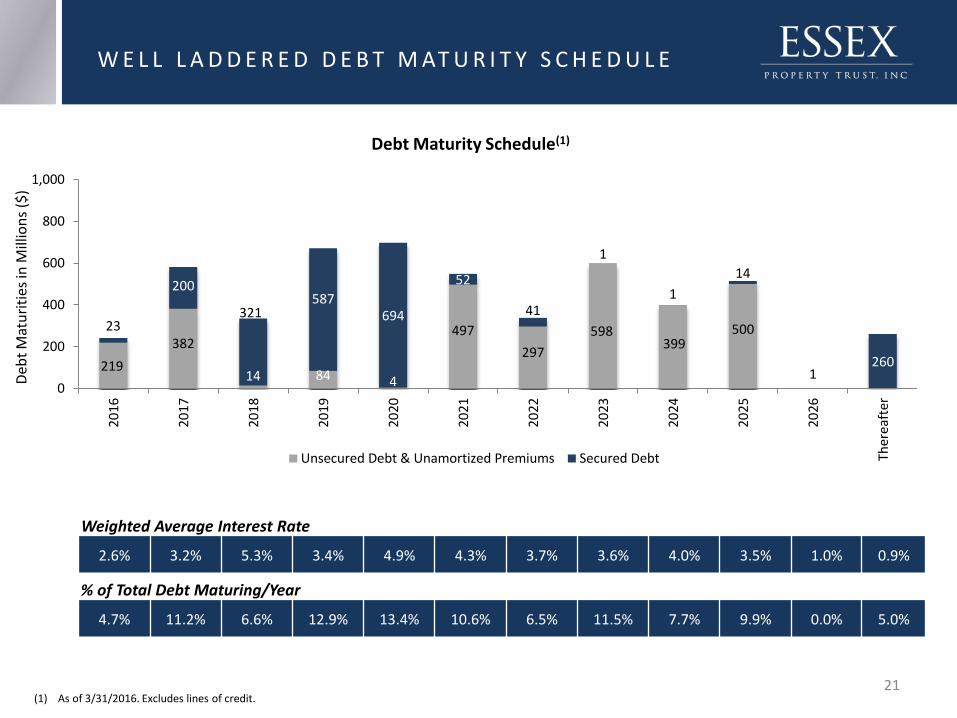
4.7% 11.2% 6.6% 12.9% 13.4% 10.6% 6.5% 11.5% 7.7% 9.9% 0.0% 5.0%
% of Total Debt Maturing/Year
W E L L L A D D E R E D D E B T M AT U R I T Y S C H E D U L E
Debt Maturity Schedule(1)
(1) As of 3/31/2016. Excludes lines of credit.
2.6% 3.2% 5.3% 3.4% 4.9% 4.3% 3.7% 3.6% 4.0% 3.5% 1.0% 0.9%
Weighted Average Interest Rate
219
382
14 84 4
497
297
598399
50023
200
321587
694
52
41
1
1
14
1260
0
200
400
600
800
1,000
2016
2017
2018
2019
2020
2021
2022
2023
2024
2025
2026
Ther
eaft
er
Unsecured Debt & Unamortized Premiums Secured Debt
21
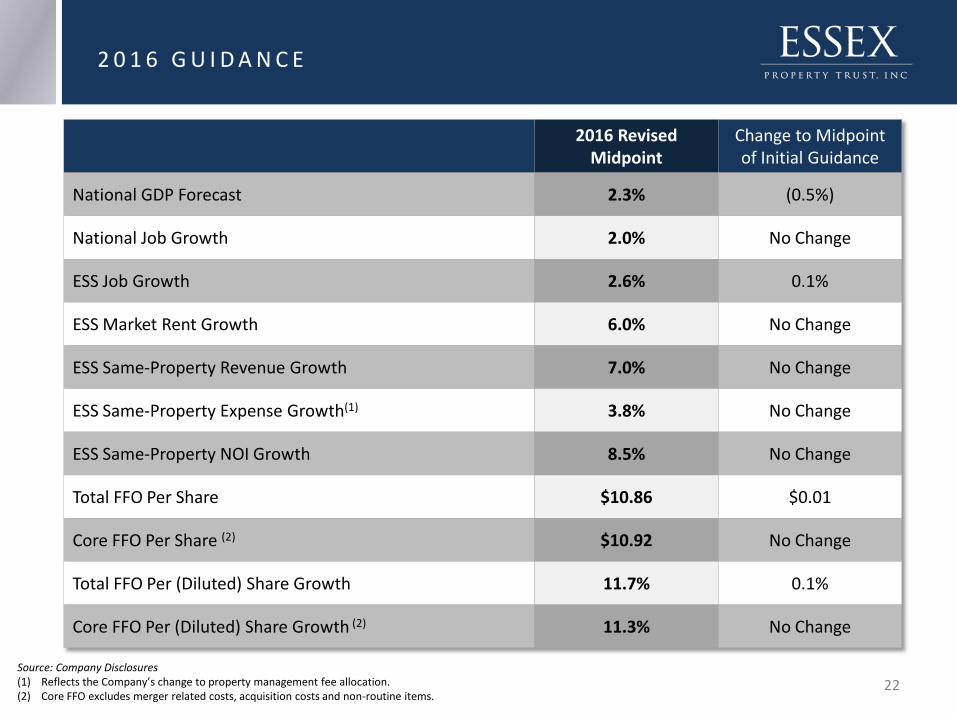
2016 Revised Midpoint
Change to Midpoint of Initial Guidance
National GDP Forecast 2.3% (0.5%)
National Job Growth 2.0% No Change
ESS Job Growth 2.6% 0.1%
ESS Market Rent Growth 6.0% No Change
ESS Same-Property Revenue Growth 7.0% No Change
ESS Same-Property Expense Growth(1) 3.8% No Change
ESS Same-Property NOI Growth 8.5% No Change
Total FFO Per Share $10.86 $0.01
Core FFO Per Share (2) $10.92 No Change
Total FFO Per (Diluted) Share Growth 11.7% 0.1%
Core FFO Per (Diluted) Share Growth (2) 11.3% No Change
Source: Company Disclosures(1) Reflects the Company’s change to property management fee allocation.(2) Core FFO excludes merger related costs, acquisition costs and non-routine items.
2 0 1 6 G U I D A N C E
22
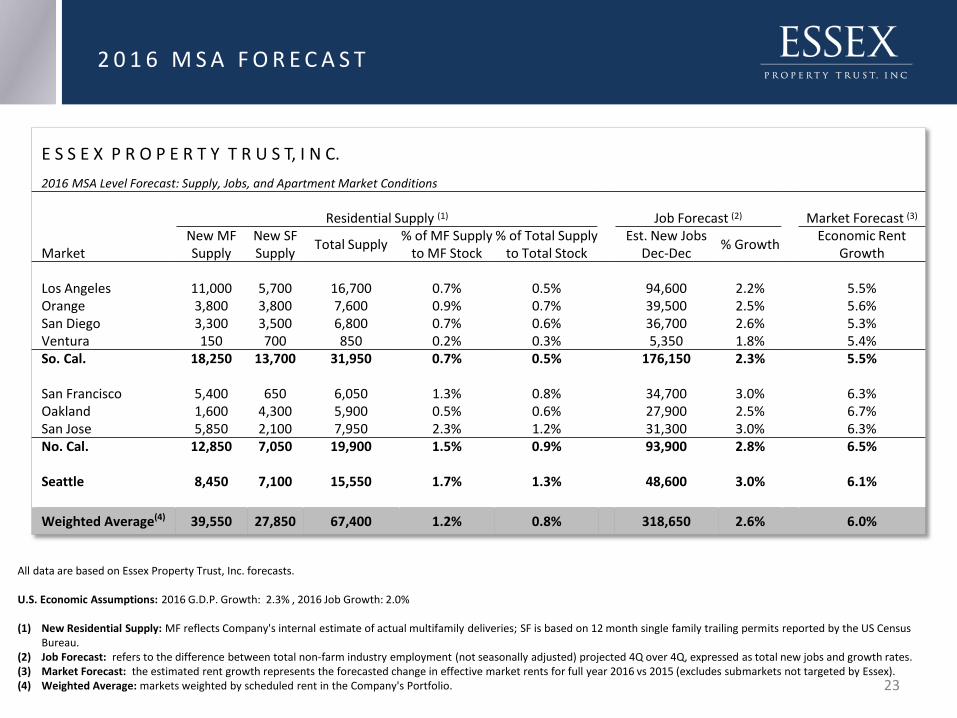
All data are based on Essex Property Trust, Inc. forecasts.
U.S. Economic Assumptions: 2016 G.D.P. Growth: 2.3% , 2016 Job Growth: 2.0%
(1) New Residential Supply: MF reflects Company's internal estimate of actual multifamily deliveries; SF is based on 12 month single family trailing permits reported by the US Census Bureau.
(2) Job Forecast: refers to the difference between total non-farm industry employment (not seasonally adjusted) projected 4Q over 4Q, expressed as total new jobs and growth rates.(3) Market Forecast: the estimated rent growth represents the forecasted change in effective market rents for full year 2016 vs 2015 (excludes submarkets not targeted by Essex).(4) Weighted Average: markets weighted by scheduled rent in the Company's Portfolio.
E S S E X P R O P E R T Y T R U S T, I N C.
2016 MSA Level Forecast: Supply, Jobs, and Apartment Market Conditions
Residential Supply (1) Job Forecast (2) Market Forecast (3)
MarketNew MF Supply
New SF Supply
Total Supply% of MF Supply
to MF Stock% of Total Supply
to Total StockEst. New Jobs
Dec-Dec % Growth
Economic Rent Growth
Los Angeles 11,000 5,700 16,700 0.7% 0.5% 94,600 2.2% 5.5%Orange 3,800 3,800 7,600 0.9% 0.7% 39,500 2.5% 5.6%San Diego 3,300 3,500 6,800 0.7% 0.6% 36,700 2.6% 5.3%Ventura 150 700 850 0.2% 0.3% 5,350 1.8% 5.4%So. Cal. 18,250 13,700 31,950 0.7% 0.5% 176,150 2.3% 5.5%
San Francisco 5,400 650 6,050 1.3% 0.8% 34,700 3.0% 6.3%Oakland 1,600 4,300 5,900 0.5% 0.6% 27,900 2.5% 6.7%San Jose 5,850 2,100 7,950 2.3% 1.2% 31,300 3.0% 6.3%No. Cal. 12,850 7,050 19,900 1.5% 0.9% 93,900 2.8% 6.5%
Seattle 8,450 7,100 15,550 1.7% 1.3% 48,600 3.0% 6.1%
Weighted Average(4) 39,550 27,850 67,400 1.2% 0.8% 318,650 2.6% 6.0%
2 0 1 6 M S A F O R E C A S T
23
APPENDIX

ESTABLISHED TRACK RECORD OF SUCCESS
0
500
1,000
1,500
2,000
2,500
3,000
3,500
4,000
1994 1996 1998 2000 2002 2004 2006 2008 2010 2012 2014
ESS NAREIT Equity Apartments NAREIT All Equity S&P 500
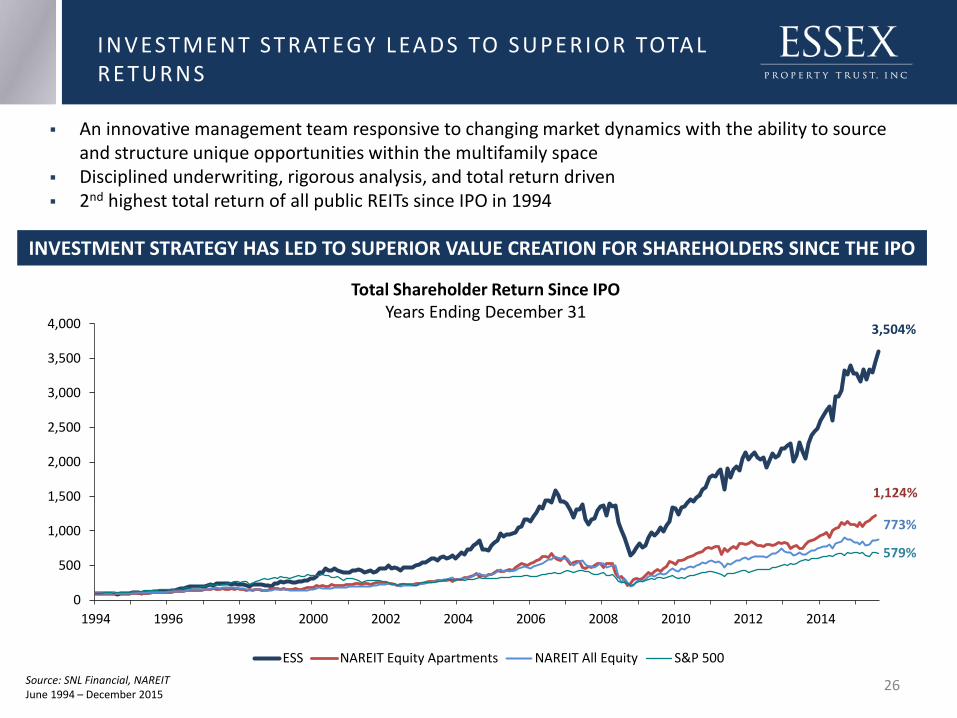
INVESTMENT STRATEGY LEADS TO SUPERIOR TOTAL RETURNS
Total Shareholder Return Since IPOYears Ending December 31
An innovative management team responsive to changing market dynamics with the ability to source and structure unique opportunities within the multifamily space
Disciplined underwriting, rigorous analysis, and total return driven 2nd highest total return of all public REITs since IPO in 1994
3,504%
773%
579%
1,124%
Source: SNL Financial, NAREITJune 1994 – December 2015
INVESTMENT STRATEGY HAS LED TO SUPERIOR VALUE CREATION FOR SHAREHOLDERS SINCE THE IPO
26

HI STORY OF G ROWTH I N D I V I DEND PER SHARE
$6.40
$0.00
$1.00
$2.00
$3.00
$4.00
$5.00
$6.00
$7.00
1994 1996 1998 2000 2002 2004 2006 2008 2010 2012 2014 2016
Dividends Per Share22 Consecutive Years of Dividend Growth Following IPO
Essex has maintained its commitment to dividend safety and has increased its dividend every year for the past 22 years, representing 283% in dividend growth since the IPO
27
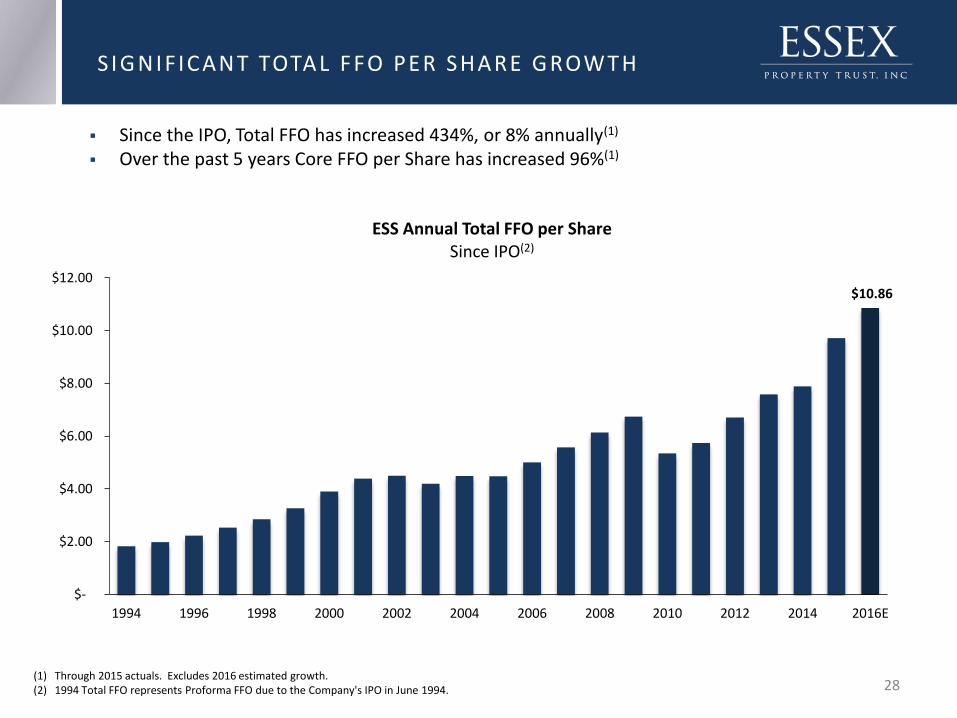
S I G NI F ICANT TOTAL FFO PER SHARE G ROWTH
(1) Through 2015 actuals. Excludes 2016 estimated growth.(2) 1994 Total FFO represents Proforma FFO due to the Company's IPO in June 1994.
Since the IPO, Total FFO has increased 434%, or 8% annually(1)
Over the past 5 years Core FFO per Share has increased 96%(1)
$10.86
$-
$2.00
$4.00
$6.00
$8.00
$10.00
$12.00
1994 1996 1998 2000 2002 2004 2006 2008 2010 2012 2014 2016E
ESS Annual Total FFO per ShareSince IPO(2)
28
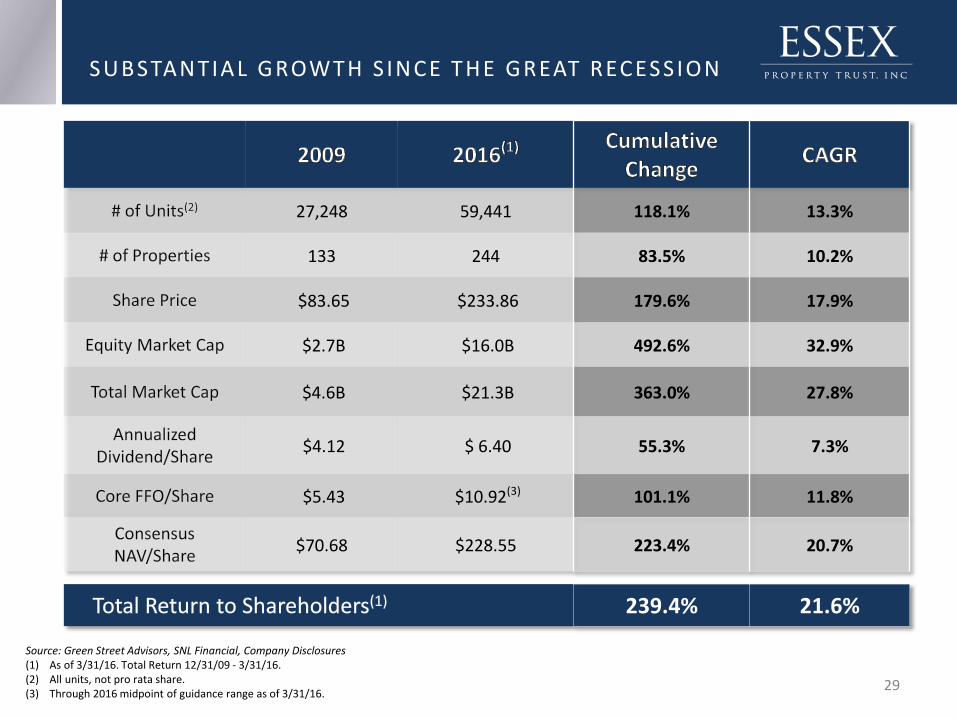
27,248 59,441 118.1% 13.3%
133 244 83.5% 10.2%
$83.65 $233.86 179.6% 17.9%
$2.7B $16.0B 492.6% 32.9%
$4.6B $21.3B 363.0% 27.8%
$4.12 $ 6.40 55.3% 7.3%
$5.43 $10.92(3) 101.1% 11.8%
$70.68 $228.55 223.4% 20.7%
239.4% 21.6%
Source: Green Street Advisors, SNL Financial, Company Disclosures(1) As of 3/31/16. Total Return 12/31/09 - 3/31/16.(2) All units, not pro rata share.(3) Through 2016 midpoint of guidance range as of 3/31/16.
29
S UB STAN TIA L G ROWTH S I N C E THE G REAT REC ES S I ON

WHY WEST COAST?
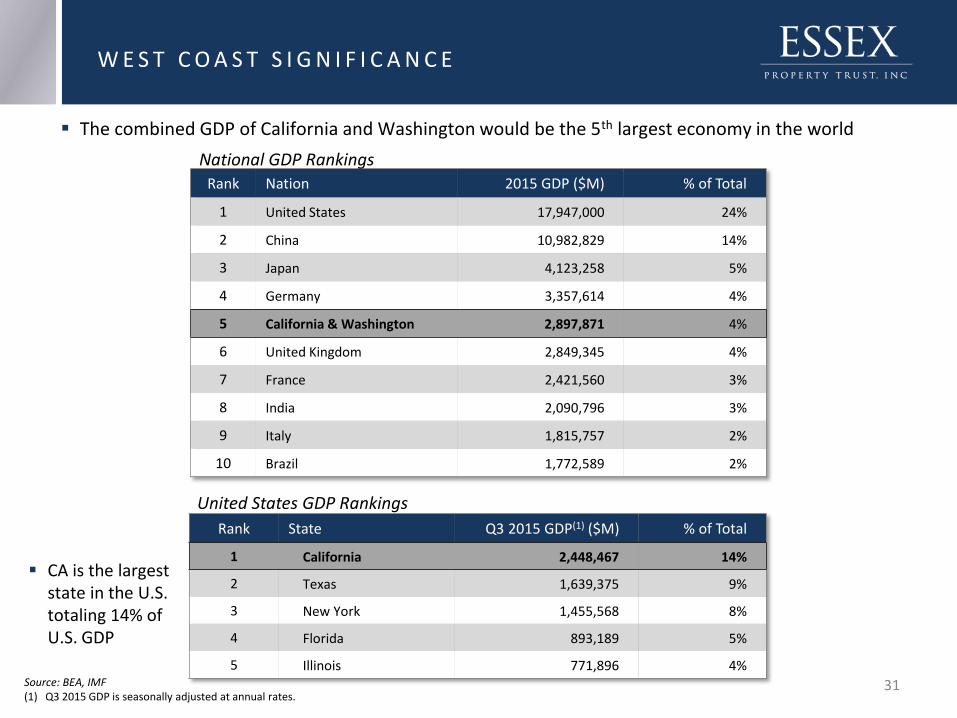
W E S T C O A S T S I G N I F I C A N C E
Rank State Q3 2015 GDP(1) ($M) % of Total
1 California 2,448,467 14%
2 Texas 1,639,375 9%
3 New York 1,455,568 8%
4 Florida 893,189 5%
5 Illinois 771,896 4%Source: BEA, IMF(1) Q3 2015 GDP is seasonally adjusted at annual rates.
The combined GDP of California and Washington would be the 5th largest economy in the world
31
Rank Nation 2015 GDP ($M) % of Total
1 United States 17,947,000 24%
2 China 10,982,829 14%
3 Japan 4,123,258 5%
4 Germany 3,357,614 4%
5 California & Washington 2,897,871 4%
6 United Kingdom 2,849,345 4%
7 France 2,421,560 3%
8 India 2,090,796 3%
9 Italy 1,815,757 2%
10 Brazil 1,772,589 2%
CA is the largest state in the U.S. totaling 14% of U.S. GDP
National GDP Rankings
United States GDP Rankings

W H Y W E S T C O A S T M A R K E T S ?
FAVORABLE DEMOGRAPHICS
• Higher incomes coupled with a higher cost of home ownership
• Higher percentage of educated 25-34 year olds
DIVERSE DEMAND DRIVERS
• Highest GDP in the U.S.
• Job growth consistently outpaces the U.S.
• Centers of innovation and drivers of job creation
LOW SUPPLY
• Long-term at below 1% of total supply
• High cost of home ownership
32
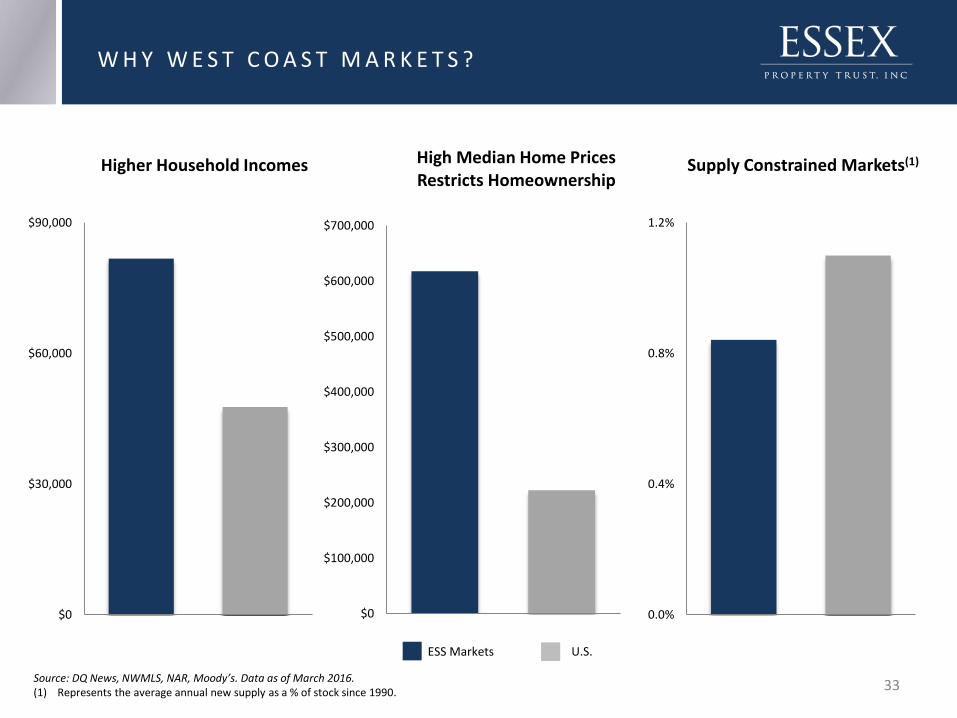
W H Y W E S T C O A S T M A R K E T S ?
$0
$100,000
$200,000
$300,000
$400,000
$500,000
$600,000
$700,000
High Median Home Prices Restricts Homeownership
$0
$30,000
$60,000
$90,000
Higher Household Incomes
0.0%
0.4%
0.8%
1.2%
Supply Constrained Markets(1)
Source: DQ News, NWMLS, NAR, Moody’s. Data as of March 2016.(1) Represents the average annual new supply as a % of stock since 1990.
ESS Markets U.S.
33

TECH INDUSTRY: THEN & NOW
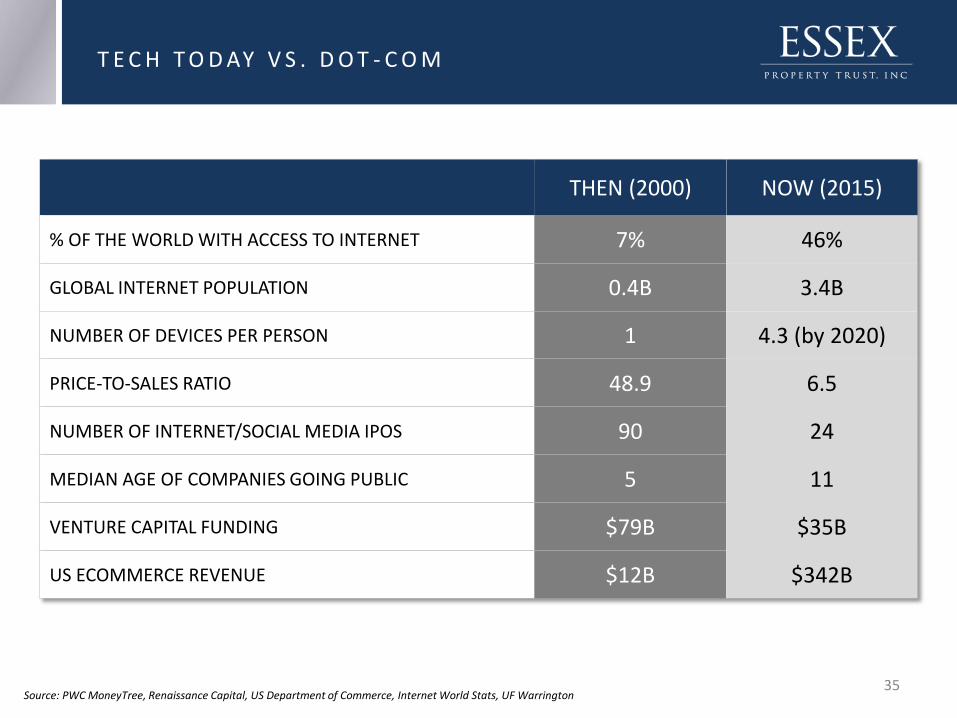
Source: PWC MoneyTree, Renaissance Capital, US Department of Commerce, Internet World Stats, UF Warrington
T E C H T O D AY V S . D O T - C O M
THEN (2000) NOW (2015)
% OF THE WORLD WITH ACCESS TO INTERNET 7% 46%
GLOBAL INTERNET POPULATION 0.4B 3.4B
NUMBER OF DEVICES PER PERSON 1 4.3 (by 2020)
PRICE-TO-SALES RATIO 48.9 6.5
NUMBER OF INTERNET/SOCIAL MEDIA IPOS 90 24
MEDIAN AGE OF COMPANIES GOING PUBLIC 5 11
VENTURE CAPITAL FUNDING $79B $35B
US ECOMMERCE REVENUE $12B $342B
35
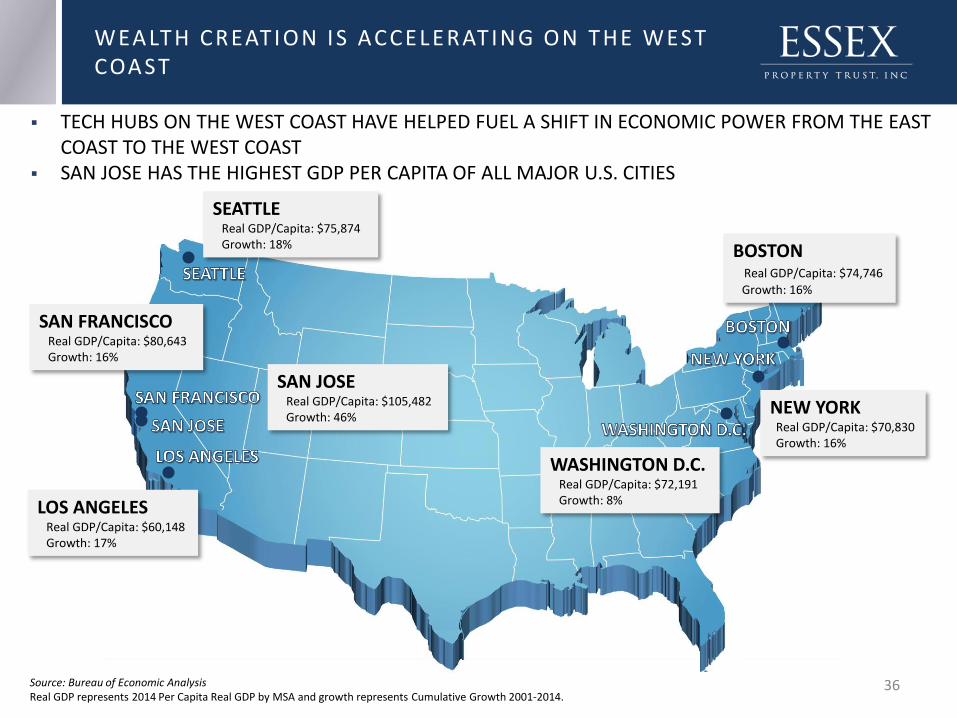
WEA LTH CREATION IS ACCELERATING ON THE WEST COA ST
TECH HUBS ON THE WEST COAST HAVE HELPED FUEL A SHIFT IN ECONOMIC POWER FROM THE EAST COAST TO THE WEST COAST
SAN JOSE HAS THE HIGHEST GDP PER CAPITA OF ALL MAJOR U.S. CITIES
BOSTONReal GDP/Capita: $74,746
Growth: 16%
NEW YORKReal GDP/Capita: $70,830 Growth: 16%
WASHINGTON D.C.Real GDP/Capita: $72,191 Growth: 8%
SEATTLEReal GDP/Capita: $75,874 Growth: 18%
SAN FRANCISCOReal GDP/Capita: $80,643 Growth: 16%
SAN JOSEReal GDP/Capita: $105,482 Growth: 46%
LOS ANGELESReal GDP/Capita: $60,148 Growth: 17%
Source: Bureau of Economic AnalysisReal GDP represents 2014 Per Capita Real GDP by MSA and growth represents Cumulative Growth 2001-2014.
36
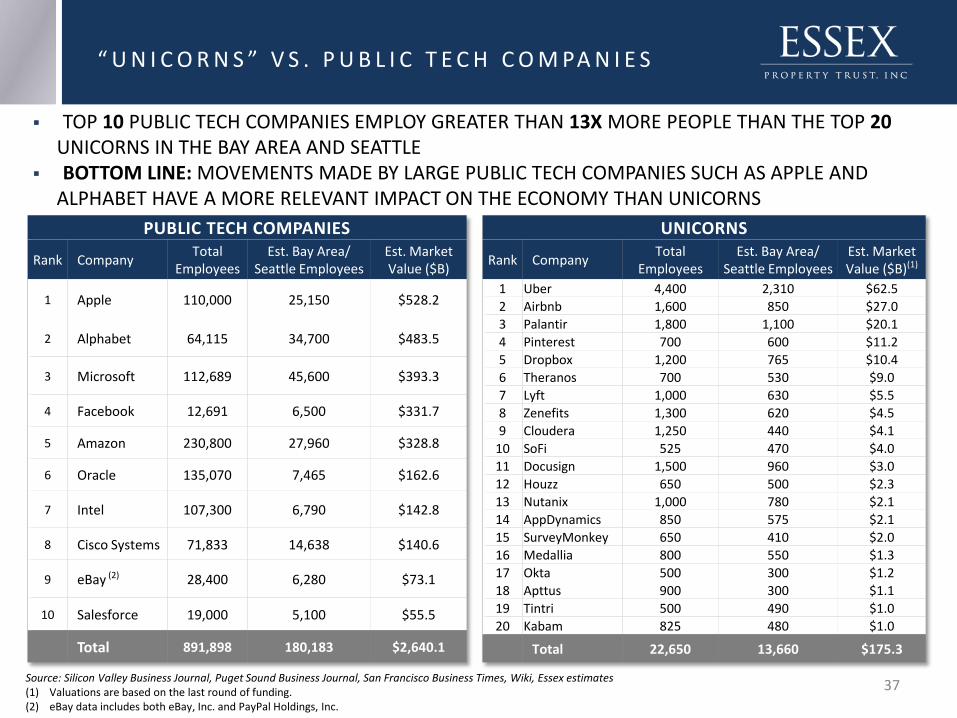
UNICORNS
Rank CompanyTotal
EmployeesEst. Bay Area/
Seattle EmployeesEst. Market Value ($B)(1)
1 Uber 4,400 2,310 $62.5
2 Airbnb 1,600 850 $27.0
3 Palantir 1,800 1,100 $20.1
4 Pinterest 700 600 $11.2
5 Dropbox 1,200 765 $10.4
6 Theranos 700 530 $9.0
7 Lyft 1,000 630 $5.5
8 Zenefits 1,300 620 $4.5
9 Cloudera 1,250 440 $4.1
10 SoFi 525 470 $4.0
11 Docusign 1,500 960 $3.0
12 Houzz 650 500 $2.3
13 Nutanix 1,000 780 $2.1
14 AppDynamics 850 575 $2.1
15 SurveyMonkey 650 410 $2.0
16 Medallia 800 550 $1.3
17 Okta 500 300 $1.2
18 Apttus 900 300 $1.1
19 Tintri 500 490 $1.0
20 Kabam 825 480 $1.0
Total 22,650 13,660 $175.3
Source: Silicon Valley Business Journal, Puget Sound Business Journal, San Francisco Business Times, Wiki, Essex estimates(1) Valuations are based on the last round of funding. (2) eBay data includes both eBay, Inc. and PayPal Holdings, Inc.
“ U N I C O R N S ” V S . P U B L I C T E C H C O M PA N I E S
PUBLIC TECH COMPANIES
Rank CompanyTotal
EmployeesEst. Bay Area/
Seattle EmployeesEst. Market Value ($B)
1 Apple 110,000 25,150 $528.2
2 Alphabet 64,115 34,700 $483.5
3 Microsoft 112,689 45,600 $393.3
4 Facebook 12,691 6,500 $331.7
5 Amazon 230,800 27,960 $328.8
6 Oracle 135,070 7,465 $162.6
7 Intel 107,300 6,790 $142.8
8 Cisco Systems 71,833 14,638 $140.6
9 eBay (2) 28,400 6,280 $73.1
10 Salesforce 19,000 5,100 $55.5
Total 891,898 180,183 $2,640.1
TOP 10 PUBLIC TECH COMPANIES EMPLOY GREATER THAN 13X MORE PEOPLE THAN THE TOP 20UNICORNS IN THE BAY AREA AND SEATTLE
BOTTOM LINE: MOVEMENTS MADE BY LARGE PUBLIC TECH COMPANIES SUCH AS APPLE AND ALPHABET HAVE A MORE RELEVANT IMPACT ON THE ECONOMY THAN UNICORNS
37

COMPARI SON OF 10 LARG EST PUBL IC TECH VS . NON - TECH F I RMS
TECH FIRMS HAVE CREATED ~$2.0 TRILLION IN EQUITY MARKET VALUE OVER THE PAST 10 YEARS, GROWING 3.0X FASTER THAN NON-TECH FIRMS
TECH FIRMS HAVE 2.2X MORE CASH ON HAND THAN NON-TECH FIRMS ALL TOP 10 TECH FIRMS AND 3 OF THE TOP NON-TECH FIRMS ARE HEADQUARTERED IN ESS MARKETS TOP TECH FIRMS HAVE 17,700 JOB OPENINGS IN CALIFORNIA AND WASHINGTON, DEMONSTRATING
THEIR COMMITMENT TO GROW
Source: Company Disclosures(1) Includes only 9 tech and 9 non-tech companies as Facebook and Visa were not public in 2005.(2) Includes cash, cash equivalents, and marketable securities.(3) Excludes banks.
Top 10 Largest PublicCompanies
Headquarters Equity Market Capitalization
(May 31, 2016)
Equity Market Capitalization
(Dec. 31, 2005)(1)Change
Cash Available as of 2015(2)
Tech Northern CA/Seattle $2,723.3 $755.0 $1,968.3 $556.3
Non-Tech(3) Various $2,321.3 $1,655.9 $665.4 $256.5
Difference $402.0 ($900.9) $1,302.9 $299.8
Ratio of Tech to Non-Tech 1.2X 0.5X 3.0X 2.2X
All data in billions except ratio
38
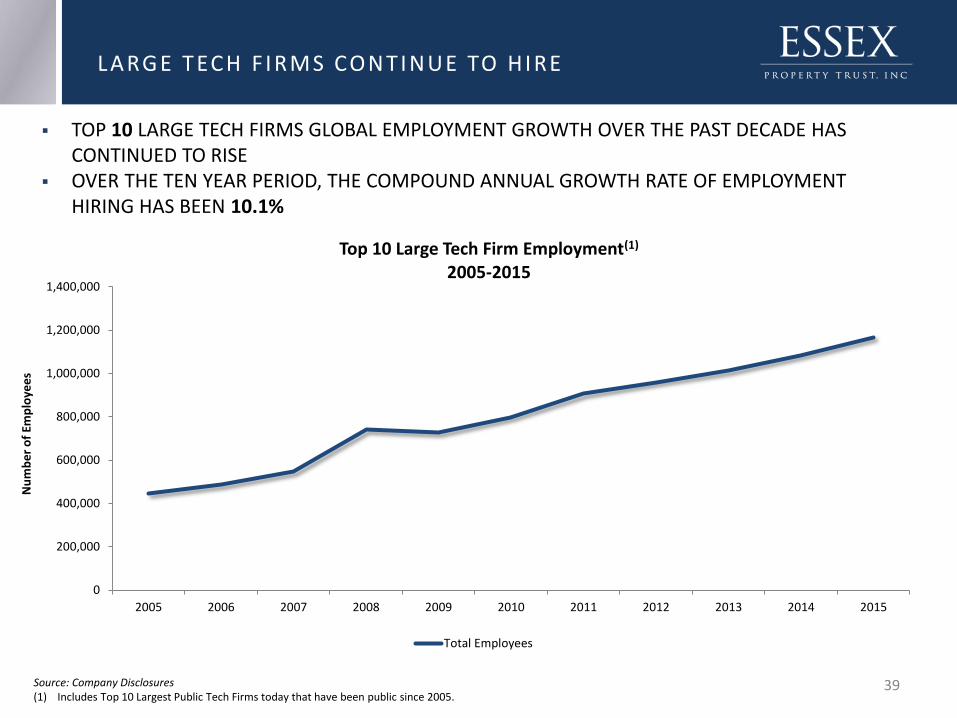
LARG E TECH F I RMS CONTI NUE TO HI RE
Source: Company Disclosures(1) Includes Top 10 Largest Public Tech Firms today that have been public since 2005.
TOP 10 LARGE TECH FIRMS GLOBAL EMPLOYMENT GROWTH OVER THE PAST DECADE HAS CONTINUED TO RISE
OVER THE TEN YEAR PERIOD, THE COMPOUND ANNUAL GROWTH RATE OF EMPLOYMENT HIRING HAS BEEN 10.1%
39
0
200,000
400,000
600,000
800,000
1,000,000
1,200,000
1,400,000
2005 2006 2007 2008 2009 2010 2011 2012 2013 2014 2015
Nu
mb
er
of
Emp
loye
es
Top 10 Large Tech Firm Employment(1)
2005-2015
Total Employees

Both San Francisco and San Jose have seen strong trailing three month job growth as of April of 4.1% and 3.9%, respectively.
Approximately 39% of the month-over-month job gains in San Francisco came from the Professional and Business Services sector.
Office absorption in the first quarter in Silicon Valley was 825,000 sf, or 1.2% of stock, with an additional 3.5M sf under construction (nearly 50% of which is pre-leased).
First quarter office absorption in the San Francisco MD was 153,000 sf, or 0.2% of stock, with 4.7M sf under construction (37% of which is pre-leased).
Source: Axiometrics, Moody's, RCG, SNL, BLS, Census and ESS Disclosures as of March 31, 2016. Trailing 3 months beginning April 2016.
(1) Home Prices as of March 2016. U.S. uses NAR 4Q15.
NORTHERN CALIFORNIA HIGHLIGHTS
Northern CA Totals
Units 19,295
Properties 73
Pro rata % of NOI 39.3%
SS Occupancy 96.1%
Market Data U.S.San
FranciscoSan Jose
Trailing 3 Month Job Growth
1.9% 4.1% 3.9%
Personal Income Growth 2016F
5.5% 7.3% 7.1%
Median Home Price(1) $223,000 $1,082,000 $775,000
N O R T H E R N C A L I F O R N I A P O R T F O L I O
NORTHERN CALIFORNIA AREA MAP
40

Source: Axiometrics, Core Logic, JLL US Office Report Q2 2015, Moody's, RCG, SNL, BLS, Census and ESS Disclosures as of March 31, 2016. Trailing 3 months beginning April 2016.
(1) Home prices as of March 2016. Home prices in Los Angeles represent the entire county and not ESS submarkets, which had a weighted average home price of $740,000 as of December 2015. U.S. uses NAR 4Q15.
L O S A N G E L E S P O R T F O L I O
LOS ANGELES HIGHLIGHTS
Los Angeles Totals
Units 11,056
Properties 50
Pro rata % of NOI 19.6%
SS Occupancy 96.0%
Job growth in Los Angeles was 2.5% for the trailing three month period beginning in April.
The largest gains in April were reported from the Trade, Transportation and Utilities, and the Education and Health Services Sectors.
Los Angeles had first quarter net absorption of roughly 432,000 sf, or 0.2% of stock, with nearly 2.3M sf of office space under construction.
Market Data U.S. Los Angeles
Trailing 3 Month Job Growth
1.9% 2.5%
Personal Income Growth 2016F
5.5% 6.4%
Median Home Price(1) $223,000 $489,000
LOS ANGELES AREA MAP
41

Source: Axiometrics, Moody's, RCG, SNL, BLS, Census and ESS Disclosures as of March 31, 2016. Trailing 3 months beginning April 2016.
(1) Home Prices as of March 2016. U.S. uses NAR 4Q15.
O R A N G E C O U N T Y P O R T F O L I O
ORANGE COUNTY HIGHLIGHTS
Orange County had job growth of 3.0% for the trailing three month period beginning April 2016.
Professional and Business Services and Trade, Transportation and Utilities were the industries leading the job growth in April.
Orange County absorbed 230,000 sf of office space in the first quarter, representing 0.2% of stock, with nearly 1.1M sf currently under construction.
Market Data U.S. Orange County
Trailing 3 Month Job Growth
1.9% 3.0%
Personal Income Growth 2016F
5.5% 6.0%
Median Home Price(1) $223,000 $610,000
Orange County Totals
Units 6,932
Properties 28
Pro rata % of NOI 10.9%
SS Occupancy 96.1%
ORANGE COUNTY AREA MAP
42

Source: Axiometrics, Moody's, RCG, SNL, BLS, NWMLS, Census and ESS Disclosures as of March 31, 2016. Trailing 3 months beginning April 2016.
(1) Home Prices as of March 2016. U.S. uses NAR 4Q15.
SEATTLE HIGHLIGHTS
S E AT T L E P O R T F O L I O
Market Data U.S. Seattle
Trailing 3 Month Job Growth 1.9% 3.2%
Personal Income Growth 2016F
5.5% 6.7%
Median Home Price(1) $223,000 $404,000
Seattle Totals
Units 12,197
Properties 56
Pro rata % of NOI 16.5%
SS Occupancy 95.8%
Seattle continues to demonstrate strong job growth with 3.2% for the trailing three months beginning in April.
Trade, Transportation and Utilities accounted for 18% of net jobs added in April, while Professional and Business Services accounted for 15%.
During the first quarter, office absorption in Seattle was 839,000 sf, or 0.9% of stock.
Approximately 6.8M sf of office space was under construction as the first quarter of 2016, with approximately 38% pre-leased.
SEATTLE AREA MAP
43

COMMITMENT TO SUSTAINABIL ITY

Began incorporating sustainable
practices into development
program
Formed Resource
Management group to
implement sustainable investments and rebate
programs at operating properties
Completed first
sustainable certified
community
Completed 224
sustainable investments at operating properties
Launched resource
management program at properties
acquired in BRE merger
Currently developing CSR
strategy; (internal
framework in-place) and plan to participate in
GRESB survey
201620152014200920082006
45
SUSTAINABLE COMMITTMENT
For the past 10 years, Essex has been incorporating green initiatives within its apartment communities
S USTA IN ABIL I TY I N I T IATI VES
46
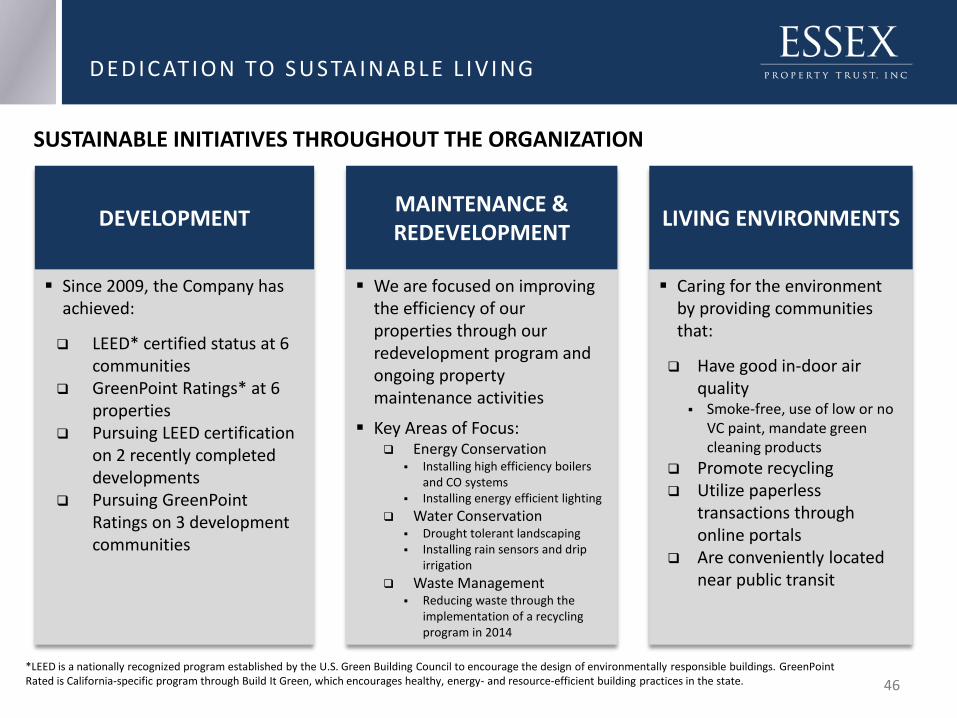
DEDI C ATI ON TO S USTA IN ABL E L I V I N G
SUSTAINABLE INITIATIVES THROUGHOUT THE ORGANIZATION
*LEED is a nationally recognized program established by the U.S. Green Building Council to encourage the design of environmentally responsible buildings. GreenPointRated is California-specific program through Build It Green, which encourages healthy, energy- and resource-efficient building practices in the state.
DEVELOPMENTMAINTENANCE & REDEVELOPMENT
LIVING ENVIRONMENTS
Since 2009, the Company has achieved:
LEED* certified status at 6 communities
GreenPoint Ratings* at 6 properties
Pursuing LEED certification on 2 recently completed developments
Pursuing GreenPointRatings on 3 development communities
We are focused on improving the efficiency of our properties through our redevelopment program and ongoing property maintenance activities
Key Areas of Focus: Energy Conservation
Installing high efficiency boilers and CO systems
Installing energy efficient lighting
Water Conservation Drought tolerant landscaping Installing rain sensors and drip
irrigation
Waste Management Reducing waste through the
implementation of a recycling program in 2014
Caring for the environment by providing communities that:
Have good in-door air quality
Smoke-free, use of low or no VC paint, mandate green cleaning products
Promote recycling Utilize paperless
transactions through online portals
Are conveniently located near public transit