INVESTOR PRESENTATION - Amazon Web...
26
RUSSEL CREEDY CHIEF EXECUTIVE OFFICER RESTAURANT BRANDS NEW ZEALAND LIMITED GRANT ELLIS CHIEF FINANCIAL OFFICER INVESTOR PRESENTATION NOVEMBER 2017
Transcript of INVESTOR PRESENTATION - Amazon Web...
RUSSEL CREEDYCHIEF EXECUTIVE OFFICER
RESTAURANT BRANDS NEW ZEALAND LIMITED
GRANT ELLISCHIEF FINANCIAL OFFICER
INVESTOR PRESENTATIONNOVEMBER 2017

SAIPAN & GUAM
AUSTRALIANEW ZEALAND
RESTAURANT BRANDSA CORPORATE FRANCHISEE, BASED IN THE SOUTH PACIFIC
HAWAII
2
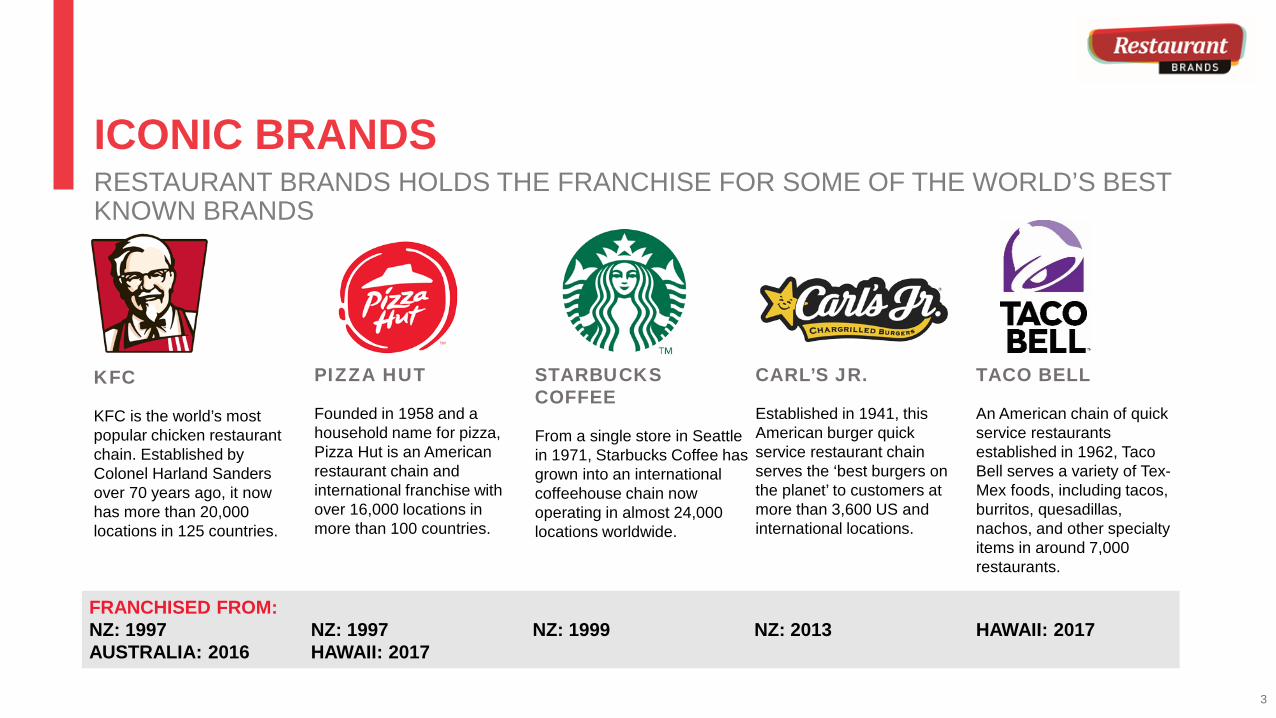
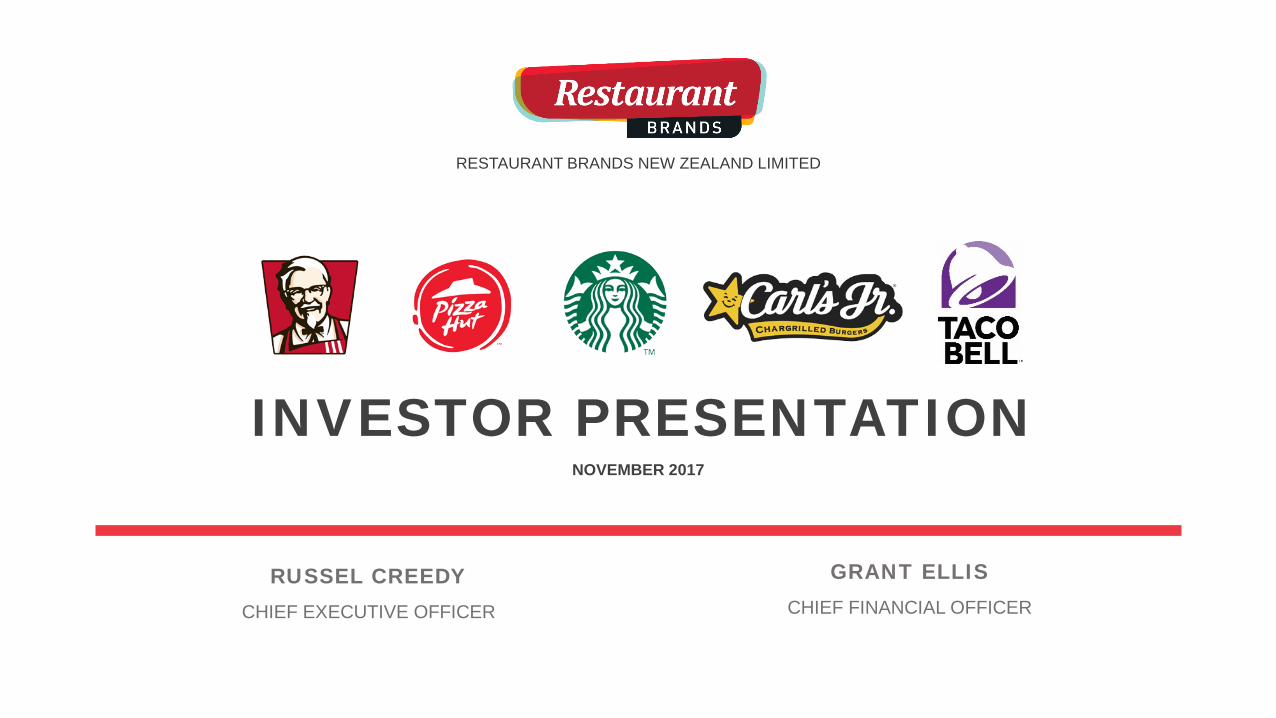
ICONIC BRANDSRESTAURANT BRANDS HOLDS THE FRANCHISE FOR SOME OF THE WORLD’S BEST KNOWN BRANDS
KFC
KFC is the world’s most popular chicken restaurant chain. Established by Colonel Harland Sanders over 70 years ago, it now has more than 20,000 locations in 125 countries.
PIZZA HUT
Founded in 1958 and a household name for pizza, Pizza Hut is an American restaurant chain and international franchise with over 16,000 locations in more than 100 countries.
STARBUCKS COFFEE
From a single store in Seattle in 1971, Starbucks Coffee has grown into an international coffeehouse chain now operating in almost 24,000 locations worldwide.
CARL’S JR.
Established in 1941, this American burger quick service restaurant chain serves the ‘best burgers on the planet’ to customers at more than 3,600 US and international locations.
TACO BELL
An American chain of quick service restaurants established in 1962, Taco Bell serves a variety of Tex-Mex foods, including tacos, burritos, quesadillas, nachos, and other specialty items in around 7,000 restaurants.
FRANCHISED FROM:NZ: 1997 AUSTRALIA: 2016
NZ: 1999 NZ: 1997 HAWAII: 2017
NZ: 2013 HAWAII: 2017
3
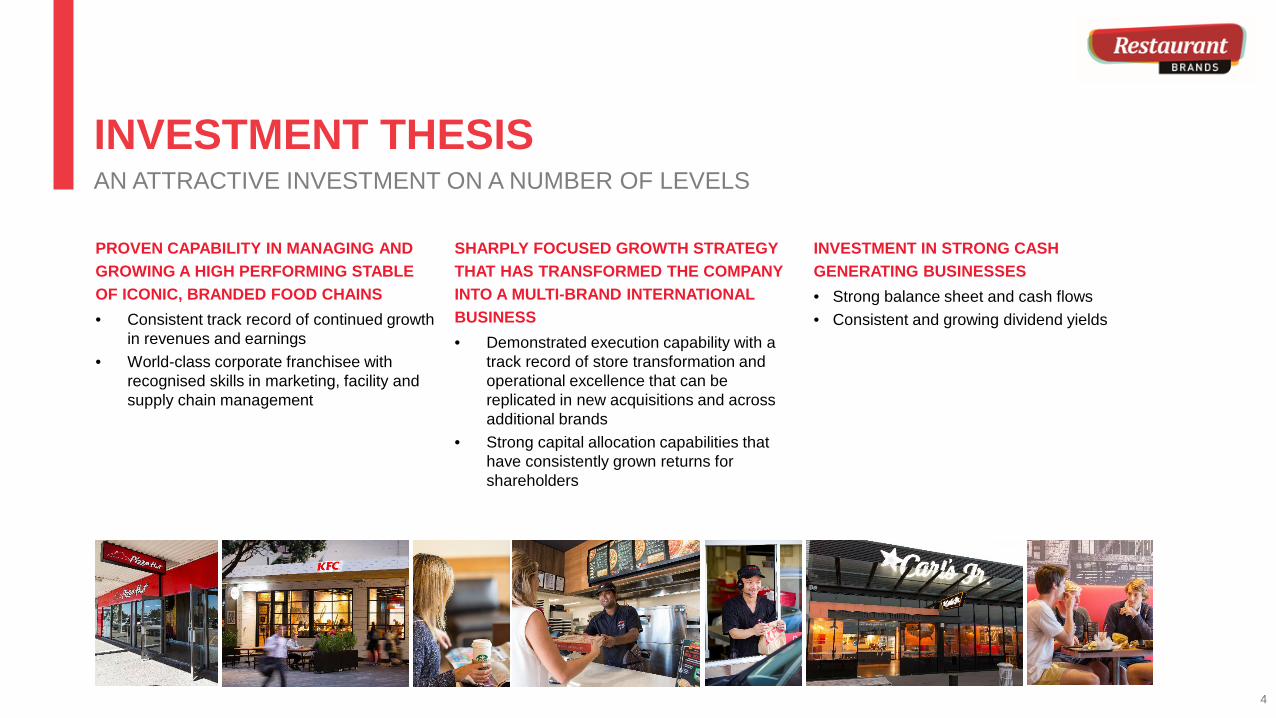
INVESTMENT THESISAN ATTRACTIVE INVESTMENT ON A NUMBER OF LEVELS
PROVEN CAPABILITY IN MANAGING AND GROWING A HIGH PERFORMING STABLE OF ICONIC, BRANDED FOOD CHAINS• Consistent track record of continued growth
in revenues and earnings• World-class corporate franchisee with
recognised skills in marketing, facility and supply chain management
SHARPLY FOCUSED GROWTH STRATEGY THAT HAS TRANSFORMED THE COMPANY INTO A MULTI-BRAND INTERNATIONAL BUSINESS • Demonstrated execution capability with a
track record of store transformation and operational excellence that can be replicated in new acquisitions and across additional brands
• Strong capital allocation capabilities that have consistently grown returns for shareholders
INVESTMENT IN STRONG CASH GENERATING BUSINESSES• Strong balance sheet and cash flows• Consistent and growing dividend yields
4
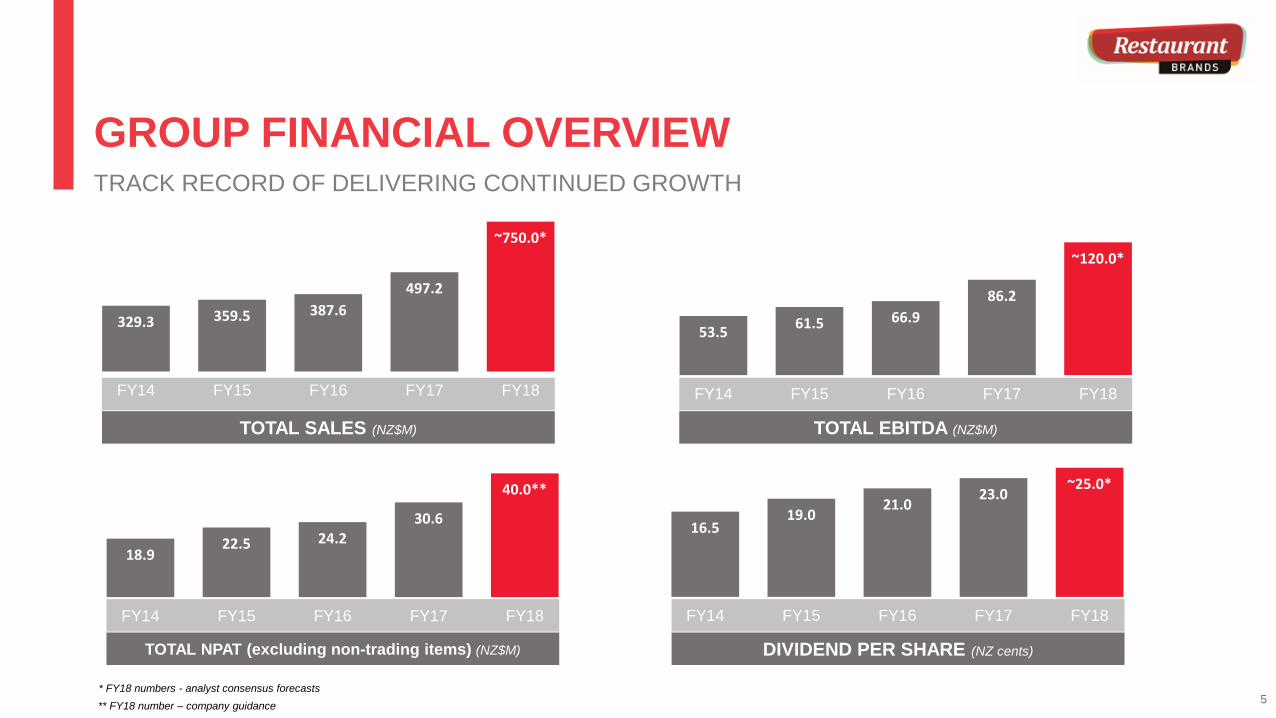
GROUP FINANCIAL OVERVIEWTRACK RECORD OF DELIVERING CONTINUED GROWTH
TOTAL SALES (NZ$M)
329.3 359.5 387.6497.2
~750.0*
FY14 FY15 FY16 FY17 FY18
TOTAL EBITDA (NZ$M)
53.5 61.5 66.986.2
~120.0*
FY14 FY15 FY16 FY17 FY18
TOTAL NPAT (excluding non-trading items) (NZ$M)
18.922.5 24.2
30.6
40.0**
FY14 FY15 FY16 FY17 FY18
DIVIDEND PER SHARE (NZ cents)
16.519.0
21.023.0
~25.0*
FY14 FY15 FY16 FY17 FY18
* FY18 numbers - analyst consensus forecasts** FY18 number – company guidance 5
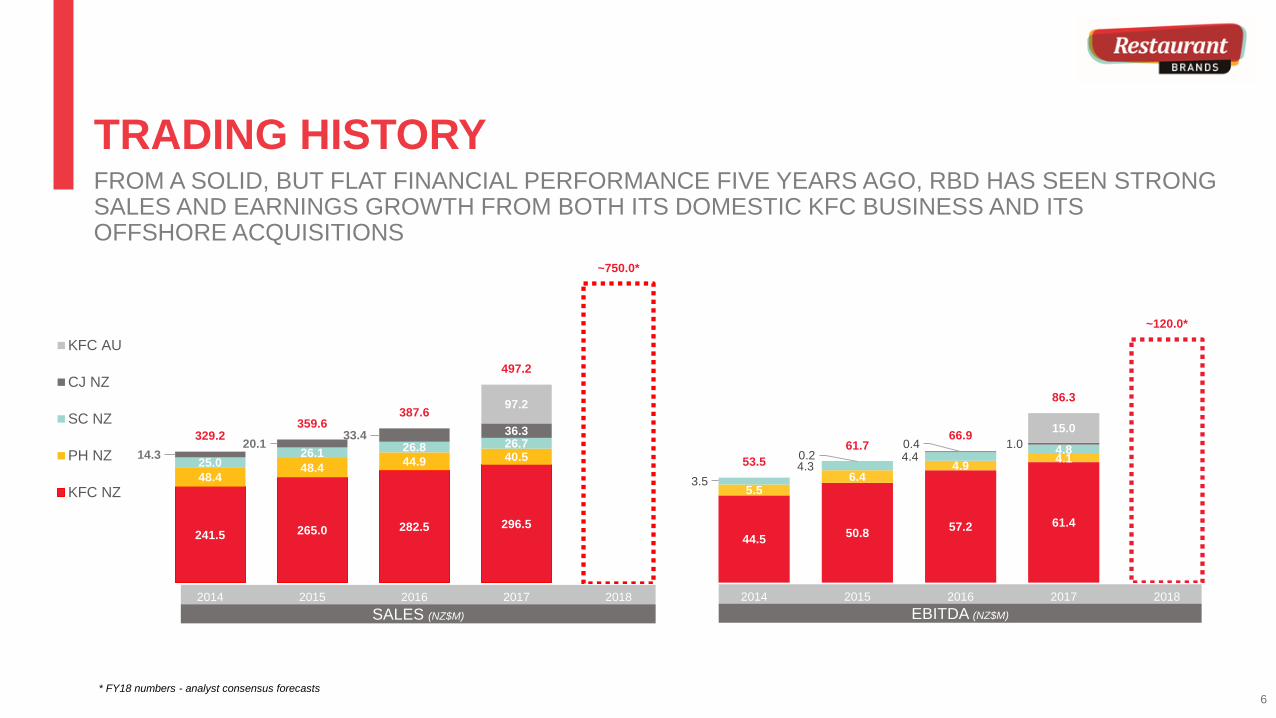
TRADING HISTORYFROM A SOLID, BUT FLAT FINANCIAL PERFORMANCE FIVE YEARS AGO, RBD HAS SEEN STRONG SALES AND EARNINGS GROWTH FROM BOTH ITS DOMESTIC KFC BUSINESS AND ITS OFFSHORE ACQUISITIONS
SALES (NZ$M)
241.5 265.0 282.5 296.5
48.448.4 44.9 40.525.026.1 26.8 26.7
14.320.1
33.4 36.3
97.2
329.2359.6
387.6
497.2
~750.0*
2014 2015 2016 2017 2018
KFC AU
CJ NZ
SC NZ
PH NZ
KFC NZ
Sales $m
EBITDA (NZ$M)
44.5 50.8 57.2 61.4
5.56.4
4.9 4.1
3.54.3
4.4 4.80.20.4 1.0
15.0
53.561.7
66.9
86.3
~120.0*
2014 2015 2016 2017 2018
* FY18 numbers - analyst consensus forecasts6
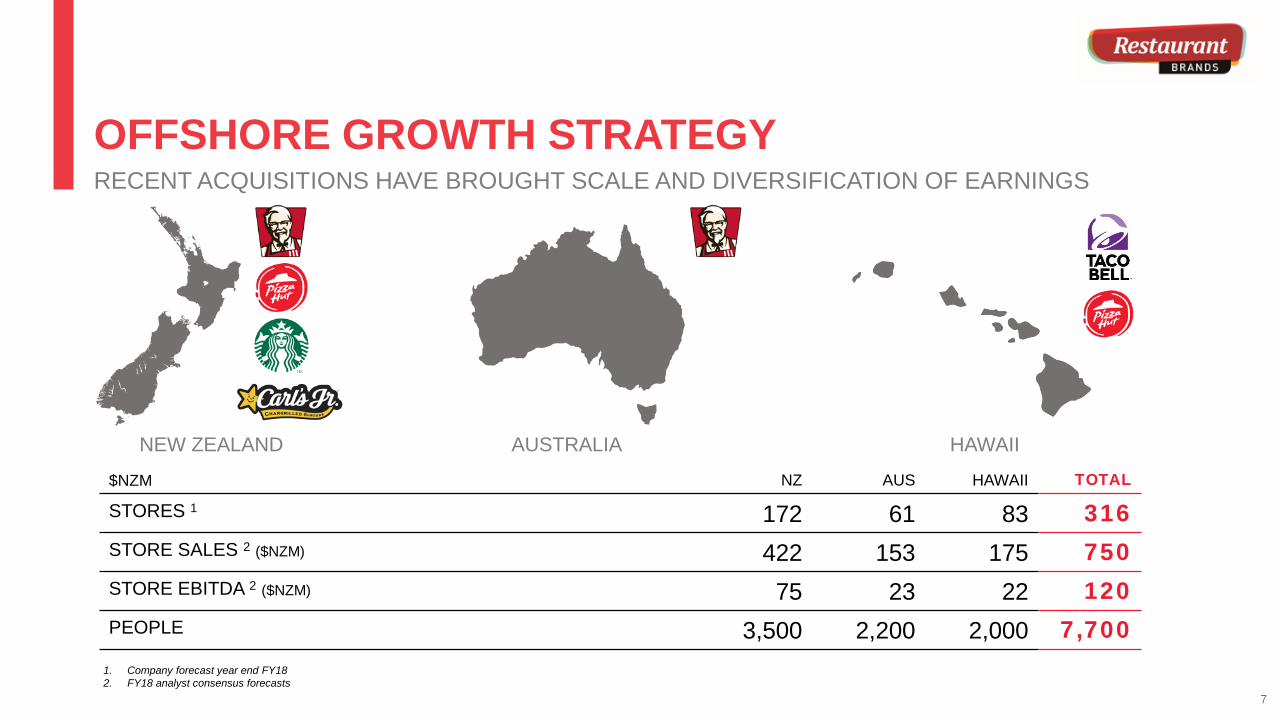
OFFSHORE GROWTH STRATEGYRECENT ACQUISITIONS HAVE BROUGHT SCALE AND DIVERSIFICATION OF EARNINGS
$NZM NZ AUS HAWAII TOTAL
STORES 1 172 61 83 316STORE SALES 2 ($NZM) 422 153 175 750STORE EBITDA 2 ($NZM) 75 23 22 120PEOPLE 3,500 2,200 2,000 7,700
NEW ZEALAND AUSTRALIA HAWAII
1. Company forecast year end FY182. FY18 analyst consensus forecasts
7
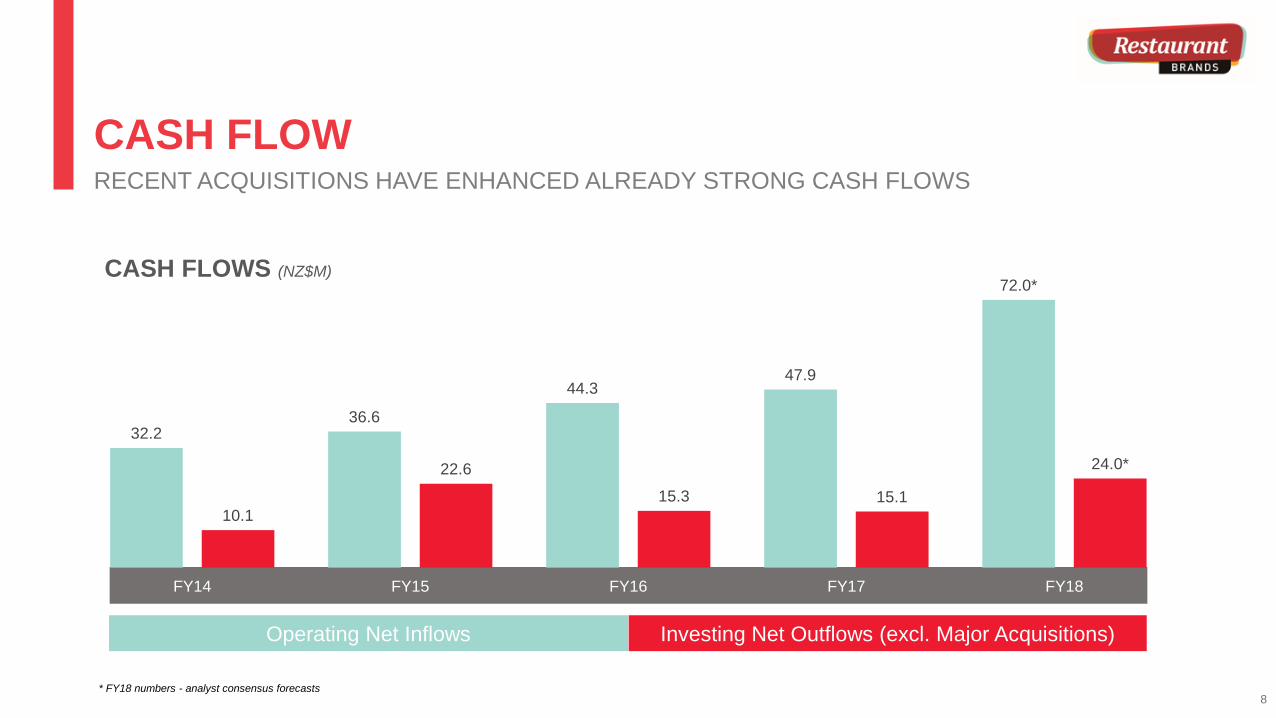
CASH FLOWRECENT ACQUISITIONS HAVE ENHANCED ALREADY STRONG CASH FLOWS
Operating Net Inflows Investing Net Outflows (excl. Major Acquisitions)
32.236.6
44.347.9
72.0*
10.1
22.6
15.3 15.1
24.0*
FY14 FY15 FY16 FY17 FY18
CASH FLOWS (NZ$M)
* FY18 numbers - analyst consensus forecasts8
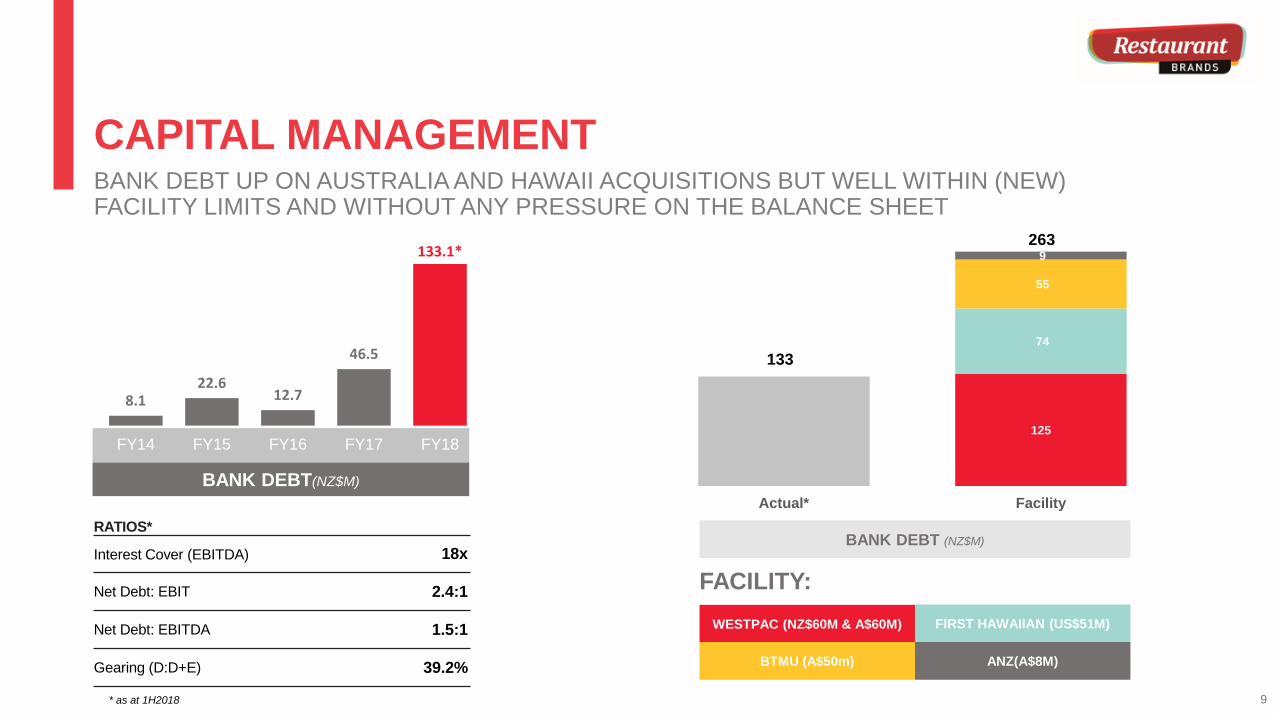
CAPITAL MANAGEMENTBANK DEBT UP ON AUSTRALIA AND HAWAII ACQUISITIONS BUT WELL WITHIN (NEW) FACILITY LIMITS AND WITHOUT ANY PRESSURE ON THE BALANCE SHEET
RATIOS*
Interest Cover (EBITDA) 18x
Net Debt: EBIT 2.4:1
Net Debt: EBITDA 1.5:1
Gearing (D:D+E) 39.2%
* as at 1H2018
WESTPAC (NZ$60M & A$60M) FIRST HAWAIIAN (US$51M)
BTMU (A$50m) ANZ(A$8M)
BANK DEBT(NZ$M)
8.122.6
12.7
46.5
133.1*
FY14 FY15 FY16 FY17 FY18125
74
55
9
-
50
100
150
200
250
300
Actual* Facility
FACILITY:
BANK DEBT (NZ$M)
263
133
9
AUSTRALIAOPERATIONS
10
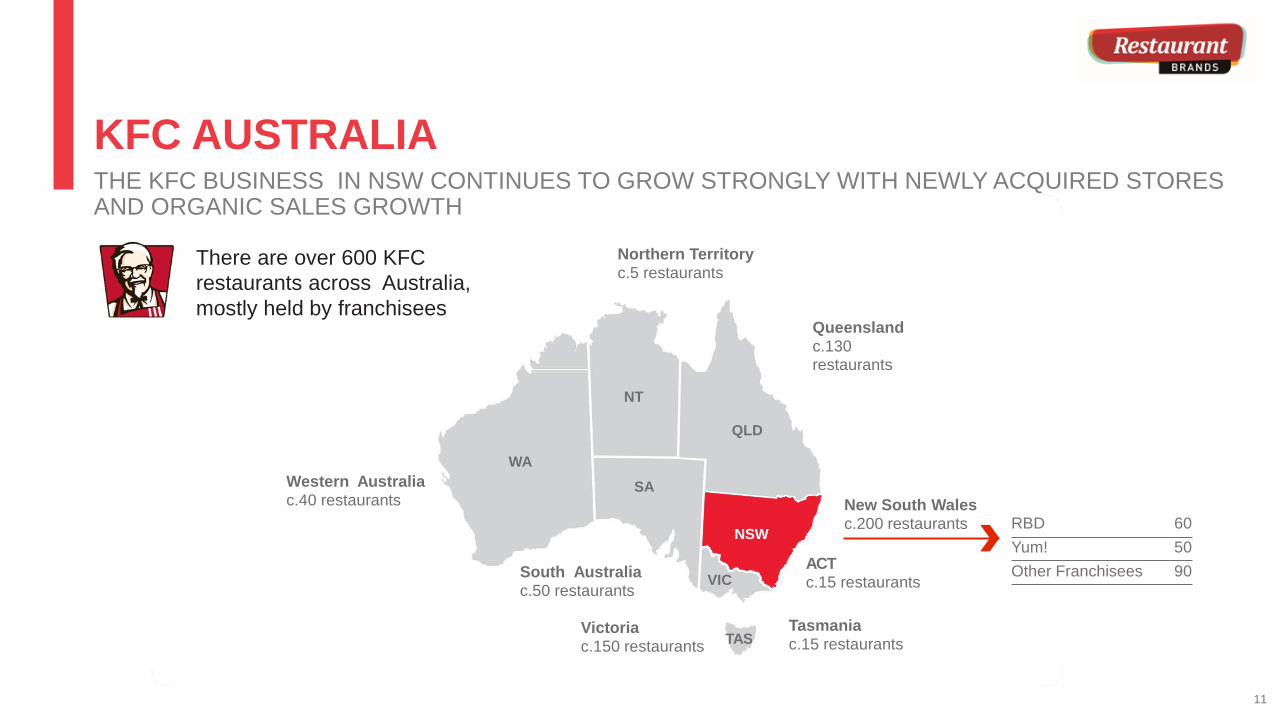
There are over 600 KFC restaurants across Australia, mostly held by franchisees
QLD
Queenslandc.130 restaurants
NSW
New South Walesc.200 restaurants
ACTc.15 restaurants
TASTasmaniac.15 restaurants
VIC
Victoriac.150 restaurants
SA
South Australiac.50 restaurants
WAWestern Australiac.40 restaurants
NT
Northern Territoryc.5 restaurants
KFC AUSTRALIATHE KFC BUSINESS IN NSW CONTINUES TO GROW STRONGLY WITH NEWLY ACQUIRED STORES AND ORGANIC SALES GROWTH
RBD 60Yum! 50Other Franchisees 90
11
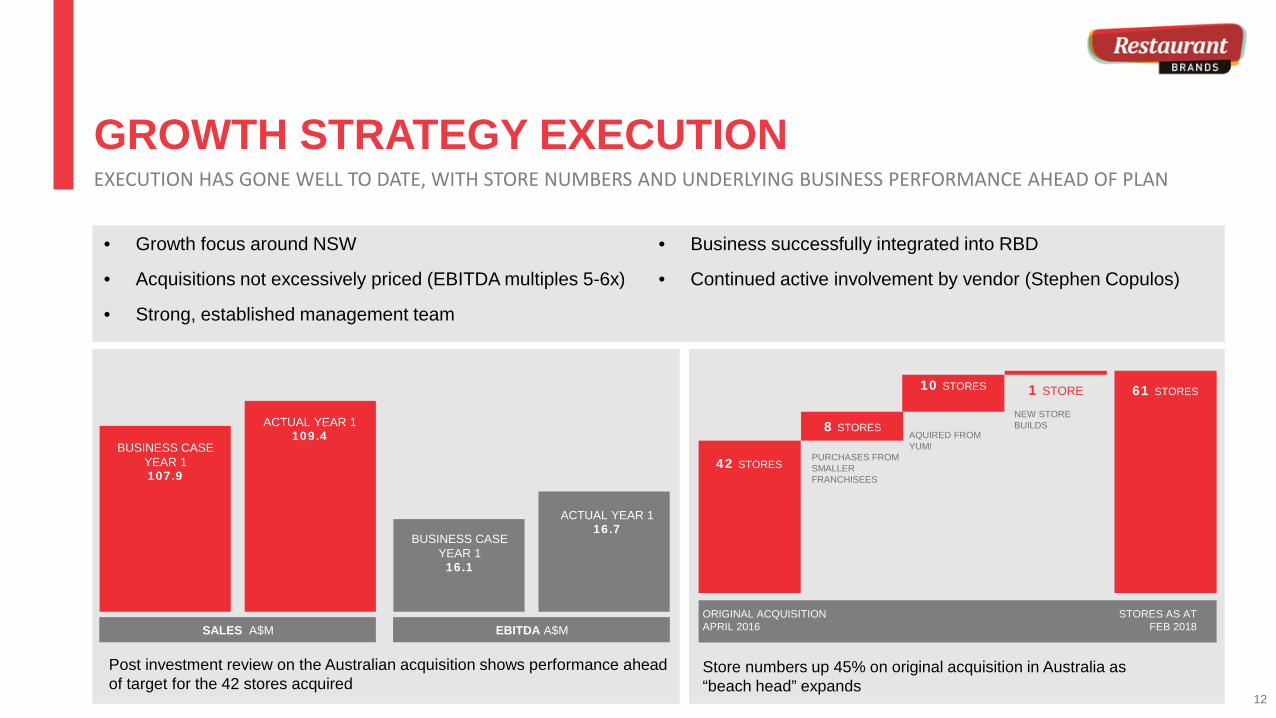
GROWTH STRATEGY EXECUTIONEXECUTION HAS GONE WELL TO DATE, WITH STORE NUMBERS AND UNDERLYING BUSINESS PERFORMANCE AHEAD OF PLAN
• Growth focus around NSW
• Acquisitions not excessively priced (EBITDA multiples 5-6x)
• Strong, established management team
• Business successfully integrated into RBD
• Continued active involvement by vendor (Stephen Copulos)
Post investment review on the Australian acquisition shows performance ahead of target for the 42 stores acquired
Store numbers up 45% on original acquisition in Australia as “beach head” expands
42 STORES
8 STORES
10 STORES 1 STORE 61 STORES
ORIGINAL ACQUISITION APRIL 2016
PURCHASES FROM SMALLER FRANCHISEES
AQUIRED FROM YUM!
NEW STORE BUILDS
STORES AS AT FEB 2018
ACTUAL YEAR 1109.4
BUSINESS CASE YEAR 1107.9
SALES A$M EBITDA A$M
BUSINESS CASE YEAR 116.1
ACTUAL YEAR 116.7
12
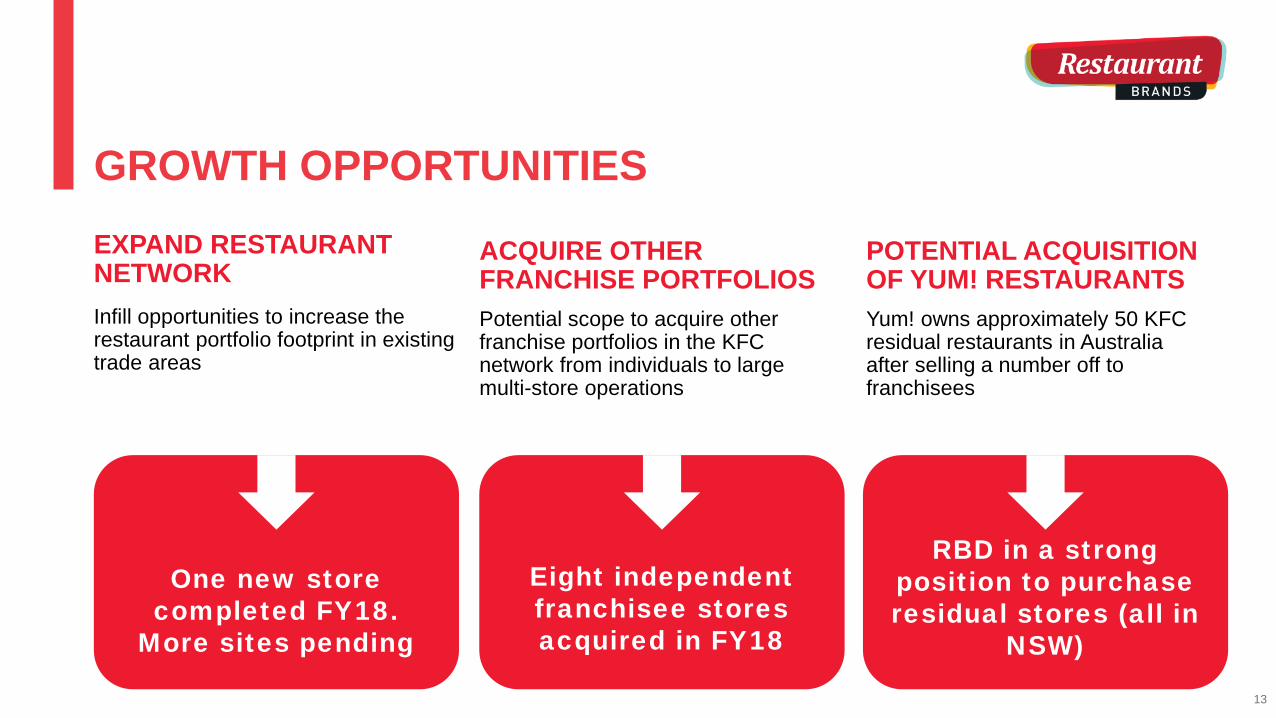
GROWTH OPPORTUNITIES
Eight independent franchisee stores acquired in FY18
EXPAND RESTAURANT NETWORKInfill opportunities to increase the restaurant portfolio footprint in existing trade areas
ACQUIRE OTHER FRANCHISE PORTFOLIOSPotential scope to acquire other franchise portfolios in the KFC network from individuals to large multi-store operations
POTENTIAL ACQUISITION OF YUM! RESTAURANTSYum! owns approximately 50 KFC residual restaurants in Australia after selling a number off to franchisees
One new store completed FY18.
More sites pending
RBD in a strong position to purchase residual stores (all in
NSW)
13
HAWAIIOPERATIONS
14
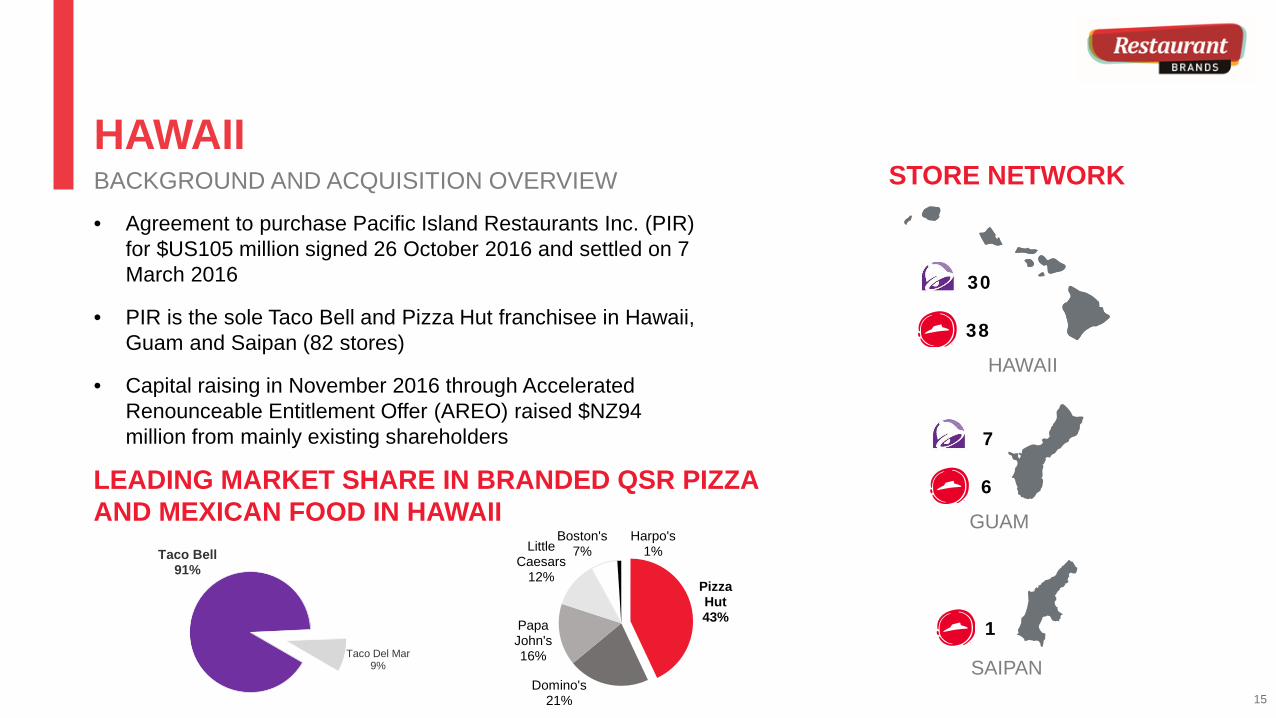
HAWAIIBACKGROUND AND ACQUISITION OVERVIEW
• Agreement to purchase Pacific Island Restaurants Inc. (PIR) for $US105 million signed 26 October 2016 and settled on 7 March 2016
• PIR is the sole Taco Bell and Pizza Hut franchisee in Hawaii, Guam and Saipan (82 stores)
• Capital raising in November 2016 through Accelerated Renounceable Entitlement Offer (AREO) raised $NZ94 million from mainly existing shareholders
STORE NETWORK
30
38
HAWAII
GUAM
7
6
SAIPAN
1
LEADING MARKET SHARE IN BRANDED QSR PIZZA AND MEXICAN FOOD IN HAWAII
Taco Bell91%
Taco Del Mar9%
Pizza Hut43%
Domino's21%
Papa John's16%
Little Caesars
12%
Boston's7%
Harpo's1%
15
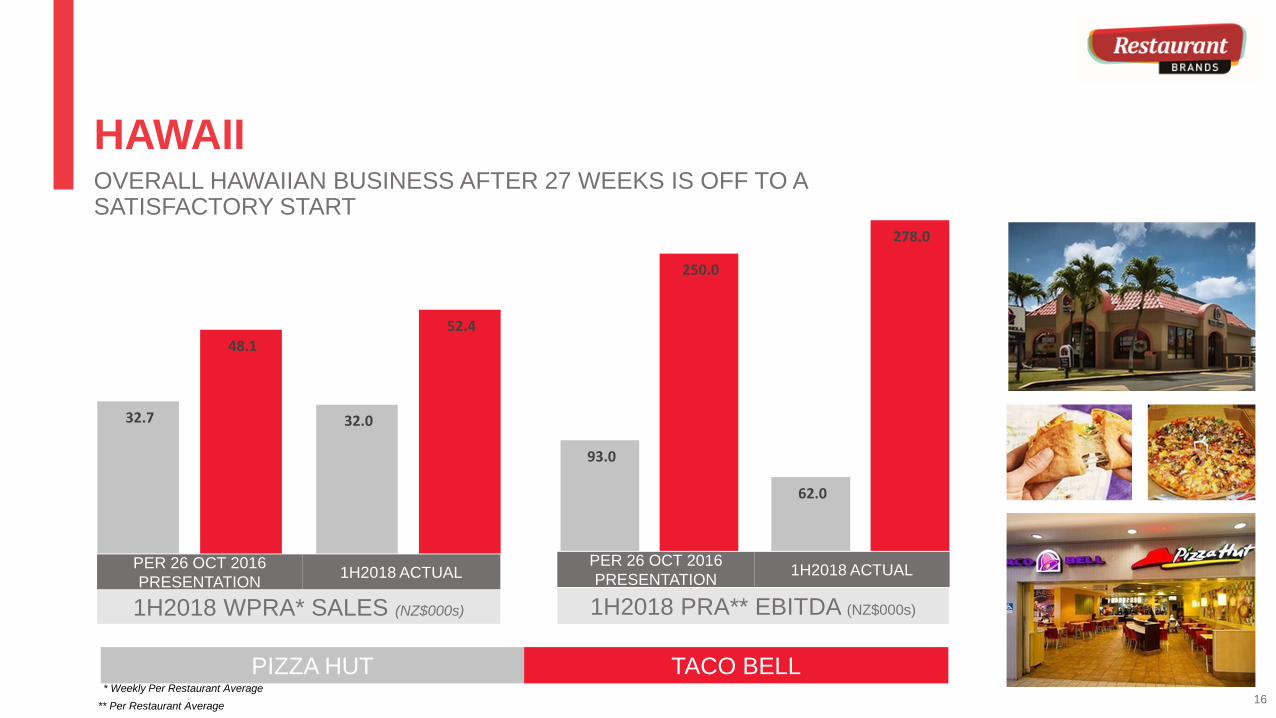
HAWAIIOVERALL HAWAIIAN BUSINESS AFTER 27 WEEKS IS OFF TO A SATISFACTORY START
1H2018 ACTUALPER 26 OCT 2016 PRESENTATION
32.7 32.0
48.1 52.4
1H2018 WPRA* SALES (NZ$000s)
93.0
62.0
250.0
278.0
1H2018 ACTUALPER 26 OCT 2016 PRESENTATION
1H2018 PRA** EBITDA (NZ$000s)
PIZZA HUT TACO BELL* Weekly Per Restaurant Average
** Per Restaurant Average 16
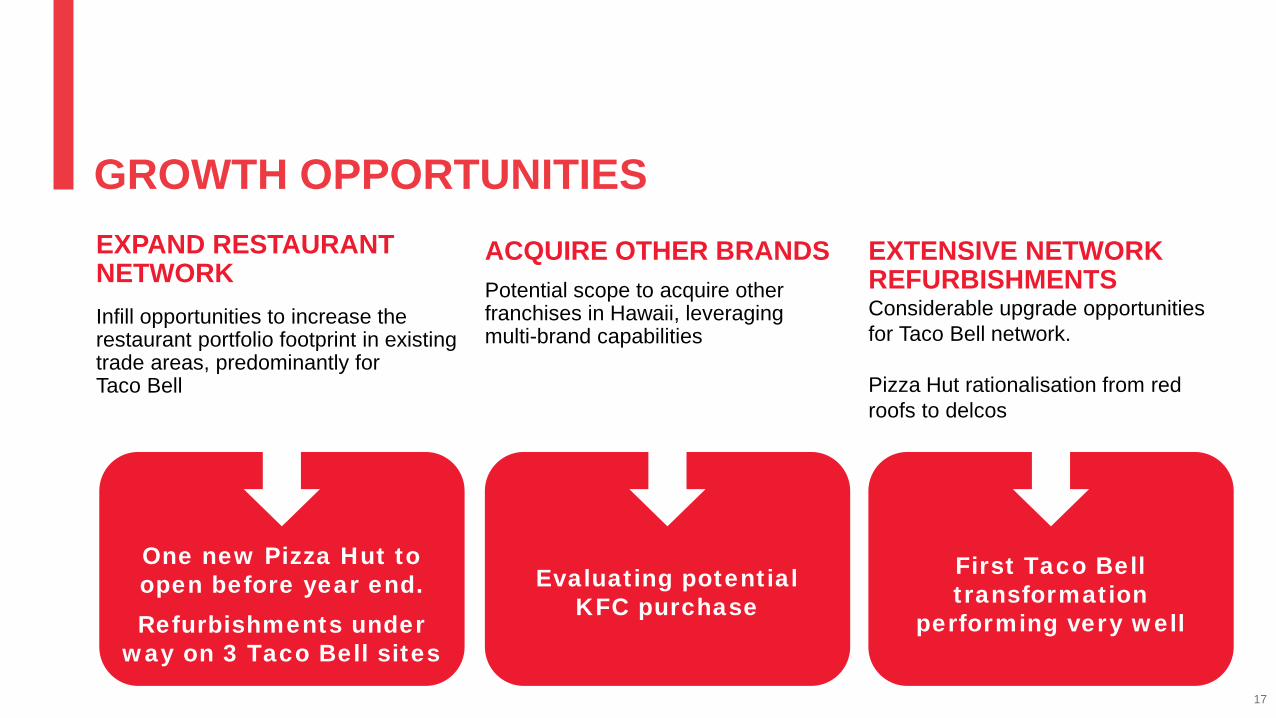
GROWTH OPPORTUNITIES
Evaluating potential KFC purchase
EXPAND RESTAURANT NETWORKInfill opportunities to increase the restaurant portfolio footprint in existing trade areas, predominantly for Taco Bell
ACQUIRE OTHER BRANDSPotential scope to acquire other franchises in Hawaii, leveraging multi-brand capabilities
EXTENSIVE NETWORK REFURBISHMENTSConsiderable upgrade opportunities for Taco Bell network.
Pizza Hut rationalisation from red roofs to delcos
One new Pizza Hut to open before year end.Refurbishments under
way on 3 Taco Bell sites
First Taco Bell transformation
performing very well
17
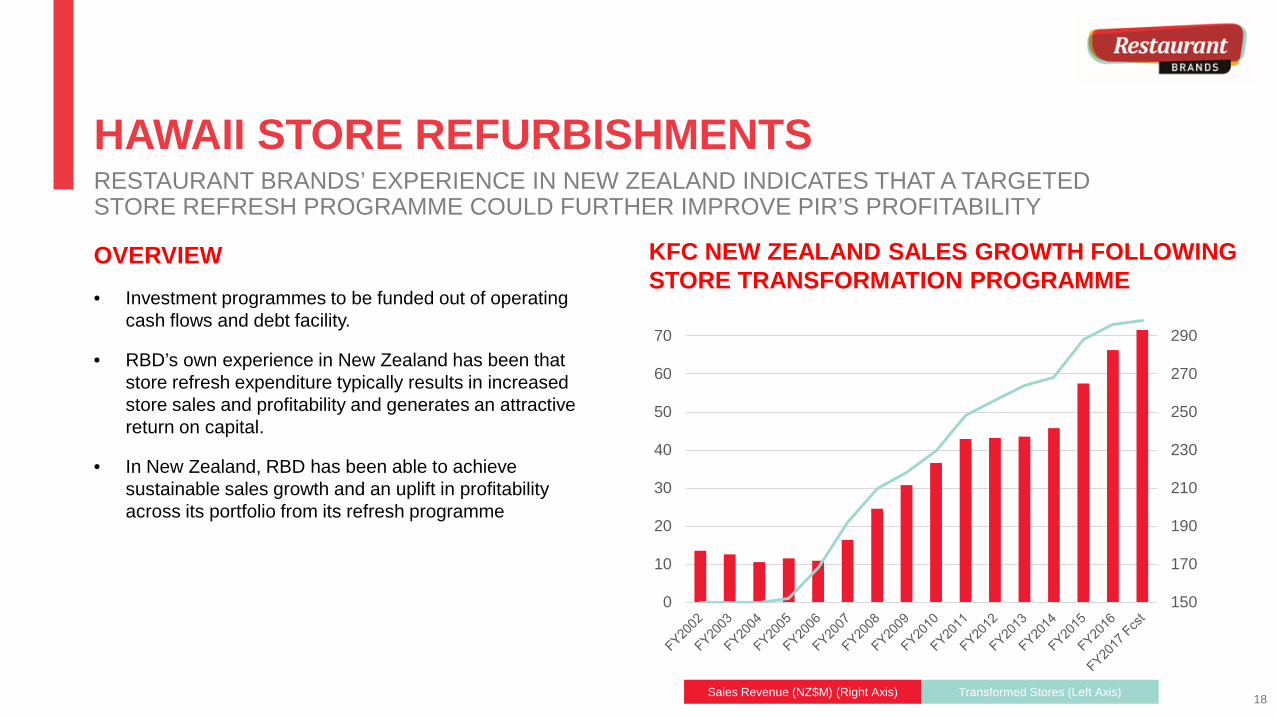
HAWAII STORE REFURBISHMENTSRESTAURANT BRANDS’ EXPERIENCE IN NEW ZEALAND INDICATES THAT A TARGETED STORE REFRESH PROGRAMME COULD FURTHER IMPROVE PIR’S PROFITABILITY
OVERVIEW• Investment programmes to be funded out of operating
cash flows and debt facility.
• RBD’s own experience in New Zealand has been that store refresh expenditure typically results in increased store sales and profitability and generates an attractive return on capital.
• In New Zealand, RBD has been able to achieve sustainable sales growth and an uplift in profitability across its portfolio from its refresh programme
150
170
190
210
230
250
270
290
0
10
20
30
40
50
60
70
KFC NEW ZEALAND SALES GROWTH FOLLOWING STORE TRANSFORMATION PROGRAMME
Sales Revenue (NZ$M) (Right Axis) Transformed Stores (Left Axis) 18
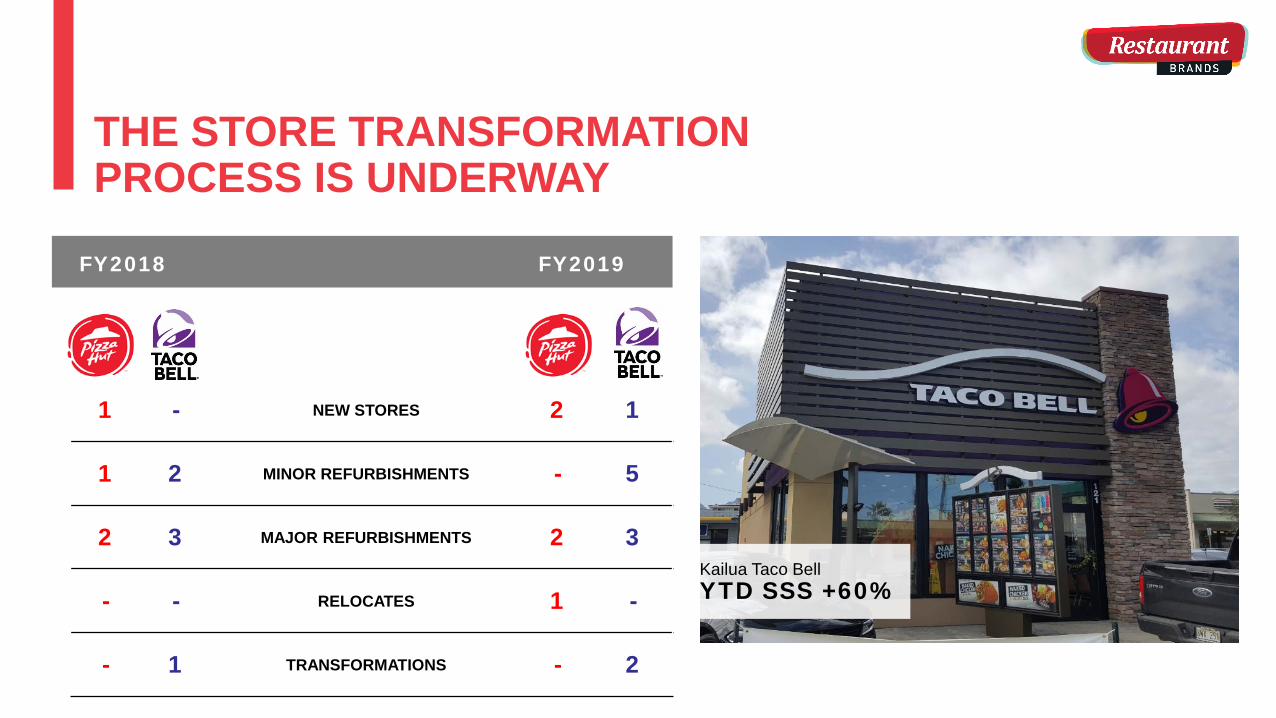
Kailua Taco BellYTD SSS +60%
THE STORE TRANSFORMATION PROCESS IS UNDERWAY
FY2018 FY2019
1 - NEW STORES 2 1
1 2 MINOR REFURBISHMENTS - 5
2 3 MAJOR REFURBISHMENTS 2 3
- - RELOCATES 1 -
- 1 TRANSFORMATIONS - 2
NEW ZEALAND OPERATIONS
20
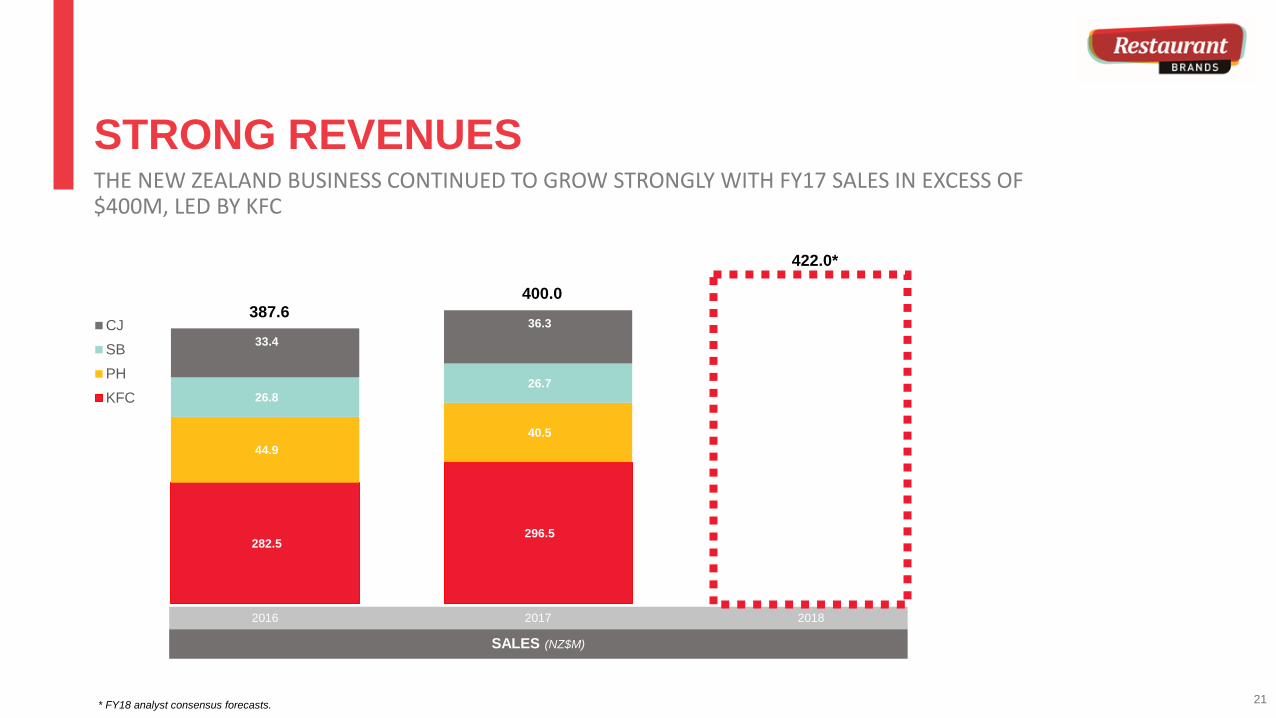
SALES (NZ$M)
STRONG REVENUES
282.5 296.5
44.9 40.5
26.8 26.7
33.4 36.3
2016 2017 2018
CJSBPHKFC
THE NEW ZEALAND BUSINESS CONTINUED TO GROW STRONGLY WITH FY17 SALES IN EXCESS OF $400M, LED BY KFC
* FY18 analyst consensus forecasts.
387.6400.0
422.0*
21
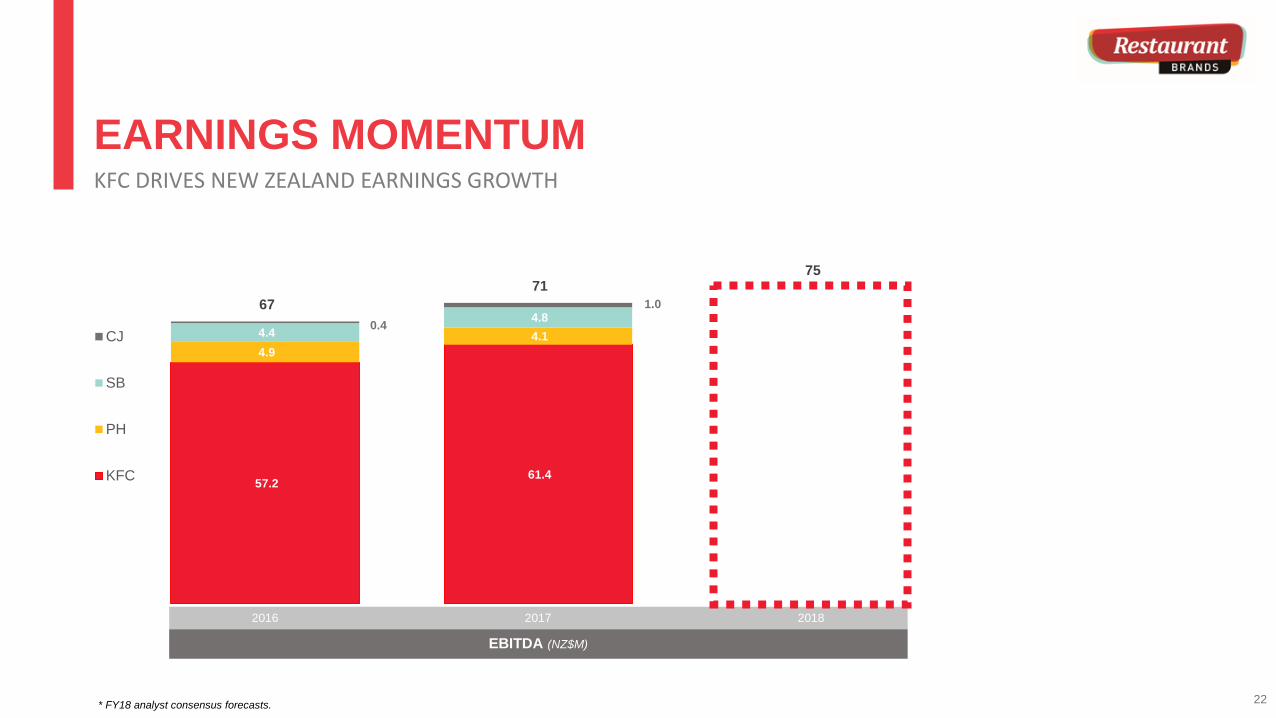
EBITDA (NZ$M)
EARNINGS MOMENTUM
57.2 61.4 65.3
4.9 4.1
3.7 4.4
4.8 4.4
0.4
1.0 67 71
75
2016 2017 2018
CJ
SB
PH
KFC
Total
KFC DRIVES NEW ZEALAND EARNINGS GROWTH
* FY18 analyst consensus forecasts. 22
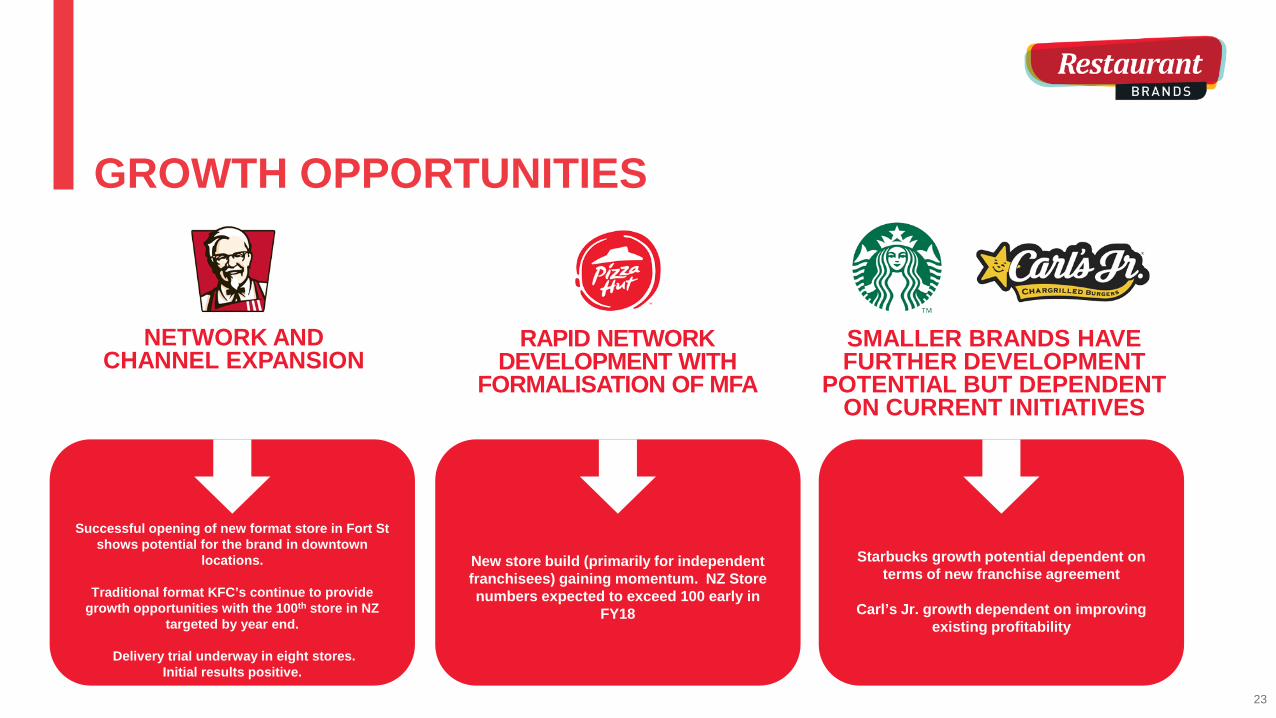
New store build (primarily for independent franchisees) gaining momentum. NZ Store numbers expected to exceed 100 early in
FY18
GROWTH OPPORTUNITIES
NETWORK AND CHANNEL EXPANSION
RAPID NETWORK DEVELOPMENT WITH
FORMALISATION OF MFA
SMALLER BRANDS HAVE FURTHER DEVELOPMENT
POTENTIAL BUT DEPENDENT ON CURRENT INITIATIVES
Successful opening of new format store in Fort St shows potential for the brand in downtown
locations.
Traditional format KFC’s continue to provide growth opportunities with the 100th store in NZ
targeted by year end.
Delivery trial underway in eight stores. Initial results positive.
Starbucks growth potential dependent on terms of new franchise agreement
Carl’s Jr. growth dependent on improving existing profitability
23
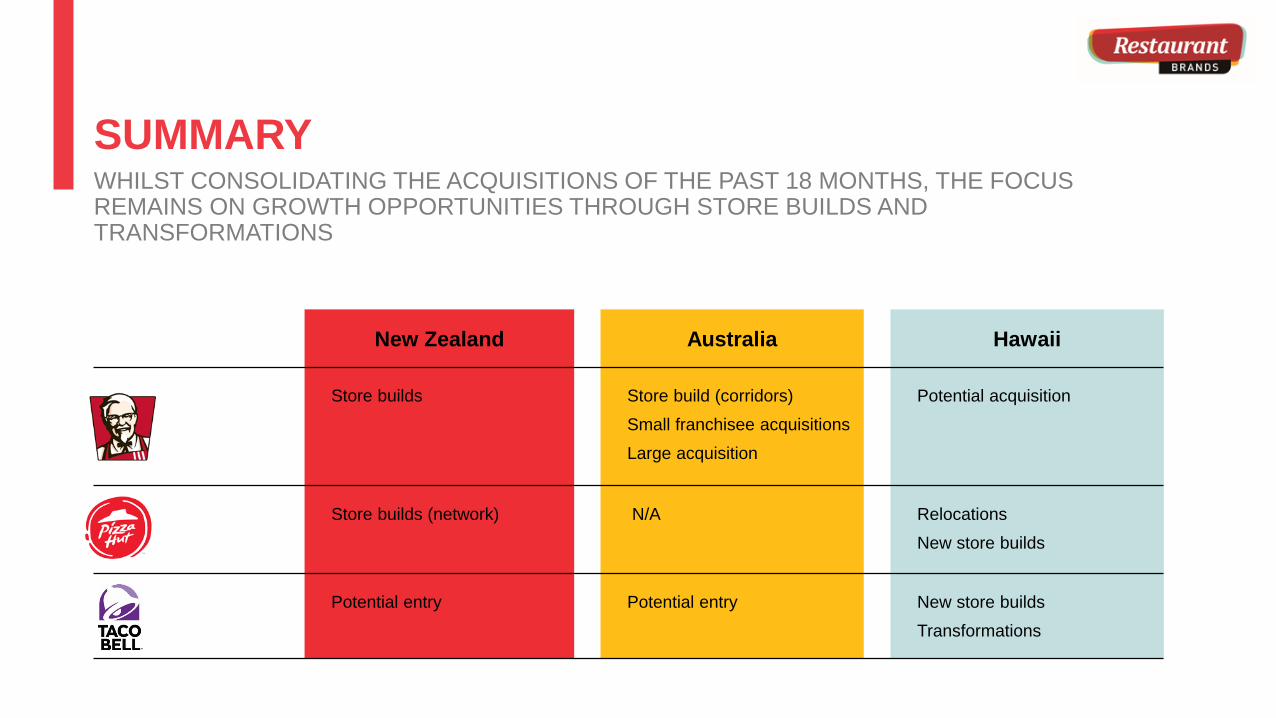
New Zealand Australia Hawaii
Store builds Store build (corridors)
Small franchisee acquisitions
Large acquisition
Potential acquisition
Store builds (network) N/A Relocations
New store builds
Potential entry Potential entry New store builds
Transformations
SUMMARYWHILST CONSOLIDATING THE ACQUISITIONS OF THE PAST 18 MONTHS, THE FOCUS REMAINS ON GROWTH OPPORTUNITIES THROUGH STORE BUILDS AND TRANSFORMATIONS
OUTLOOK FY18 YEAR• Current strategies across all geographic markets are delivering positive results.
• Acquisition of the Taco Bell and Pizza Hut brands in Hawaii has seen a solid contribution in the first period of ownership.
• Strong performance of the KFC brand in Australia and New Zealand expected to continue in the second half.
• Absent any major changes to economic or market conditions, the Group will deliver a Net Profit after Tax (excluding non-trading items) for the FY18 year of around $40 million
25

QUESTIONS?
DISCLAIMER
The information in this presentation: • Is provided by Restaurant Brands New Zealand Limited (“RBD”) for general information purposes and does not constitute investment advice or an offer of or invitation to purchase RBD securities. • Includes forward-looking statements. These statements are not guarantees or predictions of future performance. They involve known and unknown risks, uncertainties and other factors, many of which are
beyond RBD’s control, and which may cause actual results to differ materially from those contained in this presentation. • Includes statements relating to past performance which should not be regarded as reliable indicators of future performance.• Is current at the date of this presentation, unless otherwise stated. Except as required by law or the NZX Main Board and ASX listing rules, RBD is not under any obligation to update this presentation, whether
as a result of new information, future events or otherwise. • Should be read in conjunction with RBD’s audited consolidated financial statements for the year to 27 February 2017 and the unaudited six months to 11 September 2017 and NZX and ASX market releases. • Includes non-GAAP financial measures including "EBITDA”. These measures do not have a standardised meaning prescribed by GAAP and therefore may not be comparable to similar financial information
presented by other entities. However, they should not be used in substitution for, or isolation of, RBD’s audited consolidated financial statements. We monitor EBITDA as a key performance indicator and we believe it assists investors in assessing the performance of the core operations of our business.
• Has been prepared with due care and attention. However, RBD and its directors and employees accept no liability for any errors or omissions. • Contains information from third parties RBD believes reliable. However, no representations or warranties are made as to the accuracy or completeness of such information.