Investigation of Water Quality and Source Tracking at...
23
Investigation of Water Quality and Source Tracking at Caseville County Park Beach Huron County, Michigan July 10, 2009 Prepared for: Central Michigan District Health Department Prepared by: Marc Verhougstraete Research Assistant, Erin A. Dreelin, Ph.D. Associate Director Center for Water Sciences, And Joan B. Rose, Ph. D. Homer Nowlin Chair in Water Research The Water Quality, Environmental, and Molecular Microbiology Laboratory Department of Fisheries and Wildlife 13 Natural Resources Building Michigan State University East Lansing, MI 48824 Phone: (517) 432‐4412 Fax: (517) 432‐1699 [email protected]
Transcript of Investigation of Water Quality and Source Tracking at...

Investigation of Water Quality and Source Tracking at Caseville County Park Beach
Huron County, Michigan
July 10, 2009
Prepared for: Central Michigan District Health Department
Prepared by:
Marc Verhougstraete Research Assistant,
Erin A. Dreelin, Ph.D. Associate Director
Center for Water Sciences,
And
Joan B. Rose, Ph. D. Homer Nowlin Chair in Water Research
The Water Quality, Environmental, and Molecular Microbiology Laboratory
Department of Fisheries and Wildlife 13 Natural Resources Building Michigan State University East Lansing, MI 48824
Phone: (517) 432‐4412 Fax: (517) 432‐1699 [email protected]

1. INTRODUCTION 1.1 Background Throughout the United States, recreational waters are expected to meet swimmable standards as defined under the Clean Water Act. However, each year, thousands of beaches are closed due to elevated bacteria levels (NRDC 2008). It is critical that the sources of contamination are identified in order to develop solutions to water quality problems that reduce the number of beach closures and protect human health. In 1986, the United States Environmental Protection Agency (EPA) developed water quality criteria for recreational waters based on indicator bacteria. These criteria were based on public health studies conducted in the 1950s‐1980s. EPA recommended the use of two indicators: enterococci for marine waters and Escherichia coli (E. coli) or enterococci for freshwaters. E. coli and Enterococci are used as water quality indicators because they have been linked to human gastroenteritis through the use of epidemiological studies (EPA 1986, Wade et al. 2008). Each state is responsible for developing and adopting standards for “swimmable” waters under the Clean Water Act that are as protective, based on the risk of illness, as the EPA criteria. Michigan’s E. coli total body contact standard has been set at 300 CFU/100 ml, which was approved as equally protective of human health as the EPA level of 235 CFU/100 ml. In Michigan, beach managers conduct routine beach monitoring of E. coli concentrations to assess water quality conditions at recreational beaches. Samples are collected in waist‐deep water at least once per week during the swimming season. More recently, managers have added more extensive data collection, through the use of beach sanitary surveys, to routine beach monitoring in order to improve the usefulness of E. coli data. This effort developed from an EPA pilot project at Great Lake’s beaches. Beach managers using the sanitary surveys collect physical data, such as temperature and wave height, for every water sample collected. This allows managers to examine relationships between E. coli and the physical parameters, potentially enabling the managers to better predict conditions when E. coli concentrations are high. These results can be used, in conjunction with source tracking and fecal indicator results, by beach managers to make informed watershed and site‐specific management decisions. Scientists have also conducted research on recreational waters in order to better understand risks to human health from fecal contamination. Elevated bacteria levels have been detected at some beaches during high energy periods such as increased wind and wave action. This has led researchers to investigate microbial contamination, survival, and transport in the nearshore zones (Garrido‐Perez et al. 2008, Whitman 2003). Researchers have also found high levels of bacteria in the sediment and sand of
2
nearshore beaches which can be suspended into the water column during high energy inputs. Algal mass accumulation on recreational beaches prompted researchers to explore pathogens and indicators in algae (Englebert et al. 2008a, Englebert et al. 2008b, Ishii et al. 2006, Olapade et al. 2006). This research identified elevated bacteria levels in algae and algal mats but these were not correlated to beach water quality. There are multiple indicators for fecal contamination in water. In addition to E. coli and enterococci, Clostridium perfringens (C. perfringens) and Coliphage have emerged as useful alternative fecal indicators. Appendix 1 describes the indicators and advantages/disadvantages to using each. When used together, the fecal indicators can provide a better understanding of water quality than E. coli alone. Fecal indicators are based on the premise that each indicator will be found consistently in fecal waste and have similar survival and transport properties as pathogens known to cause disease (Colford 2007). However, survival rates and regrowth potential of some bacteria varies depending on water temperature, sunlight, nutrient status, and turbidity (McLellan 2007) and bacterial indicators have been poor predictors of the presence of viruses and parasites. In addition, the indicators are not able to identify the source of the contamination. Thus, fecal indicators have multiple limitations. The inability of indicators to identify pollution sources has come to the forefront of water quality in recent years and has lead to the development of microbial source tracking. Microbial source tracking is a field of study that seeks to identify the origin of fecal waste. There are two types of source tracking methods: library‐dependent and library‐independent. Library‐dependent methods involve creating a large dataset of particular target bacteria present in one area (i.e. watershed, county, etc.) from a variety of sources (human, bovine, avian, etc.). Water samples are then assayed and the results are compared to the identified organisms in the library to determine the origin of the fecal pollution. The disadvantage of library‐dependent methods is that it requires a great deal of time and resources to collect, identify, catalog, and store all of the organisms that may be present in a given area. This method also returns a large number of false positives and false negatives (Santo Domingo et al. 2007). Library‐independent methods involve the detection of a marker specific to one species to identify the source of microbial contamination. Library‐independent methods include the use of chemicals, sterols, viruses, bacterial genes, and toxins. In the case of bacterial genes, the DNA sequences first are identified and then undergo validation testing to evaluate the specificity of the sequence as unique to a particular species. Water samples are then assayed for the source markers, generally through a non‐culture based method (Santo Domingo et al. 2007) and DNA amplification through polymerase chain reactions (PCR). The library‐independent method can use conventional or real‐time
3
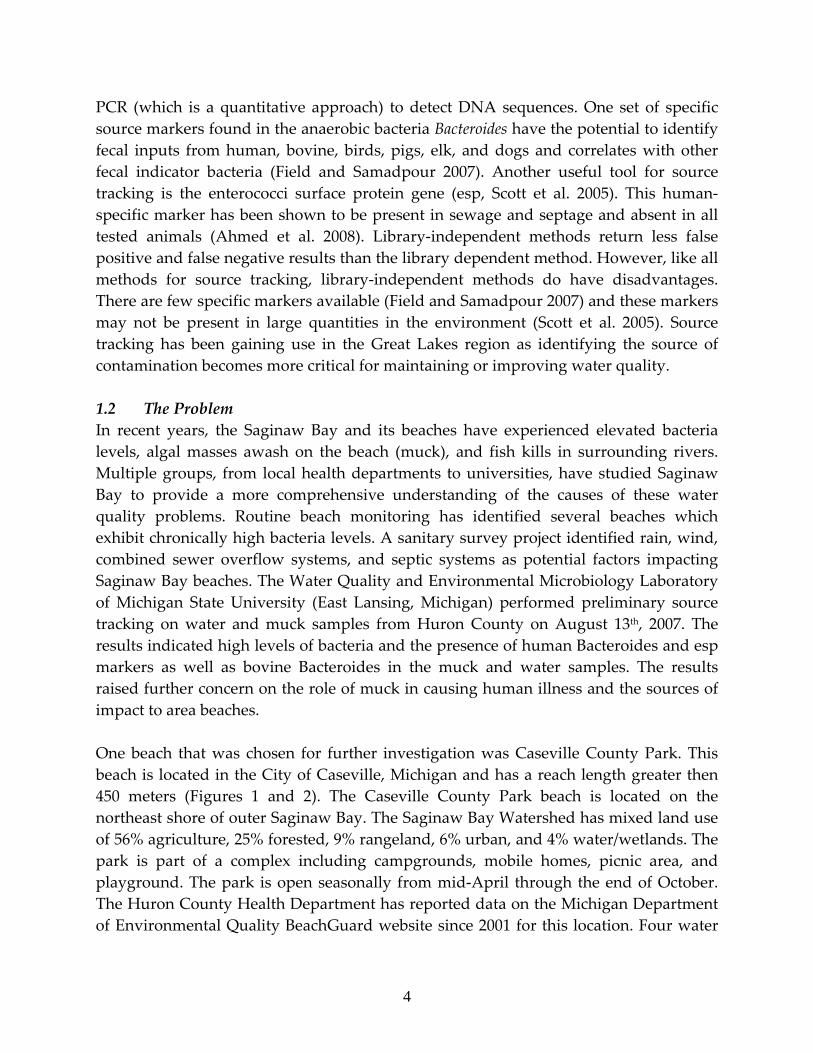
PCR (which is a quantitative approach) to detect DNA sequences. One set of specific source markers found in the anaerobic bacteria Bacteroides have the potential to identify fecal inputs from human, bovine, birds, pigs, elk, and dogs and correlates with other fecal indicator bacteria (Field and Samadpour 2007). Another useful tool for source tracking is the enterococci surface protein gene (esp, Scott et al. 2005). This human‐specific marker has been shown to be present in sewage and septage and absent in all tested animals (Ahmed et al. 2008). Library‐independent methods return less false positive and false negative results than the library dependent method. However, like all methods for source tracking, library‐independent methods do have disadvantages. There are few specific markers available (Field and Samadpour 2007) and these markers may not be present in large quantities in the environment (Scott et al. 2005). Source tracking has been gaining use in the Great Lakes region as identifying the source of contamination becomes more critical for maintaining or improving water quality. 1.2 The Problem In recent years, the Saginaw Bay and its beaches have experienced elevated bacteria levels, algal masses awash on the beach (muck), and fish kills in surrounding rivers. Multiple groups, from local health departments to universities, have studied Saginaw Bay to provide a more comprehensive understanding of the causes of these water quality problems. Routine beach monitoring has identified several beaches which exhibit chronically high bacteria levels. A sanitary survey project identified rain, wind, combined sewer overflow systems, and septic systems as potential factors impacting Saginaw Bay beaches. The Water Quality and Environmental Microbiology Laboratory of Michigan State University (East Lansing, Michigan) performed preliminary source tracking on water and muck samples from Huron County on August 13th, 2007. The results indicated high levels of bacteria and the presence of human Bacteroides and esp markers as well as bovine Bacteroides in the muck and water samples. The results raised further concern on the role of muck in causing human illness and the sources of impact to area beaches. One beach that was chosen for further investigation was Caseville County Park. This beach is located in the City of Caseville, Michigan and has a reach length greater then 450 meters (Figures 1 and 2). The Caseville County Park beach is located on the northeast shore of outer Saginaw Bay. The Saginaw Bay Watershed has mixed land use of 56% agriculture, 25% forested, 9% rangeland, 6% urban, and 4% water/wetlands. The park is part of a complex including campgrounds, mobile homes, picnic area, and playground. The park is open seasonally from mid‐April through the end of October. The Huron County Health Department has reported data on the Michigan Department of Environmental Quality BeachGuard website since 2001 for this location. Four water
4
quality exceedances have been reported since 2001, resulting in four beach closures and 18 closure days.
Figure 1: Caseville County Park Beach Caseville, Michigan
Figure 2: Caseville County Park beach, 8/12/2008
The beach at Caseville County Park was selected for further study because the sources of contaminants were poorly understood and because it was part of a beach sanitary survey project that provided geographic, weather conditions, and hydrologic data specific to this site. Muck was present on Huron County beaches in 2007 which prompted the Department of Environmental Quality to characterize the muck. Results indicate that it consisted of dead and decaying green algae, blue‐green algae, Cladophora, and macroinvertebrate (B. Walker, personal communication, January 16, 2009). On August 13, 2007 the Water Quality and Environmental Microbiology Laboratory of Michigan State University sampled muck from Saginaw Bay and found E. coli, Enterococci, and Clostridium perfringens. The esp gene was detected in about half of the muck samples while the human and bovine Bacteroides were each found once in the muck. Further investigation into the movement and origin of the muck is being planned.
1.3 Study Objectives The aim of this project was to:
1. Explore environmental conditions (i.e. wind, rain, water, etc.) and the relationship between muck and elevated E. coli concentrations;
2. Identify potential sources of fecal pollution at the Caseville County Park beach; and
3. Determine the influence muck has on surrounding water quality.
5

To achieve our objectives we applied source tracking methods, routine beach monitoring, multiple zone sampling, and sanitary surveys to the beach at Caseville County Park.
2. MATERIALS AND METHODS 2.1 Sample location, type, and strategy Tests performed by the Water Quality and Environmental Microbiology Laboratory on samples from the Caseville County Park beach included fecal indicators (E. coli, enterococci, C. perfringens, and Coliphage) and microbial source tracking markers (Human and Bovine Bacteroides markers and Enterococcus Surface Protein (esp)). Environmental samples were collected eight times at one location and included sediment samples (n=7), muck samples (n=2), shallow water samples (n=8), and waist deep water samples (n=3 and n=7 for deep water which includes 2 samples collected by MSU and 5 by health department for E. coli only) as indicated in Table 1. Deep water samples were initially collected twice (7‐10‐2008 and 7‐15‐2008) The Huron County Health Department performed routine beach monitoring for E. coli concentrations at the same time as the source tracking samples were collected. Table 1: Caseville beach monitoring dates and types of samples in Saginaw Bay, Michigan Water Sample ID
Location Description
Dates Collected
Types of Samples Collected
Caseville County Park Beach
Park entrance near Loosemore Rd. and Port Austin Rd. 44.00175, ‐83.07320
7‐10‐2008 7‐15‐2008 7‐22‐2008 7‐29‐2008 8‐5‐2008 8‐12‐2008 9‐6‐2008 9‐30‐2008
Deep and shallow Deep, shallow, and sediment Shallow and sediment Shallow, sediment, and muck Shallow, sediment, and muck Shallow and sediment Shallow and sediment Deep, shallow, and sediment
2.2 Physical data Physical parameters were collected at the same time water samples were collected and included bather load, animals present on the beach, debris in the water and on the beach, wave height, and water and air temperature. Other data (precipitation, wind speed/direction, etc.) were collected from local weather stations on‐line
6

(weatherunderground.com). Once in the laboratory pH and turbidity were also measured. Wave height data were collected using a yard stick and measured from the trough to the crest of the wave. Debris and algae amounts in the water and on the beach were estimated and later quantified using the following approach: 0% present was given a 1, 1‐20% material per area present was given a 2, 21‐50% material per area present was given a 3, and 51‐100% material per area present was given a 4. Birds in the water or at the swash zone were counted by sight and if species could be identified the count was noted. Bather load was determined by counting the number of individuals in and out of the water and noting their activity.
2.3 Water sampling Grab samples were collected at the beach in ankle deep water (approximately 15‐20 cm) using sterile sample bottles for shallow water sampling. Care was given to not disturb the surrounding sediment during collection. Grab samples were obtained at the beach in waist deep water (3’) using sterile sample bottles. Inverted sample bottles were plunged to a depth of 6”‐12” below the surface, turned up, and capped underwater to avoid surface water from being collected. All Samples, regardless of type, were placed on ice (4o C) and brought to the MSU Water Quality and Environmental Microbiology Laboratory for analysis. The samples were kept at 4o C and processed within 24 hours of collection. 2.4 Sediment/sand sampling Sediment samples were collected in the swash zone via sterile Whirl‐Pak ®. Sediment samples were collected by inverting the Whirl‐Pak®, grabbing a handful of sediment from three points on the beach, and then compositing all subsamples into one bag. Samples were placed on ice at 4o C and brought to the MSU Water Quality and Environmental Microbiology Laboratory for analysis. The samples were kept at 4o C until processed the same day as collection.
2.5 Muck sampling Muck samples were collected from large masses in the nearshore water area. A sterile Whirl‐Pak® was inverted and plunged into the muck. Three grab samples were taken during each event and composited as one sample for analysis in the laboratory. Samples were stored and transported as previously described. 2.6 Sample analysis for culture based methods 2.6a Bacterial analysis
7

Water samples were analyzed for E. coli and Enterococci via membrane filtration and the mTEC agar method (US EPA 2005) and mEI agar method (US EPA 2002), respectively. Water, muck, and sediment samples were analyzed for Clostridium perfringens by using membrane filtration and mCP agar method (US EPA 1995, Bisson 1979). Sample volume ranged from 1 ml to 100 ml of undiluted sample. Negative controls were run using sterile PBW and plating on each agar. Positive controls were also set up and assayed by membrane filtration using dilutions of stock cultures in PBW and plating on the respective selective agar. Seventy‐five grams of weight wet of muck was placed into a sterile blender, pulsed until homogenized, and diluted to a 10% w/v with sterile Phosphate Buffer Water (PBW). From the mixture, 100 ml was assayed for E. coli and Enterococci using Colilert and Enterolert, respectively. Bacterial levels were reported as colony forming units/100 grams wet weight of material. Similarly 75 grams of wet weight of sediment were diluted to a 10% w/v with sterile PBW and 100 ml of the mixture was used to assay for E. coli and Enterococci using Colilert and Enterolert, respectively. Bacterial levels were reported as colony forming units/100 grams wet weight of sediment. Sediment samples were diluted to a different w/v percentage than the muck samples to obtain countable results. The muck required a greater dilution than the sediment to obtain countable results and to assure membrane filters were not too thick to mask colonies. 2.6b Coliphage analysis Agar overlays were utilized to detect coliphage following EPA methods 1601 and 1602 (EPA 2001a and EPA 2001b). Non‐filtered water samples were used to enumerate coliphage. Two bacterial hosts were used in the overlays including E. coli F+amp and E. coli CN‐13. The F+amp is known as a host that supports growth of the male specific coliphage as the phage infects the host at the F‐pili. The (CN‐13) host bacteria supports somatic coliphage where these phage attach at the outer cell wall. In order to achieve a log phase of host bacteria, 1 ml of stock culture E. coli CN‐13 and F+amp stocks were added to 9 ml of sterile TSB and 1% total volume of appropriate antibiotic, either Naladixic acid for CN‐13 or Streptomycin Ampicillin for F+amp. Hosts were then placed in a 36 o C shaking incubator at 100 rpm for approximately four hours. One‐half ml of log phase host E. coli CN‐13 or F+amp and 2 ml of water sample were added to melted top agar (at 1.5% agar, maintained in a liquid state at 480 C) the samples were then immediately mixed and poured onto a tryptic soy agar plate (TSA),
8

these were allowed to solidify, inverted and incubated for 24 hours in a 370 C incubator. Coliphage samples were analyzed using five replicate plates per host. Thus, 20 ml of sample per site were assayed for coliphage during each sampling event. Two negative control plates were made, one with each host, by adding 1.5 ml host to the top agar, mixing and pouring onto a TSA plate. A positive control was run for each host type by adding 1.5 ml host to the top agar, mixing and pouring onto a TSA plate. Stock phage was spotted onto the hardening agar layer. Overlays were incubated at 37°C for 24 hours, and then assessed for plaque formation. Incubation times, temperatures, and EPA standards are for the fecal indicator culture based methods discussed above are summarized in Table 2. Table 2: Media and methods used for microbial indicator testing
Test Media Incubation Reference EPA Recreational Standards
E. coli mTEC 24‐28 hours at 37°C
US EPA Method 1603 (US EPA. 2005)
235 E. coli/ 100 ml
Enterococci mEI agar 24 hours at 41°C US EPA Method 1600 (US EPA. 2002)
61 Enterococci/100 ml
Clostridium perfringens
mCP 24 hours at 45°C EPA 1995, Bisson 1979 Not established
Coliphage Tryptic Soy Agar
16 – 24 hours at 37°C
US EPA Method 1601/1602 (US EPA 2001)
Not established
2.7 Sample analysis for Cryptosporidium/Giardia Analysis for Cryptosporidium and Giardia were done following the EPA approved method 1623. Water samples were filtered and the (oo)cysts (Giardia cysts and Cryptosporidium oocysts) and extraneous materials were retained on a HV Gelman filter. The material on the filter was eluted and then centrifuged to pellet the (oo)cysts. The supernatant fluid was aspirated. The (oo)cysts were further concentrated via attachment of magnetic beads conjugated to anti‐Cryptosporidium and anti‐Giardia antibodies. The (oo)cysts were separated from the extraneous materials using a magnet. The extraneous material was then discarded. The magnetic bead complex was then detached from the (oo)cysts. The (oo)cysts were stained on well slides with fluorescently labeled monoclonal antibodies and 4ʹ,6‐diamidino‐2‐phenylindole (DAPI). The stained sample was examined using fluorescence and differential interference contrast (DIC) microscopy. Quantitative analysis was performed by scanning each slide and counting all (oo)cysts that met the size, shapes, and fluorescence criteria of
9

Cryptosporidium and Giardia (oo)cysts. A percentage of the (oo)cysts were assessed through DAPI staining characteristics and DIC microscopy to record any internal features observable. 2.8 Sample analysis using Molecular methods 2.8a Bacteroides analysis One liter of water was filtered through a membrane filter, placed into a 50 ml centrifuge tube, and vortexed for five minutes. The tube was then centrifuged for 30 minutes at 4000 x g. Mobio Mega soil DNA kit was used to extract the DNA from the pellet. PCR amplification was performed on the extracted DNA. Primers for both human and cow Bacteroides sequences were used as previously described (Bernhard 2000). Gel electrophoresis was performed on the PCR product, run on a 1.2% w/v agarose gel at 95 V for approximately one hour. 2.8b Enterococci esp analysis The enterococci bacteria which grew up on the membrane filter on MEI as described in the culture based methods were washed off the membrane, centrifuged for 15 minutes and DNA was extracted from the pellet (Kumar, L. 2007, Scott et al. 2005) using Qiagen QIAmp DNA mini kit. The primers specific for the esp gene in E. faecium previously developed and examined for specificity to human fecal pollution were used in a polymerase chain reaction [PCR] (Scott et al. 2005). The forward primer: (5’‐TAT GAA AGC AAC AGC ACA AGT‐3’) and the conserved reverse primer (5’ –ACG TCG AAA GTT CGA TTT CC‐3’) were used for all reactions. Gel electrophoresis was performed on the PCR product and run on a 1.2% w/v agarose gel at 95 V for approximately one hour. Samples with bands at 680 bp were recorded as positives for esp. 2.9 Data analysis The geometric mean of each microorganism was calculated for each sample type (muck, shallow, deep, and sediment) at each site. When organisms were not detected, the detection limit value was applied. Detection limits were calculated by dividing 1 by the total sample volume processed to return a detection limit (<1/vol. converted to < per 100 ml). In sediment and muck samples, the lower detection limit was determined by dividing 1 by the total volume assayed, then multiplying by the total volume of diluted sample divided by the grams of sediment/muck added to dilution sample. Results that exceeded the upper detection limit were used as that > number. Mean air temperatures were calculated as averages of hourly observations as recorded at local weather stations over a 24 hour period on the sampling date.
10

3. RESULTS 3.1 Spatial sampling analysis Samples were collected throughout the summer at Caseville County Park beach in the deep/swimmable waters (E. coli n=7: 2 samples collected by MSU and 5 by health department; n=3 for enterococci, C. perfringens, and Coliphage), shallow waters (n=8), sediment in the swash zone (n=7), and muck (n=2) as depicted in Figure 3. Samples were processed the same day for E. coli, enterococci, C. perfringens, and coliphage (CN‐13 and F+amp). The geometric means and ranges per sample location and assay are given in Table 3. Deep water samples were initially collected on July 10th and July 15th but bacteria levels were low enough to discontinue source tracking efforts. The Huron County Health Department collected routine beach monitoring samples at the time source tracking samples were collected. E. coli concentrations in the swimmable waters had a geometric mean average of 5.3 CFU/100 ml and ranged from 1.3 to 26 CFU/100 ml. The other fecal indicators ranged from 1.0 to 8.7 CFU/100 ml for enterococci, <0.5 to 2.7 CFU/100 ml for C. perfringens, and below detection (10 PFU/100 ml) to 10 and 100 PFU/100 ml for Coliphage F+amp and CN‐13, respectively. Raw data collected from the swimmable waters are provided in Appendix 2.
Shallow water, muck, and sediment samples
Swimmable water samples
Pigeon River
Figure 3. Caseville County Park Beach
Figure 3: Sampling parameter locations at Caseville County Park Beach
11

Table 3: Spatial sample analysis from Caseville County Park Beach
Site E. coli Enterococci C. perfringens Coliphage
(F+amp) Coliphage (CN‐13)
Geometric mean 132.3 71.7 5.1 <10.0 19.5 Range 8.5‐1986.3 2.0‐1986.3 2‐30 <10.0 <10.0‐220
Shallow (a) n=8
Percent + 100 100 100 0 62 Geometric mean 5.3 2.5 0.9 10.0 21.5 Range 1.3‐26 1.0‐8.7 <0.5‐2.7 <10.0‐10 <10.0‐100
Deep (a; c) n=3
Percent + 100 100 66 33 66 Geometric mean 237.0 194.8 23.93 123.5 146.1 Range 27.0‐15596 18‐3485.7 10‐165 <90‐360 <90‐990
Sediment (b) n=7
Percent + 100 100 100 14 14 Geometric mean 1692.1 12974.0 12.3 <116.2 <116.2 Range 413.1‐6930.9 9415.8‐17876.7 12.3 <90‐<150 <90‐<150
Muck(b) n=2
Percent + 100 100 100 0 0 a: CFU or PFU/100 ml b: CFU or PFU/100 g wet weight <: Below method detection limits c: Deep water includes 2 samples collected in this study and 5 by health department for E. coli only. The geometric means of E. coli, enterococci, C. perfringens, Coliphage F+amp, and Coliphage CN‐13 in the shallow water were 132.3, 71.7, 5.1, 10, and 19.5 organisms/100 ml, respectively. Shallow water bacteria concentrations (CFU/100 ml) ranged from 8.5 to 1986.3 for E. coli, 2.0 to 1986.3 for enterococci, and 2.0 to 30 for C. perfringens. Coliphage F+amp concentrations in the shallow water were always below detection limits (10 PFU/100 ml) and ranged from below detection limits to 220 PFU/100 ml for CN‐13. Raw data collected from the shallow water of Caseville County Park beach are listed in Appendix 3. The sediment exhibited a geometric mean for E. coli, enterococci, C. perfringens, Coliphage F+amp, and Coliphage CN‐13 of 237.0, 194.8, 23.93, 123.5, and 146.1 organisms/100 g wet weight, respectively. Bacteria concentrations (CFU/100 g wet weight) in the sediment ranged from 27.0 to 15596.1 for E. coli, 18 to 3485.7 for enterococci, and 10 to165 for C. perfringens. Coliphage concentrations in the sediment ranged from below detection limits (90 PFU/ 100 g wet weight) to 360 and 990 PFU/100 g wet weight for F+amp and CN‐13, respectively. Raw data collected from the sediments of Caseville County Park beach are listed in Appendix 4. Muck samples were collected when present at Caseville County Park beach (n=2). The geometric mean concentrations of E. coli, enterococci, C. perfringens, Coliphage (F+amp), and Coliphage (CN‐13) were 1692.1, 1.30x10⁴, 12.3, <116.2, and <116.2 organisms/100 g wet weight, for each respective indicator. Indicator concentrations in the muck ranged
12

from 413.1 to 6930.9 CFU/100 g wet weight for E. coli and 9415.8 to 1.79x10⁴ CFU/100 g wet weight for enterococci. Coliphage viruses were not detected above method detection limits (90 to 150 PFU/100 g wet weight). Data collected from the muck at Caseville County Park beach are listed in Appendix 5. 3.2 Temporal sampling analysis Samples were collected at Caseville County Park beach from Mid‐July through the end of September (n=8). A total of one‐hundred fecal indicator assays were processed. Samples collected on September 30th, 2008 exhibited higher indicator averages than any other sampling date. E. coli levels detected in the water averaged 1001 CFU/100 ml while sediment samples averaged 1.56x10⁴ CFU/100 g wet weight on September 30th, 2008. Two beach advisories and one beach closure were warranted after E. coli levels exceeded Michigan water quality standards on June 30th, July 22nd, and August 19th. On September 30th, enterococci levels averaged 994 CFU/100 ml in the water and 3.49x10³ CFU/100 g wet weight in the sediment, the highest averages of this project. Clostridium perfringens assays were performed on eighteen samples. The highest levels detected in the swimming water (2.67 CFU/100 ml) and shallow water (30.0 CFU/100 ml) were detected on September 30th. C. perfringens levels were highest in the sediment on August 5th, averaging 165 CFU/100 g wet weight. Coliphage analysis was performed on nineteen samples collected from Caseville County Park beach. Coliphage levels were highest on September 30th in water samples (80.1 PFU/100 ml) and in the sediment samples (990 PFU/100 g wet weight). Coliphage levels were also elevated on July 10th in the shallow water (CN‐13 average of 30 PFU/100 ml). On September 6th, 2008 a sample was collected from Caseville County Park beach in the shallow water. This sample was analyzed for the presence of Cryptosporidium and Giardia. At the lower detection limit (.05 (oo)cysts/l), neither organism was detected. 3.3 Physical data analysis Physical data (temperatures, wind speed, wave height, etc) collected at Caseville County Park beach at the time of sampling are given in Appendix 6. Air temperature at the time of sampling ranged from 23.9°C on August 12th to 14.7°C on September 30th. Water temperatures at time of sampling ranged from 15.3°C on September 30th to 25.3°C on July 15th. Winds were generally calm and only once had a measurable speed (6 MPH on July 29th). Wind directions were variable on each sampling event. Wave height ranged from 0.0’ to 1’ when samples were collected for this project. Bathers were present in the water four times when samples were collected. The most bathers (n=80) were present on August 12th. Algae were present in the nearshore water
13

during three sampling events. During one sampling event, the algae were present in 21‐50% of the nearshore water area. Algae were present in less than 20% of the nearshore beach sand during one sampling event. During each sampling event a gull colony ranging from 5 to greater than 100 gulls was present on the beach of Caseville County Park. Precipitation data collected at Caseville County Park beach identified the largest recorded 24, 48, and 72 hour total rainfall was on September 6th (.51”. 1.94”, and 2.57”, respectively). Samples taken on July 29th indicated no rainfall had occurred in the previous 72 hours. Samples collected on July 22nd, September 6th, and September 30th were considered wet weather monitoring events because greater than .25” of rainfall was recorded in the 48 hours before samples were collected. 3.4 Molecular analysis The enterococci surface protein (esp) gene was used as a source tracking marker at Caseville County Park beach. Analysis for esp was performed on fifteen samples (two swimmable, three sediment, two muck, and eight shallow water samples). Muck collected at Caseville County Park beach on August 5th tested positive for the esp gene. One (33%) sediment sample tested positive for the esp gene (September 30th). Results from the esp testing at Caseville County Park beach are given as present/absence in Appendix 7. Samples were also assayed for the human and bovine Bacteroides marker through the use of PCR and qPCR. Six samples (two swimmable and five shallow) collected at Caseville County Park beach were assayed for the presence of Bacteroides (human and bovine) using conventional PCR methods. No samples tested posted for either of the Bacteroides indicators. Bacteroides results from the swimmable and shallow waters are given as presence/absence in Appendices 8 and 9, respectively. The sample collected on July 22nd, 2008 was further assayed using a larger sample volume (500 μl) extraction method and a qPCR marker for human Bacteroides. This test did not detect the presence of human Bacteroides at Caseville County Park beach. 4. DISCUSSION Caseville swimming water quality was good during this survey, no violations were noted. It appears there are complex interactions between the sediment in the swash zone, the muck and the shallow water, in which fecal indicators are accumulating (potentially regrowing), depositing and resuspending, associated with rain and wind
14

(and waves). The numbers of samples were too small to undertake a statistical analysis. Whitman and Nevers (2003) showed beach sand has major implications on surrounding water quality acting as a source of E. coli and may be able to sustain E. coli populations for long periods of time. E. coli and Enterococci have been shown to persist and replicate in sand (Alm et al. 2003) but during precipitation events, they may be washed into the surrounding waters. Recent research also suggests beaches with high levels of organic matter in the sediment have higher concentrations of bacteria than beaches with low organic levels (Garrido‐Perez 2008). Muck has been shown to contain algae, detritus, and macroinvertebrate that can provide large levels of nutrients during decay and may accumulate and protect the fecal organisms which are dispersed during wave action. The molecular source tracking results detected the presence of the enterococci surface protein (esp) gene in two samples taken from Caseville County Park beach in one muck and one sediment sample, indicating the presence of human sewage. However, it should be kept in mind that the detection limit was poor so that until the methods improve the absence of the Bacteroides was not informative. Previous samples collected at this beach by our laboratory in 2007 detected the presence of the esp gene in muck and shallow water samples. Bovine Bacteroides results from 2007 and 2008 indicated that bovine fecal pollution was not detected at this park. The esp gene is an emerging tool for source tracking in surface waters but its reliability has been contested. Byappanahalli et al. (2008) suggest the esp gene is not a dependable indicator of human fecal inputs. Their research indicates that the esp gene is not unique to human feces but can also be detected in dog feces. In contrast, Ahmed (2008) reported that the enterococci surface protein (esp) gene was detected in 67% of raw human septic samples and in 100% of sewage samples but never detected in non‐human source samples (i.e. cattle, avian, swine, etc.). The detection of one human marker and the non‐detect of another human marker identifies the need for further improvement to the sensitivity and specificity of source tracking markers. The detection of the human specific esp gene and the elevated fecal pollution indicators suggests a non‐consistent but present source of human fecal pollution to Caseville County Park. The non‐detect of Cryptosporidium and Giardia would indicate that, although bacteria levels may be elevated, pathogens may not be present. Future research should focus on the hydrodynamics of the Pigeon River and the source of the human wastewater signal at Caseville County Park beach.
15

Four indicators were used, two that could possibly regrow (E. coli and enterococci) and one that does not but can accumulate and survive (Clostridium) and the coliphage which can not regrow and do die‐off, (with the DNA phage which would show up on the CN‐13 host surviving a bit better in surface water). We have suggested that the coliphage represent more recent pollution or environments that allow for greater survival. In shallow and deeper waters the bacteria were found 100% of the time although at low levels in the deeper/swimmable waters, Clostridium was only found 66% of the time in the swimmable waters, as was the (CN‐13Host) coliphage. The bacteria including the Clostridium were found 100% of the time in the sediment and muck, where as the coliphage were not detected in the two muck samples and were detected only 14% of the time in the sediment. Despite the fact that muck and sediment may offer some protection from die‐off, these data suggest that the pollution in the sediment and the muck is older pollution and because it is easier to sample large volumes of water the detection of coliphage may be a result of resuspension and desorption. 5. CONCLUSIONS The major conclusions from this study of Caseville Park Beach are:
1. Muck (algal mass) was present twice on the beach during the study period and appears to be a contributor to the fecal pollution of the shallow waters and perhaps contributes to the low levels of indicators in the deeper swim zone.
2. The highest levels of fecal indicator bacteria were found in the muck and shallow water, but the Clostridium and coliphage data suggest that the pollution is older.
3. One muck and one sediment sample tested positive for the esp gene, a human source tracking marker, indicating human fecal contamination.
4. Fecal indicator bacteria are significantly lower in the swimmable waters and are within safe swimming levels.
5. Shallow water, where many children play, had higher concentrations of E. coli and other indicators, but was within the state limits. However, Enterococci were slightly higher than the recommended EPA criterion. Thus a message for good hygiene practices should be developed for the public using the shallow waters.
16
REFERENCES Ahmed,W., J. Stewart, D. Powell, and T. Gardner. (2008). Evaluation of the host‐specificity and prevalence of enterococci surface protein (esp) marker in sewage and its application for sourcing human fecal pollution. J. Environ. Quality 37: 1583‐1588. Alm, E.W., J. Burke, and A. Spain. (2003). Fecal indicator bacteria are abundant in wet sand at freshwater beaches. Water Research 37: 3978-3982. Bernhard, A.E., K.G. Field,. K.G. (2000). A PCR Assay To Discriminate Human and Ruminant Feces on the Basis of Host Differences in Bacteroides‐Prevotella Genes Encoding 16S rRNA Appl. Environ. Microbiology 66: 4571‐4574. Bisson, J.W. and V.J. Cabelli. (1979). Membrane filter enumeration method for Clostridium perfringens. Applied and Env. Microbiology 37: 55‐66. Byappanahalli, M.N., K. Przybyla‐Kelly, D.A. Shively, and R.L. Whitman. (2008). Environmental occurrence of the enterococcal surface protein gene is an unreliable indicator of human fecal contamination. Environ. Sci. Technol. 42: 8014‐8020. Colford, J.M. Jr., T.J. Wade, K.C. Schiff, C.C. Wright, J.F. Griffith, S.K. Sandhu, S. Burns, . Sobsey, G. Lovelace, and S.B. Weisberg. (2007). Water quality indicators and the risk of illness at beaches with nonpoint sources of fecal contamination. Epidemiology 18: 27‐35. Englebert, E.T., C. McDermott, and G. Kleinheinz. (2008a). Impact of the alga Cladophora on the survival of E. coli, Salmonella, and Shigella in laboratory microcosm. J. Great Lakes Res 35: 377‐382. Englebert, E.T., C. McDermott, and G. Kleinheinz. (2008b). Effects of the nuisance algae, Cladophora, on Escherichia coli at recreational beaches in Wisconsin. Science of the Total Environment 404: 10‐17. Field, K.G. and M. Samadpour. (2007). Fecal source tracking, the indicator paradigm, and managing water quality. Water Research 41: 3517‐3538. Garrido‐Perez, M.C., E. Anfuso, A. Acevedo, and J.A. Perales‐Vargas‐Machuca. (2008). Microbial indicators of faecal contamination in waters and sediments of beach bathing zones. Int. J. Hyg. Environ. Health 211: 510‐517.
17

Ishii, S., T. Yan, D.A. Shively, M.N. Byappanahalli, R.L Whitman, and M.J. Sadowsky. (2006). Cladophora spp. Harbor human bacterial pathogens in nearshore water of Lake Michigan. Applied and Environmental Microbiology 72: 4545‐4553. Kumar, L. (2007). Development of a Rapid Method for a Human Pollution Source Tracking Marker Using Enterococcus Surface Protein (Esp) In E. Faecium A THESIS Submitted to Michigan State University, in partial fulfillment of the requirements for the degree of MASTER OF SCIENCE Department of Fisheries and Wildlife, E. Lansing MI McLellan, S.L., E.J. Hollis, M.M. Depas, M. Van Dyke, J. Harris, and C.O. Scopel. (2007). Distribution and fate of Escherichia coli in Lake Michigan following contamination with urban stormwater and combined sewer overflows. Journal of Great Lakes Research 33: 566‐580. NRDC. (2008). Testing the waters 2008: A guide to water quality at vacation beaches. Retrieved 12/1/08 from http://www.nrdc.org/water/oceans/ttw/titinx.asp Olapade, O.A., M.M. Depas, E.T. Jensen, and S.L. McLellan. (2006). Microbial communities and fecal indicator bacteria associated with Cladophora mats on beach sites along Lake Michigan shores. Applied and Environmental Microbiology 72: 1932‐1938. Santo Domingo, J.W., D.G. Bambic, T.A. Edge, and S. Wuertz. (2007). Quo vadis source tracking? Towards a strategic framework for environmental monitoring of fecal pollution. Water Research 41: 3539‐3552. Scott, T. M., T.M. Jenkins, J. Lukasik, and J.B. Rose. (2005). Potential Use of a Host Associated Molecular Marker in Enterococcus faecium as an Index of Human Fecal Pollution. Environmental Science & Technology 39(1): 283 – 287 United States EPA. (1986). Ambient Water Quality Criteria for Bacteria‐1986. EPA 440/5‐84‐002. Office of Water, Regulations and Standards Criteria and Standards Division, Washington D.C. United States EPA. (1995). Method for detection and enumeration of Clostridium perfringens in water and sediments by membrane filtration. EPA/600/R‐95/030/ Office of Research and Development, Washington D.C.
18
19
United State EPA. (2005). Method 1603: Escherichia coli (E. coli) in water by membrane filtration using modified membrane‐Thermotolerant Escherichia coli agar (modified mTEC). EPA 821‐R‐04‐025. Office of Water, Washing D.C. United States EPA. (2002). Method 1600: Enterococci in water by membrane filtration using membrane‐Enterococcus indoxyl‐b‐D‐Glucoside agar (mEI). EPA‐821‐R‐02‐022. Office of Water, Washington D.C. United States EPA. (2001a). Method 1601: Male specific (F+) and somatic coliphage in water by two‐step enrichment procedure. EPA 821‐R‐01‐030. United States EPA. (2001b). Method 1602: Male specific (F+) and somatic coliphage in water by single agar layer (SAL) procedure. EPA 821‐R‐01‐029. United States EPA. (2005). Method 1623: Cryptosporidium and Giardia in water by filtration/IMS/FA. EPA 815‐R‐05‐002. Wade, T.J., R.L. Calderon, K.P. Brenner, E. Sams, M. Beach, R. Haugland, L. Wymer, and A.P. Dufour. (2008). High sensitivity of children to swimming‐associated gastrointestinal illness: Results using a rapid assay of recreational water quality. Epidemiology 19: 375‐383. Whitman, R.L., and M.B. Never. (2003). Foreshore sand as a source of Escherichia coli in nearshore water of a Lake Michigan beach. Applied and Environmental Microbiology 69: 555‐5562.

20
Appendix 1: Indicators and their applications to assessing recreational water quality
INDICATOR DEFINITION RECREATIONAL USE STANDARD OF MICHIGAN
ADVANTAGE OF USE AS AN INDICATOR DISADVANTAGE OF USE AS AN INDICATOR
E. coli A type of coliform bacteria that naturally occurs in the human intestinal tract Many strains exist but only a few are pathogenic
A geometric mean of at least 5 samples may not exceed 130 CFU/100 ml A single sample may not exceed 300 CFU/100 ml
Used as an indicator of bacteriological quality in both drinking and recreational waters Found to have a high correlation with gastroenteritis associated with bathing in freshwater Source tracking methods have bee developed
May grow in the soil of tropical locations Found to be poorly correlation to gastroenteritis in marine waters E. coli presence does not always correlate with the presence of enteric viruses and parasites
Enterococci A gram positive, non‐spore forming member of the Streptococci bacteria Commonly found in the feces of warm blooded animals Multiple strains, many of which are not harmful
A geometric mean of at least 5 samples may not exceed 33 CFU/100 ml A single sample may not exceed 61 CFU/ 100 ml
Enterococci may die at a slower rate than fecal coliforms in water and sediments, providing more reliable indications of recent pollution Multi‐site epidemiological studies have shown that enterococci have a higher correlation with gastroenteric disease related to swimming in fresh and marine waters than fecal coliforms
Can regrow in the environment Not as well researched as E. coli
Clostridium perfringens
Obligate anaerobic gram‐positive bacteria that forms endospores and does not carry out dissimilatory sulfate reduction Found in sewage and highly impacted waters An opportunistic pathogen that produces enterotoxin
FRESHWATER STANDARDS USED IN HAWAII: A single sample may not exceed 50 CFU/100 ml
C. perfringens spores could be an index parameter for the occurrence of persistent intestinal pathogens like viruses and oocysts of protozoa Useful in such specific situations as the examination of chlorinated waters or industrial waters that may contains compounds lethal to non‐spore forming bacterial indicators, samples that cannot be processed within 12 hours and the detection of recent or long term inputs of fecal pollution.
May be too conservative an indicator which may not adequately protect human health Often found in low concentrations
Coliphage Viruses whose hosts are strains of the bacteria E. coli Found wherever fecal contamination occurs
A single sample may not exceed 100 pfu/100 ml
A good indicator of enteroviruses due to similar seasonal variation, propensity for removal and resistance to environmental stress
Coliphage is not specific to human sewage

DATE E. coli Enterococci C. perfringens Coliphage
F+amp Coliphage CN‐13
7/15/2008 27.9 18 NT NT NT 7/22/2008 414 87.3 11.3 <90 <90 7/29/2008 27 27 14 <90 <90 8/5/2008 188.1 3096.9 165 <90 <90 8/12/2008 131.4 178.2 60 <90 <90 9/6/2008 349.2 130.5 12 <150 <150 9/30/2008 15596.1 3485.7 10 360 990 Geometric 237.0 194.8 23.93 123.5 146.1
21
Appendix 2: Fecal indicator concentrations from deep/ swimmable water analysis at Caseville County Park beach (CFU or PFU / 100 mL) ppendix 2: Fecal indicator concentrations from deep/ swimmable water analysis at Caseville County
Park beach (CFU or PFU / 100 mL)
DATE DATE E. coli E. coli Enterococci Enterococci C. perfringens C. perfringens Coliphage
F+amp Coliphage F+amp
Coliphage CN‐13
Coliphage CN‐13
7/10/2008 26 8.67 <.513 <10.0 <10.0
7/15/2008 1.26* 1.75 0.6 10 10 7/22/2008 1.59* NT NT NT NT 7/29/2008 1.44* NT NT NT NT 8/5/2008 7.17* NT NT NT NT 8/12/2008 13.2* NT NT NT NT 9/30/2008 16 1.0 2.67 <10.0 100 Geometric 5.27 2.48 0.94 10 21.5 NT: Not tested * E. coli data from Huron County Health Department and represented as geometric mean of three samples
Appendix 3: Fecal indicator concentrations from shallow water analysis at Caseville County Park beach (CFU or PFU / 100 mL)
DATE E. coli Enterococci C. perfringens Coliphage
F+amp Coliphage CN‐13
7/10/2008 333.3 75.7 11.3 <10.0 30
7/15/2008 18.22 38.6 2.2 <10.0 <12.5 7/22/2008 362.38 234.83 2.0 <10.0 12.5 7/29/2008 8.48 2.0 2.4 <10.0 <10.0 8/5/2008 153 26.2 10.2 <10.0 10 8/12/2008 120.3 65.3 3.71 <10.0 <10.0 9/6/2008 137.4 149 3.5 <10.0 20 9/30/2008 1986.3 1986.3 30 <10.0 220 Geometric 132.28 71.65 5.12 <10.0 19.47
NT: Not tested
Appendix 4: Fecal indicator concentrations from sediment analysis at Caseville County Park beach (CFU or PFU /100 g wet weight)
NT: Not tested

22
Appendix 5: Fecal indicator concentrations from muck analysis at Caseville County Park beach (CFU or PFU /100 g wet weight)
NT: Not tested
Appendix 6: Physical data collected at Caseville County Park beach on sampling date
DATE
Air temp. (°C)
Water temp. (°C)
Wind speed (MPH)
Wave height (feet)
24 hour precipitation
(inches)
48 hour precipitation
(Inches)
72 hour precipitation
(inches)
Bather load
Algae on nearshore
Algae on beach
Bird count
Wind direction
7/10/2008 22.2 22.3 0 0.2 0 0 0.33 3 1 1 53 variable 7/15/2008 17.8 25.3 0 0.5 0 0 0.02 0 1 1 5 variable 7/22/2008 21.7 0 1 0.22 0.4 0.6 0 1 1 40 NE 7/29/2008 22.7 22.7 6 0 0 0 0 3 1 1 40 SSE 8/5/2008 21.7 21.7 0 0.5 0.04 0.06 0.06 0 3 2 60 NNW 8/12/2008 23.9 0 0.5 0 0.04 0.59 80 2 1 40 NW 9/6/2008 20.3 23.5 0 0.5 0.51 1.94 2.57 12 2 1 75 variable 9/30/2008 14.7 15.3 0 0.5 0.26 0.34 0.34 0 1 1 100 WNW
DATE E. coli Enterococci C. perfringens Coliphage F+amp
Coliphage CN‐13
7/29/2008 413.1 9415.8 NT <90 <908/5/2008 6930.9 17876.7 12.3 <150 <150Geometric 1692.1 12974.0 12.3 <116.2 <116.2

Appendix 7: Analysis of esp testing from Caseville County Park beach
DATE DEEP SHALLOW SEDIMENT MUCK
7/10/2008 ‐ ‐ NT NT 7/15/2008 ‐ ‐ NT NT 7/22/2008 NT ‐ NT NT 7/29/2008 NT ‐ NT ‐ 8/5/2008 NT ‐ ‐ + 8/12/2008 NT ‐ ‐ NT 9/6/2008 NT ‐ NT NT 9/30/2008 NT ‐ + NT NT: Not tested for esp Appendix 8: Human and bovine Bacteroides results as detected in the deep water at Caseville County Park beach.
DATE Volume Assayed Final Concentration Volume
Human Bacteroides Bovine Bacteroides
7/10/2008 3000 ml 2 ml ‐ ‐ 7/15/2008 3000 ml 2 ml ‐ ‐ Appendix 9: Human and bovine Bacteroides results as detected in the shallow water at Caseville County Park beach
DATE Volume Assayed Final Concentration Volume
Human Bacteroides Bovine Bacteroides
7/10/2008 3100 ml 2 ml ‐ ‐ 7/15/2008 2000 ml 2 ml ‐ ‐ 7/22/2008 2000 ml 2 ml ‐ ‐ 7/29/2008 2300 ml 2 ml ‐ ‐ 8/5/2008 2200 ml 2 ml ‐ ‐
23