INVEST MALAYSIA 2014 - Market | Bursa Malaysia Market · Global Condom Market 4 48% Institutional...
30
WORLD’S LARGEST CONDOM MANUFACTURER INVEST MALAYSIA 2014
Transcript of INVEST MALAYSIA 2014 - Market | Bursa Malaysia Market · Global Condom Market 4 48% Institutional...

WORLD’S LARGEST CONDOM MANUFACTURER
INVEST MALAYSIA 2014

THE CONDOM INDUSTRY
ABOUT KAREX
COMPETITIVE ADVANTAGES
FINANCIAL HIGHLIGHTS
FUTURE PLANS
Table of Contents
1

THE CONDOM INDUSTRY
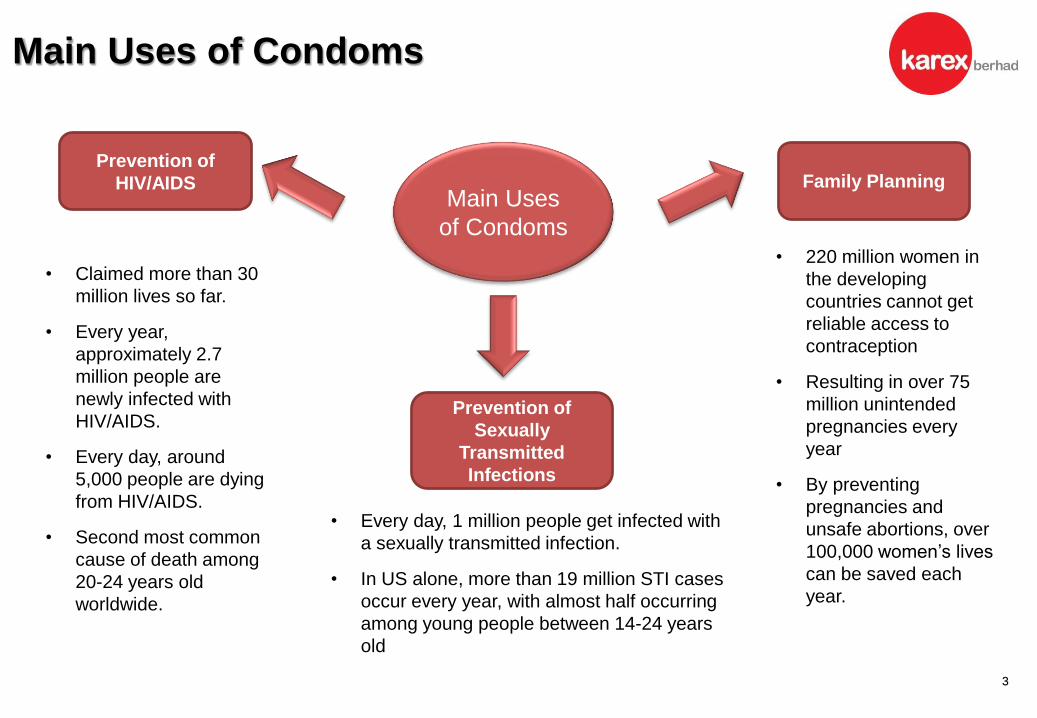
Main Uses of Condoms
Main Uses
of Condoms
Prevention of
Sexually
Transmitted
Infections
Prevention of
HIV/AIDS Family Planning
• Claimed more than 30
million lives so far.
• Every year,
approximately 2.7
million people are
newly infected with
HIV/AIDS.
• Every day, around
5,000 people are dying
from HIV/AIDS.
• Second most common
cause of death among
20-24 years old
worldwide.
• 220 million women in
the developing
countries cannot get
reliable access to
contraception
• Resulting in over 75
million unintended
pregnancies every
year
• By preventing
pregnancies and
unsafe abortions, over
100,000 women’s lives
can be saved each
year.
• Every day, 1 million people get infected with
a sexually transmitted infection.
• In US alone, more than 19 million STI cases
occur every year, with almost half occurring
among young people between 14-24 years
old
3

Global Condom Market
4
48% Institutional Buyers
• Consist of Governments,
NGOs, multilateral and
bilateral organisation.
• Condoms are provided either
free or at subsidised prices.
52% Commercial Buyers
• Comprises original brand
manufacturers and brand
owners which sell condoms to
consumers.
Source : Infobusiness Research
22.8 Billion pieces
sold in 2012

Huge Potential for Condom Usage Rates
5
In 2012, there were only 3.3 condoms for every person per year. There is ample room for growth as condom
usage rates increase further.
Global demand for condoms is expected to grow at 7.5% CAGR and reach 30.4 billion pieces in 2016.
Source : Infobusiness Research
Forecasted Growth in Condom
DemandGlobal Condom Demand

Shortage of Condoms
6
Available 15m
Need 35m
UNFPA/PSI Joint Studies on the Total Market for Male Condoms in Six African Countries (Nov 2013)
Available 100m
Need 125m
Available 11m
Need 18m
Available 14m
Need 33m
Available 31m
Need 35m
Available 480m
Need 850m
Shortage of 445 million condoms from Six African countries alone

Estimated Condoms Required in Africa
7
Mali
Swaziland
Botswana
Uganda
Lesotho
South Africa
1.1 BILLION
CONDOMS#
Whole Africa
10%
Total population - 108 million
Total Population – 1.0 billion
NEED
# Source : UNFPA/PSI Joint Study

ABOUT KAREX

Company Snapshot
9
Equity Information @ 30/05/2014
Shares Outstanding 405 million
Share Price RM 3.16
Market Cap RM 1.3 billion
Listing Board Main Market
Listing Date 6 November 2013
Net Asset Analysis @ 31/03/2014
Net Assets RM 211.6 million
Net Assets/Share RM 0.52
Net Gearing Net Cash
Major Shareholders @ 30/05/2014
Goh Family 63.31%
Condom Lubricating
Jelly
Probe
Cover
Catheter
Product Range
Hat Yai, Thailand
Port Klang, Malaysia
Pontian, Malaysia
Total
production
capacity of 4
billion pieces
of condoms
per annum
Manufacturing Facilities

Principal Operating Markets
10
Manufacture for some of the world’s famous condom brands.
Tender to institutional buyers to manufacture condoms for NGOs
and government agencies.
Manufacture condoms under own brands, Carex and INNO.
Distributed in UAE, South Africa, India, Nigeria and Bangladesh.
Commercial Market, 53%*
Tender Market, 43%* Own Brand Manufacturing Market, 4%*
Top 3 in Brazil Top 5 in USA No 1 in Australia
No. 2 in US# Based on 9M FYE2014
53%*
43%*4%*

COMPETITIVE ADVANTAGES

World Largest
12
Source : Infobusiness Research (Independent Market Researcher)
No. Name of Company Location Estimated Annual
Manufacturing
Capacity (pieces)
1 Karex Malaysia & Thailand 4.0 billion
2 Thai Nippon Rubber Industry Co.Ltd Thailand 2.0 billion
3 TTK-LIG Ltd India 1.5 billion - 2.0 billion
4 HLL Lifecare Ltd. India 1.6 billion
5 Suretex Ltd. (part of Ansell Ltd) Thailand 1.2 billion
6 Qingdao London Durex Co Ltd. (Part of Reckitt Benkiser PLC) China 1.0 billion
7 Guilin Latex Factory China 0.95 billion
8 Unidus Corp. (South Korean company) China and Korea 0.92 billion
9 Guangzhou Guangxiang Enterprises Group Co.Ltd. Doubleon Latex Factory China 0.75 billion
10 Pleasure Latex Products Sdn Bhd Malaysia 0.70 billion
Total 14.1 billion
Estimated annual manufacturing capacities of other condom manufacturers
With production capacity of 4 billion, Karex is the world’s largest condom manufacturer

Economies of Scale
13
Enjoy lower average cost per unit
Ability to deliver large tenders in a short period of time
Flexibility to offer various types of condoms

Licensed to Export to >110 Countries
14
Condoms are a highly-regulated medical device
Karex has the necessary licenses, certifications and accreditations to export to >110 countries across
Africa, Asia, America and Europe
Every region has its own regulatory bodies to
monitor and approve medical device standards
KEY LICENSES AND ACCREDITATIONS
ISO 9001:2000 US FDA 510k
ISO 13485:2003 NF Mark (France)
ISO 17025:2006 CCC mark (China)
CE Mark (Europe) BSI Kitemark (UK)
SABS Mark (South Africa) CMDCAS (Canada)
Wide global geographical coverage – attractive to
commercial customers
o With these key licenses, Karex is readily able to
supply to different geographical regions all across the
world and provide its customers with flexibility to
enter new markets.
o This gives Karex a competitive advantage over other
players.
o In addition, this creates a high barrier of entry for new
entrants into the condom manufacturing industry.

We Build Our Own Machines
15
Dipping Machine Foiling MachineElectronic Testing Machine
Machine Development
Capability to design, develop and re-engineer and customize machines
Dipping, electronic testing and foiling machines are developed in-house

Strong In-House R&D Capabilities
16
New Condom Colours, Flavours & Textures
Glow in the dark
Duo and tri-coloured
Tattoo Metallic
(gold, silver)
Super-studdedWorld Cup -
Brazilian Flag
FINANCIAL HIGHLIGHTS
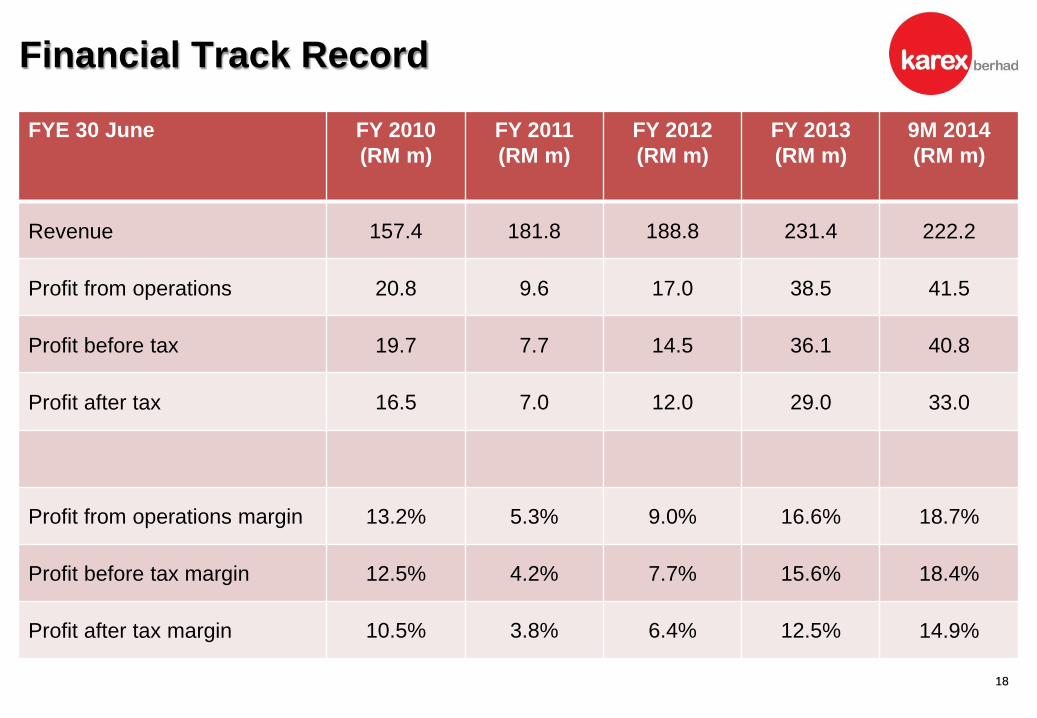
Financial Track Record
18
FYE 30 June FY 2010
(RM m)
FY 2011
(RM m)
FY 2012
(RM m)
FY 2013
(RM m)
9M 2014
(RM m)
Revenue 157.4 181.8 188.8 231.4 222.2
Profit from operations 20.8 9.6 17.0 38.5 41.5
Profit before tax 19.7 7.7 14.5 36.1 40.8
Profit after tax 16.5 7.0 12.0 29.0 33.0
Profit from operations margin 13.2% 5.3% 9.0% 16.6% 18.7%
Profit before tax margin 12.5% 4.2% 7.7% 15.6% 18.4%
Profit after tax margin 10.5% 3.8% 6.4% 12.5% 14.9%

9M2014 vs 9M2013
19
9 MONTHS ENDED Variance
31.03.2014
(RM m)
31.03.2013
(RM m)
Revenue 222.2 168.4 32.0%
Profit from operations 41.5 26.8 54.9%
Profit before tax 40.8 25.0 63.2%
Profit after tax 33.0 20.0 65.0%
Profit from operations margin 18.7% 16.0%
Profit before tax margin 18.4% 14.8%
Profit after tax margin 14.9% 11.9%
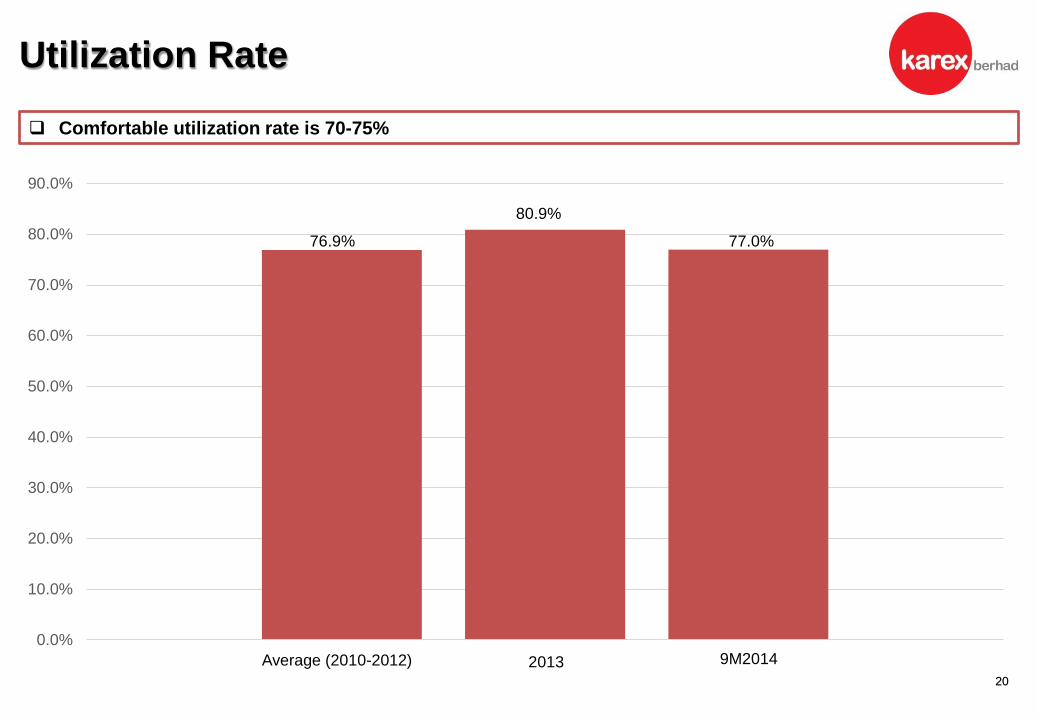
Utilization Rate
20
0.0%
10.0%
20.0%
30.0%
40.0%
50.0%
60.0%
70.0%
80.0%
90.0%
Comfortable utilization rate is 70-75%
Average (2010-2012) 2013 9M2014
80.9%
76.9% 77.0%
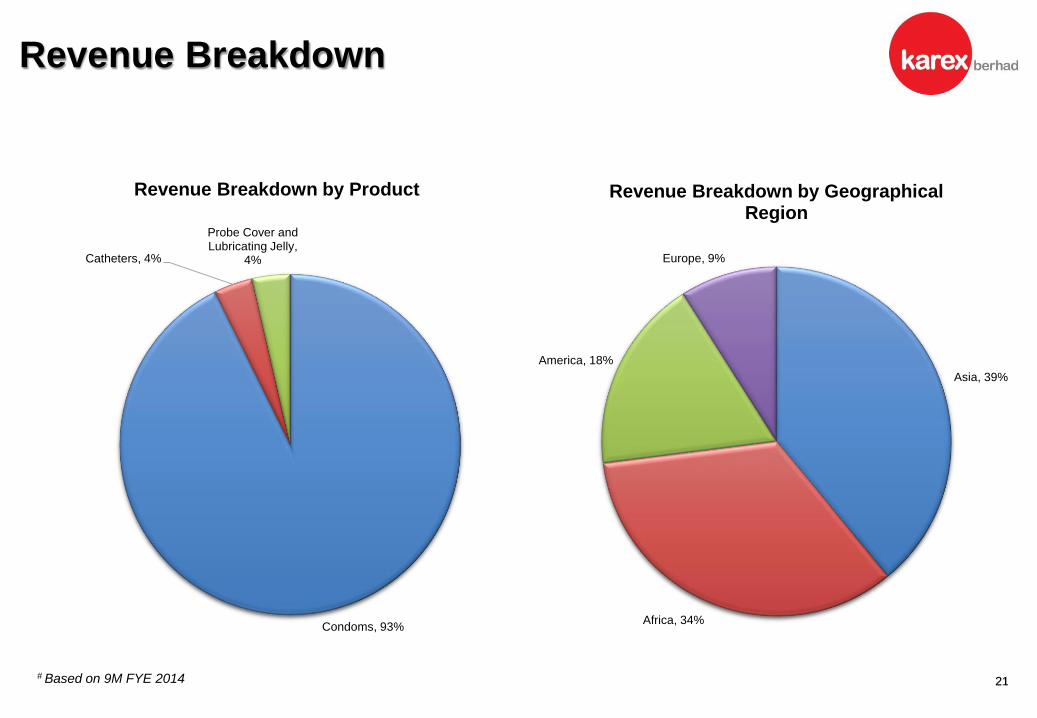
Revenue Breakdown
21
Condoms, 93%
Catheters, 4%
Probe Cover and Lubricating Jelly,
4%
Revenue Breakdown by Product
Asia, 39%
Africa, 34%
America, 18%
Europe, 9%
Revenue Breakdown by Geographical Region
# Based on 9M FYE 2014
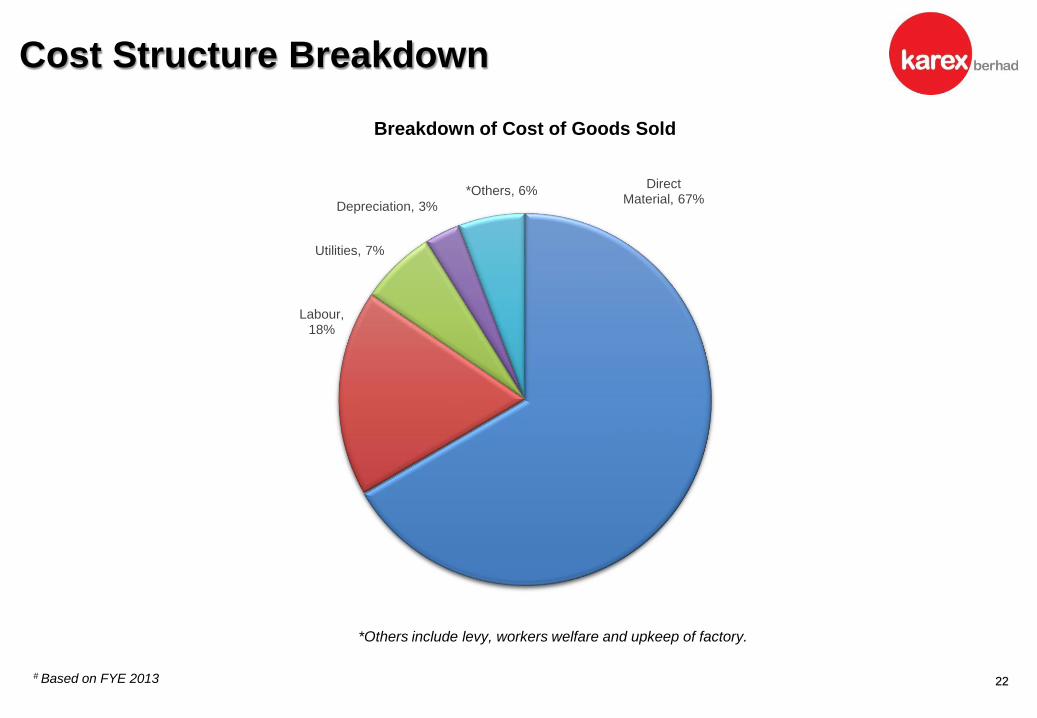
Cost Structure Breakdown
22
Direct Material, 67%
Labour, 18%
Utilities, 7%
Depreciation, 3%
*Others, 6%
Breakdown of Cost of Goods Sold
*Others include levy, workers welfare and upkeep of factory.
# Based on FYE 2013

Cost Structure Breakdown
23
Latex, 43%
Foil, 19%
Innerbox, 9%
Silicone Oil, 7%
*Others, 22%
Breakdown of Direct Material
*Others include ammonia, corn starch, magnesium carbonate, silicone emulsion, flavouring and colour pigments
# Based on FYE 2013

FUTURE PLANS

Expansion of Production Capacity
25
Schedule of expansion By April 2015
(billion pieces)
By April 2016
(billion pieces)
Installed capacity 5.0 6 .0
No Plant Location
At IPO
Installed Capacity
(billion pieces)
At 30 May 2014
Installed Capacity
(billion pieces)
Enlarged Capacity
(billion pieces)
1 Pontian, Johor 2.0 2.0 4.0
2 Klang, Selangor 0.3 0.8 0.8
3 Hat Yai, Thailand 0.7 1.2 1.2
Group Total 3.0 4.0 6.0

Artist Impression of New Plant
26
Aerial View Front View
Canteen Office Building

27
Green Building Index (GBI)
A Green building focuses on increasing the efficiency of resource use – energy, water, and materials – while reducing
building impact on human health and the environment during the building’s lifecycle, through better siting, design,
construction, operation, maintenance, and removal.
LEED is a set of rating systems for the design,
construction, operation, and maintenance of green
buildings, homes and neighbourhoods.
Developed by the U.S. Green Building
Council (USGBC), LEED is intended to help
building owners and operators be environmentally
responsible and use resources efficiently.
Leadership in Energy and Environmental Design (LEED)
Environmental Sensitive Alternative Major
Tender Customers
Green Building
Support For Companies Who Go Green
28
“Wal-Mart said supplier participation in its effort to reduce greenhouse gas emissions would not be mandatory. But
the giant retailer — with sales of more than $400 billion last year — made it clear that it was interested in doing
business only with suppliers that share its goals.”
UN Informal Interagency Task Team for Sustainable Procurement in the Health Sector (the IIATT-SPHS) wants
to shape best practices for reducing carbon footprints and integrating environmental criteria in procurement practices.
Furthermore, it wants to collaborate with external partners in order to apply lists of hazardous chemicals and potential
substitutions by incorporating environmental criteria into technical products specifications for suppliers.
Note : (the IIATT-SPHS) convenes five UN agencies – UNICEF,UNDP,UNOPS,UNFPA and WHO

THANK YOU