University of Delaware Graduate College | Graduate College ...
Modeling of Surfzone Bubbles Using a Multiphase VOF Model
Fengyan Shi1, James T. Kirby1, Merrick Haller2, and Patricio Catalan2
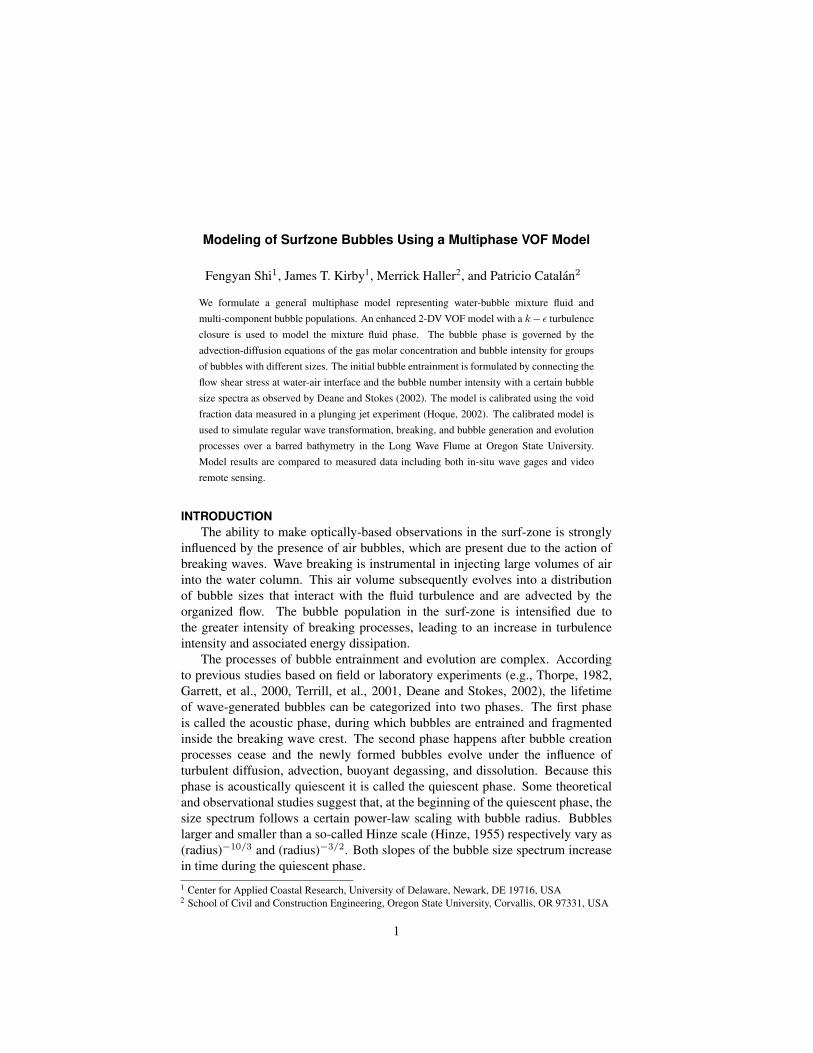
We formulate a general multiphase model representing water-bubble mixture fluid andmulti-component bubble populations. An enhanced 2-DV VOF model with a k− ε turbulenceclosure is used to model the mixture fluid phase. The bubble phase is governed by theadvection-diffusion equations of the gas molar concentration and bubble intensity for groupsof bubbles with different sizes. The initial bubble entrainment is formulated by connecting theflow shear stress at water-air interface and the bubble number intensity with a certain bubblesize spectra as observed by Deane and Stokes (2002). The model is calibrated using the voidfraction data measured in a plunging jet experiment (Hoque, 2002). The calibrated model isused to simulate regular wave transformation, breaking, and bubble generation and evolutionprocesses over a barred bathymetry in the Long Wave Flume at Oregon State University.Model results are compared to measured data including both in-situ wave gages and videoremote sensing.
INTRODUCTIONThe ability to make optically-based observations in the surf-zone is strongly
influenced by the presence of air bubbles, which are present due to the action ofbreaking waves. Wave breaking is instrumental in injecting large volumes of airinto the water column. This air volume subsequently evolves into a distributionof bubble sizes that interact with the fluid turbulence and are advected by theorganized flow. The bubble population in the surf-zone is intensified due tothe greater intensity of breaking processes, leading to an increase in turbulenceintensity and associated energy dissipation.
The processes of bubble entrainment and evolution are complex. Accordingto previous studies based on field or laboratory experiments (e.g., Thorpe, 1982,Garrett, et al., 2000, Terrill, et al., 2001, Deane and Stokes, 2002), the lifetimeof wave-generated bubbles can be categorized into two phases. The first phaseis called the acoustic phase, during which bubbles are entrained and fragmentedinside the breaking wave crest. The second phase happens after bubble creationprocesses cease and the newly formed bubbles evolve under the influence ofturbulent diffusion, advection, buoyant degassing, and dissolution. Because thisphase is acoustically quiescent it is called the quiescent phase. Some theoreticaland observational studies suggest that, at the beginning of the quiescent phase, thesize spectrum follows a certain power-law scaling with bubble radius. Bubbleslarger and smaller than a so-called Hinze scale (Hinze, 1955) respectively vary as(radius)−10/3 and (radius)−3/2. Both slopes of the bubble size spectrum increasein time during the quiescent phase.1 Center for Applied Coastal Research, University of Delaware, Newark, DE 19716, USA2 School of Civil and Construction Engineering, Oregon State University, Corvallis, OR 97331, USA
1
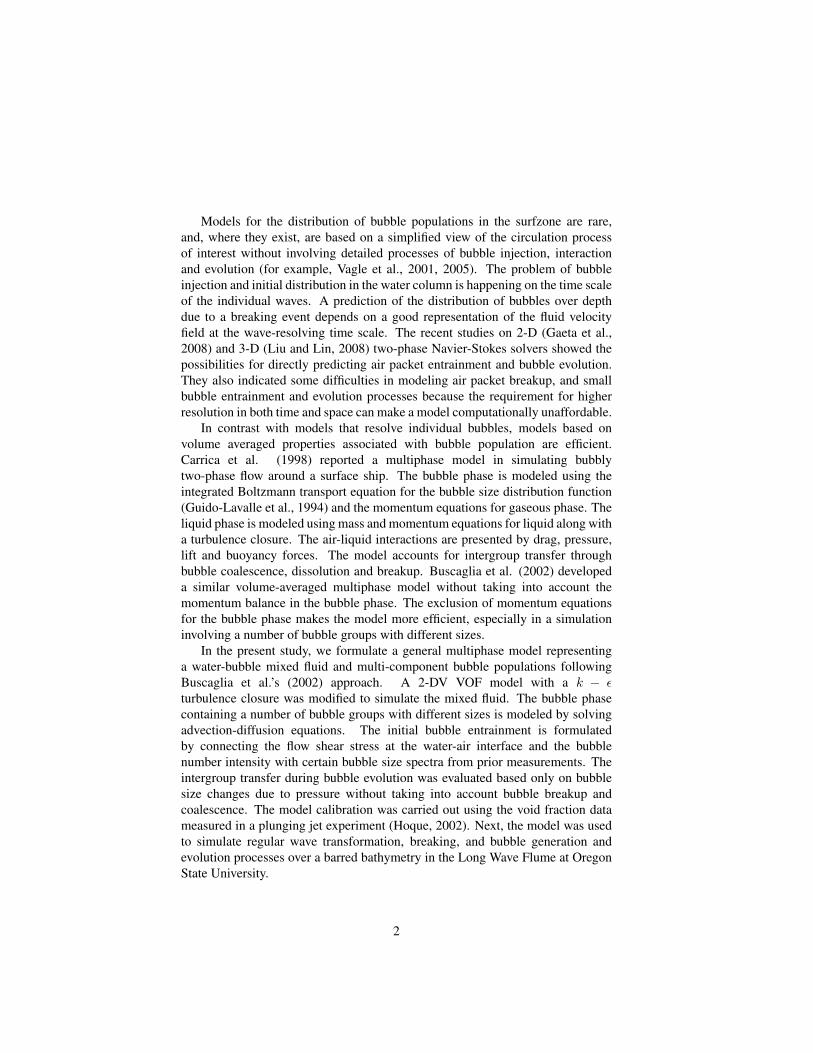
Models for the distribution of bubble populations in the surfzone are rare,and, where they exist, are based on a simplified view of the circulation processof interest without involving detailed processes of bubble injection, interactionand evolution (for example, Vagle et al., 2001, 2005). The problem of bubbleinjection and initial distribution in the water column is happening on the time scaleof the individual waves. A prediction of the distribution of bubbles over depthdue to a breaking event depends on a good representation of the fluid velocityfield at the wave-resolving time scale. The recent studies on 2-D (Gaeta et al.,2008) and 3-D (Liu and Lin, 2008) two-phase Navier-Stokes solvers showed thepossibilities for directly predicting air packet entrainment and bubble evolution.They also indicated some difficulties in modeling air packet breakup, and smallbubble entrainment and evolution processes because the requirement for higherresolution in both time and space can make a model computationally unaffordable.
In contrast with models that resolve individual bubbles, models based onvolume averaged properties associated with bubble population are efficient.Carrica et al. (1998) reported a multiphase model in simulating bubblytwo-phase flow around a surface ship. The bubble phase is modeled using theintegrated Boltzmann transport equation for the bubble size distribution function(Guido-Lavalle et al., 1994) and the momentum equations for gaseous phase. Theliquid phase is modeled using mass and momentum equations for liquid along witha turbulence closure. The air-liquid interactions are presented by drag, pressure,lift and buoyancy forces. The model accounts for intergroup transfer throughbubble coalescence, dissolution and breakup. Buscaglia et al. (2002) developeda similar volume-averaged multiphase model without taking into account themomentum balance in the bubble phase. The exclusion of momentum equationsfor the bubble phase makes the model more efficient, especially in a simulationinvolving a number of bubble groups with different sizes.
In the present study, we formulate a general multiphase model representinga water-bubble mixed fluid and multi-component bubble populations followingBuscaglia et al.’s (2002) approach. A 2-DV VOF model with a k − εturbulence closure was modified to simulate the mixed fluid. The bubble phasecontaining a number of bubble groups with different sizes is modeled by solvingadvection-diffusion equations. The initial bubble entrainment is formulatedby connecting the flow shear stress at the water-air interface and the bubblenumber intensity with certain bubble size spectra from prior measurements. Theintergroup transfer during bubble evolution was evaluated based only on bubblesize changes due to pressure without taking into account bubble breakup andcoalescence. The model calibration was carried out using the void fraction datameasured in a plunging jet experiment (Hoque, 2002). Next, the model was usedto simulate regular wave transformation, breaking, and bubble generation andevolution processes over a barred bathymetry in the Long Wave Flume at OregonState University.
2
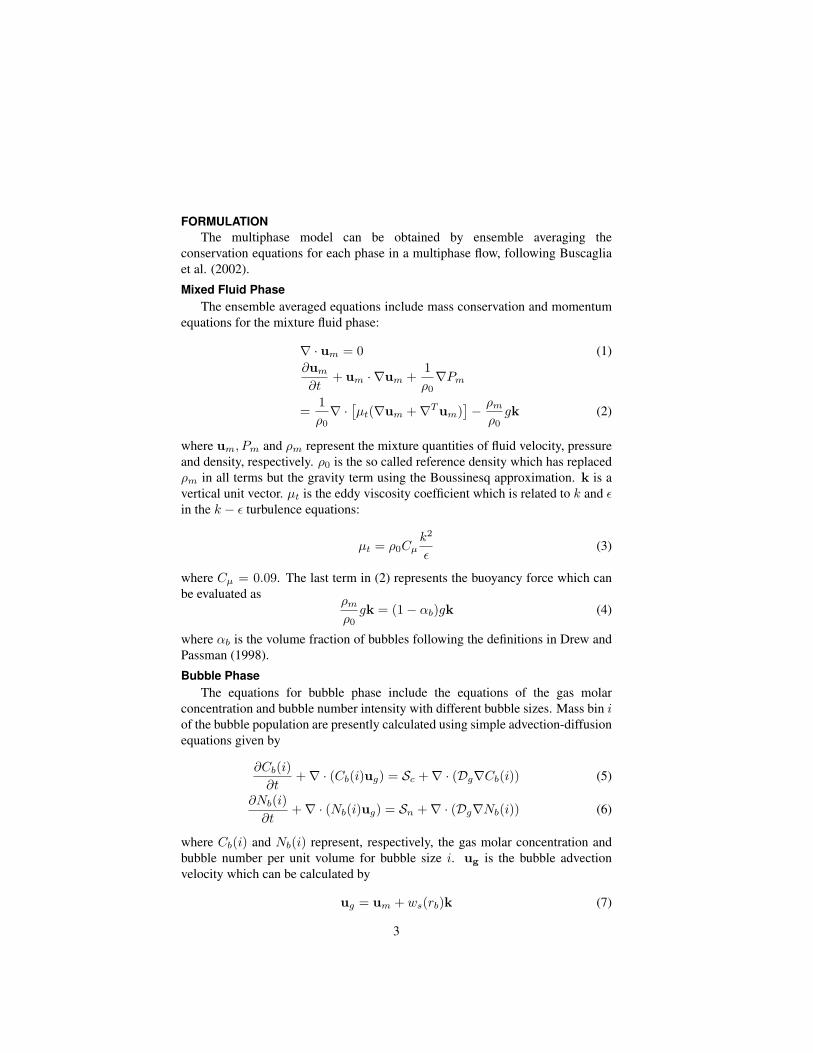
FORMULATIONThe multiphase model can be obtained by ensemble averaging the
conservation equations for each phase in a multiphase flow, following Buscagliaet al. (2002).
Mixed Fluid PhaseThe ensemble averaged equations include mass conservation and momentum
equations for the mixture fluid phase:
∇ · um = 0 (1)∂um∂t
+ um · ∇um +1ρ0∇Pm
=1ρ0∇ ·[µt(∇um +∇Tum)
]− ρmρ0gk (2)
where um, Pm and ρm represent the mixture quantities of fluid velocity, pressureand density, respectively. ρ0 is the so called reference density which has replacedρm in all terms but the gravity term using the Boussinesq approximation. k is avertical unit vector. µt is the eddy viscosity coefficient which is related to k and εin the k − ε turbulence equations:
µt = ρ0Cµk2
ε(3)
where Cµ = 0.09. The last term in (2) represents the buoyancy force which canbe evaluated as
ρmρ0gk = (1− αb)gk (4)
where αb is the volume fraction of bubbles following the definitions in Drew andPassman (1998).
Bubble PhaseThe equations for bubble phase include the equations of the gas molar
concentration and bubble number intensity with different bubble sizes. Mass bin iof the bubble population are presently calculated using simple advection-diffusionequations given by
∂Cb(i)∂t
+∇ · (Cb(i)ug) = Sc +∇ · (Dg∇Cb(i)) (5)
∂Nb(i)∂t
+∇ · (Nb(i)ug) = Sn +∇ · (Dg∇Nb(i)) (6)
where Cb(i) and Nb(i) represent, respectively, the gas molar concentration andbubble number per unit volume for bubble size i. ug is the bubble advectionvelocity which can be calculated by
ug = um + ws(rb)k (7)
3
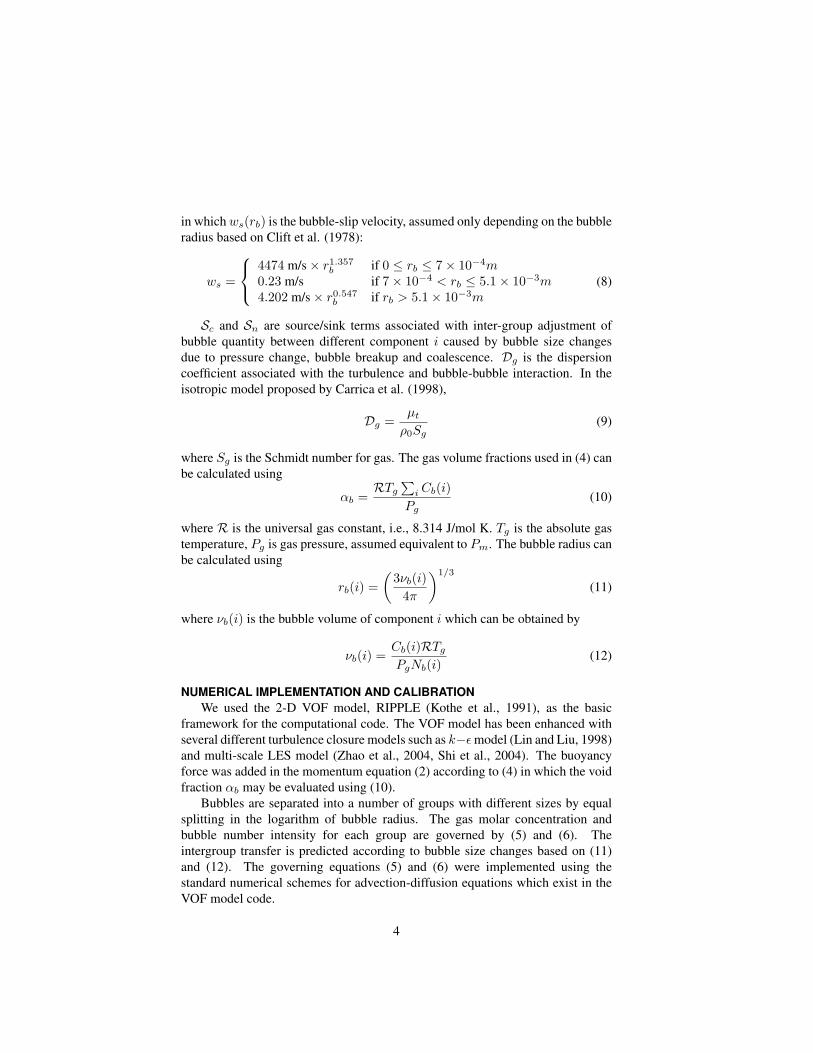
in whichws(rb) is the bubble-slip velocity, assumed only depending on the bubbleradius based on Clift et al. (1978):
ws =
4474 m/s× r1.357b if 0 ≤ rb ≤ 7× 10⁻⁴m0.23 m/s if 7× 10⁻⁴ < rb ≤ 5.1× 10⁻³m4.202 m/s× r0.547b if rb > 5.1× 10⁻³m
(8)
Sc and Sn are source/sink terms associated with inter-group adjustment ofbubble quantity between different component i caused by bubble size changesdue to pressure change, bubble breakup and coalescence. Dg is the dispersioncoefficient associated with the turbulence and bubble-bubble interaction. In theisotropic model proposed by Carrica et al. (1998),
Dg =µtρ0Sg
(9)
where Sg is the Schmidt number for gas. The gas volume fractions used in (4) canbe calculated using
αb =RTg
∑i Cb(i)
Pg(10)
where R is the universal gas constant, i.e., 8.314 J/mol K. Tg is the absolute gastemperature, Pg is gas pressure, assumed equivalent to Pm. The bubble radius canbe calculated using
rb(i) =(
3νb(i)4π
)1/3
(11)
where νb(i) is the bubble volume of component i which can be obtained by
νb(i) =Cb(i)RTgPgNb(i)
(12)
NUMERICAL IMPLEMENTATION AND CALIBRATIONWe used the 2-D VOF model, RIPPLE (Kothe et al., 1991), as the basic
framework for the computational code. The VOF model has been enhanced withseveral different turbulence closure models such as k−εmodel (Lin and Liu, 1998)and multi-scale LES model (Zhao et al., 2004, Shi et al., 2004). The buoyancyforce was added in the momentum equation (2) according to (4) in which the voidfraction αb may be evaluated using (10).
Bubbles are separated into a number of groups with different sizes by equalsplitting in the logarithm of bubble radius. The gas molar concentration andbubble number intensity for each group are governed by (5) and (6). Theintergroup transfer is predicted according to bubble size changes based on (11)and (12). The governing equations (5) and (6) were implemented using thestandard numerical schemes for advection-diffusion equations which exist in theVOF model code.
4
The initial bubble entrainment is formulated by connecting the productionof flow shear stress at water-air interface and the bubble number intensity withcertain bubble size spectra observed by Deane and Stokes (2002) and others. Theincrement of initial bubble number intensity can be written as
dN(i) = abνT(∇um +∇Tum
)r(i)αdrdt (13)
where α represents the slope of initial bubble size distribution, particularly in thisstudy, α = −3/2 if rb ≤ 1 mm and α = −10/3 if rb > 1 mm. ab is a constant.For given rb(i), Nb(i) and Pg , the initial molar concentration associated withbubble entrainment is calculated using (11) and (12). During the bubble evolutionprocess, (12) is used again to get the bubble size change due to pressure changes.Temperature Tg is kept constant during the whole process. The constant ab in (13)is determined using the void fraction data measured in a plunging jet experiment(Hoque, 2002).
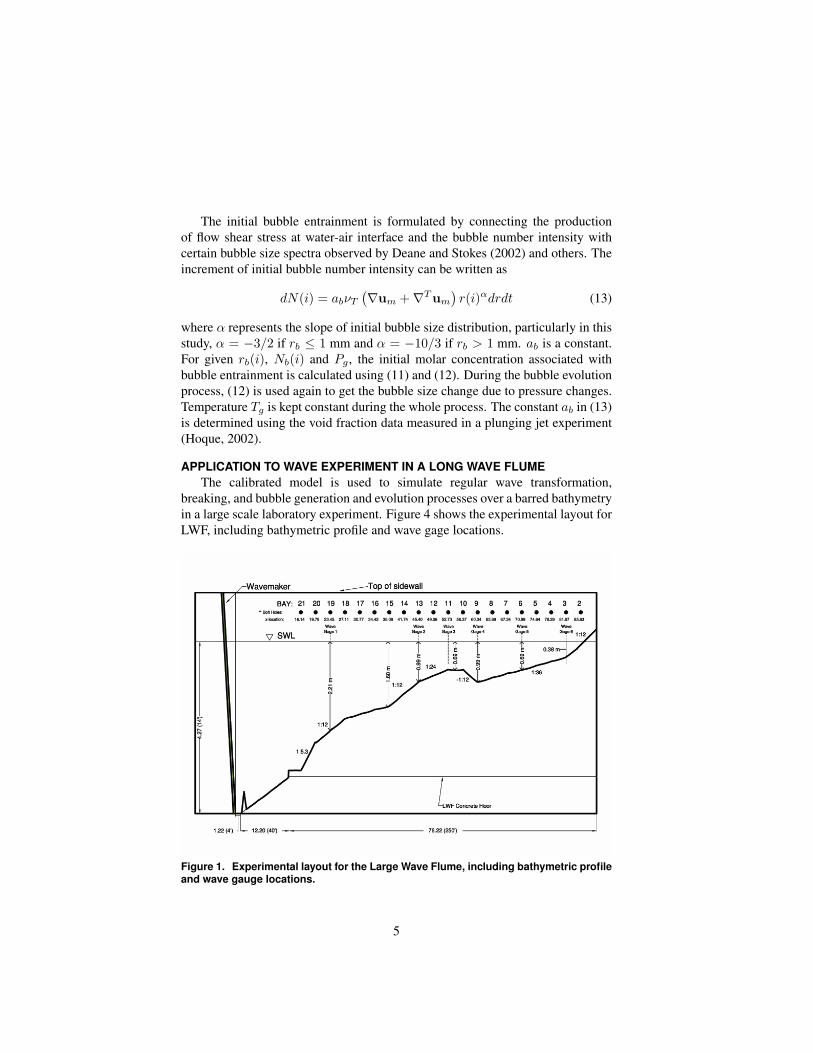
APPLICATION TO WAVE EXPERIMENT IN A LONG WAVE FLUMEThe calibrated model is used to simulate regular wave transformation,
breaking, and bubble generation and evolution processes over a barred bathymetryin a large scale laboratory experiment. Figure 4 shows the experimental layout forLWF, including bathymetric profile and wave gage locations.
Figure 1. Experimental layout for the Large Wave Flume, including bathymetric profileand wave gauge locations.
5
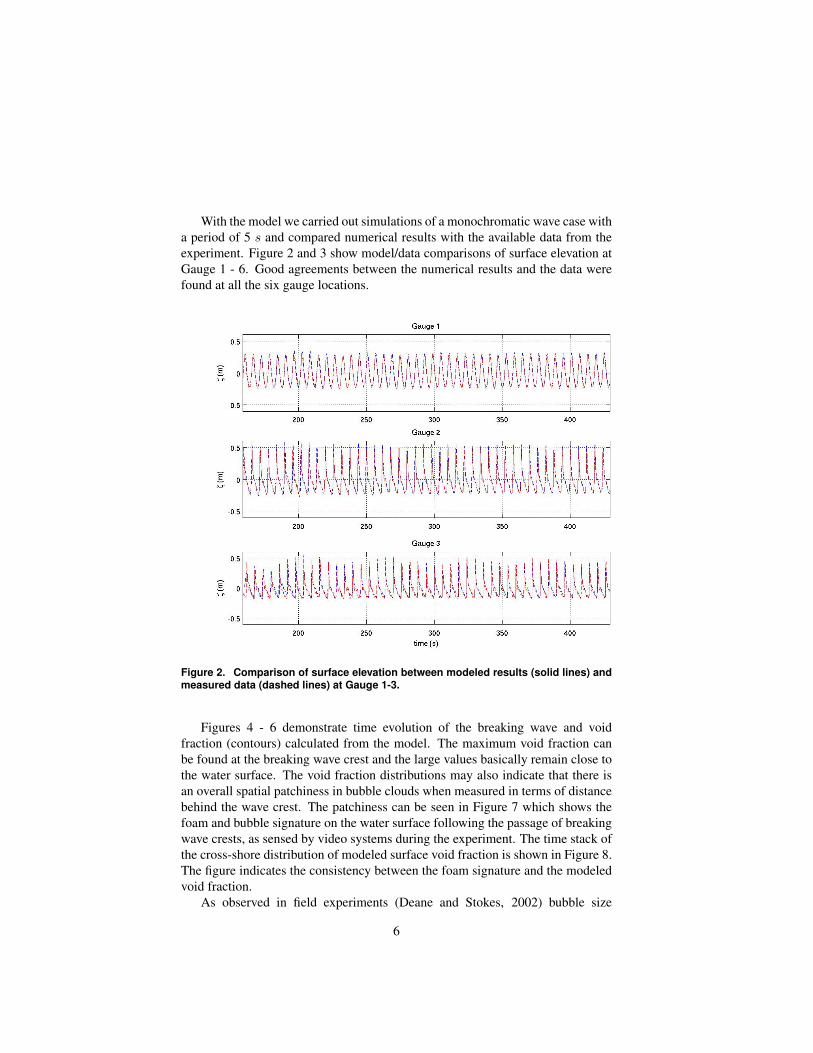
With the model we carried out simulations of a monochromatic wave case witha period of 5 s and compared numerical results with the available data from theexperiment. Figure 2 and 3 show model/data comparisons of surface elevation atGauge 1 - 6. Good agreements between the numerical results and the data werefound at all the six gauge locations.
Figure 2. Comparison of surface elevation between modeled results (solid lines) andmeasured data (dashed lines) at Gauge 1-3.
Figures 4 - 6 demonstrate time evolution of the breaking wave and voidfraction (contours) calculated from the model. The maximum void fraction canbe found at the breaking wave crest and the large values basically remain close tothe water surface. The void fraction distributions may also indicate that there isan overall spatial patchiness in bubble clouds when measured in terms of distancebehind the wave crest. The patchiness can be seen in Figure 7 which shows thefoam and bubble signature on the water surface following the passage of breakingwave crests, as sensed by video systems during the experiment. The time stack ofthe cross-shore distribution of modeled surface void fraction is shown in Figure 8.The figure indicates the consistency between the foam signature and the modeledvoid fraction.
As observed in field experiments (Deane and Stokes, 2002) bubble size
6
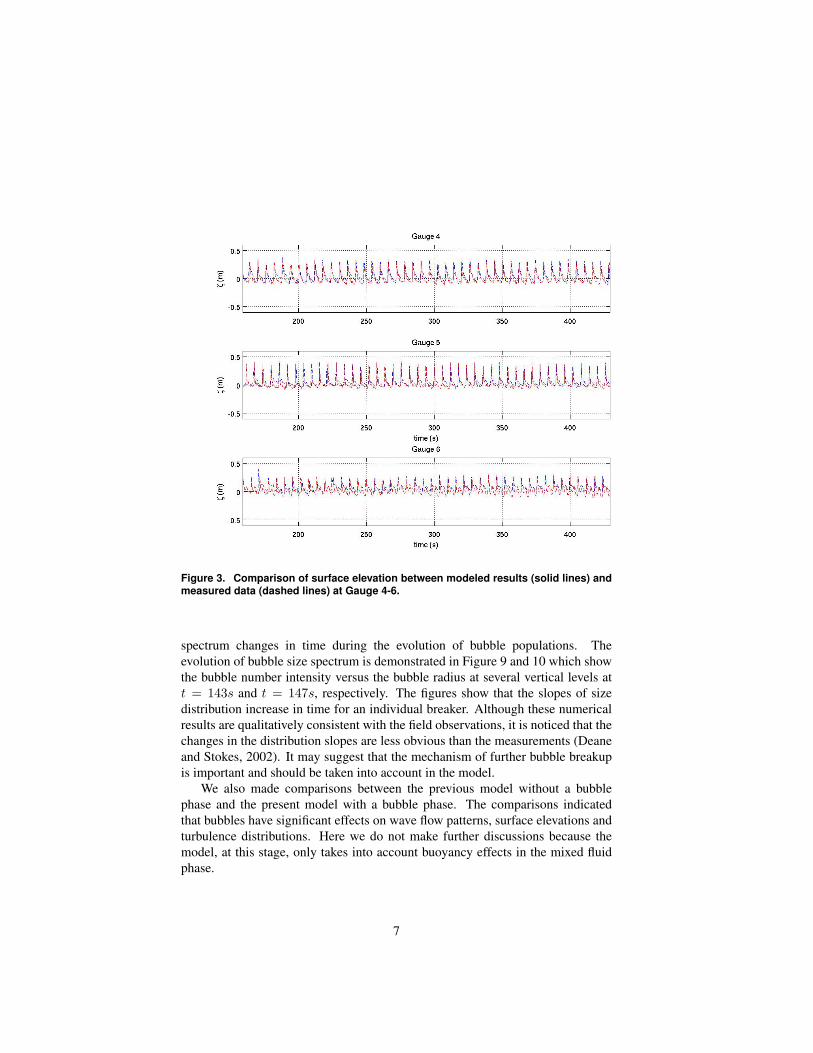
Figure 3. Comparison of surface elevation between modeled results (solid lines) andmeasured data (dashed lines) at Gauge 4-6.
spectrum changes in time during the evolution of bubble populations. Theevolution of bubble size spectrum is demonstrated in Figure 9 and 10 which showthe bubble number intensity versus the bubble radius at several vertical levels att = 143s and t = 147s, respectively. The figures show that the slopes of sizedistribution increase in time for an individual breaker. Although these numericalresults are qualitatively consistent with the field observations, it is noticed that thechanges in the distribution slopes are less obvious than the measurements (Deaneand Stokes, 2002). It may suggest that the mechanism of further bubble breakupis important and should be taken into account in the model.
We also made comparisons between the previous model without a bubblephase and the present model with a bubble phase. The comparisons indicatedthat bubbles have significant effects on wave flow patterns, surface elevations andturbulence distributions. Here we do not make further discussions because themodel, at this stage, only takes into account buoyancy effects in the mixed fluidphase.
7
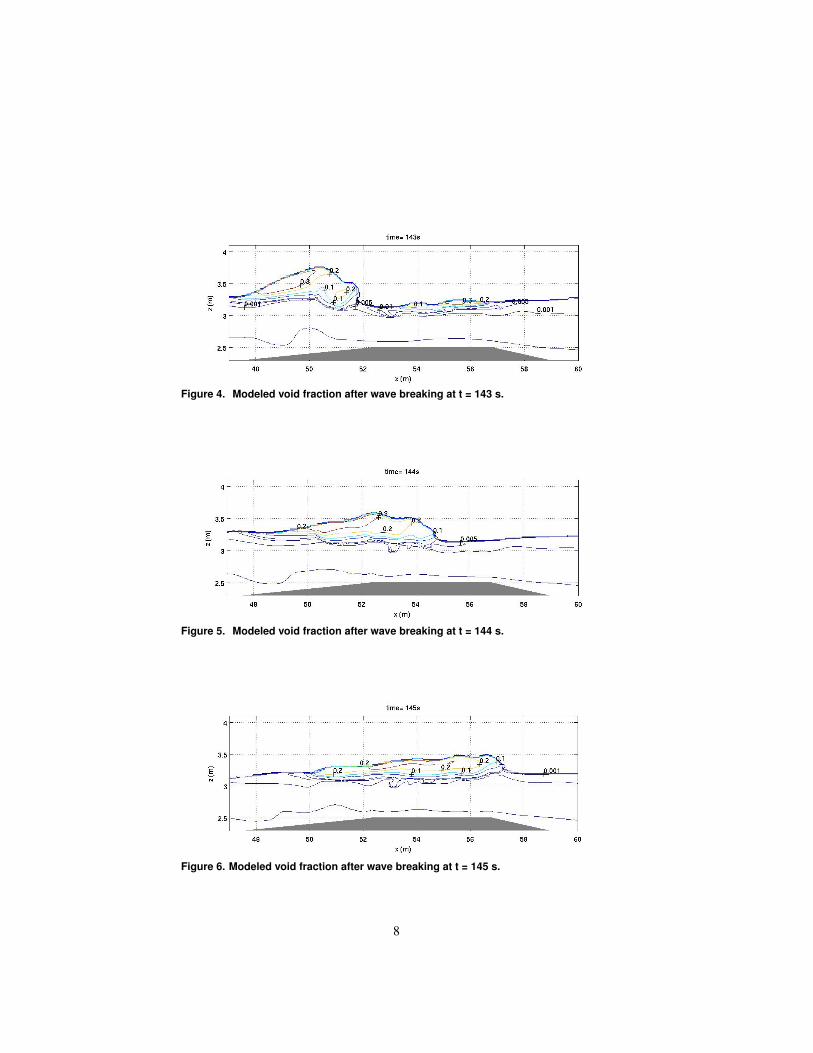
Figure 4. Modeled void fraction after wave breaking at t = 143 s.
Figure 5. Modeled void fraction after wave breaking at t = 144 s.
Figure 6. Modeled void fraction after wave breaking at t = 145 s.
8
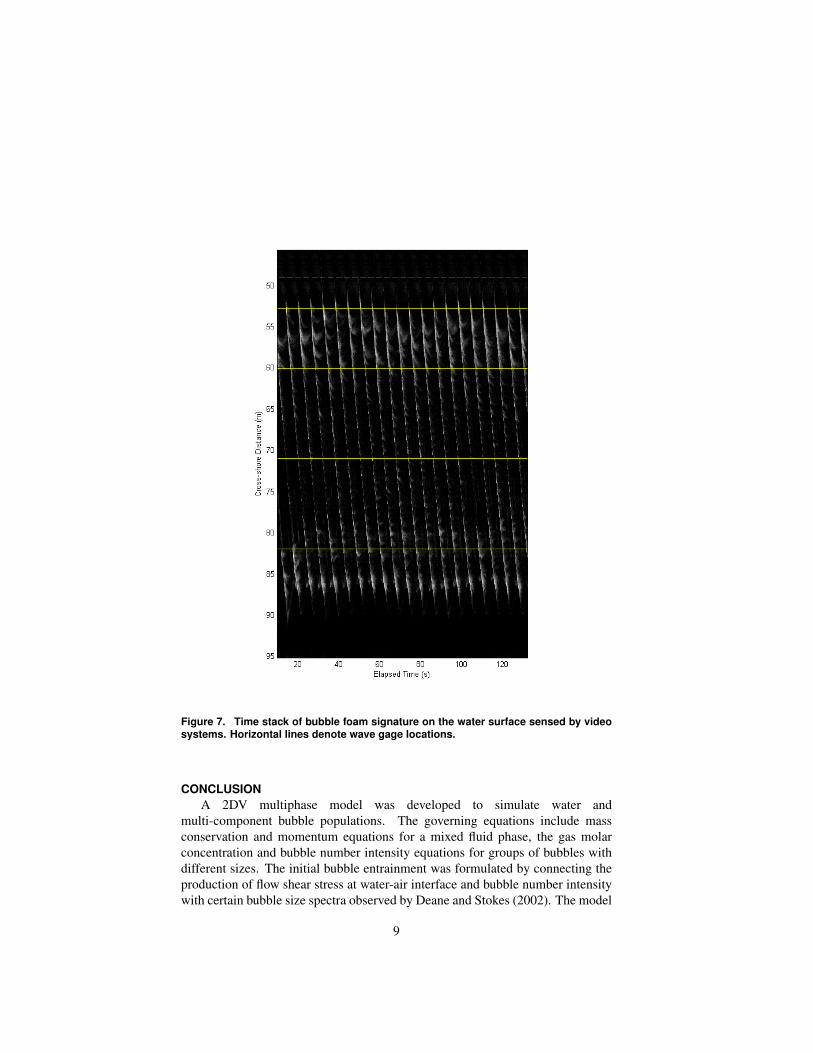
Figure 7. Time stack of bubble foam signature on the water surface sensed by videosystems. Horizontal lines denote wave gage locations.
CONCLUSIONA 2DV multiphase model was developed to simulate water and
multi-component bubble populations. The governing equations include massconservation and momentum equations for a mixed fluid phase, the gas molarconcentration and bubble number intensity equations for groups of bubbles withdifferent sizes. The initial bubble entrainment was formulated by connecting theproduction of flow shear stress at water-air interface and bubble number intensitywith certain bubble size spectra observed by Deane and Stokes (2002). The model
9
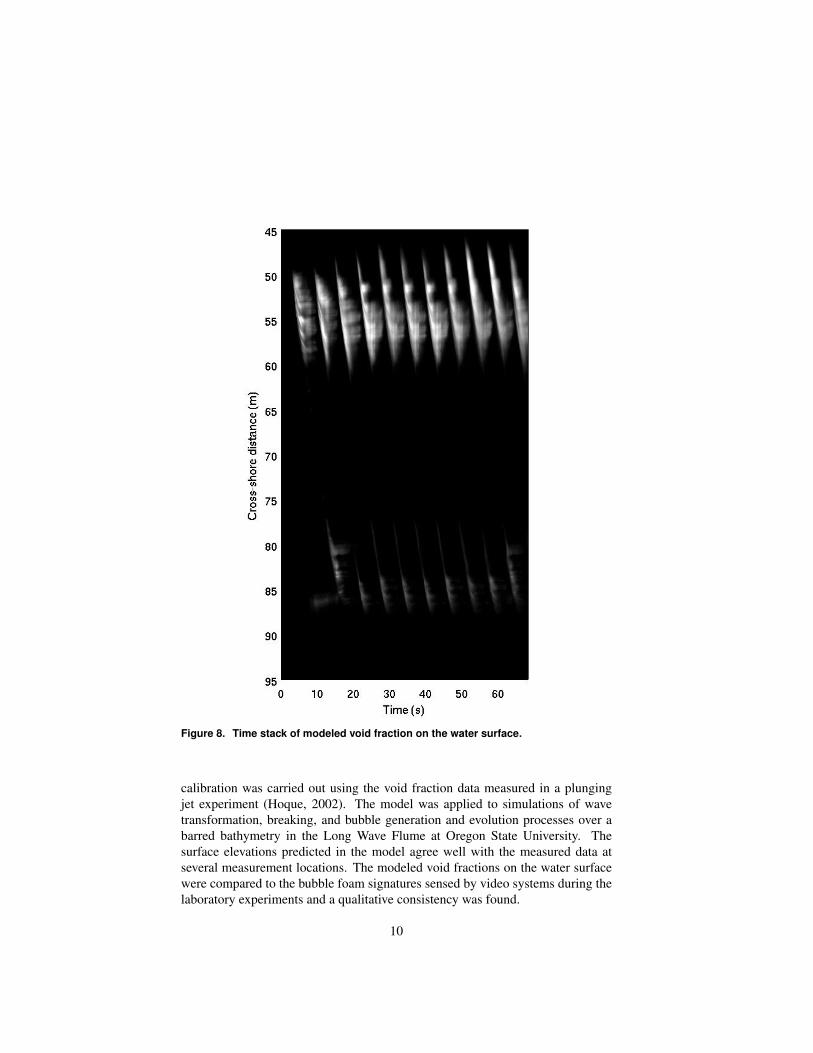
Figure 8. Time stack of modeled void fraction on the water surface.
calibration was carried out using the void fraction data measured in a plungingjet experiment (Hoque, 2002). The model was applied to simulations of wavetransformation, breaking, and bubble generation and evolution processes over abarred bathymetry in the Long Wave Flume at Oregon State University. Thesurface elevations predicted in the model agree well with the measured data atseveral measurement locations. The modeled void fractions on the water surfacewere compared to the bubble foam signatures sensed by video systems during thelaboratory experiments and a qualitative consistency was found.
10
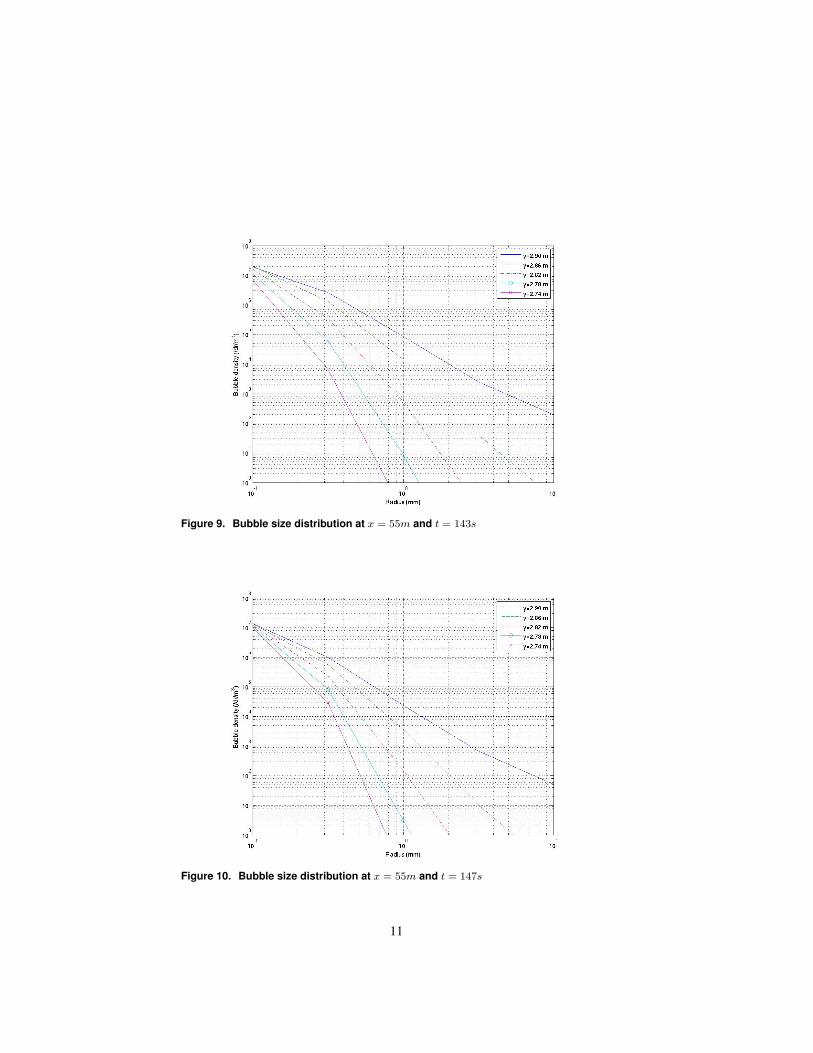
Figure 9. Bubble size distribution at x = 55m and t = 143s
Figure 10. Bubble size distribution at x = 55m and t = 147s
11
The model may not predict detailed bubble entrainment and fragmentationprocesses in the acoustic phase. The interactions between the liquid phase andbubble phase, turbulence and bubbles are not very well addressed in the model. Amore complete development will be reported on in the near future, in conjunctionwith more comprehensive implementations of wave coalescence, dissolution,further breakup and turbulence and bubble interaction.
ACKNOWLEDGMENTSThis study was supported by Office of Naval Research, Coastal Geoscience
Program under grant N00014-07-1-0582. M. Haller and P. Catalan were supportedunder grant number N00014-02-1-0147.
REFERENCES
Buscaglia G. C., Bombardelli F. A., and Garcia M H., 2002, Numericalmodeling of large-scale bubble plumes accounting for mass transfer effects,International Journal of Multiphase Flow, 28, 1763-1785
Carrica P. M., Bonetto F., Drew D. A., Lahey R. T. Jr, 1998, The interaction ofbackground ocean air bubbles with a surface ship, Int. J. Numer. Meth.Fluids, 28, 571-600.
Clift, R., Grace, J., Weber, M., 1978, Bubbles, Drops and Particles, AcademicPress.
Deane, G. B. and Stokes, M. D., 2002, Scale dependence of bubble creationmechanisms in breaking waves, Nature 418, pp. 839844.
Drew D and Passman S., 1998, Theory of multicomponent fluids, Springer.
Gaeta, M. G., Lamberti, A., and Liu, P. F.-L., 2008, Two-phase breaking wavenumerical model for incompressible fluids: Air influence and applications,Proceeding of the 31st International Conference, Hamburg.
Garrett C., Li M., and Farmer D., 2000, The connection between bubble sizespectra and energy dissipation rates in the upper ocean, Journal of PhysicalOceanography, 30, 2163-2171.
Guido-Lavalle, G., Carrica, P., Clausse, A., and Qazi, M. K., 2004, A bubblenumber density constitutive equation, Nuclear Engineering and Design,152, 1-3, 213-224.
Hinze, J. O., 1955, Fundamentals of the hydrodynamic mechanism of splittingin dispersion processes, Amer. Inst. Chem. Eng. J., 1, 289295.
Hoque, A, 2002. Air bubble entrainment by breaking waves and associatedenergy dissipation, PhD Thesis, Tokohashi University of Technology.
Kothe, D. B., Mjolsness, R. C. and Torrey, M. D., 1991, RIPPLE: a computerprogram for incompressible flows with free surfaces, Los Alamos NationalLaboratory, Report LA 12007 MS.
Lin P. and Liu P. L.-F, 1998, Turbulence transport, vorticity dynamics, and solutemixing under plunging breaking waves in surfzone, J. Geophys. Res., 103,15677-15694.
12
Liu, D. and Lin, P., 2008, A numerical study of three-dimensional liquid sloshingin tanks, Journal of Computational Physics, 227(8), 3921-3939.
Shi F., Zhao Q., Kirby J. T., Lee, D. S., and Seo S. N. 2004, Modeling waveinteraction with complex coastal structures using an enhanced VOF model,Proceedings of the 29th International Conference, Vol. 1, 581-593.
Terrill E. J., Melville W. K., and Stramski D., 2001, Bubble entrainment bybreaking waves and their influence on optical scattering in the upper ocean,J. Geophys. Res., 106, C8, 16,815-16,823.
Thorpe S. A., 1982, On the clouds of bubbles formed by breaking wind-wavesin deep water, and their role in air-sea gas transfer, Phil. Trans. Roy. Soc.London A, 304, 155-210.
Vagle S., Farmer D. M. and Deane G. B., 2001, Bubble transport in rip currents,J. Geophs. Res., 106, C6, 11,677 - 11,689.
Vagle S., Chandler P. and Farmer D. M., 2005, On the dense bubble clouds andnear bottom turbulence in the surfzone, J. Geophys. Res., 110, C09018,doi:10.1029/2004JC002603.
Zhao, Q., Armfield, S., and Tanimoto, K., 2004, Numerical simulation ofbreaking waves by a mult-scale turbulence model, Coastal Engineering,51, 53-80.
13
KEYWORDS – ICCE 2008
PAPER TITLE: Modeling of Surfzone Bubbles Using a Multiphase VOF ModelAuthors: Fengyan Shi, James T. Kirby, Merrick Haller, and Patricio CatalanAbstract number 315
Air bubbleMultiphase modelNavier-Stakes solverVOF modelSurfzone
14