Introduction, hydrologic cycle, climate and water m1
122
Introduction, Hydrologic cycle, Climate and water availability, Water balances, Precipitation Prepared by Bibhabasu Mohanty Dept. of Civil Engineering SALITER, Ahmedabad MODULE- I
-
Upload
bibhabasu-mohanty -
Category
Education
-
view
4.107 -
download
3
description
Introduction, Hydrologic cycle, Climate and water availability, Water balances,Precipitation: Forms, Classification, Variability, Measurement, Data analysis, Evaporation and its measurement, Evapotranspiration and its measurement, Penman Monteith method. Infiltration: Factors affection infiltration, Horton’s equation and Green Ampt method.
Transcript of Introduction, hydrologic cycle, climate and water m1
Introduction, Hydrologic cycle, Climate and water
availability, Water balances, Precipitation
Prepared by Bibhabasu Mohanty
Dept. of Civil EngineeringSALITER, Ahmedabad
MODULE- I
Content…
Forms, Classification, Variability, Measurement, Data analysis, Evaporation and its measurement, Evapotranspiration and its measurement, Penman Monteith method. Infiltration: Factors affection infiltration, Horton’s equation and Green Ampt method.
Introduction
• Hydrology deals with the occurrence, circulation and distribution of water upon, over and beneath the earth surface.
• Engineering hydrology includes those segments of the field related to planning, design, and operation of engineering projects for the control and use of water.
• engineering hydrology deals with -
(1) estimation of water resources
(2) the study of processes such as precipitation, runoff, Evapotranspiration and their interaction and
(3) the study of problems such as flood and draught and strategies to combat them.
Applications • The capacity of storage structures
such as reservoirs• The magnitude of flood flows to
enable safe disposal of the excess flow.
• The minimum flow and quantity of flow available at various seasons.
• The interaction of the flood wave and hydraulic structures, such as levees, reservoirs, barrages and bridges.
Hydrological cycle• water circulatory system on earth the
waters of the earth, linking atmosphere, land, and oceans.
• water evaporates from the ocean surface, driven by energy from the sun, and joins the atmosphere, moving inland
• Atmospheric conditions act to condense and precipitate water onto the land surface
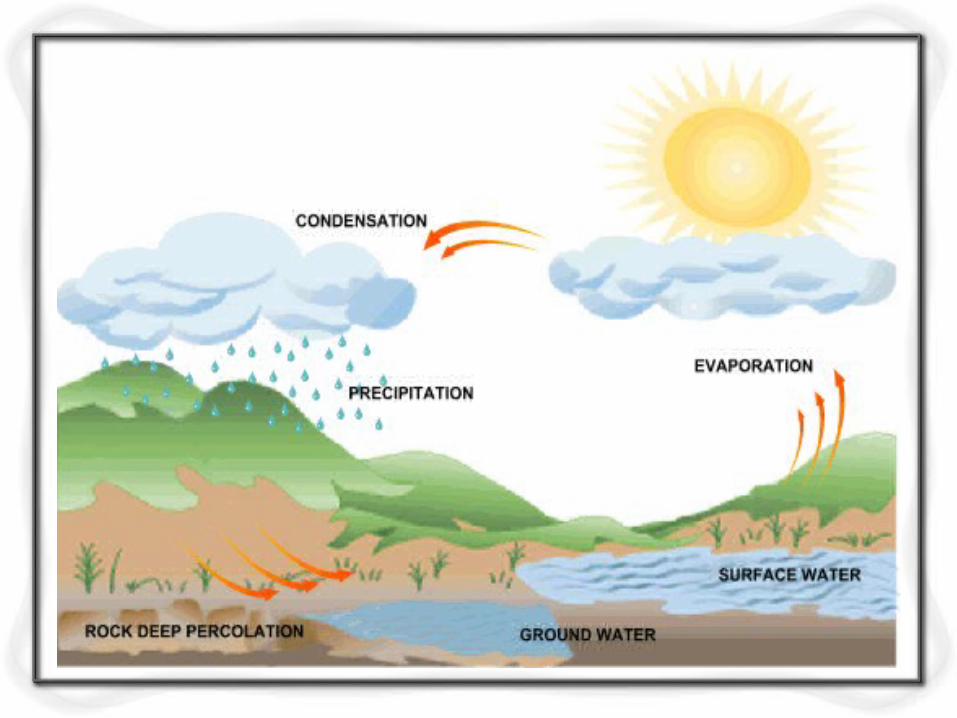
Elements of hydrological cycle• Evaporation, E• Transpiration, T• Precipitation, P• Surface runoff, R• Groundwater flow, G, and,• Infiltration, I
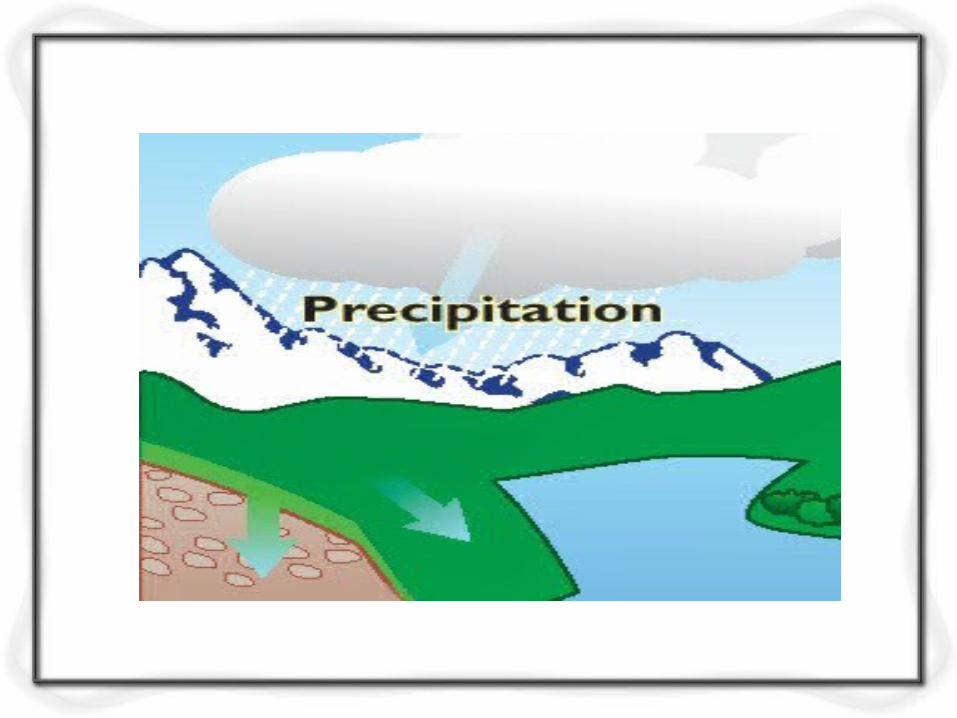
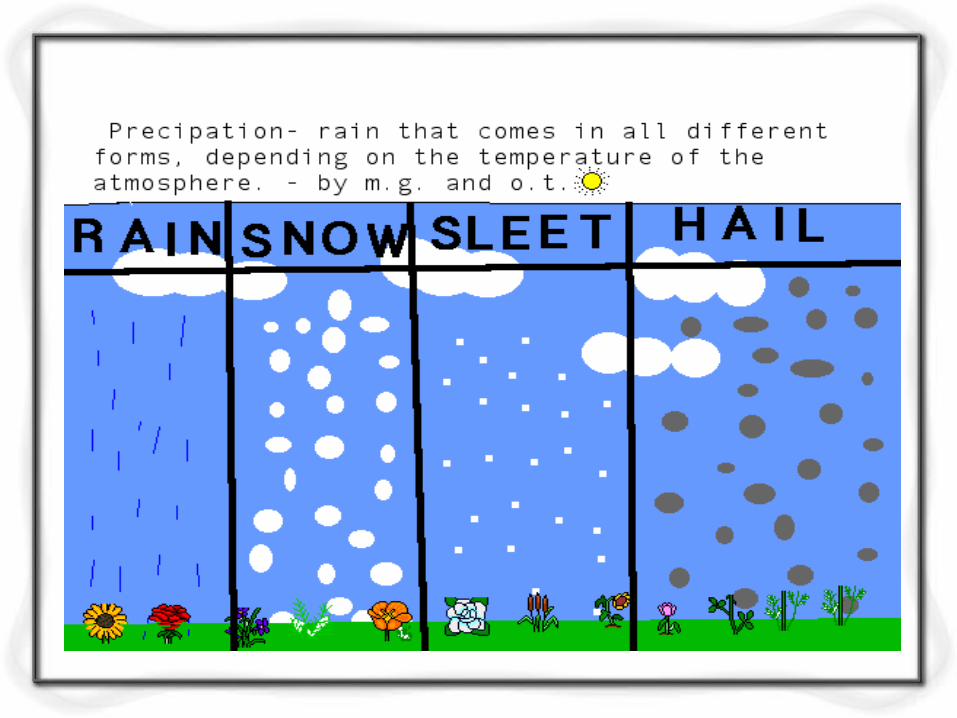
Precipitation• All forms of water that reach the earth
from the atmosphere is called Precipitation.
• The usual forms are rainfall, snowfall, frost, hail, dew. Of all these, the first two contribute significant amounts of water.
• Rainfall being the predominant form of precipitation causing stream flow, especially the flood flow in majority of rivers. Thus, in this context, rainfall is used synonymously with precipitation.
• In nature water is present in three aggregation states:– solid: snow and ice; – liquid: pure water and solutions; – gaseous: vapors under different grades of
pressure and saturation
• The water exists in the atmosphere in these three aggregation states.
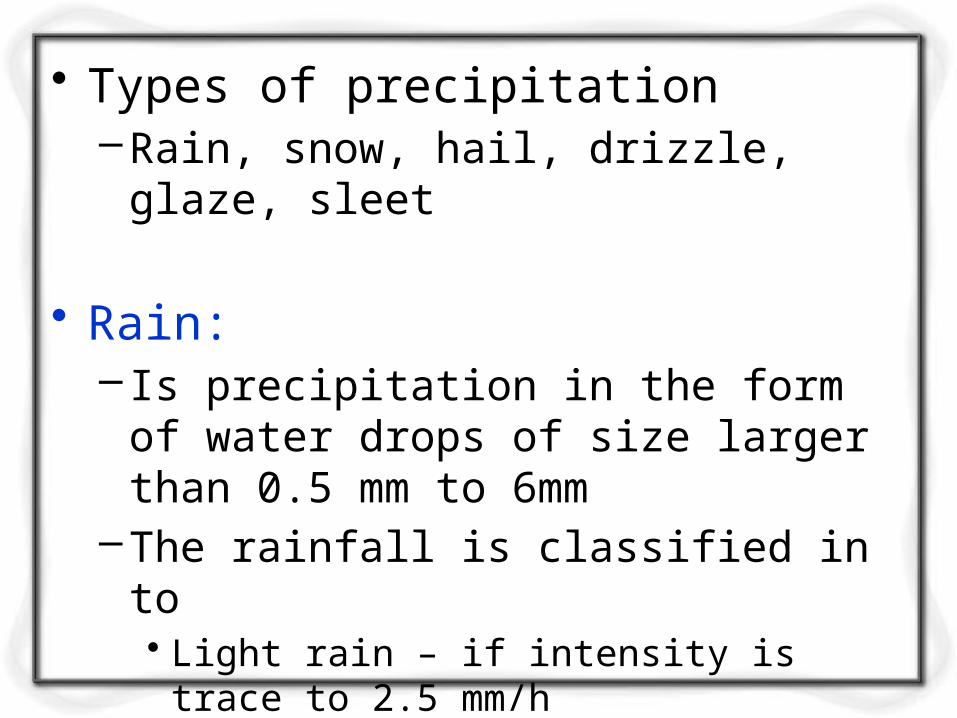
• Types of precipitation–Rain, snow, hail, drizzle, glaze,
sleet
• Rain:– Is precipitation in the form of water
drops of size larger than 0.5 mm to 6mm
–The rainfall is classified in to• Light rain – if intensity is trace to 2.5
mm/h• Moderate – if intensity is 2.5 mm/hr to
7.5 mm/hr• Heavy rain – above 7.5 mm/hr
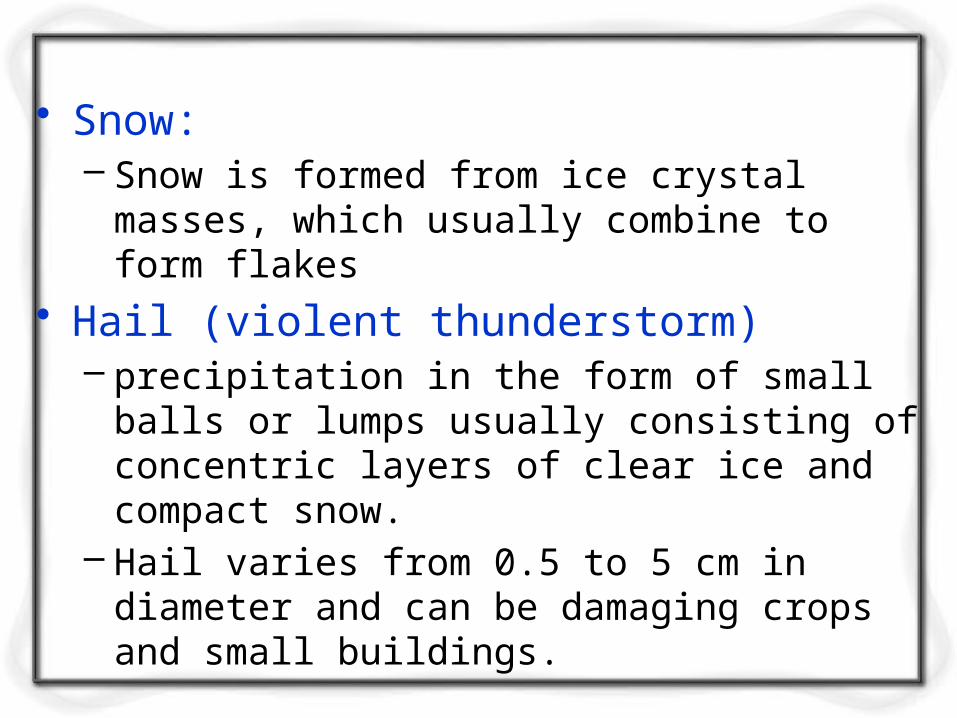
• Snow:– Snow is formed from ice crystal masses,
which usually combine to form flakes • Hail (violent thunderstorm)
– precipitation in the form of small balls or lumps usually consisting of concentric layers of clear ice and compact snow.
– Hail varies from 0.5 to 5 cm in diameter and can be damaging crops and small buildings.
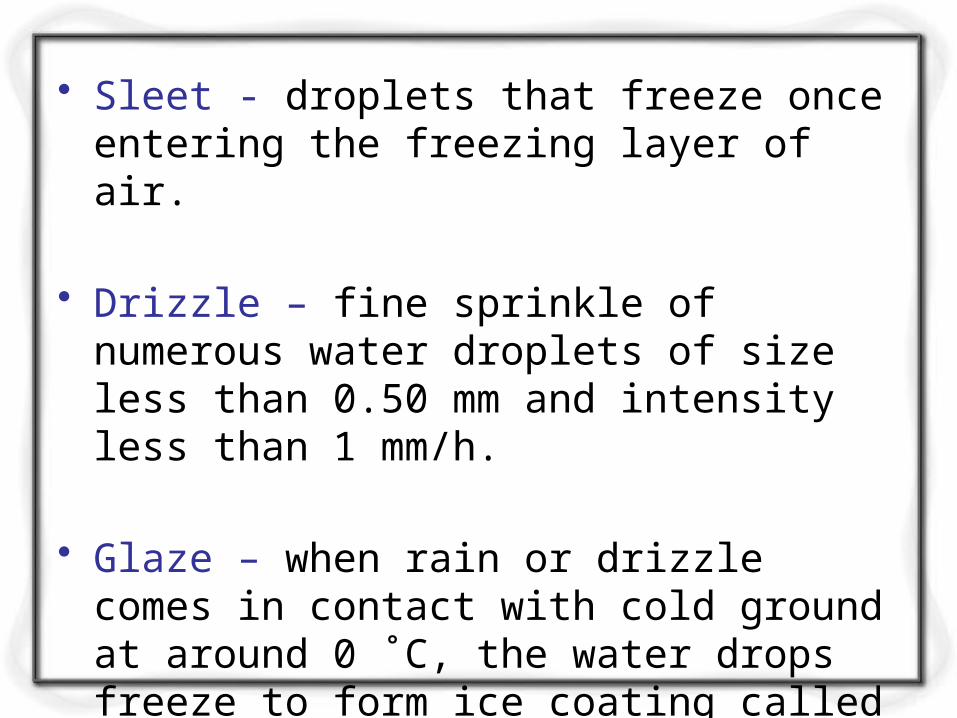
• Sleet - droplets that freeze once entering the freezing layer of air.
• Drizzle – fine sprinkle of numerous water droplets of size less than 0.50 mm and intensity less than 1 mm/h.
• Glaze – when rain or drizzle comes in contact with cold ground at around 0 ˚C, the water drops freeze to form ice coating called glaze or freezing rain.
Mechanisms for air lifting
1. Frontal lifting
2. Orographic lifting
3. Convective lifting
Definitions
• Air mass : A large body of air with similar temperature and moisture characteristics over its horizontal extent.
• Front: Boundary between contrasting air masses.
• Cold front: Leading edge of the cold air when it is advancing towards warm air.
• Warm front: leading edge of the warm air when advancing towards cold air.
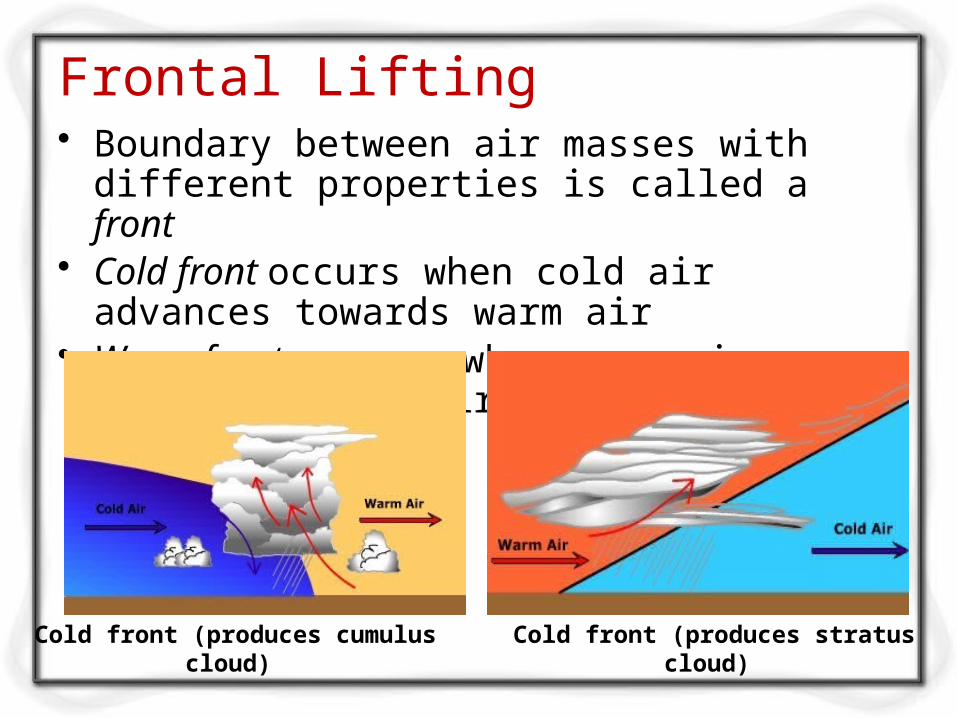
Frontal Lifting• Boundary between air masses with
different properties is called a front• Cold front occurs when cold air advances
towards warm air• Warm front occurs when warm air
overrides cold air
Cold front (produces cumulus cloud)
Cold front (produces stratus cloud)
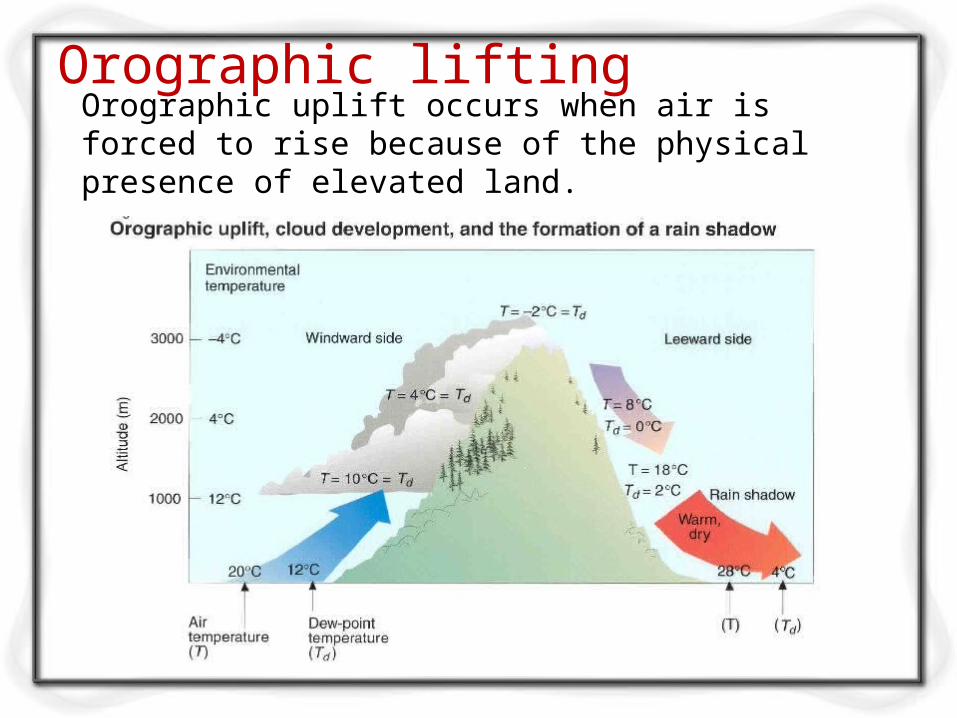
Orographic liftingOrographic uplift occurs when air is forced to rise because of the physical presence of elevated land.
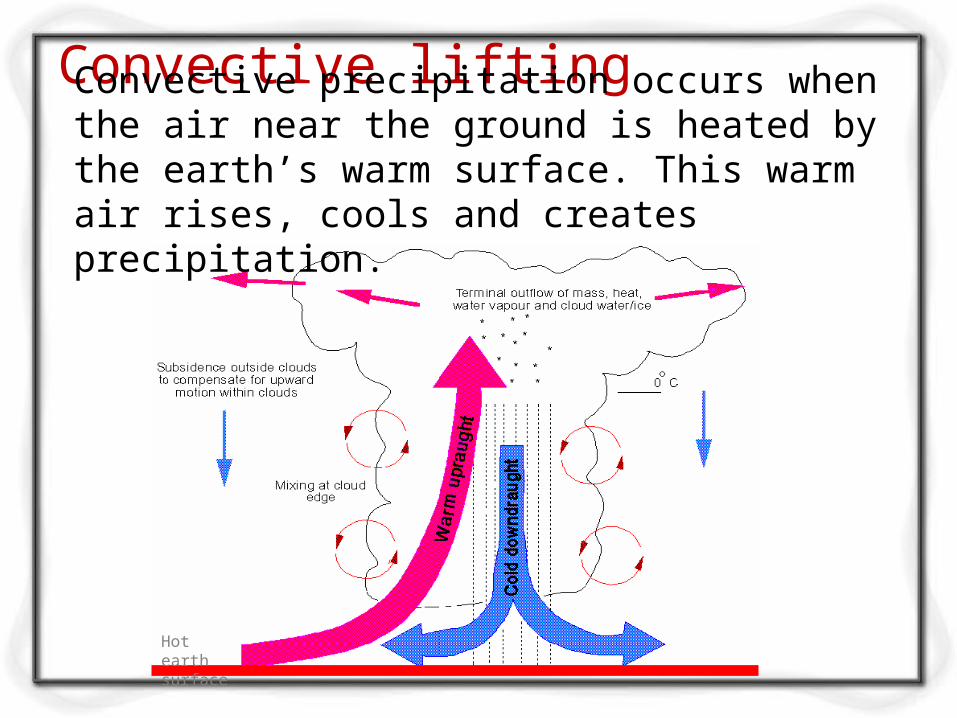
Convective lifting
Hot earth surface
Convective precipitation occurs when the air near the ground is heated by the earth’s warm surface. This warm air rises, cools and creates precipitation.
Precipitation Variation
• Influenced by –Atmospheric circulation and local
factors• Higher near coastlines• Seasonal variation – annual
oscillations in some places• Variables in mountainous areas• Increases in plains areas

Global precipitation pattern
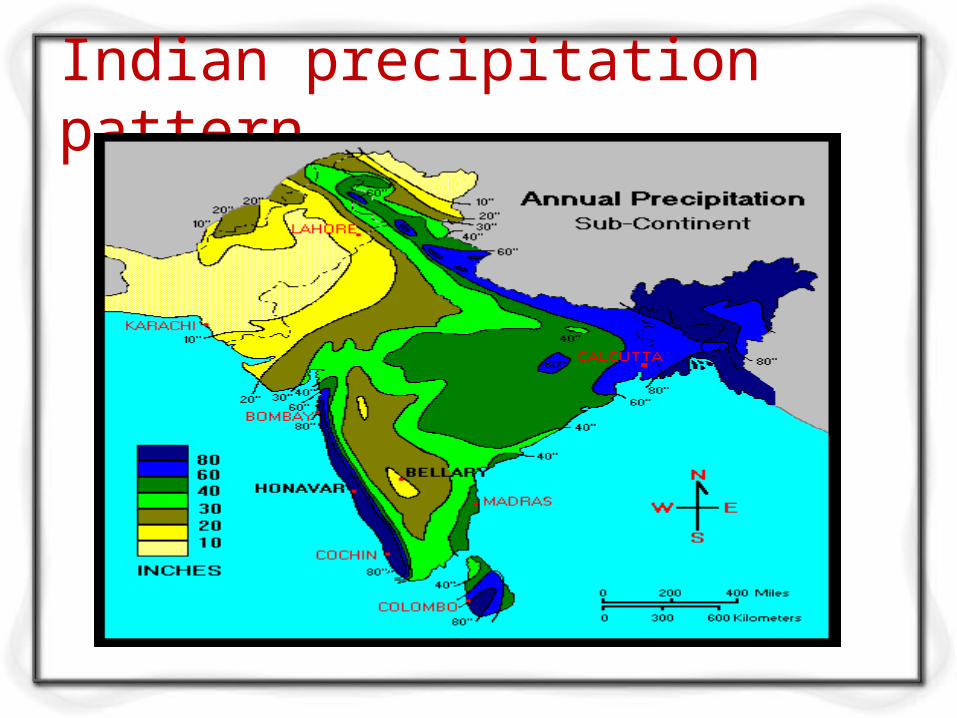
Indian precipitation pattern
Measurement of precipitation• Precipitation is expressed in terms of
depth to which rainfall water would stand on an area if all the rain were collected on it.
• Rainfall at a place can be measured by a rain gauge. The rain gauge may be broadly
• classified into two types.(1) Non-recording type rain gauge(2) Recording type rain gauge.
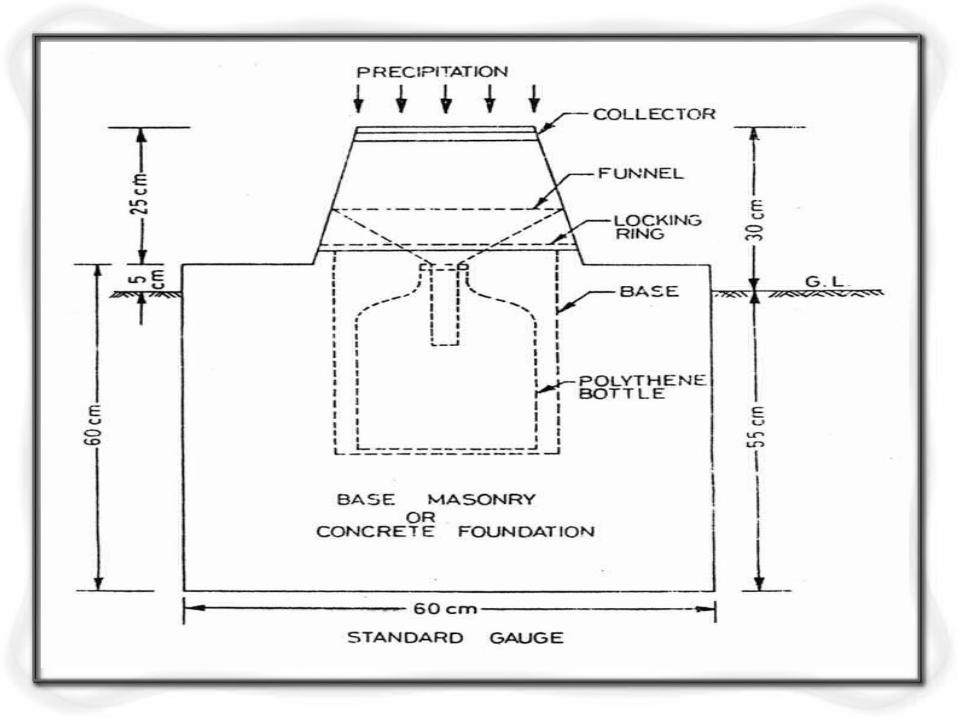
Non-recording type rain gauge
• The Symon rain gauge consists of a cylindrical vessel, called metal casing, of 12.7
• cm diameter, with a base of 21.0cm. The metal casing is fixed vertically to a masonry
• foundation block of the size 60 cm x 60 cm x 60 cm. A funnel with a circular rim of 12.7 cm and a glass bottle are placed in the metal casing.
• The height of the metal casing is fixed so that the rim is 30.5 cm above the ground surface.
• The glass bottle, called the receiver, is of 7.5 to 10 cm diameter. The rain gauge is kept in open.
• The rain falling into the funnel is collected in the receiver.
• The receiver, with the rain water in it, is taken out of the metal casing.
• The rainfall depth is measured with a special measuring glass jar graduated in mm of rainfall.
• It can measure up to 12.5 mm of rainfall.
• During heavy rains, the rainfall is measured 3 or 4 times in a day.
• The total rainfall of the day is obtained by adding all the individual measurements of day.
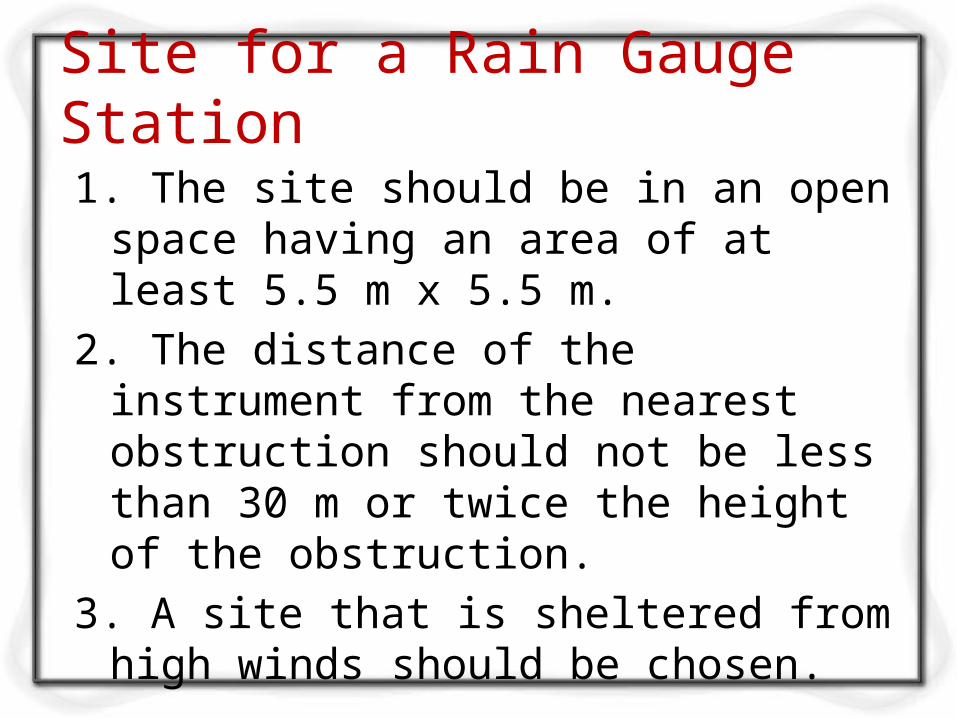
Site for a Rain Gauge Station
1. The site should be in an open space having an area of at least 5.5 m x 5.5 m.
2. The distance of the instrument from the nearest obstruction should not be less than 30 m or twice the height of the obstruction.
3. A site that is sheltered from high winds should be chosen.
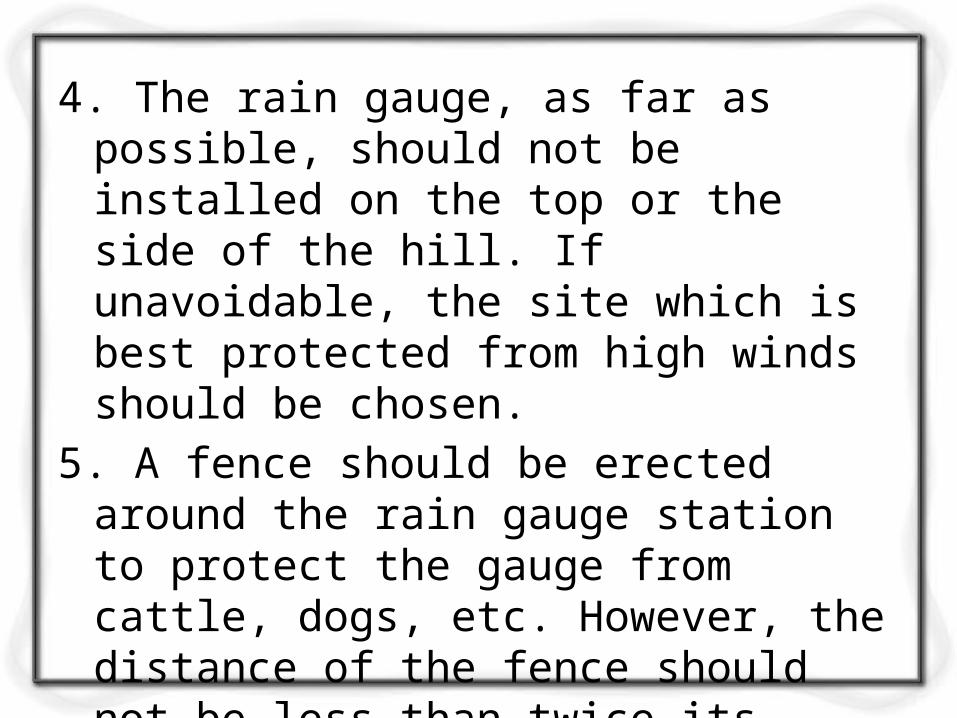
4. The rain gauge, as far as possible, should not be installed on the top or the side of the hill. If unavoidable, the site which is best protected from high winds should be chosen.
5. A fence should be erected around the rain gauge station to protect the gauge from cattle, dogs, etc. However, the distance of the fence should not be less than twice its height.
6. The gauge must always be mounted firmly so that it cannot be disturbed even by the strongest wind in that region.
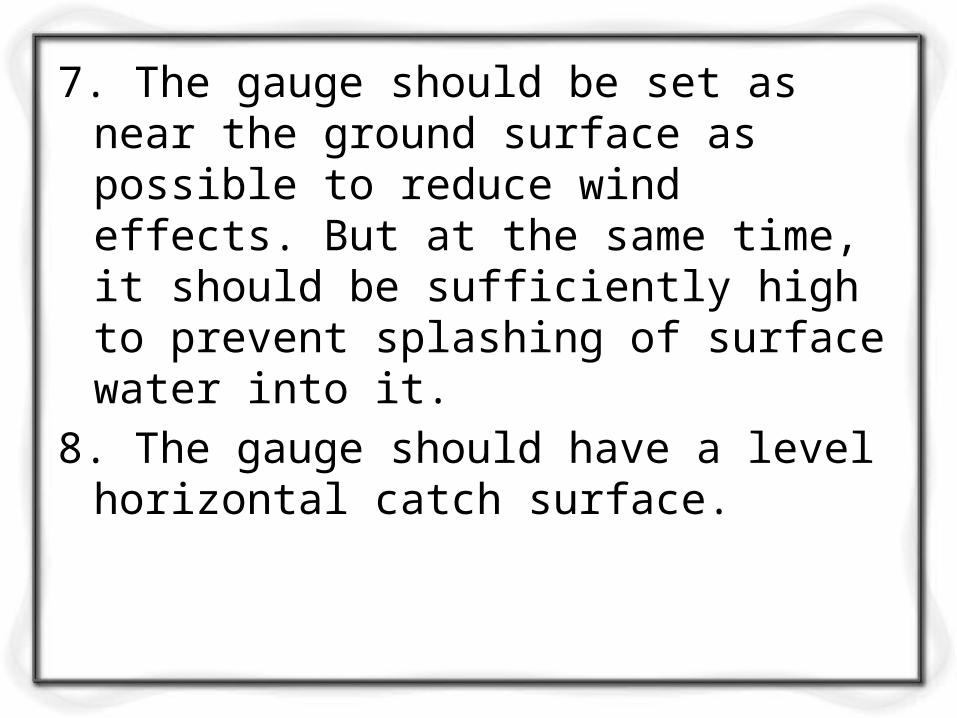
7. The gauge should be set as near the ground surface as possible to reduce wind effects. But at the same time, it should be sufficiently high to prevent splashing of surface water into it.
8. The gauge should have a level horizontal catch surface.
Recording type rain gauge• The recording type rain gauges have
recording arrangement, which gives the rainfall
• intensity and the duration of the rainfall, besides giving the total depth of the rainfall. These
• rain gauges are, therefore, more useful than the non-recording type rain gauges
1. Tipping bucket rain gauge
2. Weighing bucket rain gauge
3. Float-type rain gauge
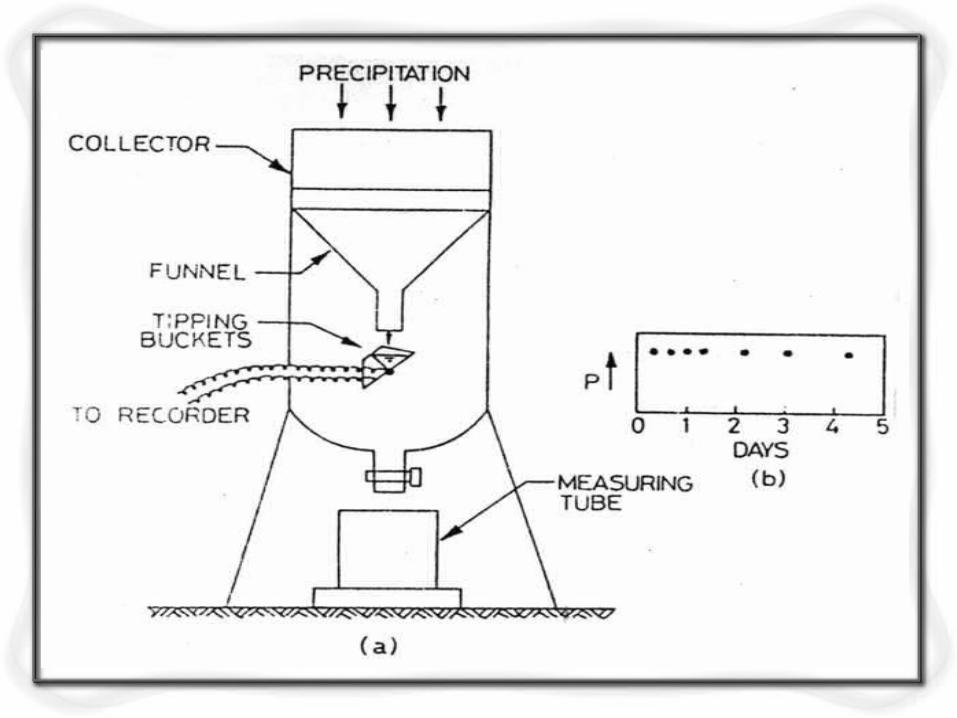
Tipping bucket rain gauge• The tipping bucket rain gauge consists of
two small buckets placed below the funnel fitted in a 30 cm diameter receiver .
• The buckets are balanced in an unstable equilibrium about a horizontal axis such that at one time only one bucket remains below the funnel.
• One bucket is always higher than the other. As the rainfall is collected by the receiver, it passes through the funnel to the higher bucket.
• After a certain small amount of rainfall (usually 0.25 mm) is received by the higher bucket, it becomes unstable and tips to empty itself into a measuring tube placed below it.
• At the same time, the other bucket comes to the higher position and starts colleting the rainfall.
• The tipping of the bucket actuates an electric circuit, which causes a pen to make a mark on a chart wrapped around a drum revolved by a clock-driven mechanism.
• Thus each mark on the chart corresponds to a rainfall of 0.25 mm.
• By counting the number of marks and noting the time, the intensity and amount of the rainfall can be determined.
Weighing Bucket Rain Gauge• The rain is collected by a weighing
bucket through a funnel. • The bucket rests on a weighing
platform of a spring or lever balance attached to a weighing mechanism.
• As the bucket is filled with rain water, its weight increases and the weighing platform moves downwards.
• The movement of the weighing platform is transmitted to a pen through a system of links and levers.
• The pen makes a trace of the accumulated amount of rainfall on a chart attached to a drum revolved by a clock driven mechanism.
• The record is continuous and is in the form of the conventional mass curve .
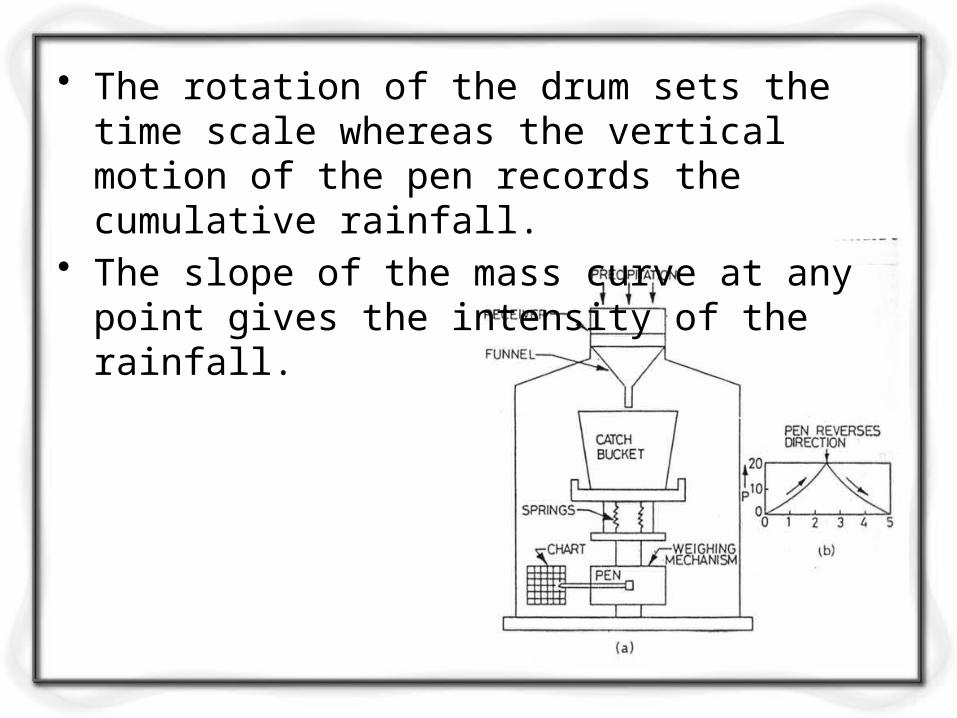
• The rotation of the drum sets the time scale whereas the vertical motion of the pen records the cumulative rainfall.
• The slope of the mass curve at any point gives the intensity of the rainfall.
Float type rain gauge• In the float-type gauge, the
precipitation falling on the receiver passes through the funnel and filter and is collected in a float chamber.
• The filter prevents dust, debris, etc, from entering the float chamber.
• The float chamber contains a float with a vertical stem fixed over it.
• A pen is mounted on the top of the vertical stem.
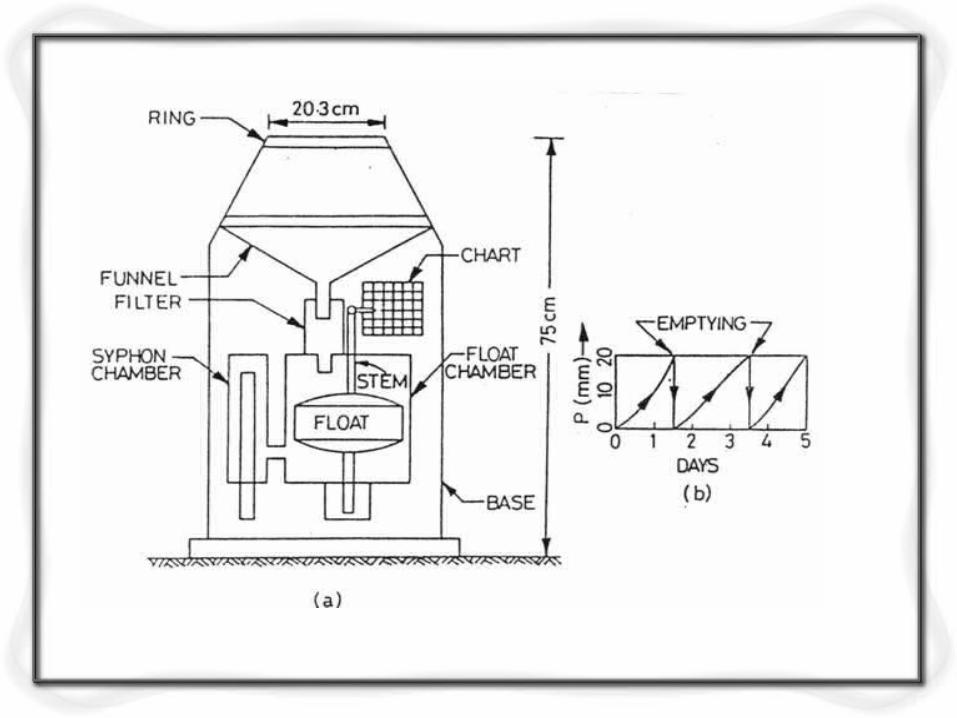
• As the rain is collected in the float chamber, the float rises and the pen moves on a chart fixed on a drum revolved by a clock-driven mechanism.
• The pen thus marks a trace of the cumulative depth of rainfall on the chart.
• The record is in the form of the conventional mass curve, from which the intensity and duration of rainfall can be determined.
Preparation of Data• Before using the rainfall records of a
station, it is necessary to first check the data for continuity and consistency.
• The continuity of a record may be broken with missing data due to many reasons such as damage or fault in a rain gauge during a period.
• The missing data can be estimated by using the data of the neighbouring stations.
• In these calculations, the normal rainfall is used as a standard of comparison.
• The normal rainfall is the average value of rainfall at a particular data, month or year over a specified 30-year period or so.
• The normal rainfall is updated every ten years.

Estimation of missing rainfall data
1. Arithmetic average method2. Comparison method3. Normal ratio method4. Isohyetal map method
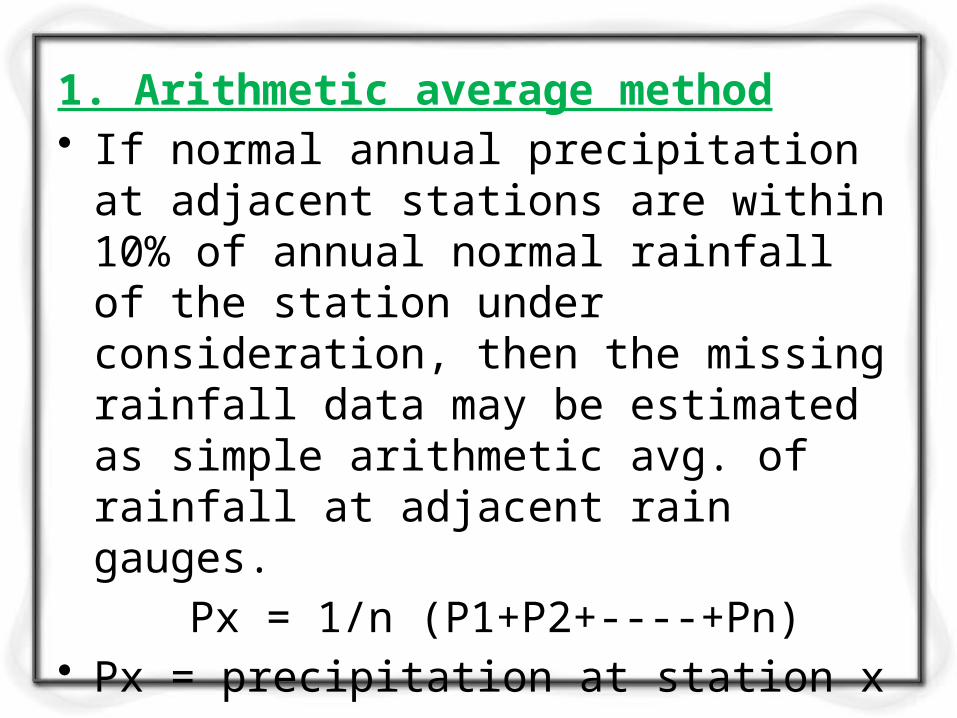
1. Arithmetic average method• If normal annual precipitation at
adjacent stations are within 10% of annual normal rainfall of the station under consideration, then the missing rainfall data may be estimated as simple arithmetic avg. of rainfall at adjacent rain gauges.
Px = 1/n (P1+P2+----+Pn)• Px = precipitation at station x• P1, P2,---Pn = rainfall at surrounding
rain gauges
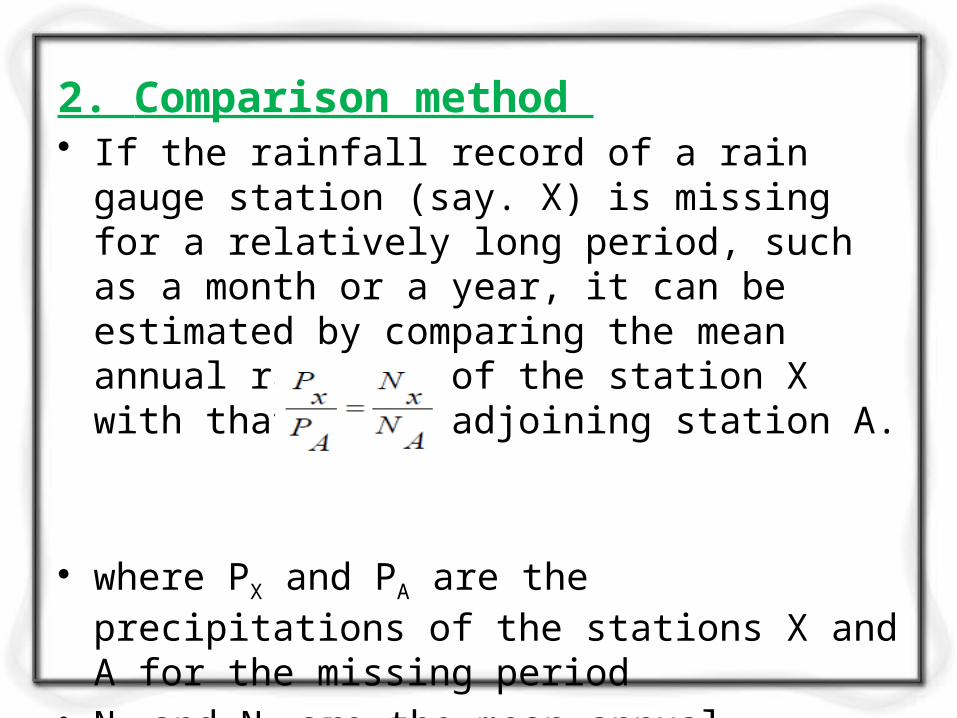
2. Comparison method • If the rainfall record of a rain gauge station
(say. X) is missing for a relatively long period, such as a month or a year, it can be estimated by comparing the mean annual rainfall of the station X with that of an adjoining station A.
• where PX and PA are the precipitations of the stations X and A for the missing period
• NX and NA are the mean annual rainfalls of the stations X and A.
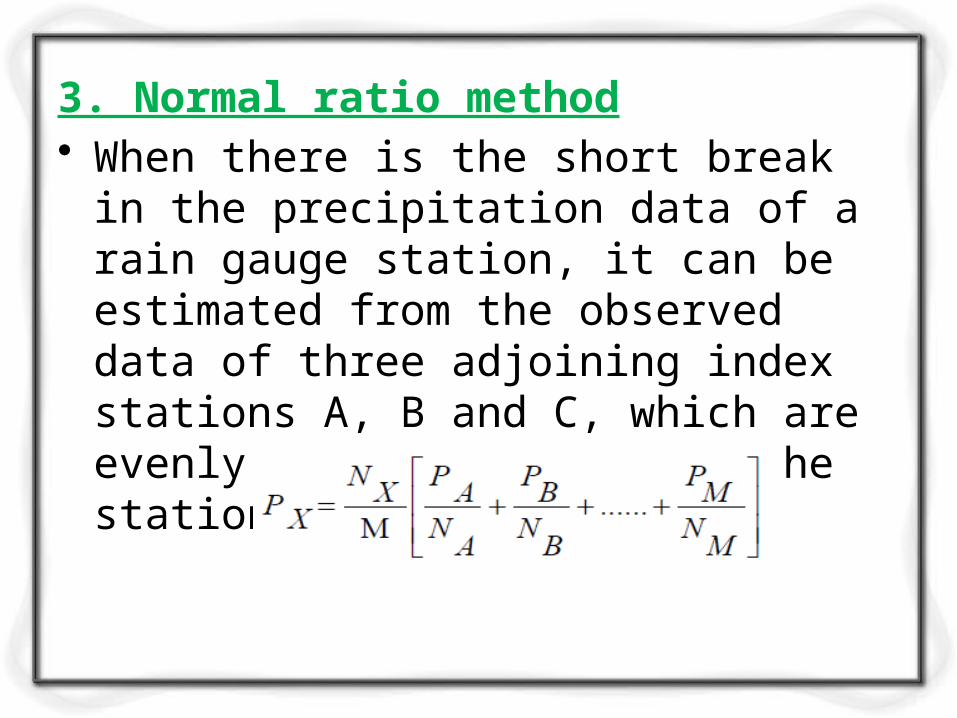
3. Normal ratio method• When there is the short break in the
precipitation data of a rain gauge station, it can be estimated from the observed data of three adjoining index stations A, B and C, which are evenly distributed around the station X.
• Nx = normal annual rainfall at station X
• NA, NB, --- NM = normal annual rainfalls at n surrounding rain gauges respectively.
• A minimum 3 surrounding stations are generally used in normal ratio method.
4. Isohyetal map method • Isohyets are the contours of equal rainfall
depth. • An isohyetal map is prepared from• the record of various rain gauge stations
by interpolation. • The isohyetal map method is suitable for
the estimation of the missing data of a station X due to a particular storm.
• An isohyetal map is prepared from the data of the various rain gauge stations, and the precipitation of the station X is estimated from the two isohyets between which the station lies.
• It consider rainfall characteristics including average patterns, distance from sea, topography and storm paths.
• Interpolation of missing data from such maps reasonably accurate.
Average Rainfall Depth Over An Area
• The rainfall recorded by a rain gauge represents the rainfall at that station.
• It is also called the point rainfall. • In many hydrological studies, the
average depth of rainfall over a specified area due to a storm, or due to a number of storms, is required.
• For determination of the average precipitation over an area, a large number of rain gauges are installed.
• The average rainfall over the area is found from the rainfall data of these rain gauges by one of the following three methods:
1. Arithmetic mean method2. Thiessen polygon method3. Isohyetal map method
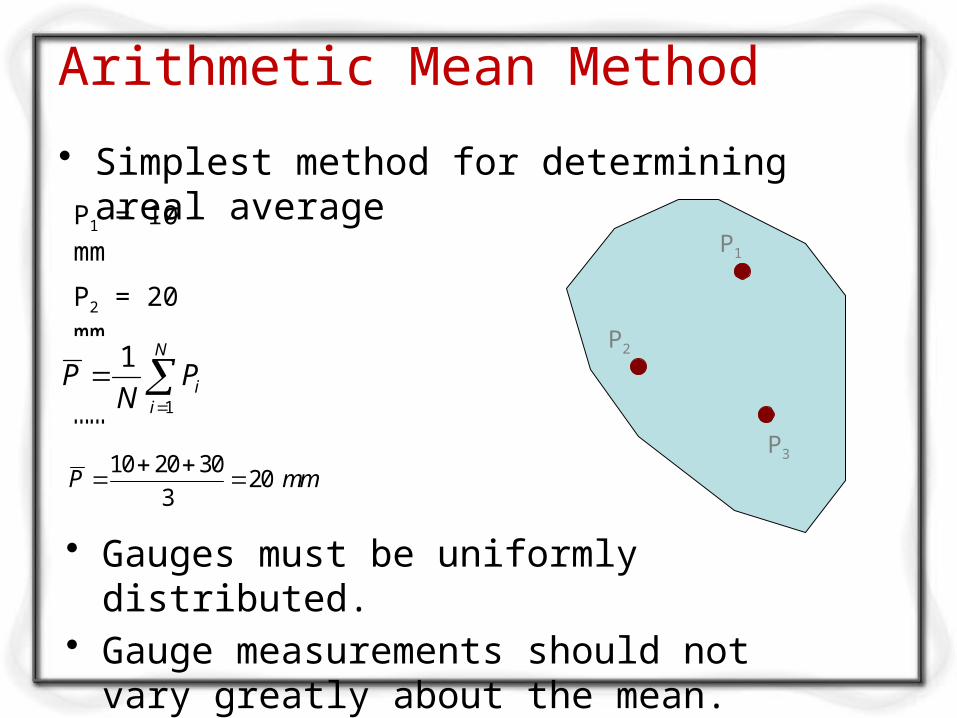
Arithmetic Mean Method
• Simplest method for determining areal average
P1
P2
P3
P1 = 10 mm
P2 = 20 mm
P3 = 30 mm
• Gauges must be uniformly distributed. • Gauge measurements should not vary
greatly about the mean.
N
iiPN
P1
1
mmP 203
302010
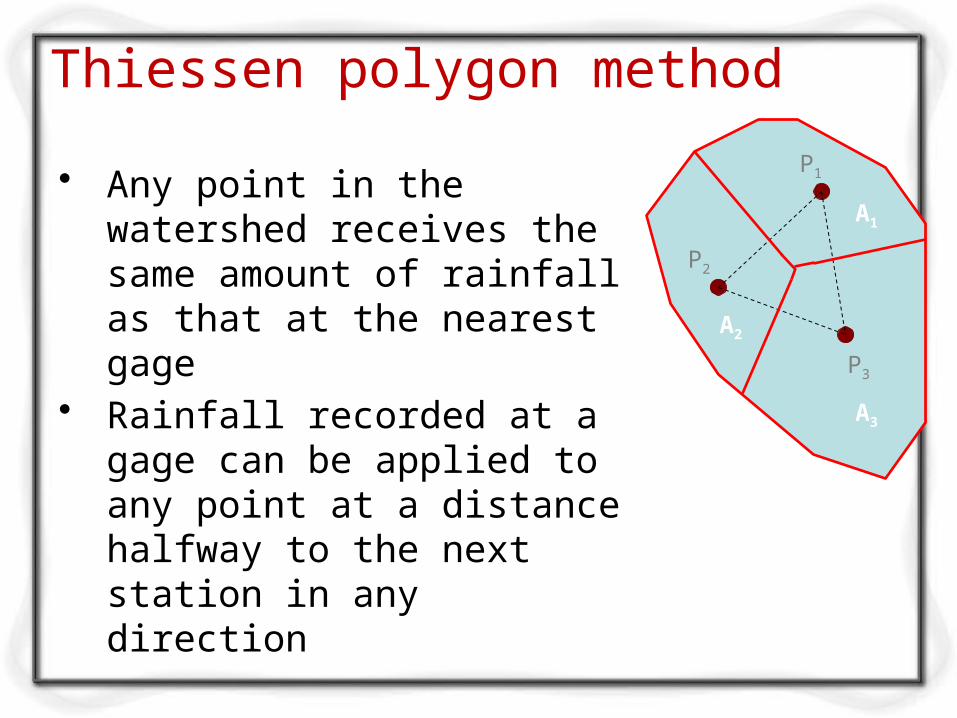
Thiessen polygon method
P1
P2
P3
A1
A2
A3
• Any point in the watershed receives the same amount of rainfall as that at the nearest gage
• Rainfall recorded at a gage can be applied to any point at a distance halfway to the next station in any direction

N
iiiPAA
P1
1
P1 = 10 mm, A1 = 12 Km2
P2 = 20 mm, A2 = 15 Km2
P3 = 30 mm, A3 = 20 km2
mmP 7.2047
302020151012
Steps in Thiessen polygon method1. Draw lines joining adjacent gages 2. Draw perpendicular bisectors to the lines
created in step 13. Extend the lines created in step 2 in both
directions to form representative areas for gages
4. Compute representative area for each gage5. Compute the areal average using the
following formula
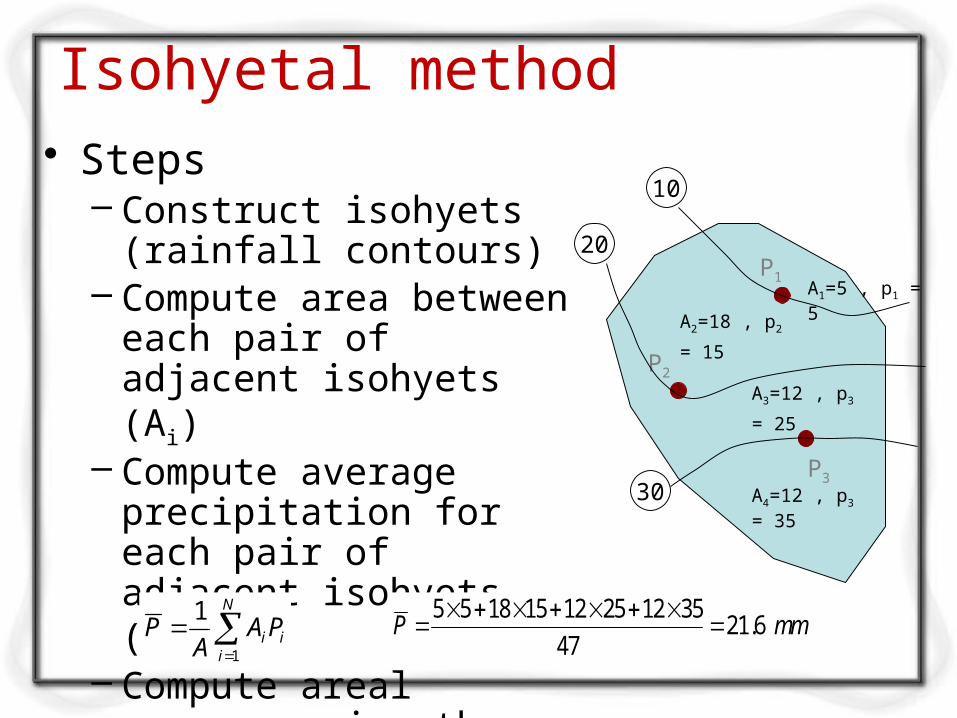
Isohyetal method
P1
P2
P3
10
20
30
• Steps– Construct isohyets
(rainfall contours)– Compute area between
each pair of adjacent isohyets (Ai)
– Compute average precipitation for each pair of adjacent isohyets (pi)
– Compute areal average using the following formula
A1=5 , p1 = 5
A2=18 , p2 =
15
A3=12 , p3 =
25
A4=12 , p3 = 35
mmP 6.2147
35122512151855
N
iiiPAA
P1
1
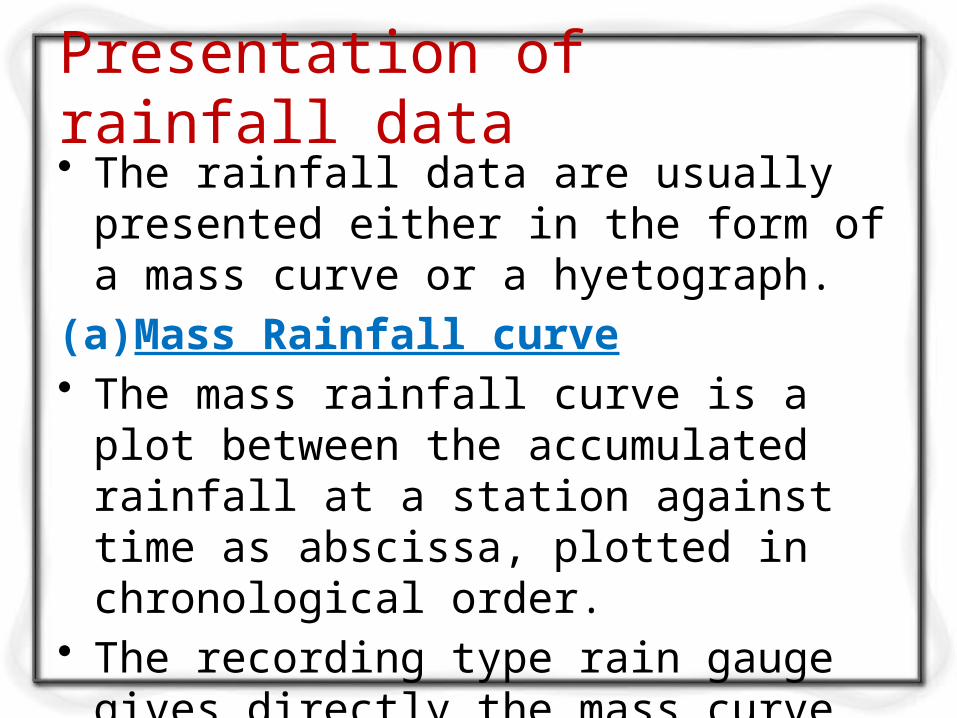
Presentation of rainfall data• The rainfall data are usually
presented either in the form of a mass curve or a hyetograph.
(a)Mass Rainfall curve• The mass rainfall curve is a plot
between the accumulated rainfall at a station against time as abscissa, plotted in chronological order.
• The recording type rain gauge gives directly the mass curve.
• The mass curve of a non-recording gauge can be prepared from the knowledge of the beginning and the end of the storm, and distributing the total depth of the rainfall over the various periods according to the mass rainfall curves of the adjacent recording rain gauge stations.
• However, such a mass curve is approximate.
• The mass curve is useful for the determination of the intensity, amount, and duration of the rainfall.
• The amount of duration of the rainfall are obtained directly from the curve.
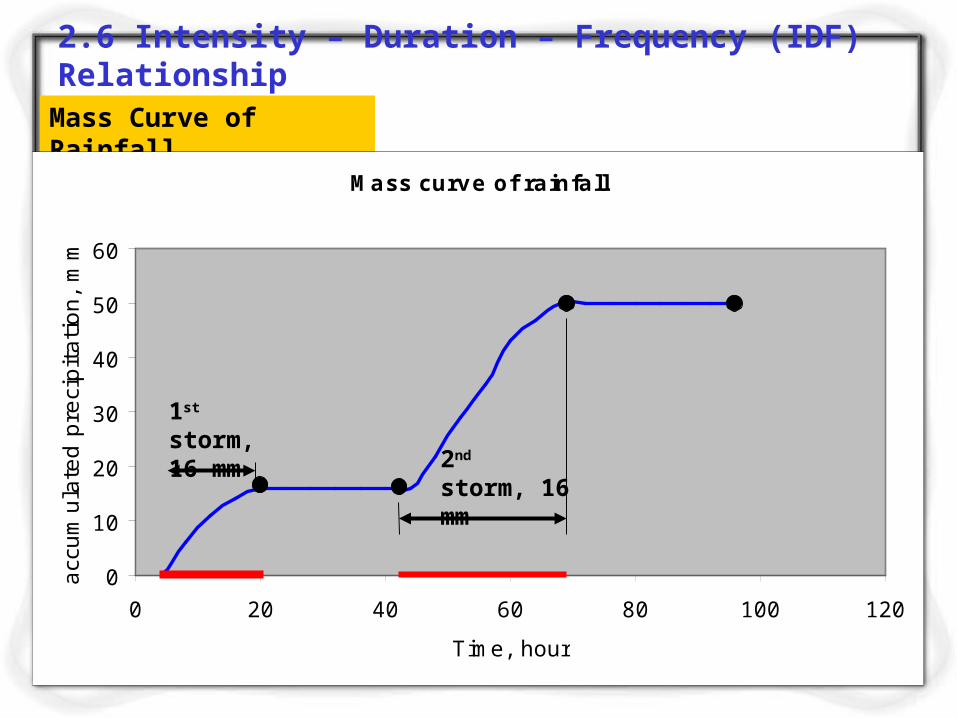
2.6 Intensity – Duration – Frequency (IDF) Relationship
Mass Curve of Rainfall
Mass curve of rainfall
0
10
20
30
40
50
60
0 20 40 60 80 100 120
Time, hour
acc
um
ula
ted p
reci
pit
ati
on,
mm
1st storm, 16 mm
2nd storm, 16 mm
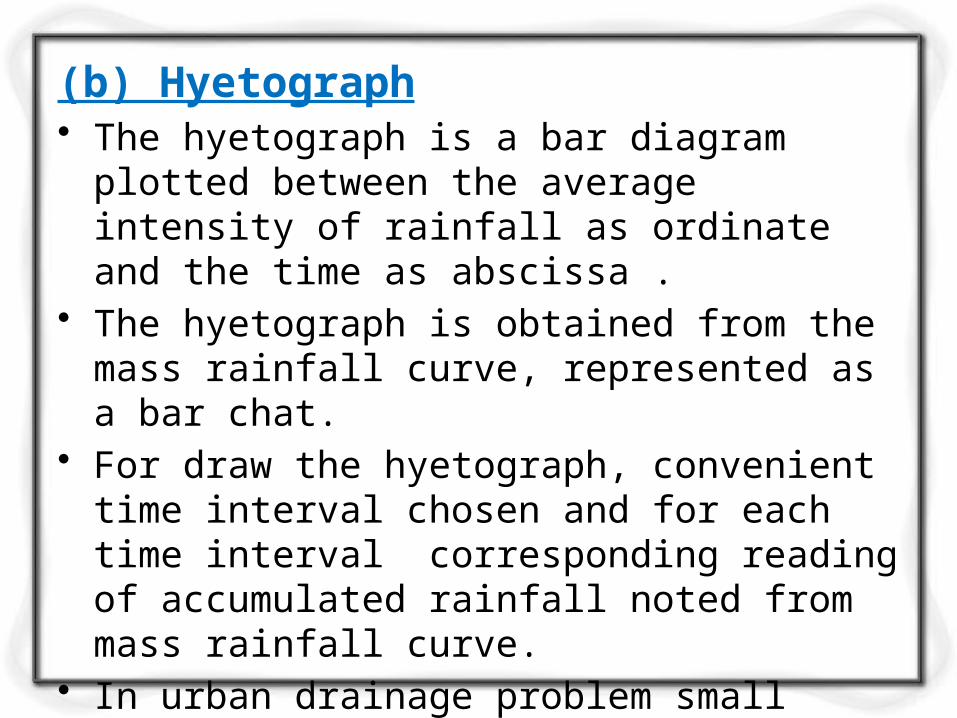
(b) Hyetograph• The hyetograph is a bar diagram plotted
between the average intensity of rainfall as ordinate and the time as abscissa .
• The hyetograph is obtained from the mass rainfall curve, represented as a bar chat.
• For draw the hyetograph, convenient time interval chosen and for each time interval corresponding reading of accumulated rainfall noted from mass rainfall curve.
• In urban drainage problem small durations used, in flood flow in larger catchment it is 6 hrs.
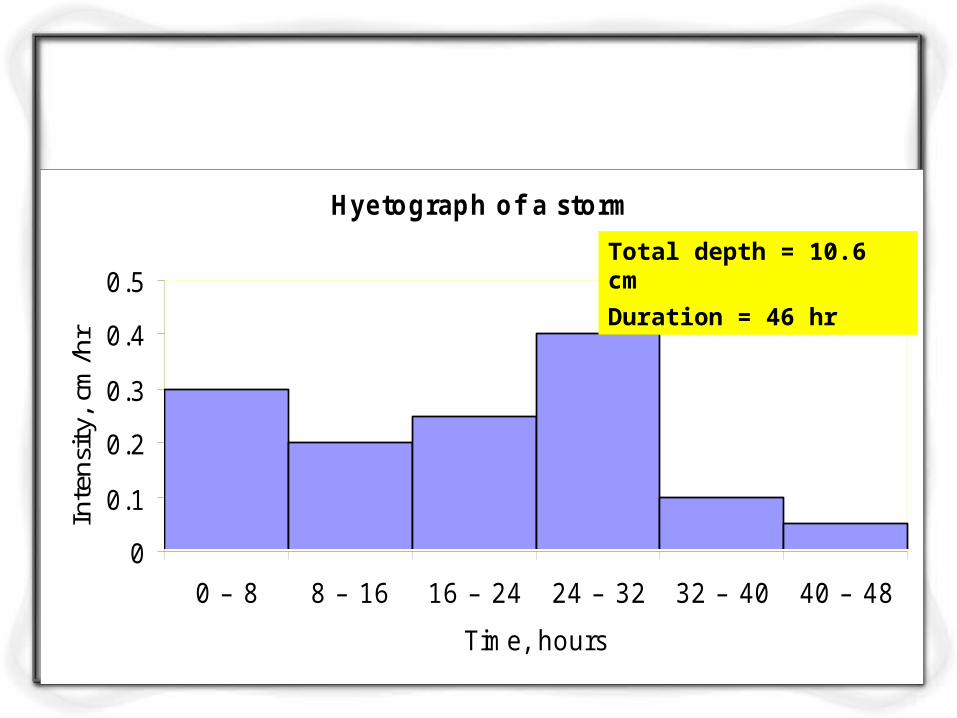
Hyetograph of a storm
0
0.1
0.2
0.3
0.4
0.5
0 – 8 8 – 16 16 – 24 24 – 32 32 – 40 40 – 48
Time, hours
Inte
nsit
y, c
m/h
r
Total depth = 10.6 cm
Duration = 46 hr
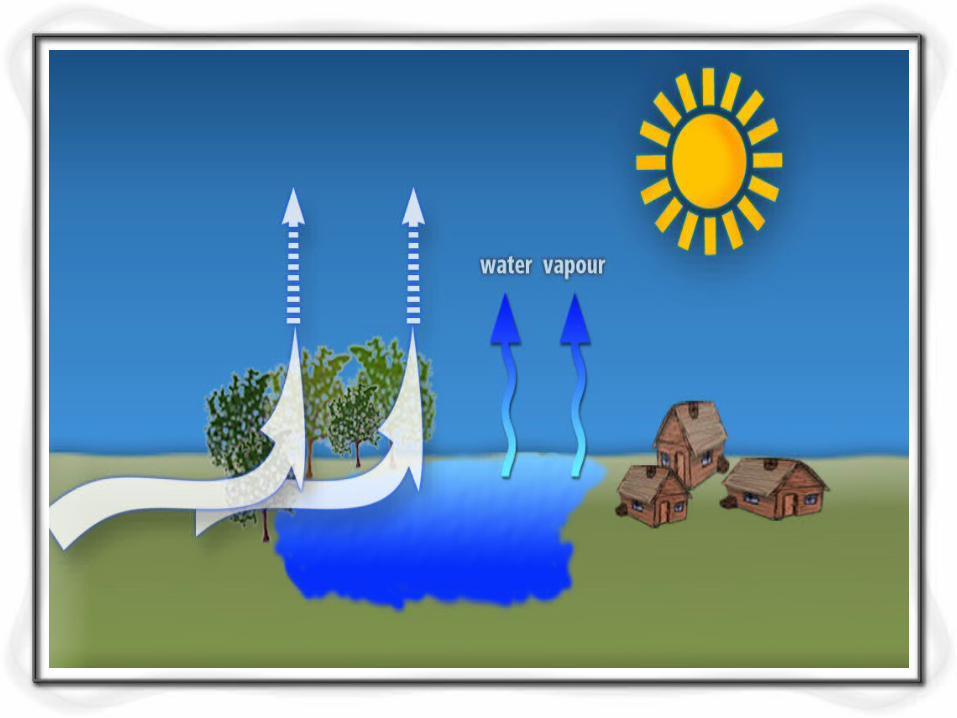
Evaporation • is the processes in which a liquid
changes to the gaseous state at the free surface, below the boiling point through the transfer of heat energy.
• This change in state requires an exchange of 585 Cal for each gram of water evaporated.
• expressed as an evaporation rate in mm / d, cm / d , in / d.

Factors affecting(a) Meteorological factors
1. Solar radiation - changes depend upon latitude, season, time of day and sky condition (cloudiness)2. air temperature3. vapour pressure4. wind velocity5. atmospheric pressure
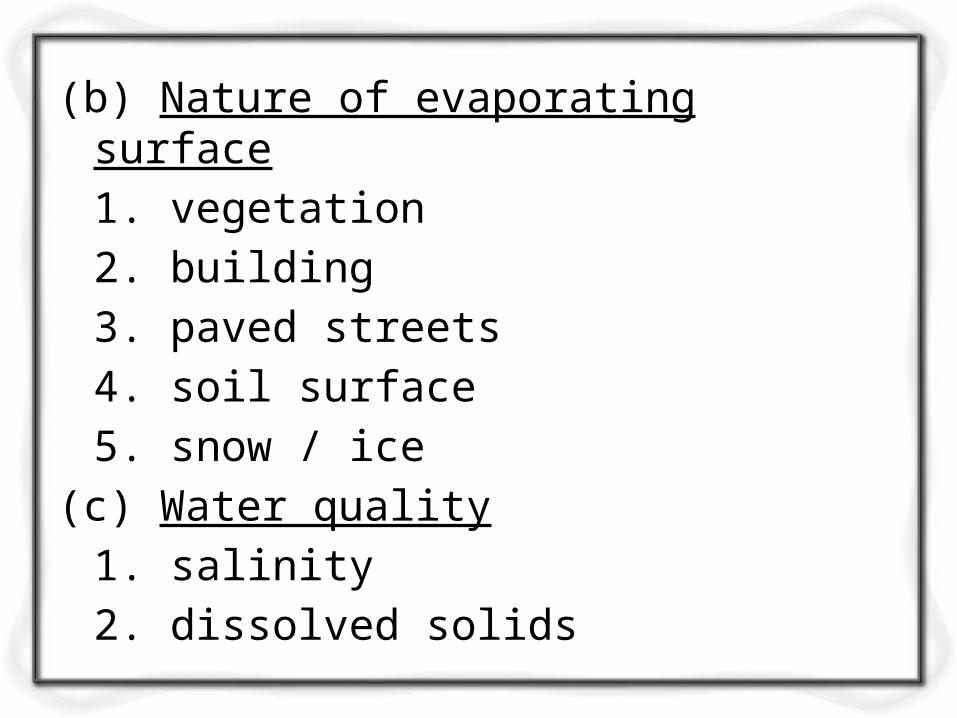
(b) Nature of evaporating surface1. vegetation2. building3. paved streets4. soil surface5. snow / ice
(c) Water quality1. salinity2. dissolved solids
Measurement • The amount of water evaporated
from a water surface is estimated by -1. Using evaporimeter data (pan evaporation)2. Emperical, equation (Penman's method, etc.)3. Analytical methods – (water budget method, energy budget method, etc.)
Pan evaporationU. S. Class A Evaporation pan• most commonly used evaporation pan. • the pan consists of a shallow vessel
about 1.21 m in diameter and 25.5cm deep.
• made of unpainted galvanised iron sheet.
• Where there is corrosion problem, it is made of monel sheet.
• Water in the pan is filled to a depth of 20cm.
• When the depth of water reduces to 18 cm, it is refilled.
• Water surface level is measured daily with a hook gauge installed in the stilling well.
• The pan is placed on a wooden platform such that its base is 15 cm above the ground surface to allow free circulation of air below the pan.
• Evaporation is computed as the difference between observed water levels on two consecutive days.
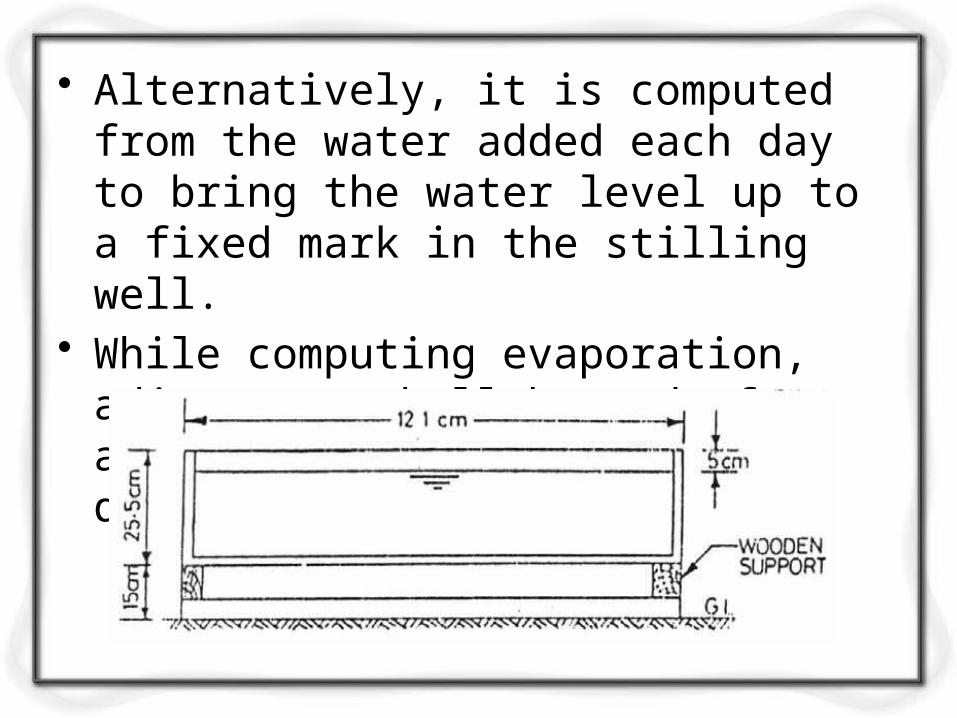
• Alternatively, it is computed from the water added each day to bring the water level up to a fixed mark in the stilling well.
• While computing evaporation, adjustment shall be made for any precipitation occurred during the period.

Colorado Sunken Pan• this type of pan is buried into the
ground such that the water• level is at the ground level. The pan
is 92 cm square in plan and 46 cm deep. It is made of
• unpainted galvanised iron sheet. The main advantage of the sunken pan over the Class A
• Evaporation pan is that its radiation and aerodynamic characteristics are closer to those of a reservoir
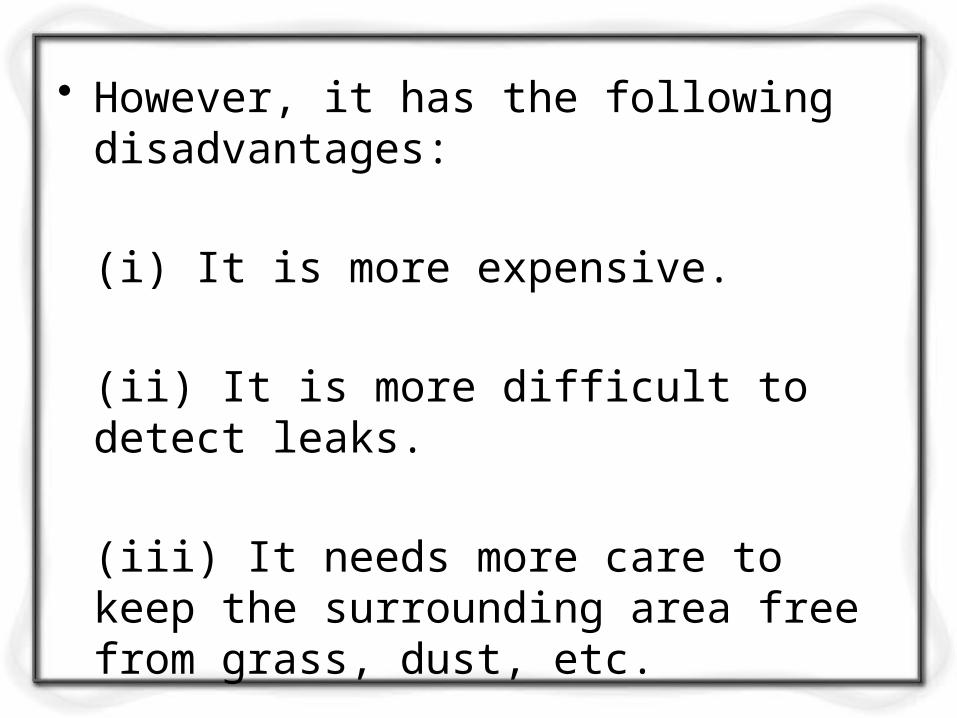
• However, it has the following disadvantages:
(i) It is more expensive.
(ii) It is more difficult to detect leaks.
(iii) It needs more care to keep the surrounding area free from grass, dust, etc.

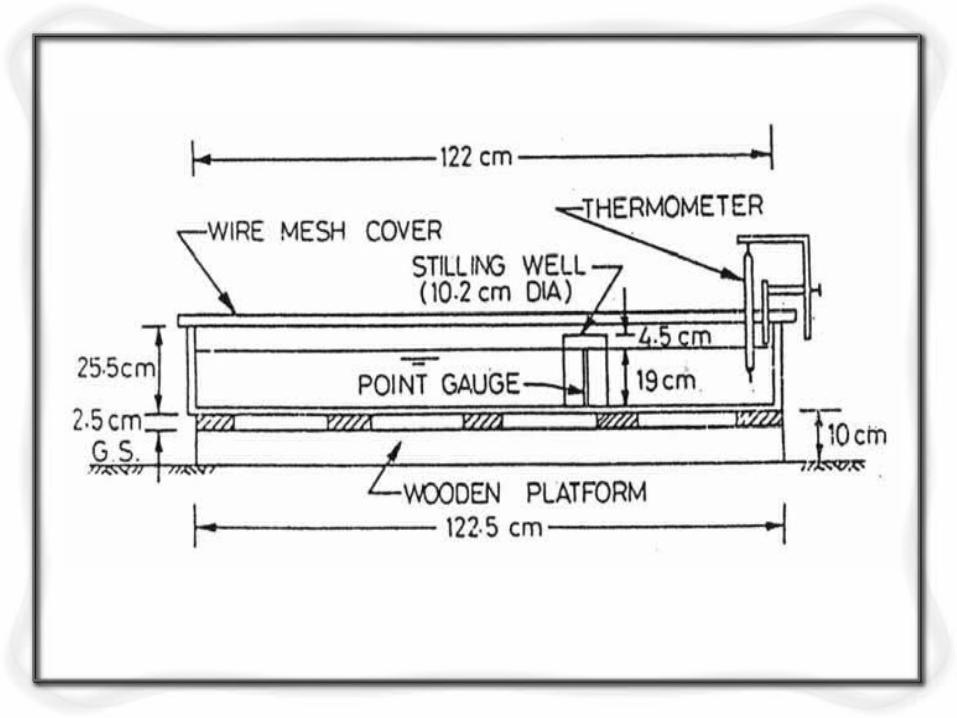
IS Standard Pan• modified form of the U.S. Class A
Evaporation Pan. The pan consists of a
• shallow vessel made of copper sheet of 0.9mm thickness, tinned inside and painted outside.
• The pan is 1.22m in diameter and 25.5 cm in depth.
• installed on a wooden grillage platform 10 cm above the ground surface.
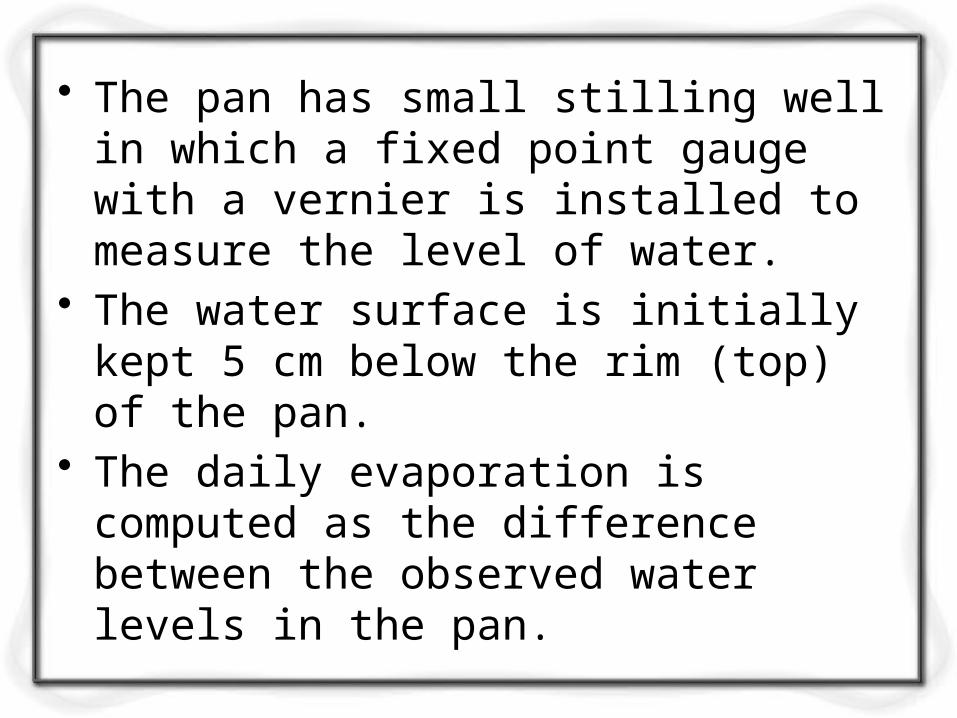
• The pan has small stilling well in which a fixed point gauge with a vernier is installed to measure the level of water.
• The water surface is initially kept 5 cm below the rim (top) of the pan.
• The daily evaporation is computed as the difference between the observed water levels in the pan.
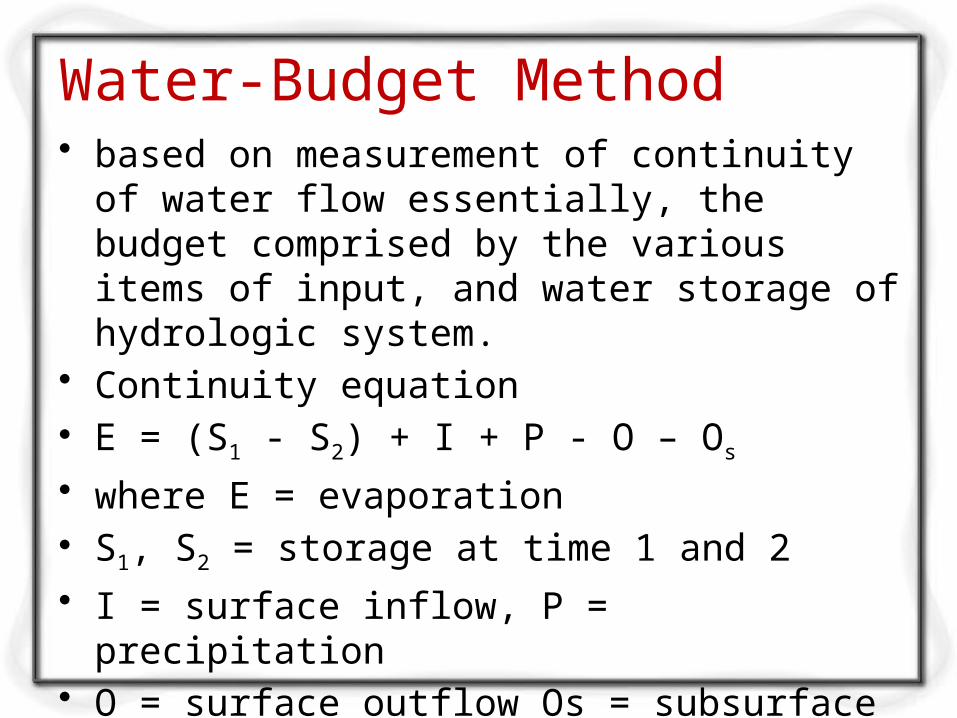
Water-Budget Method• based on measurement of continuity of
water flow essentially, the budget comprised by the various items of input, and water storage of hydrologic system.
• Continuity equation• E = (S1 - S2) + I + P - O – Os
• where E = evaporation• S1, S2 = storage at time 1 and 2• I = surface inflow, P = precipitation• O = surface outflow Os = subsurface
seepage (most difficult to evaluate)
Advantage
• This method is simple in concept.
Disadvantage
• This method is difficult to do so accurately because of the effects of errors in measuring
various items involved in the water balance.
Energy Budget Method• it deals with the continuity of energy
flow instead of water flow. Use Continuity equation in energy units
• Qn – Qh - Qe = Qθ - Qv
• where Qn = net radiation absorbed by water body
• Qh = sensible heat transfer to the atmosphere
• Qe = energy used for evaporation
• Qθ = increased in energy stored in water body
• Qv = advected energy (net energy content of inflow and outflow elements).
Advantage• It has increasing application to
special studies.
Disadvantage• It involves a great deal of
instrumentation.• It cannot readily be used without
much data.
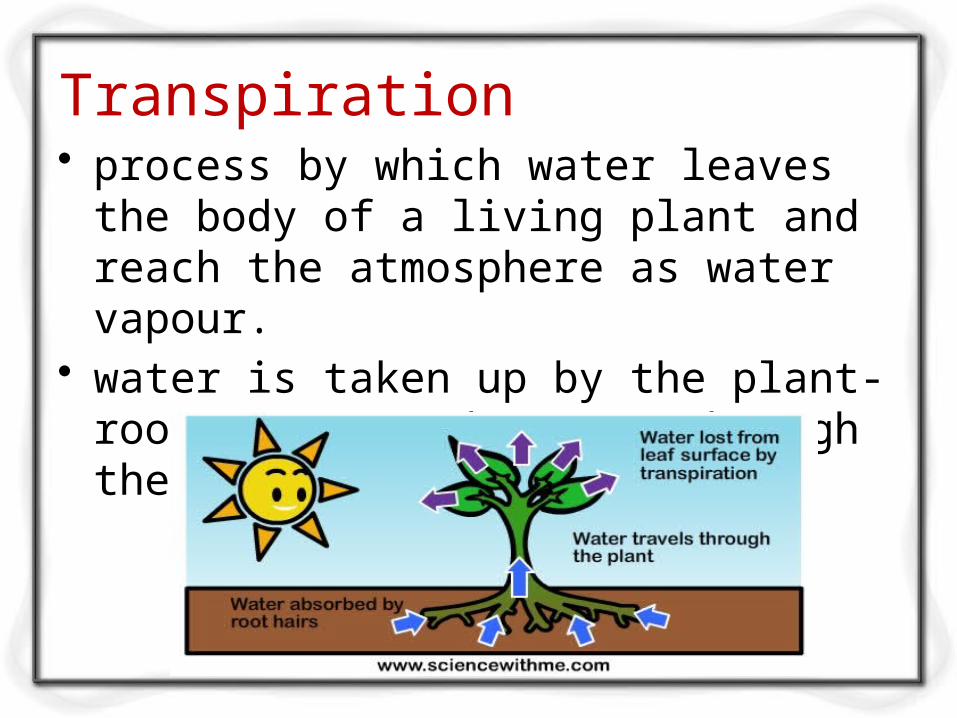
Transpiration• process by which water leaves the
body of a living plant and reach the atmosphere as water vapour.
• water is taken up by the plant-root system and escape through the leaves.
Factors affecting transpiration1. atmospheric vapour pressure2. temperature3. wind4. light intensity5. characteristics of plant
- plant type (- shallow rooted species- deep rooted species).
- available water .• - density of vegetative cover.
Measurement Phytometer method• Practical method for measuring
transpiration.• It is a large vessel filled with soil in
which one or more plants are rooted. • The soil surface is sealed to prevent
evaporation. • The only escape of moisture is by
transpiration• which can be determined by weighing
the plant and container at desired intervals
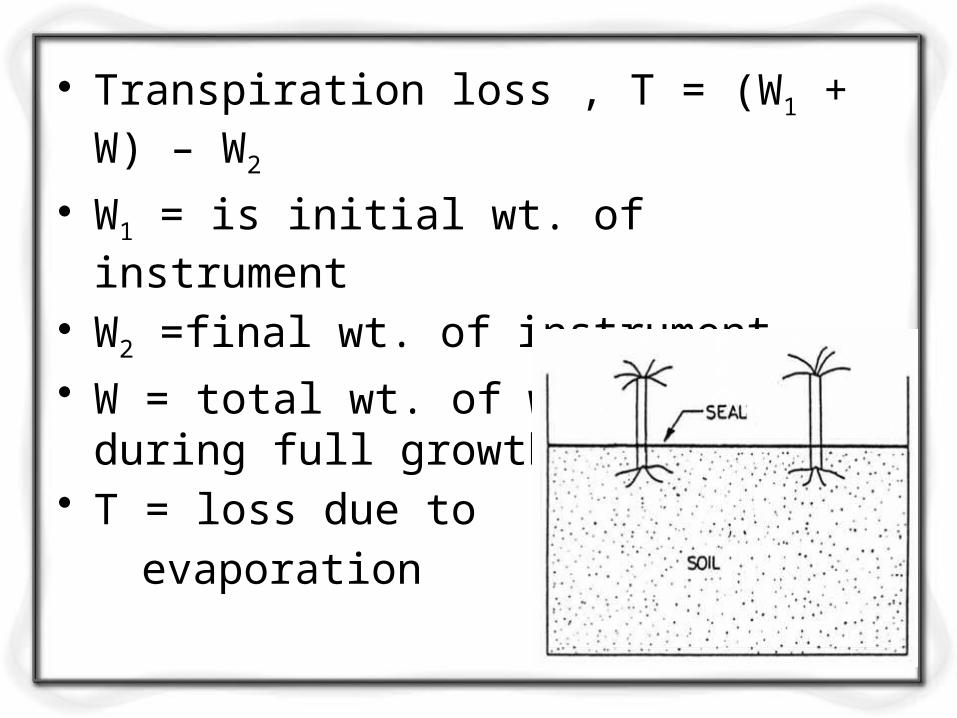
• Transpiration loss , T = (W1 + W) – W2
• W1 = is initial wt. of instrument
• W2 =final wt. of instrument• W = total wt. of water added during
full growth of plant• T = loss due to
evaporation
Transpiration ratio
• T.R. = (Total mass of water transpired by plant during full growth)/ mss of dry matter produced
• Varies with climate and region
Evapotranspiration
• sum of the amount of water transpired by plants during the growth process and that amount that is evaporated from soil and vegetation in the domain occupied by the growing crop.
• ET is normally expressed in mm/day.
Factors that affect Evapotranspiration
Weather parameters
Crop Characteristics
Management and Environmental aspects are factors affecting ET
Weather Parameters: The principal weather conditions affecting Evapotranspiration are:
Radiation
Air temperature
Humidity and
Wind speed.
Crop characteristics that affect ET :Crop TypeVariety of CropDevelopment StageCrop HeightCrop RoughnessGround CoverCrop Rooting Depth
Management and Environmental Factors :Factors such as soil salinity, Poor land fertility, Limited application of fertilizers, Absence of control of diseases
and Pests and poor soil management May limit the crop development
and reduce soil Evapotranspiration.
Determination of ETEvapotranspiration is not easy to
measure. Specific devices and accurate
measurements of various physical parameters or the soil water balance in lysimeters are required to determine ET.
The methods are expensive, demanding and used for research purposes.
They remain important for evaluating ET estimates obtained by more indirect methods.
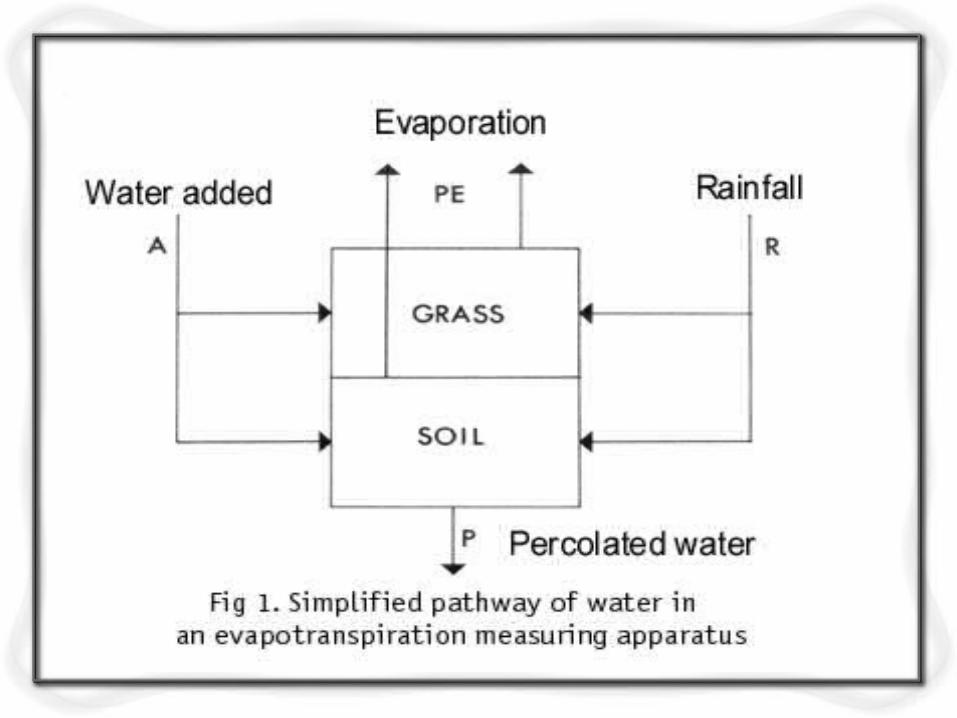
Water Balance MethodThe Water Balance or Budget Method is a
measurement of continuity of flow of water.
This method consists of drawing up a balance sheet of all the water entering and leaving a particular catchment or drainage basin.
The water balance equation can be written as:
ET = I + P – RO – DP + CR + SF + SW
Where: I is Irrigation, P is rainfall, RO is surface runoff, DP is deep percolation, CR is capillary rise, SF and SW are change in sub-surface flow and change in soil water content respectively
Lysimeter MethodA water tight tank of cylindrical shape
having dia about 2 m and depth about 3 m is placed vertically in ground.
The tank is filled with sample soil.Bottom of the tank consists of sand layer
and a pan for collecting surplus water.The consumptive use of water is measured
by the amount of water required for the satisfactory growth of plants with in tank.
Cu = Wa - Wd (Cu = consumptive use, Wa = water applied, Wd = Water drained off)
Field experimental methodSome fields are selected for expt.The quantity of water is applied in
such a way that it is sufficient for satisfactory growth of crops.
There should be no percolation or deep runoff.
If there is any runoff it should be measured and deducted from the total quantity of water applied.
Soil moisture studySeveral plots of land are selected where
irrigation water is to be supplied. The soil samples are taken from diff
depths at the root zone of the plants before and after irrigation.
Then water contents of the soil samples are determined by laboratory tests.
The depth of water removed from soil determined by Dr = pwd/ 100
(Dr= depth of water removed in m, p = % of water content, w = sp. Gr. Of soil, d= depth of soil in m)
The total quantity of water removed in 30 days period is calculated.
Then a curve of water consumption versus time is prepared.
From this curve the water consumption for any period can be calculated.
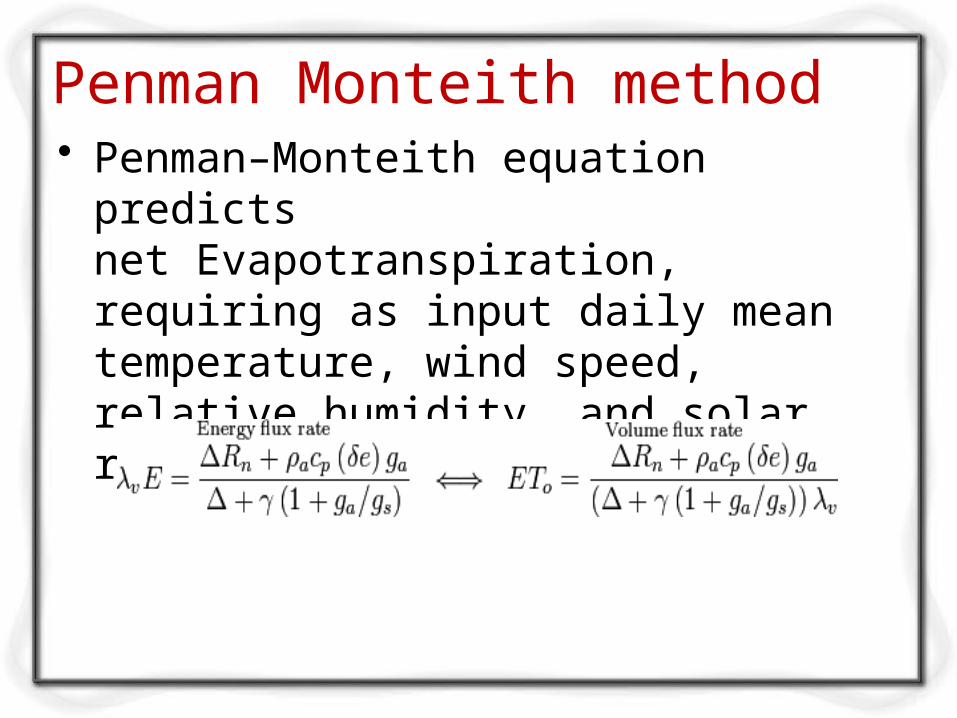
Penman Monteith method• Penman–Monteith equation predicts
net Evapotranspiration, requiring as input daily mean temperature, wind speed, relative humidity, and solar radiation.
• λv = Latent heat of vaporization. Energy required per unit mass of water vaporized.
• Lv = Volumetric latent heat of vaporization. Energy required per water volume vaporized. (Lv = 2453 MJ m-3)
• E = Mass water Evapotranspiration rate (g s-1 m-2)
• ETo = Water volume evapotranspired (m3 s-1 m-2)
• Δ = Rate of change of saturation specific humidity with air temperature. (Pa K-1)
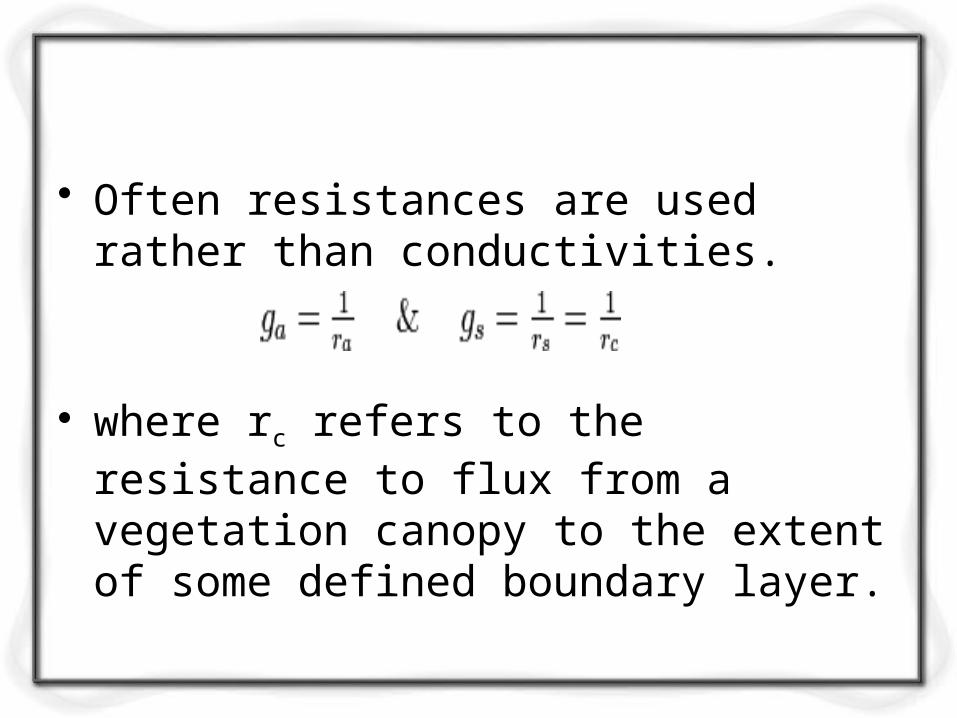
• Often resistances are used rather than conductivities.
• where rc refers to the resistance to flux from a vegetation canopy to the extent of some defined boundary layer.
• Rn = Net irradiance (W m-2), the external source of energy flux
• cp = Specific heat capacity of air (J kg-1 K-1)
• ρa = dry air density (kg m-3)• δe = vapour pressure deficit,
or specific humidity (Pa)• ga = Conductivity of air, atmospheric
conductance (m s-1)• gs = Conductivity of stoma, surface
conductance (m s-1)• γ = Psychrometric constant (γ ≈ 66 Pa
K-1)

Infiltration• is the process by which water on the
ground surface enters the soil.• Infiltration rate in soil science is a
measure of the rate at which soil is able to absorb rainfall or irrigation. It is measured in inches per hour or millimetres per hour. The rate decreases as the soil becomes saturated. If the precipitation rate exceeds the infiltration rate, runoff will usually occur unless there is some physical barrier.
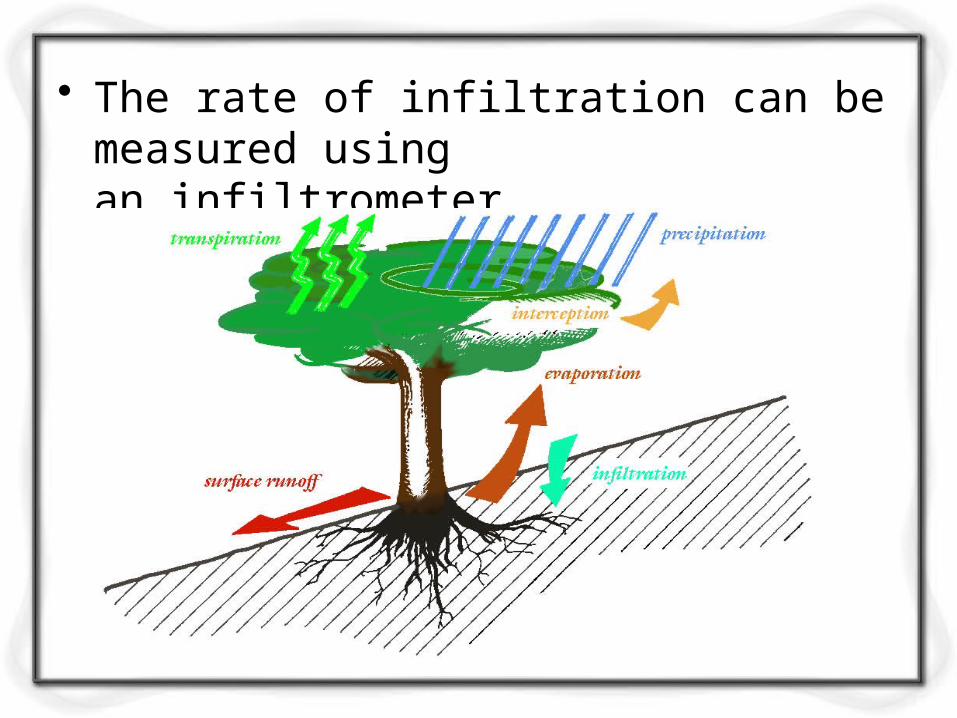
• The rate of infiltration can be measured using an infiltrometer.
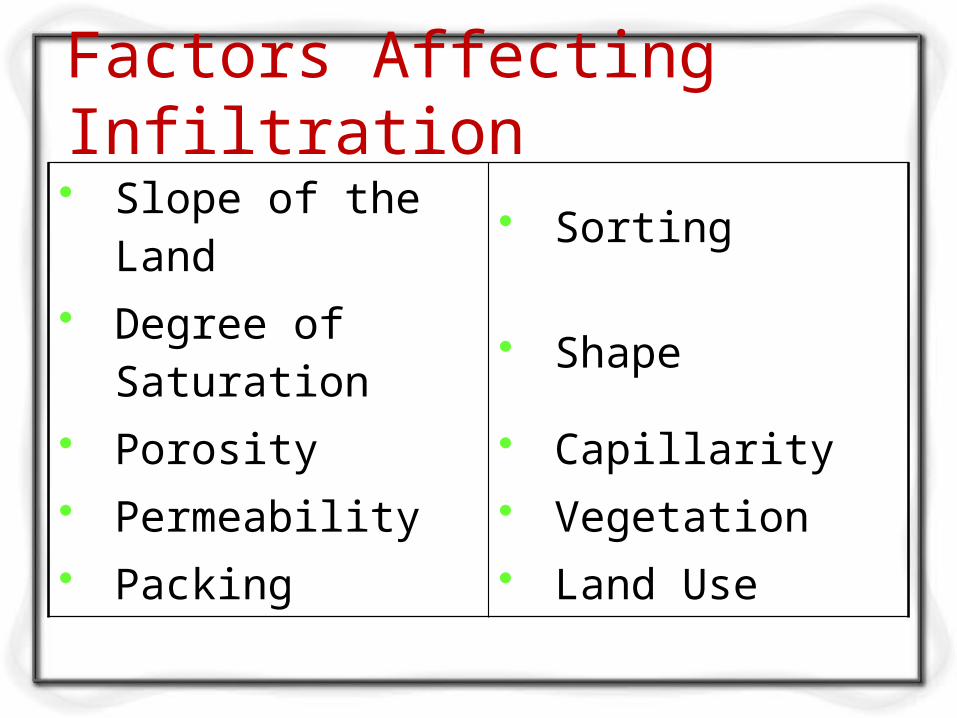
Factors Affecting Infiltration• Slope of the
Land• Sorting
• Degree of Saturation
• Shape
• Porosity • Capillarity• Permeability • Vegetation• Packing • Land Use
Infiltration indices• The two commonly used infiltration
indices are the following:
ϕ – index
W – index
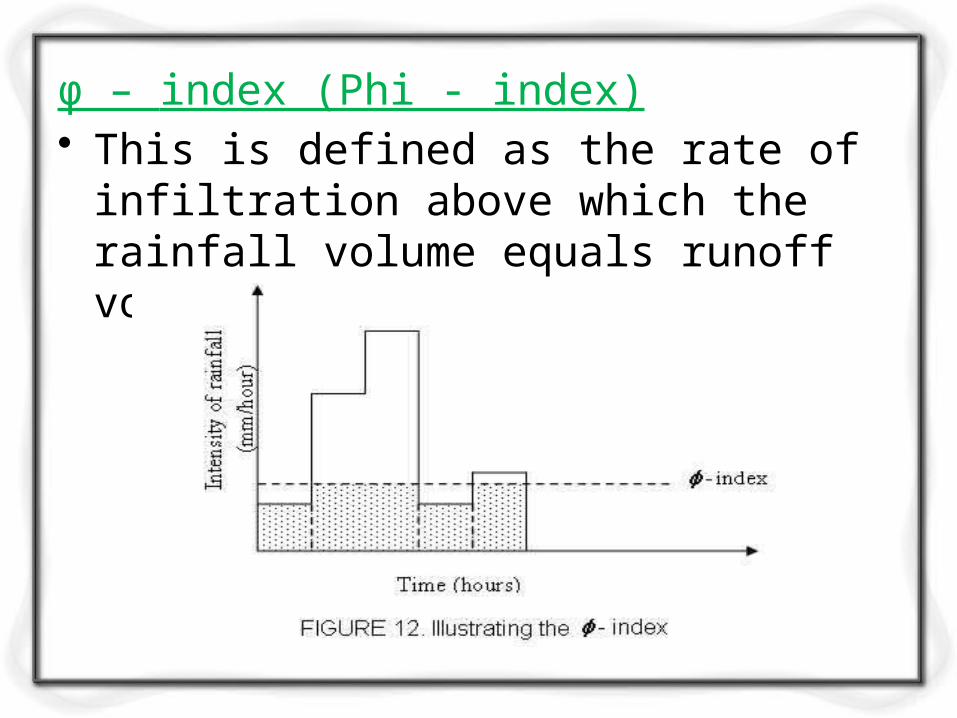
ϕ – index (Phi - index)• This is defined as the rate of
infiltration above which the rainfall volume equals runoff volume
• ϕ – index = precipitation – surface runoff
• ϕ – index = P – Q• The value of ϕ – index can be derived
from the rainfall hyetograph and the resulting surface runoff volume.
• ϕ – index can be determined for each storm for which the surface runoff volume has been measured.
• ϕ – index = (total infiltration during period of rainfall excess) / period of rainfall excess

W – index • Is the average rate of infiltration
during the time when the rainfall intensity exceeds the infiltration rate.
W – index = (P-Q-S)/tr
P = total precipitation (cm)Q = total surface runoff (cm)S = depression and interception losses
(cm)tr = duration of rainfall (hr)
• W – index is more accurate than ϕ – index because it excludes the interception and depression losses which are considered as a part of infiltration.
• W – index is always less than ϕ – index.
• Because it is difficult to estimate depression and interception losses.
• W – index not generally used in practice.
• W min – index
• Minimum rate of infiltration when a uniform stage after stabilization is attained.
• W min index = ϕ – index after it is stabilized
= Kϕ – index, where K is always less than 1.

Measurement of infiltration
• Infiltration capacity of soil can be measured in field by conducting controlled expt. using infiltrometers.
• Two types of infiltrometers are commonly used
1. Flooding type 2. Rainfall simulator type

Flooding type infiltrometerSimple infiltrometer • metal cylinder of 25 to 30 cm dia and
50 to 60 cm length, open at both ends.
• Cylinder hammer in ground and 10 cm length projects above the ground.
• top surface of soil inside ring is protected by placing a perforated by placing a perforated metallic dish over it.
• water poured into top part of a depth 5 cm and pointer is set to mark.
• As infiltration takes place, water level goes down.
• water maintained by adding water.• readings are taken at regular time
interval to determine the rate and amount of infiltration.
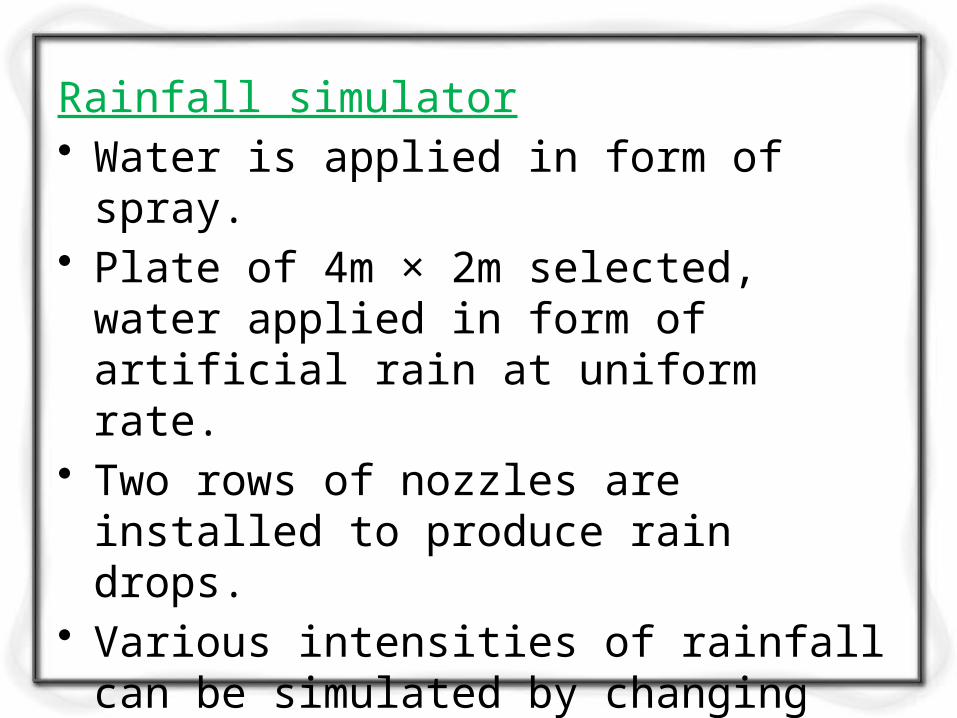
Rainfall simulator• Water is applied in form of spray.• Plate of 4m × 2m selected, water
applied in form of artificial rain at uniform rate.
• Two rows of nozzles are installed to produce rain drops.
• Various intensities of rainfall can be simulated by changing nozzles opening.
• Expt. Conducted under controlled conditions with various combinations of intensities, durations and surface runoff.
Infiltration = Rainfall – surface runoff• All terms expressed as depth of
water over the plot or as the volume of water.
• Infiltration determined from total infiltration depth and duration of expt.
Horton’s equation• Named after the same Robert E.
Horton. • Horton's equation is another viable
option when measuring ground infiltration rates or volumes.
• It is an empirical formula that says that infiltration starts at a constant rate, f0, and is decreasing exponentially with time, t.
• After some time when the soil saturation level reaches a certain value, the rate of infiltration will level off to the rate fc.
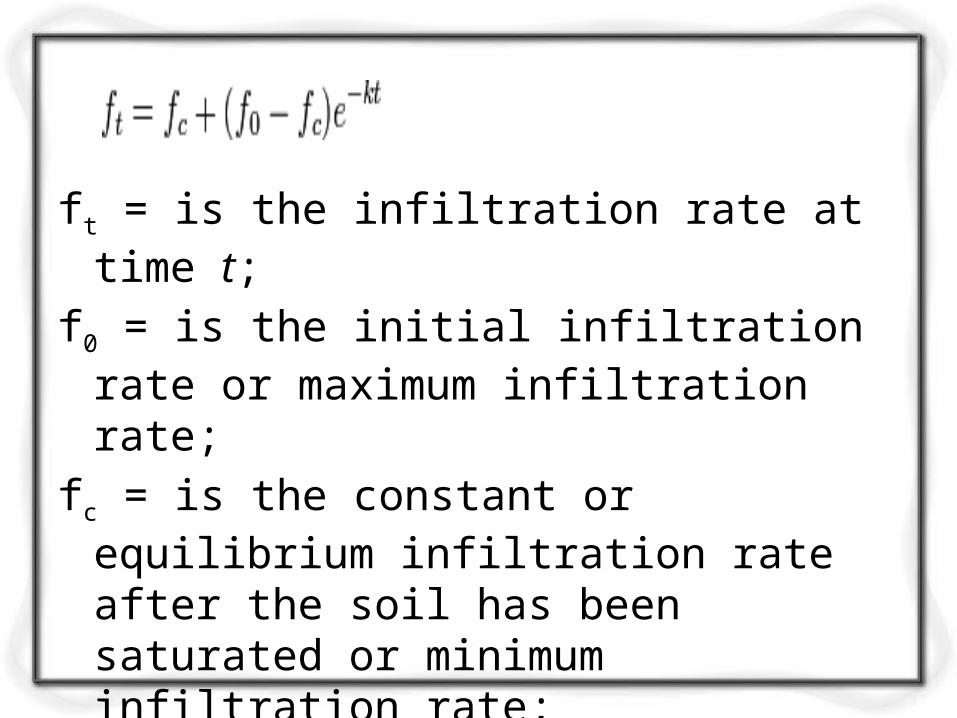
ft = is the infiltration rate at time t;
f0 = is the initial infiltration rate or maximum infiltration rate;
fc = is the constant or equilibrium infiltration rate after the soil has been saturated or minimum infiltration rate;
k= is the decay constant specific to the soil.
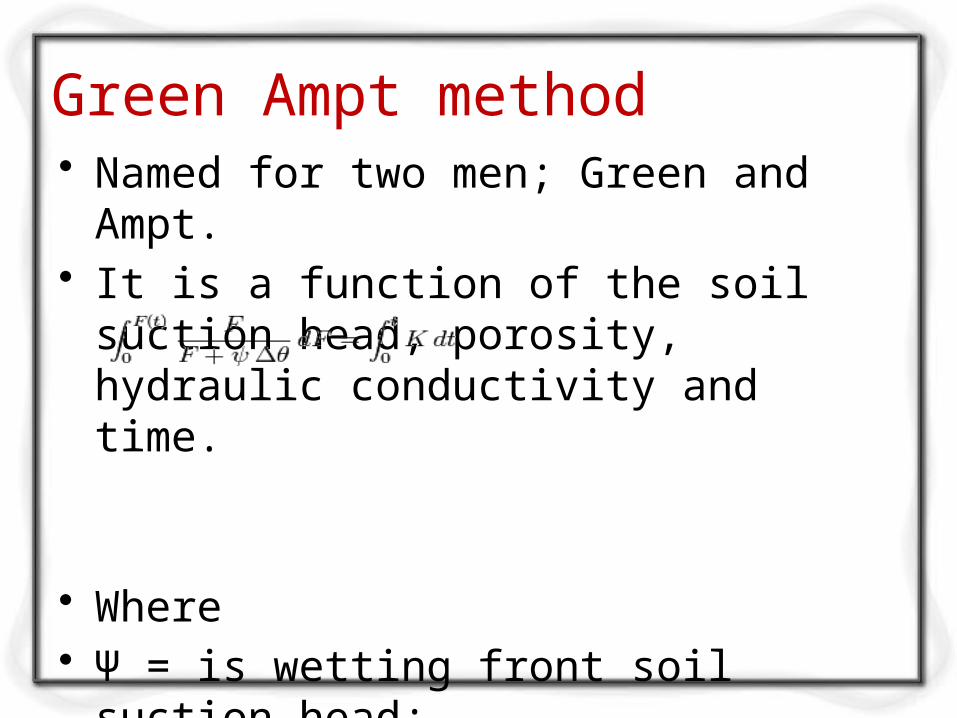
Green Ampt method• Named for two men; Green and
Ampt. • It is a function of the soil suction
head, porosity, hydraulic conductivity and time.
• Where• Ψ = is wetting front soil suction
head; • θ = is water content; • K= is Hydraulic conductivity; • F= is the total volume already
infiltrated.
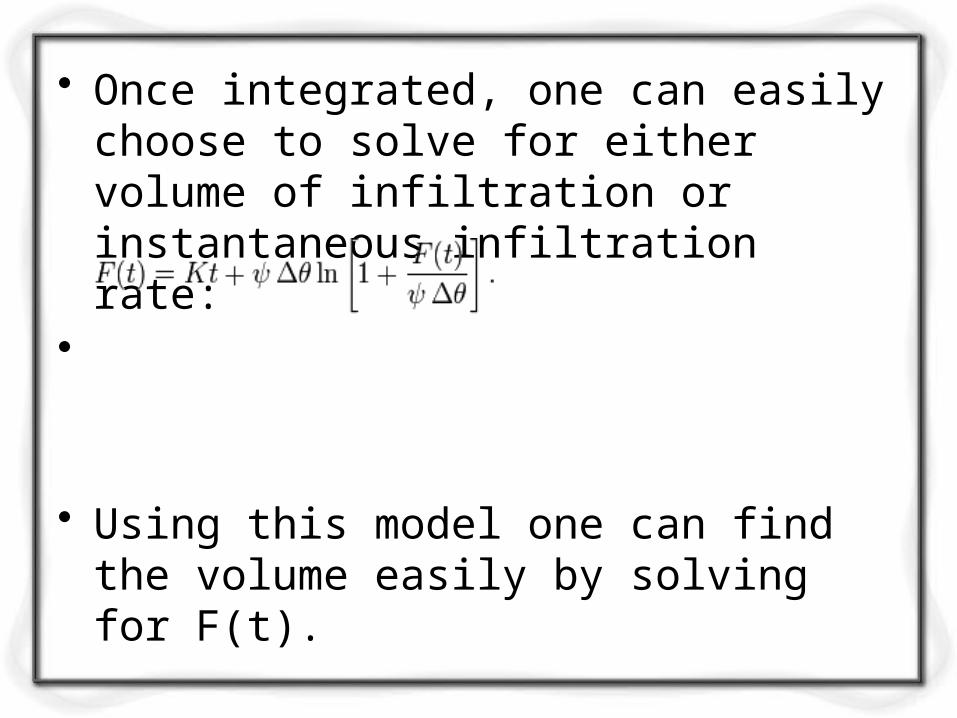
• Once integrated, one can easily choose to solve for either volume of infiltration or instantaneous infiltration rate:
•
• Using this model one can find the volume easily by solving for F(t).
• However the variable being solved for is in the equation itself so when solving for this one must set the variable in question to converge on zero, or another appropriate constant.
• The only note on using this formula is that one must assume that , the water head or the depth of ponded water above the surface, is negligible.
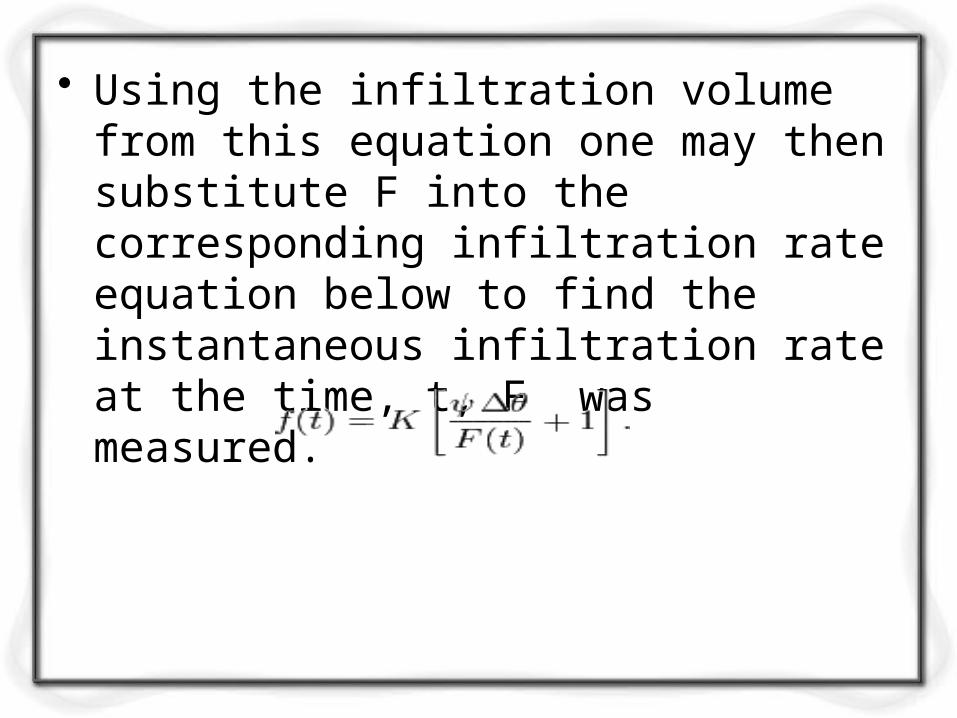
• Using the infiltration volume from this equation one may then substitute F into the corresponding infiltration rate equation below to find the instantaneous infiltration rate at the time, t, F was measured.