Interplay of superconductivity and magnetism in Ba1 ...
124
Dissertation zur Erlangung des Doktorgrades der Fakultät für Chemie und Pharmazie der Ludwig-Maximilians-Universität München Interplay of superconductivity and magnetism in Ba 1-x K x Fe 2 As 2 and its potential as wire material Josef Erwin Wiesenmayer aus Timişoara, Rumänien 2015
Transcript of Interplay of superconductivity and magnetism in Ba1 ...
Dissertation zur Erlangung des Doktorgrades der Fakultät für Chemie und Pharmazie
der Ludwig-Maximilians-Universität München
Interplay of superconductivity and magnetism in Ba1-xKxFe2As2
and its potential as wire material
Josef Erwin Wiesenmayer aus
Timişoara, Rumänien
2015
Erklärung Diese Dissertation wurde im Sinne von § 7 der Promotionsordnung vom 28. November 2011 von Herrn Prof. Dr. Dirk Johrendt betreut. Eidesstattliche Versicherung Diese Dissertation wurde eigenständig und ohne unerlaubte Hilfe erarbeitet. München, der 09.06.2015
Erwin Wiesenmayer
Dissertation eingereicht am 09.06.2015 1. Gutachter: Prof. Dr. Dirk Johrendt 2. Gutachter: Prof. Dr. Bettina Valeska Lotsch Mündliche Prüfung am 07.07.2015

Pentru voi
Danksagung
Ich danke besonders Herrn Prof. Dr. Johrendt für die freundliche Aufnahme in seinen
Arbeitskreis, die Überlassung des interessanten und spannenden Themas und die
hervorragende Betreuung während dieser Doktorarbeit.
Frau Prof. Dr. Lotsch möchte ich herzlich für die Übernahme des Zweitgutachtens
danken.
Prof. Dr. Böttcher, Prof. Dr. Karaghiosoff, PD Dr. Minar und Prof. Dr. Schnick danke
ich für ihre Bereitschaft am Rigorosum teilzunehmen.
Mein Dank gilt ebenso allen AK-Mitgliedern, ehemaligen und aktuellen: Daniel
Bichler, Andreas Binek, Lars Bulthaupt, Katharina Förg, Rainer Frankovsky, Gina
Friederichs, Franziska Hummel, Lola Lilensten, Catrin Löhnert, Katarina Marković,
Marianne Martin, Fabian Nitsche, Ursula Pachmayr, Simon Peschke, Roman Pobel,
Constantin von Schirnding, Anne Schulz, Juliane Stahl, Christine und Tobias Stürzer,
Marcus Tegel und Veronika Zinth für die Integration in die Gruppe, Hilfe und
Unterstützung bei unterschiedlichsten Problemen, die Einführung der
Geräte/Programme bzw. Durchführung verschiedenster Messungen und natürlich
auch für die Aktivitäten außerhalb der Arbeitszeit.
Marianne Martin und Marcus Tegel möchte ich danken für die Hilfe bei der
Einarbeitung in das Thema und die fortwährende Unterstützung während der
Bearbeitung des Themas.
Allen Praktikanten denen ich die Ehre hatte etwas über Festkörperchemie beibringen
zu dürfen möchte ich aus tiefstem Herzen danken. Danke an Andreas Binek, Ursula
Pachmayr, Katarina Marković, Markus Dunst, Derya Daniel Bessinger, Tobias
Sebastian Hermann und Stefan Marchner.
Meinen Kooperationspartner Dr. Hubertus Luetkens, Dr. Gwendolyn Pascua,
Dr. Rustem Kashanov, Dr. Zurab Shermadini, Dr. Zurab Guguchia, Dr. Andrea
Malagoli, Dr. Marcus Tegel, Dr. Jan Engelmann, Eike Ahrens, Dr. Pablo Docampo

und Dr. Fabian Hanusch danke ich für die interessanten Diskussionen, Anregungen,
die fortwährende Unterstützung und die lockere Gesprächsatmosphäre während und
nach der Zusammenarbeit.
Danke an meine Kollegen im Labor: Erik Flügel, Sebastian Junggeburth, Alberto von
Mankowski, Ida Pavlichenko, Anna Ranft, Christine und Tobias Stürzer, Katalin
Szendrei, Hongji Wang, für die Diskussions- und Hilfsbereitschaft während meiner
Doktorarbeit.
Herrn Hartl und Frau Obel möchte ich für die stets zügige und verlässliche
Durchführung der ICP-Messungen danken.
Christian Minke, Thomas Miller und Wolfgang Wünschheim danke ich für die stets
freundliche und kompetente Unterstützung bei EDX-Messungen, Computer-
technischem, Technischem und Administrativem.
Frau Dewald möchte ich für ihre stets freundliche und unterstützende Art danken.
Meinen Kollegen in den Arbeitskreisen Lotsch, Oeckler und Schnick danke ich für die
Hilfe die sie mir zukommen ließen und den Spaß den wir miteinander hatten.
Rainer Frankovsky und Florian Pucher möchte ich für ihre Hilfe beim Erlernen des
Umgangs mit den Gloveboxen danken.
Meinen Freunden danke ich für die schönen Zeiten innerhalb und außerhalb der
Universität!
Neben vielen anderen Dingen möchte ich Franziska Hummel herzlich für das
Korrekturlesen der Dissertation danken.
Meiner Familie möchte ich für die Unterstützung und den Rückhalt danken, den ich
mein ganzes Leben lang erfahren durfte.
"Viele kleine Leute,
an vielen kleinen Orten,
die viele kleine Schritte tun,
können das Gesicht der Erde verändern."
Sprichwort der Xhosa
Contents 1 Introduction .................................................................................................. 1
2 Methods ..................................................................................................... 10
2.1 Starting materials and synthesis conditions ................................................. 10
2.2 Powder diffraction ........................................................................................ 10
2.2.1 X-ray powder diffraction ........................................................................ 10
2.2.2 Rietveld refinements ............................................................................. 11
2.3 AC susceptibility .......................................................................................... 11
2.4 Induced coupled plasma atomic absorption spectroscopy (ICP-AAS) ........ 12
2.5 Transmission/Scanning electron microscopy (TEM/SEM) and energy
dispersive X-ray analysis (EDX) .................................................................. 12
2.6 Muon spin rotation and relaxation (µSR) ..................................................... 13
2.6.1 General considerations and properties ................................................. 14
2.6.2 Principles and configurations of the µSR experiments .......................... 15
2.7 Critical current density measurements ........................................................ 17
3 Microscopic coexistence of superconductivity and magnetism in
Ba1-xKxFe2As2 ............................................................................................ 19
3.1 Introduction .................................................................................................. 19
3.2 Synthesis ..................................................................................................... 21
3.3 Results and discussion ................................................................................ 23
3.3.1 AC susceptibility .................................................................................... 23
3.3.2 Muon spin rotation and relaxation ......................................................... 24
3.4 Conclusion ................................................................................................... 29
4 Short-range magnetic order in Ba1-xKxFe2As2 ........................................... 30
4.1 Introduction .................................................................................................. 30
4.2 Synthesis ..................................................................................................... 31
4.3 Results and discussion ................................................................................ 32
4.3.1 Susceptibility ......................................................................................... 32
4.3.2 Moun spin rotation and relaxation ......................................................... 33
4.4 Conclusion ................................................................................................... 38
5 Rise of a new magnetic phase in Ba0.8K0.2Fe2As2 ..................................... 40
5.1 Introduction .................................................................................................. 40
5.2 Synthesis ..................................................................................................... 41
5.3 Results and discussion ................................................................................ 42
5.3.1 AC susceptibility .................................................................................... 42
5.3.2 Muon spin rotation and relaxation ......................................................... 43
5.4 Conclusion ................................................................................................... 48
6 Exploring the potential of Ba0.6K0.4Fe2As2 wires and tapes ....................... 49
6.1 Motivation .................................................................................................... 49
6.2 Powder synthesis and characterization ....................................................... 50
6.3 Ba0.6K0.4Fe2As2 wires and tapes .................................................................. 53
6.3.1 The powder in tube method .................................................................. 53
6.3.2 Properties of the wires and tapes .......................................................... 55
6.4 Discussion ................................................................................................... 65
7 Optimizing the synthesis process of Ba1-xKxFe2As2 ................................... 67
7.1 Motivation .................................................................................................... 67
7.2 Synthetic difficulties ..................................................................................... 67
7.3 Element-based synthesis ............................................................................ 70
7.4 Synthesis via mechanical alloying of ternary percursors ............................. 72
7.4.1 Precursor synthesis .............................................................................. 73
7.4.1.1 BaFe2As2 ........................................................................................... 73
7.4.1.2 KFe2As2 ............................................................................................. 74
7.4.2 Mechanical alloying ............................................................................... 75
7.4.2.1 Overview ............................................................................................ 75
7.4.2.2 Experimental details .......................................................................... 76
7.4.2.3 Results of milling process A ............................................................... 77
7.4.2.4 Results of milling process B ............................................................... 80
7.5 Discussion ................................................................................................... 84
8 Summary and outlook ................................................................................ 87
9 Appendix .................................................................................................... 93
10 Abbreviations ............................................................................................. 96
11 Scientific contributions ............................................................................. 100
12 Bibliography ............................................................................................. 102

1 Introduction
1
1 Introduction
One of the major challenges that humanity is facing in the 21st century is climate
change. It is caused by the excessive emission of CO2 because of the usage of fossil
energy sources like oil, natural gas, and coal[1]. They are still our number one source
of energy because they are well accessible, easily transportable and cheap in
production. Therefore, the CO2 level in the atmosphere increased by 40 % compared
to pre-industrial times[2]. If this process continues, the earth will further warm up and
the results may be devastating. Heat waves and droughts on one side and heavy
precipitation and the intensification of hurricanes on the other side are just some of
the events that are at least likely to occur with higher frequencies in the 21st century
due to global warming[2].
However, if the biggest industrial nations work together and reform their energy
policy, the worst case scenario can be averted. Two key features of this reform are
the efficient use of energy and the production of renewable, CO2-free energy. In both
segments new high performance materials like high-temperature superconductors
can play an important role for example in the development of wind turbines utilized
for conversion of wind energy to electricity. They are an established way of producing
"green" energy. In order to optimize the efficiency of these turbines new high tech
generators using high-temperature superconductors like MgB2[3] could lead to a
noticeable weight and size reduction of the turbines and increase their efficiency to
over 95 %[4] already including the energy used for the cooling of the superconductor.
Superconductivity is known since its discovery in 1911 in Hg (cooled by liquid helium)
by Heike Kamerlingh Onnes[5-7]. Below a critical temperature (Tc) the resistance
drops to an infinitely small value and the material becomes an ideal diamagnet. This
means that if a magnetic field Hext is applied below Tc, a current is induced at the
superconductor's surface creating a magnetic field expelling Hext from the inside. This
is called the Meissner effect. By raising the external field, the current on the surface
of the superconductor also rises until a critical field Hc is reached. At this point, the
magnetic flux either permeates the superconductor completely (type 1
superconductor) or penetrates the superconductor partially by the magnetic flux
1 Introduction
2
creating a vortex lattice (Shubnikov phase of a type 2 superconductor). The vortices
grow with increasing Hext until the external field completely penetrates the
superconductor. This field is called Hc2.
Because of these unique properties superconductors have been an intensively
investigated class of materials for more than one century now. During this time the
number of known superconducting materials grew steadily. First, superconductivity
was found in elements like Nb (Tc = 9.25 K)[8], then in alloys like the A15 compounds
Nb3Sn (Tc = 18.3 K)[9] and Nb3Ge (Tc = 23 K)[10], chevrel phases like PbMo6Se8
(Tc = 18 K)[11] and various superconducting cuprates like HgBa2Ca2Cu3O8+x
(Tc ≈ 133 K)[12]. Among the superconductors the last mentioned cuprates take a
special place, being the first and up to now only class to become superconducting
above the boiling point of nitrogen at 77 K. Unfortunately they exhibit a high
anisotropy and their processability is limited due to their ceramic character making it
hard to incorporate them in flexible materials. In 2001 superconductivity in MgB2 was
discovered[3]. It is up to now the superconductor with the highest Tc (39 K) that can
be explained by the BCS theory (see below). The last milestone in superconductor
research was achieved in 2008 when Kamihara et al. discovered that LaFeAsO1-xFx
becomes superconducting at a temperature of 26 K[13]. Iron compounds until then
weren't taken into consideration for superconductivity because of their magnetism.
Ferromagnetism was considered to be a knock-out criterion for superconductivity for
a long time[14]. As a consequence of the discovery of superconductivity in
LaFeAsO1-xFx soon other iron pnictides and chalcogenides were investigated
concerning their superconductivity and Tc in this class of materials was increased in a
short time up to 55 K in SmFeAsO1-xFx[15] and 56 K in Ca1-xNdxFeAsF[16]. In the
present work the focus lies on Ba1-xKxFe2As2, a type 2 superconducting iron
arsenide[17], which was also discovered in 2008.
The iron-arsenide superconductors can be classified by their chemical
stoichiometries. Ba1-xKxFe2As2 is a member of the 122[17] family, LaFeAsO1-xFx a
member of the 1111 family. However, the class of the superconducting iron arsenides
contains many more families like the 111[18], the 21311[19], the 32522[20], the 1038[21],
or the 1048[22] compounds.
1 Introduction
3
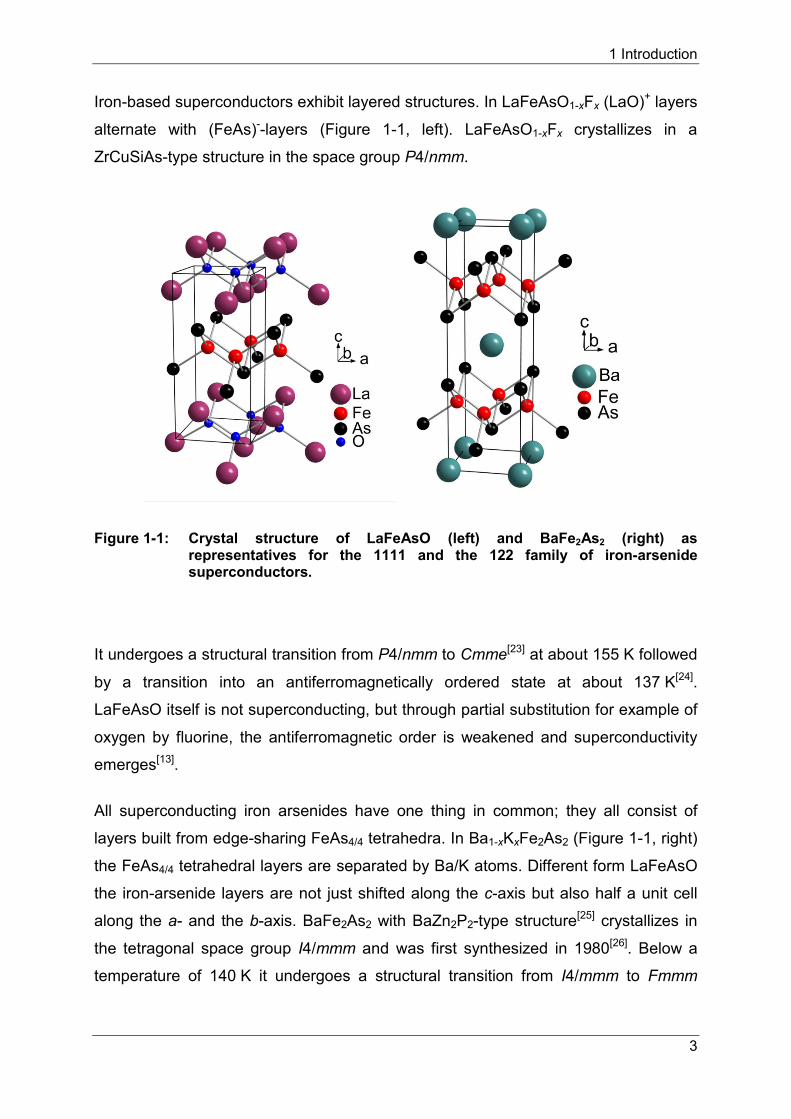
Iron-based superconductors exhibit layered structures. In LaFeAsO1-xFx (LaO)+ layers
alternate with (FeAs)--layers (Figure 1-1, left). LaFeAsO1-xFx crystallizes in a
ZrCuSiAs-type structure in the space group P4/nmm.
Figure 1-1: Crystal structure of LaFeAsO (left) and BaFe2As2 (right) as representatives for the 1111 and the 122 family of iron-arsenide superconductors.
It undergoes a structural transition from P4/nmm to Cmme[23] at about 155 K followed
by a transition into an antiferromagnetically ordered state at about 137 K[24].
LaFeAsO itself is not superconducting, but through partial substitution for example of
oxygen by fluorine, the antiferromagnetic order is weakened and superconductivity
emerges[13].
All superconducting iron arsenides have one thing in common; they all consist of
layers built from edge-sharing FeAs4/4 tetrahedra. In Ba1-xKxFe2As2 (Figure 1-1, right)
the FeAs4/4 tetrahedral layers are separated by Ba/K atoms. Different form LaFeAsO
the iron-arsenide layers are not just shifted along the c-axis but also half a unit cell
along the a- and the b-axis. BaFe2As2 with BaZn2P2-type structure[25] crystallizes in
the tetragonal space group I4/mmm and was first synthesized in 1980[26]. Below a
temperature of 140 K it undergoes a structural transition from I4/mmm to Fmmm
1 Introduction
4
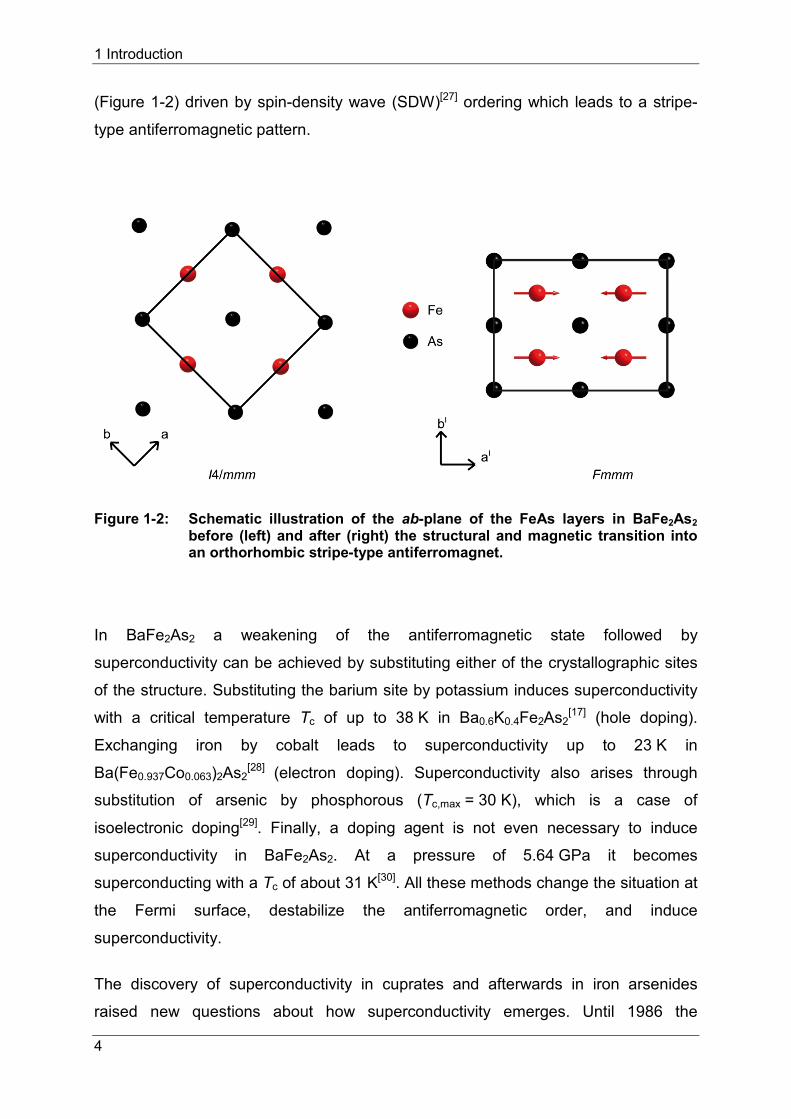
(Figure 1-2) driven by spin-density wave (SDW)[27] ordering which leads to a stripe-
type antiferromagnetic pattern.
Figure 1-2: Schematic illustration of the ab-plane of the FeAs layers in BaFe2As2 before (left) and after (right) the structural and magnetic transition into an orthorhombic stripe-type antiferromagnet.
In BaFe2As2 a weakening of the antiferromagnetic state followed by
superconductivity can be achieved by substituting either of the crystallographic sites
of the structure. Substituting the barium site by potassium induces superconductivity
with a critical temperature Tc of up to 38 K in Ba0.6K0.4Fe2As2[17] (hole doping).
Exchanging iron by cobalt leads to superconductivity up to 23 K in
Ba(Fe0.937Co0.063)2As2[28]
(electron doping). Superconductivity also arises through
substitution of arsenic by phosphorous (Tc,max = 30 K), which is a case of
isoelectronic doping[29]. Finally, a doping agent is not even necessary to induce
superconductivity in BaFe2As2. At a pressure of 5.64 GPa it becomes
superconducting with a Tc of about 31 K[30]. All these methods change the situation at
the Fermi surface, destabilize the antiferromagnetic order, and induce
superconductivity.
The discovery of superconductivity in cuprates and afterwards in iron arsenides
raised new questions about how superconductivity emerges. Until 1986 the
1 Introduction
5
mechanism by which superconductivity is induced was described by the BCS
theory[31-33] postulated by J. Bardeen, L. N. Cooper and J. R. Schrieffer in the 1950s.
According to this theory the emergence of superconductivity is mediated through
phonons (lattice vibrations) leading to a condensation of the conduction electrons into
Cooper pairs. Cooper pairs are bosons and therefore no longer bound to the Pauli
principle and can all occupy the same energetic state. Furthermore, as bosons they
underlie the Bose-Einstein statistics instead of the Fermi-Dirac statistics and because
of that cannot be scattered by the crystal lattice allowing resistance free electrical
conductivity. The formation of all Cooper pairs can be described quantum
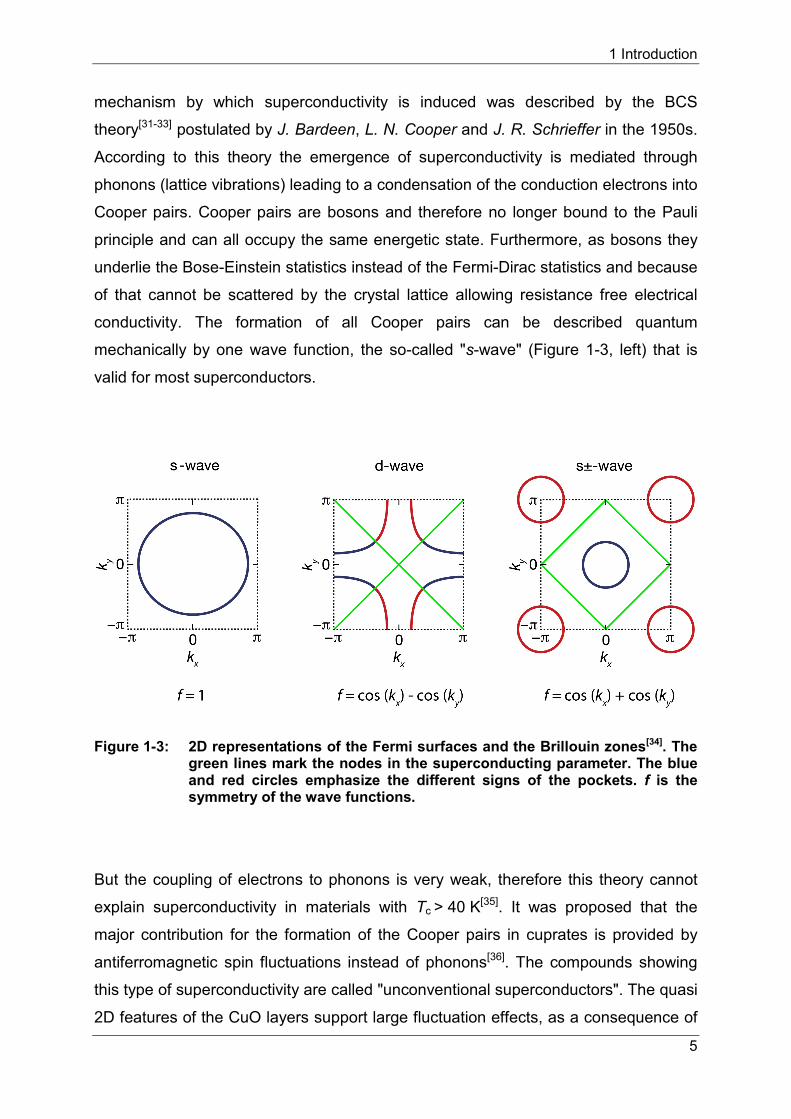
mechanically by one wave function, the so-called "s-wave" (Figure 1-3, left) that is
valid for most superconductors.
Figure 1-3: 2D representations of the Fermi surfaces and the Brillouin zones[34]. The green lines mark the nodes in the superconducting parameter. The blue and red circles emphasize the different signs of the pockets. f is the symmetry of the wave functions.
But the coupling of electrons to phonons is very weak, therefore this theory cannot
explain superconductivity in materials with Tc > 40 K[35]. It was proposed that the
major contribution for the formation of the Cooper pairs in cuprates is provided by
antiferromagnetic spin fluctuations instead of phonons[36]. The compounds showing
this type of superconductivity are called "unconventional superconductors". The quasi
2D features of the CuO layers support large fluctuation effects, as a consequence of
1 Introduction
6
the system having the tendency to develop long-range order[37]. In the parent
compounds the spins display a checkerboard-like antiferromagnetic order[38].
Through doping the magnetic order can be weakened, the Mott insulating state can
be overcome, and superconductivity emerges. The wave function of the Cooper pair
condensation has "d-wave" symmetry. The order parameter of the d-wave gap is of
(cos(kx) - cos(ky)) symmetry, requiring a sign change and nodes (Figure 1-3, middle).
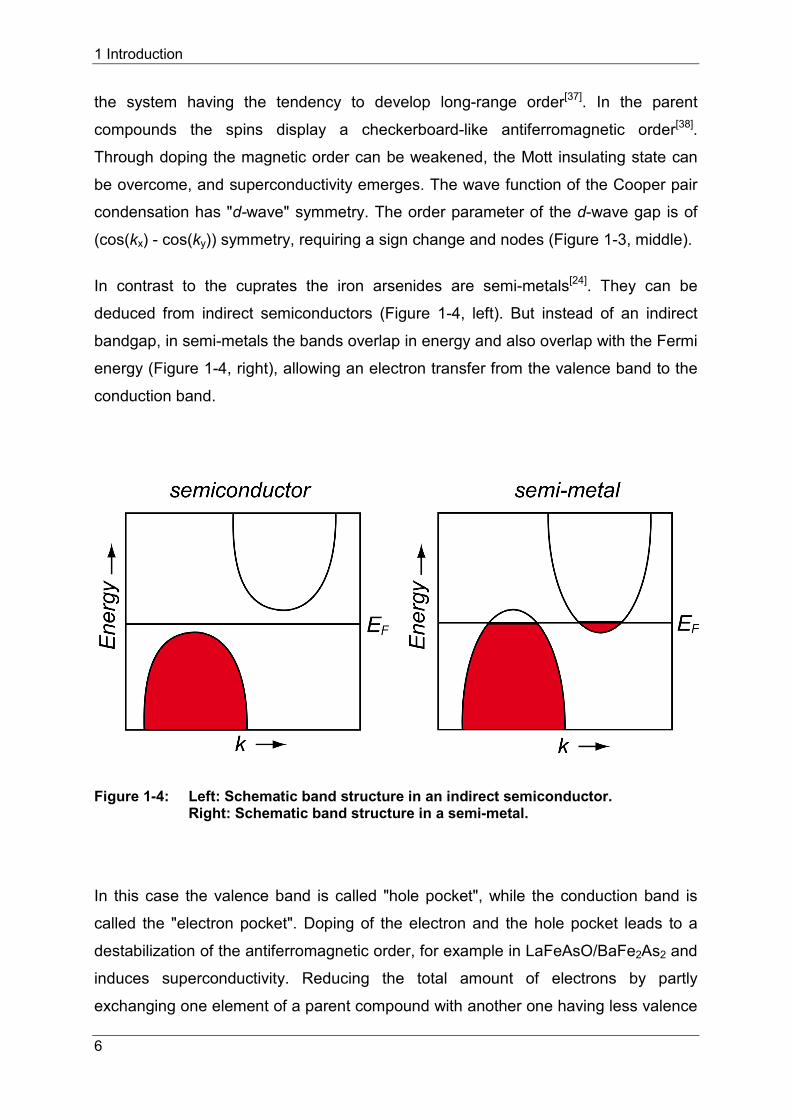
In contrast to the cuprates the iron arsenides are semi-metals[24]. They can be
deduced from indirect semiconductors (Figure 1-4, left). But instead of an indirect
bandgap, in semi-metals the bands overlap in energy and also overlap with the Fermi
energy (Figure 1-4, right), allowing an electron transfer from the valence band to the
conduction band.
Figure 1-4: Left: Schematic band structure in an indirect semiconductor. Right: Schematic band structure in a semi-metal.
In this case the valence band is called "hole pocket", while the conduction band is
called the "electron pocket". Doping of the electron and the hole pocket leads to a
destabilization of the antiferromagnetic order, for example in LaFeAsO/BaFe2As2 and
induces superconductivity. Reducing the total amount of electrons by partly
exchanging one element of a parent compound with another one having less valence
1 Introduction
7
electrons, as described for Ba1-xKxFe2As2, is called "hole doping". "Electron doping" is
the opposite. Thereby, an element with a higher number of valence electrons
replaces one in the parent compound, thus raising the number of electrons (as shown
for Ba(Fe1-xCox)2As2). Although both methods of doping can lead to
superconductivity, their effect on magnetism can be different[39]. Generally, in the
case of the iron arsenides the antiferromagnetism is a result of a spin-density wave
(SDW)[27]. Spin-density waves are incommensurate periodic modulations of electronic
spins. They cause an energy gap, lowering the total energy of the system and occur
in metals with low dimensionality and a high density of states at the Fermi surface.
Doping prevents the SDW from entering the commensurate ordered state
(antiferromagnetic ordering), while the low-energy fluctuations of the spin moments
persist. Spin-fluctuation mediated superconductivity requires a sign change in the
superconducting wave function, thus one expects d-wave symmetry (as in cuprates).
ARPES experiments on iron-based materials revealed nodeless superconductivity (s-
wave) on different sheets of the Fermi surface. The sign change occurs between
different sheets, which is then denoted as s±-wave[40] (Figure 1-3, right). This
scenario is generally accepted for the optimally doped Ba1-xKxFe2As2 (x = 0.4) as well
as for superconductivity in the underdoped area, between 0.14 ≤ x ≤ 0.4 of the phase
diagram (Figure 1-5), while for strongly hole-doped Ba1-xKxFe2As2 the wave function
transforms into a nodal d-wave[41]. But how superconductivity is induced and where
exactly the transition of the wave function occurs in these materials is still under
debate and has to be investigated further.
1 Introduction
8
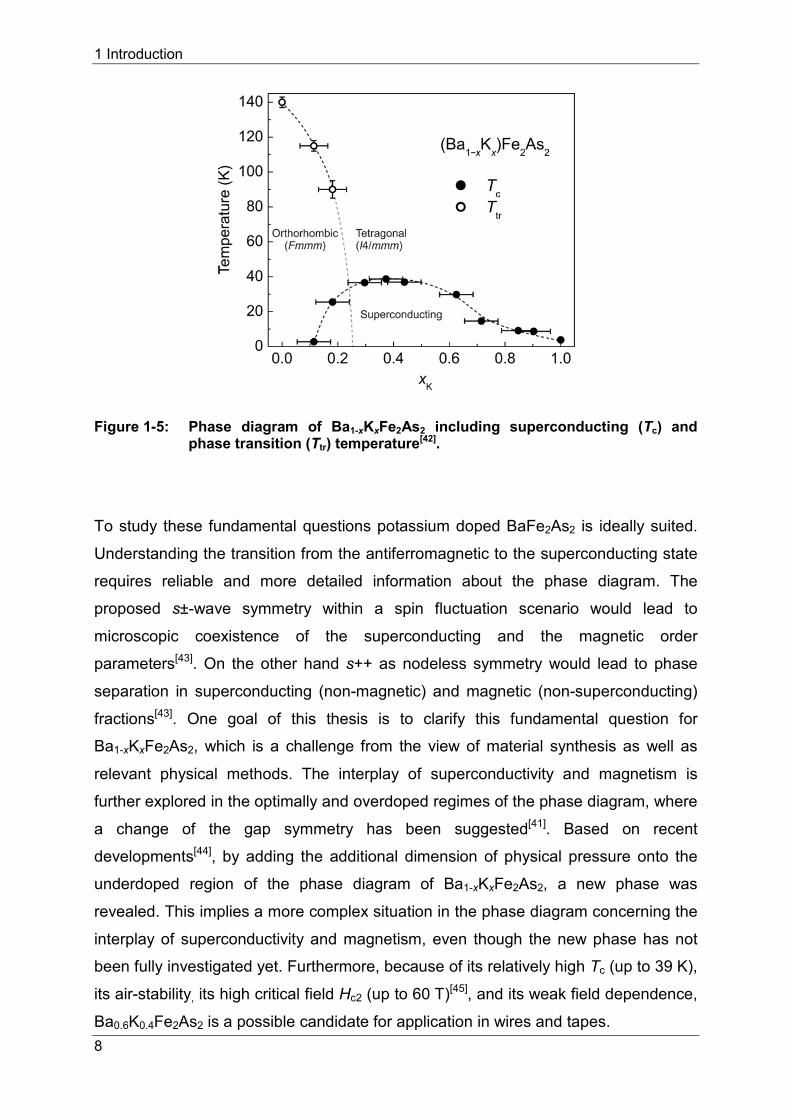
Figure 1-5: Phase diagram of Ba1-xKxFe2As2 including superconducting (Tc) and phase transition (Ttr) temperature[42].
To study these fundamental questions potassium doped BaFe2As2 is ideally suited.
Understanding the transition from the antiferromagnetic to the superconducting state
requires reliable and more detailed information about the phase diagram. The
proposed s±-wave symmetry within a spin fluctuation scenario would lead to
microscopic coexistence of the superconducting and the magnetic order
parameters[43]. On the other hand s++ as nodeless symmetry would lead to phase
separation in superconducting (non-magnetic) and magnetic (non-superconducting)
fractions[43]. One goal of this thesis is to clarify this fundamental question for
Ba1-xKxFe2As2, which is a challenge from the view of material synthesis as well as
relevant physical methods. The interplay of superconductivity and magnetism is
further explored in the optimally and overdoped regimes of the phase diagram, where
a change of the gap symmetry has been suggested[41]. Based on recent
developments[44], by adding the additional dimension of physical pressure onto the
underdoped region of the phase diagram of Ba1-xKxFe2As2, a new phase was
revealed. This implies a more complex situation in the phase diagram concerning the
interplay of superconductivity and magnetism, even though the new phase has not
been fully investigated yet. Furthermore, because of its relatively high Tc (up to 39 K),
its air-stability, its high critical field Hc2 (up to 60 T)[45], and its weak field dependence,
Ba0.6K0.4Fe2As2 is a possible candidate for application in wires and tapes.
1 Introduction
9
In the following chapters the interplay of magnetism and superconductivity in the
underdoped regime of Ba1-xKxFe2As2 is investigated by a combination of high-
resolution X-ray diffraction and µSR measurements on high-quality samples, proving
a microscopic coexistence of both features (see chapter 3).
These studies are extended to the optimally and overdoped regime showing the
evolution of the magnetism from a long-range antiferromagnetic order in the
underdoped region to an unexpected short-range order in optimally doped
Ba0.6K0.4Fe2As2 and up to Ba0.34K0.66Fe2As2, simultaneously exploring a possible
change in the superconducting wave function from s- to d-wave for x = 0.66 (see
chapter 4).
The rise of a new magnetic phase in underdoped Ba0.8K0.2Fe2As2 under pressure is
discovered and its interaction with superconductivity and the known magnetic phase
at ambient pressure are examined on pressure-dependent µSR experiments (see
chapter 5).
The experience obtained from these results is used to further explore a possible
application of Ba0.6K0.4Fe2As2 as a tape/wire material for a possible high field
application (see chapter 6).
To deliver sufficient material for the proper exploration of the properties two new
paths of synthesizing Ba1-xKxFe2As2 and especially Ba0.6K0.4Fe2As2 are investigated.
One is element based, the other one uses mechanical alloying of the ternary
compounds BaFe2As2 and KFe2As2 (see chapter 7).
2 Methods
10
2 Methods
2.1 Starting materials and synthesis conditions
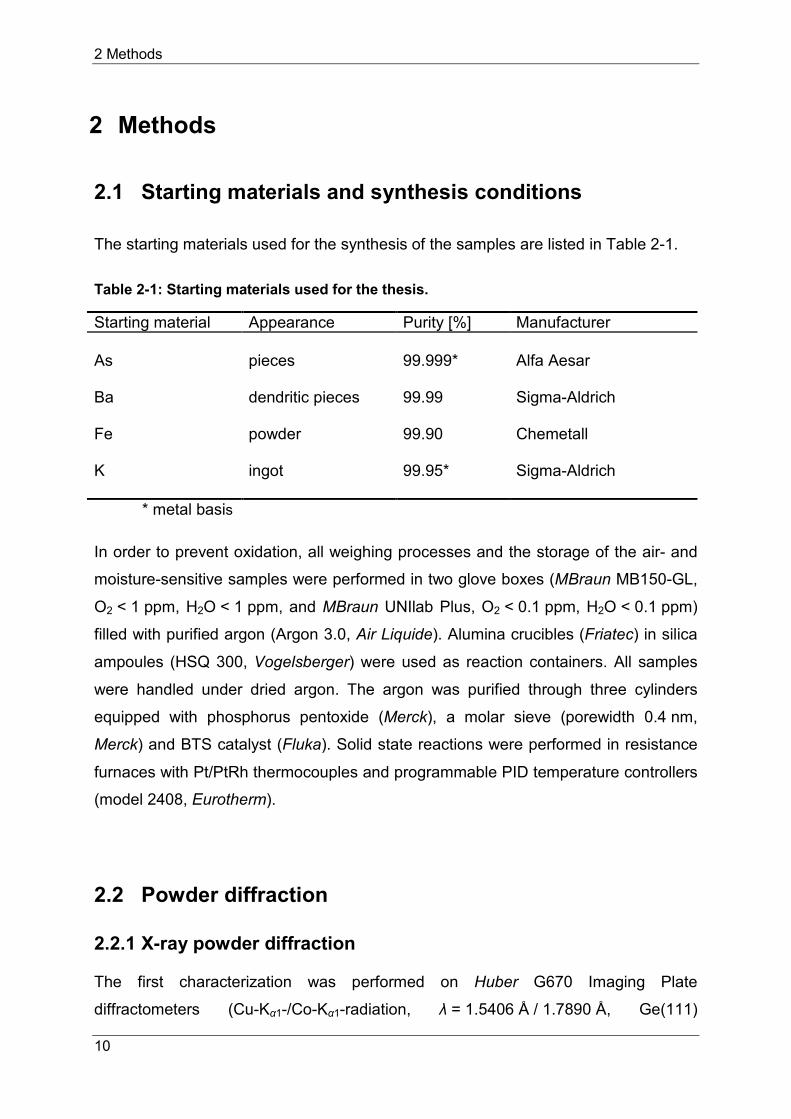
The starting materials used for the synthesis of the samples are listed in Table 2-1.
Table 2-1: Starting materials used for the thesis.
Starting material Appearance Purity [%] Manufacturer As
Ba Fe K
pieces
99.999*
Alfa Aesar
dendritic pieces
99.99
Sigma-Aldrich
powder 99.90 Chemetall ingot
99.95*
Sigma-Aldrich
* metal basis
In order to prevent oxidation, all weighing processes and the storage of the air- and
moisture-sensitive samples were performed in two glove boxes (MBraun MB150-GL,
O2 < 1 ppm, H2O < 1 ppm, and MBraun UNIlab Plus, O2 < 0.1 ppm, H2O < 0.1 ppm)
filled with purified argon (Argon 3.0, Air Liquide). Alumina crucibles (Friatec) in silica
ampoules (HSQ 300, Vogelsberger) were used as reaction containers. All samples
were handled under dried argon. The argon was purified through three cylinders
equipped with phosphorus pentoxide (Merck), a molar sieve (porewidth 0.4 nm,
Merck) and BTS catalyst (Fluka). Solid state reactions were performed in resistance
furnaces with Pt/PtRh thermocouples and programmable PID temperature controllers
(model 2408, Eurotherm).
2.2 Powder diffraction
2.2.1 X-ray powder diffraction
The first characterization was performed on Huber G670 Imaging Plate
diffractometers (Cu-Kα1-/Co-Kα1-radiation, λ = 1.5406 Å / 1.7890 Å, Ge(111)
2 Methods
11
monochromator, silicon as external standard, (Guinier geometry) oscillating flat
sample holder) or on a STOE STADI P (Mo-Kα1-radiation λ = 0.7107 Å Ge(111)
monochromator, silicon as external standard, rotating capillary (Debye-Scherrer
geometry), 0.3 outer diameter).
Low-temperature powder patterns between 300 K and 10 K were measured on the
Huber diffractometer with a closed-cycle helium cryostat model 22 CP provided by
CTI-CRYOGENICS. The temperature was controlled by a LAKESHORE-330-1
thermostat with a maximum deviation of about 0.1 K.
The gathered data were pre-processed with the program HConvert[34]. The programs
RAWDAT[46] and GRAPHICS[47] in combination with the search algorithm
"Search/Match", referring to the JCPDS-database[48], were used for the identification
and purity analysis of known phases. The program THEO[49] and the Pearson's
Crystal Data-database[50] were used to create powder patterns of JCPDS-unknown
phases.
2.2.2 Rietveld refinements
Using the TOPAS package[51] X-ray powder diffractograms were refined by the
Rietveld method. TOPAS generates reflection profiles by using the fundamental
parameters approach[52], which involves crystallite microstructure effects and a
convolution of appropriate source emission profiles with axial instrument
contributions. Shape anisotropy and the peak half width were described by a
modified approach of Le Bail and Jouanneaux[53]. The preferred orientation of the
crystallites was described by spherical harmonics or March-Dollase functions[54-55].
For further information see [34].
2.3 AC susceptibility
AC susceptibility measurements were performed with a fully automated differential
dual coil AC susceptometer. It is composed of a Janis SHI-950 two state closed-cycle
cryostat, a dual channel temperature LAKESHORE-332 temperature controller, an
2 Methods
12
EG&G-7260 DSP lock-in amplifier and a Quantum Design DC transport unit for
sample centering and differential measurements[34]. 4He was used as exchange gas.
Different parts of the susceptometer like the control software[56], the coil assembly,
the step controller, the sample holder, the coil assembly and other parts are
developed by Dr. Marcus Tegel. The samples were placed in small gelatin capsules
and fixed in straws before being attached to the sample holder and introduced into
the susceptometer. The measurements were performed between 3.5 K and 50 K with
altering magnetic fields up to 8 Oe at a frequency of 1333 kHz.
2.4 Induced coupled plasma atomic absorption spectroscopy (ICP-AAS)
ICP-AAS measurements were performed on a VARIAN Vista RL. Powder samples
were dissolved in a mixture of HNO3 and HCl and sprayed into a 10000 K argon
plasma. As a result light of a certain wave length was emitted that is specific for the
particular element. This light hits a CCD camera and thus can be quantified.
2.5 Transmission/Scanning electron microscopy (TEM/SEM) and energy dispersive X-ray analysis (EDX)
Certain samples used for the wire and tape production were analyzed via
transmission electron microscopy (TEM) and scanning electron microscopy (SEM).
One part of the samples was investigated at the Italian Institute of Technology in
Genoa, Italy, by Dr. Alessandro Genovese. High resolution TEM (HRTEM), energy
filtered TEM (EFTEM) and high angle annular dark field (HAADF) scanning TEM
(STEM) measurements were performed by a JEOL JEM-2200FS microscope,
equipped with a Schottky electron source, a CEOS spherical aberration corrector of
the objective lens which allows to reach a sub-angstrom resolution (0.9 Å), and an
“in-column” Omega energy filter.
2 Methods
13
Spatially resolved chemical analysis was obtained in STEM mode via energy
dispersive X-ray spectroscopy (EDX) using a Bruker Quantax 400 XFlash 6 T silicon
drift detector (SDD) with an area of 60 mm2 and chemical quantification calculated
using the standardless Cliff-Lorimer method. TEM characterizations were carried out
using a double tilt holder equipped with a beryllium tip to correctly align the lamellae
along zone axes and to reduce the background in EDX analysis.
SEM characterizations of as-obtained lamellae were performed by a JEOL JSM-
7500F. SEM analysis was carried out using a Rutherford backscattered electron
imaging (RBEI) detector to increase electron contrast by adding a compositional
contribution. SEM-EDX chemical analysis was performed using an Oxford X-Max 80
system with a SDD detector of 80 mm2.
Additional SEM and EDX measurements were performed by Christian Minke at the
Ludwig-Maximilians-University in Munich, Germany, on a JEOL JSM-6500 equipped
with a 7418 EDX detector provided by Oxford Instruments. The ground powder was
attached to self-adhesive carbon plates (PLANO GmbH) on brass sample holders.
Based on the characteristic X-ray emissions of the elements that were collected and
analyzed with the INCA program package[57]. In order to increase the accuracy of the
semi-quantitative results, several points on different positions of the sample were
measured and averaged.
2.6 Muon spin rotation and relaxation (µSR)
With muon spin rotation and relaxation different physical properties like the magnetic
order, magnetic fluctuations, superconductivity and their interplay in condensed
matter can be investigated. The experiments were performed at the Paul Scherrer
Institute in Switzerland on the πE1 and the πM3 beamlines at the GPS, Dolly, and
the GPD spectrometers. The GPS and the Dolly spectrometers solely work at
ambient pressure, while in the GPD spectrometer also pressure experiments can be
conducted. The data obtained from the measurements was finally analyzed with the
MUSRFIT package[58].
2 Methods
14
2.6.1 General considerations and properties
Muons are leptons, have a mass of 200 electrons or 1/9 of a proton, a spin of 1/2, a
life span of 2.2 µs, and positive or a negative charge[59]. They are part of the cosmic
radiation but can also be produced by shooting accelerated protons (E > 500 MeV)
on a pyrolytic graphite or beryllium target. As a result positive and negative pions π±
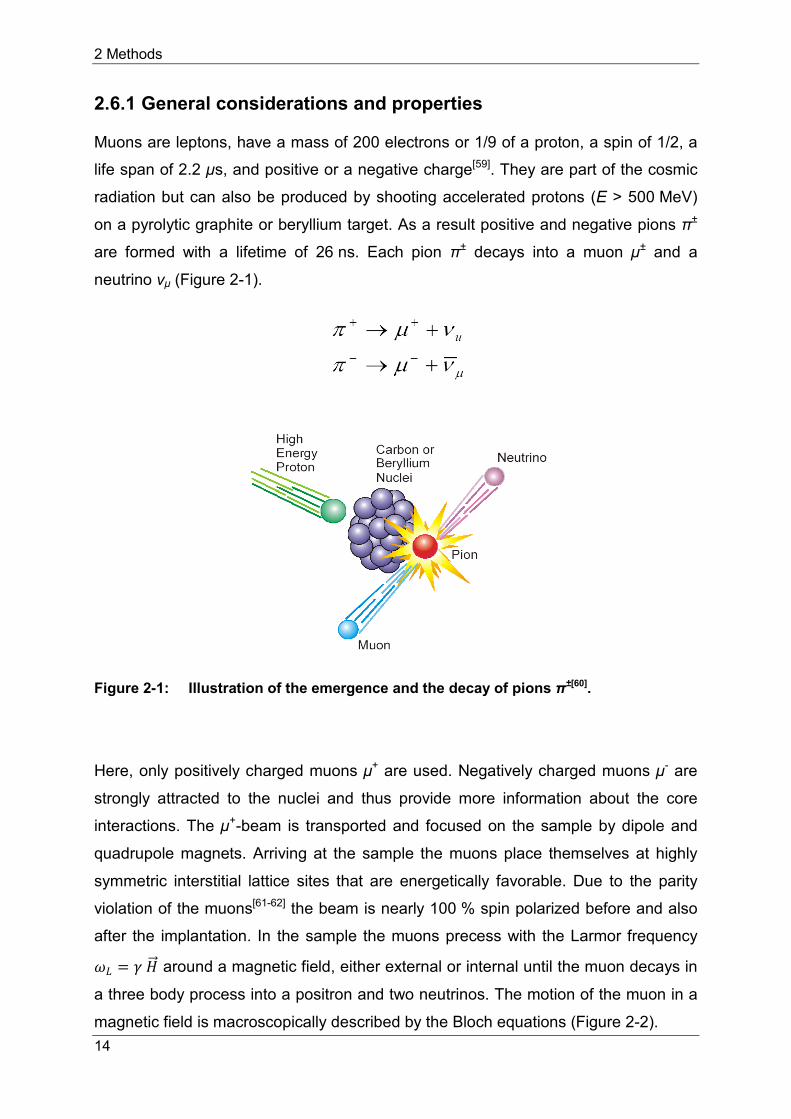
are formed with a lifetime of 26 ns. Each pion π± decays into a muon µ± and a
neutrino νμ (Figure 2-1).
Figure 2-1: Illustration of the emergence and the decay of pions π±[60].
Here, only positively charged muons μ+ are used. Negatively charged muons µ- are
strongly attracted to the nuclei and thus provide more information about the core
interactions. The µ+-beam is transported and focused on the sample by dipole and
quadrupole magnets. Arriving at the sample the muons place themselves at highly
symmetric interstitial lattice sites that are energetically favorable. Due to the parity
violation of the muons[61-62] the beam is nearly 100 % spin polarized before and also
after the implantation. In the sample the muons precess with the Larmor frequency
𝜔𝜔𝐿𝐿 = 𝛾𝛾 𝐻𝐻��⃗ around a magnetic field, either external or internal until the muon decays in
a three body process into a positron and two neutrinos. The motion of the muon in a
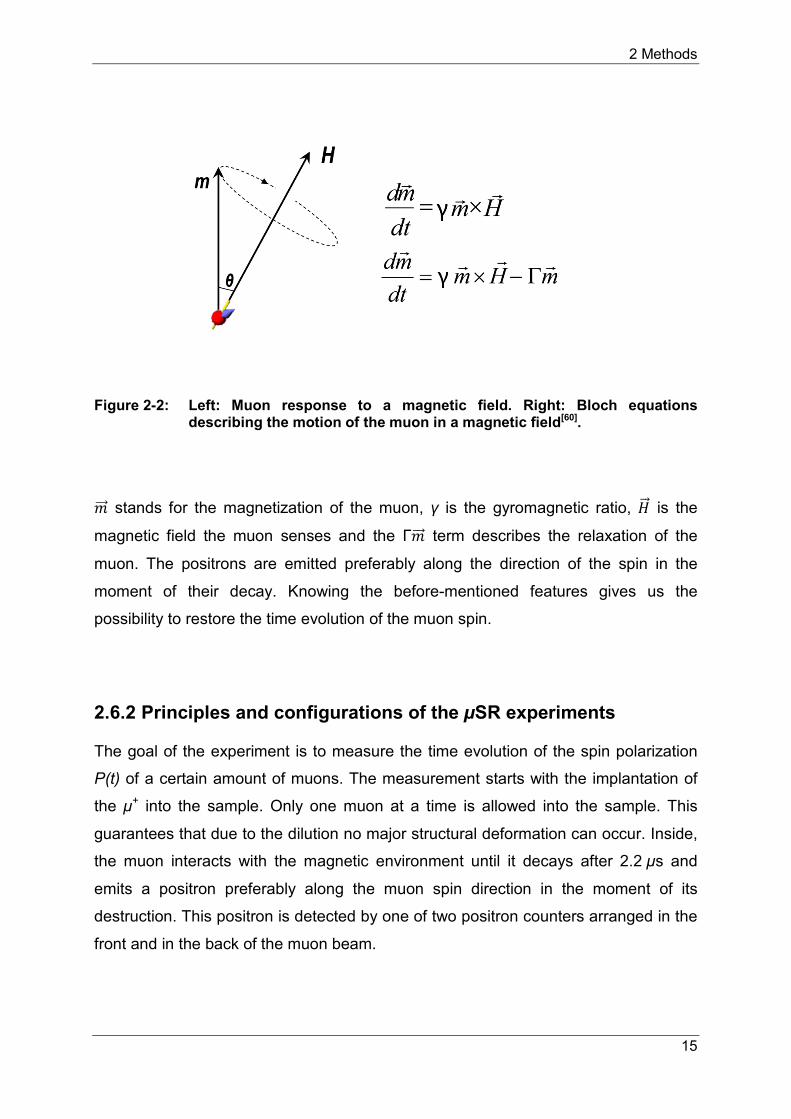
magnetic field is macroscopically described by the Bloch equations (Figure 2-2).
2 Methods
15
Figure 2-2: Left: Muon response to a magnetic field. Right: Bloch equations describing the motion of the muon in a magnetic field[60].
𝑚𝑚��⃗ stands for the magnetization of the muon, γ is the gyromagnetic ratio, 𝐻𝐻��⃗ is the
magnetic field the muon senses and the Γ𝑚𝑚��⃗ term describes the relaxation of the
muon. The positrons are emitted preferably along the direction of the spin in the
moment of their decay. Knowing the before-mentioned features gives us the
possibility to restore the time evolution of the muon spin.
2.6.2 Principles and configurations of the µSR experiments
The goal of the experiment is to measure the time evolution of the spin polarization
P(t) of a certain amount of muons. The measurement starts with the implantation of
the µ+ into the sample. Only one muon at a time is allowed into the sample. This
guarantees that due to the dilution no major structural deformation can occur. Inside,
the muon interacts with the magnetic environment until it decays after 2.2 µs and
emits a positron preferably along the muon spin direction in the moment of its
destruction. This positron is detected by one of two positron counters arranged in the
front and in the back of the muon beam.
2 Methods
16
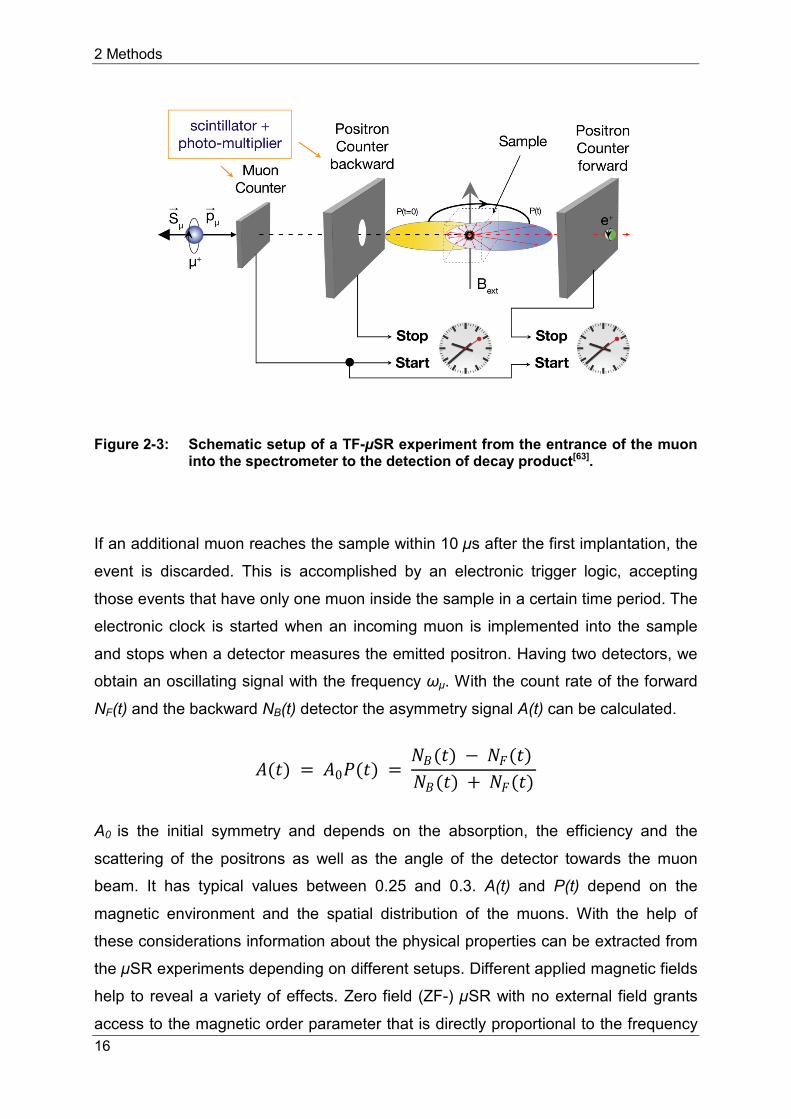
Figure 2-3: Schematic setup of a TF-µSR experiment from the entrance of the muon into the spectrometer to the detection of decay product[63].
If an additional muon reaches the sample within 10 µs after the first implantation, the
event is discarded. This is accomplished by an electronic trigger logic, accepting
those events that have only one muon inside the sample in a certain time period. The
electronic clock is started when an incoming muon is implemented into the sample
and stops when a detector measures the emitted positron. Having two detectors, we
obtain an oscillating signal with the frequency ωµ. With the count rate of the forward
NF(t) and the backward NB(t) detector the asymmetry signal A(t) can be calculated.
𝐴𝐴(𝑡𝑡) = 𝐴𝐴0𝑃𝑃(𝑡𝑡) = 𝑁𝑁𝐵𝐵(𝑡𝑡) − 𝑁𝑁𝐹𝐹(𝑡𝑡) 𝑁𝑁𝐵𝐵(𝑡𝑡) + 𝑁𝑁𝐹𝐹(𝑡𝑡)
A0 is the initial symmetry and depends on the absorption, the efficiency and the
scattering of the positrons as well as the angle of the detector towards the muon
beam. It has typical values between 0.25 and 0.3. A(t) and P(t) depend on the
magnetic environment and the spatial distribution of the muons. With the help of
these considerations information about the physical properties can be extracted from
the µSR experiments depending on different setups. Different applied magnetic fields
help to reveal a variety of effects. Zero field (ZF-) µSR with no external field grants
access to the magnetic order parameter that is directly proportional to the frequency
2 Methods
17
of the µSR signal. Longitudinal field (LF-) µSR helps to obtain information about the
superfluid density ns in the superconducting state and transverse field (TF-) µSR can
be used in combination with the other techniques to visualize the magnetic volume
fraction of samples. Above that, the damping of the µSR-signal holds information
about the inhomogeneity or the dynamics within a sample.
2.7 Critical current density measurements
The critical current density Jc is a measure for the quantity of current that can be
transported in a superconducting wire or tape in a magnetic field perpendicular to the
tape/wire. The application of a magnetic field limits this quantity. We investigated Jc
on 10 - 12 mm pieces of superconducting wires or tapes that were produced in
Genoa, Italy. The wires were fabricated by the powder in tube method by Dr. Andrea
Malagoli, described in section 6.3.1. Basically there are two possibilities being used
to measure Jc. The first one is by extracting it from magnetization hysteresis loops[64-
65]. The second method, the one used on our wires and tapes, is to measure Jc by
voltage-current-curves (V-I-curves)[66-68]. These curves display the response on the
application of a current on a wire/tape with a voltage criterion of 1 µV/cm. The
measurement is executed in a DC-four-probe homemade system that is positioned in
a liquid helium bath (4.2 K). After connecting the voltage taps to the wire/tape and
the wire/tape to the current leads by soldering (Figure 2-4), the equipment was
implemented into the sample holder placed first in a Dewar with liquid nitrogen, in
order to pre-cool it, and then into the proper Dewar filled with liquid helium to reach
the final temperature. The holder can be equipped with two samples, but only one
wire/tape at a time can be measured.
2 Methods
18
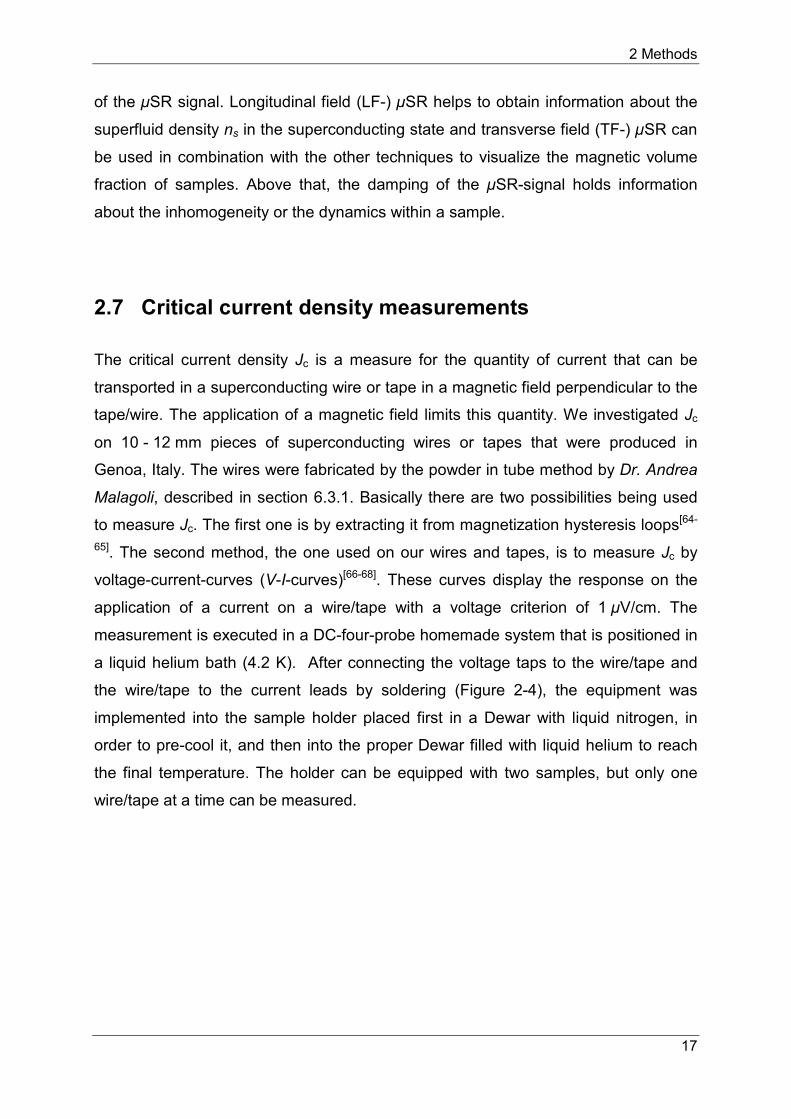
Figure 2-4: Schematic set up of a Jc measurement (up). Real set up of a Jc
measurement before it is placed in a Dewar[69].
The sample holder is positioned in the center of a 7 T split-coil magnet at the bottom
of the Dewar. The magnetic field has a horizontal direction, perpendicularly to the
longitudinal axis of the sample. During the experiment the current passes through the
sample and the voltage is measured in the presence of the magnetic field. Each
measurement is conducted in different magnetic fields and as a result the V-I curves
are obtained. When examining a superconducting sample the current is increased
until a measurable voltage is detected. This current value is called the critical current
Ic, at which the superconductivity is destroyed. Taking the surface area of the
superconductor and Ic into consideration Jc is calculated.
3 Microscopic coexistence of superconductivity and magnetism in Ba1-xKxFe2As2
19
3 Microscopic coexistence of superconductivity and
magnetism in Ba1-xKxFe2As2
Parts of this chapter are published in: E. Wiesenmayer, H. Luetkens, G. Pascua,
R. Khasanov, A. Amato, H. Potts, B. Banusch, H.-H. Klauss, Dirk Johrendt, Physical
Review Letters, 2011, 107, 231001.
DOI: 10.1103/phyRevLett.107.231001
http://journals.aps.org/prl/abstract/10.1103/PhysRevLett.107.237001
© 2011 by The American Physical Society.
3.1 Introduction
The interplay of structural, magnetic and superconducting order parameters is one of
the most intriguing aspects in iron-based superconductors. In the LaFeAsO (1111)
and BaFe2As2 (122) families, superconductivity (SC) evolves from non-
superconducting parent compounds with tetragonal crystal structures that are subject
to tiny orthorhombic lattice distortions below certain temperatures (Ts). Static long-
range antiferromagnetic ordering emerges at Néel temperatures (TN) well below Ts in
LaFeAsO[24], but very close to Ts in BaFe2As2[27]. The structural and magnetic
transitions of the parent compounds are suppressed and finally eliminated by doping
of the FeAs layers by electrons or holes, and superconductivity emerges at certain
doping levels[70]. With respect to the origin of unconventional superconductivity, the
possible coexistence of magnetic and superconducting phases in the underdoped
areas of the phase diagrams is of considerable interest. But the coupling of structural,
magnetic and superconducting order parameters relies on microscopic phase
coexistence that is often difficult to distinguish from mesoscopic phase separation. In
the 122 family, microscopic coexistence of these orders is generally accepted for the
electron-doped compounds Ba(Fe1-xCox)2As2, while conflicting reports exist for the
hole-doped compounds Ba1-xKxFe2As2.
3 Microscopic coexistence of superconductivity and magnetism in Ba1-xKxFe2As2
20
The coexistence of the orthorhombic structure with superconductivity has first been
suggested for Ba1-xKxFe2As2 up to x ≈ 0.2 by X-ray powder diffraction[42], while
neutron diffraction experiments additionally showed long-range antiferromagnetic
ordering up to x ≈ 0.3[71]. Diffraction methods however only provide the mean
structural information on a rather long spatial scale, and cannot supply conclusive
information regarding phase separation. 57Fe-Mößbauer spectroscopy as a local
probe indicated microscopic coexistence[72], but other local probes such as muon
spin rotation (µSR)[73-75] and NMR[76] showed phase separation with non-magnetic
superconducting volume fractions between 25 and 40%. These experiments with
almost optimally doped single crystals grown from fluxes constituted the paradigm of
phase separation in underdoped Ba1-xKxFe2As2.
In contrast to these scattered results, studies with cobalt-doped Ba(Fe1-xCox)2As2
yielded convincing evidence for microscopic coexistence[77]. Moreover, competing
order parameters became obvious by the concomitant reduction of the orthorhombic
lattice distortion δ = (a-b)/(a+b) and magnetic moment µFe when crossing the critical
temperature[28]. This microscopic coexistence supports s±-symmetry of the
superconducting order parameter[43, 78] and gives strong evidence for unconventional
superconductivity in iron arsenides.
Considering this generally accepted situation for Ba(Fe1-xCox)2As2, it is particularly
important to clarify the intrinsic behavior of Ba1-xKxFe2As2, also because cobalt
doping causes additional disorder in the (Fe1-xCox)As layers, while potassium doping
hardly affects the FeAs layers. Thus, if both orders coexist microscopically in
Ba1-xKxFe2As2, we rather observe the behavior of the clean superconducting FeAs
layer. Indeed, a recent neutron diffraction study with polycrystalline material supports
early suggestions about microscopic coexistence[79], but gives no conclusive proof,
because elastic neutron scattering as a bulk probe is principally unable to distinct
whether the magnetic volume fraction or the magnetic moment at the iron site
decreases.
In this chapter, a combined high-resolution X-ray diffraction and muon spin rotation
µSR study with underdoped Ba1-xKxFe2As2 (x = 0, 0.19, 0.23, 0.25) is reported. The
homogeneous coexistence of the superconducting and antiferromagnetic phase and
the competition of the respective order parameters are unambiguously shown.
3 Microscopic coexistence of superconductivity and magnetism in Ba1-xKxFe2As2
21
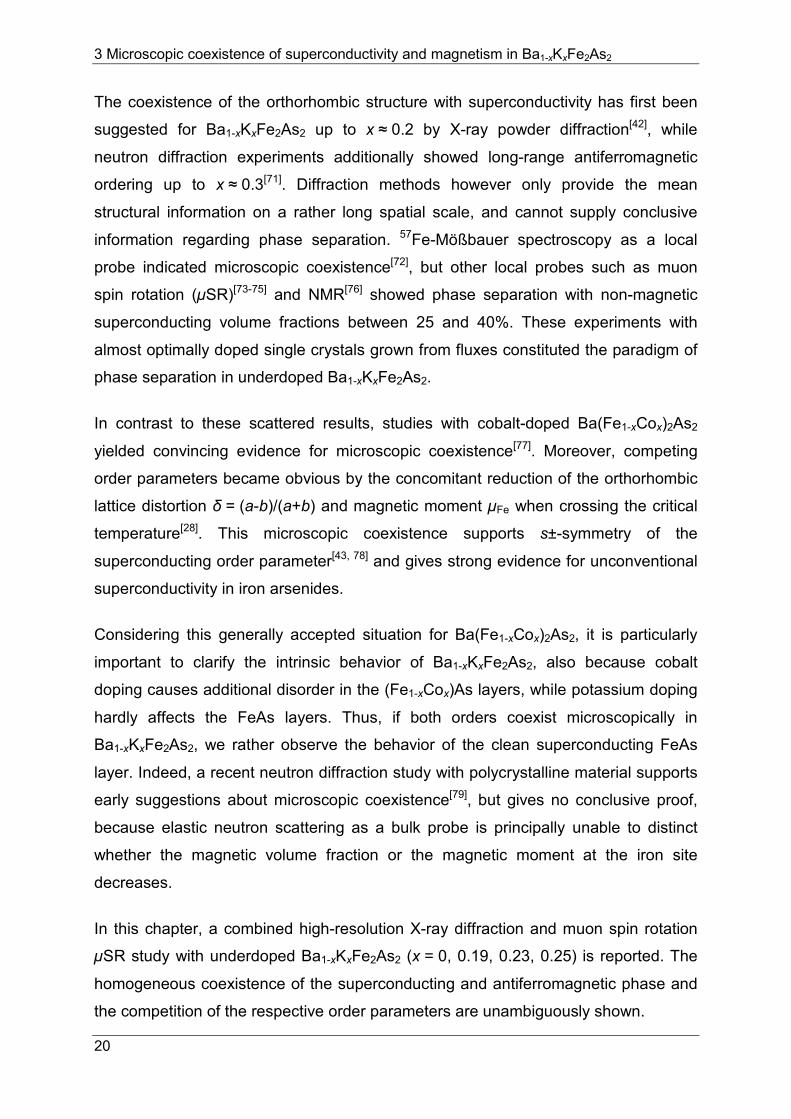
3.2 Synthesis
Polycrystalline samples of Ba1-xKxFe2As2 (x = 0, 0.19, 0.23, 0.25) were synthesized
by heating stoichiometric mixtures of the elements (purities > 99.9 %) in alumina
crucibles sealed in silica tubes under purified argon as described in chapter 7.3.
Lattice parameters were obtained by temperature-dependent X-ray powder diffraction
(Co-, Cu-, Mo-Kα1-radiation) and Rietveld refinements using the TOPAS package[51].
Figure 3-1 shows a typical XRD pattern. Only traces of impurity phases were
detected. Ba/K ratios were examined by refinement of the site occupancy parameters
and cross-checked by ICP-AAS chemical analysis. µSR measurements have been
performed using the GPS and Dolly spectrometers. The data have been analyzed
using the MUSRFIT package[58] .
Figure 3-1: X-ray powder diffraction pattern (blue) and Rietveld fit (red) of Ba1-xKxFe2As2 (x = 0.23).
X-ray powder patterns of the samples revealed the known structural phase transitions
from tetragonal to orthorhombic symmetry. In agreement with earlier studies[42], also
3 Microscopic coexistence of superconductivity and magnetism in Ba1-xKxFe2As2
22
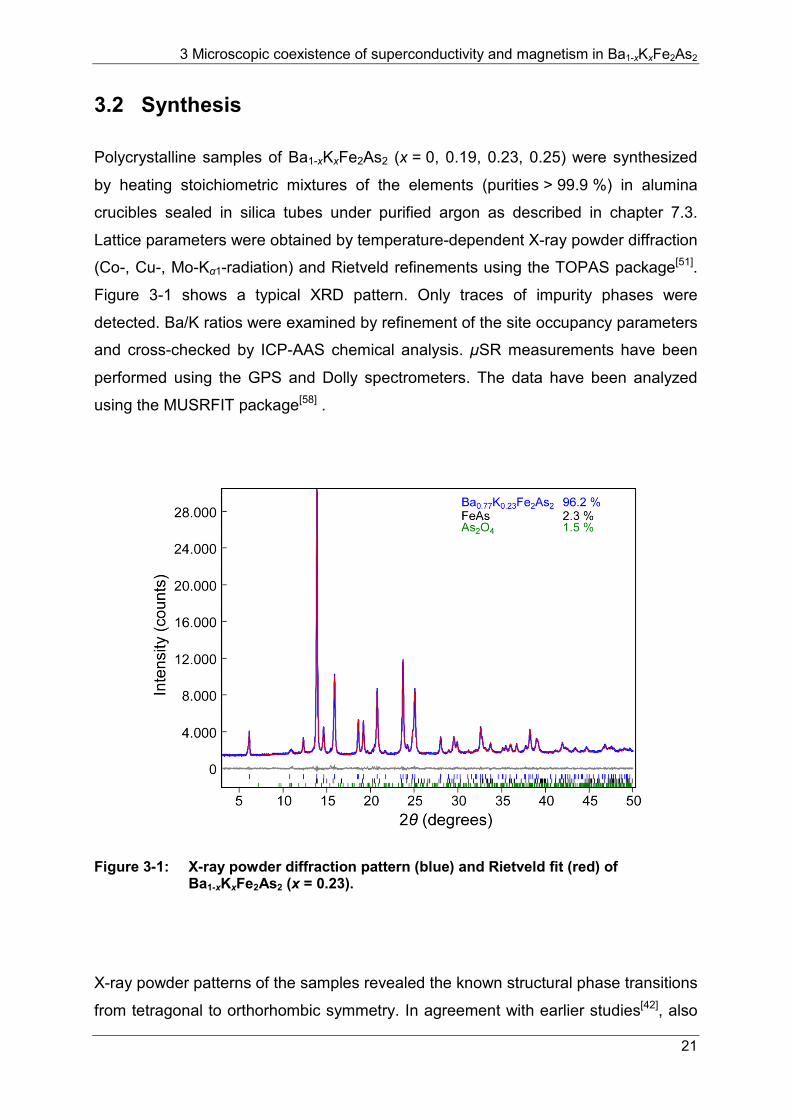
[79] showed that the orthorhombic distortion depends on the potassium concentration
and is finally absent if x ≥ 0.3. Figure 3-2 shows the temperature dependency of the
112 reflections. While the clear splitting, or at least broadening of the peak is visible
at x = 0.19 and 0.23, it is apparently absent at x = 0.25. However, a closer inspection
reveals the onset of peak broadening below ~ 70 K also in this case. From this we
obtained the tetragonal to orthorhombic transition temperatures Ts = 140 K, 98 K,
84 K and 70 K for x = 0, 0.19, 0.23, and 0.25, respectively.
Figure 3-2: Temperature dependence of the 112 reflections of for x = 0.19, 0.23, and 0.25.
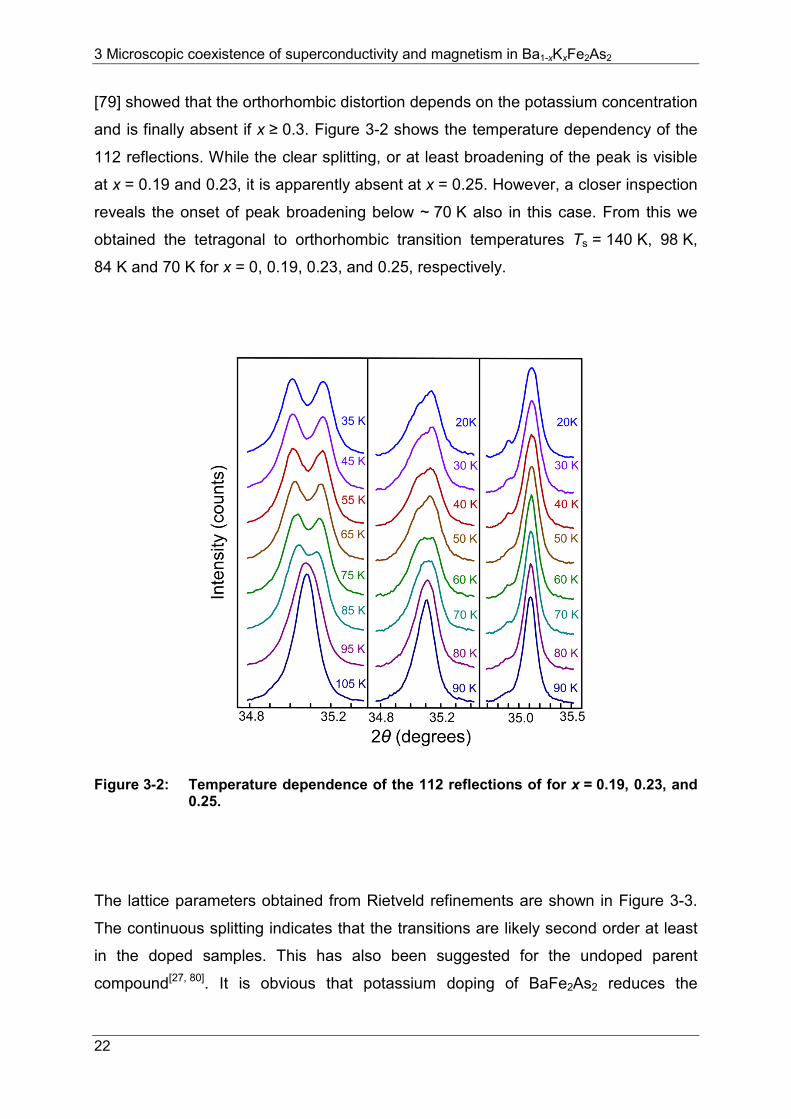
The lattice parameters obtained from Rietveld refinements are shown in Figure 3-3.
The continuous splitting indicates that the transitions are likely second order at least
in the doped samples. This has also been suggested for the undoped parent
compound[27, 80]. It is obvious that potassium doping of BaFe2As2 reduces the
3 Microscopic coexistence of superconductivity and magnetism in Ba1-xKxFe2As2
23
transition temperature Ts and also the extent of the lattice parameter splitting, which
is still visible at x = 0.25 where Tc is already 32.6 K.
Figure 3-3: a- and b-axis cell parameters as a function of temperature obtained from Rietveld refinements of the different samples.
3.3 Results and discussion
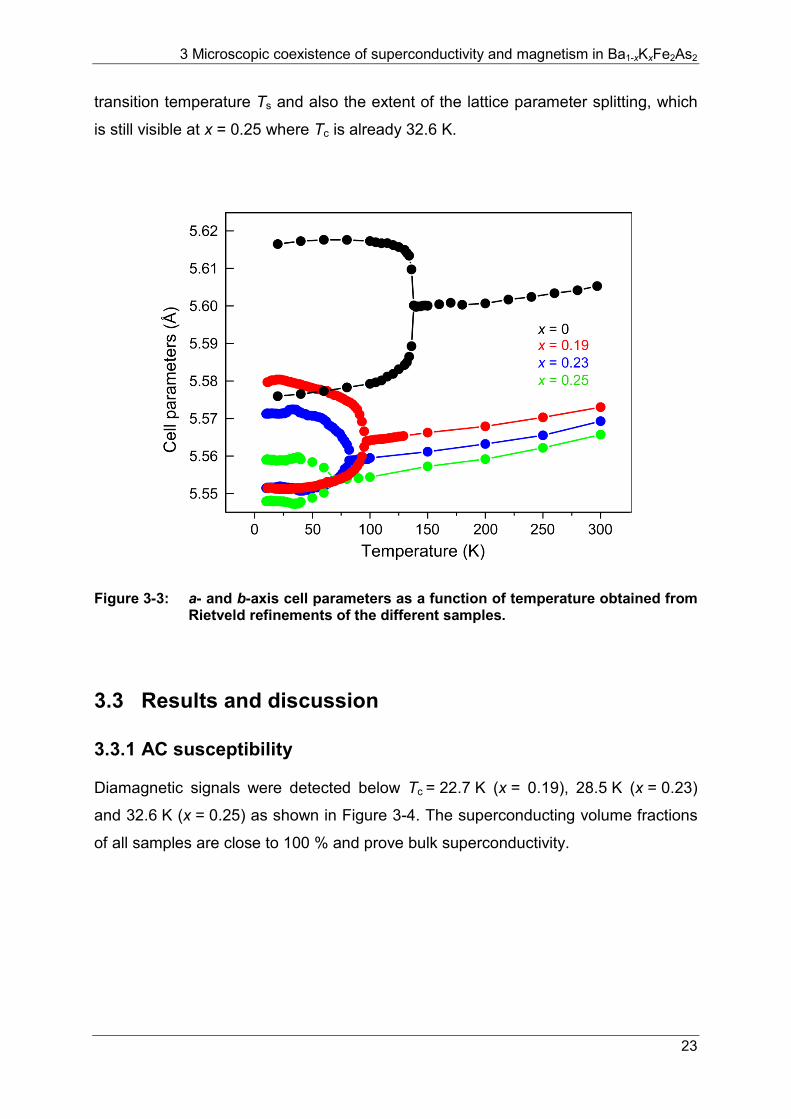
3.3.1 AC susceptibility
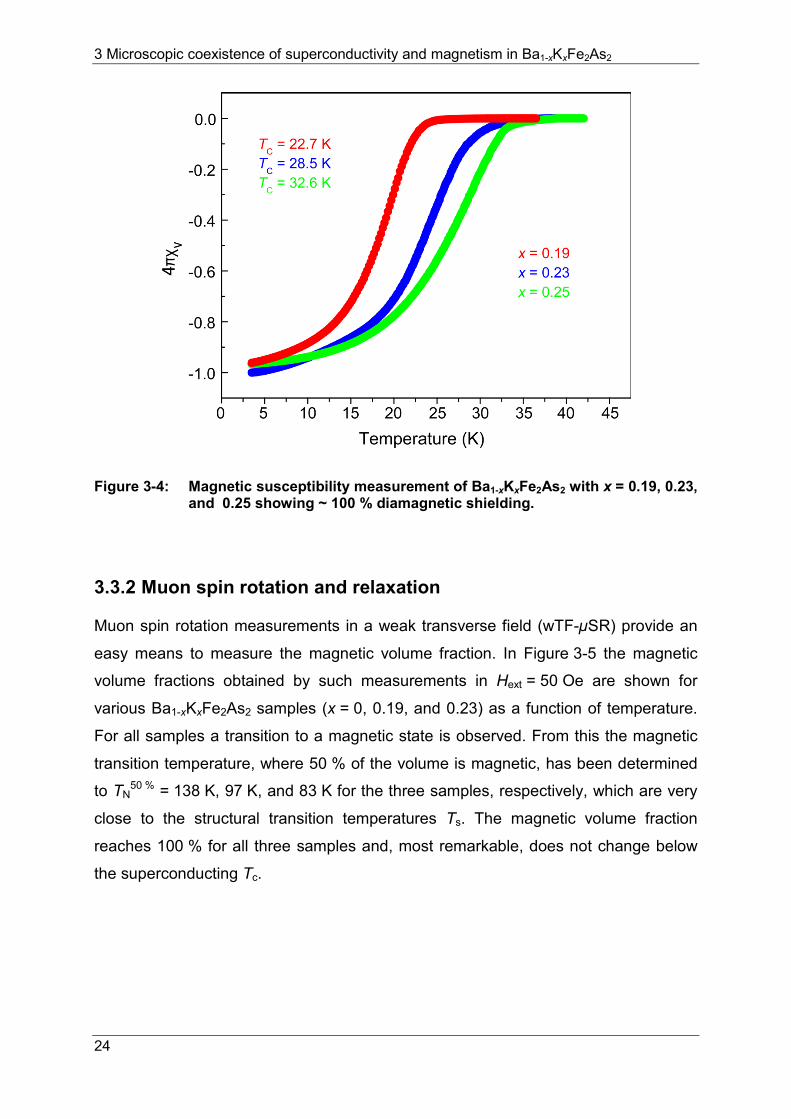
Diamagnetic signals were detected below Tc = 22.7 K (x = 0.19), 28.5 K (x = 0.23)
and 32.6 K (x = 0.25) as shown in Figure 3-4. The superconducting volume fractions
of all samples are close to 100 % and prove bulk superconductivity.
3 Microscopic coexistence of superconductivity and magnetism in Ba1-xKxFe2As2
24
Figure 3-4: Magnetic susceptibility measurement of Ba1-xKxFe2As2 with x = 0.19, 0.23, and 0.25 showing ~ 100 % diamagnetic shielding.
3.3.2 Muon spin rotation and relaxation
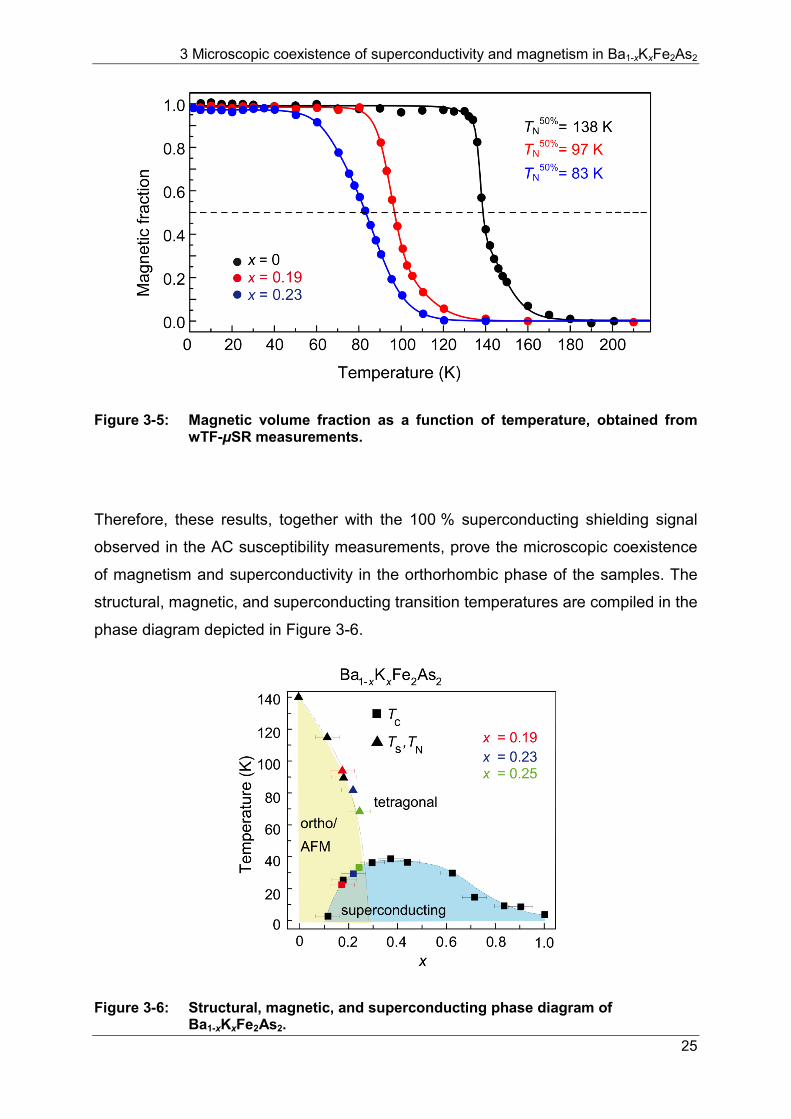
Muon spin rotation measurements in a weak transverse field (wTF-µSR) provide an
easy means to measure the magnetic volume fraction. In Figure 3-5 the magnetic
volume fractions obtained by such measurements in Hext = 50 Oe are shown for
various Ba1-xKxFe2As2 samples (x = 0, 0.19, and 0.23) as a function of temperature.
For all samples a transition to a magnetic state is observed. From this the magnetic
transition temperature, where 50 % of the volume is magnetic, has been determined
to TN50 % = 138 K, 97 K, and 83 K for the three samples, respectively, which are very
close to the structural transition temperatures Ts. The magnetic volume fraction
reaches 100 % for all three samples and, most remarkable, does not change below
the superconducting Tc.
3 Microscopic coexistence of superconductivity and magnetism in Ba1-xKxFe2As2
25
Figure 3-5: Magnetic volume fraction as a function of temperature, obtained from wTF-µSR measurements.
Therefore, these results, together with the 100 % superconducting shielding signal
observed in the AC susceptibility measurements, prove the microscopic coexistence
of magnetism and superconductivity in the orthorhombic phase of the samples. The
structural, magnetic, and superconducting transition temperatures are compiled in the
phase diagram depicted in Figure 3-6.
Figure 3-6: Structural, magnetic, and superconducting phase diagram of Ba1-xKxFe2As2.
3 Microscopic coexistence of superconductivity and magnetism in Ba1-xKxFe2As2
26
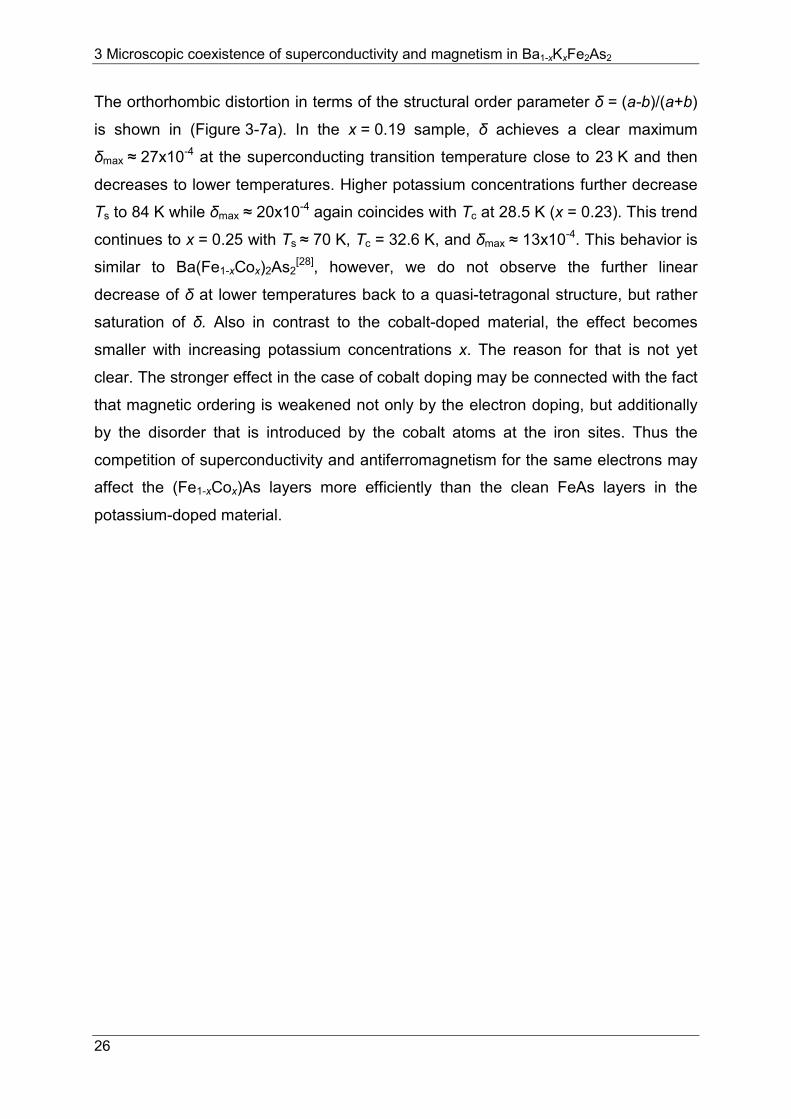
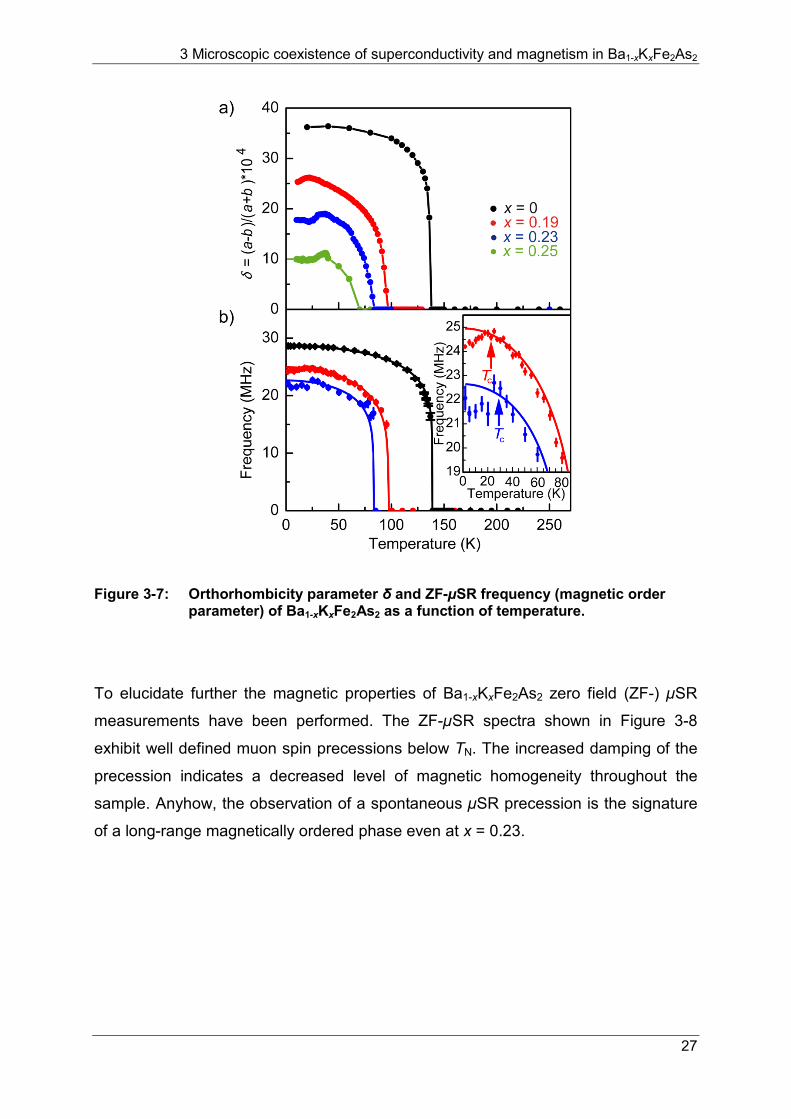
The orthorhombic distortion in terms of the structural order parameter δ = (a-b)/(a+b)
is shown in (Figure 3-7a). In the x = 0.19 sample, δ achieves a clear maximum
δmax ≈ 27x10-4 at the superconducting transition temperature close to 23 K and then
decreases to lower temperatures. Higher potassium concentrations further decrease
Ts to 84 K while δmax ≈ 20x10-4 again coincides with Tc at 28.5 K (x = 0.23). This trend
continues to x = 0.25 with Ts ≈ 70 K, Tc = 32.6 K, and δmax ≈ 13x10-4. This behavior is
similar to Ba(Fe1-xCox)2As2[28], however, we do not observe the further linear
decrease of δ at lower temperatures back to a quasi-tetragonal structure, but rather
saturation of δ. Also in contrast to the cobalt-doped material, the effect becomes
smaller with increasing potassium concentrations x. The reason for that is not yet
clear. The stronger effect in the case of cobalt doping may be connected with the fact
that magnetic ordering is weakened not only by the electron doping, but additionally
by the disorder that is introduced by the cobalt atoms at the iron sites. Thus the
competition of superconductivity and antiferromagnetism for the same electrons may
affect the (Fe1-xCox)As layers more efficiently than the clean FeAs layers in the
potassium-doped material.
3 Microscopic coexistence of superconductivity and magnetism in Ba1-xKxFe2As2
27
Figure 3-7: Orthorhombicity parameter δ and ZF-µSR frequency (magnetic order parameter) of Ba1-xKxFe2As2 as a function of temperature.
To elucidate further the magnetic properties of Ba1-xKxFe2As2 zero field (ZF-) µSR
measurements have been performed. The ZF-µSR spectra shown in Figure 3-8
exhibit well defined muon spin precessions below TN. The increased damping of the
precession indicates a decreased level of magnetic homogeneity throughout the
sample. Anyhow, the observation of a spontaneous µSR precession is the signature
of a long-range magnetically ordered phase even at x = 0.23.
3 Microscopic coexistence of superconductivity and magnetism in Ba1-xKxFe2As2
28
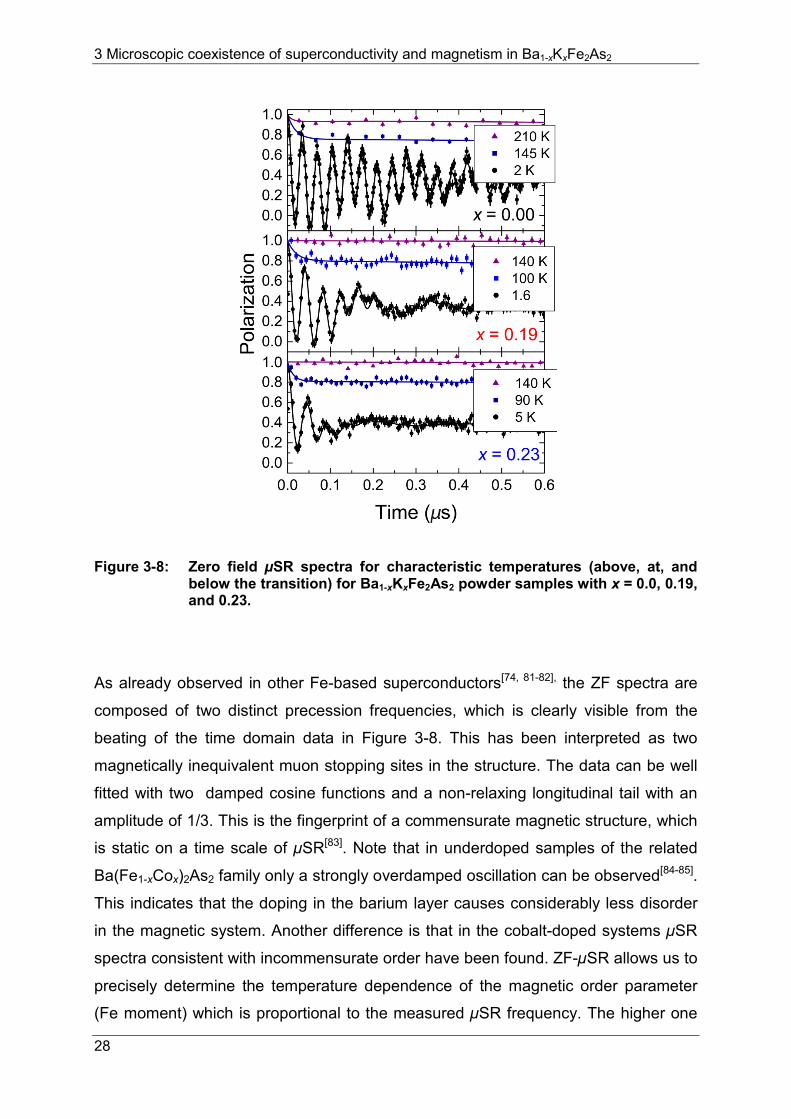
Figure 3-8: Zero field µSR spectra for characteristic temperatures (above, at, and below the transition) for Ba1-xKxFe2As2 powder samples with x = 0.0, 0.19, and 0.23.
As already observed in other Fe-based superconductors[74, 81-82], the ZF spectra are
composed of two distinct precession frequencies, which is clearly visible from the
beating of the time domain data in Figure 3-8. This has been interpreted as two
magnetically inequivalent muon stopping sites in the structure. The data can be well
fitted with two damped cosine functions and a non-relaxing longitudinal tail with an
amplitude of 1/3. This is the fingerprint of a commensurate magnetic structure, which
is static on a time scale of µSR[83]. Note that in underdoped samples of the related
Ba(Fe1-xCox)2As2 family only a strongly overdamped oscillation can be observed[84-85].
This indicates that the doping in the barium layer causes considerably less disorder
in the magnetic system. Another difference is that in the cobalt-doped systems µSR
spectra consistent with incommensurate order have been found. ZF-µSR allows us to
precisely determine the temperature dependence of the magnetic order parameter
(Fe moment) which is proportional to the measured µSR frequency. The higher one
3 Microscopic coexistence of superconductivity and magnetism in Ba1-xKxFe2As2
29
of the two observed µSR frequencies is shown in Figure 3-7b together with the
orthorhombicity parameter δ = (a-b)/(a+b) deduced from the XRD measurements
(Figure 3-7a).
The magnetic order parameter shown in Figure 3-7b decreases alike the
orthorhombicity as a function of potassium doping. Most remarkable, however, is the
decrease of the magnetic order parameter (Fe moment) below the superconducting
Tc clearly visible in the inset of Figure 3-7b. It should be mentioned that µSR as a
local probe is able to measure the magnetic volume fraction (Figure 3-5) and the size
of the ordered moment (via the ZF-µSR frequency) separately unlike it is done in
scattering experiments where the product of both quantities is measured. Taking all
data together it is obvious that all investigated samples remain 100 % magnetic, but
that the ordered Fe magnetic moment as well as the orthorhombicity decrease below
the superconducting Tc. In other words, superconductivity and magnetism coexist on
a microscopic scale, but compete for the same electrons in the underdoped region of
the Ba1-xKxFe2As2 phase diagram.
3.4 Conclusion
In summary, these results prove the paradigm of phase separation in underdoped
Ba1-xKxFe2As2 wrong. Instead compelling evidence of microscopic coexistence of
superconductivity with magnetic ordering is found from combined X-ray and µSR
data. The competition for the same electrons reduces the magnetic moment below
Tc, while the magnetic fraction remains 100 % according to volume-sensitive µSR
measurements. The response of the structural and magnetic order parameters at Tc
is weaker than in cobalt-doped Ba(Fe1-xCox)2As2. Since potassium doping introduces
no disorder in the superconducting FeAs layer, it can be suggested that we rather
observe its intrinsic behavior.
4 Short-range magnetic order in Ba1-xKxFe2As2
30
4 Short-range magnetic order in Ba1-xKxFe2As2
4.1 Introduction
The proximity of superconducting and magnetic areas in the phase diagrams of iron
arsenides led to the idea that magnetic fluctuations may play an important role in an
unconventional pairing mechanism[86-88]. In fact superconductivity coexists with the
antiferromagnetic orthorhombic phases in the underdoped areas of electron-doped
Ba(Fe1-xCox)2As2[28]
as well as in hole-doped Ba1-xKxFe2As2[89]. Resistivity
measurements with detwinned crystals revealed anisotropies much larger than the
lattice distortions[90]. This suggested the existence of a magnetic nematic state as
earlier predicted[91], which breaks the C4 symmetry of the electronic structure even if
the crystal lattice remains tetragonal[92]. The nematic phase encompasses the
boundary between the para- and antiferromagnetic area. Recently refined phase
diagrams of the 122-type compounds revealed even higher complexity. Small
pockets of tetragonal phases have been found inside the orthorhombic areas of
underdoped Ba1-xNaxFe2As2 by neutron diffraction[93-94] and in Ba1-xKxFe2As2 by
thermal expansion and specific heat experiments[95].
Less attention has been paid to the optimal and overdoped areas of the
Ba1-xKxFe2As2 phase diagram. Earlier µSR- and NMR-studies of single crystals with
x = 0.4 - 0.55 (nearly optimal doping) indicated fractions of static magnetism with
incommensurate or short-range order coexisting with superconductivity, and claimed
the existence of mesoscopic phase separations[73-76]. On the other hand,
polycrystalline samples of Ba1-xKxFe2As2 with x up to 0.25 exhibit reductions of the
magneto-elastically coupled magnetic moments below Tc with magnetic volume
fractions of 100 %, proving microscopic coexistence of superconducting and the
magnetic order parameter[89].
Thus, in order to clarify how magnetism and superconductivity interact in
Ba1-xKxFe2As2 over a larger range of the phase diagram, whether magnetic
signatures exist in optimally and overdoped polycrystalline Ba1-xKxFe2As2, and where
4 Short-range magnetic order in Ba1-xKxFe2As2
31
the change of the superconducting wave function occurs, X-ray, AC susceptibility,
and µSR measurements have been performed on different samples with 0 ≤ x ≤ 0.66.
4.2 Synthesis
The polycrystalline samples of Ba1-xKxFe2As2 (x = 0, 0.19, 0.23, 0.27, 0.31, 0.4, 0.5,
0.6, 0.66) were synthesized by heating stoichiometric mixtures of the elements
(purities > 99.9 %) in alumina crucibles sealed in silica tubes under an atmosphere of
purified argon as described in chapter 7.3. All compounds could be obtained as the
main phase with small reflection full widths at half maximum. Only small fractions of
the impurity phase FeAs are visible due to the potassium evaporation. The impurity
phase could be detected especially in the highest-doped compound (FeAs ≥ 8.5 wt%
for x = 0.66). In the lower-doped compounds (x < 0.66) the amount of FeAs is smaller
or even absent. The lattice parameters were obtained by X-ray powder diffraction
(Cu/Co-Kα1-radiation) and Rietveld refinements using the TOPAS package[52]. A
representative powder pattern and its Rietveld fit showing no impurity phase is
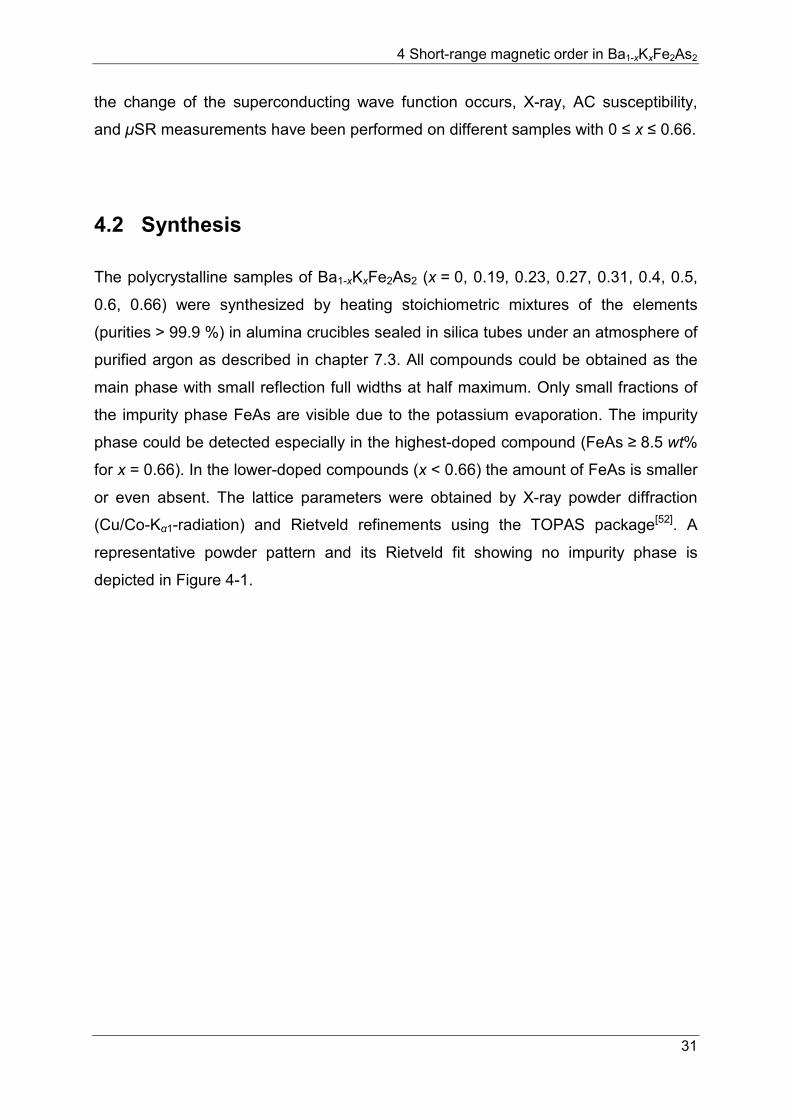
depicted in Figure 4-1.
4 Short-range magnetic order in Ba1-xKxFe2As2
32
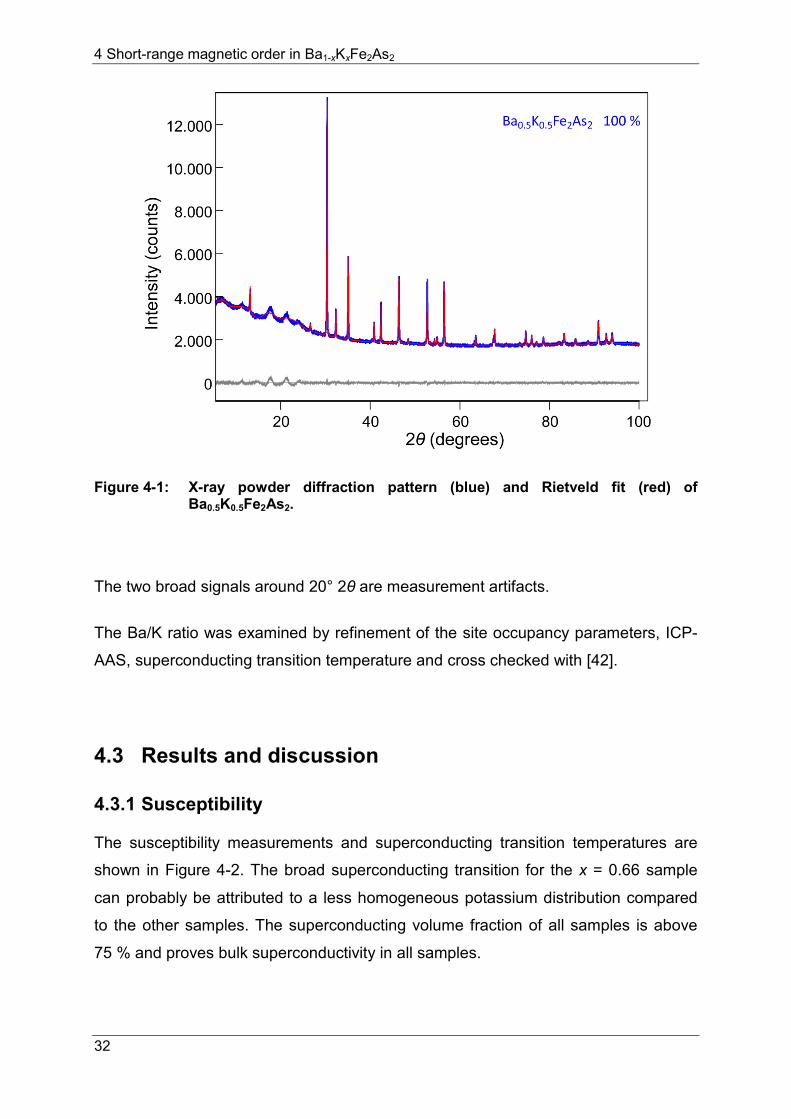
Figure 4-1: X-ray powder diffraction pattern (blue) and Rietveld fit (red) of Ba0.5K0.5Fe2As2.
The two broad signals around 20° 2θ are measurement artifacts.
The Ba/K ratio was examined by refinement of the site occupancy parameters, ICP-
AAS, superconducting transition temperature and cross checked with [42].
4.3 Results and discussion
4.3.1 Susceptibility
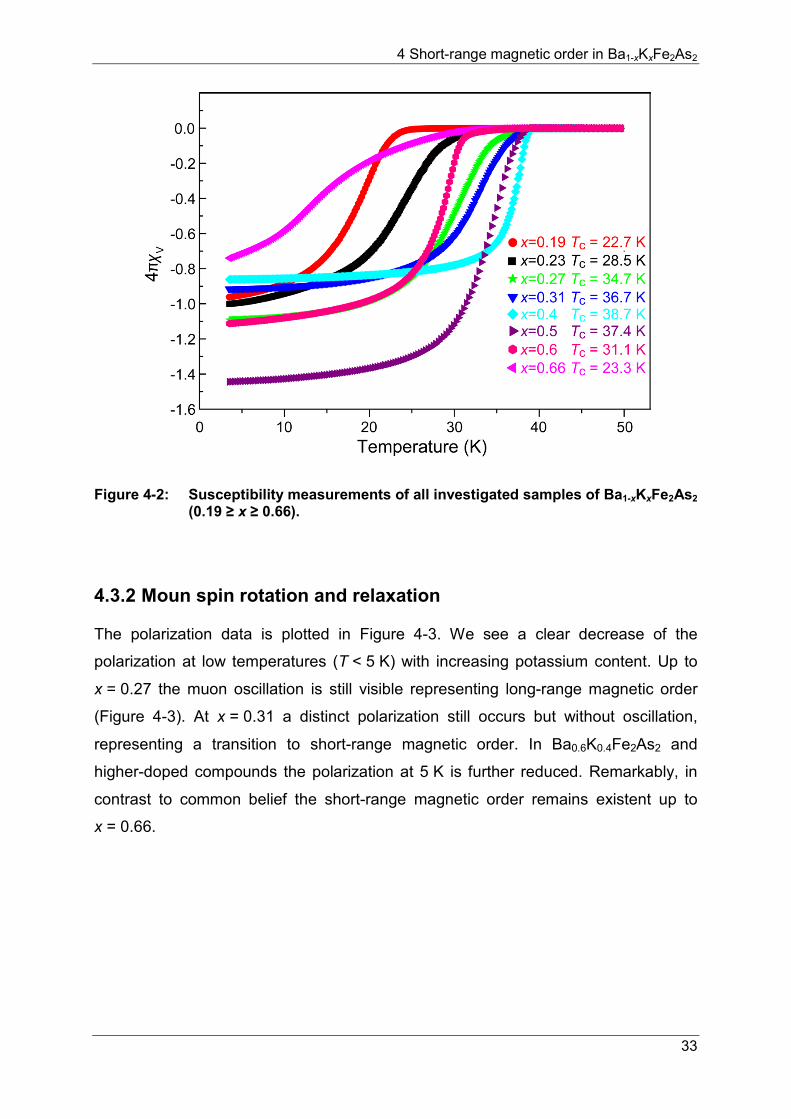
The susceptibility measurements and superconducting transition temperatures are
shown in Figure 4-2. The broad superconducting transition for the x = 0.66 sample
can probably be attributed to a less homogeneous potassium distribution compared
to the other samples. The superconducting volume fraction of all samples is above
75 % and proves bulk superconductivity in all samples.
4 Short-range magnetic order in Ba1-xKxFe2As2
33
Figure 4-2: Susceptibility measurements of all investigated samples of Ba1-xKxFe2As2 (0.19 ≥ x ≥ 0.66).
4.3.2 Moun spin rotation and relaxation
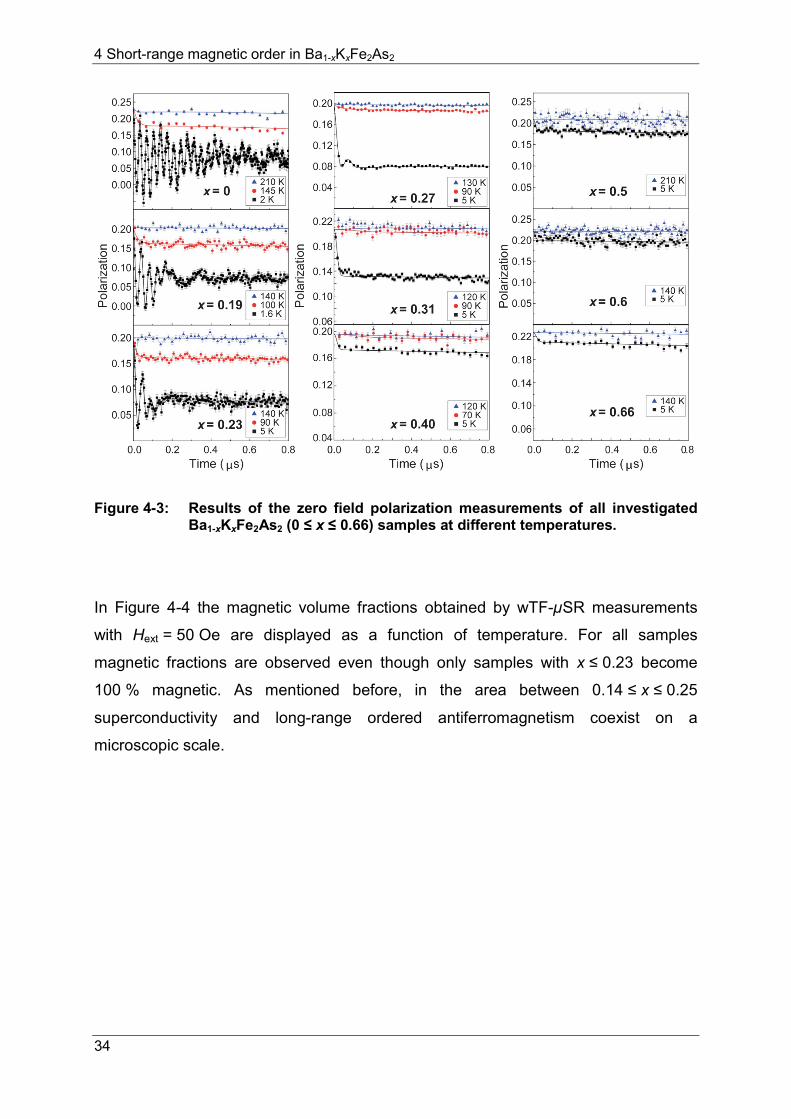
The polarization data is plotted in Figure 4-3. We see a clear decrease of the
polarization at low temperatures (T < 5 K) with increasing potassium content. Up to
x = 0.27 the muon oscillation is still visible representing long-range magnetic order
(Figure 4-3). At x = 0.31 a distinct polarization still occurs but without oscillation,
representing a transition to short-range magnetic order. In Ba0.6K0.4Fe2As2 and
higher-doped compounds the polarization at 5 K is further reduced. Remarkably, in
contrast to common belief the short-range magnetic order remains existent up to
x = 0.66.
4 Short-range magnetic order in Ba1-xKxFe2As2
34
Figure 4-3: Results of the zero field polarization measurements of all investigated Ba1-xKxFe2As2 (0 ≤ x ≤ 0.66) samples at different temperatures.
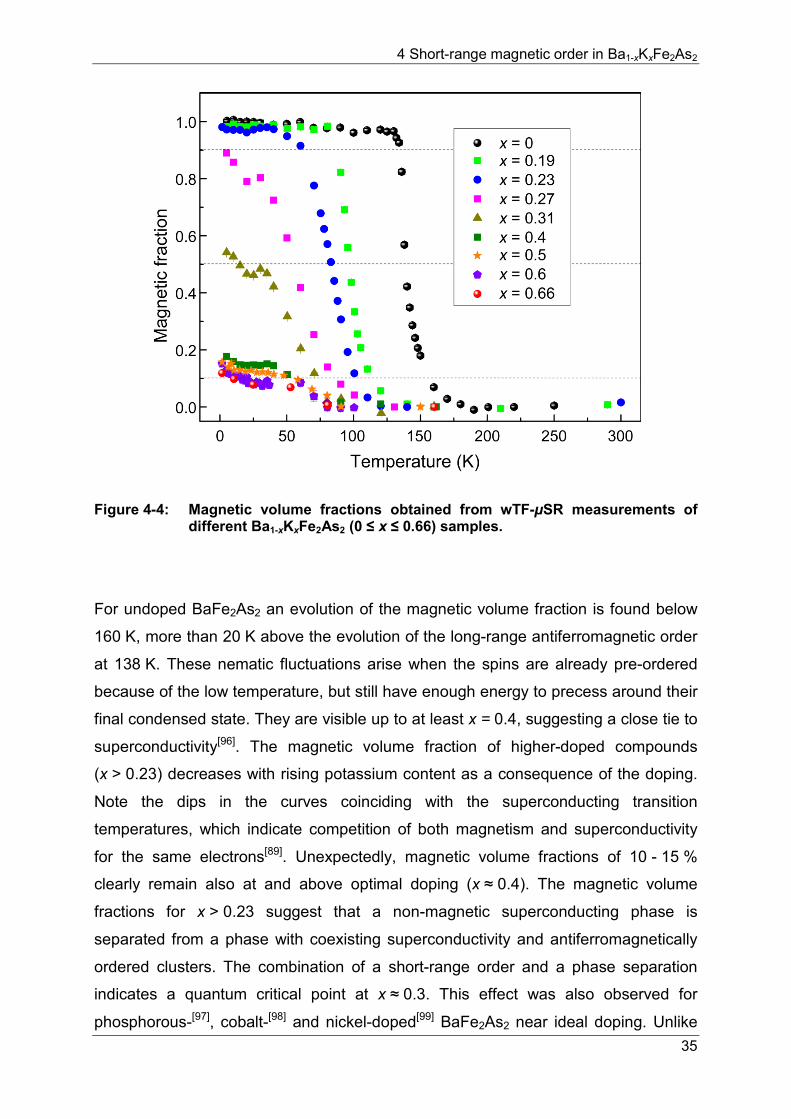
In Figure 4-4 the magnetic volume fractions obtained by wTF-µSR measurements
with Hext = 50 Oe are displayed as a function of temperature. For all samples
magnetic fractions are observed even though only samples with x ≤ 0.23 become
100 % magnetic. As mentioned before, in the area between 0.14 ≤ x ≤ 0.25
superconductivity and long-range ordered antiferromagnetism coexist on a
microscopic scale.
4 Short-range magnetic order in Ba1-xKxFe2As2
35
Figure 4-4: Magnetic volume fractions obtained from wTF-µSR measurements of different Ba1-xKxFe2As2 (0 ≤ x ≤ 0.66) samples.
For undoped BaFe2As2 an evolution of the magnetic volume fraction is found below
160 K, more than 20 K above the evolution of the long-range antiferromagnetic order
at 138 K. These nematic fluctuations arise when the spins are already pre-ordered
because of the low temperature, but still have enough energy to precess around their
final condensed state. They are visible up to at least x = 0.4, suggesting a close tie to
superconductivity[96]. The magnetic volume fraction of higher-doped compounds
(x > 0.23) decreases with rising potassium content as a consequence of the doping.
Note the dips in the curves coinciding with the superconducting transition
temperatures, which indicate competition of both magnetism and superconductivity
for the same electrons[89]. Unexpectedly, magnetic volume fractions of 10 - 15 %
clearly remain also at and above optimal doping (x ≈ 0.4). The magnetic volume
fractions for x > 0.23 suggest that a non-magnetic superconducting phase is
separated from a phase with coexisting superconductivity and antiferromagnetically
ordered clusters. The combination of a short-range order and a phase separation
indicates a quantum critical point at x ≈ 0.3. This effect was also observed for
phosphorous-[97], cobalt-[98] and nickel-doped[99] BaFe2As2 near ideal doping. Unlike
4 Short-range magnetic order in Ba1-xKxFe2As2
36
common belief, magnetic ordering is not completely suppressed in Ba1-xKxFe2As2 as
the superconducting transition temperature reaches its maximum for x = 0.4. A
residual magnetic fraction emerges at 70 K. One may argue that the residual
magnetic volume in the optimally and overdoped samples (x ≥ 0.4) may derive from
FeAs impurities (TN = 77 K)[100]. The highest FeAs fractions from X-ray diffraction are
6 vol% at x = 0.66 and 2 vol% at x = 0.6, while no FeAs was detected at x = 0.5 and
0.4. However, the low-temperature magnetic volume decreases with increasing x
which is just the reverse trend compared with the FeAs fraction. Furthermore the
µSR depolarization signal of pure FeAs is still very weak at 70 K[100], where the
magnetic fraction is already significant in these data. From this it can be excluded
that the remaining magnetism originates from FeAs.
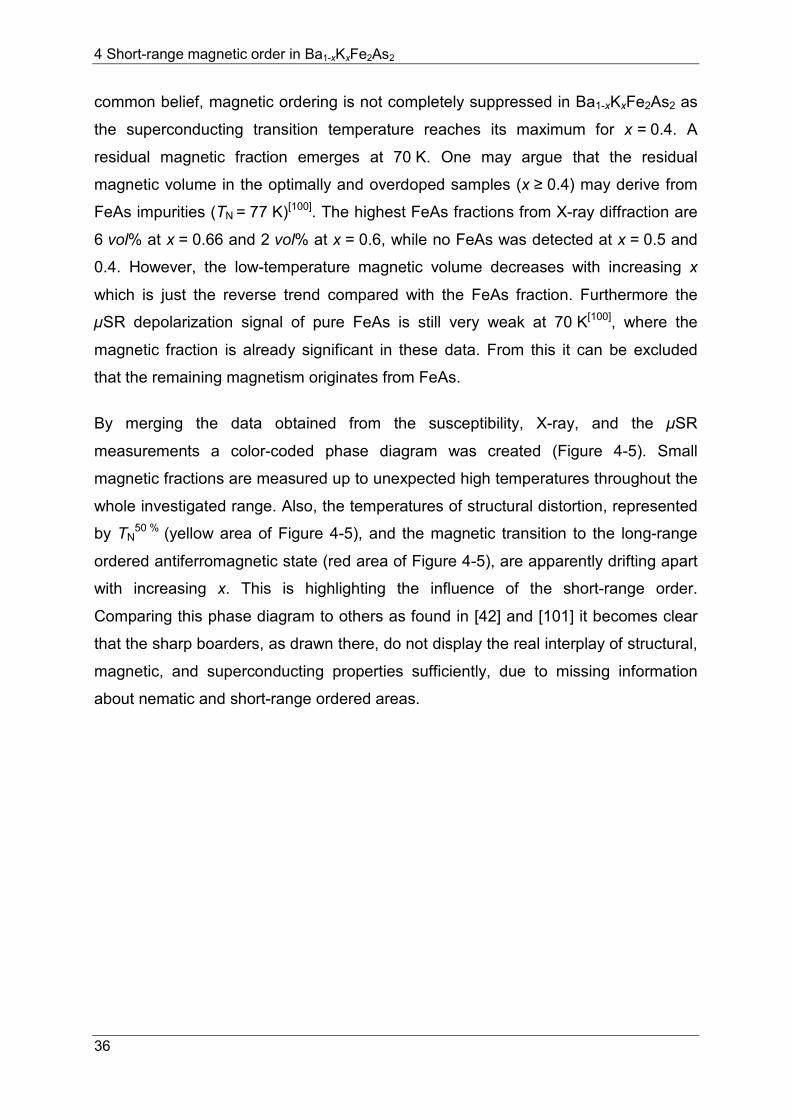
By merging the data obtained from the susceptibility, X-ray, and the µSR
measurements a color-coded phase diagram was created (Figure 4-5). Small
magnetic fractions are measured up to unexpected high temperatures throughout the
whole investigated range. Also, the temperatures of structural distortion, represented
by TN50 % (yellow area of Figure 4-5), and the magnetic transition to the long-range
ordered antiferromagnetic state (red area of Figure 4-5), are apparently drifting apart
with increasing x. This is highlighting the influence of the short-range order.
Comparing this phase diagram to others as found in [42] and [101] it becomes clear
that the sharp boarders, as drawn there, do not display the real interplay of structural,
magnetic, and superconducting properties sufficiently, due to missing information
about nematic and short-range ordered areas.
4 Short-range magnetic order in Ba1-xKxFe2As2
37
Figure 4-5: Color-coded phase diagram of Ba1-xKxFe2As2 (0 ≤ x ≤ 0.66).
As discussed by Thomale et al.[41] a change of the superconducting wave function
from s- to d-wave in highly overdoped Ba1-xKxFe2As2 can be assumed. Where this
change actually occurs hasn't been finally resolved yet. The superfluid density (ns)
represents the amount of cooper pairs and is related to the penetration depth λ by
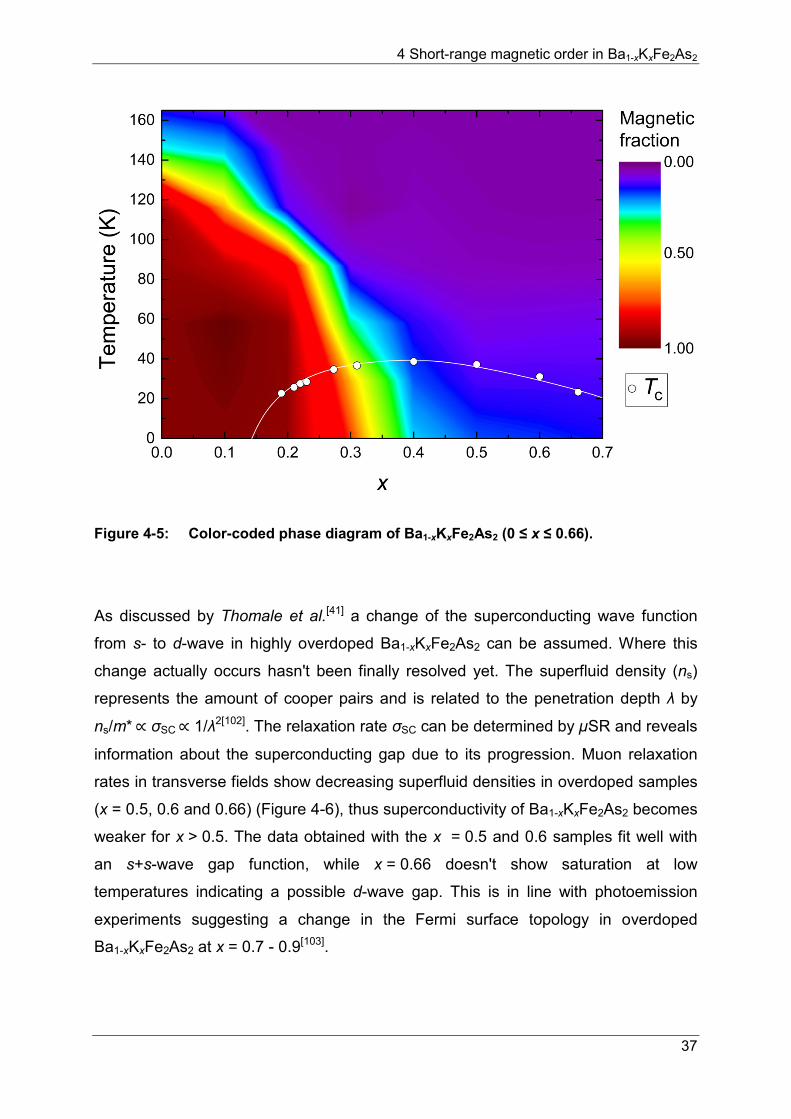
ns/m* ∝ σSC ∝ 1/λ2[102]. The relaxation rate σSC can be determined by µSR and reveals
information about the superconducting gap due to its progression. Muon relaxation
rates in transverse fields show decreasing superfluid densities in overdoped samples
(x = 0.5, 0.6 and 0.66) (Figure 4-6), thus superconductivity of Ba1-xKxFe2As2 becomes
weaker for x > 0.5. The data obtained with the x = 0.5 and 0.6 samples fit well with
an s+s-wave gap function, while x = 0.66 doesn't show saturation at low
temperatures indicating a possible d-wave gap. This is in line with photoemission
experiments suggesting a change in the Fermi surface topology in overdoped
Ba1-xKxFe2As2 at x = 0.7 - 0.9[103].
4 Short-range magnetic order in Ba1-xKxFe2As2
38
Figure 4-6: wTF-µSR measurements of the superfluid density of Ba1-xKxFe2As2 (x = 0.5, 0.6, 0.66). The black line represents an (s+s)-wave, the red dotted line an s-wave, and the green line a d-wave symmetry.
4.4 Conclusion
In summary, a color-coded phase diagram was presented, showing that the interplay
of magnetism and superconductivity is more complicated than expected. Slow
magnetic fluctuations prove a nematic phase preceding the evolution of magnetic
order up to x = 0.4. The transition from a long-range to a short-range
antiferromagnetic order takes place between 0.27 > x > 0.31, emphasizing the fact
that clear boarders for the phase diagram of Ba1-xKxFe2As2 do not reflect the
complete situation of the solid solution. In contrast to common belief, the region of
short-range order exists at least up to x = 0.66. Furthermore, the competition of
superconductivity and the antiferromagnetic order exceeds the point of phase
separation at about x = 0.27. This is represented by dips in the magnetic volume
fractions after passing Tc. The phases separate into a superconducting non-magnetic
phase and a phase where superconductivity and antiferromagnetically ordered
clusters coexist. By displaying short-range magnetic order and the phase separation
4 Short-range magnetic order in Ba1-xKxFe2As2
39
around x = 0.3, a quantum critical point is avoided[97], an observation up to now not
been measured in potassium-doped BaFe2As2. Superfluid density measurements for
overdoped Ba1-xKxFe2As2 imply a transition from an (s+s)-wave into a d-wave gap
function in samples with x ≥ 0.6.
5 Rise of a new magnetic phase in Ba0.8K0.2Fe2As2
40
5 Rise of a new magnetic phase in Ba0.8K0.2Fe2As2
5.1 Introduction
The combination of different doping agents was a logic step in the investigation of
BaFe2As2, in order to see how superconductivity and magnetism interact. In
potassium and cobalt co-doped BaFe2As2 the electron doping and the hole doping
should compensate each other. This happens up to a certain doping level, but going
beyond this point induces superconductivity until it completely vanishes together with
the magnetic order at even higher doping levels[104]. In cobalt and phosphorous co-
doped compounds the combination of both dopants leads to superconductivity at
concentrations where only one doping agent wouldn't be sufficient[105]. Also, the
combination of physical pressure and a dopant isn't new. For example BaFe2As2 has
been doped with ruthenium and physical pressure was applied to these samples[30].
One topic that again takes a special position among these experiments is potassium
doped BaFe2As2 under pressure. Hassinger et al. observed the development of a
new phase in underdoped Ba1-xKxFe2As2 (x = 0.16 - 0.21) at pressures around
10 kbar[44]. But whether this new phase is magnetic or not, or what the magnetic
structure looks like couldn't be conclusively determined.
Recently published results also show that the phase diagram of Ba1-xKxFe2As2 is
more complicated than expected[95]. Narrow magnetic tetragonal phases for
x = 0.24 - 0.28 seem to exist alongside with the known antiferromagnetic and
orthorhombic phase at low temperatures. The magnetic spins in these phases seem
to align along the c-axis as in Ba1-xNaxFe2As2[106].
Thus one may think that this new phase at high pressure and the new tetragonal
phases at ambient pressure could be the same. On the other hand the application of
two different doping agents at the same time usually brought different results than
one doping agent alone. In this chapter the interplay of magnetism and
superconductivity in Ba0.8K0.2Fe2As2 is investigated and the evolution of a new
magnetic phase in Ba0.8K0.2Fe2As2 is observed at pressures higher than 10 kbar on
the expense of the existing magnetic order at ambient pressure. This new phase has
5 Rise of a new magnetic phase in Ba0.8K0.2Fe2As2
41
the same magnetic structure as the known phase at ambient pressure and is thus
not identical to magnetic tetragonal phases at ambient pressure.
5.2 Synthesis
As the samples described in chapter 3 and 4, Ba0.8K0.2Fe2As2 (1.5 g) was
synthesized by heating stoichiometric mixtures of the elements (purities > 99.9 %) in
alumina crucibles sealed in silica tubes under an atmosphere of purified argon, which
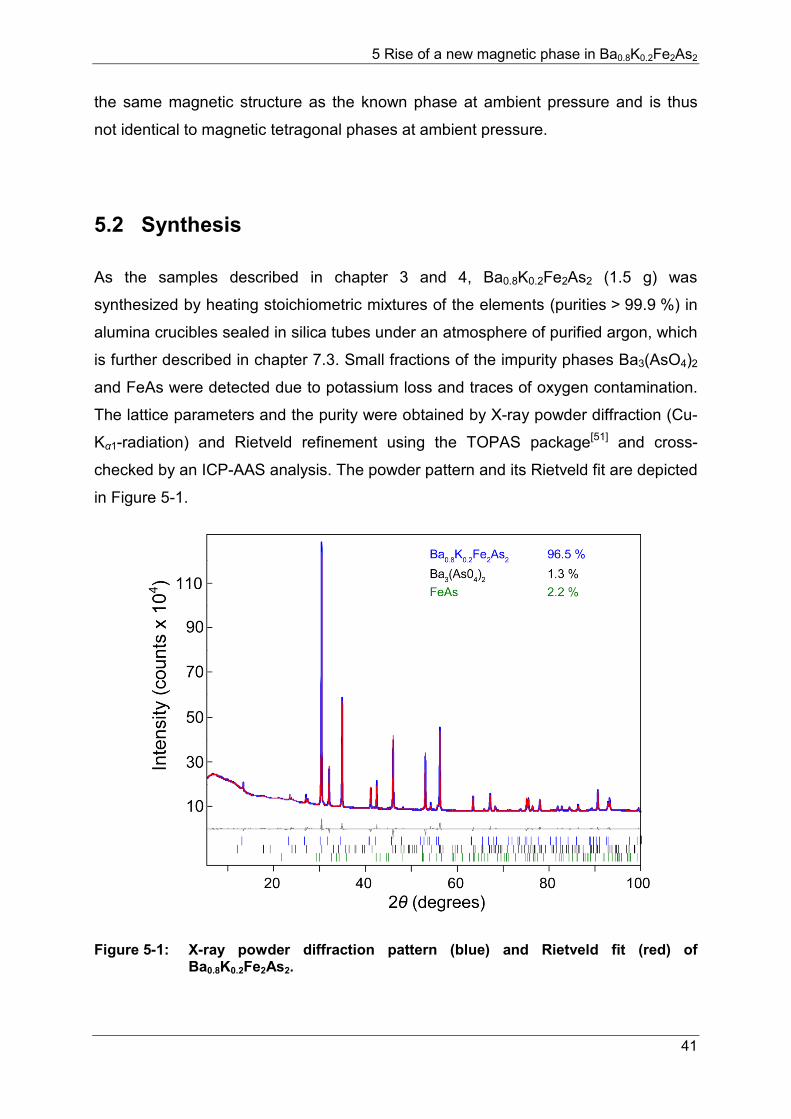
is further described in chapter 7.3. Small fractions of the impurity phases Ba3(AsO4)2
and FeAs were detected due to potassium loss and traces of oxygen contamination.
The lattice parameters and the purity were obtained by X-ray powder diffraction (Cu-
Kα1-radiation) and Rietveld refinement using the TOPAS package[51] and cross-
checked by an ICP-AAS analysis. The powder pattern and its Rietveld fit are depicted
in Figure 5-1.
Figure 5-1: X-ray powder diffraction pattern (blue) and Rietveld fit (red) of Ba0.8K0.2Fe2As2.
5 Rise of a new magnetic phase in Ba0.8K0.2Fe2As2
42
5.3 Results and discussion
5.3.1 AC susceptibility
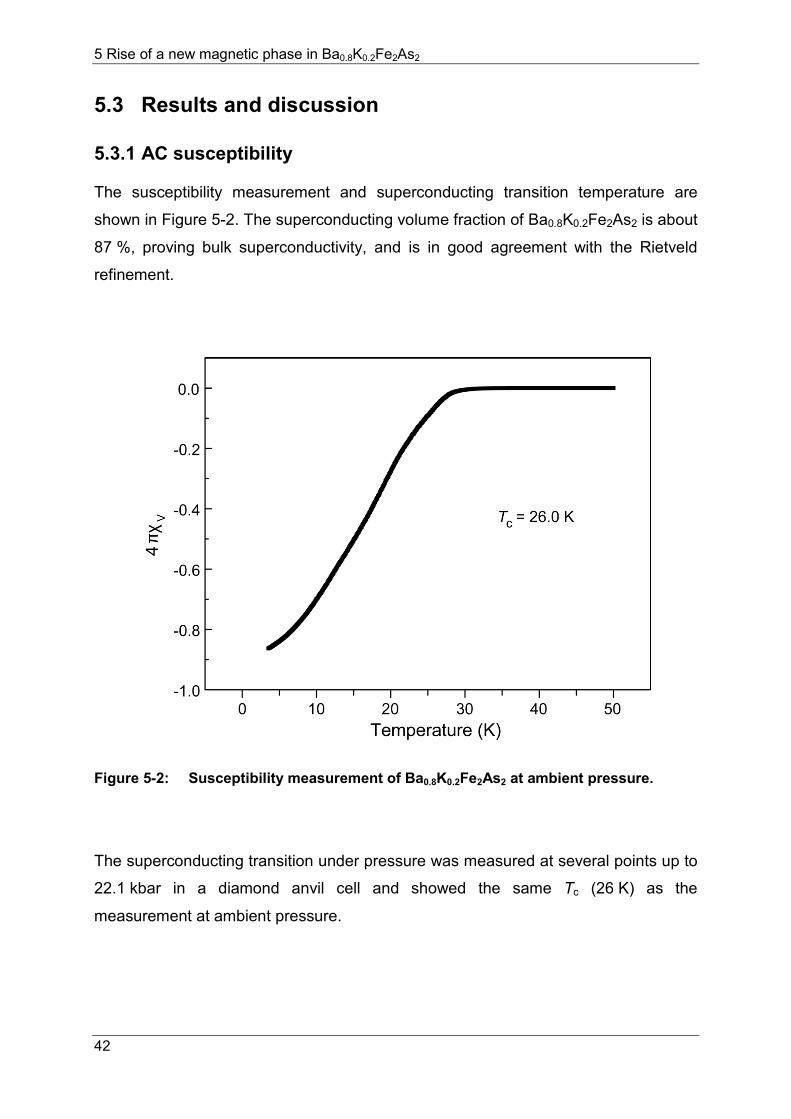
The susceptibility measurement and superconducting transition temperature are
shown in Figure 5-2. The superconducting volume fraction of Ba0.8K0.2Fe2As2 is about
87 %, proving bulk superconductivity, and is in good agreement with the Rietveld
refinement.
Figure 5-2: Susceptibility measurement of Ba0.8K0.2Fe2As2 at ambient pressure.
The superconducting transition under pressure was measured at several points up to
22.1 kbar in a diamond anvil cell and showed the same Tc (26 K) as the
measurement at ambient pressure.
5 Rise of a new magnetic phase in Ba0.8K0.2Fe2As2
43
5.3.2 Muon spin rotation and relaxation
To perform the high pressure measurements, the sample was mixed with Daphne oil,
pressed into pellets, and placed in a piston cylinder. The container was made out of
MP35, an alloy chosen because of its non-magnetic behavior and its durability
against pressure. Daphne oil was used as a pressure medium to obtain hydrostatic
pressure[107]. The pressure was determined using the temperature shift of the
superconducting temperature of an indium piece, that was also placed in the piston
cylinder[108].
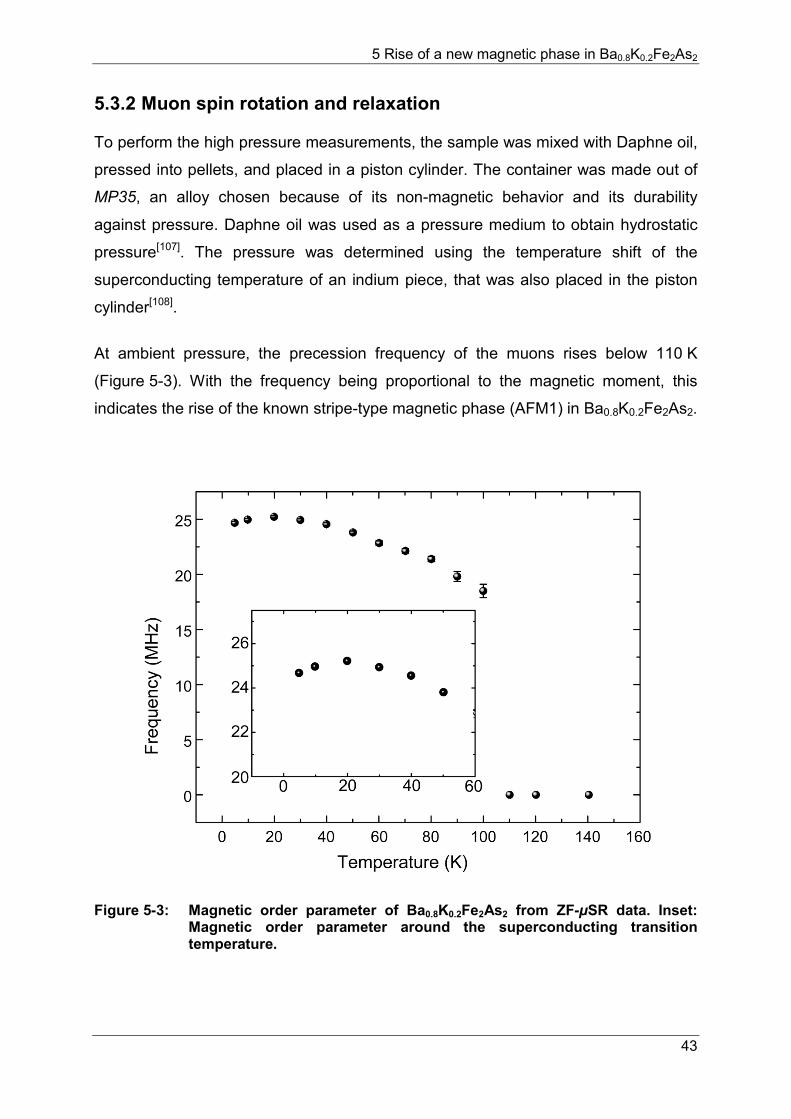
At ambient pressure, the precession frequency of the muons rises below 110 K
(Figure 5-3). With the frequency being proportional to the magnetic moment, this
indicates the rise of the known stripe-type magnetic phase (AFM1) in Ba0.8K0.2Fe2As2.
Figure 5-3: Magnetic order parameter of Ba0.8K0.2Fe2As2 from ZF-µSR data. Inset: Magnetic order parameter around the superconducting transition temperature.
5 Rise of a new magnetic phase in Ba0.8K0.2Fe2As2
44
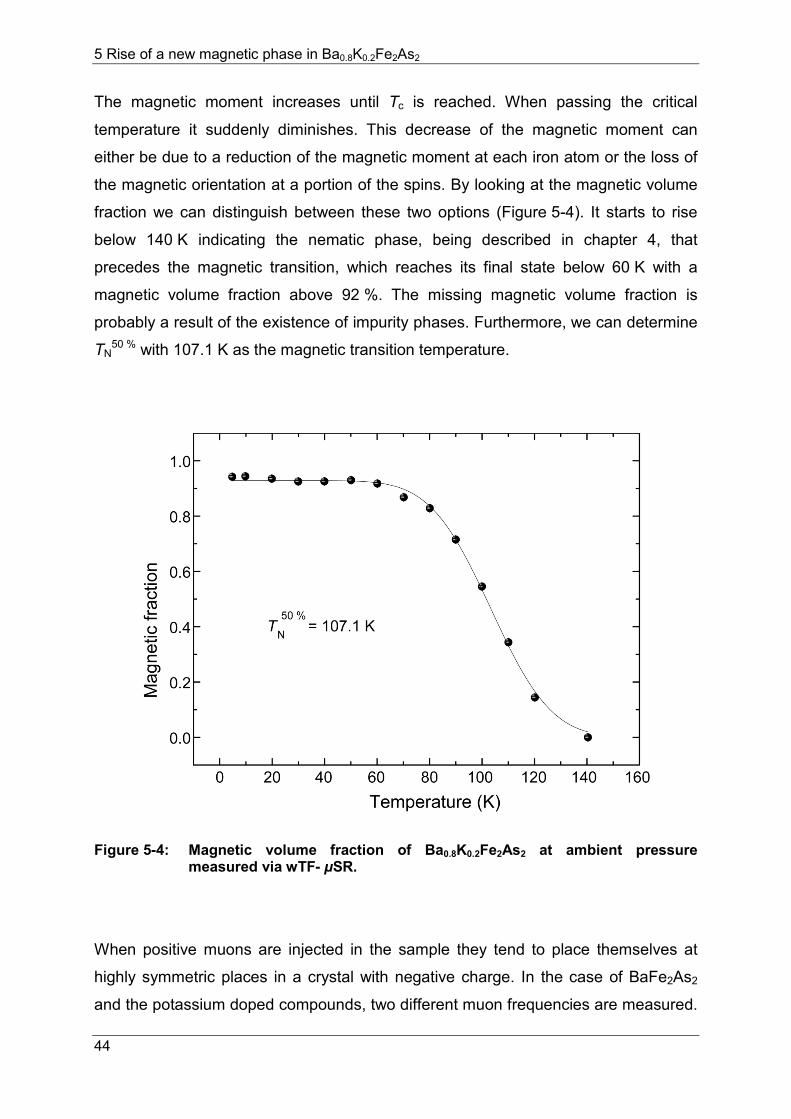
The magnetic moment increases until Tc is reached. When passing the critical
temperature it suddenly diminishes. This decrease of the magnetic moment can
either be due to a reduction of the magnetic moment at each iron atom or the loss of
the magnetic orientation at a portion of the spins. By looking at the magnetic volume
fraction we can distinguish between these two options (Figure 5-4). It starts to rise
below 140 K indicating the nematic phase, being described in chapter 4, that
precedes the magnetic transition, which reaches its final state below 60 K with a
magnetic volume fraction above 92 %. The missing magnetic volume fraction is
probably a result of the existence of impurity phases. Furthermore, we can determine
TN50 % with 107.1 K as the magnetic transition temperature.
Figure 5-4: Magnetic volume fraction of Ba0.8K0.2Fe2As2 at ambient pressure measured via wTF- µSR.
When positive muons are injected in the sample they tend to place themselves at
highly symmetric places in a crystal with negative charge. In the case of BaFe2As2
and the potassium doped compounds, two different muon frequencies are measured.
5 Rise of a new magnetic phase in Ba0.8K0.2Fe2As2
45
This indicates that, as proposed in chapter 3, there have to be two different muon
sites.
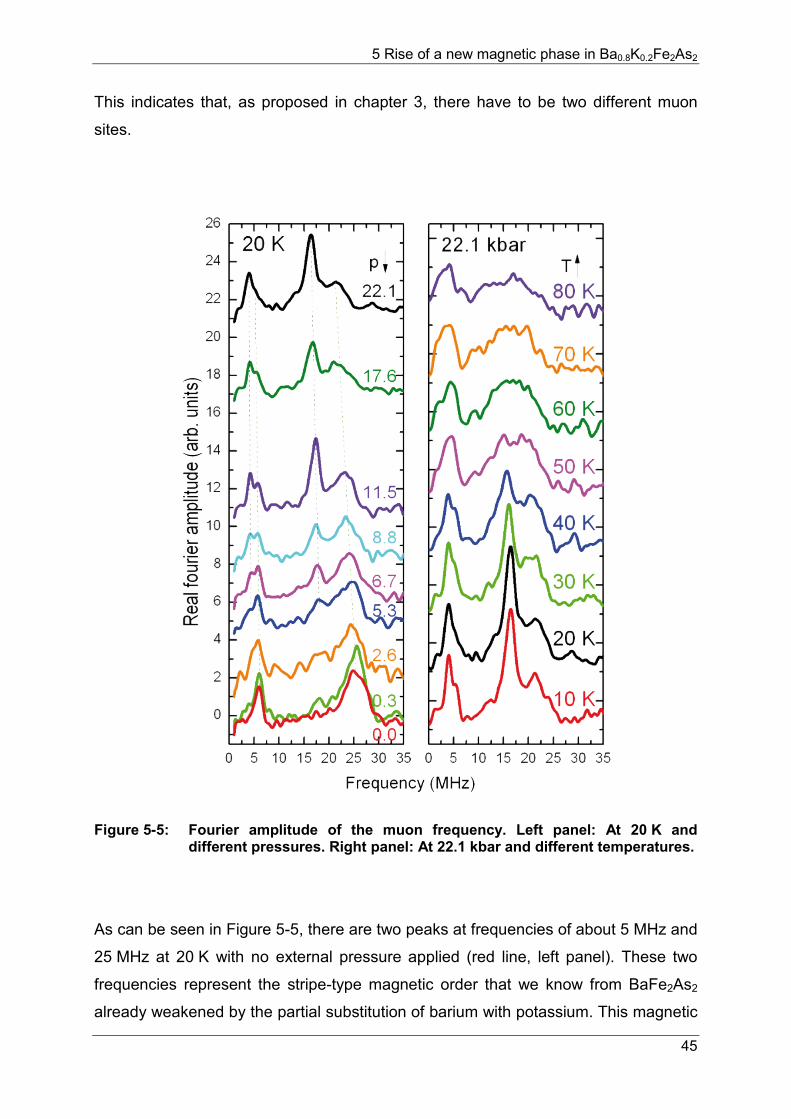
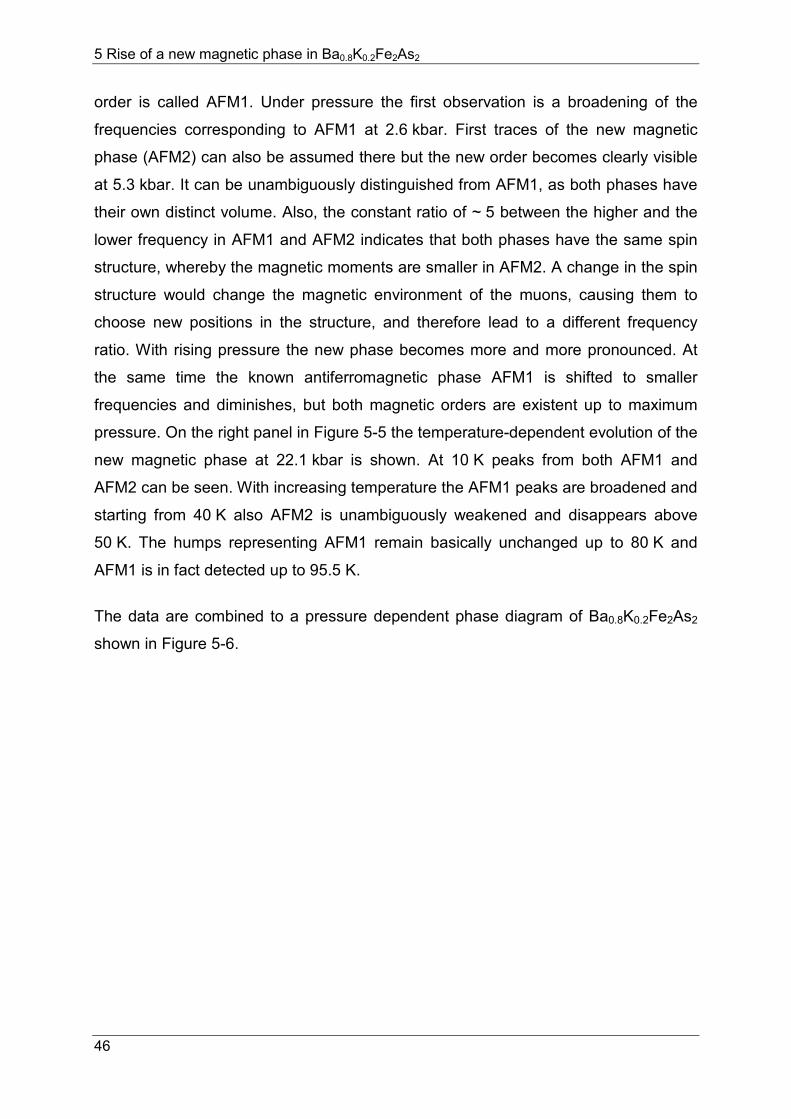
Figure 5-5: Fourier amplitude of the muon frequency. Left panel: At 20 K and different pressures. Right panel: At 22.1 kbar and different temperatures.
As can be seen in Figure 5-5, there are two peaks at frequencies of about 5 MHz and
25 MHz at 20 K with no external pressure applied (red line, left panel). These two
frequencies represent the stripe-type magnetic order that we know from BaFe2As2
already weakened by the partial substitution of barium with potassium. This magnetic
5 Rise of a new magnetic phase in Ba0.8K0.2Fe2As2
46
order is called AFM1. Under pressure the first observation is a broadening of the
frequencies corresponding to AFM1 at 2.6 kbar. First traces of the new magnetic
phase (AFM2) can also be assumed there but the new order becomes clearly visible
at 5.3 kbar. It can be unambiguously distinguished from AFM1, as both phases have
their own distinct volume. Also, the constant ratio of ~ 5 between the higher and the
lower frequency in AFM1 and AFM2 indicates that both phases have the same spin
structure, whereby the magnetic moments are smaller in AFM2. A change in the spin
structure would change the magnetic environment of the muons, causing them to
choose new positions in the structure, and therefore lead to a different frequency
ratio. With rising pressure the new phase becomes more and more pronounced. At
the same time the known antiferromagnetic phase AFM1 is shifted to smaller
frequencies and diminishes, but both magnetic orders are existent up to maximum
pressure. On the right panel in Figure 5-5 the temperature-dependent evolution of the
new magnetic phase at 22.1 kbar is shown. At 10 K peaks from both AFM1 and
AFM2 can be seen. With increasing temperature the AFM1 peaks are broadened and
starting from 40 K also AFM2 is unambiguously weakened and disappears above
50 K. The humps representing AFM1 remain basically unchanged up to 80 K and
AFM1 is in fact detected up to 95.5 K.
The data are combined to a pressure dependent phase diagram of Ba0.8K0.2Fe2As2
shown in Figure 5-6.
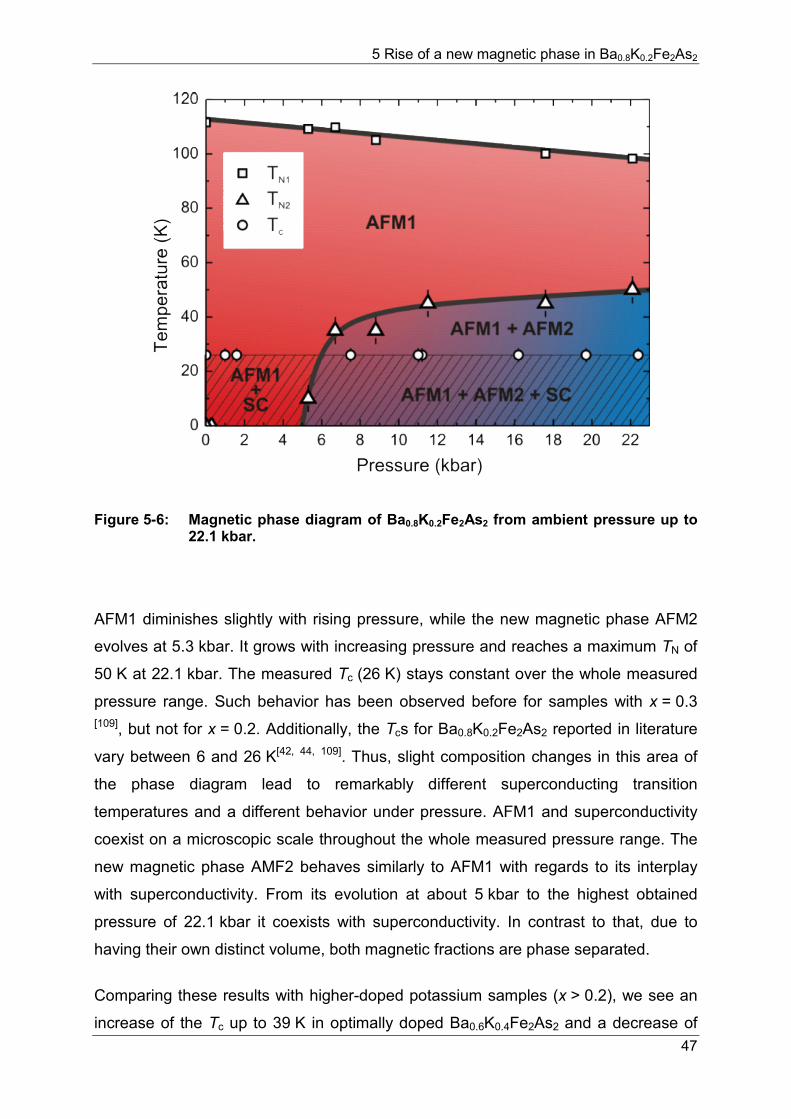
5 Rise of a new magnetic phase in Ba0.8K0.2Fe2As2
47
Figure 5-6: Magnetic phase diagram of Ba0.8K0.2Fe2As2 from ambient pressure up to 22.1 kbar.
AFM1 diminishes slightly with rising pressure, while the new magnetic phase AFM2
evolves at 5.3 kbar. It grows with increasing pressure and reaches a maximum TN of
50 K at 22.1 kbar. The measured Tc (26 K) stays constant over the whole measured
pressure range. Such behavior has been observed before for samples with x = 0.3 [109], but not for x = 0.2. Additionally, the Tcs for Ba0.8K0.2Fe2As2 reported in literature
vary between 6 and 26 K[42, 44, 109]. Thus, slight composition changes in this area of
the phase diagram lead to remarkably different superconducting transition
temperatures and a different behavior under pressure. AFM1 and superconductivity
coexist on a microscopic scale throughout the whole measured pressure range. The
new magnetic phase AMF2 behaves similarly to AFM1 with regards to its interplay
with superconductivity. From its evolution at about 5 kbar to the highest obtained
pressure of 22.1 kbar it coexists with superconductivity. In contrast to that, due to
having their own distinct volume, both magnetic fractions are phase separated.
Comparing these results with higher-doped potassium samples (x > 0.2), we see an
increase of the Tc up to 39 K in optimally doped Ba0.6K0.4Fe2As2 and a decrease of
5 Rise of a new magnetic phase in Ba0.8K0.2Fe2As2
48
the magnetic volume fraction. According to that, a phase separation of the magnetic
and the superconducting phase occurs. The pressure experiments performed here
show neither an increase of Tc, nor a phase separation. This emphasizes that the two
doping agents cannot be treated equally, as it was already shown for other co-doped
BaFe2As2 descendants.
5.4 Conclusion
In conclusion, the microscopic coexistence of superconductivity and magnetism in
Ba0.8K0.2Fe2As2 has been verified at ambient pressure and up to 22.1 kbar. Above a
pressure of about 5 kbar a new magnetic phase AFM2 with a maximum TN of 50 K at
22.1 kbar was detected. It has the same spin structure as the known
antiferromagnetic order AFM1 but exhibits smaller magnetic moments and becomes
more and more distinct with rising pressure. Meanwhile, the transition temperature of
the known magnetic order AFM1 decreases constantly towards higher pressures, but
AFM1 persists over the whole pressure range. When reaching Tc, which remains
unchanged up to 22.1 kbar, this new magnetic order also coexists with
superconductivity on a microscopic scale. The coexistence of superconductivity and
the two antiferromagnetic orders in Ba0.8K0.2Fe2As2 under pressure and the fact that a
new magnetic phase is induced with rising pressure itself shows again that physical
pressure and doping are not equal. The combination of both leads to different results
than using one modification alone.
6 Exploring the potential of Ba0.6K0.4Fe2As2 wires and tapes
49
6 Exploring the potential of Ba0.6K0.4Fe2As2 wires and
tapes
Parts of this chapter are accepted as :
"Role of heat and mechanical treatments in the fabrication of superconducting
Ba0.6K0.4Fe2As2 ex-situ Powder-In-Tube tapes"
A. Malagoli, E. Wiesenmayer, S. Marchner, D. Johrendt, A. Genovese, M. Putti,
arXiv: 1507.03781.
Accepted in Superconductor Science and Technology. © 2015 IOP Publishing
6.1 Motivation
The development, the production, and application of superconducting wires and
tapes is an ongoing process and can help to improve a large variety of aspects in our
life from small specific devices, like magnets in NMR spectrometers, to large power
grids. The hope is that superconducting wires and tapes could replace conventional
wires, at least in some areas, because of their improved efficiency combined with a
simultaneous size reduction. For example a study of the US Department of Energy
states that 7-10 % of electric power in the USA is lost in the copper-wire based power
grid[110]. This corresponds to almost 180 million tons of CO2 from fossil power plants.
Nevertheless, there is still a lot to be done until these new materials can find their
way into daily life, and exceed the test phase, as wires in the power grid[111],
motors[111], or generators[4]. Problems like low carrier densities, a short coherence
length, the high anisotropy, thermal fluctuations, or current blocking grain boundaries
in high-temperature superconductors need to be overcome in order to raise the
critical current density and lower the costs. Up to now, a lot of effort was already
made[112-115] for compounds like MgB2[116-117], diverse cuprates like Bi-2212[118], Bi-
2223[119-120] or YBCO[121-123], and also iron-based superconductors like different
1111[65, 124] compounds or FeSe[125-126]. In this chapter, the focus lies on a sufficiently
large amount of high-quality Ba0.6K0.4Fe2As2 for the production of wires and tapes in
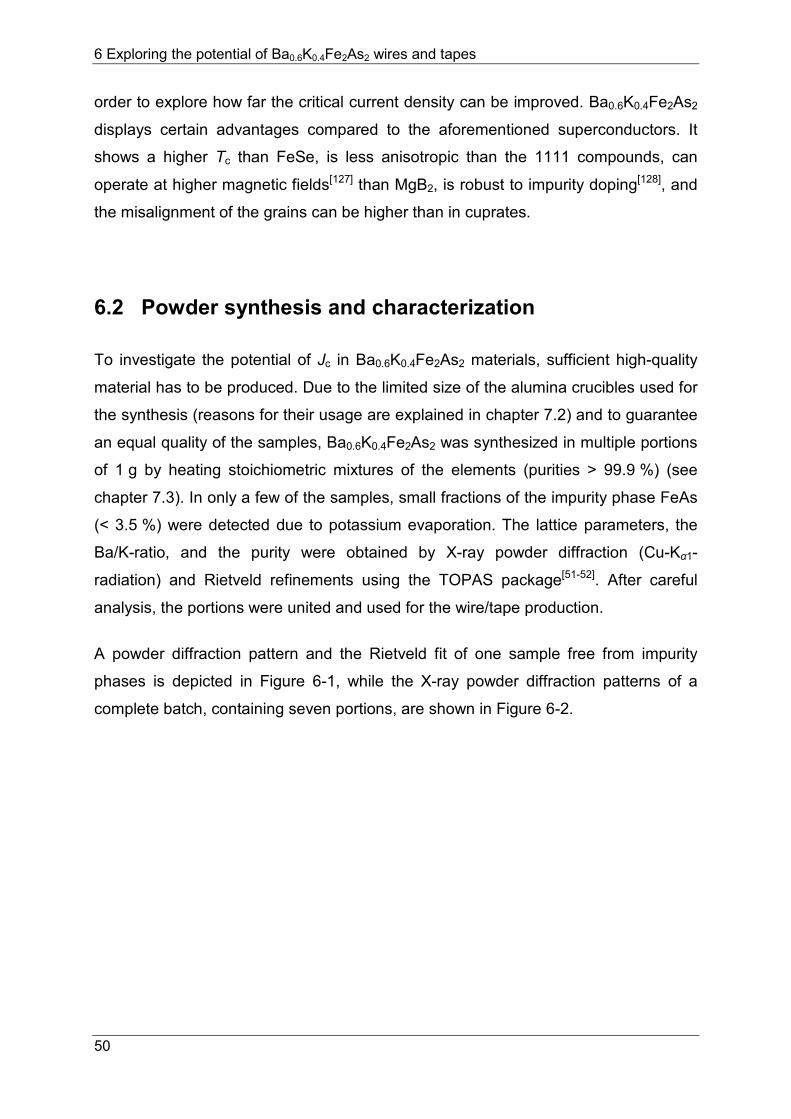
6 Exploring the potential of Ba0.6K0.4Fe2As2 wires and tapes
50
order to explore how far the critical current density can be improved. Ba0.6K0.4Fe2As2
displays certain advantages compared to the aforementioned superconductors. It
shows a higher Tc than FeSe, is less anisotropic than the 1111 compounds, can
operate at higher magnetic fields[127] than MgB2, is robust to impurity doping[128], and
the misalignment of the grains can be higher than in cuprates.
6.2 Powder synthesis and characterization
To investigate the potential of Jc in Ba0.6K0.4Fe2As2 materials, sufficient high-quality
material has to be produced. Due to the limited size of the alumina crucibles used for
the synthesis (reasons for their usage are explained in chapter 7.2) and to guarantee
an equal quality of the samples, Ba0.6K0.4Fe2As2 was synthesized in multiple portions
of 1 g by heating stoichiometric mixtures of the elements (purities > 99.9 %) (see
chapter 7.3). In only a few of the samples, small fractions of the impurity phase FeAs
(< 3.5 %) were detected due to potassium evaporation. The lattice parameters, the
Ba/K-ratio, and the purity were obtained by X-ray powder diffraction (Cu-Kα1-
radiation) and Rietveld refinements using the TOPAS package[51-52]. After careful
analysis, the portions were united and used for the wire/tape production.
A powder diffraction pattern and the Rietveld fit of one sample free from impurity
phases is depicted in Figure 6-1, while the X-ray powder diffraction patterns of a
complete batch, containing seven portions, are shown in Figure 6-2.
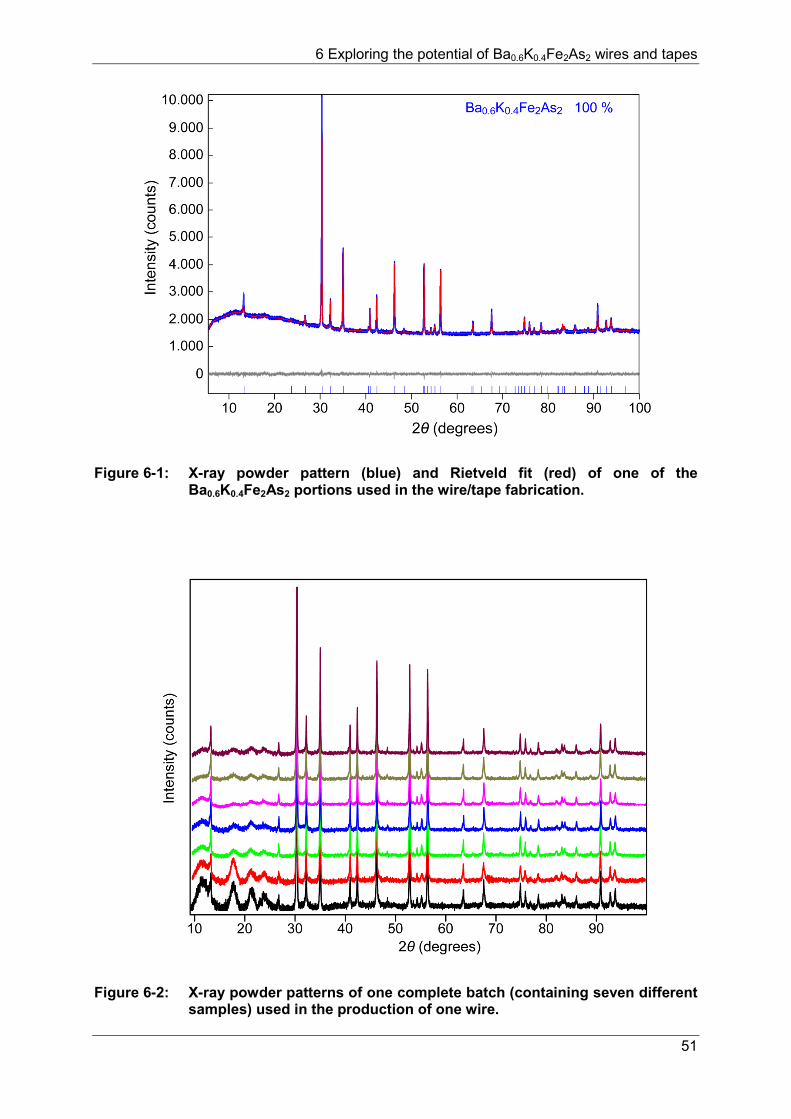
6 Exploring the potential of Ba0.6K0.4Fe2As2 wires and tapes
51
Figure 6-1: X-ray powder pattern (blue) and Rietveld fit (red) of one of the Ba0.6K0.4Fe2As2 portions used in the wire/tape fabrication.
Figure 6-2: X-ray powder patterns of one complete batch (containing seven different samples) used in the production of one wire.
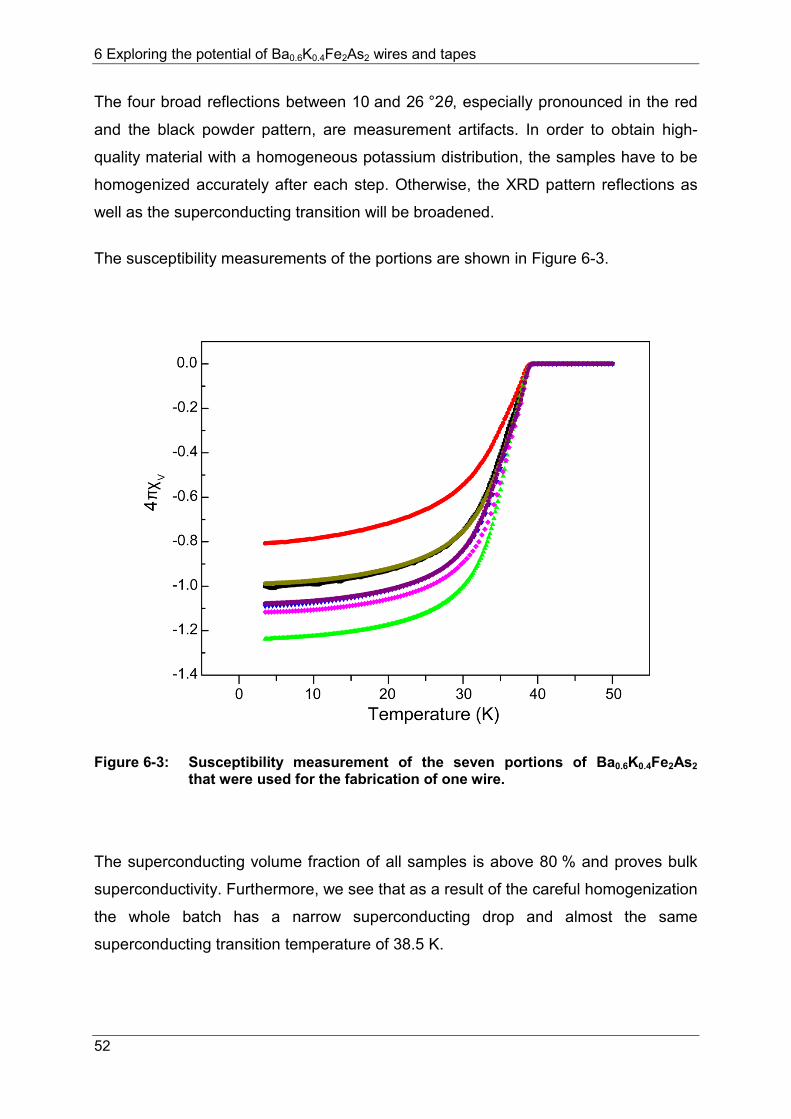
6 Exploring the potential of Ba0.6K0.4Fe2As2 wires and tapes
52
The four broad reflections between 10 and 26 °2θ, especially pronounced in the red
and the black powder pattern, are measurement artifacts. In order to obtain high-
quality material with a homogeneous potassium distribution, the samples have to be
homogenized accurately after each step. Otherwise, the XRD pattern reflections as
well as the superconducting transition will be broadened.
The susceptibility measurements of the portions are shown in Figure 6-3.
Figure 6-3: Susceptibility measurement of the seven portions of Ba0.6K0.4Fe2As2 that were used for the fabrication of one wire.
The superconducting volume fraction of all samples is above 80 % and proves bulk
superconductivity. Furthermore, we see that as a result of the careful homogenization
the whole batch has a narrow superconducting drop and almost the same
superconducting transition temperature of 38.5 K.
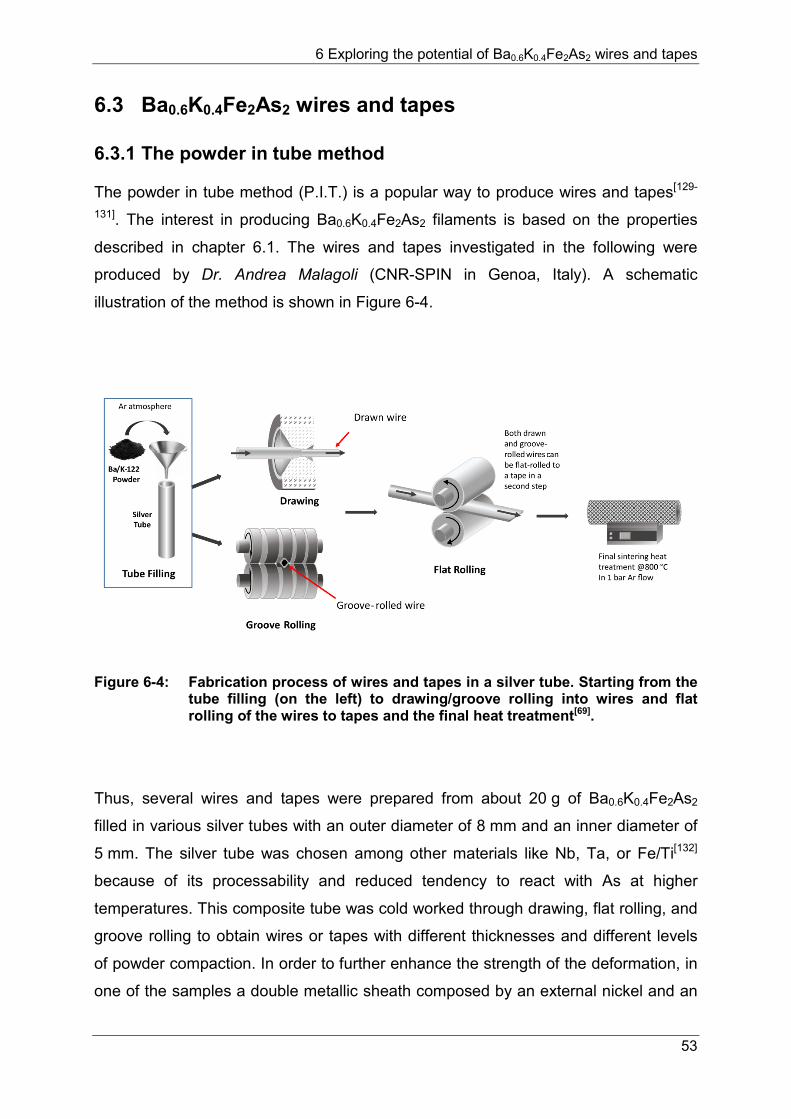
6 Exploring the potential of Ba0.6K0.4Fe2As2 wires and tapes
53
6.3 Ba0.6K0.4Fe2As2 wires and tapes
6.3.1 The powder in tube method
The powder in tube method (P.I.T.) is a popular way to produce wires and tapes[129-
131]. The interest in producing Ba0.6K0.4Fe2As2 filaments is based on the properties
described in chapter 6.1. The wires and tapes investigated in the following were
produced by Dr. Andrea Malagoli (CNR-SPIN in Genoa, Italy). A schematic
illustration of the method is shown in Figure 6-4.
Figure 6-4: Fabrication process of wires and tapes in a silver tube. Starting from the tube filling (on the left) to drawing/groove rolling into wires and flat rolling of the wires to tapes and the final heat treatment[69].
Thus, several wires and tapes were prepared from about 20 g of Ba0.6K0.4Fe2As2
filled in various silver tubes with an outer diameter of 8 mm and an inner diameter of
5 mm. The silver tube was chosen among other materials like Nb, Ta, or Fe/Ti[132]
because of its processability and reduced tendency to react with As at higher
temperatures. This composite tube was cold worked through drawing, flat rolling, and
groove rolling to obtain wires or tapes with different thicknesses and different levels
of powder compaction. In order to further enhance the strength of the deformation, in
one of the samples a double metallic sheath composed by an external nickel and an
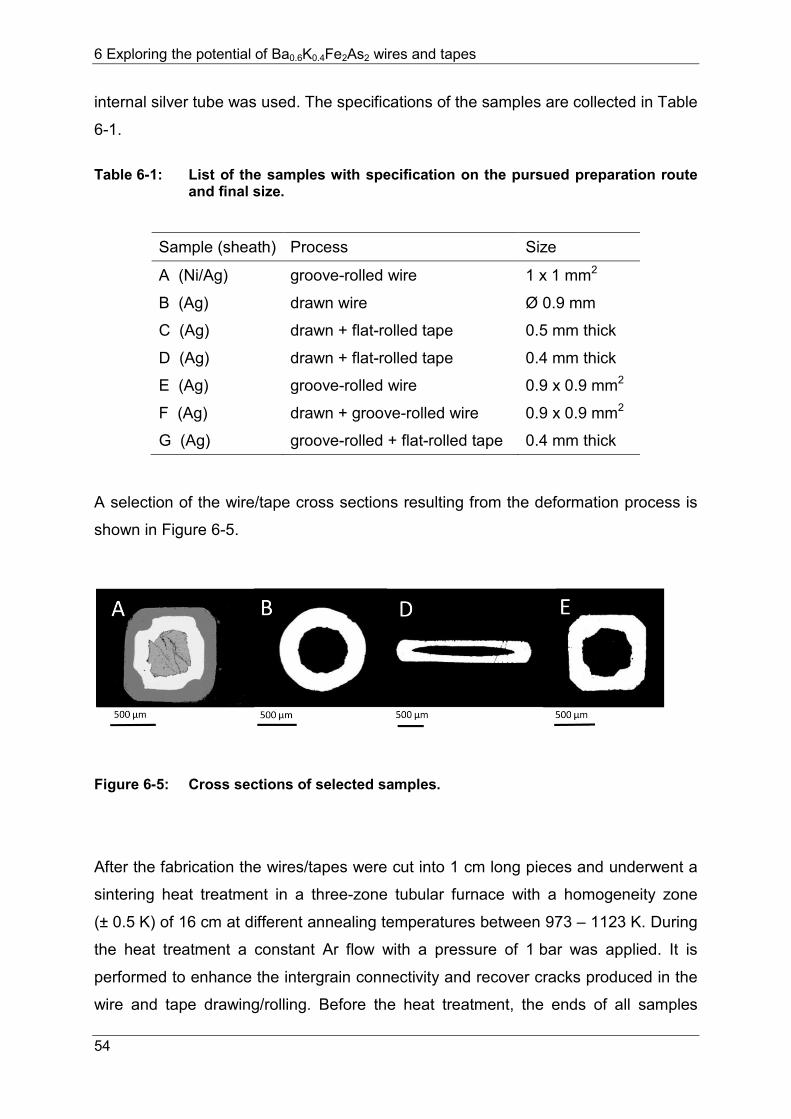
6 Exploring the potential of Ba0.6K0.4Fe2As2 wires and tapes
54
internal silver tube was used. The specifications of the samples are collected in Table
6-1.
Table 6-1: List of the samples with specification on the pursued preparation route and final size.
Sample (sheath) Process Size
A (Ni/Ag) groove-rolled wire 1 x 1 mm2
B (Ag) drawn wire Ø 0.9 mm
C (Ag) drawn + flat-rolled tape 0.5 mm thick
D (Ag) drawn + flat-rolled tape 0.4 mm thick
E (Ag) groove-rolled wire 0.9 x 0.9 mm2
F (Ag) drawn + groove-rolled wire 0.9 x 0.9 mm2
G (Ag) groove-rolled + flat-rolled tape 0.4 mm thick
A selection of the wire/tape cross sections resulting from the deformation process is
shown in Figure 6-5.
Figure 6-5: Cross sections of selected samples.
After the fabrication the wires/tapes were cut into 1 cm long pieces and underwent a
sintering heat treatment in a three-zone tubular furnace with a homogeneity zone
(± 0.5 K) of 16 cm at different annealing temperatures between 973 – 1123 K. During
the heat treatment a constant Ar flow with a pressure of 1 bar was applied. It is
performed to enhance the intergrain connectivity and recover cracks produced in the
wire and tape drawing/rolling. Before the heat treatment, the ends of all samples
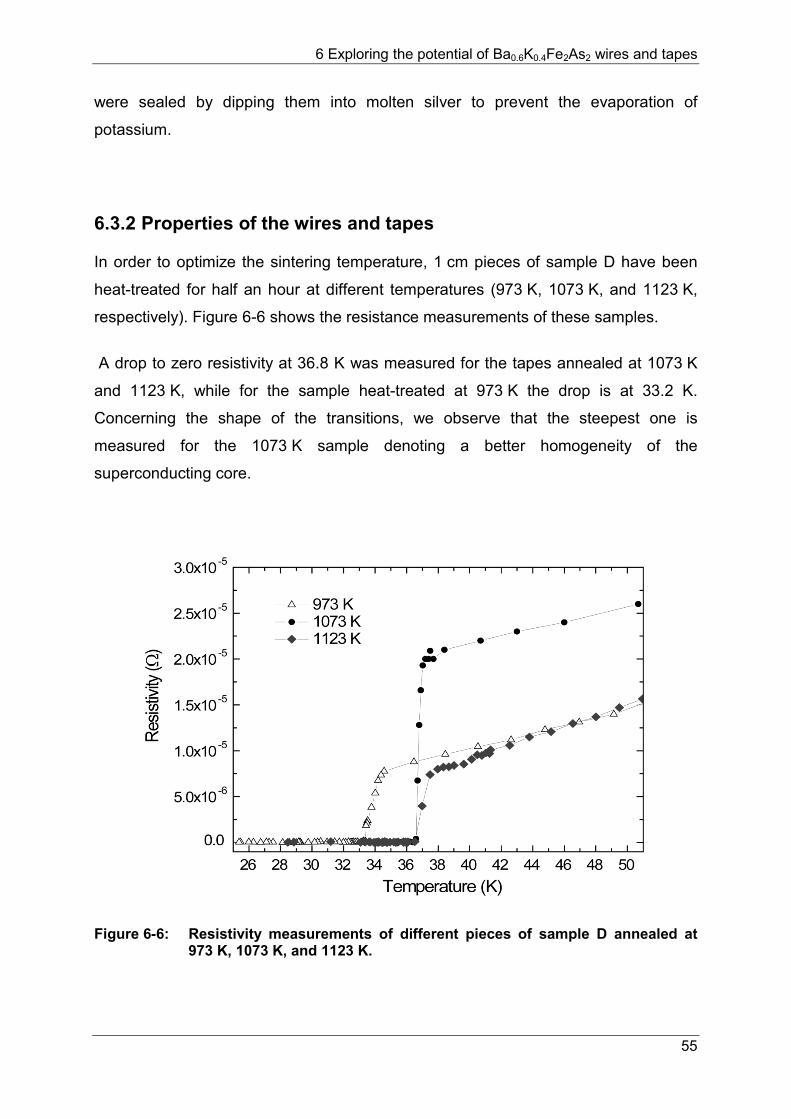
6 Exploring the potential of Ba0.6K0.4Fe2As2 wires and tapes
55
were sealed by dipping them into molten silver to prevent the evaporation of
potassium.
6.3.2 Properties of the wires and tapes
In order to optimize the sintering temperature, 1 cm pieces of sample D have been
heat-treated for half an hour at different temperatures (973 K, 1073 K, and 1123 K,
respectively). Figure 6-6 shows the resistance measurements of these samples.
A drop to zero resistivity at 36.8 K was measured for the tapes annealed at 1073 K
and 1123 K, while for the sample heat-treated at 973 K the drop is at 33.2 K.
Concerning the shape of the transitions, we observe that the steepest one is
measured for the 1073 K sample denoting a better homogeneity of the
superconducting core.
Figure 6-6: Resistivity measurements of different pieces of sample D annealed at 973 K, 1073 K, and 1123 K.
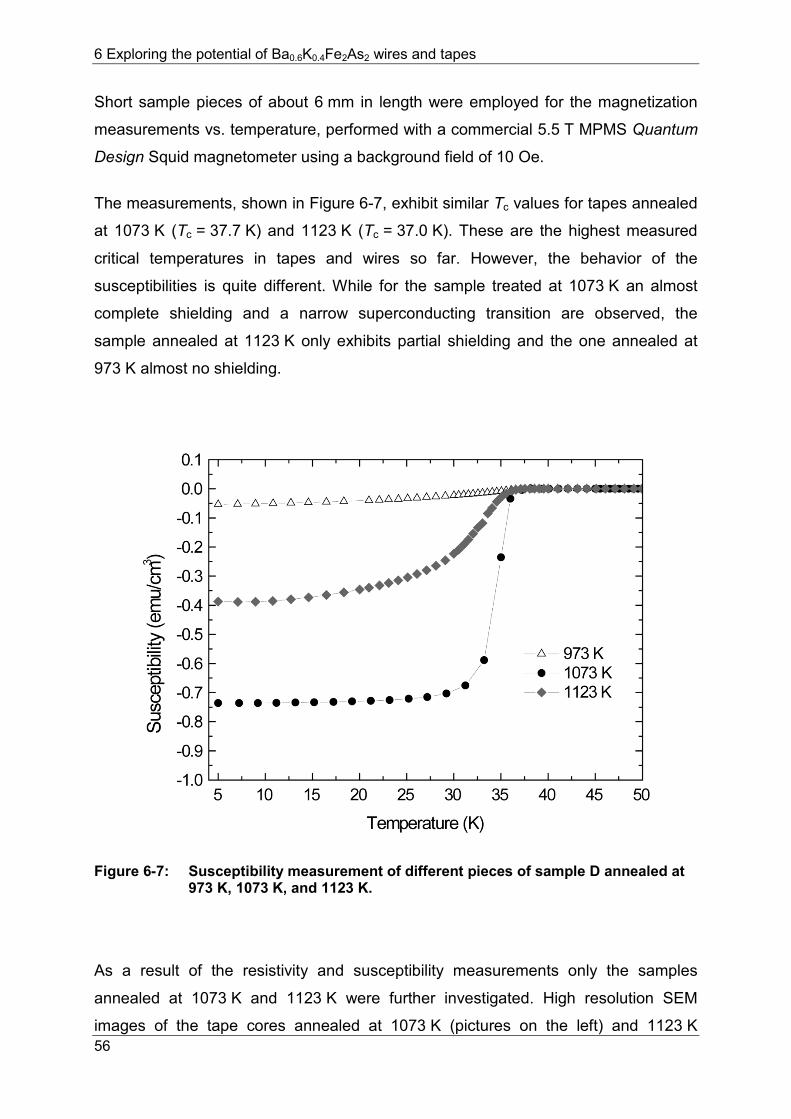
6 Exploring the potential of Ba0.6K0.4Fe2As2 wires and tapes
56
Short sample pieces of about 6 mm in length were employed for the magnetization
measurements vs. temperature, performed with a commercial 5.5 T MPMS Quantum
Design Squid magnetometer using a background field of 10 Oe.
The measurements, shown in Figure 6-7, exhibit similar Tc values for tapes annealed
at 1073 K (Tc = 37.7 K) and 1123 K (Tc = 37.0 K). These are the highest measured
critical temperatures in tapes and wires so far. However, the behavior of the
susceptibilities is quite different. While for the sample treated at 1073 K an almost
complete shielding and a narrow superconducting transition are observed, the
sample annealed at 1123 K only exhibits partial shielding and the one annealed at
973 K almost no shielding.
Figure 6-7: Susceptibility measurement of different pieces of sample D annealed at 973 K, 1073 K, and 1123 K.
As a result of the resistivity and susceptibility measurements only the samples
annealed at 1073 K and 1123 K were further investigated. High resolution SEM
images of the tape cores annealed at 1073 K (pictures on the left) and 1123 K
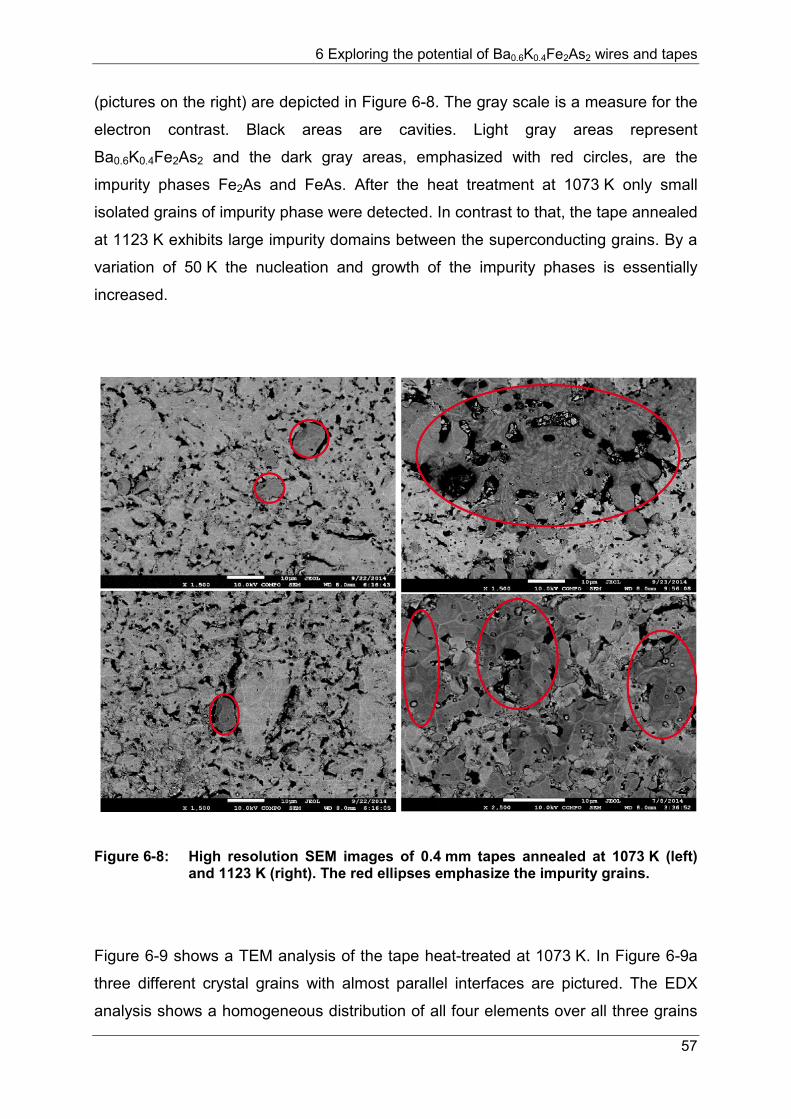
6 Exploring the potential of Ba0.6K0.4Fe2As2 wires and tapes
57
(pictures on the right) are depicted in Figure 6-8. The gray scale is a measure for the
electron contrast. Black areas are cavities. Light gray areas represent
Ba0.6K0.4Fe2As2 and the dark gray areas, emphasized with red circles, are the
impurity phases Fe2As and FeAs. After the heat treatment at 1073 K only small
isolated grains of impurity phase were detected. In contrast to that, the tape annealed
at 1123 K exhibits large impurity domains between the superconducting grains. By a
variation of 50 K the nucleation and growth of the impurity phases is essentially
increased.
Figure 6-8: High resolution SEM images of 0.4 mm tapes annealed at 1073 K (left) and 1123 K (right). The red ellipses emphasize the impurity grains.
Figure 6-9 shows a TEM analysis of the tape heat-treated at 1073 K. In Figure 6-9a
three different crystal grains with almost parallel interfaces are pictured. The EDX
analysis shows a homogeneous distribution of all four elements over all three grains
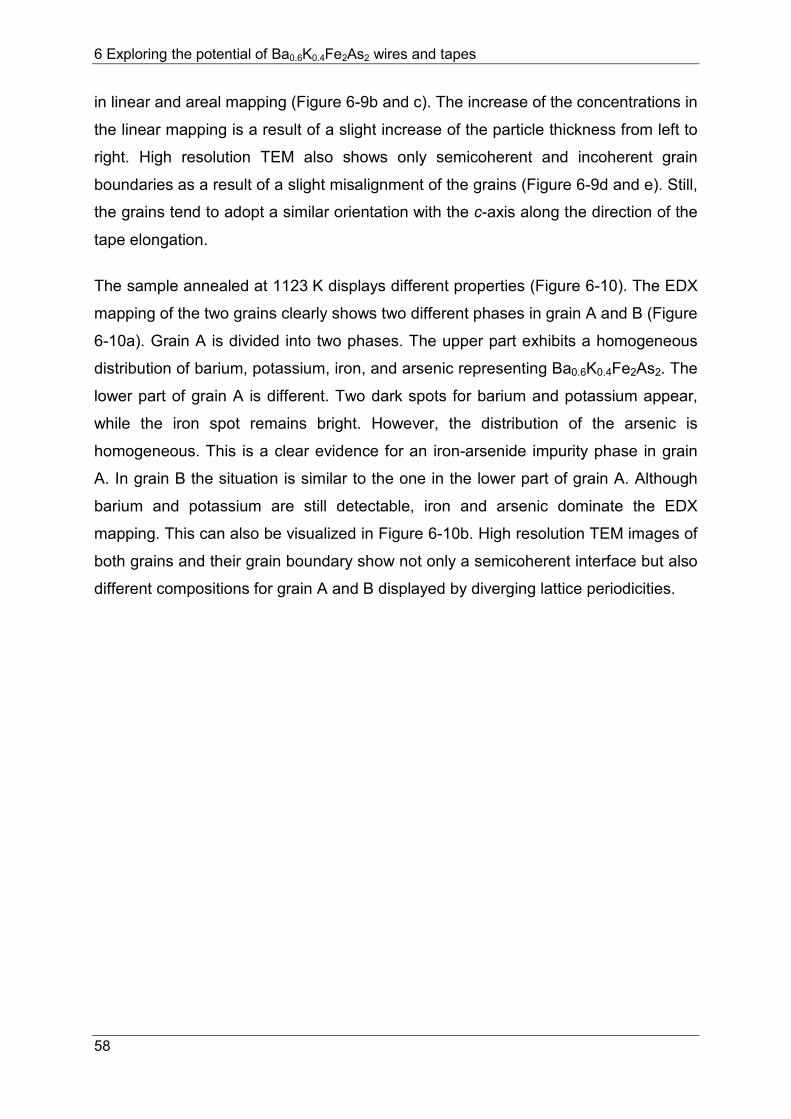
6 Exploring the potential of Ba0.6K0.4Fe2As2 wires and tapes
58
in linear and areal mapping (Figure 6-9b and c). The increase of the concentrations in
the linear mapping is a result of a slight increase of the particle thickness from left to
right. High resolution TEM also shows only semicoherent and incoherent grain
boundaries as a result of a slight misalignment of the grains (Figure 6-9d and e). Still,
the grains tend to adopt a similar orientation with the c-axis along the direction of the
tape elongation.
The sample annealed at 1123 K displays different properties (Figure 6-10). The EDX
mapping of the two grains clearly shows two different phases in grain A and B (Figure
6-10a). Grain A is divided into two phases. The upper part exhibits a homogeneous
distribution of barium, potassium, iron, and arsenic representing Ba0.6K0.4Fe2As2. The
lower part of grain A is different. Two dark spots for barium and potassium appear,
while the iron spot remains bright. However, the distribution of the arsenic is
homogeneous. This is a clear evidence for an iron-arsenide impurity phase in grain
A. In grain B the situation is similar to the one in the lower part of grain A. Although
barium and potassium are still detectable, iron and arsenic dominate the EDX
mapping. This can also be visualized in Figure 6-10b. High resolution TEM images of
both grains and their grain boundary show not only a semicoherent interface but also
different compositions for grain A and B displayed by diverging lattice periodicities.
6 Exploring the potential of Ba0.6K0.4Fe2As2 wires and tapes
59
Figure 6-9: TEM analysis of the sample annealed at 1073 K. a) Three connected grains A, B, and C of Ba0.6K0.4Fe2As2 with almost parallel interfaces recorded by EFTEM (the black arrow displays the direction of the elongation). b) HAADF image with EDX analysis of A, B, and C. The grain boundaries are marked by black dotted lines and the white arrow displays the direction of the elongation. c) Areal EDX mapping of the HAADF image. d) High resolution TEM of the grain boundaries observed along the -201 zone axis. e) Fourier transform (FT) of the three grains showing the 204, 112, and the 020 spots of Ba0.6K0.4Fe2As2.
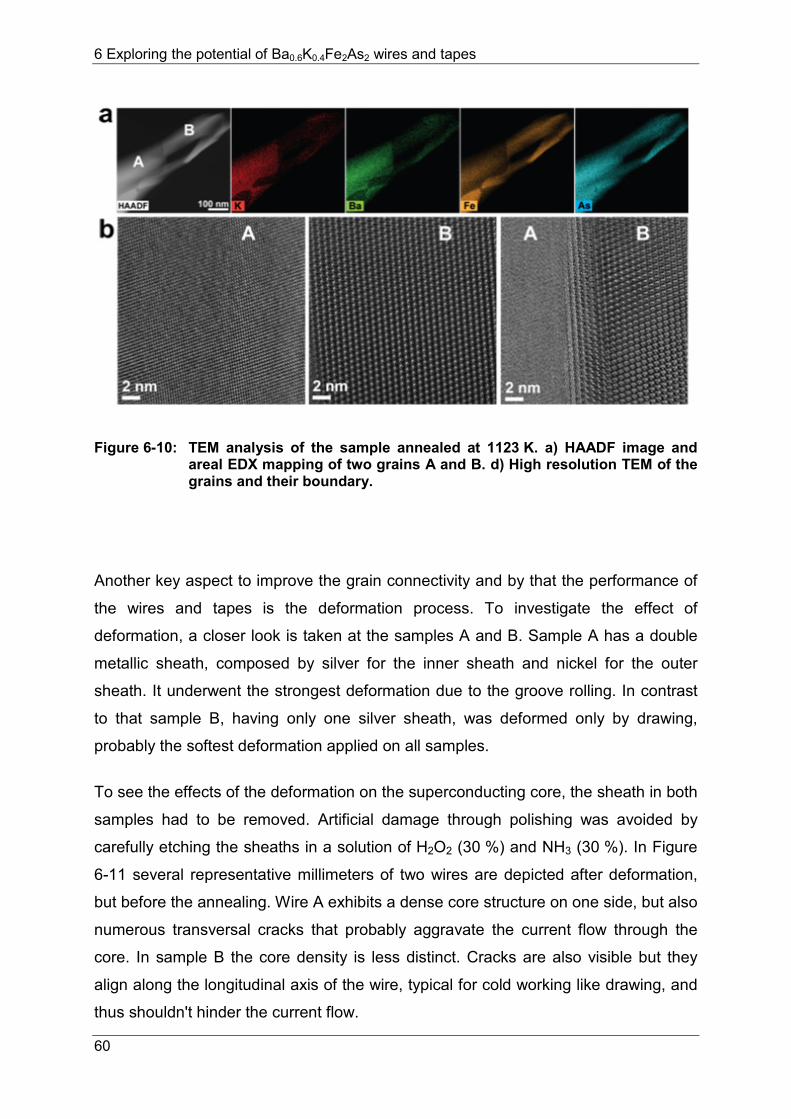
6 Exploring the potential of Ba0.6K0.4Fe2As2 wires and tapes
60
Figure 6-10: TEM analysis of the sample annealed at 1123 K. a) HAADF image and areal EDX mapping of two grains A and B. d) High resolution TEM of the grains and their boundary.
Another key aspect to improve the grain connectivity and by that the performance of
the wires and tapes is the deformation process. To investigate the effect of
deformation, a closer look is taken at the samples A and B. Sample A has a double
metallic sheath, composed by silver for the inner sheath and nickel for the outer
sheath. It underwent the strongest deformation due to the groove rolling. In contrast
to that sample B, having only one silver sheath, was deformed only by drawing,
probably the softest deformation applied on all samples.
To see the effects of the deformation on the superconducting core, the sheath in both
samples had to be removed. Artificial damage through polishing was avoided by
carefully etching the sheaths in a solution of H2O2 (30 %) and NH3 (30 %). In Figure
6-11 several representative millimeters of two wires are depicted after deformation,
but before the annealing. Wire A exhibits a dense core structure on one side, but also
numerous transversal cracks that probably aggravate the current flow through the
core. In sample B the core density is less distinct. Cracks are also visible but they
align along the longitudinal axis of the wire, typical for cold working like drawing, and
thus shouldn't hinder the current flow.
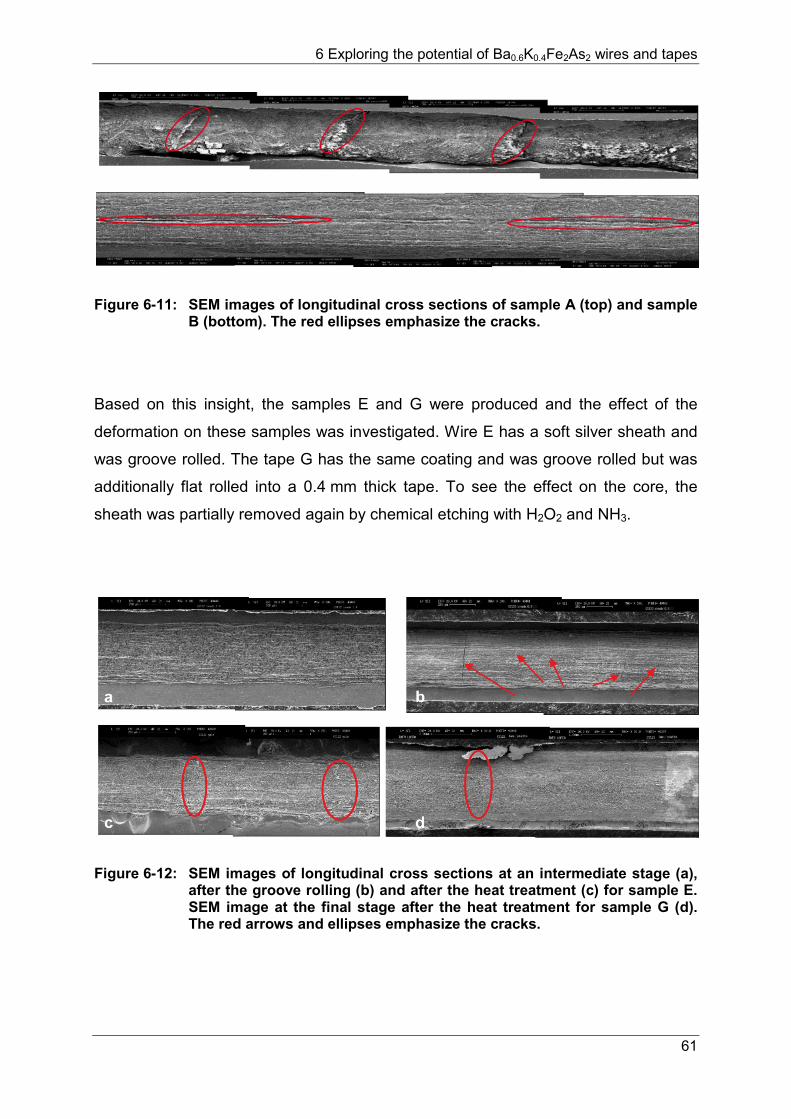
6 Exploring the potential of Ba0.6K0.4Fe2As2 wires and tapes
61
Figure 6-11: SEM images of longitudinal cross sections of sample A (top) and sample B (bottom). The red ellipses emphasize the cracks.
Based on this insight, the samples E and G were produced and the effect of the
deformation on these samples was investigated. Wire E has a soft silver sheath and
was groove rolled. The tape G has the same coating and was groove rolled but was
additionally flat rolled into a 0.4 mm thick tape. To see the effect on the core, the
sheath was partially removed again by chemical etching with H2O2 and NH3.
Figure 6-12: SEM images of longitudinal cross sections at an intermediate stage (a), after the groove rolling (b) and after the heat treatment (c) for sample E. SEM image at the final stage after the heat treatment for sample G (d). The red arrows and ellipses emphasize the cracks.
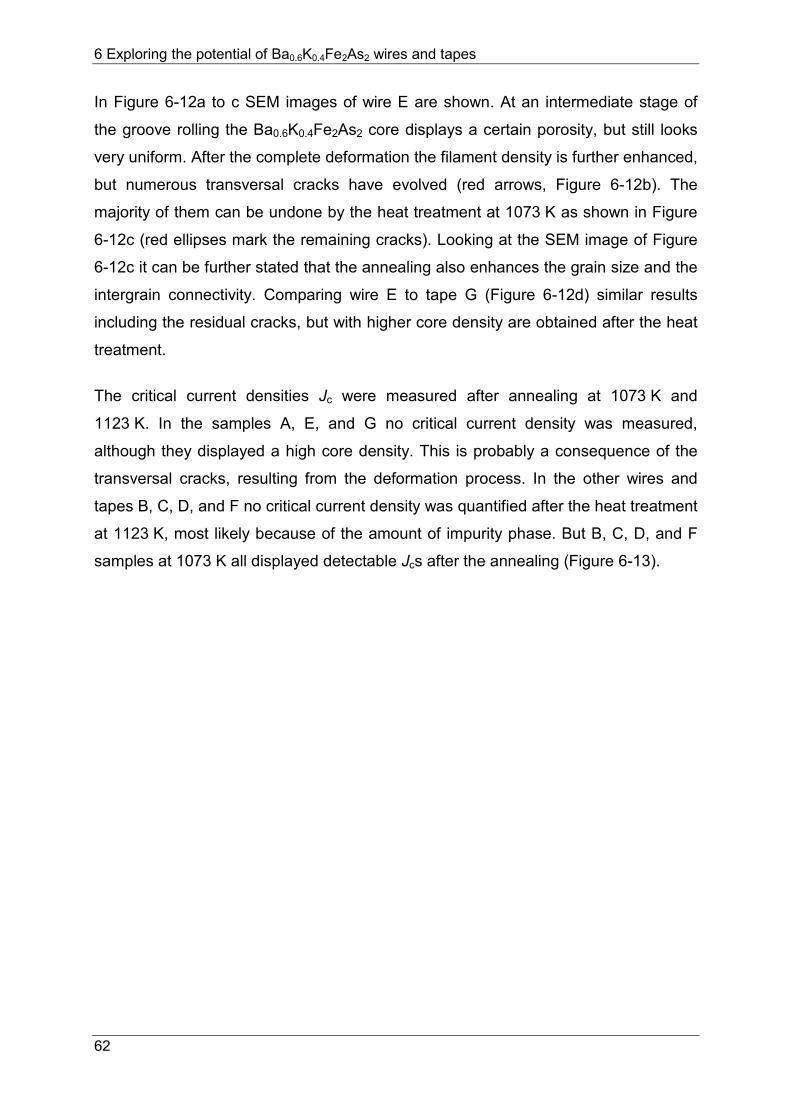
6 Exploring the potential of Ba0.6K0.4Fe2As2 wires and tapes
62
In Figure 6-12a to c SEM images of wire E are shown. At an intermediate stage of
the groove rolling the Ba0.6K0.4Fe2As2 core displays a certain porosity, but still looks
very uniform. After the complete deformation the filament density is further enhanced,
but numerous transversal cracks have evolved (red arrows, Figure 6-12b). The
majority of them can be undone by the heat treatment at 1073 K as shown in Figure
6-12c (red ellipses mark the remaining cracks). Looking at the SEM image of Figure
6-12c it can be further stated that the annealing also enhances the grain size and the
intergrain connectivity. Comparing wire E to tape G (Figure 6-12d) similar results
including the residual cracks, but with higher core density are obtained after the heat
treatment.
The critical current densities Jc were measured after annealing at 1073 K and
1123 K. In the samples A, E, and G no critical current density was measured,
although they displayed a high core density. This is probably a consequence of the
transversal cracks, resulting from the deformation process. In the other wires and
tapes B, C, D, and F no critical current density was quantified after the heat treatment
at 1123 K, most likely because of the amount of impurity phase. But B, C, D, and F
samples at 1073 K all displayed detectable Jcs after the annealing (Figure 6-13).
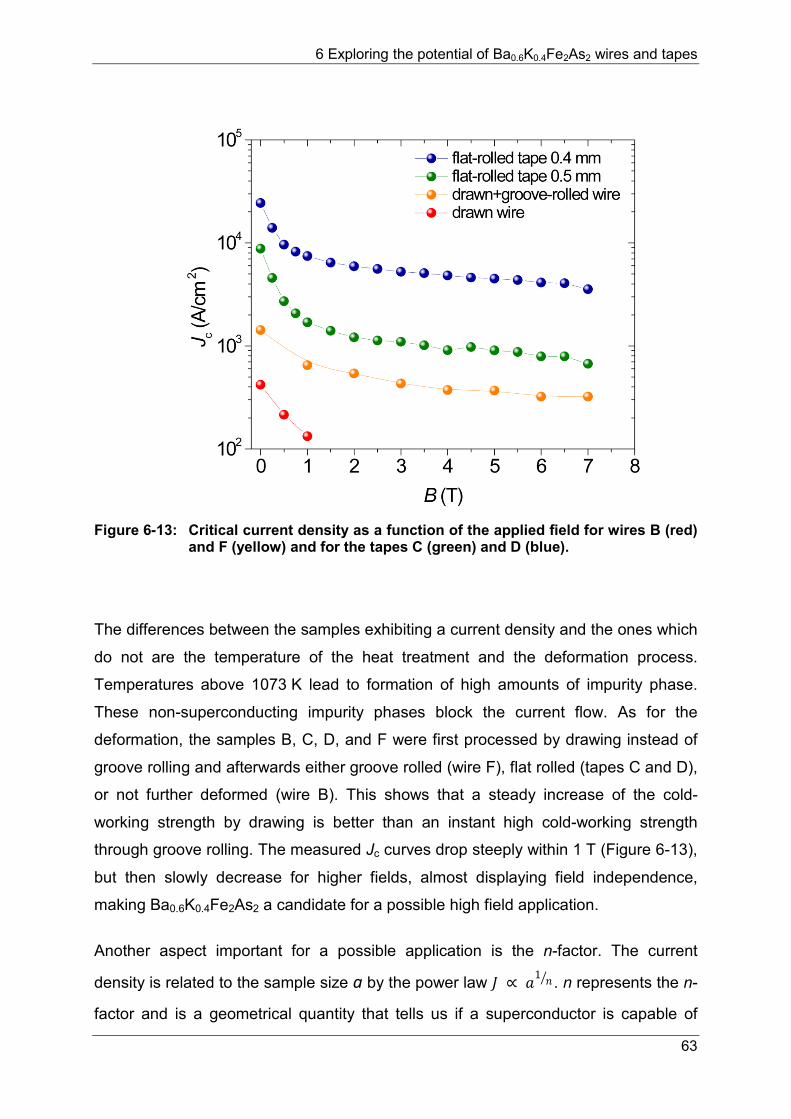
6 Exploring the potential of Ba0.6K0.4Fe2As2 wires and tapes
63
Figure 6-13: Critical current density as a function of the applied field for wires B (red) and F (yellow) and for the tapes C (green) and D (blue).
The differences between the samples exhibiting a current density and the ones which
do not are the temperature of the heat treatment and the deformation process.
Temperatures above 1073 K lead to formation of high amounts of impurity phase.
These non-superconducting impurity phases block the current flow. As for the
deformation, the samples B, C, D, and F were first processed by drawing instead of
groove rolling and afterwards either groove rolled (wire F), flat rolled (tapes C and D),
or not further deformed (wire B). This shows that a steady increase of the cold-
working strength by drawing is better than an instant high cold-working strength
through groove rolling. The measured Jc curves drop steeply within 1 T (Figure 6-13),
but then slowly decrease for higher fields, almost displaying field independence,
making Ba0.6K0.4Fe2As2 a candidate for a possible high field application.
Another aspect important for a possible application is the n-factor. The current
density is related to the sample size a by the power law 𝐽𝐽 ∝ 𝑎𝑎1 𝑛𝑛� . n represents the n-
factor and is a geometrical quantity that tells us if a superconductor is capable of
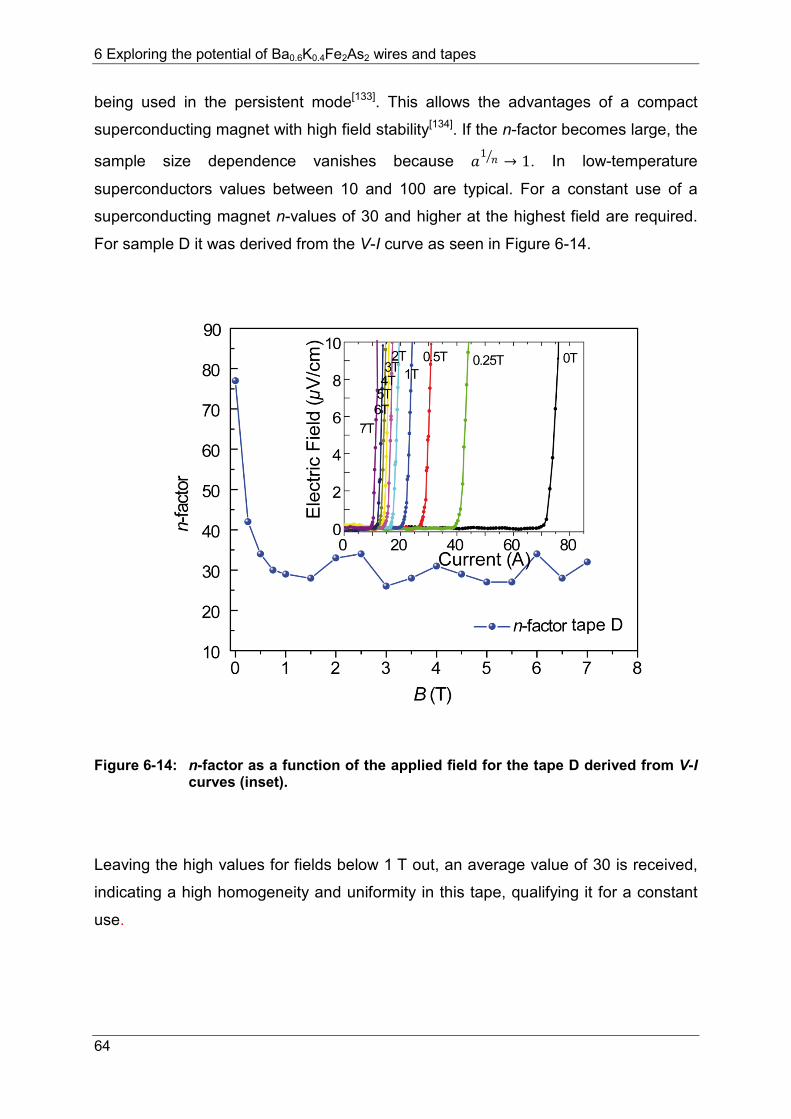
6 Exploring the potential of Ba0.6K0.4Fe2As2 wires and tapes
64
being used in the persistent mode[133]. This allows the advantages of a compact
superconducting magnet with high field stability[134]. If the n-factor becomes large, the
sample size dependence vanishes because 𝑎𝑎1 𝑛𝑛� → 1. In low-temperature
superconductors values between 10 and 100 are typical. For a constant use of a
superconducting magnet n-values of 30 and higher at the highest field are required.
For sample D it was derived from the V-I curve as seen in Figure 6-14.
Figure 6-14: n-factor as a function of the applied field for the tape D derived from V-I curves (inset).
Leaving the high values for fields below 1 T out, an average value of 30 is received,
indicating a high homogeneity and uniformity in this tape, qualifying it for a constant
use.
6 Exploring the potential of Ba0.6K0.4Fe2As2 wires and tapes
65
6.4 Discussion
In this chapter the production process and its impact on the physical properties of
Ba0.6K0.4Fe2As2 wires was investigated. Regarding the heat treatment, the path
without additional pressure was chosen that can be applied in up-scaled processes
for industrial use. Additional pressure during the synthetic process as performed in
[135-136] results in a possible enhancement of the core density, thus in a better grain
connectivity, and prevents element losses, leading to improved superconducting
properties, but it is clear that this would complicate and raise the price for long wires.
Element loss in the case of the before-investigated samples was averted by sealing
the ends with molten silver. Here, three different temperature programs at 973 K,
1073 K, and 1123 K were tested. The best results obtained here were those heat-
treated at 1073 K, showing values for Jc comparable with those reported for similar
cold-rolled tapes[137]. At 1123 K the formation of large amounts of the impurity phases
FeAs and Fe2As (Figure 6-8) was observed. The increased nucleation of impurity
phases achieved by applying temperatures higher than 1073 K is in agreement with
results known from literature described and discussed previously on FeAs-based
superconductors[124, 135]. On the other hand, at 973 K the temperature was not high
enough to obtain a proper sintering, improve the grain connectivity, and the Tc of only
33 K was measured with almost no shielding (Figure 6-7). Before using the powder
for the wire production, it displayed almost optimal Tc (38.5 K). Possibly an oxygen-
contaminated Ar flow during the heat treatment led to the reduced superconducting
properties.
Looking at the effect of the cold deformation on the microstructure, significant points
for the manufacturing were revealed and confirmed. As seen before[118], a desirable
high density of the superconducting core can be achieved by strong deformation of
the tube in the PIT processes. The downside is that the strong forces on the tube
cause transversal cracks, limiting the current flow in the superconductor. A softer
drawing instead of groove rolling avoids the evolution of cracks (Figure 6-11), but
causes a higher porosity of the core. Constant flat rolling of the drawn wire (Figure
6-9) increases the core density and enhances the superconducting performance, but
also provokes cracks, even though less than in groove-rolled samples. However,
through annealing of the cold-worked wires and tapes, the cracks can be undone
6 Exploring the potential of Ba0.6K0.4Fe2As2 wires and tapes
66
(Figure 6-12) and critical current densities were obtained (Figure 6-13). The received
critical current densities display a weak field dependence and values up to
2x10⁴ A/cm2 at low magnetic fields and critical temperatures up to 37.7 K. Jc values
considerably higher than these have already been reported: Jcs > 1x10⁵ A/cm2 at low
fields and 7.7x10⁴ A/cm2 at 10 T in double-sheathed Ba0.6K0.4Fe2As2 tapes[68]. Still,
the Tc reported there (37.2 K) is lower, indicating either a worse potassium
distribution or a slight deviation from the Ba0.6K0.4Fe2As2 stoichiometry, because of
the usage of up to 20 % excess potassium. In contrast to that, the samples presented
here were synthesized using stoichiometric mixtures, maintaining the control of the
final product's stoichiometry. A homogeneous distribution of the potassium in our
tapes was also verified by the n-factor with an average value above 30 on a cm
scale. This confirms the potential of these tapes for real application. Nevertheless,
looking at the values of Jc there still is room for further improvement. To avoid a
worsening of the superconducting properties, the heat treatment should be executed
in a strictly water- and oxygen-free environment. Moreover, using a third sheath and
flat rolling the tape to even smaller thicknesses could perhaps further improve the
critical current density above 105 A/cm2 at high magnetic fields.
7 Optimizing the synthesis process of Ba1-xKxFe2As2
67
7 Optimizing the synthesis process of Ba1-xKxFe2As2
7.1 Motivation
Upscaling of the Ba1-xKxFe2As2 synthesis is an important issue for further
investigations concerning a possible application. This is especially interesting for
Ba0.6K0.4Fe2As2 because of its Tc = 39 K and its high upper critical field Hc2[123]
. The
known processes for powder samples base on the reaction of the elements[17, 89, 138]
or use binary precursors[101, 109]. The reaction temperatures lie between 873 K and
1373 K. These paths mostly either use excess potassium (explained in chapter 7.2),
losing the control of the developing final product, or display considerable amounts of
impurity phases. In this thesis two strategies of synthesizing Ba1-xKxFe2As2 and
especially Ba0.6K0.4Fe2As2 are presented, using either the elements or ternary
precursors BaFe2As2 and KFe2As2 as starting materials.
7.2 Synthetic difficulties
A reaction of the starting materials with the container is one of the major issues.
Potassium metal is a strong reducing agent with a high vapor pressure (boiling point:
1027 K). Thus, reactions in oxide vessels like silica ampoules lead to a reaction of
the evaporated potassium with the ampoule. As a result, FeAs emerges as impurity
phase emerges (Figure 7-1). Therefore, using other metals like niobium as a
container material would make sense. But because of the high reaction temperatures
another problem occurs. At high temperatures the arsenic oxidizes the niobium,
resulting in impurity phases like Fe2As or various niobium arsenides. Hence a
compromise has been found using open alumina crucibles, chosen because of their
inert behavior and thermal stability. When adjusting the annealing temperature
properly and using alumina inlays (Figure 7-2) to reduce the free space in the
ampoule, the desired compound can be obtained without any element loss. This can
serve as a model for upscaling the synthetic process.
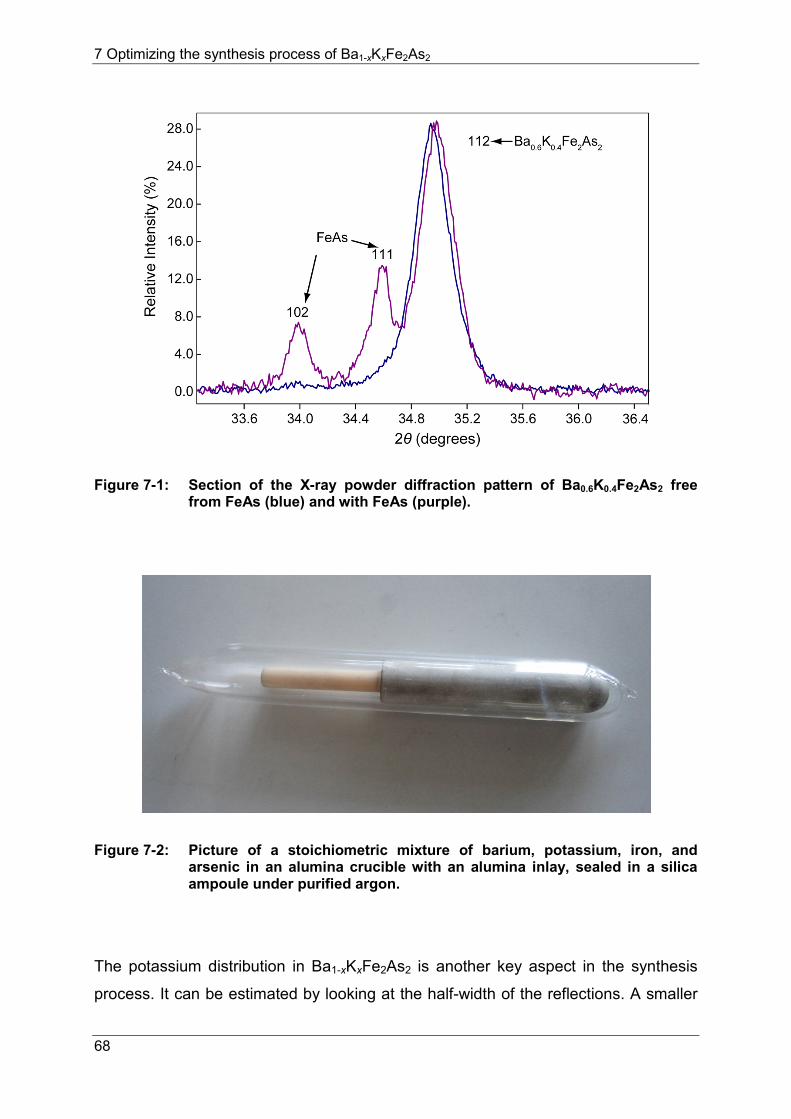
7 Optimizing the synthesis process of Ba1-xKxFe2As2
68
Figure 7-1: Section of the X-ray powder diffraction pattern of Ba0.6K0.4Fe2As2 free from FeAs (blue) and with FeAs (purple).
Figure 7-2: Picture of a stoichiometric mixture of barium, potassium, iron, and arsenic in an alumina crucible with an alumina inlay, sealed in a silica ampoule under purified argon.
The potassium distribution in Ba1-xKxFe2As2 is another key aspect in the synthesis
process. It can be estimated by looking at the half-width of the reflections. A smaller
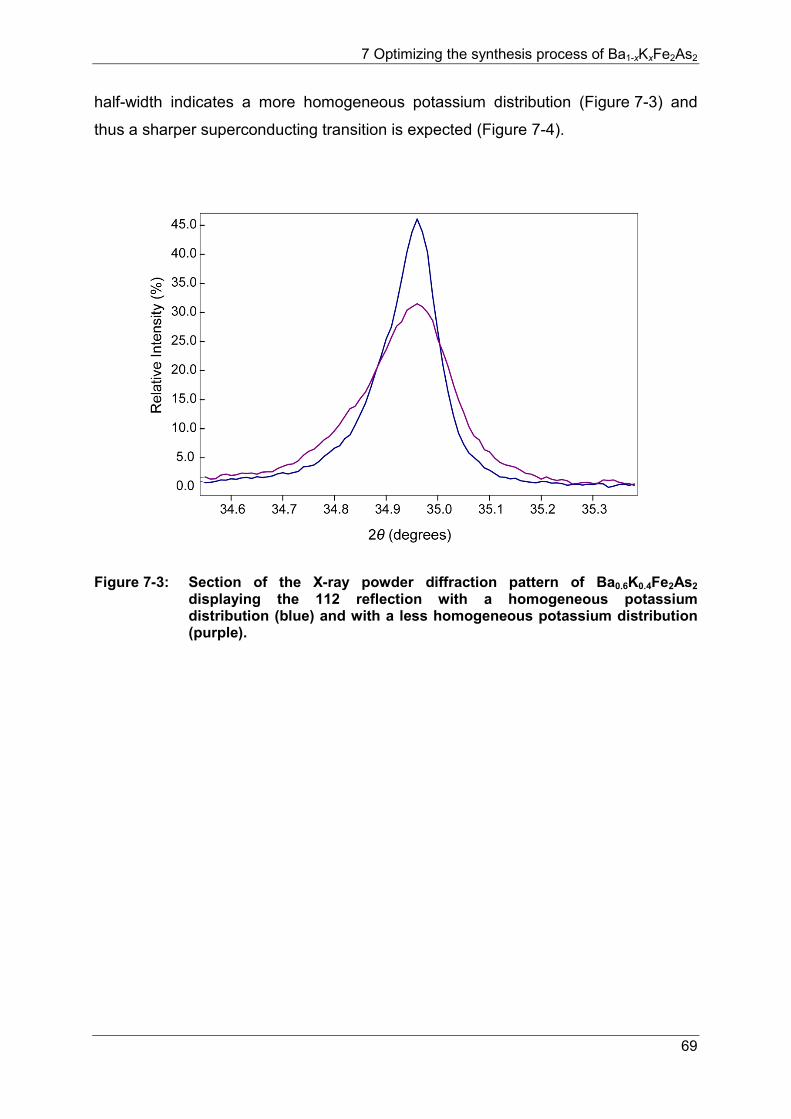
7 Optimizing the synthesis process of Ba1-xKxFe2As2
69
half-width indicates a more homogeneous potassium distribution (Figure 7-3) and
thus a sharper superconducting transition is expected (Figure 7-4).
Figure 7-3: Section of the X-ray powder diffraction pattern of Ba0.6K0.4Fe2As2 displaying the 112 reflection with a homogeneous potassium distribution (blue) and with a less homogeneous potassium distribution (purple).
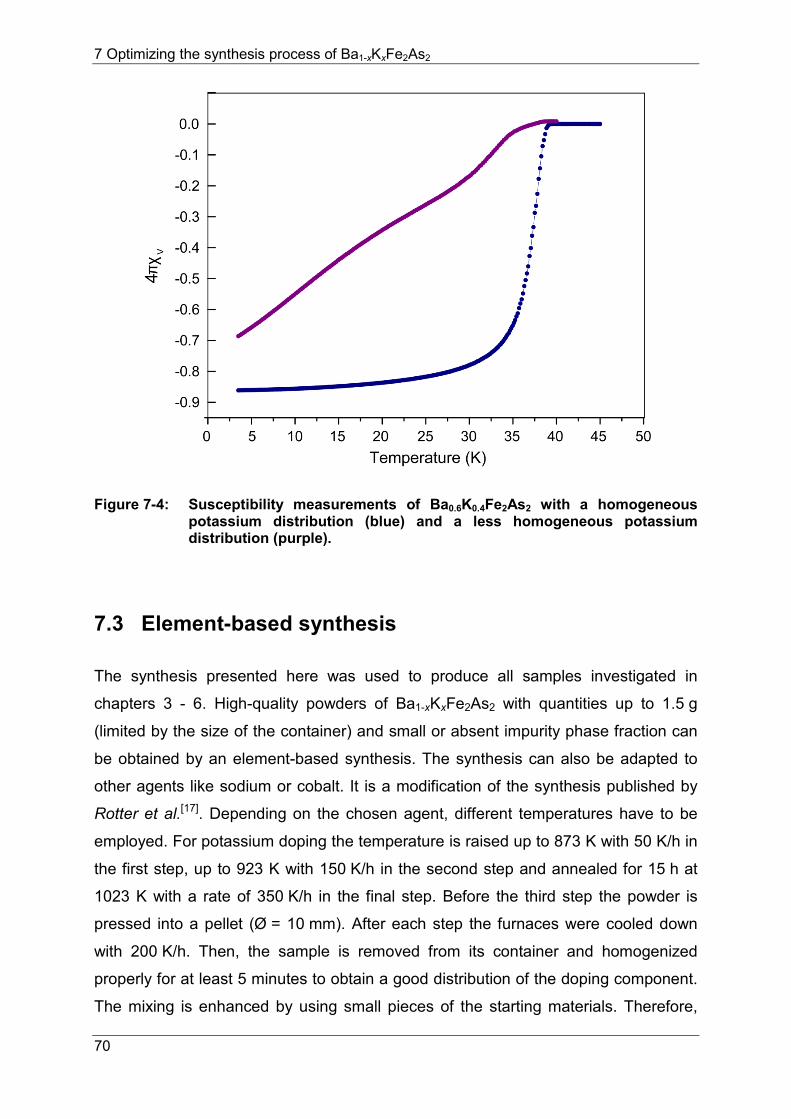
7 Optimizing the synthesis process of Ba1-xKxFe2As2
70
Figure 7-4: Susceptibility measurements of Ba0.6K0.4Fe2As2 with a homogeneous potassium distribution (blue) and a less homogeneous potassium distribution (purple).
7.3 Element-based synthesis
The synthesis presented here was used to produce all samples investigated in
chapters 3 - 6. High-quality powders of Ba1-xKxFe2As2 with quantities up to 1.5 g
(limited by the size of the container) and small or absent impurity phase fraction can
be obtained by an element-based synthesis. The synthesis can also be adapted to
other agents like sodium or cobalt. It is a modification of the synthesis published by
Rotter et al.[17]. Depending on the chosen agent, different temperatures have to be
employed. For potassium doping the temperature is raised up to 873 K with 50 K/h in
the first step, up to 923 K with 150 K/h in the second step and annealed for 15 h at
1023 K with a rate of 350 K/h in the final step. Before the third step the powder is
pressed into a pellet (Ø = 10 mm). After each step the furnaces were cooled down
with 200 K/h. Then, the sample is removed from its container and homogenized
properly for at least 5 minutes to obtain a good distribution of the doping component.
The mixing is enhanced by using small pieces of the starting materials. Therefore,
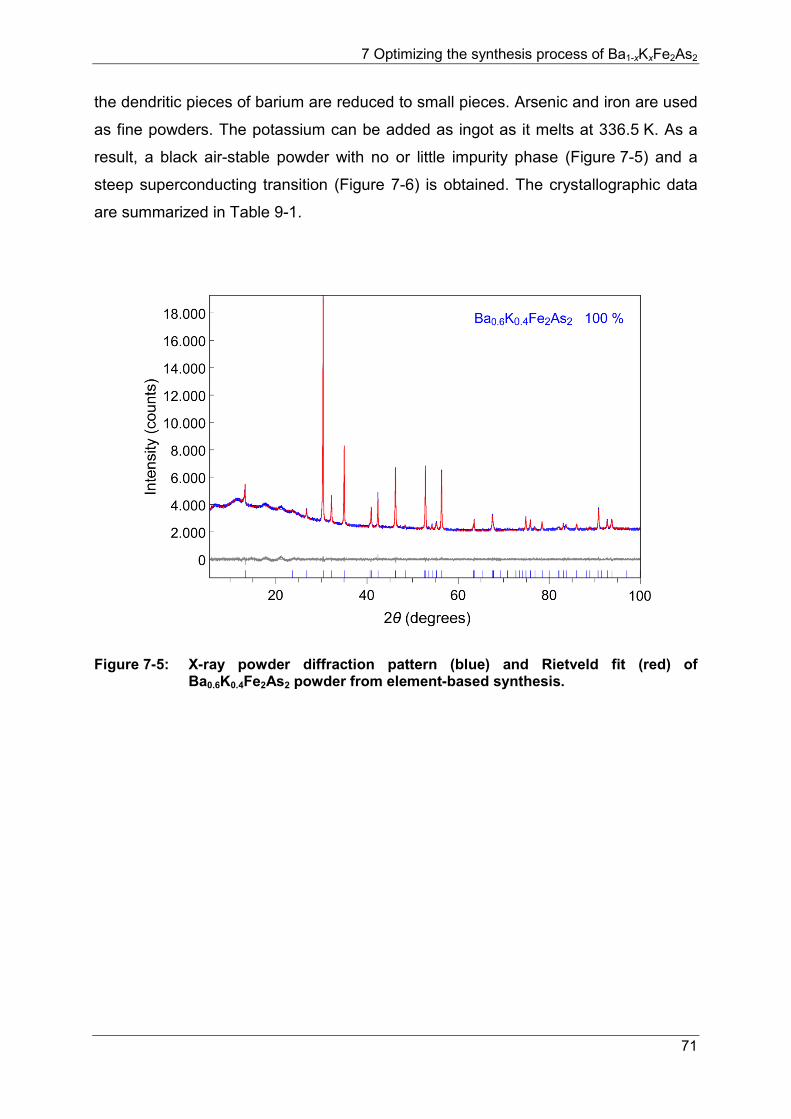
7 Optimizing the synthesis process of Ba1-xKxFe2As2
71
the dendritic pieces of barium are reduced to small pieces. Arsenic and iron are used
as fine powders. The potassium can be added as ingot as it melts at 336.5 K. As a
result, a black air-stable powder with no or little impurity phase (Figure 7-5) and a
steep superconducting transition (Figure 7-6) is obtained. The crystallographic data
are summarized in Table 9-1.
Figure 7-5: X-ray powder diffraction pattern (blue) and Rietveld fit (red) of Ba0.6K0.4Fe2As2 powder from element-based synthesis.
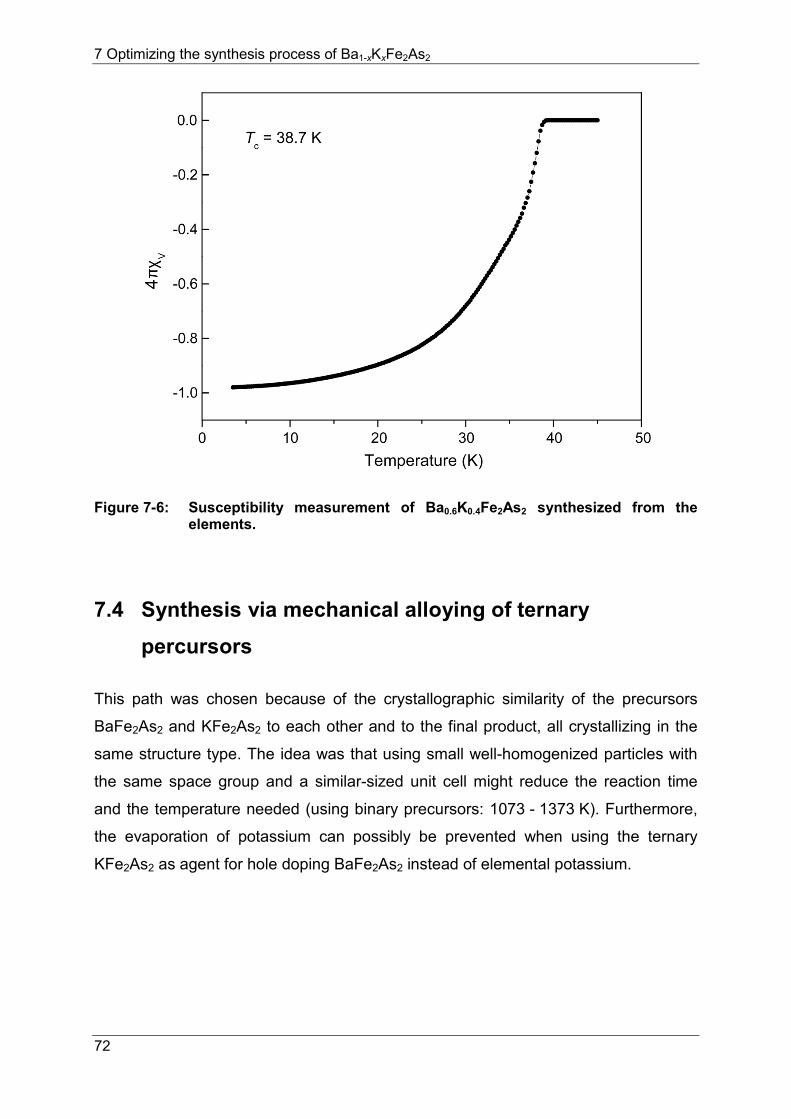
7 Optimizing the synthesis process of Ba1-xKxFe2As2
72
Figure 7-6: Susceptibility measurement of Ba0.6K0.4Fe2As2 synthesized from the elements.
7.4 Synthesis via mechanical alloying of ternary percursors
This path was chosen because of the crystallographic similarity of the precursors
BaFe2As2 and KFe2As2 to each other and to the final product, all crystallizing in the
same structure type. The idea was that using small well-homogenized particles with
the same space group and a similar-sized unit cell might reduce the reaction time
and the temperature needed (using binary precursors: 1073 - 1373 K). Furthermore,
the evaporation of potassium can possibly be prevented when using the ternary
KFe2As2 as agent for hole doping BaFe2As2 instead of elemental potassium.
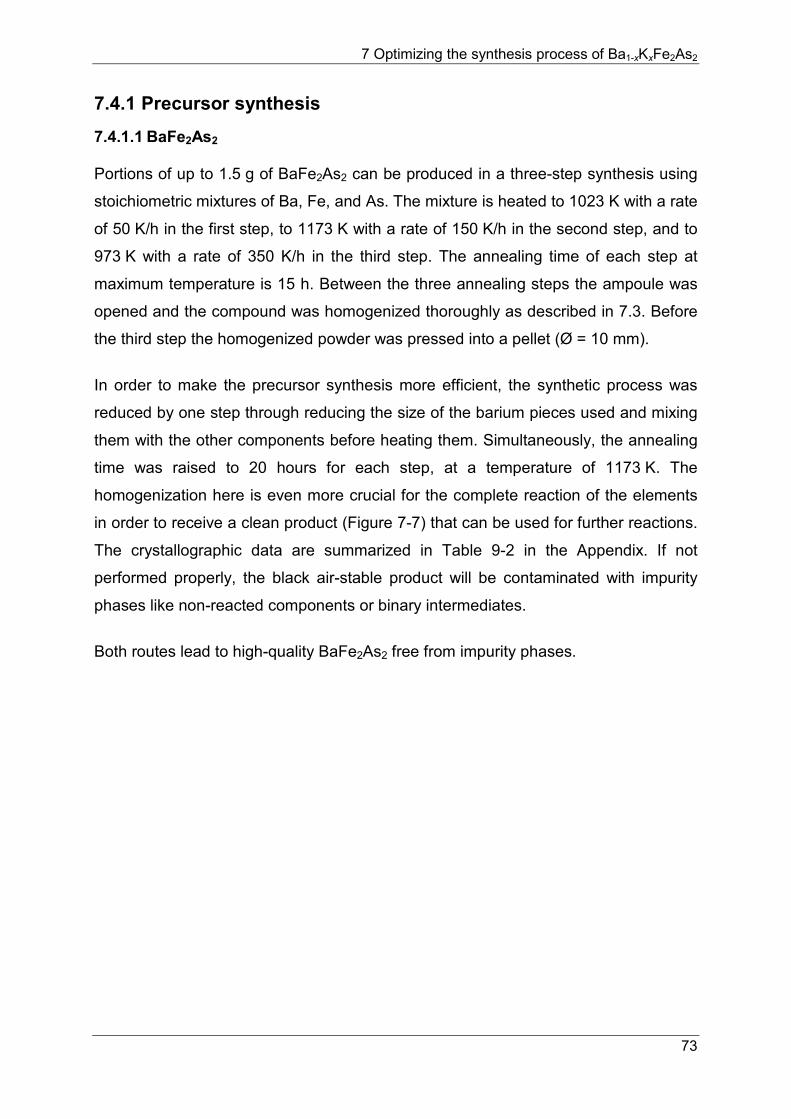
7 Optimizing the synthesis process of Ba1-xKxFe2As2
73
7.4.1 Precursor synthesis
7.4.1.1 BaFe2As2
Portions of up to 1.5 g of BaFe2As2 can be produced in a three-step synthesis using
stoichiometric mixtures of Ba, Fe, and As. The mixture is heated to 1023 K with a rate
of 50 K/h in the first step, to 1173 K with a rate of 150 K/h in the second step, and to
973 K with a rate of 350 K/h in the third step. The annealing time of each step at
maximum temperature is 15 h. Between the three annealing steps the ampoule was
opened and the compound was homogenized thoroughly as described in 7.3. Before
the third step the homogenized powder was pressed into a pellet (Ø = 10 mm).
In order to make the precursor synthesis more efficient, the synthetic process was
reduced by one step through reducing the size of the barium pieces used and mixing
them with the other components before heating them. Simultaneously, the annealing
time was raised to 20 hours for each step, at a temperature of 1173 K. The
homogenization here is even more crucial for the complete reaction of the elements
in order to receive a clean product (Figure 7-7) that can be used for further reactions.
The crystallographic data are summarized in Table 9-2 in the Appendix. If not
performed properly, the black air-stable product will be contaminated with impurity
phases like non-reacted components or binary intermediates.
Both routes lead to high-quality BaFe2As2 free from impurity phases.
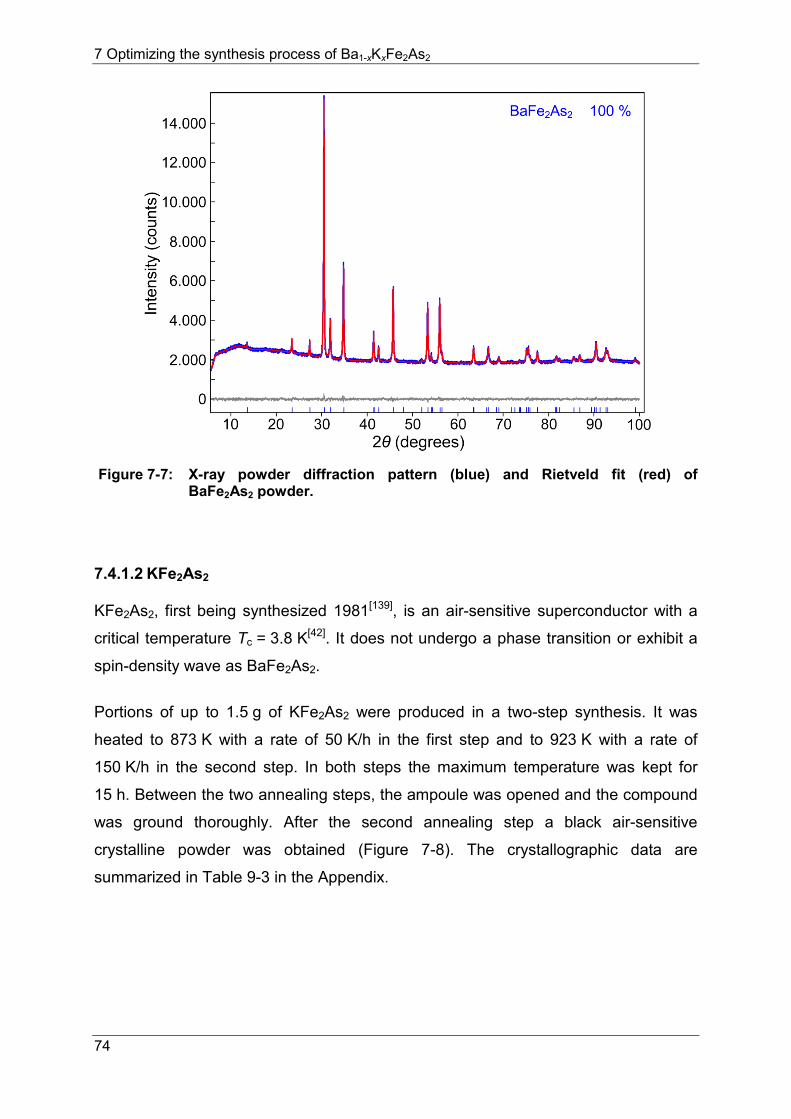
7 Optimizing the synthesis process of Ba1-xKxFe2As2
74
Figure 7-7: X-ray powder diffraction pattern (blue) and Rietveld fit (red) of BaFe2As2 powder.
7.4.1.2 KFe2As2
KFe2As2, first being synthesized 1981[139], is an air-sensitive superconductor with a
critical temperature Tc = 3.8 K[42]. It does not undergo a phase transition or exhibit a
spin-density wave as BaFe2As2.
Portions of up to 1.5 g of KFe2As2 were produced in a two-step synthesis. It was
heated to 873 K with a rate of 50 K/h in the first step and to 923 K with a rate of
150 K/h in the second step. In both steps the maximum temperature was kept for
15 h. Between the two annealing steps, the ampoule was opened and the compound
was ground thoroughly. After the second annealing step a black air-sensitive
crystalline powder was obtained (Figure 7-8). The crystallographic data are
summarized in Table 9-3 in the Appendix.
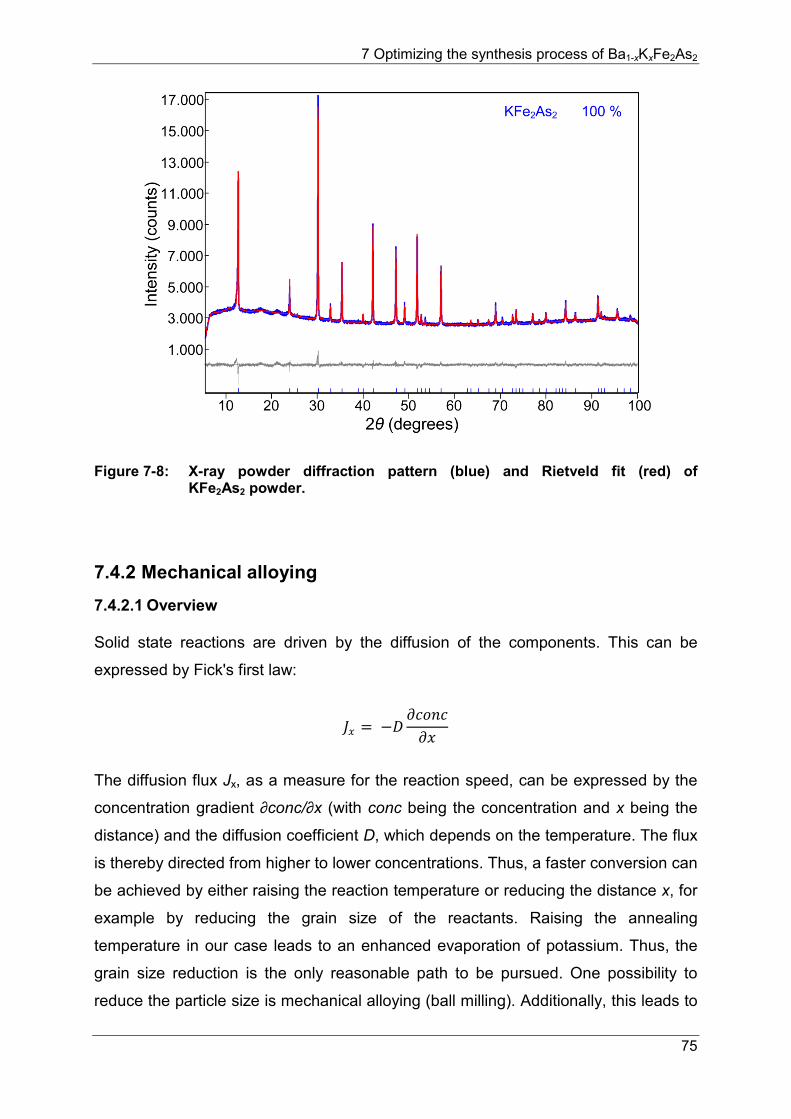
7 Optimizing the synthesis process of Ba1-xKxFe2As2
75
Figure 7-8: X-ray powder diffraction pattern (blue) and Rietveld fit (red) of KFe2As2 powder.
7.4.2 Mechanical alloying 7.4.2.1 Overview
Solid state reactions are driven by the diffusion of the components. This can be
expressed by Fick's first law:
𝐽𝐽𝑥𝑥 = −𝐷𝐷𝜕𝜕𝜕𝜕𝜕𝜕𝑛𝑛𝜕𝜕𝜕𝜕𝑥𝑥
The diffusion flux Jx, as a measure for the reaction speed, can be expressed by the
concentration gradient ∂conc/∂x (with conc being the concentration and x being the
distance) and the diffusion coefficient D, which depends on the temperature. The flux
is thereby directed from higher to lower concentrations. Thus, a faster conversion can
be achieved by either raising the reaction temperature or reducing the distance x, for
example by reducing the grain size of the reactants. Raising the annealing
temperature in our case leads to an enhanced evaporation of potassium. Thus, the
grain size reduction is the only reasonable path to be pursued. One possibility to
reduce the particle size is mechanical alloying (ball milling). Additionally, this leads to
7 Optimizing the synthesis process of Ba1-xKxFe2As2
76
a homogeneous mixing of the starting materials. Thereby the reaction time is
decreased and the yield of metastable reaction products increases. This leads to a
more efficient use of materials, energy, and time[140-141]. The compounds to be
homogenized are filled into a milling chamber. Additionally, a number of balls is
added and the chamber is sealed. The container is then shaken or rotated depending
on the type of ball mill for a determined time period. During this motion the balls
collide with the chamber's wall and with each other, crushing and merging the
powder between the colliding objects. In order to achieve the best result possible,
different parameters used in the milling process have to be well chosen. Parameters
like the speed of the mill, the milling time, the material of the balls and the container
used in the process, the filling ratio of the chamber, the size, and the number of the
balls influence the result of the mechanical alloying tremendously.
7.4.2.2 Experimental details
In this work the focus Iies especially on the speed, the duration of the milling process,
and the materials used for the container and the balls. The speed of the ball mill is
important for the synthesis. A minimum speed is necessary to obtain the desired
sample quality but if the speed is too high this can lead to a decomposition of the
starting materials[141-142], due to a significant increase of temperature. The size,
density, and the number of balls used in the alloying process can influence the
product formation. Choosing large balls with a high density favors thermodynamically
stable products[143-144]. Small balls on the other hand help creating meta stable or
amorphous phases and improve the mixing. Another thing that has to be considered
in the mixing is the abrasion of the container and the balls. The rate of wear depends
on the used materials, is independent of the milling time, but increases with the
speed of the mill[145].
Here two different mixtures of BaFe2As2/KFe2As2 with a molar ratio of 0.6/0.4 were
tested in two different milling processes. One process was performed by Dr. Marcus
Tegel (Fraunhofer Institute for Manufacturing Technology and Advanced Materials,
Dresden) (process A), the other one was performed by M. Sc. Eike Ahrens
(Technical University Dresden) and Dr. Jan Engelmann (Leibnitz Institute for Solid
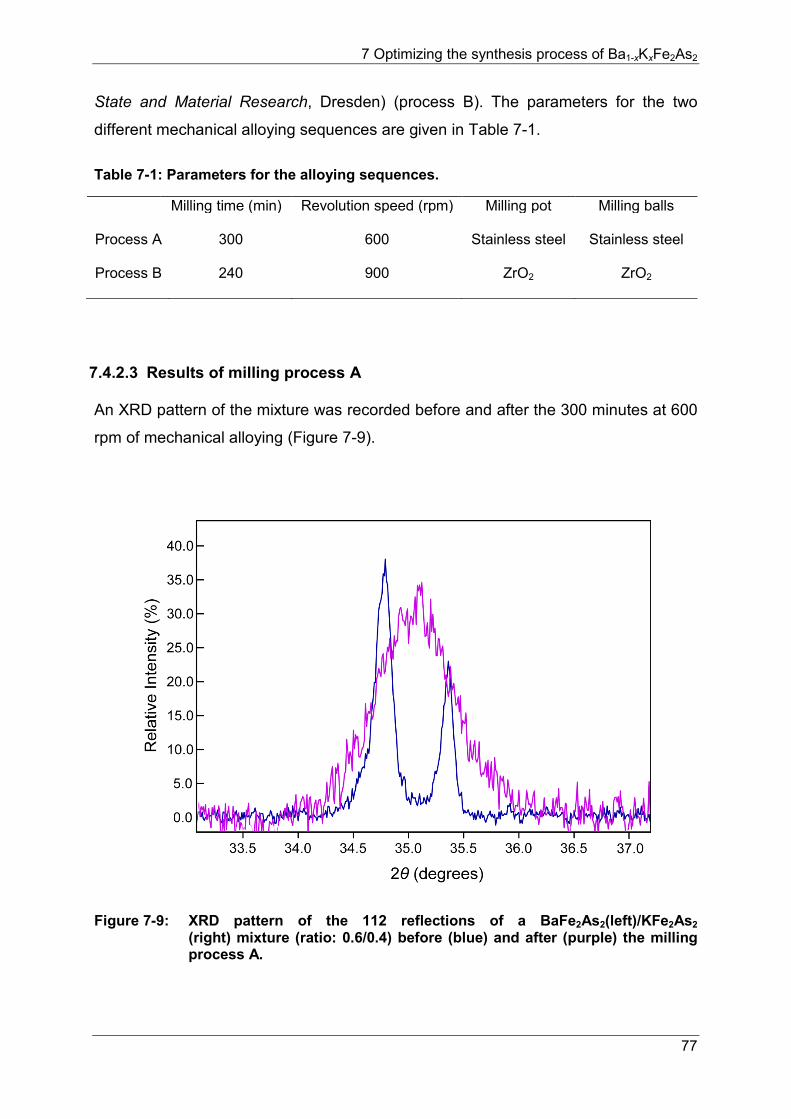
7 Optimizing the synthesis process of Ba1-xKxFe2As2
77
State and Material Research, Dresden) (process B). The parameters for the two
different mechanical alloying sequences are given in Table 7-1.
Table 7-1: Parameters for the alloying sequences.
Milling time (min) Revolution speed (rpm) Milling pot Milling balls
Process A
300
600
Stainless steel
Stainless steel
Process B
240
900
ZrO2
ZrO2
7.4.2.3 Results of milling process A
An XRD pattern of the mixture was recorded before and after the 300 minutes at 600
rpm of mechanical alloying (Figure 7-9).
Figure 7-9: XRD pattern of the 112 reflections of a BaFe2As2(left)/KFe2As2
(right) mixture (ratio: 0.6/0.4) before (blue) and after (purple) the milling process A.
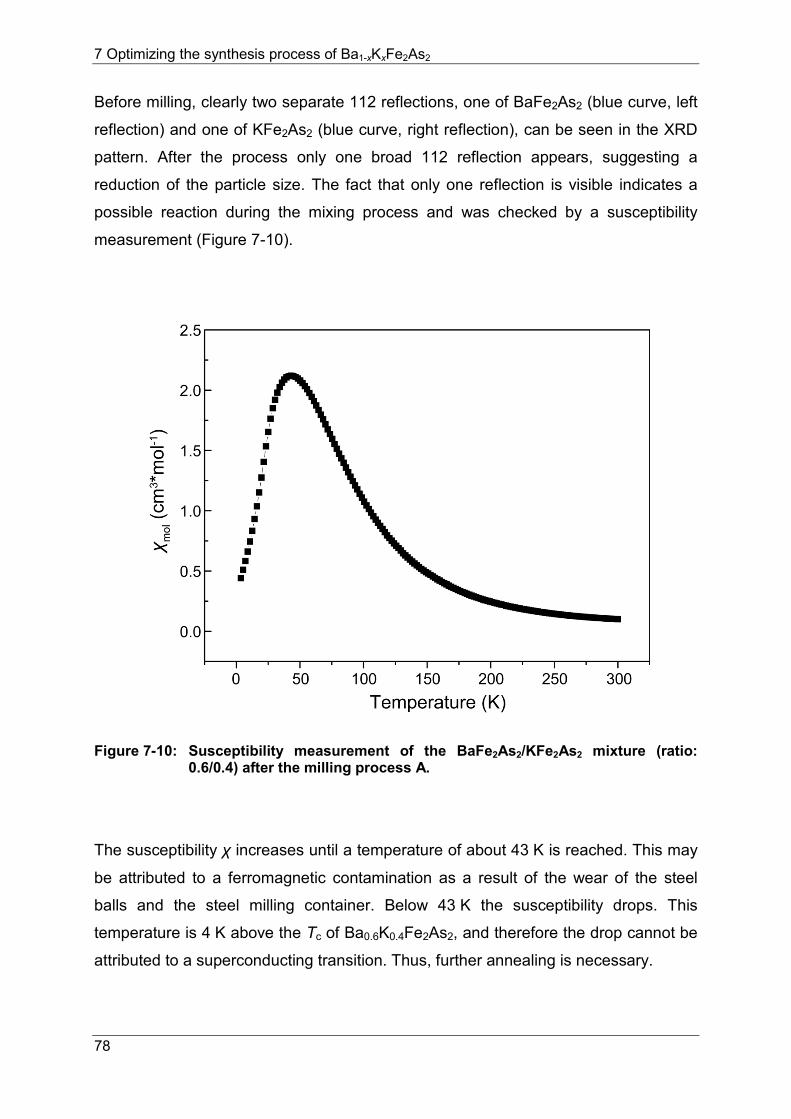
7 Optimizing the synthesis process of Ba1-xKxFe2As2
78
Before milling, clearly two separate 112 reflections, one of BaFe2As2 (blue curve, left
reflection) and one of KFe2As2 (blue curve, right reflection), can be seen in the XRD
pattern. After the process only one broad 112 reflection appears, suggesting a
reduction of the particle size. The fact that only one reflection is visible indicates a
possible reaction during the mixing process and was checked by a susceptibility
measurement (Figure 7-10).
Figure 7-10: Susceptibility measurement of the BaFe2As2/KFe2As2 mixture (ratio: 0.6/0.4) after the milling process A.
The susceptibility χ increases until a temperature of about 43 K is reached. This may
be attributed to a ferromagnetic contamination as a result of the wear of the steel
balls and the steel milling container. Below 43 K the susceptibility drops. This
temperature is 4 K above the Tc of Ba0.6K0.4Fe2As2, and therefore the drop cannot be
attributed to a superconducting transition. Thus, further annealing is necessary.
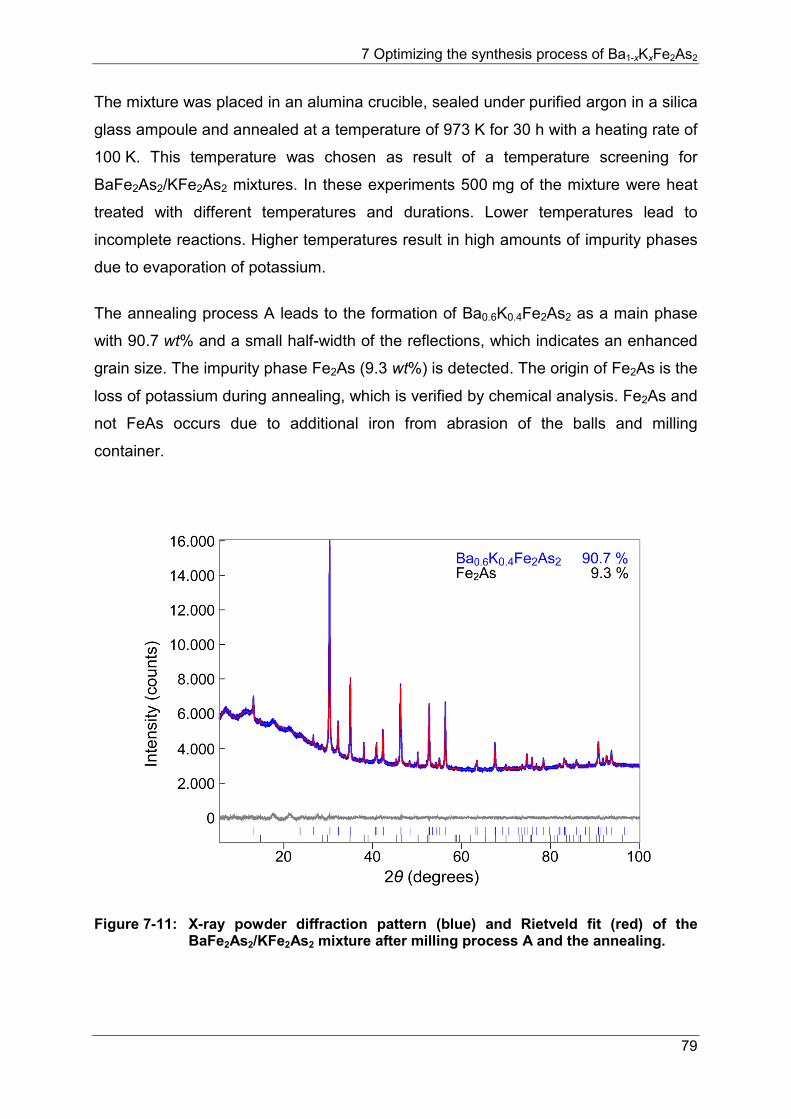
7 Optimizing the synthesis process of Ba1-xKxFe2As2
79
The mixture was placed in an alumina crucible, sealed under purified argon in a silica
glass ampoule and annealed at a temperature of 973 K for 30 h with a heating rate of
100 K. This temperature was chosen as result of a temperature screening for
BaFe2As2/KFe2As2 mixtures. In these experiments 500 mg of the mixture were heat
treated with different temperatures and durations. Lower temperatures lead to
incomplete reactions. Higher temperatures result in high amounts of impurity phases
due to evaporation of potassium.
The annealing process A leads to the formation of Ba0.6K0.4Fe2As2 as a main phase
with 90.7 wt% and a small half-width of the reflections, which indicates an enhanced
grain size. The impurity phase Fe2As (9.3 wt%) is detected. The origin of Fe2As is the
loss of potassium during annealing, which is verified by chemical analysis. Fe2As and
not FeAs occurs due to additional iron from abrasion of the balls and milling
container.
Figure 7-11: X-ray powder diffraction pattern (blue) and Rietveld fit (red) of the BaFe2As2/KFe2As2 mixture after milling process A and the annealing.
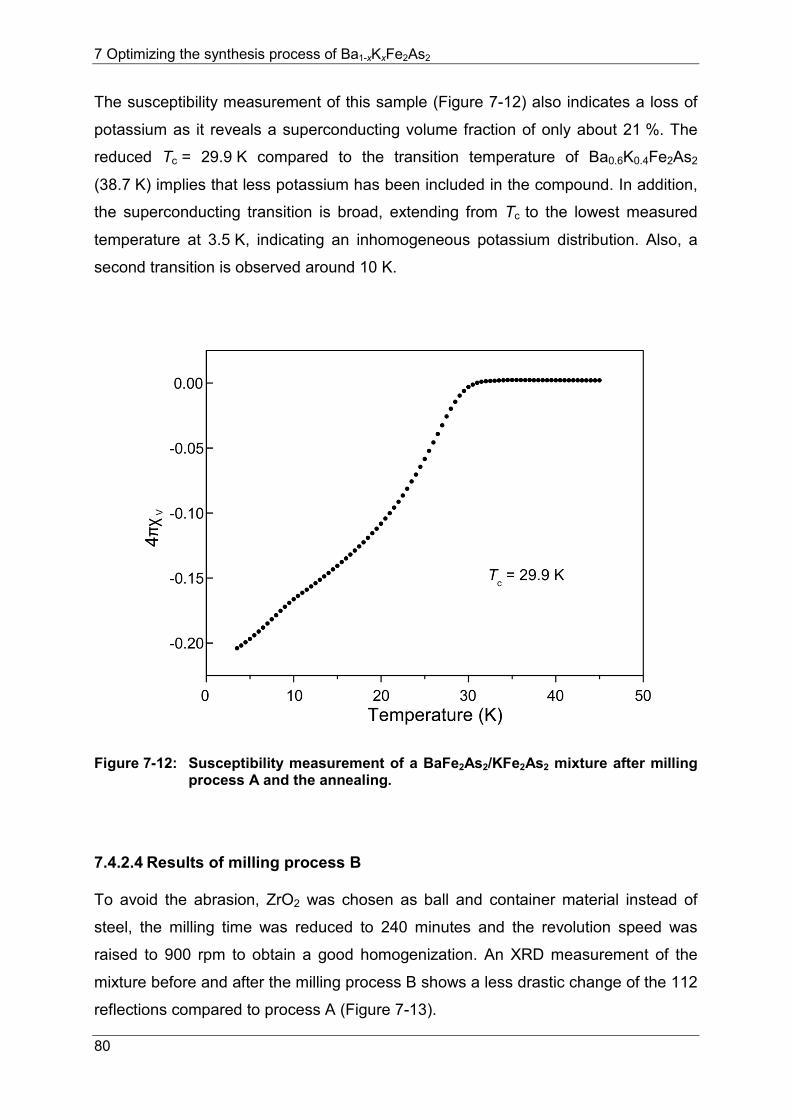
7 Optimizing the synthesis process of Ba1-xKxFe2As2
80
The susceptibility measurement of this sample (Figure 7-12) also indicates a loss of
potassium as it reveals a superconducting volume fraction of only about 21 %. The
reduced Tc = 29.9 K compared to the transition temperature of Ba0.6K0.4Fe2As2
(38.7 K) implies that less potassium has been included in the compound. In addition,
the superconducting transition is broad, extending from Tc to the lowest measured
temperature at 3.5 K, indicating an inhomogeneous potassium distribution. Also, a
second transition is observed around 10 K.
Figure 7-12: Susceptibility measurement of a BaFe2As2/KFe2As2 mixture after milling process A and the annealing.
7.4.2.4 Results of milling process B
To avoid the abrasion, ZrO2 was chosen as ball and container material instead of
steel, the milling time was reduced to 240 minutes and the revolution speed was
raised to 900 rpm to obtain a good homogenization. An XRD measurement of the
mixture before and after the milling process B shows a less drastic change of the 112
reflections compared to process A (Figure 7-13).
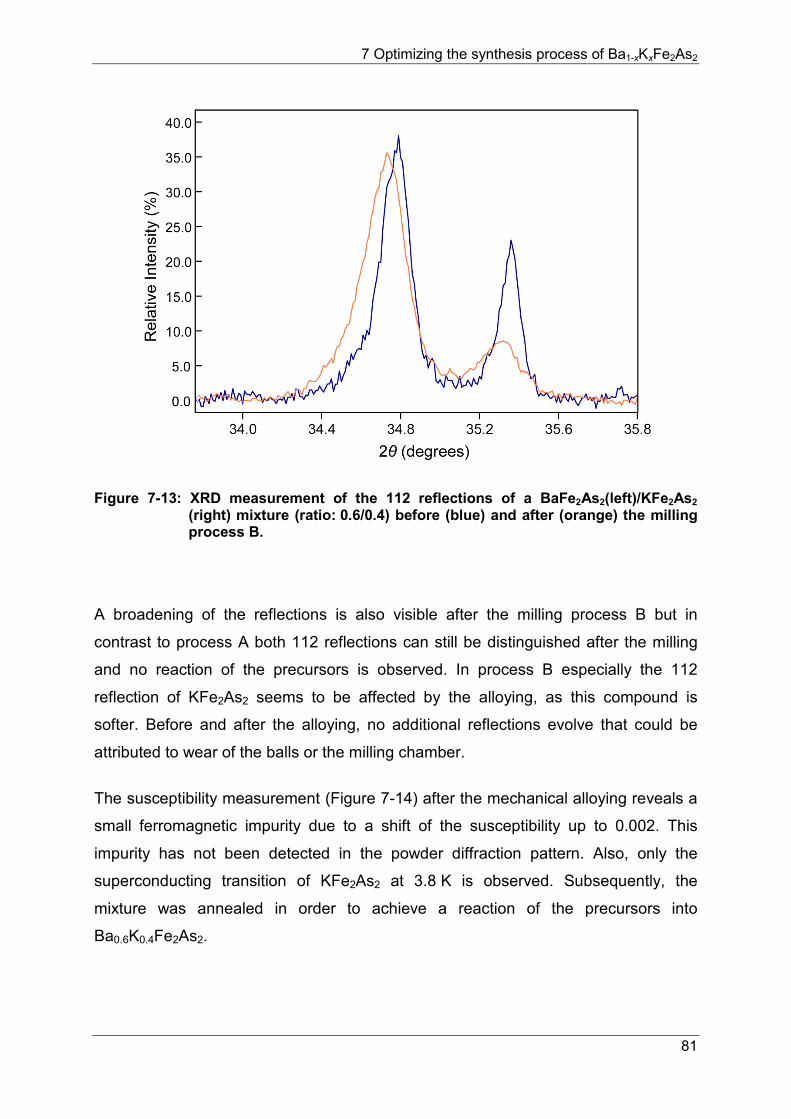
7 Optimizing the synthesis process of Ba1-xKxFe2As2
81
Figure 7-13: XRD measurement of the 112 reflections of a BaFe2As2(left)/KFe2As2
(right) mixture (ratio: 0.6/0.4) before (blue) and after (orange) the milling process B.
A broadening of the reflections is also visible after the milling process B but in
contrast to process A both 112 reflections can still be distinguished after the milling
and no reaction of the precursors is observed. In process B especially the 112
reflection of KFe2As2 seems to be affected by the alloying, as this compound is
softer. Before and after the alloying, no additional reflections evolve that could be
attributed to wear of the balls or the milling chamber.
The susceptibility measurement (Figure 7-14) after the mechanical alloying reveals a
small ferromagnetic impurity due to a shift of the susceptibility up to 0.002. This
impurity has not been detected in the powder diffraction pattern. Also, only the
superconducting transition of KFe2As2 at 3.8 K is observed. Subsequently, the
mixture was annealed in order to achieve a reaction of the precursors into
Ba0.6K0.4Fe2As2.
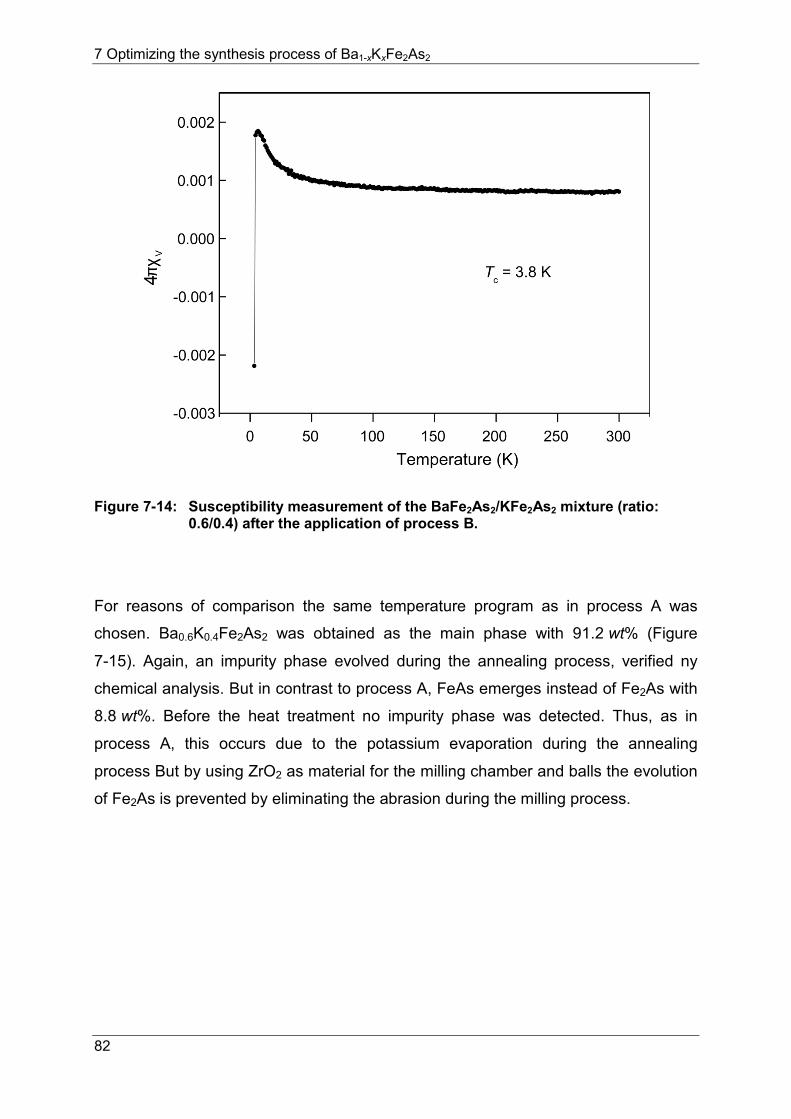
7 Optimizing the synthesis process of Ba1-xKxFe2As2
82
Figure 7-14: Susceptibility measurement of the BaFe2As2/KFe2As2 mixture (ratio: 0.6/0.4) after the application of process B.
For reasons of comparison the same temperature program as in process A was
chosen. Ba0.6K0.4Fe2As2 was obtained as the main phase with 91.2 wt% (Figure
7-15). Again, an impurity phase evolved during the annealing process, verified ny
chemical analysis. But in contrast to process A, FeAs emerges instead of Fe2As with
8.8 wt%. Before the heat treatment no impurity phase was detected. Thus, as in
process A, this occurs due to the potassium evaporation during the annealing
process But by using ZrO2 as material for the milling chamber and balls the evolution
of Fe2As is prevented by eliminating the abrasion during the milling process.
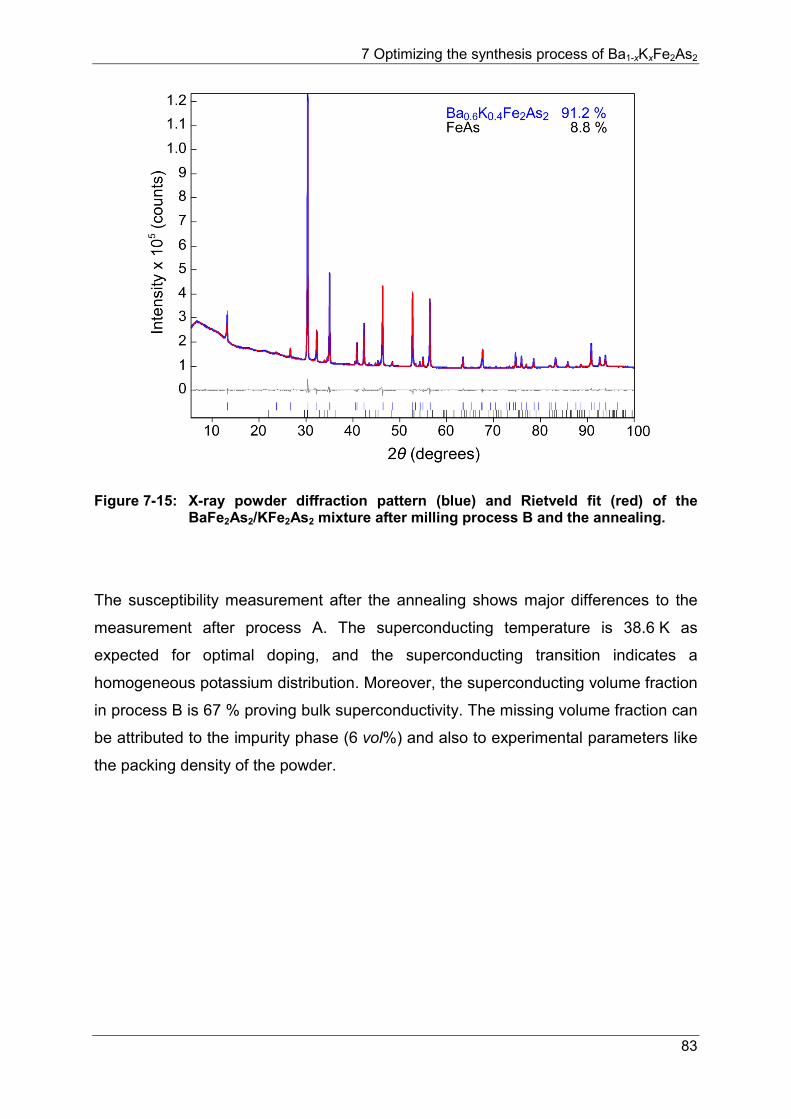
7 Optimizing the synthesis process of Ba1-xKxFe2As2
83
Figure 7-15: X-ray powder diffraction pattern (blue) and Rietveld fit (red) of the BaFe2As2/KFe2As2 mixture after milling process B and the annealing.
The susceptibility measurement after the annealing shows major differences to the
measurement after process A. The superconducting temperature is 38.6 K as
expected for optimal doping, and the superconducting transition indicates a
homogeneous potassium distribution. Moreover, the superconducting volume fraction
in process B is 67 % proving bulk superconductivity. The missing volume fraction can
be attributed to the impurity phase (6 vol%) and also to experimental parameters like
the packing density of the powder.
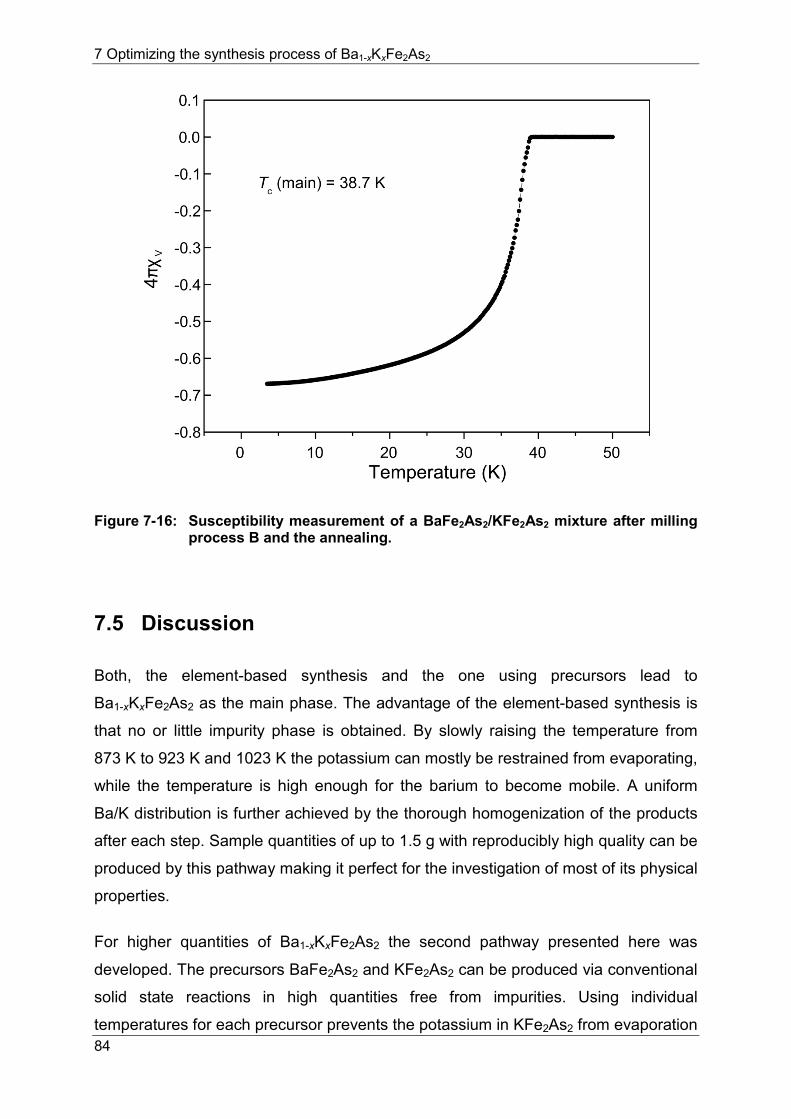
7 Optimizing the synthesis process of Ba1-xKxFe2As2
84
Figure 7-16: Susceptibility measurement of a BaFe2As2/KFe2As2 mixture after milling process B and the annealing.
7.5 Discussion
Both, the element-based synthesis and the one using precursors lead to
Ba1-xKxFe2As2 as the main phase. The advantage of the element-based synthesis is
that no or little impurity phase is obtained. By slowly raising the temperature from
873 K to 923 K and 1023 K the potassium can mostly be restrained from evaporating,
while the temperature is high enough for the barium to become mobile. A uniform
Ba/K distribution is further achieved by the thorough homogenization of the products
after each step. Sample quantities of up to 1.5 g with reproducibly high quality can be
produced by this pathway making it perfect for the investigation of most of its physical
properties.
For higher quantities of Ba1-xKxFe2As2 the second pathway presented here was
developed. The precursors BaFe2As2 and KFe2As2 can be produced via conventional
solid state reactions in high quantities free from impurities. Using individual
temperatures for each precursor prevents the potassium in KFe2As2 from evaporation
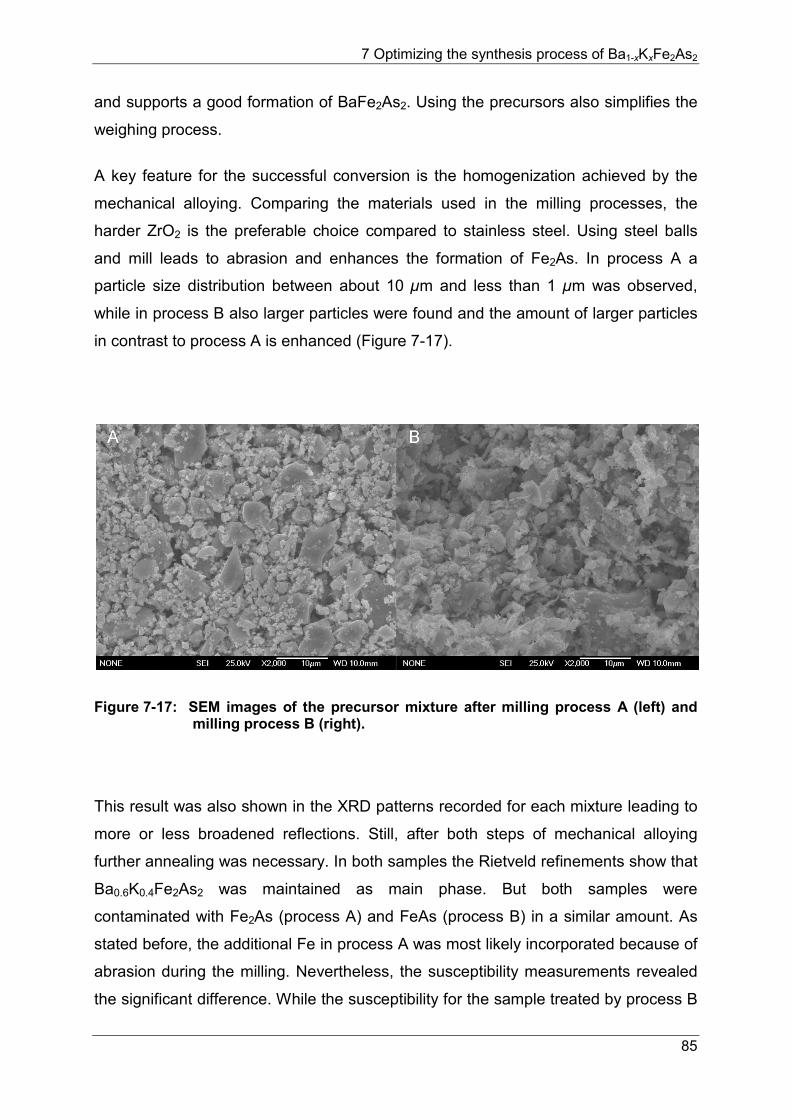
7 Optimizing the synthesis process of Ba1-xKxFe2As2
85
and supports a good formation of BaFe2As2. Using the precursors also simplifies the
weighing process.
A key feature for the successful conversion is the homogenization achieved by the
mechanical alloying. Comparing the materials used in the milling processes, the
harder ZrO2 is the preferable choice compared to stainless steel. Using steel balls
and mill leads to abrasion and enhances the formation of Fe2As. In process A a
particle size distribution between about 10 µm and less than 1 µm was observed,
while in process B also larger particles were found and the amount of larger particles
in contrast to process A is enhanced (Figure 7-17).
Figure 7-17: SEM images of the precursor mixture after milling process A (left) and milling process B (right).
This result was also shown in the XRD patterns recorded for each mixture leading to
more or less broadened reflections. Still, after both steps of mechanical alloying
further annealing was necessary. In both samples the Rietveld refinements show that
Ba0.6K0.4Fe2As2 was maintained as main phase. But both samples were
contaminated with Fe2As (process A) and FeAs (process B) in a similar amount. As
stated before, the additional Fe in process A was most likely incorporated because of
abrasion during the milling. Nevertheless, the susceptibility measurements revealed
the significant difference. While the susceptibility for the sample treated by process B
7 Optimizing the synthesis process of Ba1-xKxFe2As2
86
displayed bulk superconductivity and a Tc of 38.6 K, the sample treated by process A
showed a Tc of only 29.9 K, a superconducting volume fraction of only about 21 %,
and a broad superconducting drop with two transitions.
Chemical analysis revealed that the potassium loss in process A and process B
happens during the annealing, since both mixtures display the Ba/K ratio of 0.6/0.4
before the heat treatment. Therefore, the annealing step needs further optimization
for example by implementing intermediate temperature steps comparable to the
different annealing temperatures in the element-based synthesis to further reduce the
potassium loss. Still, process B with its high Tc and its narrow superconducting
transition is the better path to pursue for the production of larger amounts of high-
quality Ba0.6K0.4Fe2As2.
8 Summary and outlook
87
8 Summary and outlook
The results presented in this thesis provide a deeper insight into the physical
properties of Ba1-xKxFe2As2 and their connection among each other. By using a
combination of high resolution X-ray diffraction, susceptibility measurements, and
µSR, it was possible to unambiguously identify a microscopic coexistence of
superconductivity and antiferromagnetism in underdoped Ba1-xKxFe2As2 (up to
x = 0.23). This result strongly supports the assumption of an s±-wave symmetry in
this area of the phase diagram. These studies were extended to the optimally and
overdoped Ba1-xKxFe2As2 up to x = 0.66, generating a phase diagram displaying
gradual transitions from long-range to short-range order instead of sharp borders.
This magnetic order can be detected up to at least x = 0.66, a value beyond the
expected one (between 0.2 and 0.3). On Ba0.8K0.2Fe2As2 under pressure, a new
antiferromagnetic order AFM2 was discovered, also displaying coexistence with
superconductivity.
In the second part of this thesis, Ba0.6K0.4Fe2As2 was examined as material for the
production of superconducting wires and tapes. Preliminary critical current density
measurements of these prototype filaments are encouraging. To further investigate
these wires, a new synthesis route was explored using mechanical alloying of the
ternary precursors BaFe2As2 and KFe2As2 in order to obtain larger sample amounts.
Microscopic coexistence of superconductivity and magnetism in Ba1-xKxFe2As2
On four high-quality samples of Ba1-xKxFe2As2 (x = 0, 0.19, 0.23, 0.25) low-
temperature XRD measurements were performed revealing a structural transition
from I4/mmm to Fmmm below 140 K. The origin of this structural transition is an
antiferromagnetic ordering of the iron atoms below 138 K. With increasing potassium
content the magnetism is weakened, the structural transition temperature decreases
from Ts = 140 K (x = 0) to 98 K (x = 0.19), 84 K (x = 0.23), and 70 K (x = 0.25) and
superconductivity is induced with increasing Tc = 22.7 K (x = 0.19), 28.5 K (x = 0.23)
and 32.6 K (x = 0.25). Alongside with the reduction of Ts also the structural order
8 Summary and outlook
88
parameter δ diminishes with rising potassium content. Interestingly, when reaching
Tc, δ is slightly decreased, indicating a competition of the structural and magnetic
order parameter with the superconducting one. Muon spin rotation measurements
reveal information about the magnetic volume fraction of the samples with
x = 0, 0.19, 0.23. After an initially slow evolution of the magnetic phases, the
magnetic fractions increase up to TN50% until they saturate at almost 100 % at 1.6 K.
Simultaneously susceptibility data exhibits superconducting volume fractions of
nearly 100 %, proving unequivocally that both properties coexist on a microscopic
scale.
Short-range magnetic order in Ba1-xKxFe2As2
Throughout the investigated range of the phase diagram (0 ≤ x ≤ 0.66) a nematic
phase is detected, preceding the transition into an antiferromagnetic state. Beyond
the underdoped area of the phase diagram, the Tcs rise up to x = 0.4, reaching a
maximum at Tc = 38.7 K, then decrease first slowly for x = 0.5 (Tc = 37.4 K) and then
with an increasing rate for x = 0.6 (Tc = 31.1 K) and 0.66 (Tc = 23.3 K). All
superconducting volume fractions display bulk superconductivity. At the same time
higher-doped compounds (x > 0.23) exhibit an increasing non-magnetic fraction with
increasing potassium content, indicating a phase separation into a non-magnetic
superconducting phase and magnetic clusters that coexist with superconductivity.
The dips in the curves coincide with the superconducting transition temperatures,
demonstrating the competition of both magnetism and superconductivity in these
clusters. In contrast to the common belief, the magnetic fraction does not vanish
completely in the optimally and overdoped area but remains present throughout the
whole investigated range (up to x = 0.66). Only the nature of the antiferromagnetism
changes from a long-range order up to x = 0.27, to a short-range order for
0.27 ≤ x ≤ 0.66. Both the short-range order and the phase separation point to an
avoided quantum critical point around x = 0.3. The overdoped compounds (x = 0.5,
0.6, and 0.66) were further analyzed concerning a possible transition of the
superconducting wave function from an s- to a d-wave. For x = 0.5, 0.6 the superfluid
density measurements could be fitted best with s-wave functions, while for x = 0.66 a
d-wave seems to be preferable.
8 Summary and outlook
89
Rise of a new magnetic phase in Ba0.8K0.2Fe2As2
µSR measurements under pressure indicate the rise of a new antiferromagnetic
phase AFM2 on the expense of the antiferromagnetic phase at ambient pressure,
AFM1. This new phase differs from recently found tetragonal pockets in
Ba1-xKxFe2As2 due to its spin structure, being the same as in AFM1 (along the ab-
plane), but with lower magnetic moments. AFM2 is phase separated from AFM1 but
coexists with the superconducting phase on a microscopic scale. First hints of AFM2
are observed at 20 K and 2.6 kbar and the phase becomes clearly visible at 5.3 kbar.
With increasing pressure the new phase becomes more and more distinct, while the
frequencies of AFM1 shift towards lower values and become less pronounced but are
still existent at 22.1 kbar. At maximum pressure the AFM1 frequencies broaden at
20 K with rising temperature but the order exists up to 95.5 K. In contrast to that,
AFM2 is first affected by an increase of temperature at 40 K but already disappears
completely above 50 K.
Exploring the potential of Ba0.6K0.4Fe2As2 wires and tapes
This material was chosen for production of filaments because of its low
crystallographic anisotropy, high upper critical field HC2[127] and the robustness to
impurity phases[128]. Here important factors for the wire/tape manufacturing and the
physical properties of these wires and tapes concerning the grain connectivity,
superconductivity, and critical current density were investigated.
This was enabled by the up-scaling of the synthesis process (in total about 20 g of
Ba0.6K0.4Fe2As2), simultaneously ensuring a high quality of the material.
The best results concerning the heat treatment (performed to improve the grain
connectivity and enhance Jc) after the cold working were obtained for samples
annealed at 1073 K. An oxygen- and water-free atmosphere for the annealing
process is mandatory. The samples displayed a high shielding fraction and a
Tc = 37.7 K. In lower-doped samples the grain connectivity was insufficient. For the
samples annealed at higher temperatures large areas of FeAs and Fe2As were
detected. A detailed microstructural analysis shows a homogeneous distribution of
8 Summary and outlook
90
the elements, a slight misalignment of the grains with semi- and incoherent grain
boundaries, and an orientation almost parallel to the direction of the elongation for
the compound heated at 1073 K.
Concerning the deformation process it was shown that groove rolling alone leads to a
high core density, but also to transversal cracks that inhibit the current flow. A
drawing of the wire results in uniform but less dense cores and also introduces
cracks. These cracks are longitudinal to the drawing axis and should not hinder the
current flow. The best result was obtained by a combination of groove rolling, flat
rolling, and then annealing at 1073 K, leading to a dense core with almost no cracks.
This was also confirmed by measuring critical current densities above 1x10⁴ A/cm2 at
low magnetic fields. The received n-factor for the best filament is around 30, proving
the homogeneous distribution of the elements and empowering it as a material that
can be used in constant mode. Comparing these values to the literature, we see that
Jc is lower than in [68], but Tc is higher. It is the highest Tc measured up to now for
Ba0.6K0.4Fe2As2 wires and tapes, probably as a result of the optimized reaction
conditions and the high quality material.
Optimizing the synthesis process of Ba1-xKxFe2As2
Two different processes were developed in order to improve and up-scale the
synthesis process. One element-based and one via mechanical alloying of the
ternary precursors BaFe2As2 and KFe2As2.
The element-based synthesis was based on the three-step synthesis developed by
Rotter et al. [17]. Using a moderate temperature of 873 K with a slow rate of 50 K/h in
the first step, 923 K and a rate of 150 K/h in the second step, and 1023 K and a rate
of 350 K/h in the third step allows a slow and steady reaction of the elements and
minimizes a potential element loss. Decisive for the successful conversion into a
homogeneous sample is the thorough homogenization of the mixtures after each
step. Through this improvement high-quality powder samples with a homogeneous
Ba/K distribution and no or very little impurity phase could be obtained. Limited by the
size of the crucible, sample sizes of up to 1.5 g could be produced.
8 Summary and outlook
91
An alternative path to synthesize Ba0.6K0.4Fe2As2 is mechanical alloying of BaFe2As2
and KFe2As2 as ternary precursors before annealing. Both precursors can be
produced in large quantities and high quality in a two-step synthesis. BaFe2As2 and
KFe2As2 were then mechanically alloyed in two different processes (A and B).
Process A was performed with a milling chamber and milling balls made of stainless
steel. After the annealing of this mixture Ba0.6K0.4Fe2As2 was obtained as the main
phase (91 wt%), but also the impurity phase Fe2As evolved (additional Fe because of
abrasion) and the superconducting properties with a volume fraction of only 20 %
and a Tc = 29.9 K were unsatisfactory.
Process B used ZrO2 milling chamber and balls. After the heat treatment
Ba0.6K0.4Fe2As2 was obtained as the main phase (more than 91 wt%) with the
impurity phase FeAs. This material shows bulk superconductivity with a narrow
transition indicating a homogeneous Ba/K distribution and Tc = 38.7 K. By optimizing
the heat treatment the amount of impurity phase has to be reduced further. However,
the superconducting properties after the heat treatment in process B display that it is
a promising path to larger quantities of Ba0.6K0.4Fe2As2, to further investigate the
potential for future application.
Outlook
The phase diagram of Ba1-xKxFe2As2 turned out to be significantly more complicated
than expected earlier. Recently published results observing a tetragonal magnetic
pocket in underdoped Ba1-xKxFe2As2[95] underline this and should be investigated
further. These pockets are in line with findings in the Ba1-xNaxFe2As2 phase diagram.
Thus it would be interesting to also examine Ba1-xNaxFe2As2 concerning the new
magnetic phase under pressure and see if this phase is an intrinsic feature of hole-
doped BaFe2As2. Although the experimental results in the underdoped area support
the s±-wave scenario, the indications of a transition to d-wave have to be analyzed in
more detail towards the concentration of its appearance and its nature. Also, the
evolution of the magnetic fluctuations in samples with 0.66 > x > 1 should be further
examined to see at which potassium concentration the fluctuation vanishes
completely.
8 Summary and outlook
92
The optimized synthesis processes allow to further improve the critical current
density of Ba0.6K0.4Fe2As2-based wires/tapes. It should be examined if by additional
deformation of the tapes to diameters smaller than 0.4 mm, Jc is increased. This
could be either achieved by an additional sheath or higher deformation forces. If by
force no further compaction can be obtained, Jc could be increased by radiation-
induced pinning centers as recently shown in [146]. Moreover, directly converting the
mechanically alloyed mixture of BaFe2As2 and KFe2As2 in a tube, in an oxygen- and
water-free environment, drawn, flat rolled, and finally annealed, could lead to dense
core structures without cracks.
The interaction of the interplay of superconductivity and magnetism in Ba1-xKxFe2As2
is unraveled bit by bit and provides a more detailed picture of how superconductivity
works in Ba1-xKxFe2As2. If the above-mentioned problems concerning a possible
application are solved, this compound could find its way into future devices. This step
may take some time, but Ba0.6K0.4Fe2As2 filaments could help to use energy more
efficiently. Referring to climate warming, as mentioned in the introduction,
Ba0.6K0.4Fe2As2 will not avert the climate change by itself, but it still has the potential
to contribute to it.
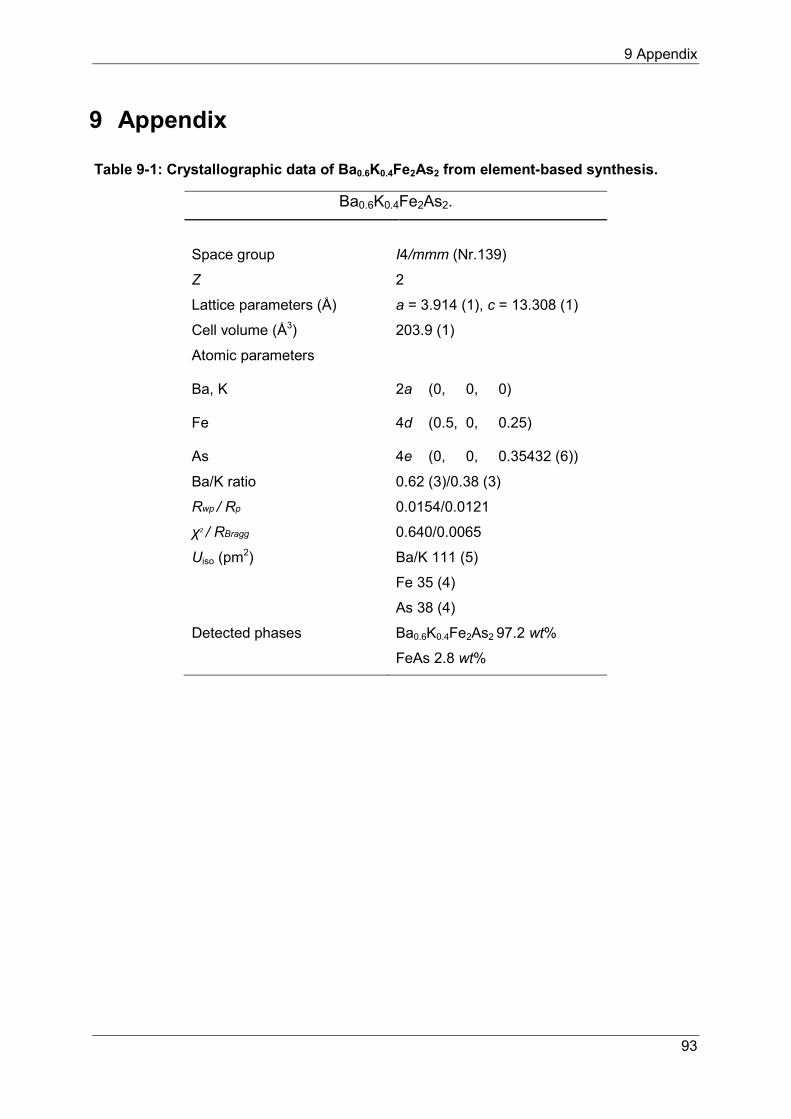
9 Appendix
93
9 Appendix
Table 9-1: Crystallographic data of Ba0.6K0.4Fe2As2 from element-based synthesis.
Ba0.6K0.4Fe2As2.
Space group I4/mmm (Nr.139)
Z 2
Lattice parameters (Å) a = 3.914 (1), c = 13.308 (1)
Cell volume (Å3) 203.9 (1)
Atomic parameters
Ba, K
2a (0, 0, 0)
Fe
4d (0.5, 0, 0.25)
As 4e (0, 0, 0.35432 (6))
Ba/K ratio 0.62 (3)/0.38 (3)
Rwp / Rp 0.0154/0.0121
χ2 / RBragg 0.640/0.0065
Uiso (pm2) Ba/K 111 (5)
Fe 35 (4)
As 38 (4)
Detected phases Ba0.6K0.4Fe2As2 97.2 wt%
FeAs 2.8 wt%
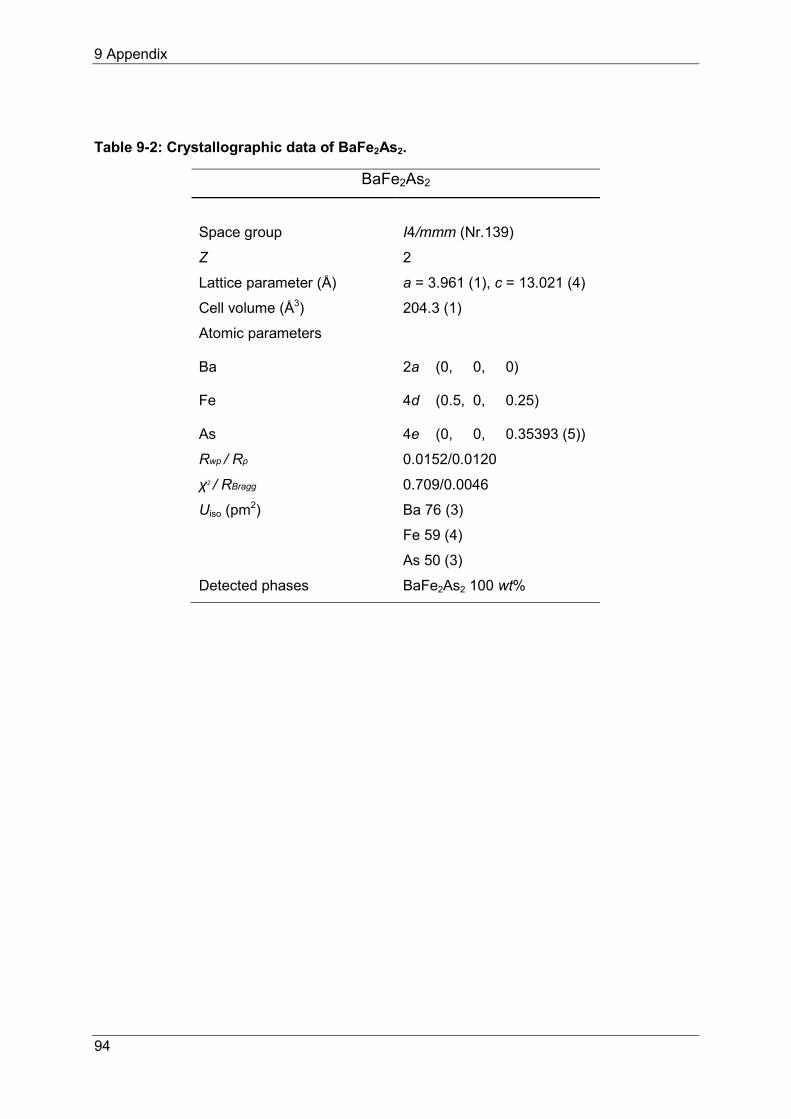
9 Appendix
94
Table 9-2: Crystallographic data of BaFe2As2.
BaFe2As2
Space group I4/mmm (Nr.139)
Z 2
Lattice parameter (Å) a = 3.961 (1), c = 13.021 (4)
Cell volume (Å3) 204.3 (1)
Atomic parameters
Ba
2a (0, 0, 0)
Fe
4d (0.5, 0, 0.25)
As 4e (0, 0, 0.35393 (5))
Rwp / Rp 0.0152/0.0120
χ2 / RBragg 0.709/0.0046
Uiso (pm2) Ba 76 (3)
Fe 59 (4)
As 50 (3)
Detected phases BaFe2As2 100 wt%
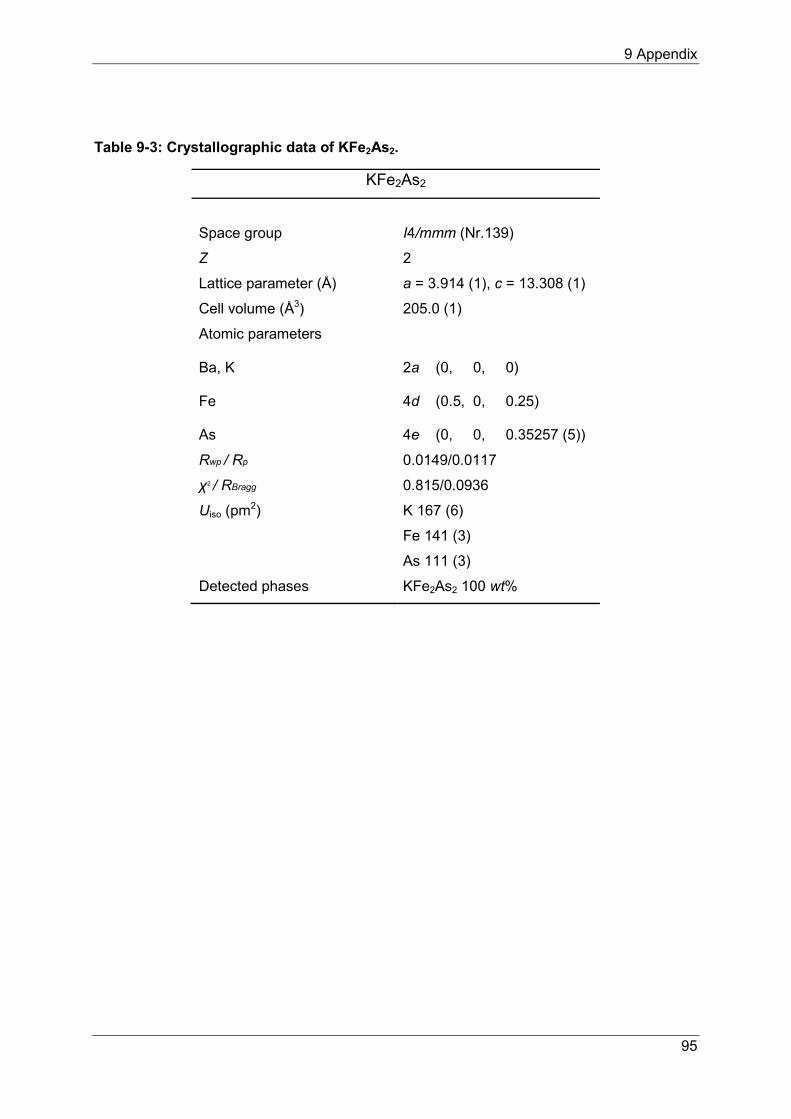
9 Appendix
95
Table 9-3: Crystallographic data of KFe2As2.
KFe2As2
Space group I4/mmm (Nr.139)
Z 2
Lattice parameter (Å) a = 3.914 (1), c = 13.308 (1)
Cell volume (Å3) 205.0 (1)
Atomic parameters
Ba, K
2a (0, 0, 0)
Fe
4d (0.5, 0, 0.25)
As 4e (0, 0, 0.35257 (5))
Rwp / Rp 0.0149/0.0117
χ2 / RBragg 0.815/0.0936
Uiso (pm2) K 167 (6)
Fe 141 (3)
As 111 (3)
Detected phases KFe2As2 100 wt%
10 Abbreviations
96
10 Abbreviations
2D two-dimensional
2θ diffraction angle
3D three-dimensional
4πχ magnetic (e.g. superconducting) volume fraction
a1/n sample size dependence
a, b, c lattice parameters
Å Angstrøm
AC alternating current
ARPES angle resolved photoemission spectroscopy
BCS acronym of Bardeen, Cooper, and Schrieffer
B… magnetic flux density
Bi-2212 Bi2Sr2CaCu2O8
Bi-2223 Bi2Sr2Ca2Cu3O10
δ a measure for the orthorhombic lattice distortion
D diffusion coefficient
DC direct current
E energy
EDX energy dispersive X-ray spectroscopy
EF Fermi energy
10 Abbreviations
97
EFTEM energy filtered transmission electron microscopy
g gram(s)
γ gyromagnetic ratio
H magnetic field
Hext external magnetic field
Hc critical magnetic field
Hc2 upper critical field (type 2 superconductor)
HAADF high angle annular dark field
HRTEM high resolution transmission electron microscopy
I electric current
Ic critical electric current
ICP-AAS Induced coupled plasma atomic absorption spectroscopy
J current density
Jx diffusion flux
Jc critical current density
K Kelvin
λ wavelength
LF longitudinal field
LMU Ludwig-Maximilians-Universität
m* effective mass of the superconducting carriers
µ muon

10 Abbreviations
98
µs microsecond(s)
μSR muon spin rotation and relaxation
ns nanosecond(s)
ns superfluid density
NMR nuclear magnetic resonance
NB(t) count rate of the backward detector
NF(t) count rate of the forward detector
ν neutrino
ωL Larmor frequency
ωµ muon frequency
pm picometer
π pion
P(t) Polarization of the muons
R… residual value
RBEI Rutherford backscattered electron imaging
SDW spin-density wave
SEM scanning electron microscopy
σSC muon spin relaxation rate
STEM scanning transmission electron microscopy
T Tesla
t time
10 Abbreviations
99
Tc critical temperature
TEM transmission electron microscopy
TF transverse field
TN Néel temperature
TN10 % Temperature where 10 % of a sample are magnetically ordered
TN50 % Temperature where 50 % of a sample are magnetically ordered,
also structural transition temperature in Ba1-xKxFe2As2
TN90 % Temperature where 90 % of a sample are magnetically ordered
Ts/Ttr (tetragonal-to-orthorhombic) structural transition temperature
U electric voltage
Uiso thermal displacement value
V Voltage
vol% volume per cent
wt% weight per cent
wTF weak transverse field
x distance
χ magnetic susceptibility per volume (equivalent to χV)
χ2 goodness of fit
YBCO YBa2Cu3O7−x
Z number of empirical formulas per unit cell
ZF zero field
11 Scientific contributions
100
11 Scientific contributions
Publications
Microscopic co-existence of superconductivity and magnetism in Ba1-xKxFe2As2 E. Wiesenmayer, H. Luetkens, G. Pascua, R. Khasanov, A. Amato, H. Potts, B.
Banusch, H.-H. Klaus, D. Johrendt, Phys Rev. Lett., 2011, 107, 237001. (chapter 3)
Role of heat and mechanical treatments in the fabrication of superconducting Ba0.6K0.4Fe2As2 ex-situ Powder-In-Tube tapes A. Malagoli, E. Wiesenmayer, S. Marchner, D. Johrendt, A. Genovese, M. Putti
Superconductor Science and Technology, accepted; arXiv: 1507.03781 2015.
(chapter 6)
Short range magnetic order in overdoped Ba1-xKxFe2As2 (0 ≥ x ≥ 0.66) E. Wiesenmayer, G. Pascua, F. Hummel, H. Luetkens, Z. Guguchia, A. Binek, U.
Pachmayr, T. Hermann, T. Goltz, R. Khasanov, A. Amato, H. Maeter, H.-H. Klaus, D.
Johrendt.
in preparation (chapter 4)
Rise of a new magnetic phase in Ba0.8K0.2Fe2As2 E. Wiesenmayer, G. Pascua, H. Luetkens, D. Bessinger, T. Hermann, Z. Shermadini,
R. Khasanov, A. Amato, H.-H. Klaus, D. Johrendt.
in preparation (chapter 5)
Efficient Planar Heterojunction Perovskite Solar Cells Based on Formamidinium Lead Bromide. F. C. Hanusch, E. Wiesenmayer, E. Mankel, A. Binek, P. Angloher, C. Fraunhofer, N.
Giesbrecht, J. M. Feckl, W. Jaegermann, D. Johrendt, T. Bein, and P. Docampo J.
Phys. Chem. Lett. 2014, 5, 2791−2795.
11 Scientific contributions
101
Conference contributions
D. Bichler, E. Wiesenmayer, D. Johrendt; "Crystal structures and magnetic properties of GaV4Se8 and GaV0.5Cr3.5Se8" ECSSC XII European Conference on
Solid State Chemistry, Münster 2009. (Poster)
E. Wiesenmayer, H. Luetkens, G. Pascua, R. Khasanov, A. Amato, H. Potts, B.
Banusch, H.-H. Klaus, D. Johrendt; "Koexistenz von Magnetismus und Supraleitung in unterdotiertem Ba1−xKxFe2As2 (0.2 ≤ x ≤ 0.3)" Festkörper-Seminar
Hirschegg, Hirschegg, Austria 2011. (Talk)
G. Pascua, H. Luetkens, E. Wiesenmayer, Z. Shermadini, R. Khasanov, A. Amato, H.
Maeter, H.-H. Klauss, D. Johrendt; "Microscopic Coexistence and Competition of Magnetism and Superconductivity in Ba1−xKxFe2As2: A Structural, Magnetic, and Superconducting Phase Diagram" ICM International Conference on
Magnetism, Busan, Korea 2012. (Poster)
E. Wiesenmayer, H. Luetkens, G. Pascua, R. Khasanov, A. Amato, H. Potts, B.
Banusch, H.-H. Klaus, D. Johrendt; "Microscopic coexistence of superconductivity and magnetism in Ba1−xKxFe2As2", Summer School on Iron-
Pnictides, Achatswies, Germany 2012. (Poster)
E. Wiesenmayer, A. Binek, U. Pachmayr, K. Markovic, M. Dunst, D. Johrendt;
"Optimized synthesis of Ba1-xKxFe2As2 via mechanical alloying", Student
Workshop, Bad Schandau, Germany 2013. (Poster)
E. Wiesenmayer, A. Binek, U. Pachmayr, K. Markovic, M. Dunst, D. Bessinger, D.
Johrendt; "New synthetic route and optimized synthesis of Ba1-xKxFe2As2",
EUCAS European Conference on Applied Superconductivity, Genoa, Italy 2013.
(Poster)
A. Malagoli, C. Bernini, E. Wiesenmayer, D. Johrendt, A. Genovese and M. Putti;
"Fabrication and characterization of superconducting (Ba0.6K0.4)Fe2As2 ex-situ P.I.T. processed wires", ASC Applied Superconductivity Conference, Charlotte,
USA 2014. (Poster)
12 Bibliography
102
12 Bibliography
[1] Arbeitsgemeinschaft Energiebilanzen e.V.; Berlin; 2014
[2] L. V. Alexander, S. K. Allen, N. L. Bindoff, et al., Summary for Policymakers.
In: Climate Change 2013: The Physical Science Basis. Contribution of
Working Group I to the Fifth Assessment Report of the Intergovernmental
Panel on Climate Change, Cambridge University Press, Cambridge, United
Kingdom and New York, NY, USA, 2013.
[3] J. Nagamatsu, N. Nakagawa, T. Muranaka, Y. Zenitani, J. Akimitsu, Nature
(London) 2001, 410, 63.
[4] S. Sanz, T. Arlaban, R. Manzanas, M. Tropeano, R. Funke, P. Kováč, Y.
Yang, H. Neumann, B. Mondesert, Journal of Physics: Conference Series
2014, 507, 032040.
[5] H. Kamerlingh Onnes, Comm. Phys. Lab Leiden 1911, 120b.
[6] H. Kamerlingh Onnes, Comm. Phys. Lab Leiden 1911, 122b.
[7] H. Kamerlingh Onnes, Comm. Phys. Lab Leiden 1911, 124c.
[8] D. K. Finnemore, T. F. Stromberg, C. A. Swenson, Physical Review 1966,
149, 231-243.
[9] B. T. Matthias, T. H. Geballe, S. Geller, E. Corenzwit, Physical Review 1954,
95, 1435.
[10] B. T. Matthias, T. H. Geballe, R. H. Willens, E. Corenzwit, G. W. Hull, Jr.,
Physical Review 1965, 139, 1501-1503.
[11] R. Chevrel, M. Hirrien, M. Sergent, Polyhedron 1986, 5, 87-94.
12 Bibliography
103
[12] A. Schilling, M. Cantoni, J. D. Guo, H. R. Ott, Nature 1993, 363, 56-58.
[13] Y. Kamihara, T. Watanabe, M. Hirano, H. Hosono, Journal of the American
Chemical Society 2008, 130, 3296.
[14] S. S. Saxena, P. B. Littlewood, Nature 2001, 412, 290-291.
[15] Z.-A. Ren, W. Lu, J. Yang, W.Yi, X.-L. Shen, Z.-C. Li, G.-C. Che, X.-L. Dong,
L.-L. Sun, F. Zhou, Z.-X. Zhao, Chinese Physics Letters 2008, 25, 2215.
[16] P. Cheng, B. Shen, G. Mu, X. Zhu, F. Han, B. Zeng, H.-H. Wen, Europhysics
Letters 2009, 85, 67003.
[17] M. Rotter, M. Tegel, D. Johrendt, Physical Review Letters 2008, 101, 107006.
[18] M. Gooch, B. Lv, K. Sasmal, J. H. Tapp, Z. J. Tang, A. M. Guloy, B. Lorenz, C.
W. Chu, Physica C 2010, 470, S276-S279.
[19] F. Hummel, Y. Su, A. Senyshyn, D. Johrendt, Physical Review B 2013, 88,
144517.
[20] P. M. Shirage, K. Kihou, C. H. Lee, H. Kito, H. Eisaki, A. Iyo, J Am Chem Soc
2011, 133, 9630-9633.
[21] T. Stürzer, G. Derondeau, D. Johrendt, Physical Review B 2012, 86, 060516.
[22] C. Löhnert, T. Stürzer, M. Tegel, R. Frankovsky, G. Friederichs, D. Johrendt,
Angewandte Chemie International Edition 2011, 50, 9195-9199.
[23] T. Nomura, S. W. Kim, Y. Kamihara, M. Hirano, P. V. Sushko, K. Kato, M.
Takata, A. L. Shluger, H. Hosono, Superconductor Science and Technology
2008, 21, 125028.
[24] C. d. l. Cruz, Q. Huang, J. W. Lynn, J. Li, W. RatcliffII, J. L. Zarestky, H. A.
Mook, G. F. Chen, J. L. Luo, N. L. Wang, P. Dai, Nature 2008, 453, 899.
12 Bibliography
104
[25] P. Klüfers, A. Mewis, Zeitschrift für Naturforschung B 1978, 33, 151-155.
[26] M. Pfisterer, G. Nagorsen, Zeitschrift für Naturforschung B 1980, 35b, 703-
704.
[27] M. Rotter, M. Tegel, I. Schellenberg, W. Hermes, R. Pöttgen, D. Johrendt,
Physical Review B: Condensed Matter and Materials Physics 2008, 78,
020503(R).
[28] S. Nandi, M. G. Kim, A. Kreyssig, R. M. Fernandes, D. K. Pratt, A. Thaler, N.
Ni, S. L. Bud'ko, P. C. Canfield, J. Schmalian, R. J. McQueeney, A. I.
Goldman, Physical Review Letters 2010, 104, 057006.
[29] M. Rotter, C. Hieke, D. Johrendt, Physical Review B 2010, 82, 014513.
[30] S. K. Kim, M. S. Torikachvili, E. Colombier, A. Thaler, S. L. Bud'ko, P. C.
Canfield, Physical Review B 2011, 84, 134525.
[31] J. Bardeen, Physical Review 1955, 97, 1724.
[32] L. N. Cooper, Physical Review 1956, 104, 1189.
[33] J. Bardeen, L. N. Cooper, J. R. Schrieffer, Physical Review 1957, 106, 162.
[34] M. Tegel, PhD thesis, Ludiwig-Maximilians-Universität 2011.
[35] A. Y. Liu, I. I. Mazin, J. Kortus, Physical Review Letters 2001, 87, 087005.
[36] J. R. Schrieffer, X. G. Wen, S. C. Zhang, Physical Review B 1989, 39, 11663-
11679.
[37] N. D. Mermin, H. Wagner, Physical Review Letters 1966, 17, 1133-1136.
[38] D. Vaknin, S. K. Sinha, D. E. Moncton, D. C. Johnston, J. M. Newsam, C. R.
Safinya, H. E. King, Physical Review Letters 1987, 58, 2802-2805.
12 Bibliography
105
[39] G. Xu, H. Zhang, X. Dai, Z. Fang, EPL (Europhysics Letters) 2008, 84, 67015.
[40] A. I. Liechtenstein, I. I. Mazin, O. K. Andersen, Physical Review Letters 1995,
74, 2303-2306.
[41] R. Thomale, C. Platt, W. Hanke, J. Hu, B. A. Bernevig, Physical Review
Letters 2011, 107, 117001.
[42] M. Rotter, M. Pangerl, M. Tegel, D. Johrendt, Angewandte Chemie,
International Edition 2008, 47, 7949-7952.
[43] R. M. Fernandes, D. K. Pratt, W. Tian, J. Zarestky, A. Kreyssig, S. Nandi, M.
G. Kim, A. Thaler, N. Ni, P. C. Canfield, R. J. McQueeney, J. Schmalian, A. I.
Goldman, Physical Review B 2010, 81, 140501.
[44] E. Hassinger, G. Gredat, F. Valade, S. R. de Cotret, A. Juneau-Fecteau, J. P.
Reid, H. Kim, M. A. Tanatar, R. Prozorov, B. Shen, H. H. Wen, N. Doiron-
Leyraud, L. Taillefer, Physical Review B 2012, 86, 140502.
[45] H. Q. Yuan, J. Singleton, F. F. Balakirev, S. A. Baily, G. F. Chen, J. L. Luo, N.
L. Wang, Nature 2009, 457, 565.
[46] W. RAWDAT, 2.14 ed., STOE & Cie GmbH
Darmstadt, 2005.
[47] W. GRAPHICS, 2.16 ed., STOE & Cie GmbH
Darmstadt, 2004.
[48] JCPDS, 2.2 ed., International Center for Diffraction Data, Swathmore, USA,
2001.
[49] S. W. THEO, 2.04 ed., STOE & Cie GmbH, 2004.
[50] P. K. C. Villars, ASM International, Materials Park, Ohio, USA, 2009/10.
[51] A. Coelho, 4.1 ed., Coelho Software, Brisbane, 2007.
12 Bibliography
106
[52] R. W. Cheary, A. A. Coelho, J. P. Cline, J. Res. Natl. Inst. Stand. Technol.
2004, 109, 1-26.
[53] A. Le Bail, A. Jouanneaux, Journal of Applied Crystallography 1997, 30, 265.
[54] A. March, Zeitschrift für Kristallographie 1932, 81, 285-297.
[55] W. A. Dollase, Journal of Applied Crystallography 1986, 19, 267-272.
[56] M. Tegel, 1.67 rc ed., Ludwig-Maximilians-Universität, München, 2010.
[57] INCA, 4.02 ed., Oxford Instruments Analytical Ltd., 1998-2002.
[58] A. Suter, B. M. Wojek, Physics Procedia 2012, 30, 69-73.
[59] K. Hagiwara, Phys Rec. D 2002, 66, 010001.
[60] H. Luetkens, in PSI Summer School, Villigen, Switzerland, 2010.
[61] C. S. Wu, E. Ambler, R. W. Hayward, D. D. Hoppes, and, R. P. Hudson, Phys.
Rev. 1957, 105, 1413-1415.
[62] R. L. Garwin, L. M. Lederman, and, M. Weinrich, Phys. Rev. 1957, 105, 1415-
1417.
[63] G. Pascua, PhD thesis, Universität Zürich 2014.
[64] K. Muller, C. Andrikidis, H. K. Liu, S. X. Dou, Physical review. B, Condensed
matter 1994, 50, 10218-10224.
[65] A. Yamamoto, J. Jiang, C. Tarantini, N. Craig, A. A. Polyanskii, F. Kametani,
F. Hunte, J. Jaroszynski, E. E. Hellstrom, D. C. Larbalestier, R. Jin, A. S.
Sefat, M. A. McGuire, B. C. Sales, D. K. Christen, D. Mandrus, Applied
Physics Letters 2008, 92, 252501.
12 Bibliography
107
[66] M. Vojenčiak, F. Grilli, A. Stenvall, A. Kling, W. Goldacker, Cryogenics 2013,
57, 189-194.
[67] C. Dong, C. Yao, H. Lin, X. Zhang, Q. Zhang, D. Wang, Y. Ma, H. Oguro, S.
Awaji, K. Watanabe, Scripta Materialia 2015, 99, 33-36.
[68] Z. Gao, K. Togano, A. Matsumoto, H. Kumakura, Superconductor Science and
Technology 2015, 28, 012001.
[69] A. Malagoli, Private communication, 2015
[70] V. Zinth, T. Dellmann, H.-H. Klauss, D. Johrendt, Angewandte Chemie
International Edition 2011, 50, 7919-7923.
[71] H. Chen, Y. Ren, Y. Qiu, W. Bao, R. H. Liu, G. Wu, T. Wu, Y. L. Xie, X. F.
Wang, Q. Huang, X. H. Chen, Europhysics Letters 2009, 85, 17006.
[72] M. Rotter, M. Tegel, I. Schellenberg, F. M. Schappacher, R. Pöttgen, J.
Deisenhofer, A. Günther, F. Schrettle, A. Loidl, D. Johrendt, New Journal of
Physics 2009, 11, 025014.
[73] A. A. Aczel, E. Baggio-Saitovitch, S. L. Budko, P. C. Canfield, J. P. Carlo, G.
F. Chen, P. C. Dai, T. Goko, W. Z. Hu, G. M. Luke, J. L. Luo, N. Ni, D. R.
Sanchez-Candela, F. F. Tafti, N. L. Wang, T. J. Williams, W. Yu, Y. J. Uemura,
Physical Review B 2008, 78, 214503.
[74] T. Goko, A. A. Aczel, E. Baggio-Saitovitch, et al., Physical Review B 2009, 80,
024508.
[75] J. T. Park, D. S. Inosov, C. Niedermayer, G. L. Sun, D. Haug, N. B.
Christensen, R. Dinnebier, A. V. Boris, A. J. Drew, L. Schulz, T. Shapoval, U.
Wolff, V. Neu, X. P. Yang, C. T. Lin, B. Keimer, V. Hinkov, Physical Review
Letters 2009, 102, 117006.
12 Bibliography
108
[76] M. H. Julien, H. Mayaffre, M. Horvatić, C. Berthier, X. D. Zhang, W. Wu, G. F.
Chen, N. L. Wang, J. L. Luo, EPL (Europhysics Letters) 2009, 87, 37001.
[77] D. K. Pratt, W. Tian, A. Kreyssig, J. L. Zarestky, S. Nandi, N. Ni, S. L. Bud’ko,
P. C. Canfield, A. I. Goldman, R. J. McQueeney, Physical Review Letters
2009, 103, 087001.
[78] R. M. Fernandes, J. Schmalian, Physical Review B 2010, 82, 014521.
[79] S. Avci, O. Chmaissem, E. A. Goremychkin, S. Rosenkranz, J. P. Castellan,
D. Y. Chung, I. S. Todorov, J. A. Schlueter, H. Claus, M. G. Kanatzidis, A.
Daoud-Aladine, D. Khalyavin, R. Osborn, Physical Review B 2011, 83,
172503.
[80] S. D. Wilson, Z. Yamani, C. R. Rotundu, B. Freelon, E. Bourret-Courchesne,
R. J. Birgeneau, Physical Review B 2009, 79, 184519.
[81] H.-H. Klauss, H. Luetkens, R. Klingeler, C. Hess, F. J. Litterst, M. Kraken, M.
M. Korshunov, I. Eremin, S.-L. Drechsler, R. Khasanov, A. Amato, J. Hamann-
Borrero, N. Leps, A. Kondrat, G. Behr, J. Werner, B. Büchner, Physical
Review Letters 2008, 101, 077005.
[82] A. Jesche, N. Caroca-Canales, H. Rosner, H. Borrmann, A. Ormeci, D.
Kasinathan, H. H. Klauss, H. Luetkens, R. Khasanov, A. Amato, A. Hoser, K.
Kaneko, C. Krellner, C. Geibel, Physical Review B 2008, 78, 180504.
[83] A. Yaouanc, P. D. Réotier, MUON SPIN RELAXATION and RESONANCE,
Oxford University Press, 2011.
[84] C. Bernhard, A. J. Drew, L. Schulz, V. K. Malik, M. Rössle, N. Ch, W. Th, G. D.
Varma, G. Mu, H. H. Wen, H. Liu, G. Wu, X. H. Chen, New Journal of Physics
2009, 11, 055050.
12 Bibliography
109
[85] P. Marsik, K. W. Kim, A. Dubroka, M. Rössle, V. K. Malik, L. Schulz, C. N.
Wang, C. Niedermayer, A. J. Drew, M. Willis, T. Wolf, C. Bernhard, Physical
Review Letters 2010, 105, 057001.
[86] A. V. Chubukov, D. V. Efremov, I. Eremin, Physical Review B 2008, 78,
134512.
[87] P. J. Hirschfeld, M. M. Korshunov, I. I. Mazin, Reports on Progress in Physics
2011, 74, 124508.
[88] P. Dai, J. Hu, E. Dagotto, Nat Phys 2012, 8, 709-718.
[89] E. Wiesenmayer, H. Luetkens, G. Pascua, R. Khasanov, A. Amato, H. Potts,
B. Banusch, H. H. Klauss, D. Johrendt, Phys Rev Lett 2011, 107, 237001.
[90] J.-H. Chu, J. G. Analytis, K. De Greve, P. L. McMahon, Z. Islam, Y.
Yamamoto, I. R. Fisher, Science 2010, 329, 824-826.
[91] C. Fang, H. Yao, W.-F. Tsai, J. Hu, S. A. Kivelson, Physical Review B 2008,
77, 224509.
[92] R. M. Fernandes, A. V. Chubukov, J. Schmalian, Nat Phys 2014, 10, 97-104.
[93] S. Avci, O. Chmaissem, J. M. Allred, S. Rosenkranz, I. Eremin, A. V.
Chubukov, D. E. Bugaris, D. Y. Chung, M. G. Kanatzidis, J. P. Castellan, J. A.
Schlueter, H. Claus, D. D. Khalyavin, P. Manuel, A. Daoud-Aladine, R.
Osborn, Nat Commun 2014, 5.
[94] F. Waßer, A. Schneidewind, Y. Sidis, S. Wurmehl, S. Aswartham, B. Büchner,
M. Braden, Physical Review B 2015, 91, 060505.
[95] A. E. Böhmer, F. Hardy, L. Wang, T. Wolf, P. Schweiss, C. Meingast,
arXiv:1412.7038 2014.
12 Bibliography
110
[96] A. E. Böhmer, P. Burger, F. Hardy, T. Wolf, P. Schweiss, R. Fromknecht, M.
Reinecker, W. Schranz, C. Meingast, Physical Review Letters 2014, 112,
047001.
[97] D. Hu, X. Lu, W. Zhang, et al., Physical Review Letters 2015, 114, 157002.
[98] D. K. Pratt, M. G. Kim, A. Kreyssig, Y. B. Lee, G. S. Tucker, A. Thaler, W.
Tian, J. L. Zarestky, S. L. Bud’ko, P. C. Canfield, B. N. Harmon, A. I. Goldman,
R. J. McQueeney, Physical Review Letters 2011, 106, 257001.
[99] X. Lu, H. Gretarsson, R. Zhang, X. Liu, H. Luo, W. Tian, M. Laver, Z. Yamani,
Y.-J. Kim, A. H. Nevidomskyy, Q. Si, P. Dai, Physical Review Letters 2013,
110, 257001.
[100] P. J. Baker, H. J. Lewtas, S. J. Blundell, T. Lancaster, F. L. Pratt, D. R. Parker,
M. J. Pitcher, S. J. Clarke, Physical Review B 2008, 78, 212501.
[101] S. Avci, O. Chmaissem, D. Y. Chung, S. Rosenkranz, E. A. Goremychkin, J.
P. Castellan, I. S. Todorov, J. A. Schlueter, H. Claus, A. Daoud-Aladine, D. D.
Khalyavin, M. G. Kanatzidis, R. Osborn, Physical Review B 2012, 85, 184507.
[102] J. E. Sonier, J. H. Brewer, R. F. Kiefl, Reviews of Modern Physics 2000, 72,
769-811.
[103] N. Xu, P. Richard, X. Shi, A. van Roekeghem, T. Qian, E. Razzoli, E. Rienks,
G. F. Chen, E. Ieki, K. Nakayama, T. Sato, T. Takahashi, M. Shi, H. Ding,
Physical Review B 2013, 88, 220508.
[104] T. Goltz, V. Zinth, D. Johrendt, H. Rosner, G. Pascua, H. Luetkens, P.
Materne, H.-H. Klauss, Physical Review B 2014, 89, 144511.
[105] V. Zinth, D. Johrendt, EPL (Europhysics Letters) 2012, 98, 57010.
12 Bibliography
111
[106] J. M. Allred, S. Avci, D. Y. Chung, H. Claus, D. Khalyavin, P. Manuel, M.
Taddei, M. G. Kanatzidis, S. Rosenkranz, R. Osborn, O. Chmaissem,
arXiv:1505.01433 2015.
[107] P. L. Alireza, Y. T. C. Ko, J. Gillett, C. M. Petrone, J. M. Cole, G. G. Lonzarich,
S. E. Sebastian, Journal of Physics: Condensed Matter 2009, 21, 012208.
[108] L. D. Jennings, C. A. Swenson, Physical Review 1958, 112, 31-43.
[109] S. L. Bud'ko, M. Sturza, D. Y. Chung, M. G. Kanatzidis, P. C. Canfield,
Physical Review B 2013, 87, 100509.
[110] Office of Science, US Department of Energy, 2006.
[111] A. P. Malozemoff, Nat Mater 2007, 6, 617-619.
[112] R. Flükiger, H. L. Suo, N. Musolino, C. Beneduce, P. Toulemonde, P. Lezza,
Physica C: Superconductivity 2003, 385, 286-305.
[113] H. Takeshi, S. Ken-ichi, H. Hajime, Japanese Journal of Applied Physics 1989,
28, L82.
[114] J. E. Kunzler, E. Buehler, F. S. L. Hsu, J. H. Wernick, Physical Review Letters
1961, 6, 89-91.
[115] Z. Gao, L. Wang, Y. Qi, D. Wang, X. Zhang, Y. Ma, Superconductor Science
and Technology 2008, 21, 105024.
[116] M. Vignolo, G. Bovone, C. Bernini, A. Palenzona, S. Kawale, G. Romano, A.
S. Siri, Superconductor Science and Technology 2013, 26, 105022.
[117] A. Malagoli, V. Braccini, C. Bernini, G. Romano, M. Vignolo, M. Putti, C.
Ferdeghini, Superconductor Science and Technology 2010, 23, 025032.
[118] A. Malagoli, V. Braccini, M. Vignolo, X. Chaud, M. Putti, Superconductor
Science and Technology 2014, 27, 055022.
12 Bibliography
112
[119] L. A. Schwartzkopf, J. Jiang, X. Y. Cai, D. Apodaca, D. C. Larbalestier,
Applied Physics Letters 1999, 75, 3168-3170.
[120] M. Y. Li, X. P. Chen, T. M. Qu, H. P. Yi, Z. Han, Q. Liu, Physica C:
Superconductivity 2004, 412–414, Part 2, 1091-1095.
[121] D. Larbalestier, A. Gurevich, D. M. Feldmann, A. Polyanskii, Nature 2001, 414,
368-377.
[122] M. Majoros, B. A. Glowacki, A. M. Campbell, G. A. Levin, P. N. Barnes, M.
Polak, Applied Superconductivity, IEEE Transactions on 2005, 15, 2819-2822.
[123] A. Gurevich, Nat Mater 2011, 10, 255-259.
[124] F. Kametani, P. Li, D. Abraimov, A. A. Polyanskii, A. Yamamoto, J. Jiang, E.
E. Hellstrom, A. Gurevich, D. C. Larbalestier, Z. A. Ren, J. Yang, X. L. Dong,
W. Lu, Z. X. Zhao, Applied Physics Letters 2009, 95, 142502.
[125] T. Ozaki, Y. Mizuguchi, S. Demura, K. Deguchi, Y. Kawasaki, T. Watanabe, H.
Okazaki, H. Hara, H. Takeya, T. Yamaguchi, H. Kumakura, Y. Takano, Journal
of Applied Physics 2012, 111, 013912.
[126] H. Izawa, Y. Mizuguchi, T. Ozaki, Y. Takano, O. Miura, Japanese Journal of
Applied Physics 2012, 51, 010101.
[127] A. Gurevich, Reports on Progress in Physics 2011, 74, 124501.
[128] M. Yanwei, Superconductor Science and Technology 2012, 25, 113001.
[129] Z. Gao, L. Wang, C. Yao, Y. Qi, C. Wang, X. Zhang, D. Wang, C. Wang, Y.
Ma, Applied Physics Letters 2011, 99, 242506.
[130] B. A. Glowacki, M. Majoros, M. Vickers, J. E. Evetts, Y. Shi, I. McDougall,
Superconductor Science and Technology 2001, 14, 193.
12 Bibliography
113
[131] A. Malagoli, C. Bernini, V. Braccini, G. Romano, M. Putti, X. Chaud, F. Debray,
Superconductor Science and Technology 2013, 26, 045004.
[132] X. Zhang, L. Wang, Y. Qi, D. Wang, Z. Gao, Z. Zhang, Y. Ma, Physica C:
Superconductivity 2010, 470, 104-108.
[133] M. J. Qin, S. Keshavarzi, S. Soltanian, X. L. Wang, H. K. Liu, S. X. Dou,
Physical Review B 2004, 69, 012507.
[134] K. Fukushima, M. Okada, J. Sato, T. Kiyoshi, H. Kumakura, K. Togano, H.
Wada, Japanese Journal of Applied Physics 1997, 36, L1433.
[135] J. D. Weiss, C. Tarantini, J. Jiang, F. Kametani, A. A. Polyanskii, D. C.
Larbalestier, E. E. Hellstrom, Nat Mater 2012, 11, 682-685.
[136] H. Lin, C. Yao, X. Zhang, C. Dong, H. Zhang, D. Wang, Q. Zhang, Y. Ma, S.
Awaji, K. Watanabe, H. Tian, J. Li, Sci. Rep. 2014, 4.
[137] T. Kazumasa, G. Zhaoshun, M. Akiyoshi, K. Hiroaki, Superconductor Science
and Technology 2013, 26, 115007.
[138] Z. Gao, K. Togano, A. Matsumoto, H. Kumakura, Sci. Rep. 2014, 4.
[139] S. Rozsa, H. U. Schuster, Zeitschrift für Naturforschung B 1981, 36B, 1668-
1670.
[140] E. L. Fokina, N. I. Budim, V. G. Kochnev, G. G. Chernik, Journal of Materials
Science 2004, 39, 5217-5221.
[141] V. V. Tcherdyntsev, S. D. Kaloshkin, E. V. Shelekhov, A. I. Salimon, S. Sartori,
G. Principi, Intermetallics 2005, 13, 841-847.
[142] S. D. Kaloshkin, V. V. Tcherdyntsev, Y. V. Baldokhin, I. A. Tomilin, E. V.
Shelekhov, Journal of Non-Crystalline Solids 2001, 287, 329-333.
12 Bibliography
114
[143] V. P. Balema, J. W. Wiench, M. Pruski, V. K. Pecharsky, Chemical
Communications 2002, 724-725.
[144] A. Stolle, T. Szuppa, S. E. S. Leonhardt, B. Ondruschka, Chemical Society
Reviews 2011, 40, 2317-2329.
[145] C. F. Burmeister, A. Kwade, Chemical Society Reviews 2013, 42, 7660-7667.
[146] T. Baumgartner, M. Eisterer, H. W. Weber, R. Flükiger, C. Scheuerlein, L.
Bottura, arXiv:1504.05366 2015.