Interim Report -...
203
2017 Interim Report Stock Code: 1398 USD Preference Shares Stock Code: 4603 EUR Preference Shares Stock Code: 4604 RMB Preference Shares Stock Code: 84602
Transcript of Interim Report -...

2017Interim Report
Stock Code: 1398USD Preference Shares Stock Code: 4603EUR Preference Shares Stock Code: 4604RMB Preference Shares Stock Code: 84602
中國北京市西城區復興門內大街55號 郵編:100140No.55 Fuxingmennei Avenue, Xicheng District, Beijing, PRC
www.icbc.com.cn, www.icbc-ltd.comPost Code: 100140
2017Interim
Report

Company Profile
Industrial and Commercial Bank of China was established on 1 January 1984. On 28 October 2005, the Bank was wholly restructured to a joint-stock limited company. On 27 October 2006, the Bank was successfully listed on both Shanghai Stock Exchange and The Stock Exchange of Hong Kong Limited.
Through its continuous endeavor and stable development, the Bank has developed into the leading bank in the world, possessing an excellent customer base, a diversified business structure, strong innovation capabilities and market competitiveness. The Bank regards service as the very foundation to seek further development and has made efforts to build a “bank to the satisfaction of customers” while providing a comprehensive range of financial products and services to 6.07 million corporate customers and 546 million personal customers. The Bank consciously integrates the social responsibilities with its development strategy and operation and management activities, gaining wide recognition in the aspects of supporting targeted poverty relief, protecting environment and resources, participating in public welfare undertakings and promoting inclusive finance.
The Bank always keeps in mind its underlying mission of serving the real economy with its principal business, and along with the real economy it prospers, suffers and grows. Taking a risk-based approach and never overstepping the bottom line, it regards controlling and resolving risks as its iron law. Besides, the Bank remains steadfast in understanding and following the business rules of commercial banks to strive to be a century-old bank. It also stays committed to seeking progress with innovation while maintaining stability, continuously enhances the strategy of mega retail, mega asset management, mega investment banking as well as international and comprehensive development, and actively embraces the Internet. The Bank unswervingly delivers specialized services, and pioneers a specialized business model, thus making it “a craftsman in large banking”.
The Bank was ranked the 1st place among the Top 1000 World Banks by The Banker, ranked 1st place in the Global 2000 listed by Forbes and topped the sub-list of commercial banks of the Global 500 in Fortune for the fifth consecutive year, and took the 1st place among the Top 500 Banking Brands of Brand Finance.
Definitions 2
Important Notice 3
Corporate Information 4
Financial Highlights 5
Chairman’s Statement 8
President’s Statement 10
Discussion and Analysis 12
— Economic, Financial and Regulatory Environments 12
— Financial Statements Analysis 13
— Business Overview 28
— Risk Management 47
— Capital Management 58
— Outlook 61
— Other Information Disclosed Pursuant to Regulatory Requirements 62
Information Disclosed Pursuant to the Capital Regulation 63
Details of Changes in Share Capital and Shareholding of Substantial Shareholders 67
Directors, Supervisors, Senior Management, Employees and Institutions 74
Significant Events 76
Review Report and Interim Financial Report 80
List of Domestic and Overseas Branches and Offices 196
CONTENTS
Definitions
2
In this report, unless the context otherwise requires, the following terms shall have the meanings set out below:
Articles of Association The Articles of Association of Industrial and Commercial Bank of China LimitedBank ICBC (JSC) Bank ICBC (Joint Stock Company)Capital Regulation Regulation Governing Capital of Commercial Banks (Provisional) promulgated by
CBRC in June 2012CBRC China Banking Regulatory CommissionCSRC China Securities Regulatory CommissionGlobal Systemically Important Banks Banks undertaking key functions with global features in the financial markets as
released by the Financial Stability BoardHong Kong Listing Rules Rules Governing the Listing of Securities on The Stock Exchange of Hong Kong
LimitedHuijin Central Huijin Investment Ltd.ICBC (Almaty) Industrial and Commercial Bank of China (Almaty) Joint Stock CompanyICBC (Argentina) Industrial and Commercial Bank of China (Argentina) S.A.ICBC (Asia) Industrial and Commercial Bank of China (Asia) LimitedICBC (Brasil) Industrial and Commercial Bank of China (Brasil) S.A.ICBC (Canada) Industrial and Commercial Bank of China (Canada)ICBC (Europe) Industrial and Commercial Bank of China (Europe) S.A.ICBC (Indonesia) PT. Bank ICBC IndonesiaICBC (London) ICBC (London) PLCICBC (Macau) Industrial and Commercial Bank of China (Macau) LimitedICBC (Malaysia) Industrial and Commercial Bank of China (Malaysia) BerhadICBC (Mexico) Industrial and Commercial Bank of China Mexico S.A.ICBC (New Zealand) Industrial and Commercial Bank of China (New Zealand) LimitedICBC (Peru) ICBC PERU BANKICBC (Thai) Industrial and Commercial Bank of China (Thai) Public Company LimitedICBC (Turkey) ICBC Turkey Bank Anonim SirketiICBC (USA) Industrial and Commercial Bank of China (USA) NAICBC Credit Suisse Asset Management ICBC Credit Suisse Asset Management Co., Ltd.ICBC International ICBC International Holdings LimitedICBC Leasing ICBC Financial Leasing Co., Ltd.ICBC Standard Bank ICBC Standard Bank PLCICBC-AXA ICBC-AXA Assurance Co., Ltd.ICBCFS Industrial and Commercial Bank of China Financial Services LLCIFRSs The International Financial Reporting Standards promulgated by the International
Accounting Standards Board, which comprise the International Accounting Standards
MOF Ministry of Finance of the People’s Republic of ChinaPBC The People’s Bank of ChinaPRC GAAP Accounting Standards for Business Enterprises promulgated by the Ministry of
FinanceSecurities and Futures Ordinance of
Hong KongSecurities and Futures Ordinance (Chapter 571 of the Laws of Hong Kong)
SEHK The Stock Exchange of Hong Kong LimitedSSE Shanghai Stock ExchangeStandard Bank Standard Bank Group Limitedthe Bank/the Group Industrial and Commercial Bank of China Limited; or Industrial and Commercial
Bank of China Limited and its subsidiaries
Important Notice
I n t e r i m R e p o r t 2 0 1 7 3
The Board of Directors, the Board of Supervisors, Directors, Supervisors and Senior Management members of Industrial and Commercial Bank of China Limited undertake that the information in this report contains no false record, misleading statement or material omission, and assume individual and joint and several liability for the authenticity, accuracy and completeness of the information in this report.
The 2017 Interim Report of the Bank and the results announcement have been considered and approved at the meeting of the Board of Directors of the Bank held on 30 August 2017. There were 13 directors eligible for attending the meeting, of whom 11 directors attended the meeting in person, 2 directors appointed others to attend the meeting. Vice Chairman Gu Shu appointed Chairman Yi Huiman to attend the meeting and vote on his behalf, and Director Shen Si appointed Director Hong Yongmiao to attend the meeting and vote on his behalf.
Upon the approval at the Annual General Meeting for the Year 2016 held on 27 June 2017, the Bank has distributed cash dividends of about RMB83,506 million, or RMB2.343 per ten shares (pre-tax), for the period from 1 January 2016 to 31 December 2016 to the ordinary shareholders whose names appeared on the share register after the close of market on 10 July 2017. The Bank will not declare or distribute interim dividends for 2017, nor will it convert any capital reserves to share capital.
The 2017 interim financial report prepared by the Bank in accordance with PRC GAAP and IFRSs have been reviewed by KPMG Huazhen LLP and KPMG in accordance with Chinese and international standards on review engagements, respectively.
The Board of Directors of Industrial and Commercial Bank of China Limited
30 August 2017
Mr. Yi Huiman, Legal Representative of the Bank, Mr. Gu Shu, President in charge of finance of the Bank, and Mr. Zhang Wenwu, General Manager of the Finance and Accounting Department of the Bank, hereby warrant and guarantee that the financial statements contained in the Interim Report are authentic, accurate and complete.
Notes on Material Risks
During the reporting period, the Bank did not identify any material risk that exerted negative impact on the Bank’s future development strategy and business objectives. The Bank has actively adopted measures to effectively manage various types of risks. Please refer to “Discussion and Analysis — Risk Management” for detailed information.
The report contains forward-looking statements on the Bank’s financial positions, business performance and development. These statements are based on existing plans, estimates and forecasts, and bear upon future external events or the Group’s future finance, business or performance in other aspects, and may involve future plans which do not constitute substantive commitment to investors. Hence, investors and persons concerned shall be fully aware of the risks and understand the difference between plans, estimates and commitments.
This report is prepared in both Chinese and English. In the case of discrepancy between the two versions, the Chinese version shall prevail.
Corporate Information
4
Legal name in Chinese中國工商銀行股份有限公司 (“中國工商銀行”)
Legal name in EnglishINDUSTRIAL AND COMMERCIAL BANK OF CHINA LIMITED (“ICBC”)
Legal representativeYi Huiman
Registered address and office address55 Fuxingmennei Avenue, Xicheng District, Beijing, ChinaPostal code: 100140Telephone: 86-10-66106114Business enquiry and complaint hotline: 86-95588Website: www.icbc.com.cn, www.icbc-ltd.com
Principal place of business in Hong Kong33/F, ICBC Tower, 3 Garden Road, Central, Hong Kong
Authorized representativesGu Shu and Guan Xueqing
Board Secretary and Company SecretaryGuan XueqingAddress: 55 Fuxingmennei Avenue, Xicheng District, Beijing, ChinaTelephone: 86-10-66108608Facsimile: 86-10-66107571E-mail: [email protected]
Selected media for information disclosureChina Securities Journal, Shanghai Securities News, Securities Times, Securities Daily
Website designated by CSRC for publication of the interim report in respect of A shareswww.sse.com.cn
The “HKEXnews” website of SEHK for publication of the interim report in respect of H shareswww.hkexnews.hk
Legal advisorsMainland China
King & Wood Mallesons40/F, Office Tower A, Beijing Fortune Plaza, 7 East 3rd Ring Middle Road, Chaoyang District, Beijing, PRC
JunHe LLP20/F, China Resources Building, 8 Jianguomen North Street, Dongcheng District, Beijing, PRC
Hong Kong, China
Allen & Overy9/F, Three Exchange Square, Central, Hong Kong
Linklaters10/F, Alexandra House, Chater Road, Central, Hong Kong
Share registrarsA Share
China Securities Depository and Clearing Corporation Limited, Shanghai Branch3/F China Insurance Building, No. 166 Lujiazui Dong Road, Pudong New Area, Shanghai, PRCTelephone: 86-4008058058
H Share
Computershare Hong Kong Investor Services Limited17M Floor, Hopewell Center, 183 Queen’s Road East, Wanchai, Hong KongTelephone: 852-28628555Facsimile: 852-28650990
Location where copies of the interim report are kept Board of Directors’ Office of the Bank
Place where shares are listed, and their names and codesA Share
Shanghai Stock ExchangeStock name: 工商銀行Stock code: 601398
H Share
The Stock Exchange of Hong Kong LimitedStock name: ICBCStock code: 1398
Offshore Preference Shares
The Stock Exchange of Hong Kong LimitedStock name: ICBC USDPREF1Stock code: 4603
Stock name: ICBC EURPREF1Stock Code: 4604
Stock name: ICBC CNHPREF1-RStock Code: 84602
Domestic Preference Shares
Shanghai Stock ExchangeStock name: 工行優1Stock code: 360011
Name and office address of auditorsDomestic auditors
KPMG Huazhen LLP8/F, Tower E2, Oriental Plaza, 1 East Chang’an Avenue, Dongcheng District, Beijing, PRCCPAs (Practicing): Song Chenyang and He Qi
International auditors
KPMG8/F, Prince’s Building, 10 Chater Road, Central, Hong Kong
Financial Highlights
I n t e r i m R e p o r t 2 0 1 7 5
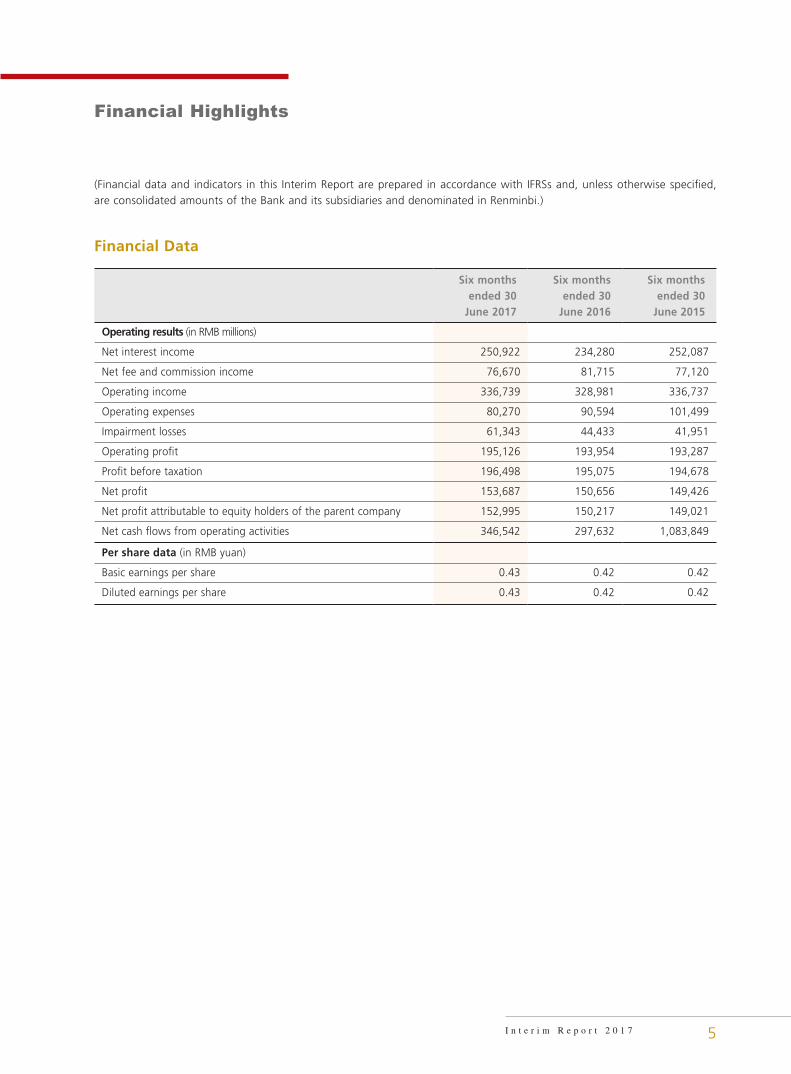
(Financial data and indicators in this Interim Report are prepared in accordance with IFRSs and, unless otherwise specified, are consolidated amounts of the Bank and its subsidiaries and denominated in Renminbi.)
Financial Data
Six months ended 30
June 2017
Six months ended 30
June 2016
Six months ended 30
June 2015
Operating results (in RMB millions)
Net interest income 250,922 234,280 252,087
Net fee and commission income 76,670 81,715 77,120
Operating income 336,739 328,981 336,737
Operating expenses 80,270 90,594 101,499
Impairment losses 61,343 44,433 41,951
Operating profit 195,126 193,954 193,287
Profit before taxation 196,498 195,075 194,678
Net profit 153,687 150,656 149,426
Net profit attributable to equity holders of the parent company 152,995 150,217 149,021
Net cash flows from operating activities 346,542 297,632 1,083,849
Per share data (in RMB yuan)
Basic earnings per share 0.43 0.42 0.42
Diluted earnings per share 0.43 0.42 0.42

Financial Highlights
6
Financial Data (continued)
30 June 2017
31 December 2016
31 December 2015
Assets and liabilities (in RMB millions)
Total assets 25,514,046 24,137,265 22,209,780
Total loans and advances to customers 13,865,909 13,056,846 11,933,466
Corporate loans 8,927,631 8,140,684 7,869,552
Personal loans 4,575,191 4,196,169 3,541,862
Discounted bills 363,087 719,993 522,052
Allowance for impairment losses on loans 316,513 289,512 280,654
Investment 5,569,993 5,481,174 5,009,963
Total liabilities 23,483,412 22,156,102 20,409,261
Due to customers 19,021,171 17,825,302 16,281,939
Corporate deposits 10,332,529 9,448,520 8,437,014
Personal deposits 8,489,736 8,140,281 7,601,114
Other deposits 198,906 236,501 243,811
Due to banks and other financial institutions 1,815,045 2,016,799 2,265,860
Equity attributable to equity holders of the parent company 2,018,295 1,969,751 1,789,474
Share capital 356,407 356,407 356,407
Net asset value per share(1) (in RMB yuan) 5.42 5.29 4.80
Net core tier 1 capital(2) 1,923,535 1,874,976 1,701,495
Net tier 1 capital(2) 2,003,429 1,954,770 1,781,062
Net capital base(2) 2,196,084 2,127,462 2,012,103
Risk-weighted assets(2) 15,183,975 14,564,617 13,216,687
Credit rating
S&P(3) A A A
Moody’s(3) A1 A1 A1
Notes: (1) Calculated by dividing equity attributable to equity holders of the parent company after deduction of other equity instruments at the end of the reporting period by the total number of ordinary shares at the end of the reporting period.
(2) Calculated in accordance with the Capital Regulation.
(3) The rating results are in the form of “long-term foreign currency deposits rating”.

7
Financial Highlights
I n t e r i m R e p o r t 2 0 1 7
Financial Indicators
Six months ended 30
June 2017
Six months ended 30
June 2016
Six months ended 30
June 2015
Profitability (%)
Return on average total assets(1) 1.24* 1.32* 1.39*
Return on weighted average equity(2) 15.69* 16.83* 18.86*
Net interest spread(3) 2.03* 2.07* 2.34*
Net interest margin(4) 2.16* 2.21* 2.53*
Return on risk-weighted assets(5) 2.07* 2.21* 2.36*
Ratio of net fee and commission income to operating income 22.77 24.84 22.90
Cost-to-income ratio(6) 22.68 23.44 23.71
30 June 2017
31 December 2016
31 December 2015
Asset quality (%)
Non-performing loans (“NPL”) ratio(7) 1.57 1.62 1.50
Allowance to NPL(8) 145.81 136.69 156.34
Allowance to total loans ratio(9) 2.28 2.22 2.35
Capital adequacy (%)
Core tier 1 capital adequacy ratio(10) 12.67 12.87 12.87
Tier 1 capital adequacy ratio(10) 13.19 13.42 13.48
Capital adequacy ratio(10) 14.46 14.61 15.22
Total equity to total assets ratio 7.96 8.21 8.11
Risk-weighted assets to total assets ratio 59.51 60.34 59.51
Notes: * indicates annualized ratios.
(1) Calculated by dividing net profit by the average balance of total assets at the beginning and at the end of the reporting period.
(2) Calculated in accordance with the Rules for the Compilation and Submission of Information Disclosure by Companies that Offer Securities to the Public No. 9 — Calculation and Disclosure of Return on Net Assets and Earnings per Share (Revision 2010) issued by CSRC.
(3) Calculated by the spread between yield on average balance of interest-generating assets and cost on average balance of interest-bearing liabilities.
(4) Calculated by dividing net interest income by the average balance of interest-generating assets.
(5) Calculated by dividing net profit by the average balance of risk-weighted assets at the beginning and at the end of the reporting period.
(6) Calculated by dividing operating expenses (less taxes and surcharges) by operating income.
(7) Calculated by dividing the balance of NPLs by total balance of loans and advances to customers.
(8) Calculated by dividing allowance for impairment losses on loans by total balance of NPLs.
(9) Calculated by dividing allowance for impairment losses on loans by total balance of loans and advances to customers.
(10) Calculated in accordance with the Capital Regulation.

Chairman’s Statement
8
In the past half of 2017, the Bank has presented a satisfactory performance sheet with several highlights despite the complex and versatile operating environment. In the first six months, we realized a pre-provision profit of RMB257.8 billion, up 7.7% compared to the same period of last year and 7.5 percentage points from 2016, and a net profit of RMB153.7 billion, up 2.0% compared to the same period of last year, at the highest growth rate since 2015. Asset quality saw positive signs, the foundation for stable operation was further cemented, a favorable trend was more evident, and the NPL ratio, overdue loan ratio, scissors difference and other KPIs were reduced comprehensively, with the NPL ratio down by 0.05 percentage point from the beginning of the year to 1.57%, the first fall after the NPL balance and ratio have been rising since 2013. The allowance to NPL ratio increased quarter by quarter and reached 145.81% at the end of June, up 9.12 percentage points from the beginning of the year. The improvement of asset return and quality fully proved that our overall operation is stable, the fundamentals are good, and development is resilient.
If we read a little deeper into this performance sheet, we’ll realize that it reflects the Bank’s continuous exploration and grasp of the principle governing the operation of commercial banks, our relentless pursuit and cultivation of professional capabilities, and our commitment to our fundamental purpose and principal businesses. The more complicated the situation is, the more valuable our commitment is.
Serving the real economy is our fundamental purpose
Finance and economy are symbiotic and promote each other. Only on the basis of a sound real economy can finance prosper. Taking serving the real economy as its inherent duty and obligation, the Bank has further optimized its principal businesses and refined its fundamental functions, and improved its operating quality while comprehensively enhancing the efficiency and standard of serving the real economy. We paid more attention to the consolidated management of existing and new credit to inject more “financial water” to quench the “thirst” of the real economy. In the first half of this year, the Bank’s domestic institutions granted RMB624.8 billion new loans, recovered and re-lent RMB1.04 trillion inventory loans, and provided RMB1.66 trillion new loans in total, meaning that the value of RMB1 was tripled in use. We attached more importance to serving major national strategies, and made active efforts to serve the “four regions”, “three supporting belts” and the construction of the Xiong’an New Area. The regular cooperation and exchange mechanism among banks under the Belt and Road Initiative initiated by the Bank was incorporated in the list of official achievements at the Belt and Road Forum for International Cooperation as the only commercial achievement. We placed more stress on serving the basic task of the supply-side structural reform, made special efforts for “de-stocking, de-leveraging and de-capacity”, and reduced the occupation of financial resources by “low-efficiency areas”. The value of the Bank’s market-based debt-for-equity swap framework agreements was around RMB200 billion, which played a positive role in helping enterprises to lower their leverage and get through difficulties. We made more efforts to support weaker areas in the real economy, set up the Inclusive Finance Department, and promoted financial services for small and micro enterprises, farmers, agriculture and the countryside, mass entrepreneurship and innovation, and targeted poverty alleviation in a holistic way. In particular, we stepped up the construction of the small and micro enterprise service center according to the guideline of “specialized operation, power delegation, efficiency improvement, and rigorous management”, and met the regulatory requirement of “Three No-Lower-Thans”.
Defending the bottom line of risk is the foundation for lasting and steady development
A tranquil ocean makes a good voyage. As a systemically important bank in the country and the world, the Bank takes risk management as the “lifeline” of our operation, focusing on the two balance sheets. We will prevent both the “black swan” and the “gray rhino”, maintain our strategic persistence and a clear mind, and hold to the bottom line of security and risk with the due attitude, professional capability and wisdom of a major commercial bank. On the balance sheet, our focus is keeping credit risks well under control. The Bank has worked hard on the “two projects” of asset quality management and credit basis management, closely watched and controlled the three “sluice gates” of loan increment, existing credit control, and disposal of NPLs, and fully exerted the fundamental effect of building the credit culture and reforming the systems
9
Chairman’s Statement
I n t e r i m R e p o r t 2 0 1 7
and mechanisms, thus realizing the general stability and gradual improvement of asset quality. Off the balance sheet, we well managed the new types of risks across border, across industries and across markets, drew a clear and complete risk diagram, and intensified prevention and disposal of risk by category. According to the principle of “simple, transparent and controllable”, we regulated the development of asset management, interbank and note businesses, raised the proportion of net-value wealth management products step by step, and kept the interbank liability-asset ratio and wealth management leveraging ratio within a reasonable range, so as to prevent useless capital circulation and its flow from the real economy to virtual economy. Following the strategy of prudent and sound operation, we made overall arrangements for the risk management and control of liquidity, exchange rate and interest rate. We rigorously controlled the four key points of cooperation, access, quota and account, in order to control the crossover risks of internet financing. We also applied big data technologies in risk management more extensively, and controlled risks such as illegal fund raising and financial fraud by managing the accounts and account holders. In the first half of 2017, the Bank, by means of the external fraud risk information system, intercepted more than 450,000 cases of risky business involving RMB2.3 billion, and protected the customers’ rights and interests.
Deepening transformation and innovation is the way of growth
Always oriented by customer demand, the Bank has promoted operational transformation, reform and innovation based on its advantages, created value through service, and become more competitive in this process. We have improved the modern corporate governance system, and the Shareholders’ General Meeting voted to include Party building work in our Articles of Association. We implemented the strategy of mega retail, mega asset management and mega investment bank in depth, boosted internationalized development and comprehensive upgrade, and fostered new development drives and brought traditional ones into vitality again. In the first half of this year, the contribution of the operating income from domestic mega retail kept increasing, mega asset management and mega investment bank business maintained sound increase in general despite the drastic market changes, and net profit of overseas and controlled institutions increased by 21.4% compared to the same period of last year, giving a positive boost to our development. We deepened a series of reforms including competitiveness improvement, reinforcement of profit units, adjustment of personnel structure, outlet layout, and optimization of business procedures, with a view to fostering new mechanisms conducive to stimulating the operating vitality and improving service efficiency. We launched the e-ICBC3.0 strategy to create a number of “phenomenal” scenarios and products that offer great experience, build a network of partnerships in internet financing, and widen and deepen our moat in the field of financial technologies, striving to reach a new realm of operation and development through new innovations and practices in internet financing.
During the reporting period, Mr. Kenneth Patrick Chung, Mr. Fu Zhongjun, Ms. Wang Xiaoya and Ms. Ge Rongrong were no longer members of the Board of Directors due to the expiration of the term of office or transfer of position. The Board of Directors appreciates their diligent work and contributions during their terms. Ms. Sheila Colleen Bair and Mr. Shen Si became Independent Non-executive Directors of the Bank. Their joining will play a positive role in improving the Board of Directors.
All difficulties can be surmounted. All destinations can be reached. In the second half of 2017, we will look at the operating environment and our own development with the big logic of new normal, adhere to the basic direction of making progress while maintaining stability, follow the operating laws of commercial banks, and make unremitting and effective efforts and solid progress while overcoming difficulties one after another. By making progress little by little, we will present a more satisfying performance sheet at the end of this year and draw a more definite blueprint for the future with our efforts today.
Chairman: Yi Huiman
30 August 2017
President’s Statement
10
Year to date, the Bank has continued to make greater strides while maintaining increasingly stable performance. Our key operating indicators outperformed the plan, the schedule and the expectations.
In the first half year, the Bank recorded net profit of RMB153.7 billion and before-provision profit of RMB257.8 billion, up 2.0% and 7.7% when compared to the same period of last year, respectively. The two growth figures exceeded both the same period of 2016 and the first quarter of 2017. The stability of profit growth was heightened because of the following three factors: First, NIM further stabilized. Our NIM for the six months ended 30 June 2017, at 2.16%, stayed unchanged from last year and increased by four BPs compared with the first quarter. Second, relevant lines and segments made larger contribution to profit. For example, domestic mega retail segment functioned like a “ballast” and “stabilizer”. Overseas and controlled institutions reported a growth of 21.4% in net profit compared to the same period of last year, which outpaced the average growth of both the Group and domestic institutions, and their net profit was 7.9% of the Group’s total net profit. Third, the Bank strengthened cost management. The cost-to-income ratio was kept at a desirable level of 22.68%.
Our good business results in the first half of 2017 were attributable to the hard efforts made by the Bank to improve financial services, accelerate transformation and innovation and strictly control risks in line with the development needs of the real economy. Thanks to these efforts, the Bank’s business operations have been bolstered in our ever-increasing number of aspects.
Specifically, first, we actively improved financing management, helping to further enhance the quality and efficiency of serving the real economy. To proactively adapt to the needs of supply-side structural reform and economic transformation and upgrade, the Bank was committed to perfecting the integrated management mechanism of credit increment and stock and maintained a good balance in the total volume, distribution, speed and method of financing. In the first half year, the Bank’s domestic institutions granted new loans of RMB1.66 trillion, including new additions of RMB624.8 billion and re-lending after collections of RMB1.04 trillion. New non-credit financing and new investment in local government debts were close to RMB450 billion, making a variety of fund sources available to the real economy. The Bank increased support to major strategic projects and key projects of the Chinese government by issuing cumulatively RMB670.7 billion worth of project loans, up RMB183.3 billion from the same period of last year. We lent USD15.3 billion to 71 “Going Global” projects in the first half year. The Bank set up the Inclusive Finance Department aimed at exploring how to improve the efficiency and effectiveness of developing small and micro enterprise finance and inclusive finance, and our loans to small and micro enterprises accomplished the regulatory requirements of “Three No-Lower-Thans”. Besides, our outstanding loans for targeted poverty reduction and elimination grew by 16% compared with the year beginning to RMB107.5 billion. The Bank actively supported the reasonable housing demand and consumption upgrade of residents, and our domestic personal loans grew by RMB375.0 billion with the balance accounting for 32.3% of total loans. The Bank entered into cooperative framework agreements on debt-for-equity swap with 16 enterprises, involving an amount of close to RMB200 billion.
Second, we continued to strengthen risk prevention and control, helping the asset quality to show improvement signs. The Bank placed risk prevention and control higher on our priority list, actively improved the new mechanism on credit risk prevention and control under the new normal, and took a multi-pronged approach including controlling new risks, preventing deterioration and rapidly disposing risks to make the asset quality more stable and better. So, there was an overall improvement in major indicators. NPL ratio, at 1.57%, dropped by 0.05 and 0.02 percentage point compared with the beginning and the first quarter of 2017, respectively. Allowance to NPL rebounded by 9.12 and 4.30 percentage points compared with the beginning and the first quarter of 2017 to 145.81%, indicating that the risk compensation capability was enhancing. Meanwhile, the Bank further improved the whole-chain, full-category and all-inclusive risk management system, and perfected the mechanism of comprehensive investigation, rapid response and proper resolution against the trend that all categories of risks occurred in different places frequently. In particular, with concentrated control of crossed and imported risks, the Bank strictly defended the access threshold. What’s more, the Bank demarcated proper boundaries of transformation-based development and innovation, and standardized the development of interbank, wealth management and asset management businesses. We combined a series of special governance activities scheduled by regulators with the Bank’s self-inspections on important areas and key links for advancing overall remediation, and solidly carried out the activity of “Year of Heightened Implementation” of internal control and compliance, thus playing a due role in eliminating risks and rooting out hazards. Both the number and volume of risk events declined year-on-year in the first half year.

11
President’s Statement
I n t e r i m R e p o r t 2 0 1 7
Third, we carried forward transformation and innovation in a down-to-earth way, helping to further strengthen the operation vitality and the growth engines. The Bank was dedicated to innovation and transformation so as to nourish new drivers under the guidance of new concepts and sharpen fresh edges. In the context of liquidity squeeze in the whole society, the Bank, deepening on our customer base and service strengths, managed to realize a RMB1.2 trillion growth in deposits. The “mega retail” strategy was advanced further in practice, registering a net increase of 16.86 million personal customers and an aggregate value of personal financial assets up to RMB12.67 trillion in the first half year. Wealth management business was valued at RMB2.7 trillion and assets under custody surpassed RMB14.5 trillion, both leading the market. Capturing the market opportunities arising from economic transformation and upgrade, the Bank picked up speed in well-regulated innovation in investment banking business, and reported outstanding M&A loans close to RMB200 billion. Internet-based finance remained on a fast growth track, with registered users of our mobile banking platform “ICBC Mobile” reaching 267 million, registered users of information service platform “ICBC Link” increasing by 40.6% to 93.49 million and the value of transactions over our e-commerce platform “ICBC Mall” swelling to RMB523.9 billion. Internet financing expanded to over RMB740 billion, making us still the largest internet financing bank in China. To build an intelligent banking service system, the Bank devised and implemented the e-ICBC3.0 strategic upgrade and leap-frog development, actively shifted traditional services to go online and become more intelligent, and promoted the transformation of innovative services to form an ecosphere which is based on platforms and scenarios.
We were well recognized by the market for our outstanding performance in a severe and complicated environment. For the fifth consecutive year, the Bank was ranked the 1st place among the Top 1000 World Banks by The Banker, ranked the 1st place in the Global 2000 listed by Forbes, and topped the sub-list of commercial banks of the Global 500 in Fortune.
As a Chinese saying goes, a thing is not done until it is done. At present, corrections of the world economy are under way, while Chinese economy is amid transformation, so banks still have to face lots of uncertainties, risks and challenges in future operation and development. In the latter half year, the Bank’s management will continue to convey and implement strategic arrangements of the Board of Directors pragmatically and efficiently, and brave ahead wisely while ensuring stability. We are devoted to creating even more excellent results and reward our shareholders and customers with higher returns.
President: Gu Shu
30 August 2017

Discussion and Analysis
12
ECONOMIC, FINANCIAL AND REGULATORY ENVIRONMENTS
The good growth momentum since the latter half of last year has carried into the first half year of 2017, witnessing overall improvement in developed economies and certain progress in economic development of emerging markets. Specifically, developed economies like the U.S., Europe and Japan revived synchronously, China and India led the growth of emerging economies. A differentiation has opened up in the overall steady operation of international financial market, with a fall in choppy trading of asset sectors like U.S. dollars, U.S. bonds and crude oil but a surge in non-USD currencies, global stocks and international gold price.
The Chinese economy continued to make progress in its stable operation. China’s gross domestic product (GDP), consumer price index (CPI), retail sales of consumer goods, fixed asset investment, industrial added value of above-scale enterprises, and total imports and exports rose by 6.9%, 1.4%, 10.4%, 8.6%, 6.9% and 19.6% respectively.
The PBC implemented a prudent, neutral monetary policy. It adopted a mix of monetary policy instruments to keep liquidity in basic stability, strengthened the window guidance and the structural guiding role of credit policy to support economic restructuring, transformation and upgrade, further advanced the interest rate liberalization and the RMB exchange rate formation mechanism reform to ensure that the exchange rates of RMB were basically stable at a reasonable, balanced level. Financial regulation and supervision became stricter. In the first half of 2017, the CBRC released a series of regulatory documents, requiring the launch of special crackdowns on “Three Breaches”, “Three Arbitrages” and “Four Misconducts” and placing focus on supervising interbank business, wealth management business and investment business of banks.
Money supply expanded on a steady footing in the first half of 2017. As at the end of June, the broad money supply (M2) balance was RMB163.1 trillion, representing an increase of 9.4% from the same period of last year. The outstanding RMB loans reached RMB114.6 trillion, representing an increase of 12.9%. The balance of RMB deposits registered RMB159.7 trillion, up 9.2%. The increase in social financing scale was RMB11.2 trillion in the first half of 2017, RMB1.4 trillion more than a year earlier. The stock markets operated steadily in general, with a rise of 2.9% and 3.5% in the Shanghai Composite Index and the Shenzhen Component Index respectively. The capitalization of the free float stocks on the Shanghai and Shenzhen stock markets increased by 5.7% from the end of the previous year. The accumulative issuance amount of bonds contracted by 2% compared with the same period of last year to RMB17.6 trillion in the first half of 2017. The central parity of RMB against the U.S. dollar was RMB6.7744, representing an appreciation of 2.40% from the end of the previous year. The overall issuing interest rate of various bonds increased, and the treasury bond yield curve shifted upwards on a whole, while the term spread narrowed markedly.
Asset scale of the banking industry grew steadily, with the quality of credit assets remaining stable overall. As at the end of June, the total assets of banking financial institutions (corporate) in China were RMB243.17 trillion, representing an increase of 11.54% compared with the same period of last year. The balance of NPLs of commercial banks reached RMB1.64 trillion; NPL ratio was 1.74%; allowance to NPL was 177.18%. Core tier 1 capital adequacy ratio (CAR), tier 1 CAR and CAR were 10.64%, 11.12% and 13.16% respectively.
Looking into the second half of the year, although the speed and width of global economic recovery have hit the highest level for the past few years, a slew of old and new factors, e.g. sluggish global trade and increasing protectionism, the trend of interest rate hikes and balance sheet reduction by the U.S., tension in geopolitical state and frequent occurrence of terrorist attacks, still exist to threaten the sustainability of global recovery and may even trigger drastic fluctuations of international financial market. China will continue to adopt a prudent, neutral monetary policy with the aim of maintaining the stability of market liquidity. The fiscal policy will be made more proactive and effective with the focus further shifting possibly to enhancement of fiscal policy efficiency, that is, strengthening fee and tax cut efforts and putting idle fiscal funds to good use. Real estate control policy is gradually causing transmission effect on investment in this sector, the external environment for foreign trade growth is expected to improve, and consumption will function more effectively as a “stabilizer”. It is expected that this year’s economic growth target will be realized.

13
Discussion and Analysis
I n t e r i m R e p o r t 2 0 1 7
FINANCIAL STATEMENTS ANALYSIS
Income Statement Analysis
In the first half of 2017, in response to the on-going severe and complicated operating environment, the Bank insisted on serving the real economy as its starting point, innovated the products and services based on demands of the real economy and customers, and sped up the operational transformation to enhance operating vitality and market competitiveness. As a result, the interest spread was gradually stabilized, and the asset and liability scale was steadily expanded with the profitability further improved. The Bank realized a net profit of RMB153,687 million in the first half of 2017, representing an increase of 2.0% as compared to the same period of last year. Annualized return on average total assets stood at 1.24%, and annualized return on weighted average equity was 15.69%. Operating income amounted to RMB336,739 million, representing an increase of 2.4%, of which net interest income grew by 7.1% to RMB250,922 million. Non-interest income reached RMB85,817 million, representing a decrease of 9.4% (of which, net fee and commission income decreased by 6.2%). Operating expenses amounted to RMB80,270 million, representing a decrease of 11.4%, and the cost-to-income ratio dropped to 22.68%. Allowance for impairment losses was RMB61,343 million, representing an increase of 38.1%. Income tax expense dropped by 3.6% to RMB42,811 million.
CHANGES OF KEY INCOME STATEMENT ITEMSIn RMB millions, except for percentages
Item
Six monthsended 30
June 2017
Six months ended 30June 2016
Increase/(decrease)
Growth rate (%)
Net interest income* 250,922 234,280 16,642 7.1
Non-interest income* 85,817 94,701 (8,884) (9.4)
Operating income* 336,739 328,981 7,758 2.4
Less: Operating expenses 80,270 90,594 (10,324) (11.4)
Less: Impairment losses 61,343 44,433 16,910 38.1
Operating profit 195,126 193,954 1,172 0.6
Share of profits of associates and joint ventures
1,372 1,121 251 22.4
Profit before taxation 196,498 195,075 1,423 0.7
Less: Income tax expense 42,811 44,419 (1,608) (3.6)
Net profit 153,687 150,656 3,031 2.0
Attributable to: Equity holders of the parent company
152,995 150,217 2,778 1.8
Non-controlling interests 692 439 253 57.6
Note: * After reversal of the impact of “replacing business tax with VAT”, operating income increased by 6.2% compared with the same period of the previous year, net interest income grew by 11.5% and non-interest income dropped by 6.6% (of which, net fee and commission income decreased by 3.0%).
Net Interest Income
In the first half of 2017, net interest income amounted to RMB250,922 million, representing an increase of RMB16,642 million or 7.1% compared to the same period of last year. Interest income grew by RMB23,125 million to RMB418,353 million, an increase of 5.9%; interest expense grew by RMB6,483 million or 4.0% to RMB167,431 million. Net interest spread and net interest margin came at 2.03% and 2.16%, 4 basis points and 5 basis points lower than those of the same period of last year, respectively. Net interest spread raised by 1 basis point over last year, while net interest margin kept the same level with last year. After reversal of the impact of “replacement of business tax with VAT”, the above two indicators would increase by 4 basis points and 3 basis points.

Discussion and Analysis
14
AVERAGE YIELD OF INTEREST-GENERATING ASSETS AND AVERAGE COST OF INTEREST-BEARING LIABILITIESIn RMB millions, except for percentages
Item
Six months ended 30 June 2017 Six months ended 30 June 2016
Average balance
Interest income/expense
Average yield/
cost (%)Average balance
Interestincome/expense
Average yield/
cost (%)
Assets
Loans and advances to customers 13,585,552 278,043 4.13 12,286,073 270,749 4.43
Investment 5,113,807 90,927 3.59 4,781,923 87,675 3.69
Due from central banks(2) 3,049,809 23,018 1.52 2,831,848 21,730 1.54
Due from banks and other financial institutions(3)
1,648,082 26,365 3.23 1,382,905 15,074 2.19
Total interest-generating assets 23,397,250 418,353 3.61 21,282,749 395,228 3.73
Non-interest-generating assets 1,873,288 1,713,176
Allowance for impairment losses (309,523) (286,114)
Total assets 24,961,015 22,709,811
Liabilities
Deposits 17,952,242 127,754 1.43 16,373,524 129,967 1.60
Due to banks and other financial institutions(3)
2,743,299 30,198 2.22 2,696,569 22,598 1.69
Debt securities issued 622,388 9,479 3.07 486,426 8,383 3.47
Total interest-bearing liabilities 21,317,929 167,431 1.58 19,556,519 160,948 1.66
Non-interest-bearing liabilities 1,487,647 1,348,427
Total liabilities 22,805,576 20,904,946
Net interest income 250,922 234,280
Net interest spread 2.03 2.07
Net interest margin 2.16 2.21
Notes: (1) The average balances of interest-generating assets and interest-bearing liabilities represent their daily average balances. The average balances of non-interest-generating assets, non-interest-bearing liabilities and the allowance for impairment losses represent the average of the balances at the beginning of the period and at the end of the period.
(2) Due from central banks mainly includes mandatory reserves and surplus reserves with central banks.
(3) Due from banks and other financial institutions includes the amount of reverse repurchase agreements, and due to banks and other financial institutions includes the amount of repurchase agreements.
15
Discussion and Analysis
I n t e r i m R e p o r t 2 0 1 7
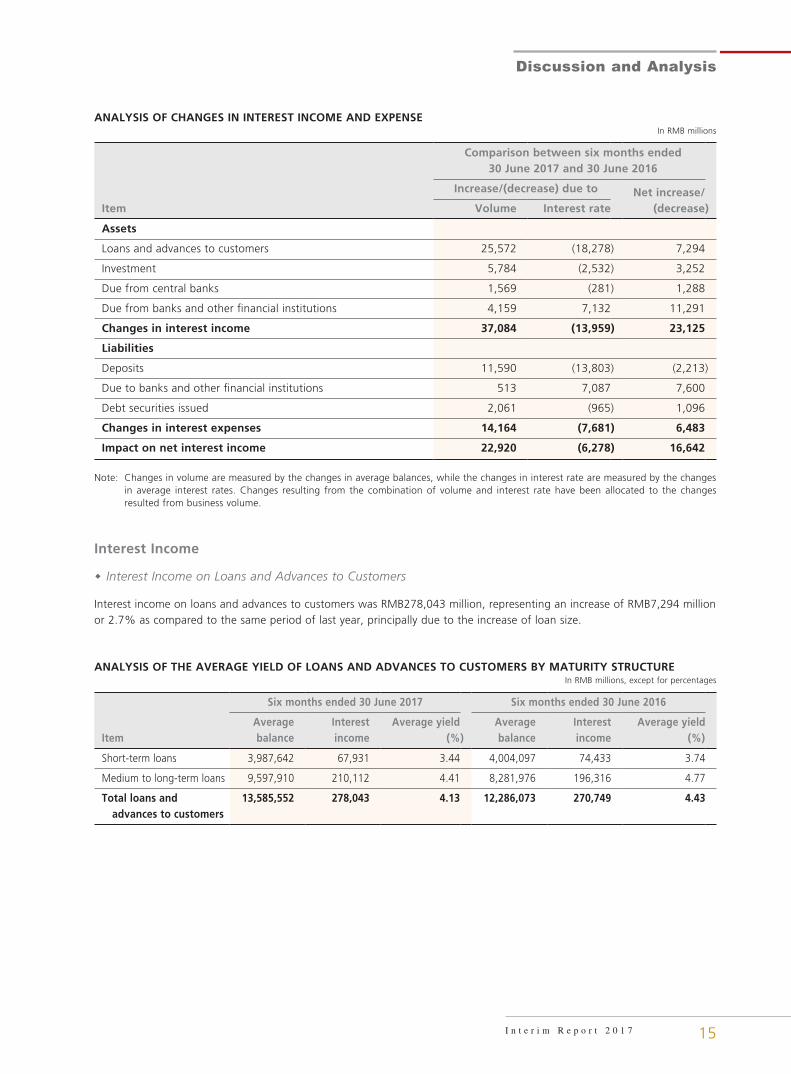
ANALYSIS OF CHANGES IN INTEREST INCOME AND EXPENSEIn RMB millions
Item
Comparison between six months ended30 June 2017 and 30 June 2016
Increase/(decrease) due to Net increase/(decrease)Volume Interest rate
Assets
Loans and advances to customers 25,572 (18,278) 7,294
Investment 5,784 (2,532) 3,252
Due from central banks 1,569 (281) 1,288
Due from banks and other financial institutions 4,159 7,132 11,291
Changes in interest income 37,084 (13,959) 23,125
Liabilities
Deposits 11,590 (13,803) (2,213)
Due to banks and other financial institutions 513 7,087 7,600
Debt securities issued 2,061 (965) 1,096
Changes in interest expenses 14,164 (7,681) 6,483
Impact on net interest income 22,920 (6,278) 16,642
Note: Changes in volume are measured by the changes in average balances, while the changes in interest rate are measured by the changes in average interest rates. Changes resulting from the combination of volume and interest rate have been allocated to the changes resulted from business volume.
Interest Income
� Interest Income on Loans and Advances to Customers
Interest income on loans and advances to customers was RMB278,043 million, representing an increase of RMB7,294 million or 2.7% as compared to the same period of last year, principally due to the increase of loan size.
ANALYSIS OF THE AVERAGE YIELD OF LOANS AND ADVANCES TO CUSTOMERS BY MATURITY STRUCTUREIn RMB millions, except for percentages
Item
Six months ended 30 June 2017 Six months ended 30 June 2016
Average balance
Interest income
Average yield(%)
Average balance
Interest income
Average yield(%)
Short-term loans 3,987,642 67,931 3.44 4,004,097 74,433 3.74
Medium to long-term loans 9,597,910 210,112 4.41 8,281,976 196,316 4.77
Total loans and advances to customers
13,585,552 278,043 4.13 12,286,073 270,749 4.43
Discussion and Analysis
16
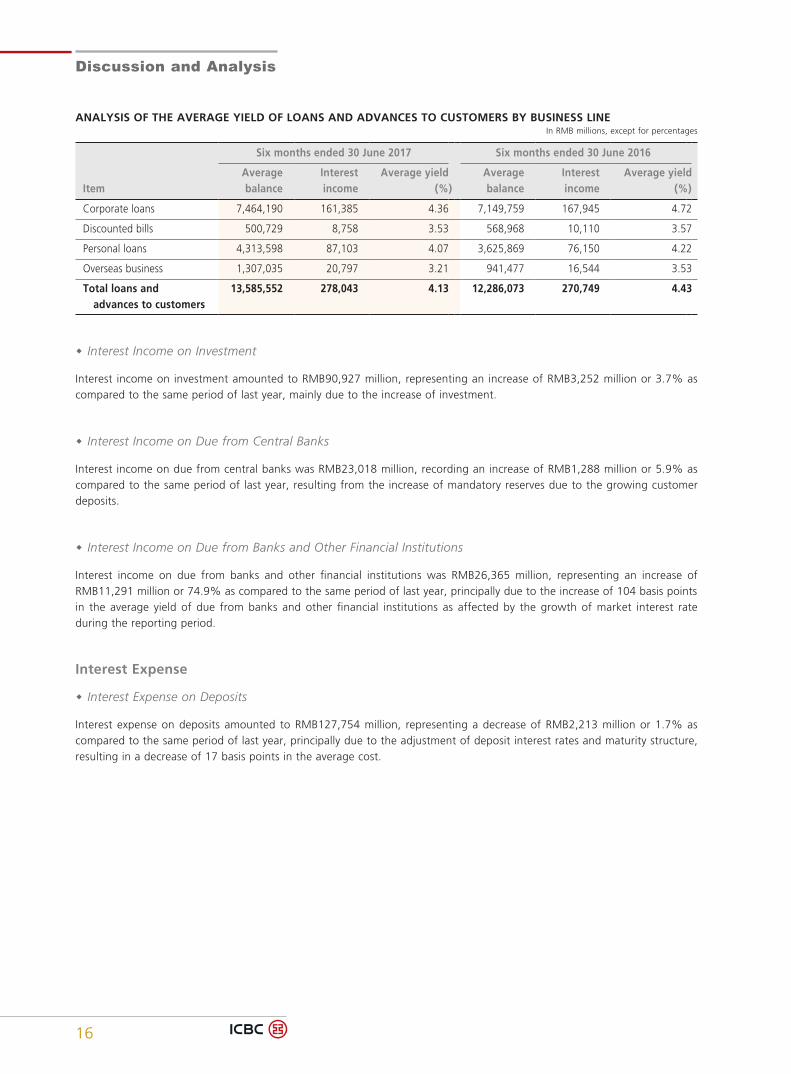
ANALYSIS OF THE AVERAGE YIELD OF LOANS AND ADVANCES TO CUSTOMERS BY BUSINESS LINEIn RMB millions, except for percentages
Item
Six months ended 30 June 2017 Six months ended 30 June 2016
Average balance
Interest income
Average yield(%)
Average balance
Interest income
Average yield(%)
Corporate loans 7,464,190 161,385 4.36 7,149,759 167,945 4.72
Discounted bills 500,729 8,758 3.53 568,968 10,110 3.57
Personal loans 4,313,598 87,103 4.07 3,625,869 76,150 4.22
Overseas business 1,307,035 20,797 3.21 941,477 16,544 3.53
Total loans and advances to customers
13,585,552 278,043 4.13 12,286,073 270,749 4.43
� Interest Income on Investment
Interest income on investment amounted to RMB90,927 million, representing an increase of RMB3,252 million or 3.7% as compared to the same period of last year, mainly due to the increase of investment.
� Interest Income on Due from Central Banks
Interest income on due from central banks was RMB23,018 million, recording an increase of RMB1,288 million or 5.9% as compared to the same period of last year, resulting from the increase of mandatory reserves due to the growing customer deposits.
� Interest Income on Due from Banks and Other Financial Institutions
Interest income on due from banks and other financial institutions was RMB26,365 million, representing an increase of RMB11,291 million or 74.9% as compared to the same period of last year, principally due to the increase of 104 basis points in the average yield of due from banks and other financial institutions as affected by the growth of market interest rate during the reporting period.
Interest Expense
� Interest Expense on Deposits
Interest expense on deposits amounted to RMB127,754 million, representing a decrease of RMB2,213 million or 1.7% as compared to the same period of last year, principally due to the adjustment of deposit interest rates and maturity structure, resulting in a decrease of 17 basis points in the average cost.
17
Discussion and Analysis
I n t e r i m R e p o r t 2 0 1 7
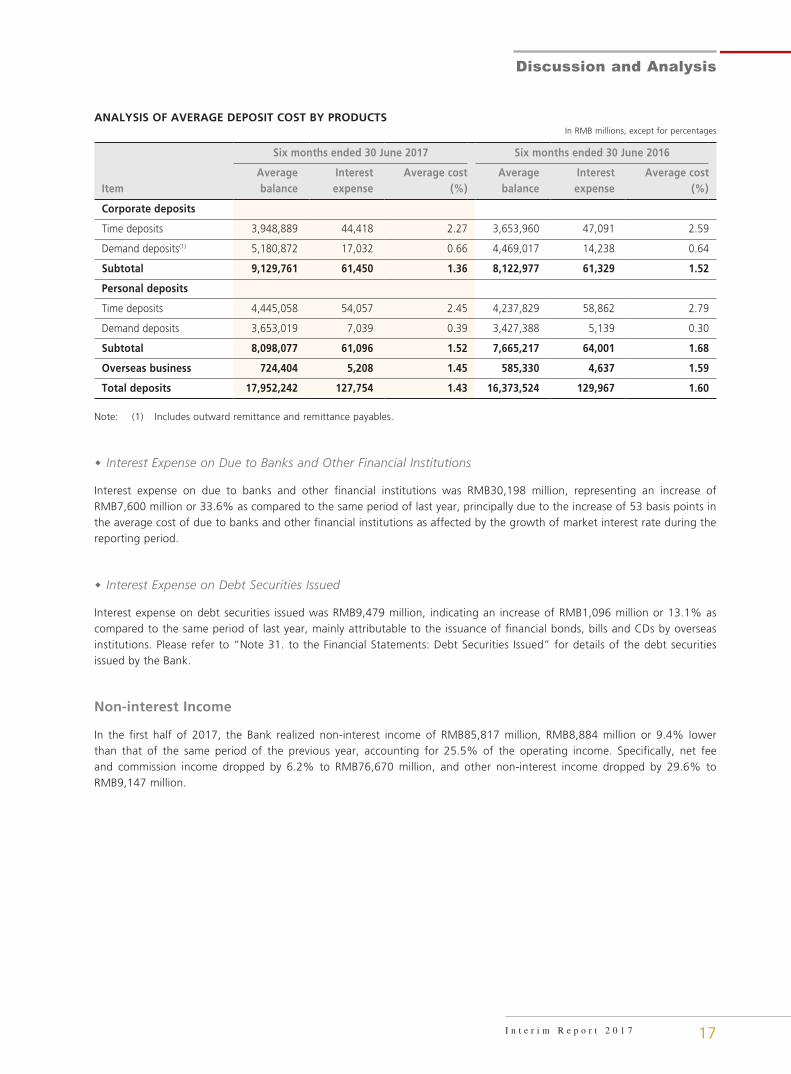
ANALYSIS OF AVERAGE DEPOSIT COST BY PRODUCTSIn RMB millions, except for percentages
Item
Six months ended 30 June 2017 Six months ended 30 June 2016
Averagebalance
Interestexpense
Average cost(%)
Averagebalance
Interestexpense
Average cost(%)
Corporate deposits
Time deposits 3,948,889 44,418 2.27 3,653,960 47,091 2.59
Demand deposits(1) 5,180,872 17,032 0.66 4,469,017 14,238 0.64
Subtotal 9,129,761 61,450 1.36 8,122,977 61,329 1.52
Personal deposits
Time deposits 4,445,058 54,057 2.45 4,237,829 58,862 2.79
Demand deposits 3,653,019 7,039 0.39 3,427,388 5,139 0.30
Subtotal 8,098,077 61,096 1.52 7,665,217 64,001 1.68
Overseas business 724,404 5,208 1.45 585,330 4,637 1.59
Total deposits 17,952,242 127,754 1.43 16,373,524 129,967 1.60
Note: (1) Includes outward remittance and remittance payables.
� Interest Expense on Due to Banks and Other Financial Institutions
Interest expense on due to banks and other financial institutions was RMB30,198 million, representing an increase of RMB7,600 million or 33.6% as compared to the same period of last year, principally due to the increase of 53 basis points in the average cost of due to banks and other financial institutions as affected by the growth of market interest rate during the reporting period.
� Interest Expense on Debt Securities Issued
Interest expense on debt securities issued was RMB9,479 million, indicating an increase of RMB1,096 million or 13.1% as compared to the same period of last year, mainly attributable to the issuance of financial bonds, bills and CDs by overseas institutions. Please refer to “Note 31. to the Financial Statements: Debt Securities Issued” for details of the debt securities issued by the Bank.
Non-interest Income
In the first half of 2017, the Bank realized non-interest income of RMB85,817 million, RMB8,884 million or 9.4% lower than that of the same period of the previous year, accounting for 25.5% of the operating income. Specifically, net fee and commission income dropped by 6.2% to RMB76,670 million, and other non-interest income dropped by 29.6% to RMB9,147 million.
Discussion and Analysis
18
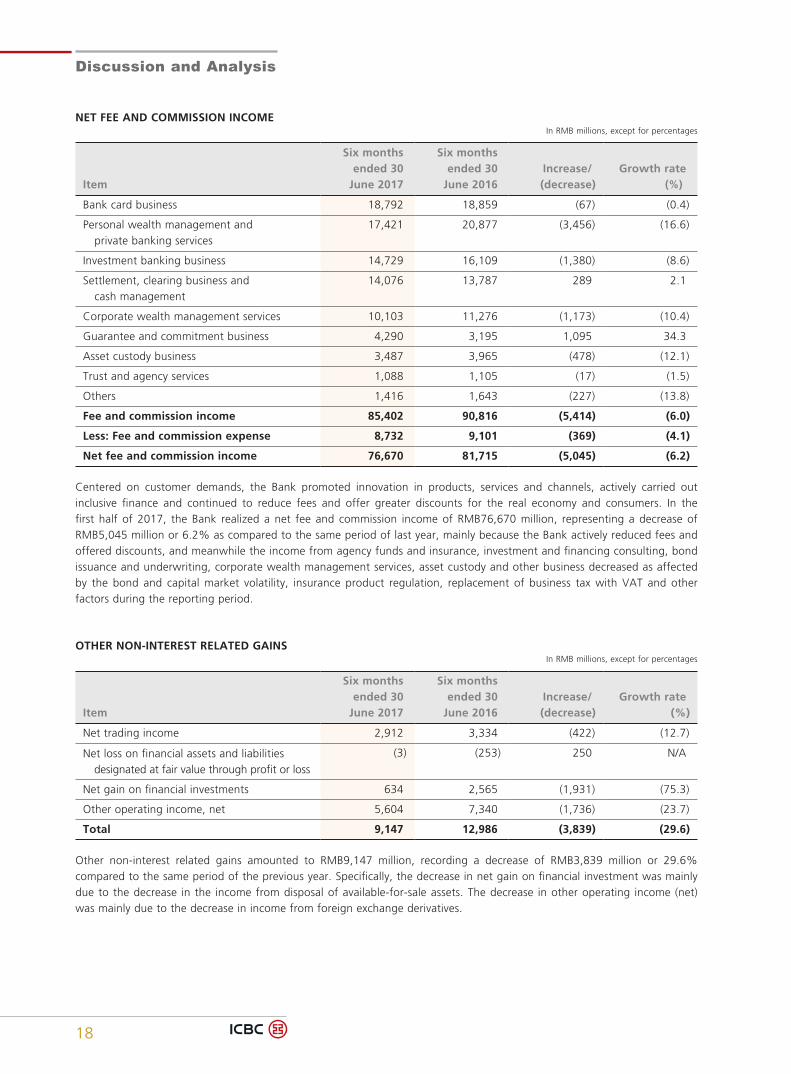
NET FEE AND COMMISSION INCOMEIn RMB millions, except for percentages
Item
Six months ended 30June 2017
Six months ended 30June 2016
Increase/(decrease)
Growth rate (%)
Bank card business 18,792 18,859 (67) (0.4)
Personal wealth management and private banking services
17,421 20,877 (3,456) (16.6)
Investment banking business 14,729 16,109 (1,380) (8.6)
Settlement, clearing business and cash management
14,076 13,787 289 2.1
Corporate wealth management services 10,103 11,276 (1,173) (10.4)
Guarantee and commitment business 4,290 3,195 1,095 34.3
Asset custody business 3,487 3,965 (478) (12.1)
Trust and agency services 1,088 1,105 (17) (1.5)
Others 1,416 1,643 (227) (13.8)
Fee and commission income 85,402 90,816 (5,414) (6.0)
Less: Fee and commission expense 8,732 9,101 (369) (4.1)
Net fee and commission income 76,670 81,715 (5,045) (6.2)
Centered on customer demands, the Bank promoted innovation in products, services and channels, actively carried out inclusive finance and continued to reduce fees and offer greater discounts for the real economy and consumers. In the first half of 2017, the Bank realized a net fee and commission income of RMB76,670 million, representing a decrease of RMB5,045 million or 6.2% as compared to the same period of last year, mainly because the Bank actively reduced fees and offered discounts, and meanwhile the income from agency funds and insurance, investment and financing consulting, bond issuance and underwriting, corporate wealth management services, asset custody and other business decreased as affected by the bond and capital market volatility, insurance product regulation, replacement of business tax with VAT and other factors during the reporting period.
OTHER NON-INTEREST RELATED GAINSIn RMB millions, except for percentages
Item
Six months ended 30June 2017
Six months ended 30June 2016
Increase/(decrease)
Growth rate (%)
Net trading income 2,912 3,334 (422) (12.7)
Net loss on financial assets and liabilities designated at fair value through profit or loss
(3) (253) 250 N/A
Net gain on financial investments 634 2,565 (1,931) (75.3)
Other operating income, net 5,604 7,340 (1,736) (23.7)
Total 9,147 12,986 (3,839) (29.6)
Other non-interest related gains amounted to RMB9,147 million, recording a decrease of RMB3,839 million or 29.6% compared to the same period of the previous year. Specifically, the decrease in net gain on financial investment was mainly due to the decrease in the income from disposal of available-for-sale assets. The decrease in other operating income (net) was mainly due to the decrease in income from foreign exchange derivatives.
19
Discussion and Analysis
I n t e r i m R e p o r t 2 0 1 7
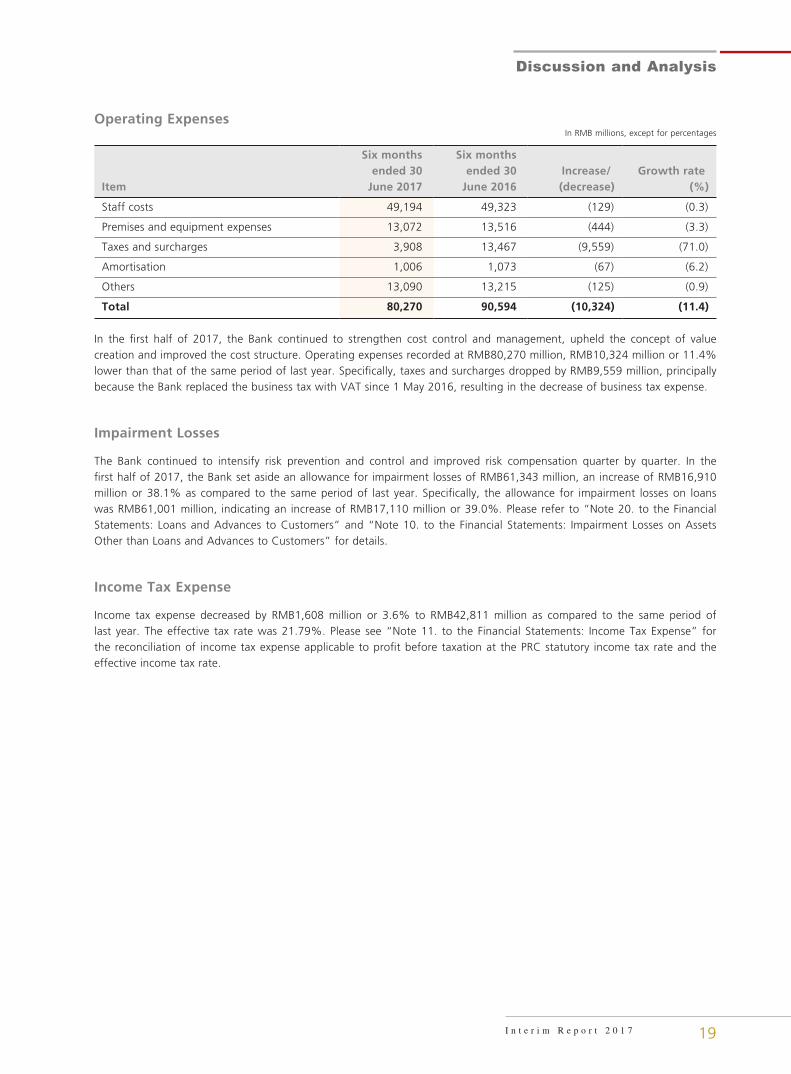
Operating ExpensesIn RMB millions, except for percentages
Item
Six months ended 30June 2017
Six months ended 30June 2016
Increase/(decrease)
Growth rate(%)
Staff costs 49,194 49,323 (129) (0.3)
Premises and equipment expenses 13,072 13,516 (444) (3.3)
Taxes and surcharges 3,908 13,467 (9,559) (71.0)
Amortisation 1,006 1,073 (67) (6.2)
Others 13,090 13,215 (125) (0.9)
Total 80,270 90,594 (10,324) (11.4)
In the first half of 2017, the Bank continued to strengthen cost control and management, upheld the concept of value creation and improved the cost structure. Operating expenses recorded at RMB80,270 million, RMB10,324 million or 11.4% lower than that of the same period of last year. Specifically, taxes and surcharges dropped by RMB9,559 million, principally because the Bank replaced the business tax with VAT since 1 May 2016, resulting in the decrease of business tax expense.
Impairment Losses
The Bank continued to intensify risk prevention and control and improved risk compensation quarter by quarter. In the first half of 2017, the Bank set aside an allowance for impairment losses of RMB61,343 million, an increase of RMB16,910 million or 38.1% as compared to the same period of last year. Specifically, the allowance for impairment losses on loans was RMB61,001 million, indicating an increase of RMB17,110 million or 39.0%. Please refer to “Note 20. to the Financial Statements: Loans and Advances to Customers” and “Note 10. to the Financial Statements: Impairment Losses on Assets Other than Loans and Advances to Customers” for details.
Income Tax Expense
Income tax expense decreased by RMB1,608 million or 3.6% to RMB42,811 million as compared to the same period of last year. The effective tax rate was 21.79%. Please see “Note 11. to the Financial Statements: Income Tax Expense” for the reconciliation of income tax expense applicable to profit before taxation at the PRC statutory income tax rate and the effective income tax rate.
Discussion and Analysis
20
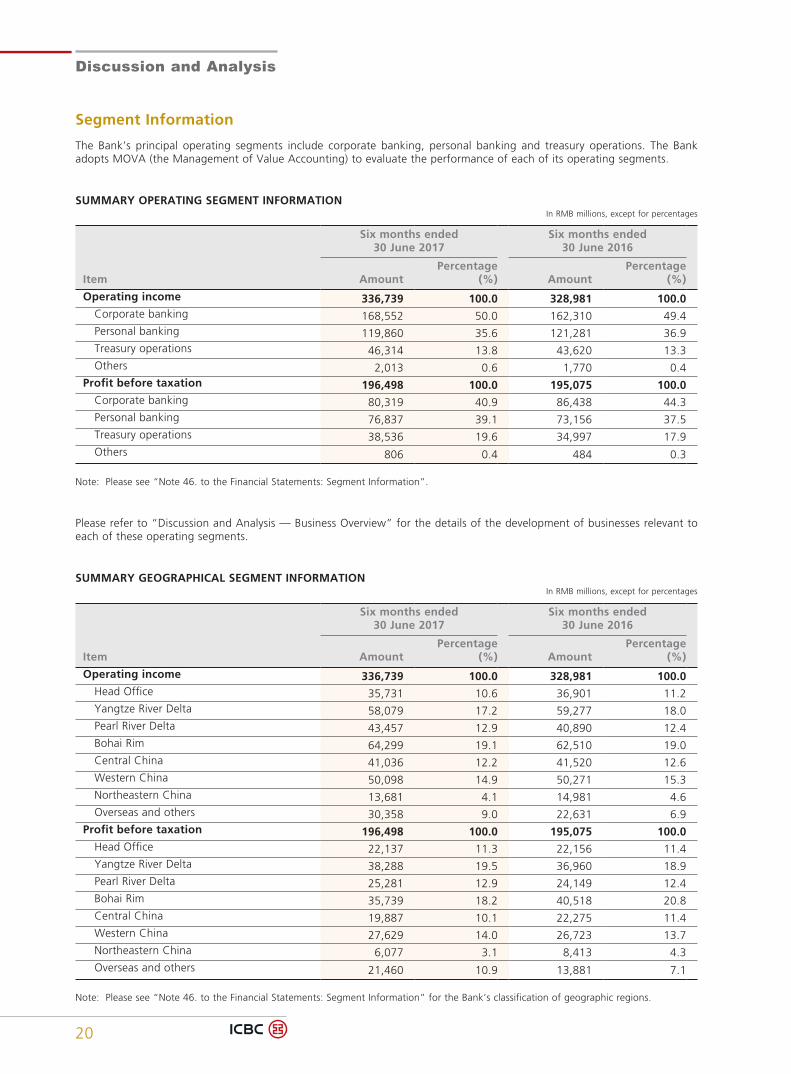
Segment Information
The Bank’s principal operating segments include corporate banking, personal banking and treasury operations. The Bank adopts MOVA (the Management of Value Accounting) to evaluate the performance of each of its operating segments.
SUMMARY OPERATING SEGMENT INFORMATIONIn RMB millions, except for percentages
Item
Six months ended30 June 2017
Six months ended30 June 2016
AmountPercentage
(%) AmountPercentage
(%)
Operating income 336,739 100.0 328,981 100.0 Corporate banking 168,552 50.0 162,310 49.4 Personal banking 119,860 35.6 121,281 36.9 Treasury operations 46,314 13.8 43,620 13.3 Others 2,013 0.6 1,770 0.4Profit before taxation 196,498 100.0 195,075 100.0 Corporate banking 80,319 40.9 86,438 44.3 Personal banking 76,837 39.1 73,156 37.5 Treasury operations 38,536 19.6 34,997 17.9 Others 806 0.4 484 0.3
Note: Please see “Note 46. to the Financial Statements: Segment Information”.
Please refer to “Discussion and Analysis — Business Overview” for the details of the development of businesses relevant to each of these operating segments.
SUMMARY GEOGRAPHICAL SEGMENT INFORMATIONIn RMB millions, except for percentages
Item
Six months ended30 June 2017
Six months ended30 June 2016
AmountPercentage
(%) AmountPercentage
(%)
Operating income 336,739 100.0 328,981 100.0 Head Office 35,731 10.6 36,901 11.2 Yangtze River Delta 58,079 17.2 59,277 18.0 Pearl River Delta 43,457 12.9 40,890 12.4 Bohai Rim 64,299 19.1 62,510 19.0 Central China 41,036 12.2 41,520 12.6 Western China 50,098 14.9 50,271 15.3 Northeastern China 13,681 4.1 14,981 4.6 Overseas and others 30,358 9.0 22,631 6.9Profit before taxation 196,498 100.0 195,075 100.0 Head Office 22,137 11.3 22,156 11.4 Yangtze River Delta 38,288 19.5 36,960 18.9 Pearl River Delta 25,281 12.9 24,149 12.4 Bohai Rim 35,739 18.2 40,518 20.8 Central China 19,887 10.1 22,275 11.4 Western China 27,629 14.0 26,723 13.7 Northeastern China 6,077 3.1 8,413 4.3 Overseas and others 21,460 10.9 13,881 7.1
Note: Please see “Note 46. to the Financial Statements: Segment Information” for the Bank’s classification of geographic regions.

21
Discussion and Analysis
I n t e r i m R e p o r t 2 0 1 7
Balance Sheet Analysis
In the first half of 2017, the Bank timely adjusted its business strategy based on the changes in the external macroeconomic environment, improved the asset and liability structure, maintained coordinated development of deposit and loan business, and strived to enhance the efficiency of resource allocation for assets and liabilities. In the meanwhile, by taking the demands of the real economy into account, the Bank made reasonable arrangement of the total amount, usage and frequency of credit extensions. Based on the international and domestic financial market trends, it modestly increased the scale of investment and optimized the portfolio structure. The Bank also actively took measures to promote the steady growth of customer deposits and upgrade the maturity structure of liabilities so as to ensure the stability and continuous growth of funding sources.
Assets Deployment
As at the end of June 2017, total assets of the Bank amounted to RMB25,514,046 million, RMB1,376,781 million or 5.7% higher than the prior year-end. Specifically, total loans and advances to customers (collectively referred to as “total loans”) increased by RMB809,063 million or 6.2%, investment increased by RMB88,819 million or 1.6%, and cash and balances with central banks increased by RMB191,985 million or 5.7%.
ASSETS DEPLOYMENTIn RMB millions, except for percentages
At 30 June 2017 At 31 December 2016
Item AmountPercentage
(%) AmountPercentage
(%)
Total loans and advances to customers 13,865,909 — 13,056,846 —
Less: Allowance for impairment losses on loans
316,513 — 289,512 —
Loans and advances to customers, net 13,549,396 53.1 12,767,334 52.9
Investment 5,569,993 21.8 5,481,174 22.7
Cash and balances with central banks 3,542,773 13.9 3,350,788 13.9
Due from banks and other financial institutions
957,239 3.8 797,473 3.3
Reverse repurchase agreements 840,658 3.3 755,627 3.1
Others 1,053,987 4.1 984,869 4.1
Total assets 25,514,046 100.0 24,137,265 100.0
Loan
In the first half of 2017, the Bank continued to support the supply-side structural reform by conforming to the requirements of national and regulating policies, thus achieving new results in serving the real economy. It also intensified the efforts to support the implementation of major national strategies and the development of key areas, and actively supported the reasonable housing demand and consumption upgrade of residents, strived to support the weaker areas in the real economy, and steadily promoted the development of small and micro financial centers and the optimization of product systems. As at the end of June 2017, total loans amounted to RMB13,865,909 million, representing an increase of RMB809,063 million or 6.2% from the end of the previous year, of which, RMB-denominated loans of domestic branches increased by RMB612,054 million or 5.3% to RMB12,054,995 million.

Discussion and Analysis
22
DISTRIBUTION OF LOANS BY BUSINESS LINEIn RMB millions, except for percentages
At 30 June 2017 At 31 December 2016
Item AmountPercentage
(%) AmountPercentage
(%)
Corporate loans 8,927,631 64.4 8,140,684 62.4
Discounted bills 363,087 2.6 719,993 5.5
Personal loans 4,575,191 33.0 4,196,169 32.1
Total 13,865,909 100.0 13,056,846 100.0
DISTRIBUTION OF CORPORATE LOANS BY MATURITYIn RMB millions, except for percentages
At 30 June 2017 At 31 December 2016
Item AmountPercentage
(%) AmountPercentage
(%)
Short-term corporate loans 3,029,966 33.9 2,729,873 33.5
Medium to long-term corporate loans 5,897,665 66.1 5,410,811 66.5
Total 8,927,631 100.0 8,140,684 100.0
Corporate loans rose by RMB786,947 million or 9.7% from the end of last year. Specifically, short-term corporate loans increased by RMB300,093 million or 11.0%, mainly because of the increase in short-term financing demands of production operators as affected by the domestic economic recovery; medium to long-term corporate loans increased by RMB486,854 million or 9.0% mainly because the Bank, based on the major strategic planning of the state, actively supported the development of key national areas and projects, served the real economy and supported the industrial upgrading and reconstruction.
Discounted bills dropped by RMB356,906 million compared with the end of last year, principally because the Bank moderately decreased its asset allocation to discounted bills to satisfy management needs of asset-liability portfolios and keep balanced credit extension.
DISTRIBUTION OF PERSONAL LOANS BY PRODUCT LINEIn RMB millions, except for percentages
At 30 June 2017 At 31 December 2016
Item AmountPercentage
(%) AmountPercentage
(%)
Residential mortgages 3,615,528 79.0 3,240,838 77.2
Personal consumption loans 260,048 5.7 247,020 5.9
Personal business loans 229,881 5.0 256,272 6.1
Credit card overdrafts 469,734 10.3 452,039 10.8
Total 4,575,191 100.0 4,196,169 100.0
Personal loans augmented by RMB379,022 million or 9.0% from the end of last year. Specifically, residential mortgages grew by RMB374,690 million or 11.6%, mainly because the Bank worked to meet the owner-occupiers’ financing requirement for house purchase in line with the state’s policy on real estate adjustment and control based on the situation of different cities and classifications. Personal consumption loans increased by RMB13,028 million or 5.3%, principally because the Bank grasped the opportunities of personal consumption structure upgrading and demand expansion, comprehensively stepped up the innovation efforts in personal internet financing products by means of active Internet thinking and promoted the rapid development of ICBC e-Loan business. Credit card overdrafts grew by RMB17,695 million or 3.9%, primarily attributable to a stable growth in credit card installment business.
Please see “Discussion and Analysis — Risk Management” for detailed analysis of the Bank’s loans and their quality.

23
Discussion and Analysis
I n t e r i m R e p o r t 2 0 1 7
Investment
In the first half of 2017, the Bank duly adjusted its investment and trading strategies, and optimized the investment portfolio structure in adherence to the trends in financial markets. As at the end of June 2017, investment amounted to RMB5,569,993 million, representing an increase of RMB88,819 million or 1.6% from the end of the previous year.
INVESTMENTIn RMB millions, except for percentages
At 30 June 2017 At 31 December 2016
Item AmountPercentage
(%) AmountPercentage
(%)
Debt instruments 5,158,552 92.6 5,196,535 94.8
Bonds 5,131,174 92.1 5,162,025 94.2
Other debt instruments 27,378 0.5 34,510 0.6
Equity instruments and others 411,441 7.4 284,639 5.2
Total 5,569,993 100.0 5,481,174 100.0
Debt instruments amounted to RMB5,158,552 million, RMB37,983 million or 0.7% lower than that at the end of last year, of which bonds decreased by RMB30,851 million or 0.6%. Equity instruments and others stood at RMB411,441 million, increased by RMB126,802 million or 44.5% compared to the end of last year, mainly due to the increase of principal-guaranteed wealth management products issued by the Bank.
DISTRIBUTION OF BONDS BY ISSUERSIn RMB millions, except for percentages
At 30 June 2017 At 31 December 2016
Item AmountPercentage
(%) AmountPercentage
(%)
Government bonds 2,776,759 54.1 2,484,463 48.1
Central bank bills 9,625 0.2 58,024 1.1
Policy bank bonds 1,161,100 22.6 1,319,450 25.6
Other bonds 1,183,690 23.1 1,300,088 25.2
Total 5,131,174 100.0 5,162,025 100.0
In terms of distribution by issuers, government bonds increased by RMB292,296 million or 11.8%; central bank bills decreased by RMB48,399 million or 83.4%; and policy bank bonds went down RMB158,350 million or 12.0%; other bonds dropped by RMB116,398 million or 9.0%. In the reporting period, the Bank continued to increase its investment in local government bonds and treasury bonds, while the balance of central bank bills, policy bank bonds and other bonds all went down in varying degrees under the influence of normal maturity of bonds and changes in the supply structure of bond market.
Discussion and Analysis
24
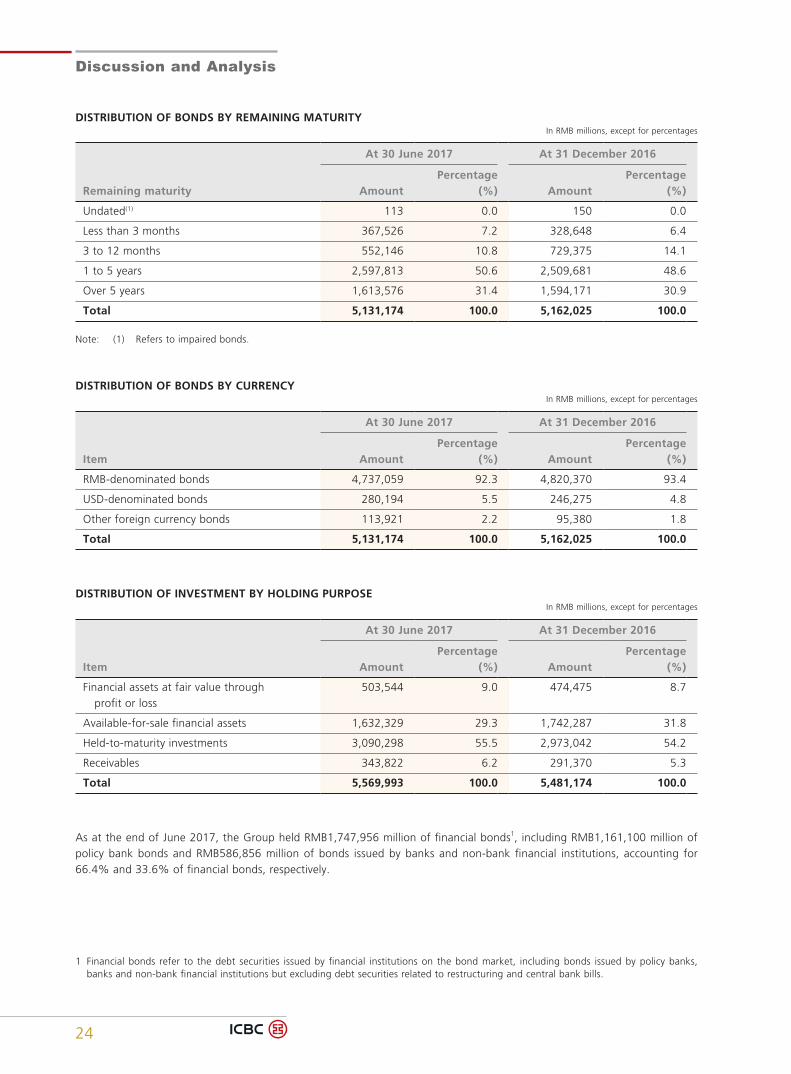
DISTRIBUTION OF BONDS BY REMAINING MATURITYIn RMB millions, except for percentages
At 30 June 2017 At 31 December 2016
Remaining maturity AmountPercentage
(%) AmountPercentage
(%)
Undated(1) 113 0.0 150 0.0
Less than 3 months 367,526 7.2 328,648 6.4
3 to 12 months 552,146 10.8 729,375 14.1
1 to 5 years 2,597,813 50.6 2,509,681 48.6
Over 5 years 1,613,576 31.4 1,594,171 30.9
Total 5,131,174 100.0 5,162,025 100.0
Note: (1) Refers to impaired bonds.
DISTRIBUTION OF BONDS BY CURRENCYIn RMB millions, except for percentages
At 30 June 2017 At 31 December 2016
Item AmountPercentage
(%) AmountPercentage
(%)
RMB-denominated bonds 4,737,059 92.3 4,820,370 93.4
USD-denominated bonds 280,194 5.5 246,275 4.8
Other foreign currency bonds 113,921 2.2 95,380 1.8
Total 5,131,174 100.0 5,162,025 100.0
DISTRIBUTION OF INVESTMENT BY HOLDING PURPOSEIn RMB millions, except for percentages
Item
At 30 June 2017 At 31 December 2016
AmountPercentage
(%) AmountPercentage
(%)
Financial assets at fair value through profit or loss
503,544 9.0 474,475 8.7
Available-for-sale financial assets 1,632,329 29.3 1,742,287 31.8
Held-to-maturity investments 3,090,298 55.5 2,973,042 54.2
Receivables 343,822 6.2 291,370 5.3
Total 5,569,993 100.0 5,481,174 100.0
As at the end of June 2017, the Group held RMB1,747,956 million of financial bonds1, including RMB1,161,100 million of policy bank bonds and RMB586,856 million of bonds issued by banks and non-bank financial institutions, accounting for 66.4% and 33.6% of financial bonds, respectively.
1 Financial bonds refer to the debt securities issued by financial institutions on the bond market, including bonds issued by policy banks, banks and non-bank financial institutions but excluding debt securities related to restructuring and central bank bills.

25
Discussion and Analysis
I n t e r i m R e p o r t 2 0 1 7
TOP 10 FINANCIAL BONDS HELD BY THE BANKIn RMB millions, except for percentages
Debt securitiesNominal
valueAnnual
interest rate Maturity dateImpairment
loss
Policy bank bonds 2007 17,300 5.07% 29 November 2017 –
Policy bank bonds 2008 16,266 4.95% 11 March 2018 –
Policy bank bonds 2011 12,860 4.66% 25 August 2018 –
Policy bank bonds 2011 11,776 4.25% 24 March 2018 –
Policy bank bonds 2012 11,508 3.94% 21 August 2019 –
Policy bank bonds 2012 11,400 4.04% 25 June 2022 –
Policy bank bonds 2010 11,050 3.51% 27 July 2020 –
Policy bank bonds 2012 11,035 3.76% 13 July 2019 –
Policy bank bonds 2011 10,505 4.62% 22 February 2021 –
Policy bank bonds 2014 10,410 5.75% 14 January 2019 –
Liabilities
As at the end of June 2017, total liabilities of the Bank amounted to RMB23,483,412 million, representing an increase of RMB1,327,310 million or 6.0% from the end of the previous year.
LIABILITIESIn RMB millions, except for percentages
At 30 June 2017 At 31 December 2016
Item AmountPercentage
(%) AmountPercentage
(%)
Due to customers 19,021,171 81.0 17,825,302 80.5
Due to banks and other financial institutions 1,815,045 7.7 2,016,799 9.1
Repurchase agreements 681,925 2.9 589,306 2.7
Debt securities issued 413,016 1.8 357,937 1.6
Others 1,552,255 6.6 1,366,758 6.1
Total liabilities 23,483,412 100.0 22,156,102 100.0
Due to Customers
Due to customers is the Bank’s main source of funds. As at the end of June 2017, the balance of due to customers was RMB19,021,171 million, representing an increase of RMB1,195,869 million or 6.7% from the end of the previous year. In terms of customer structure, the balance of corporate deposits increased by RMB884,009 million or 9.4%; and the balance of personal deposits increased by RMB349,455 million or 4.3%. In terms of maturity structure, the balance of time deposits increased by RMB685,349 million or 8.0%, while the balance of demand deposits increased by RMB548,115 million or 6.1%.

Discussion and Analysis
26
DISTRIBUTION OF DUE TO CUSTOMERS BY BUSINESS LINEIn RMB millions, except for percentages
Item
At 30 June 2017 At 31 December 2016
AmountPercentage
(%) AmountPercentage
(%)
Corporate deposits
Time deposits 4,583,355 24.1 4,176,834 23.4
Demand deposits 5,749,174 30.2 5,271,686 29.6
Subtotal 10,332,529 54.3 9,448,520 53.0
Personal deposits
Time deposits 4,698,735 24.7 4,419,907 24.8
Demand deposits 3,791,001 19.9 3,720,374 20.9
Subtotal 8,489,736 44.6 8,140,281 45.7
Other deposits(1) 198,906 1.1 236,501 1.3
Total 19,021,171 100.0 17,825,302 100.0
Note: (1) Includes outward remittance and remittance payables.
DISTRIBUTION OF DUE TO CUSTOMERS BY GEOGRAPHIC AREAIn RMB millions, except for percentages
Item
At 30 June 2017 At 31 December 2016
AmountPercentage
(%) AmountPercentage
(%)
Head Office 58,261 0.3 69,210 0.4
Yangtze River Delta 3,534,718 18.6 3,456,697 19.4
Pearl River Delta 2,586,313 13.6 2,397,059 13.4
Bohai Rim 5,127,946 27.0 4,795,528 26.9
Central China 2,740,898 14.4 2,561,772 14.4
Western China 3,133,342 16.4 2,881,274 16.2
Northeastern China 1,070,559 5.6 986,703 5.5
Overseas and others 769,134 4.1 677,059 3.8
Total 19,021,171 100.0 17,825,302 100.0
In terms of the currency structure, the balance of RMB deposits amounted to RMB17,797,487 million, which accounted for 93.6% of the total balance of due to customers, RMB1,074,736 million or 6.4% higher than that at the end of the previous year. The balance of foreign currency deposits was equivalent to RMB1,223,684 million, an increase of RMB121,133 million or 11.0%.

27
Discussion and Analysis
I n t e r i m R e p o r t 2 0 1 7
Shareholders’ Equity
As at the end of June 2017, shareholders’ equity amounted to RMB2,030,634 million in aggregate, RMB49,471 million or 2.5% higher than that at the end of the previous year. Equity attributable to equity holders of the parent company amounted to RMB2,018,295 million, recording an increase of RMB48,544 million or 2.5%. Please refer to the “Financial Statements: Consolidated Statement of Changes in Equity” for details.
For details of off-balance sheet items, please refer to “Note 41. to the Financial Statements: Commitments and Contingent Liabilities”.
Analysis on Statement of Cash Flows
Net cash inflows from operating activities amounted to RMB346,542 million. Specifically, net cash outflows of operating assets rose by RMB88,360 million as compared to the same period of last year, mainly because the increase of loans and advances to customers generated more cash outflows, the decrease of due from banks and other financial institutions generated more cash inflows in the first half of 2016, but cash outflows on the contrary in the first half of 2017; and net cash inflows of operating liabilities grew by RMB64,779 million, mainly due to the increase of cash inflows resulting from the customer deposits.
Net cash outflows from investing activities amounted to RMB118,910 million, of which, cash inflows increased by RMB57,803 million to RMB1,039,403 million, mainly due to the increase in cash inflows generated from sale and payment of bond investment; and cash outflows decreased by RMB250,187 million to RMB1,158,313 million, mainly due to the decrease in cash payment generated from bond investment.
Net cash inflows from financing activities amounted to RMB51,344 million, of which, cash inflows were RMB407,835 million, mainly due to the issuance of debt securities by overseas institutions; and cash outflows were RMB356,491 million, mainly due to the repayment of debt securities.
Discussion and Analysis
28
BUSINESS OVERVIEW
Corporate Banking
Facing the new normal of economic development, the Bank strove to develop its corporate banking business by continuing to support the growth of the real economy and facilitate the supply-side structural reform. Through innovation, the Bank tapped into new markets.
The Bank optimized the establishment of global marketing network, strengthened the coordinated marketing of all products among domestic and overseas institutions and solidly forged ahead in the marketing of a full package of financial service solutions including payroll payment agency, domestic and overseas cash management and bi-directional cash pooling.
Leveraging the large customer base and broad network, the Bank strengthened marketing to industrial chain cluster, urban circle cluster and specific customer cluster to attract their deposits. Besides, the Bank also made good use of its advantages in integrated financial services such as corporate wealth management, cash management, E-banking and credit fund custody. As a result, its market competitiveness in corporate deposits business was further enhanced.
Carrying forward the Project on Expanding the Base of Loan Customers, the Bank managed to balance the increase of small, medium and large-sized customers, adjusted the credit structure via reshuffling of customer mix and enhanced its capabilities to serve the real economy with credit business.
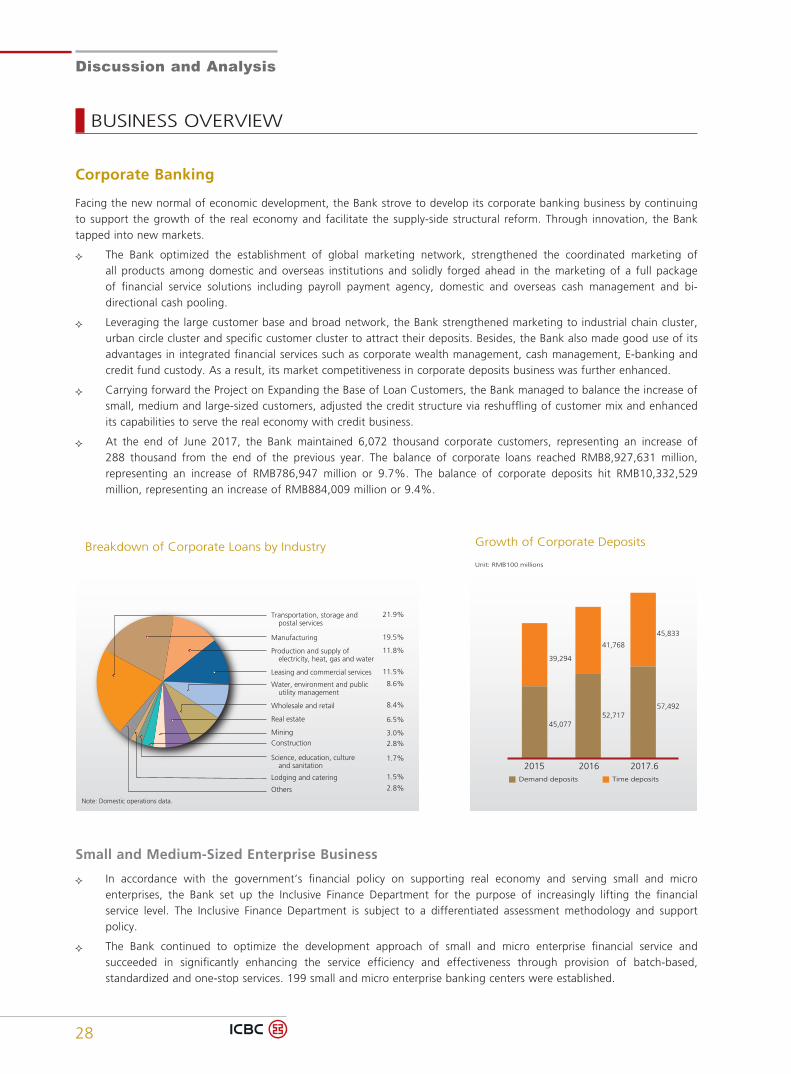
At the end of June 2017, the Bank maintained 6,072 thousand corporate customers, representing an increase of 288 thousand from the end of the previous year. The balance of corporate loans reached RMB8,927,631 million, representing an increase of RMB786,947 million or 9.7%. The balance of corporate deposits hit RMB10,332,529 million, representing an increase of RMB884,009 million or 9.4%.
Transportation, storage and postal services
Manufacturing
Production and supply of electricity, heat, gas and water
Leasing and commercial services
Water, environment and public utility management
Wholesale and retail
Real estate
Mining
Construction
Science, education, culture and sanitation
Lodging and catering
Others
21.9%
19.5%
11.8%
11.5%
8.6%
8.4%
6.5%
3.0%
2.8%
1.7%
1.5%
2.8%
Note: Domestic operations data.
Breakdown of Corporate Loans by Industry
2017.620162015
52,71757,492
45,833
45,077
39,294
41,768
Growth of Corporate Deposits
Unit: RMB100 millions
Demand deposits Time deposits
Small and Medium-Sized Enterprise Business
In accordance with the government’s financial policy on supporting real economy and serving small and micro enterprises, the Bank set up the Inclusive Finance Department for the purpose of increasingly lifting the financial service level. The Inclusive Finance Department is subject to a differentiated assessment methodology and support policy.
The Bank continued to optimize the development approach of small and micro enterprise financial service and succeeded in significantly enhancing the service efficiency and effectiveness through provision of batch-based, standardized and one-stop services. 199 small and micro enterprise banking centers were established.
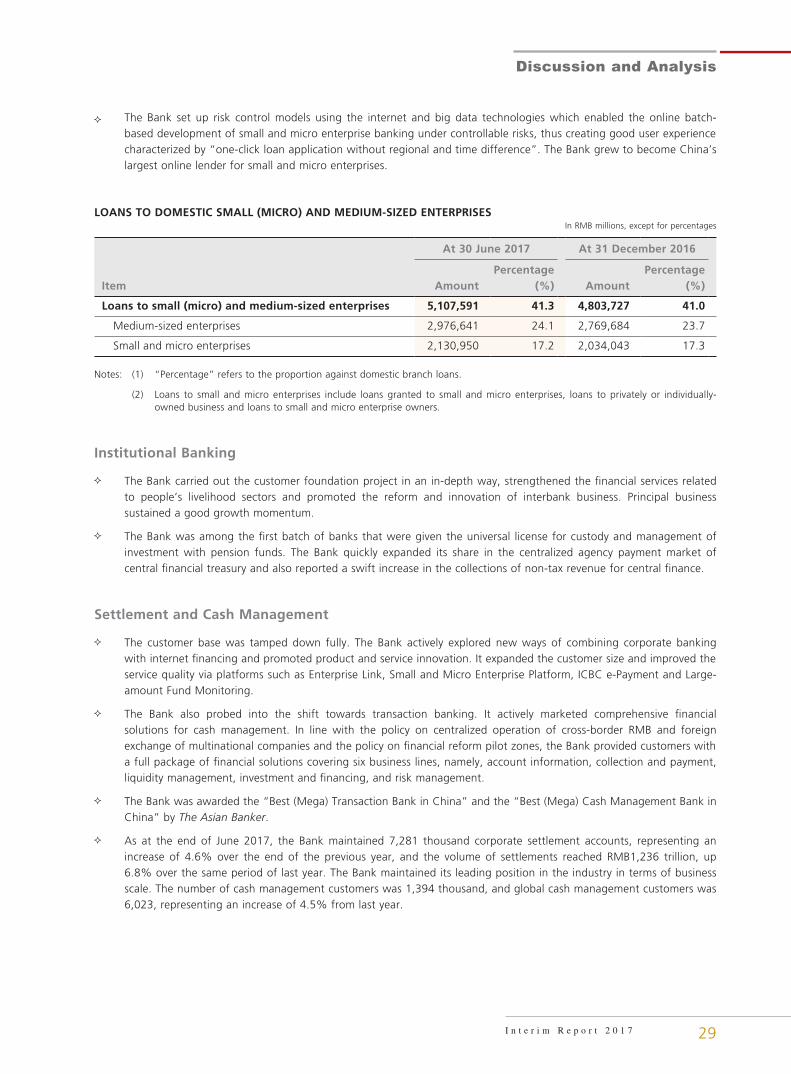
29
Discussion and Analysis
I n t e r i m R e p o r t 2 0 1 7
The Bank set up risk control models using the internet and big data technologies which enabled the online batch-based development of small and micro enterprise banking under controllable risks, thus creating good user experience characterized by “one-click loan application without regional and time difference”. The Bank grew to become China’s largest online lender for small and micro enterprises.
LOANS TO DOMESTIC SMALL (MICRO) AND MEDIUM-SIZED ENTERPRISESIn RMB millions, except for percentages
Item
At 30 June 2017 At 31 December 2016
AmountPercentage
(%) AmountPercentage
(%)
Loans to small (micro) and medium-sized enterprises 5,107,591 41.3 4,803,727 41.0
Medium-sized enterprises 2,976,641 24.1 2,769,684 23.7
Small and micro enterprises 2,130,950 17.2 2,034,043 17.3
Notes: (1) “Percentage” refers to the proportion against domestic branch loans.
(2) Loans to small and micro enterprises include loans granted to small and micro enterprises, loans to privately or individually-owned business and loans to small and micro enterprise owners.
Institutional Banking
The Bank carried out the customer foundation project in an in-depth way, strengthened the financial services related to people’s livelihood sectors and promoted the reform and innovation of interbank business. Principal business sustained a good growth momentum.
The Bank was among the first batch of banks that were given the universal license for custody and management of investment with pension funds. The Bank quickly expanded its share in the centralized agency payment market of central financial treasury and also reported a swift increase in the collections of non-tax revenue for central finance.
Settlement and Cash Management
The customer base was tamped down fully. The Bank actively explored new ways of combining corporate banking with internet financing and promoted product and service innovation. It expanded the customer size and improved the service quality via platforms such as Enterprise Link, Small and Micro Enterprise Platform, ICBC e-Payment and Large-amount Fund Monitoring.
The Bank also probed into the shift towards transaction banking. It actively marketed comprehensive financial solutions for cash management. In line with the policy on centralized operation of cross-border RMB and foreign exchange of multinational companies and the policy on financial reform pilot zones, the Bank provided customers with a full package of financial solutions covering six business lines, namely, account information, collection and payment, liquidity management, investment and financing, and risk management.
The Bank was awarded the “Best (Mega) Transaction Bank in China” and the “Best (Mega) Cash Management Bank in China” by The Asian Banker.
As at the end of June 2017, the Bank maintained 7,281 thousand corporate settlement accounts, representing an increase of 4.6% over the end of the previous year, and the volume of settlements reached RMB1,236 trillion, up 6.8% over the same period of last year. The Bank maintained its leading position in the industry in terms of business scale. The number of cash management customers was 1,394 thousand, and global cash management customers was 6,023, representing an increase of 4.5% from last year.
Discussion and Analysis
30
International Settlement and Trade Finance
The Bank further strengthened interaction and cooperation between domestic and overseas institutions and paid more efforts to innovation in core cross-border investment & financing products. It stepped up the expansion of export related businesses and customers and continued to improve the business structure.
Continued upgrade was seen in business transformation via accelerated development and promotion of internet innovation initiatives such as documents settlement system under internet banking and cross-border remittance system under internet banking.
In the first half of 2017, domestic branches disbursed an aggregate of USD33.7 billion in international trade finance. International settlements increased by 16.1% compared with the same period of last year to USD1,391,365 million, of which USD560,424 million were handled by overseas institutions, up 41.6%.
Investment Banking
The Bank made progress in developing market-based fund and equity financing businesses to signature projects. It successfully operated the China Aerospace Science and Technology Corp. and other market-based fund business, and provided equity financing advisory service for almost 100 companies.
The Bank actively expanded its merger and acquisition (M&A) advisory business. It achieved success in various domestic and cross-border M&A projects such as acquisition financing for China Merchants Group, mixed ownership reorganization of Yunnan Baiyao Holdings and Shanghai Electric Power Company Ltd.’s acquisition of K-Electric Ltd.
The Bank actively strengthened the new business of debt financing advisory service, with a focus on infrastructure and emerging industries, among other important industries. It engaged in a number of structured financing and liquidity debt financing projects with Guangzhou State-owned Capital Operation Holdings Co., Ltd., Urumqi Property Development Group, etc.
The Bank actively expanded its bond underwriting business and underwrote various debt financing instruments worth RMB451.5 billion as a lead manager in the first half of 2017.
In the first half of 2017, the investment banking income reached RMB14,729 million.
Personal Banking
The Bank continued to implement the “Mega Retail” strategy in the first half of 2017. Capturing the opportunity of consumption structure upgrade and demand expansion of residents, the Bank actively explored the seamless integration of novel technologies such as big data and artificial intelligence with traditional banking business and spared no effort to promote the transformation and upgrade to intelligent retail under the guidance of internet thinking.
To maintain good customer relationships and expand the customer base, the Bank developed an online & offline customer on-boarding system in the internet era, commenced strategic partnership with such internet firms as JD and Tencent and relied on products and platforms such as ICBC e-Campus, Baby Growth Card and direct banking to attract more online customers and young customers. It also did a lot of concrete work in acquiring customers offline and through cluster marketing, optimized the “ICBC Salary Manager” value-added service system, set up a comprehensive service platform for merchant customers, diversified the application scenarios of financial social security cards and built the ICBC service brand of supporting the army.
What’s more, the Bank promoted the construction of an interconnected service platform which is based on personal banking accounts, added a new feature of deferred cancellation to transfers made via ATM, self-service terminals, internet banking and mobile banking, and optimized the business process of account closing in non-account-opening places and petty account loss-reporting.
Pursuing the increase of deposits via innovation, the Bank rolled out personal deposit innovative product series such as “Daily Benefit” and “Salary Premium 3”.
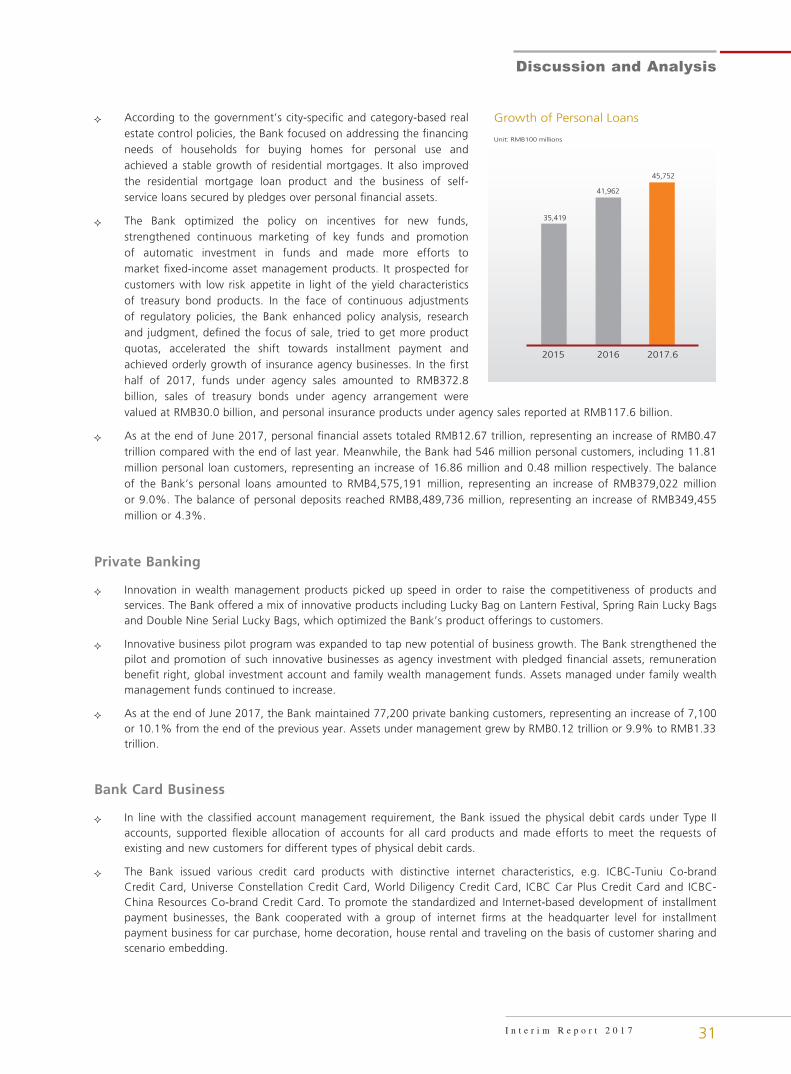
31
Discussion and Analysis
I n t e r i m R e p o r t 2 0 1 7
According to the government’s city-specific and category-based real estate control policies, the Bank focused on addressing the financing needs of households for buying homes for personal use and achieved a stable growth of residential mortgages. It also improved the residential mortgage loan product and the business of self-service loans secured by pledges over personal financial assets.
The Bank optimized the policy on incentives for new funds, strengthened continuous marketing of key funds and promotion of automatic investment in funds and made more efforts to market fixed-income asset management products. It prospected for customers with low risk appetite in light of the yield characteristics of treasury bond products. In the face of continuous adjustments of regulatory policies, the Bank enhanced policy analysis, research and judgment, defined the focus of sale, tried to get more product quotas, accelerated the shift towards installment payment and achieved orderly growth of insurance agency businesses. In the first half of 2017, funds under agency sales amounted to RMB372.8 billion, sales of treasury bonds under agency arrangement were valued at RMB30.0 billion, and personal insurance products under agency sales reported at RMB117.6 billion.
As at the end of June 2017, personal financial assets totaled RMB12.67 trillion, representing an increase of RMB0.47 trillion compared with the end of last year. Meanwhile, the Bank had 546 million personal customers, including 11.81 million personal loan customers, representing an increase of 16.86 million and 0.48 million respectively. The balance of the Bank’s personal loans amounted to RMB4,575,191 million, representing an increase of RMB379,022 million or 9.0%. The balance of personal deposits reached RMB8,489,736 million, representing an increase of RMB349,455 million or 4.3%.
Private Banking
Innovation in wealth management products picked up speed in order to raise the competitiveness of products and services. The Bank offered a mix of innovative products including Lucky Bag on Lantern Festival, Spring Rain Lucky Bags and Double Nine Serial Lucky Bags, which optimized the Bank’s product offerings to customers.
Innovative business pilot program was expanded to tap new potential of business growth. The Bank strengthened the pilot and promotion of such innovative businesses as agency investment with pledged financial assets, remuneration benefit right, global investment account and family wealth management funds. Assets managed under family wealth management funds continued to increase.
As at the end of June 2017, the Bank maintained 77,200 private banking customers, representing an increase of 7,100 or 10.1% from the end of the previous year. Assets under management grew by RMB0.12 trillion or 9.9% to RMB1.33 trillion.
Bank Card Business
In line with the classified account management requirement, the Bank issued the physical debit cards under Type II accounts, supported flexible allocation of accounts for all card products and made efforts to meet the requests of existing and new customers for different types of physical debit cards.
The Bank issued various credit card products with distinctive internet characteristics, e.g. ICBC-Tuniu Co-brand Credit Card, Universe Constellation Credit Card, World Diligency Credit Card, ICBC Car Plus Credit Card and ICBC-China Resources Co-brand Credit Card. To promote the standardized and Internet-based development of installment payment businesses, the Bank cooperated with a group of internet firms at the headquarter level for installment payment business for car purchase, home decoration, house rental and traveling on the basis of customer sharing and scenario embedding.
2017.620162015
41,962
45,752
35,419
Growth of Personal Loans
Unit: RMB100 millions
Discussion and Analysis
32
The Bank accelerated the development of QR Code payment for merchants, and rolled out a more open and inclusive e payment platform with better QR payment product functions.
Taking a customer-centric approach, the Bank launched the “I Go” customer reward activities with ICBC characteristics, including “I Go Weekend”, “I Go Global” and “I Go Scan”, and also rolled out a customer benefits program with eight categories covering business travel, shopping and consumption and insurance, vigorously improving customers’ experience.
As at the end of June 2017, the Bank issued 860 million bank cards, representing an increase of 31.42 million cards from the end of the previous year, which consisted of 729 million debit cards and 129 million credit cards. In the first half of 2017, bank cards-based spending totaled to RMB3.23 trillion, of which, debit cards-based spending reached RMB2.09 trillion and credit cards-based spending reached RMB1.14 trillion. Overdraft balance of credit cards rose by RMB17,695 million or 3.9% from the end of previous year to RMB469,734 million. The first half of 2017 registered a bank card business income of RMB18,792 million.
Asset Management Services
Seizing the opportunities arising from customers’ wealth increase and capital market growth, the Bank made efforts to establish a mega asset management business system across the whole value chain and enhance its diversified, integrated and specialized services on the strength of the Group’s asset management, custody and pension businesses, and the functions of its comprehensive subsidiaries specialized in fund, insurance, leasing and investment banking.
Wealth Management Services
The Bank launched innovative product series, namely Free e-Wealth Management products, while strengthening the marketing of Money Link Express, Personal Enhanced Return, Enjoyable Return and Stable Return product series. Thus, the volume of and income from wealth management products grew in parallel.
The Bank released a variety of Free e-Wealth Management products for corporate customers to further enhance the convenience of wealth management and investment and meet customers’ requirements for independent and flexible investment. In the process of promoting the small and micro enterprise financial service platform, the Bank made wealth management products exclusive for small and micro enterprises available on the online terminals to attract their short-term investment.
As at the end of June 2017, the Bank’s outstanding balance of wealth management products was RMB2,723,041 million, remaining the largest in the banking industry.
Asset Custody Services
The Bank followed market demands closely to enhance its service capabilities on a full scale. It developed a sound asset custody product and service system and remained a market leader in respect of primary custody products, e.g. securities investment funds, insurance, banking wealth management, enterprise annuities, special fund accounts and global asset custody.
The Bank was awarded the “Custodian Bank of the Year in China” by The Asian Banker.
As at the end of June 2017, total net value of assets under the Bank’s custody reported at RMB14.5 trillion.
Pension Services
The Bank actively carried forward product innovation including personal pension wealth management products and also in personal pension financial services.
The Bank further reinforced the reserve of trusteeship capabilities for occupational annuities and strengthened the communication with regulatory authorities and social security departments to bolster the development of occupational annuities.
As at the end of June 2017, the pension funds under the Bank’s trusteeship amounted to RMB103.1 billion; the Bank managed 17.0 million individual pension accounts, and the pension funds under the Bank’s custody totaled RMB483.8 billion. The Bank led other banks in terms of the scale of enterprise annuity funds under the Bank’s trusteeship, number of individual enterprise annuity accounts and enterprise annuity funds under the Bank’s custody.
33
Discussion and Analysis
I n t e r i m R e p o r t 2 0 1 7
Financial Market Business
Money Market Activities
The Bank took the following actions on the RMB money market: It kept on strengthening market research and judgment on the premise of protecting liquidity safety, and enhanced the fund use efficiency through scientifically arranging the financing terms; it timed the market properly to increase earnings; it fully leveraged large bond holdings and assorted bond types to develop bond lending, put existing bonds to good use and expand profit growth points; it improved the development and process management of non-settlement interbank deposit system to enhance the efficiency of deposit taking from other banks and financial institutions.
On the foreign-currency money market, the Bank improved the lean management of foreign currency position and enlarged inter-bank lending and borrowing at a proper time, while actively carrying out interbank lending and borrowing with non-banking institutions to generate more benefits from fund operations.
In the first half of 2017, domestic trading amount in the interbank market was RMB14.16 trillion, of which lending amounted to RMB8.18 trillion. The transaction volume in foreign exchange money markets recorded USD319.8 billion.
Investment
With respect to investment in RMB bonds, in the face of a market environment where market interest rates vibrated upwards and the terminal interest rate rose overall in the first half of 2017, the Bank seized opportunities in the market promptly and enhanced the fund operation efficiency and earnings; actively participated in investment in low-risk and high-quality local government bonds to support local economic development; and continued to reinforce credit risk prevention and control by purchasing premier credit bonds but selling potentially risky bonds.
With respect to investment in foreign currency bonds, against the higher cost of foreign currency funds and the narrower net interest margin of bond portfolio as a result of interest rate hikes by the U.S. Federal Reserve, the Bank stepped up active management of foreign currency bond portfolio, increased frequency of band operations and added spread earnings. Besides, the Bank also actively expanded income sources via options and securities lending.
Financing
In line with its fund operation and liquidity management needs, the Bank rationally arranged the scale and structure of its active liabilities including interbank borrowing, short-term time deposits from other banks and large-value CDs in order to enhance the supporting capacity of diverse liabilities to asset business growth.
For details on the CDs and debt securities issued by the Bank, please refer to “Notes to the Financial Statements: 29. Certificates of Deposit; 31. Debt Securities Issued”.
Discussion and Analysis
34
Franchise Treasury Business
The Bank actively pushed for a balanced development of foreign exchange settlement and sales and vigorously carried forward exchange settlement business. The first half of 2017 saw the volume of franchise foreign exchange settlement and sales at USD205.8 billion and the volume of franchise foreign exchange trading at USD127.4 billion, up 7.0% and 10.0% compared with the same period of last year respectively.
The Bank continued to enrich the varieties of paper trading transactions and rolled out the paper copper and paper soybean continuing products on the basis of unremitting innovation in product line. In the first half of 2017, paper trading sized up to RMB207.4 billion.
In addition to providing customers with financial services on the basis of foreign exchange rate and interest rate risk management, the Bank strove to develop the trading in currencies of countries along the “Belt and Road” and also the emerging markets, making the Bank the first and only commercial bank in China to cover all of the countries along the “Belt and Road”. The business types included spot, forward and swap trading of more than 20 currencies, as well as Non-deliverable Forwards (NDF) of over 60 currencies. The diversified business types and whole coverage of currencies enabled the Bank to satisfy individual demands of enterprises in a comprehensive manner.
Agency trading business saw sustained development. The Bank actively launched the marketing campaigns over the provision of agency service for foreign central banks and commercial institutions to access China’s interbank market, and was selected by a number of foreign central banks to act as their agent on the interbank bond and foreign exchange markets. What’s more, the Bank became the counterparty of many foreign central banks on the interbank bond market and concluded the first foreign exchange transactions. The Bank ranked No. 1 in terms of OTC trading volume of book-entry treasury bonds in the first half of 2017.
Asset Securitization
The Bank broadened the NPA disposal channels in order to diversify asset and capital management approaches. In the first half of 2017, the Bank, as the issuer and facility provider, issued two tranches of NPA securitization programs totaling RMB4,006 million in the mainland, with non-performing credit card loans and non-performing personal loans as the underlying assets respectively.
Precious Metal Business
To meet customers’ demands for investing in physical precious metals, the Bank released a series of physical products for investment value preservation and cultural collections consistent with the market trends.
The Bank steadily promoted the online sales of physical precious metals and improved customer experience. Thematic marketing events and actions such as “Scan & Win” and “Thee-year Anniversary Celebration” were launched to increase the physical precious metal sales volume of “ICBC Precious Metal Flagship Store” under ICBC Mall.
The Bank prudently set the gold benchmark price at the London Intercontinental Exchange and served as the price setter of “Shanghai Gold”, a gold pricing product denominated in RMB, at the Shanghai Gold Exchange.
In the first half of 2017, the sum of precious metal business transactions was RMB799.5 billion. The Bank cleared RMB243.5 billion on behalf of the Shanghai Gold Exchange, up over 20% compared with the same period of last year.
Internet-based Finance
The Bank advanced its internet-based finance development strategies on all fronts, played a guiding role in leading innovation, upgraded and improved the overall architecture of internet-based finance with the e-commerce platform ICBC Mall, the information service platform ICBC Link and the open-ended online banking platform ICBC Mobile as the main pillars and covering financial services, e-commerce, payment and social life. The Bank made customer experience increasingly specialized and improved its risk prevention and control system to inject new vigor into the business transformation of the Bank.

35
Discussion and Analysis
I n t e r i m R e p o r t 2 0 1 7
ICBC Mall
The Bank continued to optimize the platform’s functions. It released WeChat-based Mobile Mall, promoted the building of B2B Cross-border e-Commerce Product System and pushed forward the application development of Top-up Center, Local Supermarket, Bonus Point Zone and Installment Zone, etc.
In addition, brilliant achievements were seen in merchant expansion and marketing events. 189 key brands and 147 important merchants came onboard, realizing full-coverage of well-known merchants in mobile, digital and oil card top-up sectors, and fresh breakthroughs in attracting well-known merchants in personal care and cosmetic products, major appliances, clothes and red wine sectors.
In the first half of 2017, ICBC Mall achieved an accumulative transaction amount of RMB523.9 billion.
ICBC Link
Big data-based applications such as “I’m right here at ICBC” customer portrait, as well as related customer asset analysis and product recommendations went live.
Product upgrade was in full blossom, testified by enhancement of customer manager application functions, upgrade of balance change alert service and rollout of embedded version of ICBC e-Payment and Emotion Icon Store.
Many scenario applications were expanded to offer various convenient life services such as Sharing Umbrella, UCAR, payment of traffic fines, ETC travel fee-deduction notice, social security payment, campus card top-up and payment by scanning QR on VEM.
As at the end of June 2017, ICBC Link had 93.49 million registered users.
ICBC Mobile
Thanks to great efforts in product innovation, the Bank released fingerprint login and fingerprint payment, enriched scenario-based services in Financial Calendar and Message Center and developed a special zone for serving soldiers under mobile banking. The Bank added the feature of reminding the expiration of U-Shield and e-password Device into Financial Calendar and the functions of outward/inward transfer of money from/into Type II accounts of physical cards, upgraded the entire credit card column, in particular its key processes, and released the brand new “Forget your password” process to effectively increase fault tolerance and flexibility. Remitting efforts were made to better customer experience after the open-ended personal internet banking was put online.
What’s more, the Bank rolled out many competitive mobile banking products. For instance, it introduced the “ICBC Benefit Gain T+0” money market fund, a kind of wealth management product using account balance, offered four tranches of high-earnings wealth management products exclusively for mobile banking customers, and gradually built “Xiangju Wealth” brand, which is a purely online wealth management brand.
At the end of June 2017, the number of users of ICBC Mobile reached 267 million.
Internet Financing
With a brand-new breakthrough in online supply chain financing business, the Bank newly rolled out 12 supply chains including FAW Jiefang, Volkswagen demo cars, Chery Jaguar Land Rover Automotive, QOROS, Vinda Paper and Vanke.
The Bank integrated personal loan brands and improved the personal loan interactive process. It developed and launched online petty unsecured loan product for small and micro enterprise customers, established a well-defined product system, designed a single entrance for online service and improved credit facility capability and risk control strength on the basis of big data.
Product innovation picked up speed. The Bank optimized the online pledged financing for corporate customers, rolled out the function of issuing paper acceptance drafts under pledge, improved the financing network-based system functions, and reinforced system risk control measures over pending offline confirmation of contracts signed online, attachment of contracts, contract status adjustment and money withdrawal.
As at the end of June 2017, internet financing balance exceeded RMB740 billion.
Discussion and Analysis
36
Payment
The Bank expanded the application scenarios of ICBC e-Payment and released such functions as Scan QR Code & Pay under ICBC Mobile, mutual acceptance of China UnionPay QR Code and clustered acquiring of QR code under WeChat.
The integration project was rolled out, providing a simple and brand-new payment platform that allows unified login, simplified card selection, intelligent signature verification and easy connection between the Bank and non-ICBC banks’ accounts and merchants, and supports interconnected access to e-banking services.
Brand upgrading continued. The constant marketing of withdrawing money by scanning QR code has made money withdrawal by scanning QR code an important scenario of attracting customers to register for ICBC e-Payment on a self-service basis.
Investment and Wealth Management
The franchise trading system was improved. In harmony with the development trend of internet-based finance, the Bank actively promoted the innovation of franchise products. It rendered one-stop trading and management services for paper precious metals, paper energy, paper base metals, paper agricultural products, paper foreign exchange, foreign exchange settlement and sales, foreign exchange trading, OTC bonds, etc. under internet banking and mobile banking, and constantly enriched the products and functions of ICBC e-Investment terminal. It further expanded the scope of products traded on the internet banking, and completed promotion across China of foreign exchange swap, foreign exchange option, interest rate swap and corporate commodities European option on the internet banking.
The Bank built the financial market interbank trading platform. It researched and developed a creative interbank trading platform and established a 24-hour non-stop trading system which allows efficient trading, whole-process risk control and lean management. The Bank was able to realize whole-process transaction processing of mainstream financial market products such as exchange rates and precious metal products, including market information, quotation, trading and clearing. It provided customers with access to established connections to the international trading systems in exchange rate, interest rate and commodities, thereby saving the customers’ efforts to connect to other trading systems and helping them to continuously improve their trading capacities.
Channel Development and Service Enhancement
Channel Development
Geographic distribution of outlets was optimised. The Bank made a comprehensive analysis of inputs and outputs of physical channels for an optimal outlet distribution. The Bank strengthened partnership with third-party companies on application of external big data, developed and improved the outlet distribution optimization models and tools, and increased the reasonableness and preciseness of site selection.
Outlet innovation and transformation were accelerated. Adapting to the new normal features with the upgrade of commercial and consumption models and multi-channel migration of customers, the Bank quickened the upgrade of traditional business structure of outlets to a diversified new structure characterized by functional stratification, customer classification and service coordination, and promoted the pilot of innovative business formats at outlets on a steady footing.
Intelligent service model was popularized at outlets comprehensively. The Bank made smooth progress in building intelligent outlets, continued to improve intelligent service processes and functions and drove the transformation of marketing services at outlets. For better customer experience, the Bank successively improved eight intelligent service functions that customers were in urgent demand, including debit card password resetting, e-banking medium management, enabling of internet banking for credit cards and bi-lingual anti-fraud alerts on ATM. The innovation of intelligent devices pushed the enhancement of abilities in customer marketing and service, while the Bank also researched, developed and rolled out portable intelligent ATM and ATM for passbooks, among other new types of devices.
The Bank continued to diversify and improve the entrances of new channels and related tools such as channel-based QR code, outlet WiFi, outlet mini programs and self-service channel outreach, launched joint promotional activities for new products, and set up a fresh three-dimensional marketing model characterized by promotions on multiple interfaces such as staff, outlet, ATM and mobile applications, and interconnections both online and offline.
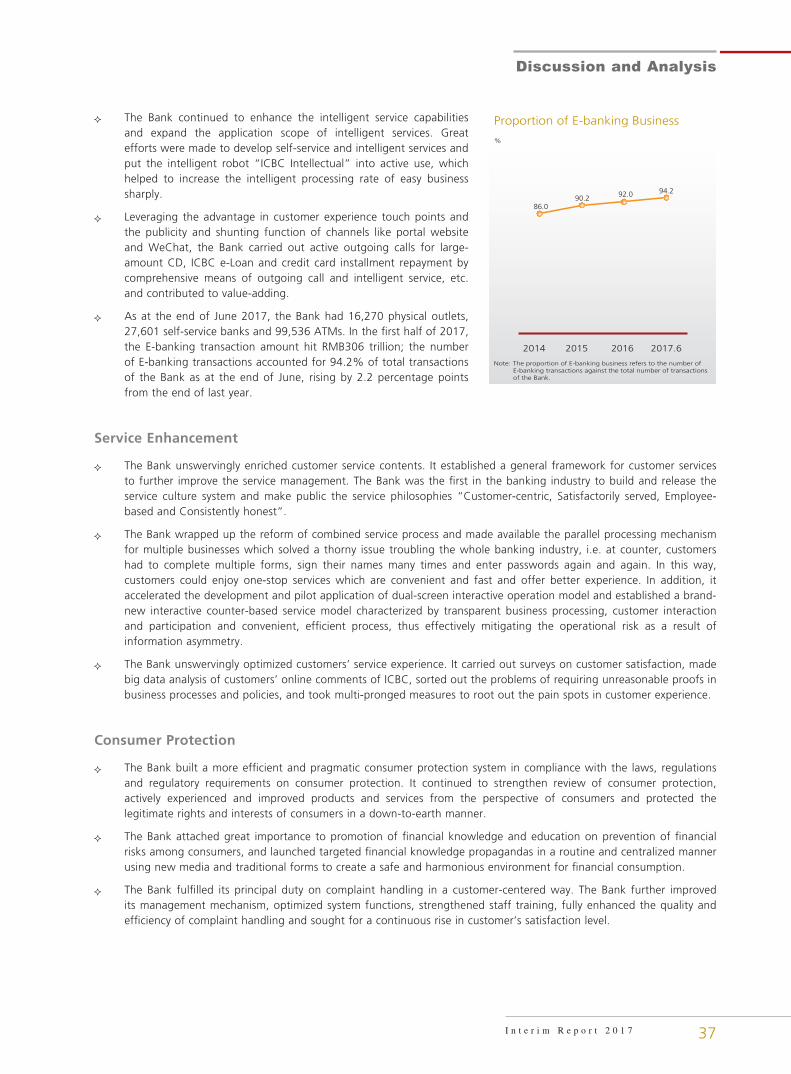
37
Discussion and Analysis
I n t e r i m R e p o r t 2 0 1 7
The Bank continued to enhance the intelligent service capabilities and expand the application scope of intelligent services. Great efforts were made to develop self-service and intelligent services and put the intelligent robot “ICBC Intellectual” into active use, which helped to increase the intelligent processing rate of easy business sharply.
Leveraging the advantage in customer experience touch points and the publicity and shunting function of channels like portal website and WeChat, the Bank carried out active outgoing calls for large-amount CD, ICBC e-Loan and credit card installment repayment by comprehensive means of outgoing call and intelligent service, etc. and contributed to value-adding.
As at the end of June 2017, the Bank had 16,270 physical outlets, 27,601 self-service banks and 99,536 ATMs. In the first half of 2017, the E-banking transaction amount hit RMB306 trillion; the number of E-banking transactions accounted for 94.2% of total transactions of the Bank as at the end of June, rising by 2.2 percentage points from the end of last year.
Service Enhancement
The Bank unswervingly enriched customer service contents. It established a general framework for customer services to further improve the service management. The Bank was the first in the banking industry to build and release the service culture system and make public the service philosophies “Customer-centric, Satisfactorily served, Employee-based and Consistently honest”.
The Bank wrapped up the reform of combined service process and made available the parallel processing mechanism for multiple businesses which solved a thorny issue troubling the whole banking industry, i.e. at counter, customers had to complete multiple forms, sign their names many times and enter passwords again and again. In this way, customers could enjoy one-stop services which are convenient and fast and offer better experience. In addition, it accelerated the development and pilot application of dual-screen interactive operation model and established a brand-new interactive counter-based service model characterized by transparent business processing, customer interaction and participation and convenient, efficient process, thus effectively mitigating the operational risk as a result of information asymmetry.
The Bank unswervingly optimized customers’ service experience. It carried out surveys on customer satisfaction, made big data analysis of customers’ online comments of ICBC, sorted out the problems of requiring unreasonable proofs in business processes and policies, and took multi-pronged measures to root out the pain spots in customer experience.
Consumer Protection
The Bank built a more efficient and pragmatic consumer protection system in compliance with the laws, regulations and regulatory requirements on consumer protection. It continued to strengthen review of consumer protection, actively experienced and improved products and services from the perspective of consumers and protected the legitimate rights and interests of consumers in a down-to-earth manner.
The Bank attached great importance to promotion of financial knowledge and education on prevention of financial risks among consumers, and launched targeted financial knowledge propagandas in a routine and centralized manner using new media and traditional forms to create a safe and harmonious environment for financial consumption.
The Bank fulfilled its principal duty on complaint handling in a customer-centered way. The Bank further improved its management mechanism, optimized system functions, strengthened staff training, fully enhanced the quality and efficiency of complaint handling and sought for a continuous rise in customer’s satisfaction level.
2017.6201620152014
%
Proportion of E-banking Business
Note: The proportion of E-banking business refers to the number of E-banking transactions against the total number of transactions of the Bank.
92.0 94.2
86.090.2

Discussion and Analysis
38
Internationalized and Diversified Operation
The Bank steadily advanced global network layout and channel building. Overseas institutions further improved their capabilities of localized operation and sustainable development. A slew of global key product lines involving investment banking, cash management, financial markets, asset management and asset custody were developed in depth and breadth in a bid to sharpen competitive edges and influence on the international market. Leveraging on the investment and financing product lines such as global financing, investment banking and financial leasing, the Bank supported the “Going Global” drive of Chinese-funded enterprises in the aspects of serving the “Belt and Road” initiative and the cooperation in international production capacity. Comprehensive subsidiaries delivered stronger profit contributions and strategic synergies to the Group.
Internationalized Operation
The Bank continued to improve its service network in countries and regions along the “Belt and Road”, and the establishment of Mongolia Representative Office and Prague Branch in Czech Republic was approved by regulators of host countries.
In the first half of 2017, the Bank undertook new “Going Global” loan projects worth USD15.3 billion, covering areas of electricity, telecommunication, infrastructure, resource, aerospace and civil engineering across the world. As at the end of June 2017, the Bank accumulatively supported 339 “Going Global” projects, with loans amounting to USD88.1 billion.
The Bank consolidated the basis of cross-border RMB business, grasped opportunities brought about by the opening-up of domestic financial market, and accelerated overseas sovereign customer marketing and expansion. It actively advanced the business reserve and development for the third-batch new free trade zones. In addition, the Bank seized the opportunity from internet financing development to push forward the rapid growth of cross-border e-commerce. In the first half of 2017, the cross-border RMB business volume reached RMB1.77 trillion.
As at the end of June 2017, the Bank established 419 institutions in 42 countries and regions and indirectly covered 20 African countries as a shareholder of Standard Bank Group. It also established correspondent banking relationships with 1,519 overseas banking institutions in 143 countries and regions, making its service network cover six continents and important international financial centers around the world. In particular, the Bank maintained 127 institutions in 18 countries and regions along the “Belt and Road” region.
39
Discussion and Analysis
I n t e r i m R e p o r t 2 0 1 7
MAJOR INDICATORS FOR OVERSEAS INSTITUTIONS
Item
Assets(in USD millions)
Profit before tax(in USD millions) Number of institutions
At30 June
2017
At31 December
2016
Six monthsended
30 June 2017
Six monthsended
30 June 2016
At30 June
2017
At31 December
2016
Hong Kong and Macau 163,558 159,445 848 789 108 108
Asia-Pacific Region (except Hong Kong and Macau)
78,674 69,935 451 319 88 87
Europe 65,081 58,317 145 49 79 80
Americas 71,981 64,723 289 304 143 136
African Representative Office – – – – 1 1
Eliminations (42,768) (49,741)
Subtotal 336,526 302,679 1,733 1,461 419 412
Investment in Standard Bank(1) 3,965 3,771 190 149
Total 340,491 306,450 1,923 1,610 419 412
Note: (1) The assets represent the balance of the Bank’s investment in Standard Bank and the profit before taxation represents the Bank’s gain on investment recognized by the Bank during the reporting period.
As at the end of June 2017, total assets of overseas institutions (including overseas branches, subsidiaries and investments in Standard Bank) of the Bank were USD340,491 million, representing an increase of USD34,041 million or 11.1% from the end of the previous year, and they accounted for 9.0% of the Group’s total assets. Total loans amounted to USD206,389 million, representing an increase of USD30,518 million or 17.4 %, and total deposits were USD113,227 million, representing an increase of USD16,004 million or 16.5%. Profit before taxation during the reporting period was USD1,923 million, increasing by 19.4% as compared to the same period of last year.
Diversified Operation
ICBC Credit Suisse Asset Management seized opportunities from deepened reform and continually improved multi-level capital market at home, further gave play to its functions as an all-round asset management platform, accelerated innovation and enhanced coordination.
Leveraging on the opportunities brought about by the “Belt and Road” initiative, maritime strategy and international cooperation in production capacity, ICBC Leasing reinforced exploration of international and domestic markets and key sectors, and maintained steady and solid development of all businesses.
ICBC-AXA adhered to the operation philosophy of laying equal stress on scale and value, actively promoted transformation and innovation, effectively improved its product structure, and therefore continually promoted business scale and market position, significantly enhanced profitability, and realized sound year-on-year growth of all the major operation indicators.
ICBC International, the licensed integrated platform for financial services of the Group, accelerated its transformation and development, and put equal emphasis on traditional corporate financing business, and asset management and investment business, thereby steadily enhancing its sustainability.

Discussion and Analysis
40
DISTRIBUTION MAP OF OVERSEAS INSTITUTIONS
Afr
ica
Inst
itu
tio
n
Nu
mb
er o
f (c
ou
ntr
y/re
gio
n)
inst
itu
tio
ns
Inve
stm
ents
in S
tan
dar
d B
ank
(S
ou
th A
fric
a)A
fric
an R
epre
sen
tati
ve O
ffic
e
(So
uth
Afr
ica)
----
----
----
----
----
----
---1
Ho
ng
Ko
ng
an
d M
acau
Inst
itu
tio
n
Nu
mb
er o
f (c
ou
ntr
y/re
gio
n)
inst
itu
tio
ns
ICB
C (
Asi
a) (
Ho
ng
Ko
ng
, Ch
ina)
73
Ho
ng
Ko
ng
Bra
nch
(Ho
ng
Ko
ng
, Ch
ina)
----
----
----
--2
ICB
C In
tern
atio
nal
(Ho
ng
Ko
ng
, Ch
ina)
----
----
----
--9
ICB
C (
Mac
au)
(Mac
au, C
hin
a)--
24
Euro
pe
Inst
itu
tio
n
Nu
mb
er o
f (c
ou
ntr
y/re
gio
n)
inst
itu
tio
ns
Luxe
mb
ou
rg B
ran
ch
(L
uxe
mb
ou
rg)
----
----
----
----
----
--1
Fran
kfu
rt B
ran
ch (
Ger
man
y)--
---5
Lon
do
n B
ran
ch (
UK
)--
----
----
----
--1
ICB
C S
tan
dar
d (
UK
)---
----
----
----
-10
ICB
C (
Euro
pe)
(Lu
xem
bo
urg
)---
--1
Pa
ris
Bra
nch
(Fr
ance
)---
----
----
--1
W
arsa
w B
ran
ch (
Pola
nd
)---
----
-1
Mad
rid
Bra
nch
(Sp
ain
)---
----
----
2
Mila
n B
ran
ch (
Ital
y)--
----
----
----
-2
Am
ster
dam
Bra
nch
(t
he
Net
her
lan
ds)
----
----
----
---2
B
russ
els
Bra
nch
(B
elg
ium
)--
----
2IC
BC
(Lo
nd
on
) (U
K)-
----
----
----
----
-1B
ank
ICB
C (
JSC
) (R
uss
ia)-
----
----
---3
ICB
C T
urk
ey (
Turk
ey)-
----
----
----
-47
Am
eric
aIn
stit
uti
on
N
um
ber
of
(co
un
try/
reg
ion
) in
stit
uti
on
sN
ew Y
ork
Bra
nch
(U
SA)-
----
----
----
1IC
BC
(U
SA)
(USA
)---
----
----
----
----
-15
ICB
CFS
(U
SA)
----
----
----
----
----
----
---1
ICB
C (
Can
ada)
(C
anad
a)--
----
----
10IC
BC (A
rgen
tin
a) (
Arg
enti
na)
--11
3IC
BC
(B
razi
l) (
Bra
zil)
---
----
----
----
--1
ICB
C (
Peru
) (P
eru
)---
----
----
----
----
--1
ICB
C (
Mex
ico
) (M
exic
o)
----
----
----
-1
Asi
a-Pa
cifi
c R
egio
n (
exce
pt
H
on
g K
on
g a
nd
Mac
au)
Inst
itu
tio
n
Nu
mb
er o
f (c
ou
ntr
y/re
gio
n)
inst
itu
tio
ns
Sin
gap
ore
Bra
nch
(Si
ng
apo
re)-
----
--11
Toky
o B
ran
ch (
Jap
an)-
----
----
----
----
---
3Se
ou
l Bra
nch
(So
uth
Ko
rea)
----
----
---
3B
usa
n B
ran
ch (
Sou
th K
ore
a)--
----
----
1H
ano
i Bra
nch
(V
ietn
am)-
----
----
----
---
1V
ien
tian
e B
ran
ch (
Lao
PD
R)-
----
----
--1
Phn
om
Pen
h B
ran
ch (
Cam
bo
dia
)--
--1
Yan
go
n B
ran
ch (
Mya
nm
ar)-
----
----
---
1D
oh
a B
ran
ch (
Qat
ar)-
----
----
----
----
----
1A
bu
Dh
abi B
ran
ch (
UA
E)--
----
----
----
-1
Riy
adh
Bra
nch
(Sa
ud
i Ara
bia
)---
----
--1
Du
bai
(D
IFC
) B
ran
ch (
UA
E)--
----
----
---
1K
uw
ait
Bra
nch
(K
uw
ait)
----
----
----
----
1K
arac
hi B
ran
ch (
Paki
stan
)---
----
----
---
3M
um
bai
Bra
nch
(In
dia
)--
----
----
----
---
1IC
BC
(M
alay
sia)
(M
alay
sia)
----
----
----
-5
ICB
C (
Ind
on
esia
) (I
nd
on
esia
)--
----
---2
2IC
BC
(Th
ai)
(Th
aila
nd
)--
----
----
----
----
24IC
BC
(A
lmat
y) (
Kaz
akh
stan
)--
----
----
-1
Syd
ney
Bra
nch
(A
ust
ralia
)---
----
----
---
4IC
BC
(N
ew Z
eala
nd
)
(New
Zea
lan
d)-
----
----
----
----
----
----
--1

41
Discussion and Analysis
I n t e r i m R e p o r t 2 0 1 7
Controlled Subsidiaries and Major Equity Participation Company
� Overseas Subsidiaries
INDUSTRIAL AND COMMERCIAL BANK OF CHINA (ASIA) LIMITED
ICBC (Asia) is a wholly owned Hong Kong registered bank by the Bank, and has an issued share capital of HKD36,379 million. It provides comprehensive commercial banking services and the major businesses include commercial credit, trade finance, investment service, retail banking, E-banking, custody, credit card, receiving bank services for IPOs and dividend distribution. As at the end of June 2017, ICBC (Asia) recorded total assets of USD107,692 million and net assets of USD11,240 million. It generated a net profit of USD463 million during the first half of the year.
ICBC INTERNATIONAL HOLDINGS LIMITED
ICBC International, a licensed integrated platform for financial services in Hong Kong that is wholly owned by the Bank, has a paid-up capital of HKD4,882 million. It mainly renders a variety of financial services, including corporate finance, investment management, sales and trading, and asset management. As of the end of June 2017, ICBC International recorded total assets of USD5,474 million and net assets of USD1,055 million. It generated a net profit of USD58 million during the first half of the year.
INDUSTRIAL AND COMMERCIAL BANK OF CHINA (MACAU) LIMITED
ICBC (Macau) is the largest local legal banking entity in Macau. It has a share capital of MOP589 million, in which the Bank holds an 89.33% stake. ICBC (Macau) mainly engages in comprehensive commercial banking services such as deposit, loan, trade finance and international settlement. As at the end of June 2017, ICBC (Macau) recorded total assets of USD26,684 million and net assets of USD2,458 million. It generated a net profit of USD151 million during the first half of the year.
INDUSTRIAL AND COMMERCIAL BANK OF CHINA (MALAYSIA) BERHAD
ICBC (Malaysia) is a wholly-owned subsidiary of the Bank established in Malaysia. With a paid-up capital of MYR833 million, it is able to provide a full range of commercial banking services. As at the end of June 2017, ICBC (Malaysia) recorded total assets of USD1,013 million and net assets of USD227 million. It generated a net profit of USD5.70 million during the first half of the year.
PT. BANK ICBC INDONESIA
ICBC (Indonesia) is a full-licensed commercial banking subsidiary of the Bank registered in Indonesia, with a paid-up capital of IDR3.69 trillion, in which ICBC holds a 98.61% stake. ICBC (Indonesia) mainly specializes in financial services such as deposit, loan, trade finance, settlement, agency services, interbank borrowing and lending and foreign exchange. As at the end of June 2017, ICBC (Indonesia) recorded total assets of USD3,767 million and net assets of USD432 million. It generated a net profit of USD20.02 million during the first half of the year.
INDUSTRIAL AND COMMERCIAL BANK OF CHINA (THAI) PUBLIC COMPANY LIMITED
ICBC (Thai), a subsidiary of the Bank in Thailand, has a share capital of THB20,132 million, in which the Bank holds a 97.86% stake. ICBC (Thai) holds a comprehensive banking license and provides various services including deposit, loan, trade finance, remittance, settlement, leasing and consulting. As at the end of June 2017, ICBC (Thai) recorded total assets of USD5,864 million and net assets of USD801 million. It generated a net profit of USD26.56 million during the first half of the year.
Discussion and Analysis
42
INDUSTRIAL AND COMMERCIAL BANK OF CHINA (ALMATY) JOINT STOCK COMPANY
ICBC (Almaty), an ICBC’s wholly owned subsidiary, was incorporated in Kazakhstan with a share capital of KZT8,933 million. The primary commercial banking services it engages in include deposit, loan, international settlement and trade finance, foreign currency exchange, bank guarantee, account management, E-banking and bank card. As at the end of June 2017, ICBC (Almaty) recorded total assets of USD262 million and net assets of USD55 million. It generated a net profit of USD4.30 million during the first half of the year.
INDUSTRIAL AND COMMERCIAL BANK OF CHINA (NEW ZEALAND) LIMITED
ICBC (New Zealand), a wholly-owned subsidiary of the Bank in New Zealand, has a paid-up capital of NZD145.46 million. ICBC (New Zealand) provides corporate and personal banking services such as account management, transfer and remittance, international settlement, trade finance, corporate credit, residential mortgages and credit card business. As at the end of June 2017, ICBC (New Zealand) recorded total assets of USD833 million and net assets of USD104 million. It generated a net profit of USD0.69 million during the first half of the year.
ICBC (LONDON) PLC
ICBC (London), an ICBC’s wholly owned subsidiary, was incorporated in the United Kingdom with a paid-up capital of USD200 million. It provides banking services such as deposit and exchange, loan, trade finance, international settlement, funds clearing, agency, foreign exchange trading and retail banking services. As at the end of June 2017, ICBC (London) recorded total assets of USD2,518 million and net assets of USD386 million. It generated a net profit of USD8.68 million during the first half of the year.
INDUSTRIAL AND COMMERCIAL BANK OF CHINA (EUROPE) S.A.
ICBC (Europe), an ICBC’s wholly owned subsidiary, was incorporated in Luxembourg with a paid-up capital of EUR437 million. It has several institutions including Paris Branch, Amsterdam Branch, Brussels Branch, Milan Branch, Madrid Branch and Warsaw Branch, which mainly offer financial services including loan, trade finance, settlement, treasury, investment banking, custody, and franchise wealth management. As at the end of June 2017, ICBC (Europe) recorded total assets of USD8,285 million and net assets of USD685 million. It generated a net profit of USD2.32 million during the first half of the year.
BANK ICBC (JOINT STOCK COMPANY)
Bank ICBC (JSC), an ICBC’s wholly owned subsidiary, was incorporated in Russia with a share capital of RUB10.81 billion. Bank ICBC (JSC) provides a full range of corporate and personal banking services including corporate and project loan, trade finance, deposit, settlement, securities brokerage, custody, franchise treasury business and securities trading, foreign currency exchange, global cash management, investment banking and corporate financial consultation. As at the end of June 2017, Bank ICBC (JSC) recorded total assets of USD861 million and net assets of USD250 million. It generated a net profit of USD8.80 million during the first half of the year.
INDUSTRIAL AND COMMERCIAL BANK OF CHINA (USA) NA
ICBC (USA), an ICBC’s controlled subsidiary in the United States, has a paid-up capital of USD309 million, in which the Bank holds an 80% stake. It holds a full-functional commercial banking license registered in the UFIQAC and is a member of Federal Deposit Insurance Corporation. ICBC (USA) provides a full range of corporate and consumer retail banking products and services including deposits, loans, settlement and remittance services, trade finance, cross-border settlements, cash management services, internet banking and bank card. As at the end of June 2017, its assets totaled USD2,138 million and net asset USD330 million. ICBC (USA) generated a net profit of USD8.75 million during the first half of the year.

43
Discussion and Analysis
I n t e r i m R e p o r t 2 0 1 7
INDUSTRIAL AND COMMERCIAL BANK OF CHINA FINANCIAL SERVICES LLC
ICBCFS, an ICBC’s wholly owned subsidiary in the United States, has a paid-up capital of USD50.00 million. With a focus on securities clearing business in Europe and America, ICBCFS offers institutional customers securities brokerage services such as securities clearing, clearing and financing. At the end of June 2017, ICBCFS recorded total assets of USD39,851 million and net assets of USD154 million. It generated a net profit of USD14.60 million during the first half of the year.
INDUSTRIAL AND COMMERCIAL BANK OF CHINA (CANADA)
ICBC (Canada) is an ICBC’s subsidiary in Canada with a paid-up capital of CAD158.00 million, in which ICBC holds an 80% stake. With a full-functional commercial banking license, ICBC (Canada) provides various corporate and retail banking services such as deposit, loan, settlement, remittance, trade finance, foreign exchange trading, funds clearing, cross-border RMB settlement, RMB currency notes, cash management, E-banking, bank card and investment and financing consultation. As at the end of June 2017, ICBC (Canada) recorded total assets of USD1,446 million and net assets of USD180 million. It generated a net profit of USD7.84 million during the first half of the year.
INDUSTRIAL AND COMMERCIAL BANK OF CHINA (ARGENTINA) S.A.
ICBC (Argentina), an ICBC’s controlled subsidiary in Argentina, has a share capital of ARS1,345 million, in which the Bank holds an 80% stake. With a full-functional commercial banking license, ICBC (Argentina) provides a full range of commercial banking services including working capital loan, syndicated loan, structured financing, trade finance, personal loan, auto loan, spot/forward foreign exchange trading, financial markets, cash management, investment banking, bond underwriting, asset custody, leasing, international settlement, E-banking, credit card and asset management. As at the end of June 2017, ICBC (Argentina) recorded total assets of USD5,042 million and net assets of USD633 million. It generated a net profit of USD69.44 million during the first half of the year.
INDUSTRIAL AND COMMERCIAL BANK OF CHINA (BRASIL) S.A.
ICBC (Brasil), a wholly-owned subsidiary of the Bank in Brazil, has a paid-up capital of BRL202 million. ICBC (Brasil) offers commercial banking and investment banking services such as deposit, loan, trade finance, international settlement, fund transaction, franchise wealth management and financial advisory. As at the end of June 2017, ICBC (Brasil) recorded total assets of USD273 million and net assets of USD66 million. It generated a net profit of USD0.62 million during the first half of the year.
ICBC PERU BANK
ICBC (Peru), an ICBC’s wholly owned subsidiary in Peru, has a paid-up capital of USD50.00 million. Holding a full-functional commercial banking license, ICBC (Peru) offers a wide range of services including corporate deposit, loan, financial leasing, international settlement, trade finance, foreign exchange trading and E-banking. As at the end of June 2017, ICBC (Peru) recorded total assets of USD134 million and net assets of USD32 million. It generated a net profit of USD2.90 million during the first half of the year.
INDUSTRIAL AND COMMERCIAL BANK OF CHINA MEXICO S.A.
ICBC (Mexico), an ICBC’s wholly owned subsidiary in Mexico, has a paid-up capital of MXN664 million. Holding a full-functional commercial banking license, ICBC (Mexico) offers corporate deposit, loan, international settlement, trade finance, foreign exchange trading and other services. It started business in June 2016. As at the end of June 2017, ICBC (Mexico) recorded total assets of USD95 million and net assets of USD28 million.
Discussion and Analysis
44
ICBC TURKEY BANK ANONIM SIRKETI
ICBC (Turkey), an ICBC’s controlled subsidiary in Turkey, has a share capital of TRY860 million, in which ICBC holds a 92.84% stake. With licenses for commercial banking, investment banking and asset management, ICBC (Turkey) provides corporate customers with integrated financial services including deposit, project loan, syndicated loan, trade finance, small and medium-sized enterprise loan, investment and financing advisory services, securities brokerage and asset management. At the same time, it provides personal customers with financial services such as deposit, personal consumption loan, residential mortgages, credit card and E-banking. As at the end of June 2017, ICBC (Turkey) recorded total assets of USD3,047 million and net assets of USD316 million. It generated a net profit of USD12.96 million during the first half of the year.
ICBC STANDARD BANK PLC
ICBC Standard Bank, an ICBC’s controlled subsidiary in the United Kingdom, has an issued share capital of USD1,083 million, in which the Bank holds a 60% stake directly. ICBC Standard Bank mainly engages in global commodity trading businesses such as base metals, precious metals, bulk commodities and energy. It also provides global financial markets services such as exchange rate, interest rate, unsecured products and equities. As at the end of June 2017, ICBC Standard Bank recorded total assets of USD23,413 million and net assets of USD1,253 million. It generated a net profit of USD9.39 million during the first half of the year.
� Major Domestic Subsidiaries
ICBC CREDIT SUISSE ASSET MANAGEMENT CO., LTD.
ICBC Credit Suisse Asset Management, a subsidiary of the Bank, has a paid-up capital of RMB200 million, in which the Bank holds an 80% stake. It mainly engages in fund placement, fund distribution, asset management and such other businesses as approved by CSRC, and owns many business qualifications including public fund, QDII, enterprise annuity, specific asset management, domestic and overseas investment manager of social security fund, RQFII, insurance asset management, special asset management, occupational annuity, manager of basic pension insurance investment. It is one of the fund companies with “full-qualification” in the industry. As at the end of June 2017, ICBC Credit Suisse Asset Management managed a total of 110 public funds and nearly 600 enterprise annuity accounts and special accounts as well as special portfolios, with the assets under management approaching RMB1.4 trillion, and recorded total assets of RMB6,732 million and net assets of RMB5,405 million. It generated a net profit of RMB943 million during the first half of the year.
ICBC FINANCIAL LEASING CO., LTD.
ICBC Leasing, a wholly-owned subsidiary of the Bank, has a paid-up capital of RMB11.0 billion. It mainly engages in financial leasing of large-scale equipment in key fields such as aviation, shipping, energy and power, rail transit and equipment manufacturing and provides a variety of financial and industrial services including retail assignment, investment funds, securitization of investment assets, assets transactions and management. It has become a financial leasing company with the strongest comprehensive strength in China. As at the end of June 2017, ICBC Leasing recorded total assets of RMB308,259 million and net assets of RMB27,638 million. It generated a net profit of RMB1,619 million during the first half of the year.
ICBC-AXA ASSURANCE CO., LTD.
ICBC-AXA, a subsidiary of the Bank, has a paid-up capital of RMB8,705 million, in which the Bank holds a 60% stake. It engages in a variety of insurance businesses such as life insurance, health insurance and accident insurance, and re-insurance of these businesses, businesses in which use of insurance capital is permitted by laws and regulations of the State, and other businesses approved by China Insurance Regulatory Commission. As at the end of June 2017, ICBC-AXA recorded total assets of RMB124,030 million and net assets of RMB8,541 million. It generated a net profit of RMB268 million during the first half of the year.
45
Discussion and Analysis
I n t e r i m R e p o r t 2 0 1 7
� Majority Equity Participation Company
STANDARD BANK GROUP LIMITED
Standard Bank is the largest commercial bank in Africa. Its scope of business covers commercial banking, investment banking, life insurance business and other areas. The Bank holds 20.08% ordinary shares of Standard Bank, and the two banks engage in cooperation and communication frequently. As at the end of June 2017, Standard Bank recorded total assets of ZAR1,952,519 million and net assets of ZAR183,817 million. It generated a net profit attributable to ordinary shareholders of ZAR12,340 million during the first half of the year.
IT-based Banking Development
The Bank continued to enhance the production and operation service system. It reinforced group-wide integrated management of production and operation, accelerated the construction of business system monitoring and intelligent operation maintenance platform and effected automation of changes and emergency responses. It performed the local switch of information systems and improved the practical capability of ensuring business continuity after local takeover. The Bank encouraged the implementation of the PRC Cyber-safety Law in the Bank, continued to improve the overall security system, built the network and information safety notification mechanism, optimized the network and information safety technological system, and took effective measures against risk events involving global outbreak of ransomware attack. No material production incident or information safety incident took place in the Group.
Technologies supported business and service innovation. Adhering to the e-ICBC strategy, the Bank continued to promote innovation in internet-based finance and push forward the building and integration of ICBC Mobile, ICBC Link and ICBC Mall. It unified the “ICBC e Payment” brand and consolidated various signature verification methods, e.g. using payment password, U-Shield, password device and SMS. The Bank moved ahead in API reform and migration of the new-generation regional featured business platform to prop up the development of featured businesses at branches. While continuously promoting the building of international and diversified business systems, the Bank provided scientific and technological support for relevant overseas institutions since they acted as the RMB clearing bank of host countries and engaged in global market securities trading business.
The Bank set up seven innovation labs in order to strengthen research and application of new technologies. It deepened the mining and application of big data and made progress in application of big data-based findings in the fields of customer insight and value enhancement, precise marketing and service management, risk monitoring and control, and channel synergy and management. Using the block chain technology, it developed the Guizhou Anti-poverty Fund Block Chain Platform, realizing transparent review and approval of funding for poverty alleviation projects. It set up an open, safe and expandable “ICBC Internet of Things Service Platform” to effectively control post-lending risk. It enabled the identification of parties related to customer risks via artificial intelligence technology to heighten monitoring of credit risk. And it adopted face recognition and video authentication technologies to support the integrated account opening by micro, small and medium-sized enterprises both online and offline.
In the first half of 2017, the Bank obtained 25 patents from the State Intellectual Property Office, and the total number of patents owned by the Bank increased to 480, including 225 patents for inventions granted by the State Intellectual Property Office and 255 patents for utility model and product design patents granted by the State Intellectual Property Office.
Discussion and Analysis
46
Human Resources Management
To echo bank-wide operation transformation, reform and development, the Bank carried forward the innovation in the Group’s human resources management system and mechanism, deepened the officer system reform, improved the organizational structure management, optimized the staffing, reinforced the remuneration incentives and restraints, strengthened building of key talent teams, expanded career growth platform of staff and provided strong organizational guarantee and talent support for the whole bank’s reform and development.
The Bank set up the Inclusive Finance Department at the Head Office and all tier-one branches that are directly controlled by the Head Office, and established small and micro enterprise banking centers at tier-two branches or key sub-branches at an opportune time to further enhance the capabilities of serving real economy.
The Bank has comprehensively built the “ICBC University” that addresses the Group’s development strategy and staff team building by coordinating domestic and overseas, online and offline resources, and offering training for all staff and professional talent cultivation. It promoted the building of “Competency Training System” and “Online University System”, constructed a diversified, integrated overseas staff training system, kept pace with the times to reinforce building of Party school training system, stepped up business adaptability training, optimized the professional aptitude test certification system and laid a solid foundation for the training resource guarantee system. In the first half of 2017, the Bank organized 24 thousand sessions of training for 2.08 million employees, averaging to approximately 3.86 days of training per employee.
The Bank continued to deepen corporate culture building and built the consensus on innovation-driven development. With enrichment and development of the Group’s cultural concepts at the core, the Bank vigorously advocated and exercised the “Craftsmanship” mindset and raised the awareness of “Act”. It strengthened the sub-cultures of “Innovation, Honesty, Compliance and Service” and embedded such cultures into operations management. It actively encouraged the planting of corporate culture at grassroots operations, comprehensive subsidiaries and overseas institutions. The Bank established a three-dimensional whole-media platform to publicize, communicate and showcase its culture via official public account of WeChat, ICBC Link and authoritative media.
47
Discussion and Analysis
I n t e r i m R e p o r t 2 0 1 7
RISK MANAGEMENT
Enterprise Risk Management System
In the first half of 2017, the Bank continued to enhance the Group’s risk management, improved the enterprise risk management system, and made risk management more forward-looking. It implemented the latest regulatory requirements, revised the basic policies on enterprise risk management, better managed the related work of Global Systemically Important Banks, and advanced the building of stress testing management system. It strengthened consolidated risk management of the Group and the risk management and monitoring reporting of subsidiaries. It reinforced the tracking of important country risk events and the related risk warning and sharpened the capacity to manage the country risk. It enhanced the management over market risk limits and the centralized management over product control, pushed forward the extension and application of the global market risk management system, and improved the management over the Group’s market risk. It enhanced the risk management over wealth management. In addition, it continuously pressed forward with the application of advanced approaches for capital management, refined the relevant measurement approaches and tools, enhanced the risk measurement model monitoring, further improved the relevant data quality management, advanced the upgrading and transformation of its system and the system’s overseas extension, and reinforced the application of risk measurement results.
Credit Risk
Credit Risk Management
In the first half of 2017, the Bank stuck to providing financial support to the real economy, and pushed forward the management of the “Two Major Projects” over credit quality and credit foundation to improve its capacity to control credit risk and boost its business efficiency simultaneously.
The Bank strengthened the formation of the credit rule framework and consolidated the management over credit base. It actively implemented the Notice on Further Strengthening Credit Risk Management of the CBRC and other regulatory requirements, and further improved the regulations and measures for credit risk management. It continuously enhanced the global unified credit extension management, and controlled the aggregate customer financing risk. It refined the rules on credit products and the business management requirements, improved the business management and better satisfied the demand of customers for financing. It also further standardized the management over collateral and guarantees, refined system setting and determined reasonable access standards for qualified collateral to better manage loan guarantees.
The Bank constantly adjusted and improved industrial credit policy in accordance with the macroeconomic policy, the prevailing trends of industry policy and the characteristics of the operation of the industry as well as the important national strategic initiatives. Conforming to the industrial policy system of “18 segments + key sub-industries”, the Bank strengthened the industrial investment layout, highlighted strategies of key areas and quality customers. While supporting leading industrial enterprises and their transformation and upgrading demands, it continuously improved the industrial credit structure, further stressed the strategic orientation of credit policy, and promoted the guidance, practicality and operability of industrial credit policy.
The Bank strengthened risk management of the real estate industry. It adjusted and refined the management over city classification in property loans, supported the financing demands of real estate development projects of key regions and large and quality customers, and steadily advanced the financing for shantytown renovation as a part of the government service procurement projects. It also prudently granted new housing development loans to tier-3 and tier-4 cities with long de-stocking period and strictly controlled loans to commercial property development and commercial shantytown renovation.
The Bank strengthened risk management in relation to trade finance. It systemically refined the trade finance product system, further adjusted, improved and integrated various trade finance products and formulated operational rules on domestic trade finance in accordance with the features of credit risk control, thereby consolidating the risk management base of trade finance.

Discussion and Analysis
48
The Bank strengthened credit risk management of small enterprises. It increased the number of small and micro enterprise banking centers and expanded the coverage of the specialized operation of small and micro banking. It accelerated the building of the management system for the small and micro enterprise banking risk, pushed forward the formulation of overall market planning and regional market planning, and better controlled the admission of customers to ensure the asset quality of small enterprise customers. It conducted cross-checks of the information about the real conditions of these customers from multiple channels both inside and outside the Bank, enhanced the unified credit management in relation to connected customers to guard against the excessive financing risk. It created a management platform for risk early warning of credit to small and micro enterprises by applying the big data technology and pushed forward a post-lending management model focusing on offsite monitoring and supplemented by onsite examination.
The Bank enhanced risk management of personal loans. It improved and adjusted the basic procedures for personal loans, created a review and approval model fitting the business features of personal loans, and reinforced the system control in position setting, loan conditions and cross defaults. It continued to strengthen the management over the Bank’s acceptance, early warning of and termination of relationship with its partners in personal loan business to guard against the external risk. It diversified and improved the monitoring and early warning model for risk monitoring for personal loans by employing the big data methods and concepts to give sufficient warning and revelation of the credit risk so as to prevent and control it. With different measures for varied customers, the Bank improved the quality and effect of NPL collection and recovery, implemented the securitization of personal NPLs, and advanced the resolution and disposition of personal loan risk with market-based approaches.
The Bank enhanced risk management of credit card business. It revised the administrative measures for grant of credit facility to personal customers, established a credit system based on the characteristics of customer groups, took into full consideration the multi-dimensional information of customers for precise credit extension, and implemented the centralized reform of credit extension in unsecured asset business step by step, thereby increasing the efficiency of approval and controlling the credit risk exposure. It accelerated the setting up of the big data risk control model and system for ICBC credit cards, and further sharpened its risk early warning capacity. It investigated the risks of existing card customers with high credit lines and adjusted their credit lines accordingly, and improved the credit extension structure of existing credit card customers so as to effectively control substantial risks. It took out a new post-lending management model, and resolved non-performing assets from various channels.
The Bank improved credit risk management of treasury operations. It further improved credit risk monitoring and analysis mechanism for treasury operations, enhanced the pre-investment screening and credit risk analysis and judgment, to control the access threshold for the SPV investment business. It better monitored and investigated risks and enhanced the risk management for the duration of businesses. It proactively improved the structure of bond investment portfolio in line with current trends on domestic and international financial markets, continued to maintain high-quality unsecured bond investment, and strived to mitigate the credit risk of bond investment portfolio.

49
Discussion and Analysis
I n t e r i m R e p o r t 2 0 1 7
Credit Risk Analysis
As at the end of June 2017, the Bank’s maximum credit risk exposures without taking account of any collateral and other credit enhancements reached RMB27,962,424 million, representing an increase of RMB1,724,880 million over the end of the previous year. Please refer to “Note 47.(a)(i) to the Financial Statements: Details of the Bank’s Maximum Exposure to Credit Risk Without Taking Account of Any Collateral and Other Credit Enhancements”. For mitigated risk exposures of credit risk asset portfolio of the Bank, please refer to the “Information Disclosed Pursuant to the Capital Regulation”.
DISTRIBUTION OF LOANS BY FIVE-CATEGORY CLASSIFICATIONIn RMB millions, except for percentages
At 30 June 2017 At 31 December 2016
Item AmountPercentage
(%) AmountPercentage
(%)
Pass 13,107,689 94.53 12,261,034 93.91
Special mention 541,148 3.90 584,011 4.47
NPLs 217,072 1.57 211,801 1.62
Substandard 104,850 0.76 109,434 0.84
Doubtful 92,874 0.67 82,505 0.63
Loss 19,348 0.14 19,862 0.15
Total 13,865,909 100.00 13,056,846 100.00
Loan quality showed improvement signs. As at the end of June 2017, according to the five-category classification, pass loans amounted to RMB13,107,689 million, representing an increase of RMB846,655 million from the end of the previous year and accounting for 94.53% of total loans. Special mention loans amounted to RMB541,148 million, representing a decrease of RMB42,863 million and accounting for 3.90% of total loans, dropping 0.57 percentage point. NPLs registered RMB217,072 million, representing an increase of RMB5,271 million, dropping by RMB11,514 million compared with the increase of the same period of last year. The NPL ratio was 1.57%, representing a decrease of 0.05 percentage point.
DISTRIBUTION OF LOANS AND NPLS BY BUSINESS LINEIn RMB millions, except for percentages
Item
At 30 June 2017 At 31 December 2016
LoanPercentage
(%) NPLsNPL ratio
(%) LoanPercentage
(%) NPLsNPL ratio
(%)
Corporate loans 8,927,631 64.4 169,506 1.90 8,140,684 62.4 159,871 1.96
Discounted bills 363,087 2.6 605 0.17 719,993 5.5 598 0.08
Personal loans 4,575,191 33.0 46,961 1.03 4,196,169 32.1 51,332 1.22
Total 13,865,909 100.0 217,072 1.57 13,056,846 100.0 211,801 1.62
The balance of non-performing corporate loans stood at RMB169,506 million, increasing by RMB9,635 million from the end of the previous year, and NPL ratio was 1.90%, declining by 0.06 percentage point. The balance of non-performing personal loans stood at RMB46,961 million, decreasing by RMB4,371 million, and NPL ratio was 1.03%, declining by 0.19 percentage point.

Discussion and Analysis
50
DISTRIBUTION OF CORPORATE LOANS AND NON-PERFORMING CORPORATE LOANS OF DOMESTIC BRANCHES BY INDUSTRY
In RMB millions, except for percentages
Item
At 30 June 2017 At 31 December 2016
LoanPercentage
(%) NPLsNPL ratio
(%) LoanPercentage
(%) NPLsNPL ratio
(%)
Transportation, storage and postal services
1,643,482 21.9 5,167 0.31 1,516,089 21.8 3,022 0.20
Manufacturing 1,470,551 19.5 64,838 4.41 1,414,408 20.4 60,639 4.29
Production and supply of electricity, heat, gas and water
889,429 11.8 617 0.07 820,692 11.9 501 0.06
Leasing and commercial services
864,223 11.5 6,417 0.74 736,921 10.7 4,938 0.67
Water, environment and public utility management
644,446 8.6 1,471 0.23 517,542 7.5 1,302 0.25
Wholesale and retail 629,756 8.4 56,958 9.04 625,488 9.0 58,029 9.28
Real estate 486,341 6.5 10,302 2.12 426,999 6.2 9,367 2.19
Mining 226,684 3.0 4,097 1.81 225,505 3.3 4,425 1.96
Construction 213,630 2.8 3,248 1.52 187,363 2.7 4,222 2.25
Science, education, culture and sanitation
124,099 1.7 895 0.72 122,294 1.8 675 0.55
Lodging and catering 113,685 1.5 3,129 2.75 122,117 1.8 2,742 2.25
Others 207,721 2.8 4,362 2.10 197,119 2.9 2,456 1.25
Total 7,514,047 100.0 161,501 2.15 6,912,537 100.0 152,318 2.20
In the first half of 2017, the Bank made more efforts to serve the development of the real economy, actively followed major national development strategies, strived to satisfy the loan demand of investment projects in national key areas, and continuously stepped up efforts to improve and adjust the allocation of credits to industries. Loans to the transportation, storage and postal services increased by RMB127,393 million or 8.4%, mainly driven by the fast increase in the country’s investment in the highways in the first half of the year. Loans to the leasing and commercial services also showed an increase of RMB127,302 million or 17.3%, mainly due to the rapid growth of loans for investment and asset management and other commercial services. Loans for water, environment and public utility management increased by RMB126,904 million or 24.5%, which was mainly used to support construction projects of major water conservancy, environment and municipal facilities.
The balance of NPLs of the manufacturing industry had a relatively higher increase, mainly due to the impact of the slowing macro-economy, insufficient market demands, production overcapacity and increasing resources and environmental constraints on some light, chemical and building materials industries and the loan defaults of some enterprises in those industries as a result of more fierce competition and declining profitability.

51
Discussion and Analysis
I n t e r i m R e p o r t 2 0 1 7
DISTRIBUTION OF LOANS AND NPLS BY GEOGRAPHIC AREAIn RMB millions, except for percentages
Item
At 30 June 2017 At 31 December 2016
LoanPercentage
(%) NPLsNPL ratio
(%) LoanPercentage
(%) NPLsNPL ratio
(%)
Head Office 572,411 4.1 13,644 2.38 581,084 4.5 13,758 2.37
Yangtze River Delta 2,539,633 18.3 31,227 1.23 2,409,725 18.4 35,325 1.47
Pearl River Delta 1,838,940 13.3 35,423 1.93 1,743,572 13.4 35,913 2.06
Bohai Rim 2,298,380 16.6 44,198 1.92 2,156,022 16.5 41,097 1.91
Central China 1,945,628 14.0 32,495 1.67 1,819,143 13.9 28,575 1.57
Western China 2,439,370 17.6 37,360 1.53 2,313,507 17.7 37,623 1.63
Northeastern China 719,954 5.2 14,286 1.98 706,472 5.4 11,571 1.64
Overseas and others 1,511,593 10.9 8,439 0.56 1,327,321 10.2 7,939 0.60
Total 13,865,909 100.0 217,072 1.57 13,056,846 100.0 211,801 1.62
CHANGES IN ALLOWANCE FOR IMPAIRMENT LOSSES ON LOANSIn RMB millions
Individually assessed
Collectively assessed Total
At the beginning of the period 65,557 223,955 289,512
Charge for the period 54,652 6,349 61,001
Including: Impairment allowances charged 77,906 80,806 158,712
Reversal of impairment allowances (23,254) (74,457) (97,711)
Accreted interest on impaired loans (1,632) – (1,632)
Write-offs (25,453) (7,889) (33,342)
Recoveries of loans and advances previously written off 606 368 974
At the end of the period 93,730 222,783 316,513
As at the end of June 2017, the allowance for impairment losses on loans stood at RMB316,513 million, representing an increase of RMB27,001 million as compared to the end of last year. Allowance to NPL was 145.81%, representing an increase of 9.12 percentage points; allowance to total loans was 2.28%.
DISTRIBUTION OF LOANS BY COLLATERALIn RMB millions, except for percentages
At 30 June 2017 At 31 December 2016
Item AmountPercentage
(%) AmountPercentage
(%)
Loans secured by mortgages 6,284,856 45.3 5,986,629 45.9
Including: Residential mortgages 3,639,794 26.2 3,237,427 24.8
Pledged loans 1,330,808 9.6 1,610,680 12.3
Including: Discounted bills 363,087 2.6 719,993 5.5
Guaranteed loans 2,073,036 15.0 1,867,424 14.3
Unsecured loans 4,177,209 30.1 3,592,113 27.5
Total 13,865,909 100.0 13,056,846 100.0

Discussion and Analysis
52
OVERDUE LOANSIn RMB millions, except for percentages
Overdue periods
At 30 June 2017 At 31 December 2016
Amount% of total
loans Amount% of total
loans
Less than 3 months 112,250 0.81 151,115 1.16
3 months to 1 year 67,339 0.49 75,550 0.58
1 to 3 years 107,923 0.78 101,916 0.78
Over 3 years 21,104 0.15 17,546 0.13
Total 308,616 2.23 346,127 2.65
Note: Loans and advances to customers are deemed overdue when either the principal or interest is overdue. For loans and advances to customers repayable by installments, the total amount of loans is deemed overdue if part of the installments is overdue.
Overdue loans stood at RMB308,616 million, representing a decrease of RMB37,511 million from the end of the previous year. Specifically, loans overdue for over 3 months amounted to RMB196,366 million, representing an increase of RMB1,354 million.
RENEGOTIATED LOANS
Renegotiated loans and advances amounted to RMB5,996 million, representing an increase of RMB455 million as compared to the end of the previous year. Renegotiated loans and advances overdue for over three months amounted to RMB1,681 million, representing an increase of RMB283 million.
BORROWER CONCENTRATION
The total amount of loans granted by the Bank to the single largest customer and top ten single customers accounted for 4.9% and 13.9% of the Bank’s net capital respectively. The total amount of loans granted to the top ten single customers was RMB305,765 million, accounting for 2.2% of the total loans. The table below shows the details of the loans granted to the top ten single borrowers of the Bank as at the end of June 2017.
In RMB millions, except for percentages
Borrower Industry Amount% of total
loans
Borrower A Transportation, storage and postal services 110,384 0.8
Borrower B Transportation, storage and postal services 36,715 0.3
Borrower C Transportation, storage and postal services 34,360 0.3
Borrower D Transportation, storage and postal services 20,809 0.2
Borrower E Transportation, storage and postal services 17,972 0.1
Borrower F Transportation, storage and postal services 17,762 0.1
Borrower G Transportation, storage and postal services 17,242 0.1
Borrower H Leasing and commercial services 17,000 0.1
Borrower I Transportation, storage and postal services 16,770 0.1
Borrower J Transportation, storage and postal services 16,751 0.1
Total 305,765 2.2

53
Discussion and Analysis
I n t e r i m R e p o r t 2 0 1 7
Risk Management of Asset Management
The Bank enhanced the risk management of asset management. It further refined the policy system for the non-standard agency investment and built a risk management system more accommodating to the features of non-standard agency investments on equity fund, debts and fund portfolios which takes into account the underlying asset type, structure of transactions and risk features. It adjusted and improved the authorization plan for credit risk in non-standard agency investment and fully considered the differences between agency investment and principal credit business in risk features. It also understood the risk nature and strengthened the risk control of agency investment so as to effectively promote the healthy development of asset management.
Market Risk
Market Risk Management of the Banking Book
The Bank actively improved the market risk management system for the banking book and further increased interest rate and currency risk management and measurement capability of the Group. It focused on adopting steady and prudent interest rate risk appetite, comprehensively utilized interest rate limit system management, term structure management, internal and external pricing management, hedging management and other instruments to effectively control the Group’s interest rate risk, taking interest rate risk management strategies and the business development conditions into consideration.
Market Risk Management of the Trading Book
The Bank continued to strengthen and improve risk management and product control of the trading book by adopting multiple methods including value at risk (VaR) measurement, stress testing, sensitivity analysis, exposure analysis and limit monitoring to measure and manage products in the trading book. The Bank further improved the market risk limit management system based on trading portfolios, revised the limit approval procedures, innovated limit approval approaches, made limit setting more scientific by applying an approach combining qualitative and quantitative analysis, and realized fast and flexible monitoring and dynamic adjustment of limits with the help of its Global Market Risk Management (GMRM) system. For VaR of the trading book of the Bank, please refer to “Note 47. (c)(i) to the Financial Statements: Value at Risk (VaR)”.
Market Risk Analysis
� Interest Rate Risk Analysis
In the first half of 2017, the Bank made scientific analysis and judgment of the trends of the macro economy and the market interest rates, improved the interest rate risk management transmission mechanism for the Group by formulating a three-tier limit management system, and continued to sharpen its internal and external pricing ability and its ability to manage the term structure of assets and liabilities to ensure the realization of interest rate risk management target.
As at the end of June 2017, the Bank had a negative cumulative interest rate risk gap within one year of RMB32,028 million, representing a decrease of RMB388,667 million from the end of the previous year, which was mainly caused by the increase of loans and advances to customers and placements with and lendings to banks and other financial institutions being re-priced or maturing within one year. Interest rate risk over one year had a positive gap of RMB1,647,538 million, representing a decrease of RMB371,277 million, mainly due to the increase in customer deposits maturing over one year. The structure of the Bank’s interest rate risk exposure according to the contractual repricing date or maturity date (whichever is earlier) is shown in the following table:
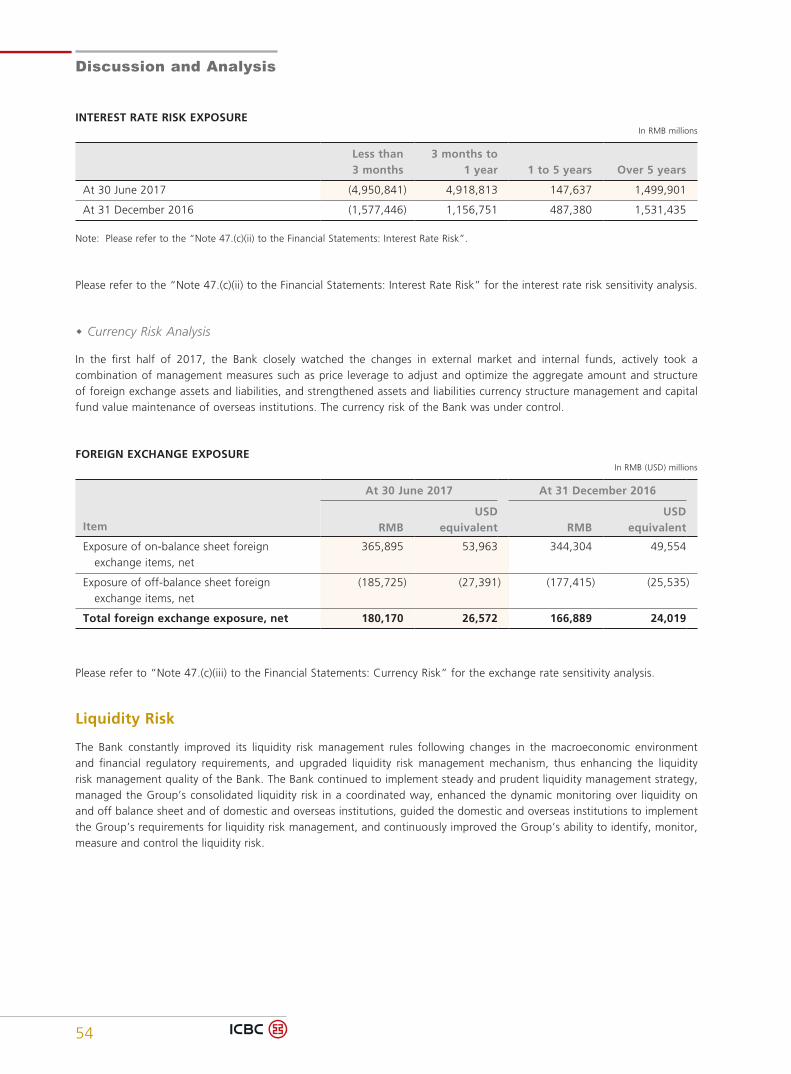
Discussion and Analysis
54
INTEREST RATE RISK EXPOSUREIn RMB millions
Less than3 months
3 months to1 year 1 to 5 years Over 5 years
At 30 June 2017 (4,950,841) 4,918,813 147,637 1,499,901
At 31 December 2016 (1,577,446) 1,156,751 487,380 1,531,435
Note: Please refer to the “Note 47.(c)(ii) to the Financial Statements: Interest Rate Risk”.
Please refer to the “Note 47.(c)(ii) to the Financial Statements: Interest Rate Risk” for the interest rate risk sensitivity analysis.
� Currency Risk Analysis
In the first half of 2017, the Bank closely watched the changes in external market and internal funds, actively took a combination of management measures such as price leverage to adjust and optimize the aggregate amount and structure of foreign exchange assets and liabilities, and strengthened assets and liabilities currency structure management and capital fund value maintenance of overseas institutions. The currency risk of the Bank was under control.
FOREIGN EXCHANGE EXPOSUREIn RMB (USD) millions
Item
At 30 June 2017 At 31 December 2016
RMBUSD
equivalent RMBUSD
equivalent
Exposure of on-balance sheet foreign exchange items, net
365,895 53,963 344,304 49,554
Exposure of off-balance sheet foreign exchange items, net
(185,725) (27,391) (177,415) (25,535)
Total foreign exchange exposure, net 180,170 26,572 166,889 24,019
Please refer to “Note 47.(c)(iii) to the Financial Statements: Currency Risk” for the exchange rate sensitivity analysis.
Liquidity Risk
The Bank constantly improved its liquidity risk management rules following changes in the macroeconomic environment and financial regulatory requirements, and upgraded liquidity risk management mechanism, thus enhancing the liquidity risk management quality of the Bank. The Bank continued to implement steady and prudent liquidity management strategy, managed the Group’s consolidated liquidity risk in a coordinated way, enhanced the dynamic monitoring over liquidity on and off balance sheet and of domestic and overseas institutions, guided the domestic and overseas institutions to implement the Group’s requirements for liquidity risk management, and continuously improved the Group’s ability to identify, monitor, measure and control the liquidity risk.
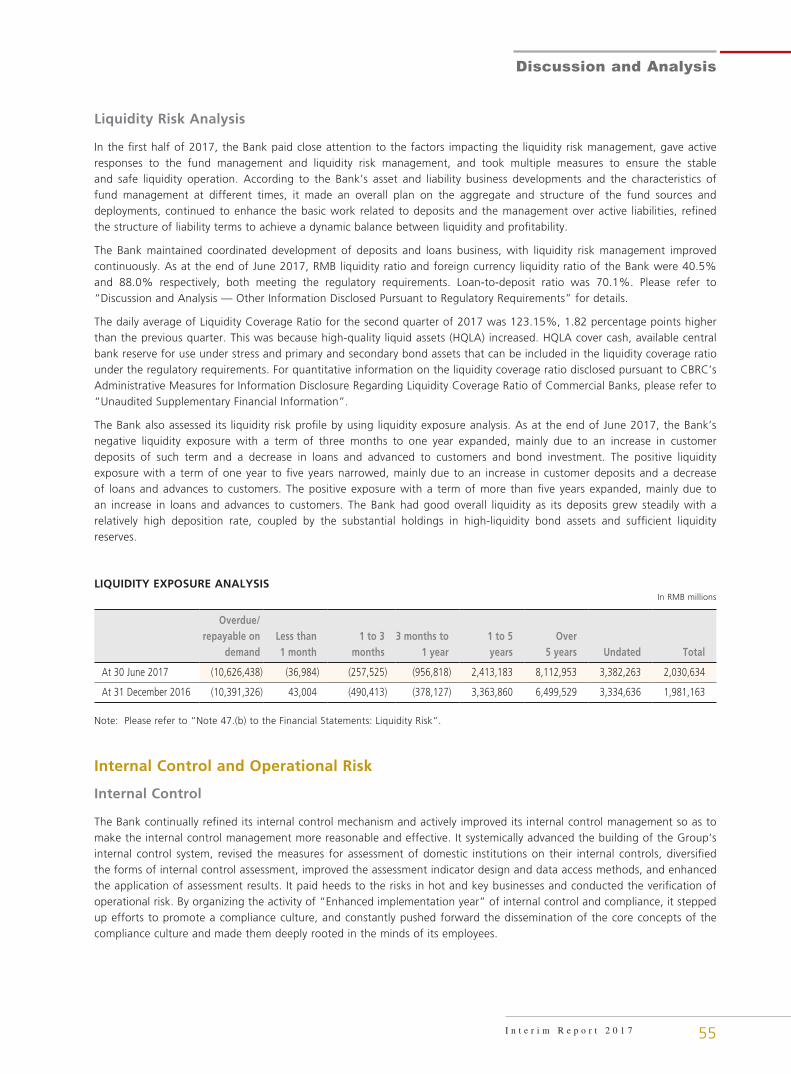
55
Discussion and Analysis
I n t e r i m R e p o r t 2 0 1 7
Liquidity Risk Analysis
In the first half of 2017, the Bank paid close attention to the factors impacting the liquidity risk management, gave active responses to the fund management and liquidity risk management, and took multiple measures to ensure the stable and safe liquidity operation. According to the Bank’s asset and liability business developments and the characteristics of fund management at different times, it made an overall plan on the aggregate and structure of the fund sources and deployments, continued to enhance the basic work related to deposits and the management over active liabilities, refined the structure of liability terms to achieve a dynamic balance between liquidity and profitability.
The Bank maintained coordinated development of deposits and loans business, with liquidity risk management improved continuously. As at the end of June 2017, RMB liquidity ratio and foreign currency liquidity ratio of the Bank were 40.5% and 88.0% respectively, both meeting the regulatory requirements. Loan-to-deposit ratio was 70.1%. Please refer to “Discussion and Analysis — Other Information Disclosed Pursuant to Regulatory Requirements” for details.
The daily average of Liquidity Coverage Ratio for the second quarter of 2017 was 123.15%, 1.82 percentage points higher than the previous quarter. This was because high-quality liquid assets (HQLA) increased. HQLA cover cash, available central bank reserve for use under stress and primary and secondary bond assets that can be included in the liquidity coverage ratio under the regulatory requirements. For quantitative information on the liquidity coverage ratio disclosed pursuant to CBRC’s Administrative Measures for Information Disclosure Regarding Liquidity Coverage Ratio of Commercial Banks, please refer to “Unaudited Supplementary Financial Information”.
The Bank also assessed its liquidity risk profile by using liquidity exposure analysis. As at the end of June 2017, the Bank’s negative liquidity exposure with a term of three months to one year expanded, mainly due to an increase in customer deposits of such term and a decrease in loans and advanced to customers and bond investment. The positive liquidity exposure with a term of one year to five years narrowed, mainly due to an increase in customer deposits and a decrease of loans and advances to customers. The positive exposure with a term of more than five years expanded, mainly due to an increase in loans and advances to customers. The Bank had good overall liquidity as its deposits grew steadily with a relatively high deposition rate, coupled by the substantial holdings in high-liquidity bond assets and sufficient liquidity reserves.
LIQUIDITY EXPOSURE ANALYSISIn RMB millions
Overdue/repayable on
demandLess than 1 month
1 to 3 months
3 months to1 year
1 to 5 years
Over5 years Undated Total
At 30 June 2017 (10,626,438) (36,984) (257,525) (956,818) 2,413,183 8,112,953 3,382,263 2,030,634
At 31 December 2016 (10,391,326) 43,004 (490,413) (378,127) 3,363,860 6,499,529 3,334,636 1,981,163
Note: Please refer to “Note 47.(b) to the Financial Statements: Liquidity Risk”.
Internal Control and Operational Risk
Internal Control
The Bank continually refined its internal control mechanism and actively improved its internal control management so as to make the internal control management more reasonable and effective. It systemically advanced the building of the Group’s internal control system, revised the measures for assessment of domestic institutions on their internal controls, diversified the forms of internal control assessment, improved the assessment indicator design and data access methods, and enhanced the application of assessment results. It paid heeds to the risks in hot and key businesses and conducted the verification of operational risk. By organizing the activity of “Enhanced implementation year” of internal control and compliance, it stepped up efforts to promote a compliance culture, and constantly pushed forward the dissemination of the core concepts of the compliance culture and made them deeply rooted in the minds of its employees.

Discussion and Analysis
56
Operational Risk Management
In accordance with the latest regulatory requirements concerning operational risk and the trends of operational risk in the banking industry, the Bank effectively conducted the scientific and detailed management of operational risks. It conducted campaigns against risks in all major businesses, and advanced the special risk governance campaign regarding ten key areas and key stages. It made strict risk assessment and investigation, reinforced risk monitoring and early warning, alertly guarded against external fraud risk, and seriously punished and held relevant personnel accountable for cases. It enhanced the constraint of liability of performance of obligations related to credit, made a tough whole-process control before, during and after granting loans. It carried out a comprehensive reform on seals across the Bank to control the risk arising from using seals. It strengthened the campaign against data quality issues of domestic and overseas institutions and pressed forward with the integrated identification of domestic and overseas customers of the Group. It made a scientific plan for business outsourcing and enhanced control over the related risks. It revised the management plan for operational risk limits and perfected the closed-loop management of operational risk loss events. It continuously conducted monitoring over key indicators of operational risks and enhanced the application of self-assessment results on operational risk and control. During the reporting period, the operational risk management system of the Bank operated smoothly and the operational risk was controllable on the whole.
Legal Risk
The Bank continued to strengthen legal risk management. It continuously improved both the vertical linkage and horizontal coordination mechanisms between the Head Office and branches, and made the legal risk prevention and control more prospective, proactive and targeted by embedding it into business negotiations, product design, contract execution and other daily operation. The Bank further improved the cross-border coordination and management for legal work and strengthened the legal risk management of overseas institutions, actively responding to cross-border legal issues emerging in the international development.
Anti-money Laundering
In strict compliance with applicable laws and regulations concerning anti-money laundering of China and the host countries (regions) of overseas institutions, the Bank deeply implemented the “risk-based” regulatory requirements in respect of anti-money laundering, earnestly fulfilled the social duties and legal obligations concerning anti-money laundering, and kept enhancing the Group’s risk management level regarding anti-money laundering and anti-terrorist financing. It set up the Anti-Money Laundering Center at the Head Office level to further improve the anti-money laundering management structure of the Group. It pressed ahead with the application of the overseas anti-money laundering system and the compliance review system for sensitive businesses as planned, took multiple measures to strengthen staffing of overseas institutions for anti-money laundering and compliance to continuously consolidate the basis for management of anti-money laundering in overseas institutions. It enhanced the system monitoring, analysis and quality sampling inspection of domestic suspicious transaction reports, and actively assisted the competent authorities in anti-money laundering investigation and funds investigation and control. Moreover, the Bank classified the customer anti-money laundering risks, evaluated the money-laundering risks of new products, and proactively promoted the comprehensive application of the results to various businesses. It implemented special project regarding customer information control and reinforced the prevention and control of money laundering risks and terrorist financing risks in key business areas. Besides, the Bank organized multi-layered anti-money laundering trainings, strengthened the cultivation of anti-money laundering and compliance talents, and improved the compliance consciousness, professionalism and performance capability of anti-money laundering personnel.
57
Discussion and Analysis
I n t e r i m R e p o r t 2 0 1 7
Reputational Risk
The Bank constantly advanced the building of a reputational risk management mechanism and reinforced the governance of the reputational risk sources. It stepped up efforts to apply and improve the reputational risk management system and further improve the IT application in reputational risk management. It conducted reputational risk assessments on new businesses and products, and investigated all potential reputational risks. It performed reputational risk management and protection of consumer rights and interests together, actively responded to the comments and suggestions of the public, expanded the coverage and penetration of reputational risk management, and continued to increase the reputational risk awareness of all the employees. During the reporting period, the Bank’s reputational risk was controllable without the occurrence of any material reputational risk event.
Country Risk
In the first half of 2017, in response to the increasingly complicated international environment, the Bank continued to enhance country risk management. It continuously improved the policies and procedures for country risk management, closely watched changes in country risk exposures, constantly tracked, monitored and reported country risks, and timely updated and adjusted the country risk rating and limits. It also conducted stress tests on country risk actively, strengthened early warning for country risks, and effectively controlled country risks while pushing ahead with the internationalization strategy.
Discussion and Analysis
58
CAPITAL MANAGEMENT
In the first half of 2017, the Bank further deepened the capital management reform and coordinated, allocated and utilized diverse capital resources to optimize the capital utilization. It also intensified the rigid constraint of economic capital on risk-weighted assets and continued to elevate the capital use efficiency and return on capital. During the reporting period, the Bank’s capital indicators maintained sound performance and its capital adequacy ratio was kept at a relatively good level among peers.
Capital Adequacy Ratio and Leverage Ratio
The Bank calculated capital adequacy ratios at all tiers in accordance with the Capital Regulation. According to the scope of implementing the advanced capital management approaches as approved by CBRC, the foundation internal ratings-based (IRB) approach is adopted for corporate credit risk, the IRB approach for retail credit risk, the internal model approach (IMA) for market risk, and the standardized approach for operational risk meeting regulatory requirements. The weighted approach is adopted for credit risk uncovered by the IRB approach and the standardized approach for market risk uncovered by the IMA approach.
As at the end of June 2017, the core tier 1 capital adequacy ratio, tier 1 capital adequacy ratio and capital adequacy ratio stood at 12.67%, 13.19% and 14.46% respectively, all complying with regulatory requirements.

59
Discussion and Analysis
I n t e r i m R e p o r t 2 0 1 7
CAPITAL ADEQUACY RATIOIn RMB millions, except for percentages
ItemAt 30 June
2017At 31 December
2016
Core tier 1 capital 1,934,598 1,886,536
Paid-in capital 356,407 356,407
Valid portion of capital reserve 152,002 151,998
Surplus reserve 205,308 205,021
General reserve 251,767 251,349
Retained profits 1,008,879 940,237
Valid portion of minority interests 2,432 3,164
Others (42,197) (21,640)
Core tier 1 capital deductions 11,063 11,560
Goodwill 8,810 9,001
Other intangible assets other than land use rights 1,157 1,477
Cash flow hedge reserves that relate to the hedging of items that are not fair valued on the balance sheet
(4,604) (4,618)
Investments in core tier 1 capital instruments issued by financial institutions that are under control but not subject to consolidation
5,700 5,700
Net core tier 1 capital 1,923,535 1,874,976
Additional tier 1 capital 79,894 79,794
Additional tier 1 capital instruments and related premium 79,375 79,375
Valid portion of minority interests 519 419
Net tier 1 capital 2,003,429 1,954,770
Tier 2 capital 193,155 178,292
Valid portion of tier 2 capital instruments and related premium 134,863 154,861
Surplus provision for loan impairment 54,954 19,195
Valid portion of minority interests 3,338 4,236
Tier 2 capital deductions 500 5,600
Significant minority investments in tier 2 capital instruments issued by financial institutions that are not subject to consolidation
500 5,600
Net capital base 2,196,084 2,127,462
Risk-weighted assets(2) 15,183,975 14,564,617
Core tier 1 capital adequacy ratio 12.67% 12.87%
Tier 1 capital adequacy ratio 13.19% 13.42%
Capital adequacy ratio 14.46% 14.61%
Notes: (1) Please refer to “Note 47.(d) to the Financial Statements: Capital management”.
(2) Refers to risk-weighted assets after capital floor and adjustments.
For more information of capital measurement of the Bank, please refer to “Information Disclosed Pursuant to the Capital Regulation”.

Discussion and Analysis
60
LEVERAGE RATIOIn RMB millions, except for percentages
Item
At30 June
2017
At31 March
2017
At31 December
2016
At30 September
2016
Net tier 1 capital 2,003,429 2,017,717 1,954,770 1,919,729
Balance of adjusted on- and off-balance sheet assets
27,467,633 26,753,069 25,904,533 25,357,448
Leverage ratio 7.29% 7.54% 7.55% 7.57%
Note: Please refer to “Unaudited Supplementary Financial Information” for details on disclosure of leverage ratio information.
Capital Financing Management
The Bank proactively carried out external capital replenishment and constantly promoted the issuance of new capital instruments on the basis of achieving capital replenishment by retained profits. The Board of Directors of the Bank convened a meeting in March 2016 to review and approve the proposal on the new issuance of write-down eligible tier 2 capital instruments up to RMB88.0 billion equivalent by the end of 2017, which was deliberated and approved by the Shareholders’ General Meeting in June 2016. For the issuance of the tier 2 capital instruments, please refer to the announcements published by the Bank on the websites of SEHK and SSE.

61
Discussion and Analysis
I n t e r i m R e p o r t 2 0 1 7
OUTLOOK
In the second half of 2017, the global economy is expected to continue on the recovery trend, but the complexity, instability and uncertainty features of the economic and financial system may become increasingly prominent. China’s economy moves forward steadily and moderately, and driven by the dual forces of economic structure upgrade and demand improvement, the quality and efficiency of the economy is expected to be further improved.
For the Bank, opportunities and challenges coexist in the external environment. Opportunities are mainly manifested in the following aspects: first, the macroeconomic stability and soundness provide better conditions for the Bank to tap into advanced market and constantly improve asset quality. Second, the deepening of supply-side structural reform and the acceleration of economic transformation inject a stronger impetus into the Bank’s business innovation and transformational development. Third, the rolling-out of national strategies, such as the “four regions”, the “three supporting belts” and the Xiong’an New Area, will help to build a new pattern of regional coordinated development, and provide new opportunities for the Bank to optimize strategic resources and tap the growth potential. Fourth, the improvement of the financial regulatory system and the deepening of financial reform will create a more healthy and orderly market environment.
The main challenges include: first, financial risks become more and more complex in the way they demonstrate and develop, and the contagious and interlocking features of various types of risks are increasingly obvious, posing higher requirements for the Bank’s risk prevention and control. Second, the interweaving of monetary policy differentiation of world’s major economies, the financial disintermediation and interest rate liberalisation in China and other factors put further squeezing pressure on banks’ profitability space, and raise urgent demands for the Bank to cultivate multiple sources of income, and improve pricing and cost control capability. Third, the restructuring of the cross-over competition among banks, internet companies, and Fintech companies forces the Bank to speed up business transformation and service model innovation, consolidate and expand its advantages in diversified competition.
2017 marks the final year of the fourth three-year plan since the Bank’s joint-stock reform. In the first half of this year, the Bank managed to present a better-than-expected performance result against all odds. In the second half of the year, the Bank will adhere to the major tone of seeking progress on the basis of stability, and continue to muster up all efforts to go through the three major tasks of serving the real economy, guarding against financial risks and deepening innovation and reform, so as to maintain a steady and healthy development trend.
Comprehensively enhancing the efficiency and capability of serving the real economy. Following the major trend of supply-side structural reform, emphasis shall be put on key national economic areas and weaker areas, the credit top-level design shall be strengthened, and the allocation of credit resources shall be optimized. While continuing to increase support for national key initiatives and major projects, the Bank will pay more attention to the bigger role that inclusive finance plays, and promote financial services in fields such as small and micro enterprises, “rural areas, agriculture and farmers”, targeted poverty alleviation and people’s livelihood. Consolidated management between new credit and existing credit shall be made, a multilevel and diversified investment and financing system that complies with the innovative and tiered market development shall be better regulated and more efforts shall be made in supporting the de-leveraging and cost-reduction of the real economy.
Effectively enhancing the risk mitigation ability. The Bank will focus more on the on and off-balance sheets, strengthen the accountability of the responsible persons, and keep a staring eye on key areas of risks. Centering on the credit risk, on-balance sheet work shall be mainly done in the three areas of new credit admission, inventory control, and NPL disposal, and resolute efforts shall be made to prevent the quality of assets from turning bad. In terms of off-balance sheet, we will focus on cross-border, cross-industry, cross-market new risk prevention and control, actively deal with liquidity, interest rate, exchange rate and other market risks, and make full efforts to safeguard the security line and risk bottom line.
Deepening reform and innovation as well as business transformation. The Bank will continue to deepen the implementation of the strategies including mega retail, mega asset management, and mega investment banking, improve the internationalized and integrated business system and business structure, and strengthen the development of profit-making units of all institutions and all product lines, to create values based on services and further shape up the balanced income structure with multiple sources of income. The Bank will also improve the performance-linked assessment system and resource allocation mechanism, accelerate the transformation of the outlet channel and the optimization of service process, deepen the implementation of the e-ICBC3.0 “intelligent banking” strategy, fully stimulate vitality and create new growth drivers.
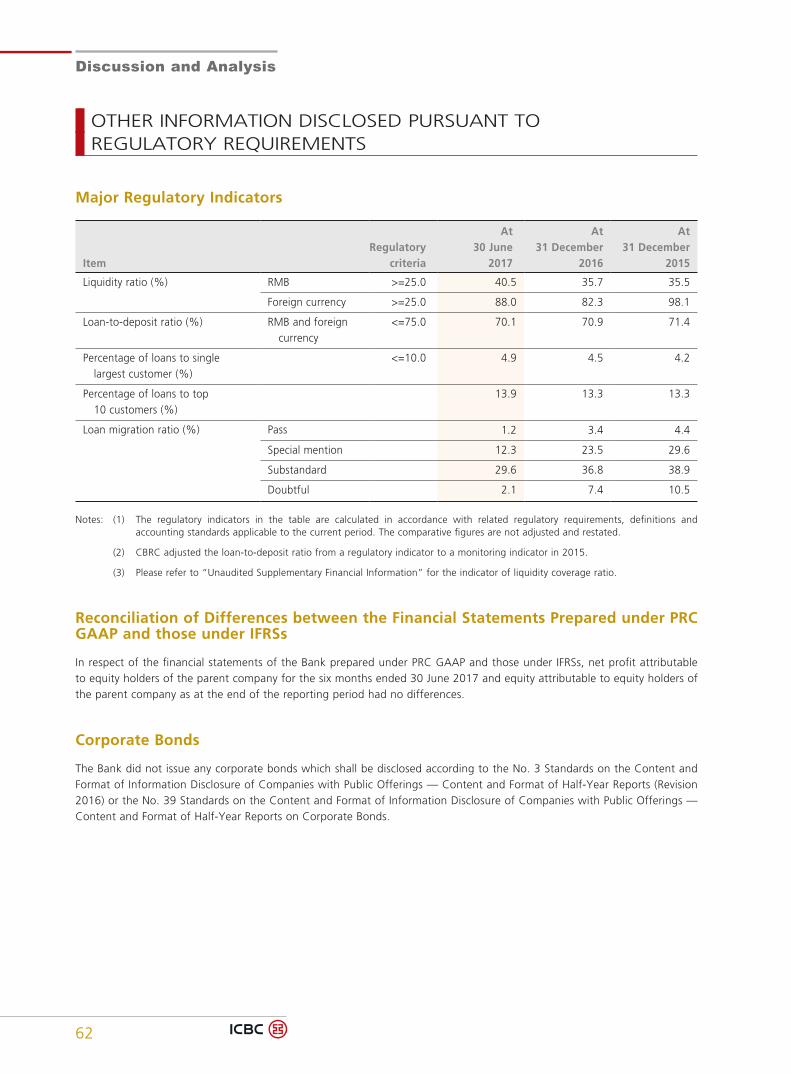
Discussion and Analysis
62
OTHER INFORMATION DISCLOSED PURSUANT TOREGULATORY REQUIREMENTS
Major Regulatory Indicators
ItemRegulatory
criteria
At30 June
2017
At31 December
2016
At31 December
2015
Liquidity ratio (%) RMB >=25.0 40.5 35.7 35.5
Foreign currency >=25.0 88.0 82.3 98.1
Loan-to-deposit ratio (%) RMB and foreign currency
<=75.0 70.1 70.9 71.4
Percentage of loans to single largest customer (%)
<=10.0 4.9 4.5 4.2
Percentage of loans to top 10 customers (%)
13.9 13.3 13.3
Loan migration ratio (%) Pass 1.2 3.4 4.4
Special mention 12.3 23.5 29.6
Substandard 29.6 36.8 38.9
Doubtful 2.1 7.4 10.5
Notes: (1) The regulatory indicators in the table are calculated in accordance with related regulatory requirements, definitions and accounting standards applicable to the current period. The comparative figures are not adjusted and restated.
(2) CBRC adjusted the loan-to-deposit ratio from a regulatory indicator to a monitoring indicator in 2015.
(3) Please refer to “Unaudited Supplementary Financial Information” for the indicator of liquidity coverage ratio.
Reconciliation of Differences between the Financial Statements Prepared under PRC GAAP and those under IFRSs
In respect of the financial statements of the Bank prepared under PRC GAAP and those under IFRSs, net profit attributable to equity holders of the parent company for the six months ended 30 June 2017 and equity attributable to equity holders of the parent company as at the end of the reporting period had no differences.
Corporate Bonds
The Bank did not issue any corporate bonds which shall be disclosed according to the No. 3 Standards on the Content and Format of Information Disclosure of Companies with Public Offerings — Content and Format of Half-Year Reports (Revision 2016) or the No. 39 Standards on the Content and Format of Information Disclosure of Companies with Public Offerings — Content and Format of Half-Year Reports on Corporate Bonds.

Information Disclosed Pursuant to the Capital Regulation
I n t e r i m R e p o r t 2 0 1 7 63
Capital Adequacy Ratio
Scope of Capital Adequacy Ratio Calculation
The scope of capital adequacy ratio calculation shall cover the Bank and all eligible financial institutions in which the Bank has a direct or indirect investment as specified in the Capital Regulation promulgated by CBRC.
Results of Capital Adequacy Ratio CalculationIn RMB millions, except for percentages
Item
At 30 June 2017 At 31 December 2016
GroupParent
Company GroupParent
Company
Calculated in accordance with the Capital Regulation:
Net core tier 1 capital 1,923,535 1,764,663 1,874,976 1,723,839
Net tier 1 capital 2,003,429 1,844,038 1,954,770 1,803,214
Net capital base 2,196,084 2,022,005 2,127,462 1,960,840
Core tier 1 capital adequacy ratio 12.67% 12.68% 12.87% 12.90%
Tier 1 capital adequacy ratio 13.19% 13.25% 13.42% 13.49%
Capital adequacy ratio 14.46% 14.53% 14.61% 14.67%
Calculated in accordance with the Regulation Governing Capital Adequacy of Commercial Banks and related regulations:
Core capital adequacy ratio 11.16% 11.43% 11.71% 11.96%
Capital adequacy ratio 13.52% 13.55% 14.29% 14.26%
Note: Please refer to “Discussion and Analysis — Capital Management” for the Group’s capital adequacy ratio at the end of the reporting period.
Measurement of Risk-Weighted Assets
According to the scope of implementing the advanced capital management approaches as approved by CBRC, the foundation internal ratings-based (IRB) approach was adopted for corporate credit risk, the IRB approach for retail credit risk, the internal model approach (IMA) for market risk, and the standardized approach for operational risk meeting regulatory requirements. The weighted approach was adopted for credit risk uncovered by the IRB approach and the standardized approach for market risk uncovered by the IMA approach.
RISK-WEIGHTED ASSETSIn RMB millions
Item At 30 June 2017 At 31 December 2016
Credit risk-weighted assets 13,766,067 13,144,466
Parts covered by internal ratings-based approach 9,535,934 9,304,653
Parts uncovered by internal ratings-based approach 4,230,133 3,839,813
Market risk-weighted assets 227,007 229,250
Parts covered by internal model approach 142,142 150,951
Parts uncovered by internal model approach 84,865 78,299
Operational risk-weighted assets 1,190,901 1,190,901
Total 15,183,975 14,564,617
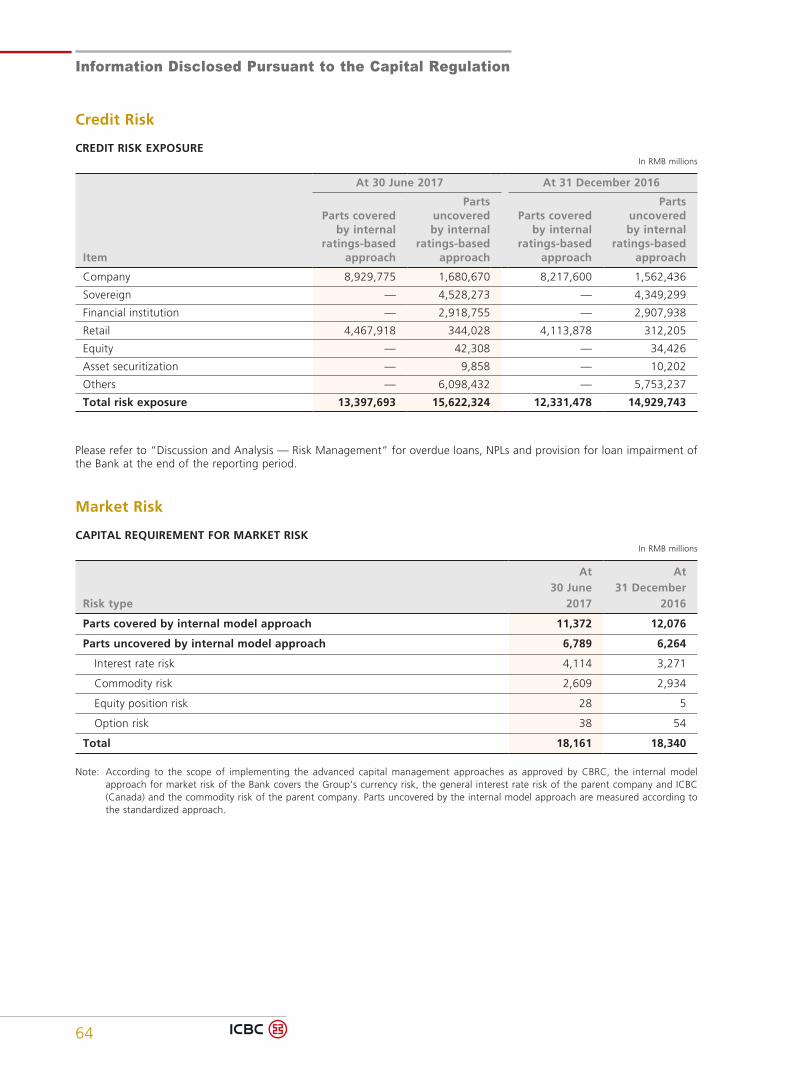
Information Disclosed Pursuant to the Capital Regulation
64
Credit Risk
CREDIT RISK EXPOSUREIn RMB millions
Item
At 30 June 2017 At 31 December 2016
Parts covered by internal
ratings-based approach
Parts uncovered by internal
ratings-based approach
Parts covered by internal
ratings-based approach
Parts uncovered by internal
ratings-based approach
Company 8,929,775 1,680,670 8,217,600 1,562,436
Sovereign — 4,528,273 — 4,349,299
Financial institution — 2,918,755 — 2,907,938
Retail 4,467,918 344,028 4,113,878 312,205
Equity — 42,308 — 34,426
Asset securitization — 9,858 — 10,202
Others — 6,098,432 — 5,753,237
Total risk exposure 13,397,693 15,622,324 12,331,478 14,929,743
Please refer to “Discussion and Analysis — Risk Management” for overdue loans, NPLs and provision for loan impairment of the Bank at the end of the reporting period.
Market Risk
CAPITAL REQUIREMENT FOR MARKET RISKIn RMB millions
Risk type
At 30 June
2017
At 31 December
2016
Parts covered by internal model approach 11,372 12,076
Parts uncovered by internal model approach 6,789 6,264
Interest rate risk 4,114 3,271
Commodity risk 2,609 2,934
Equity position risk 28 5
Option risk 38 54
Total 18,161 18,340
Note: According to the scope of implementing the advanced capital management approaches as approved by CBRC, the internal model approach for market risk of the Bank covers the Group’s currency risk, the general interest rate risk of the parent company and ICBC (Canada) and the commodity risk of the parent company. Parts uncovered by the internal model approach are measured according to the standardized approach.
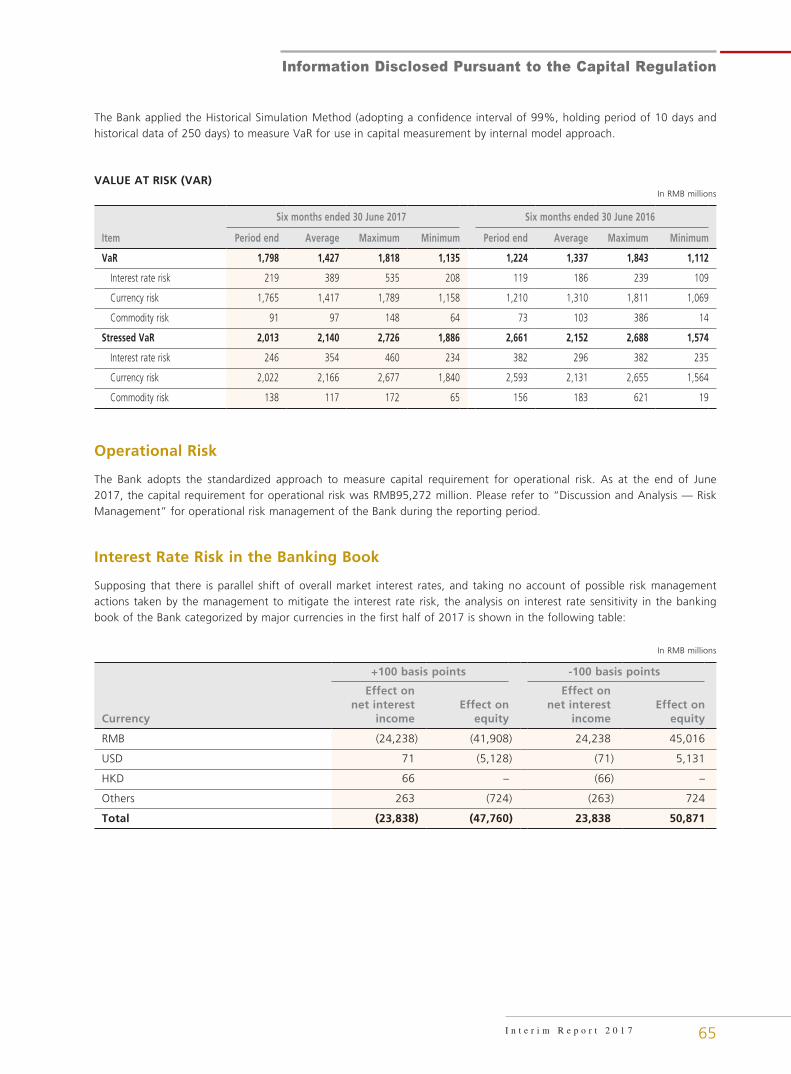
Information Disclosed Pursuant to the Capital Regulation
I n t e r i m R e p o r t 2 0 1 7 65
The Bank applied the Historical Simulation Method (adopting a confidence interval of 99%, holding period of 10 days and historical data of 250 days) to measure VaR for use in capital measurement by internal model approach.
VALUE AT RISK (VAR)In RMB millions
Item
Six months ended 30 June 2017 Six months ended 30 June 2016
Period end Average Maximum Minimum Period end Average Maximum Minimum
VaR 1,798 1,427 1,818 1,135 1,224 1,337 1,843 1,112
Interest rate risk 219 389 535 208 119 186 239 109
Currency risk 1,765 1,417 1,789 1,158 1,210 1,310 1,811 1,069
Commodity risk 91 97 148 64 73 103 386 14
Stressed VaR 2,013 2,140 2,726 1,886 2,661 2,152 2,688 1,574
Interest rate risk 246 354 460 234 382 296 382 235
Currency risk 2,022 2,166 2,677 1,840 2,593 2,131 2,655 1,564
Commodity risk 138 117 172 65 156 183 621 19
Operational Risk
The Bank adopts the standardized approach to measure capital requirement for operational risk. As at the end of June 2017, the capital requirement for operational risk was RMB95,272 million. Please refer to “Discussion and Analysis — Risk Management” for operational risk management of the Bank during the reporting period.
Interest Rate Risk in the Banking Book
Supposing that there is parallel shift of overall market interest rates, and taking no account of possible risk management actions taken by the management to mitigate the interest rate risk, the analysis on interest rate sensitivity in the banking book of the Bank categorized by major currencies in the first half of 2017 is shown in the following table:
In RMB millions
Currency
+100 basis points -100 basis points
Effect on net interest
incomeEffect on
equity
Effect on net interest
incomeEffect on
equity
RMB (24,238) (41,908) 24,238 45,016
USD 71 (5,128) (71) 5,131
HKD 66 – (66) –
Others 263 (724) (263) 724
Total (23,838) (47,760) 23,838 50,871
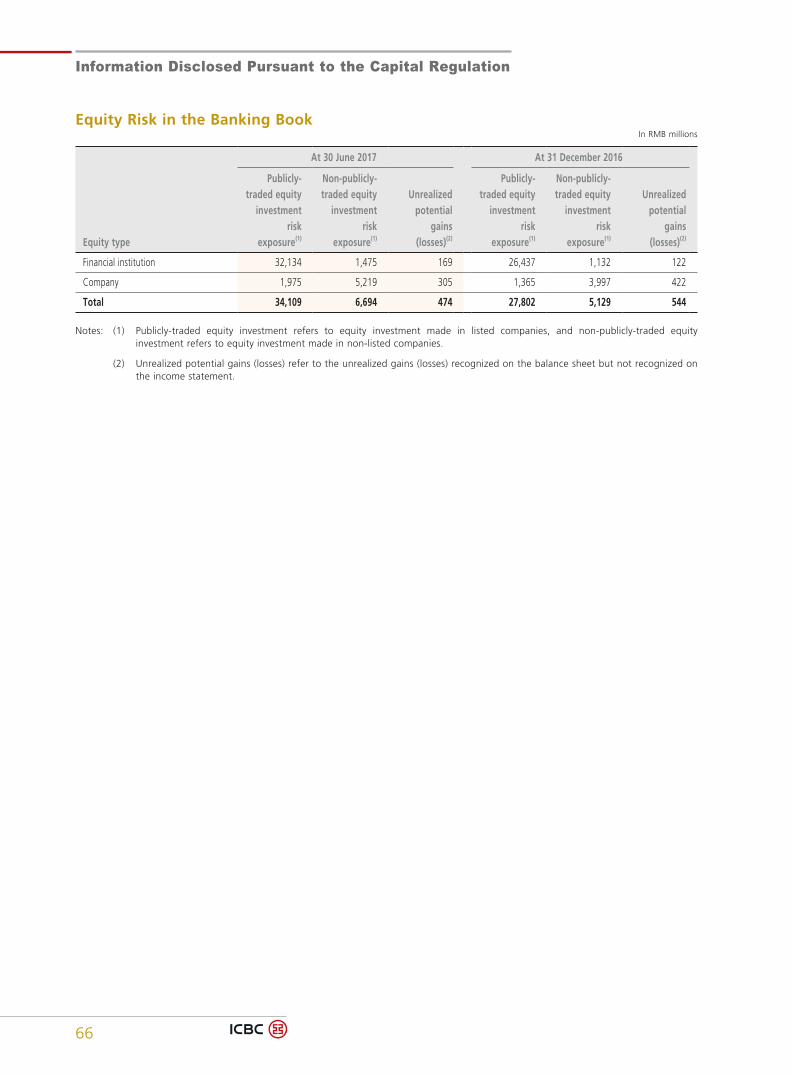
Information Disclosed Pursuant to the Capital Regulation
66
Equity Risk in the Banking BookIn RMB millions
Equity type
At 30 June 2017 At 31 December 2016
Publicly-traded equity
investment risk
exposure(1)
Non-publicly-traded equity
investment risk
exposure(1)
Unrealized potential
gains (losses)(2)
Publicly-traded equity
investment risk
exposure(1)
Non-publicly-traded equity
investment risk
exposure(1)
Unrealized potential
gains (losses)(2)
Financial institution 32,134 1,475 169 26,437 1,132 122
Company 1,975 5,219 305 1,365 3,997 422
Total 34,109 6,694 474 27,802 5,129 544
Notes: (1) Publicly-traded equity investment refers to equity investment made in listed companies, and non-publicly-traded equity investment refers to equity investment made in non-listed companies.
(2) Unrealized potential gains (losses) refer to the unrealized gains (losses) recognized on the balance sheet but not recognized on the income statement.
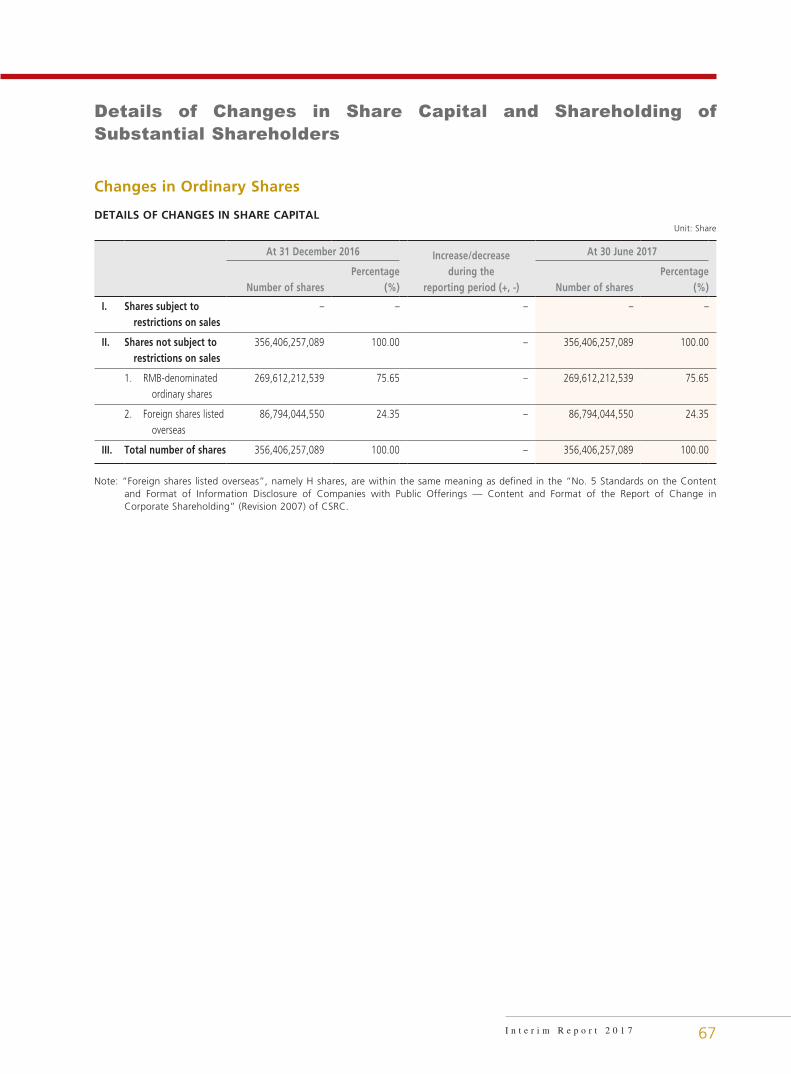
Details of Changes in Share Capital and Shareholding of Substantial Shareholders
I n t e r i m R e p o r t 2 0 1 7 67
Changes in Ordinary Shares
DETAILS OF CHANGES IN SHARE CAPITALUnit: Share
At 31 December 2016 Increase/decrease during the
reporting period (+, -)
At 30 June 2017
Number of sharesPercentage
(%) Number of sharesPercentage
(%)
I. Shares subject to restrictions on sales
– – – – –
II. Shares not subject to restrictions on sales
356,406,257,089 100.00 – 356,406,257,089 100.00
1. RMB-denominated ordinary shares
269,612,212,539 75.65 – 269,612,212,539 75.65
2. Foreign shares listed overseas
86,794,044,550 24.35 – 86,794,044,550 24.35
III. Total number of shares 356,406,257,089 100.00 – 356,406,257,089 100.00
Note: “Foreign shares listed overseas”, namely H shares, are within the same meaning as defined in the “No. 5 Standards on the Content and Format of Information Disclosure of Companies with Public Offerings — Content and Format of the Report of Change in Corporate Shareholding” (Revision 2007) of CSRC.
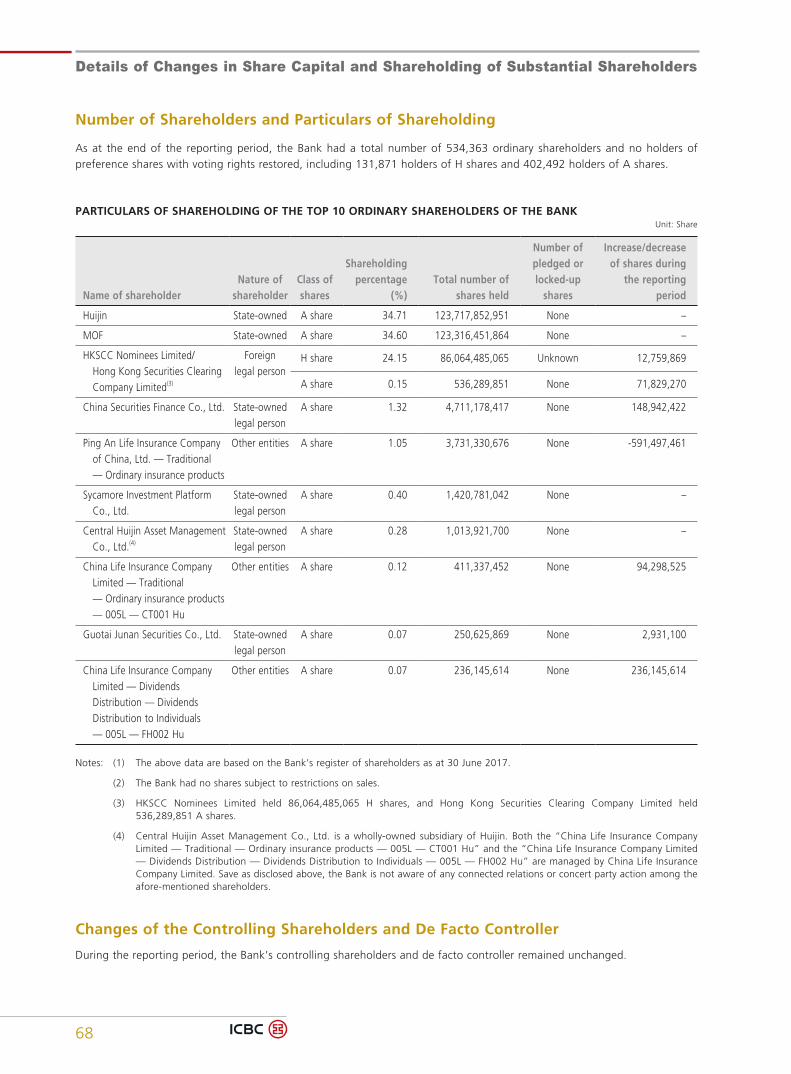
Details of Changes in Share Capital and Shareholding of Substantial Shareholders
68
Number of Shareholders and Particulars of Shareholding
As at the end of the reporting period, the Bank had a total number of 534,363 ordinary shareholders and no holders of preference shares with voting rights restored, including 131,871 holders of H shares and 402,492 holders of A shares.
PARTICULARS OF SHAREHOLDING OF THE TOP 10 ORDINARY SHAREHOLDERS OF THE BANKUnit: Share
Name of shareholderNature of
shareholderClass of shares
Shareholding percentage
(%)Total number of
shares held
Number of pledged or locked-up
shares
Increase/decrease of shares during
the reporting period
Huijin State-owned A share 34.71 123,717,852,951 None –
MOF State-owned A share 34.60 123,316,451,864 None –
HKSCC Nominees Limited/ Hong Kong Securities Clearing Company Limited(3)
Foreign legal person
H share 24.15 86,064,485,065 Unknown 12,759,869
A share 0.15 536,289,851 None 71,829,270
China Securities Finance Co., Ltd. State-owned legal person
A share 1.32 4,711,178,417 None 148,942,422
Ping An Life Insurance Company of China, Ltd. — Traditional — Ordinary insurance products
Other entities A share 1.05 3,731,330,676 None -591,497,461
Sycamore Investment Platform Co., Ltd.
State-owned legal person
A share 0.40 1,420,781,042 None –
Central Huijin Asset Management Co., Ltd.(4)
State-owned legal person
A share 0.28 1,013,921,700 None –
China Life Insurance Company Limited — Traditional — Ordinary insurance products — 005L — CT001 Hu
Other entities A share 0.12 411,337,452 None 94,298,525
Guotai Junan Securities Co., Ltd. State-owned legal person
A share 0.07 250,625,869 None 2,931,100
China Life Insurance Company Limited — Dividends Distribution — Dividends Distribution to Individuals — 005L — FH002 Hu
Other entities A share 0.07 236,145,614 None 236,145,614
Notes: (1) The above data are based on the Bank’s register of shareholders as at 30 June 2017.
(2) The Bank had no shares subject to restrictions on sales.
(3) HKSCC Nominees Limited held 86,064,485,065 H shares, and Hong Kong Securities Clearing Company Limited held 536,289,851 A shares.
(4) Central Huijin Asset Management Co., Ltd. is a wholly-owned subsidiary of Huijin. Both the “China Life Insurance Company Limited — Traditional — Ordinary insurance products — 005L — CT001 Hu” and the “China Life Insurance Company Limited — Dividends Distribution — Dividends Distribution to Individuals — 005L — FH002 Hu” are managed by China Life Insurance Company Limited. Save as disclosed above, the Bank is not aware of any connected relations or concert party action among the afore-mentioned shareholders.
Changes of the Controlling Shareholders and De Facto Controller
During the reporting period, the Bank’s controlling shareholders and de facto controller remained unchanged.
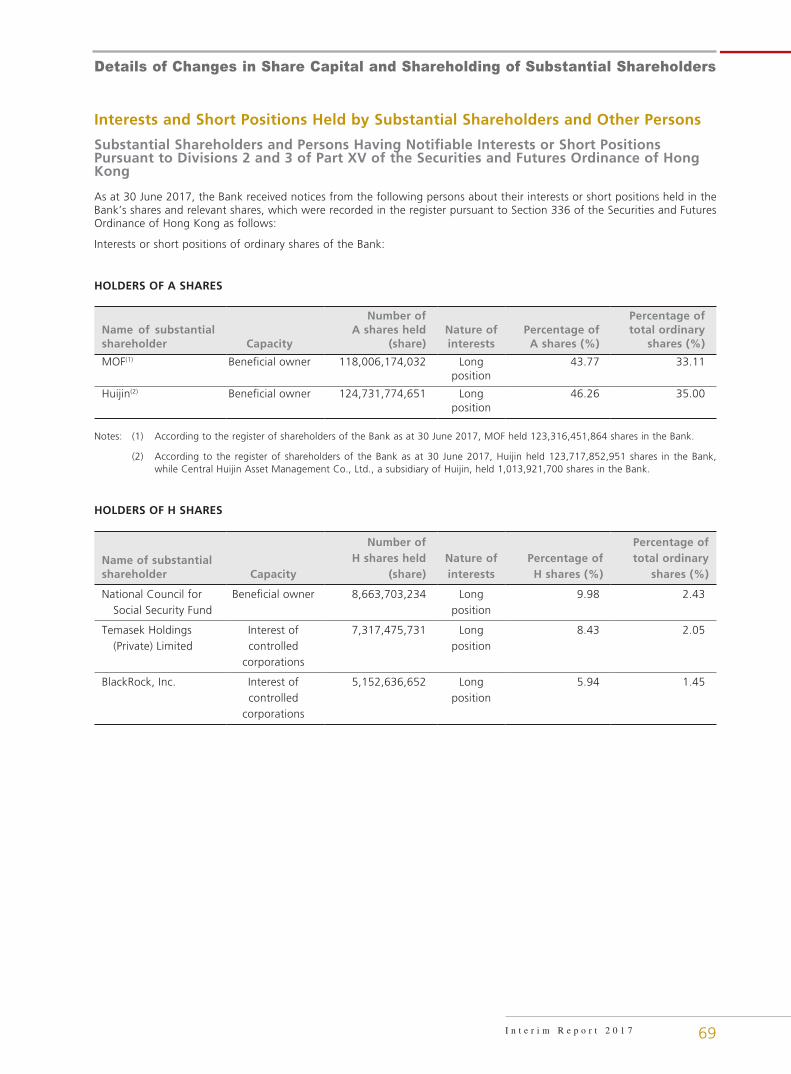
69
Details of Changes in Share Capital and Shareholding of Substantial Shareholders
I n t e r i m R e p o r t 2 0 1 7
Interests and Short Positions Held by Substantial Shareholders and Other Persons
Substantial Shareholders and Persons Having Notifiable Interests or Short Positions Pursuant to Divisions 2 and 3 of Part XV of the Securities and Futures Ordinance of Hong Kong
As at 30 June 2017, the Bank received notices from the following persons about their interests or short positions held in the Bank’s shares and relevant shares, which were recorded in the register pursuant to Section 336 of the Securities and Futures Ordinance of Hong Kong as follows:
Interests or short positions of ordinary shares of the Bank:
HOLDERS OF A SHARES
Name of substantial shareholder Capacity
Number of A shares held
(share)Nature of interests
Percentage of A shares (%)
Percentage of total ordinary
shares (%)
MOF(1) Beneficial owner 118,006,174,032 Long position
43.77 33.11
Huijin(2) Beneficial owner 124,731,774,651 Long position
46.26 35.00
Notes: (1) According to the register of shareholders of the Bank as at 30 June 2017, MOF held 123,316,451,864 shares in the Bank.
(2) According to the register of shareholders of the Bank as at 30 June 2017, Huijin held 123,717,852,951 shares in the Bank, while Central Huijin Asset Management Co., Ltd., a subsidiary of Huijin, held 1,013,921,700 shares in the Bank.
HOLDERS OF H SHARES
Name of substantial shareholder Capacity
Number of H shares held
(share)Nature of interests
Percentage of H shares (%)
Percentage of total ordinary
shares (%)
National Council for Social Security Fund
Beneficial owner 8,663,703,234 Long position
9.98 2.43
Temasek Holdings (Private) Limited
Interest of controlled
corporations
7,317,475,731 Long position
8.43 2.05
BlackRock, Inc. Interest of controlled
corporations
5,152,636,652 Long position
5.94 1.45
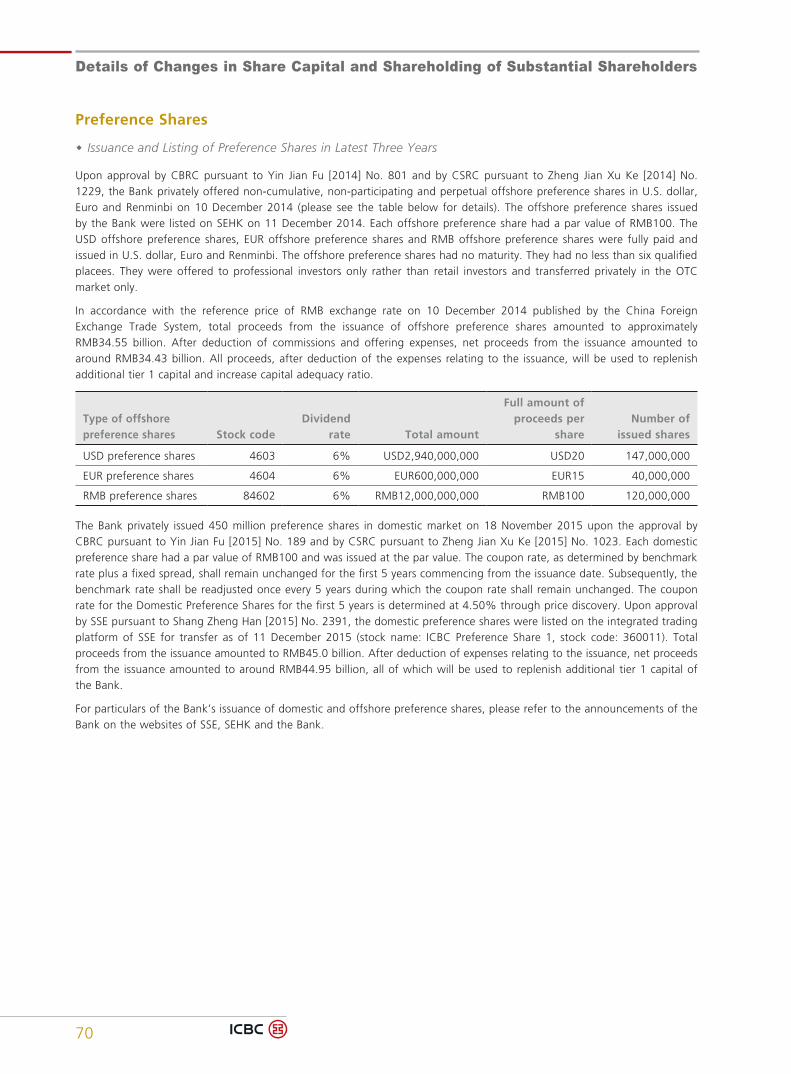
Details of Changes in Share Capital and Shareholding of Substantial Shareholders
70
Preference Shares
� Issuance and Listing of Preference Shares in Latest Three Years
Upon approval by CBRC pursuant to Yin Jian Fu [2014] No. 801 and by CSRC pursuant to Zheng Jian Xu Ke [2014] No. 1229, the Bank privately offered non-cumulative, non-participating and perpetual offshore preference shares in U.S. dollar, Euro and Renminbi on 10 December 2014 (please see the table below for details). The offshore preference shares issued by the Bank were listed on SEHK on 11 December 2014. Each offshore preference share had a par value of RMB100. The USD offshore preference shares, EUR offshore preference shares and RMB offshore preference shares were fully paid and issued in U.S. dollar, Euro and Renminbi. The offshore preference shares had no maturity. They had no less than six qualified placees. They were offered to professional investors only rather than retail investors and transferred privately in the OTC market only.
In accordance with the reference price of RMB exchange rate on 10 December 2014 published by the China Foreign Exchange Trade System, total proceeds from the issuance of offshore preference shares amounted to approximately RMB34.55 billion. After deduction of commissions and offering expenses, net proceeds from the issuance amounted to around RMB34.43 billion. All proceeds, after deduction of the expenses relating to the issuance, will be used to replenish additional tier 1 capital and increase capital adequacy ratio.
Type of offshore preference shares Stock code
Dividend rate Total amount
Full amount of proceeds per
shareNumber of
issued shares
USD preference shares 4603 6% USD2,940,000,000 USD20 147,000,000
EUR preference shares 4604 6% EUR600,000,000 EUR15 40,000,000
RMB preference shares 84602 6% RMB12,000,000,000 RMB100 120,000,000
The Bank privately issued 450 million preference shares in domestic market on 18 November 2015 upon the approval by CBRC pursuant to Yin Jian Fu [2015] No. 189 and by CSRC pursuant to Zheng Jian Xu Ke [2015] No. 1023. Each domestic preference share had a par value of RMB100 and was issued at the par value. The coupon rate, as determined by benchmark rate plus a fixed spread, shall remain unchanged for the first 5 years commencing from the issuance date. Subsequently, the benchmark rate shall be readjusted once every 5 years during which the coupon rate shall remain unchanged. The coupon rate for the Domestic Preference Shares for the first 5 years is determined at 4.50% through price discovery. Upon approval by SSE pursuant to Shang Zheng Han [2015] No. 2391, the domestic preference shares were listed on the integrated trading platform of SSE for transfer as of 11 December 2015 (stock name: ICBC Preference Share 1, stock code: 360011). Total proceeds from the issuance amounted to RMB45.0 billion. After deduction of expenses relating to the issuance, net proceeds from the issuance amounted to around RMB44.95 billion, all of which will be used to replenish additional tier 1 capital of the Bank.
For particulars of the Bank’s issuance of domestic and offshore preference shares, please refer to the announcements of the Bank on the websites of SSE, SEHK and the Bank.

71
Details of Changes in Share Capital and Shareholding of Substantial Shareholders
I n t e r i m R e p o r t 2 0 1 7
� Changes in Preference Shares
As at the end of the reporting period, the Bank had 28 preference shareholders (or proxies), including two offshore preference shareholders (or proxies) and 26 domestic preference shareholders.
PARTICULARS OF SHAREHOLDING OF THE TOP 10 OFFSHORE PREFERENCE SHAREHOLDERS (OR PROXIES) OF THE BANK
Unit: Share
Name of shareholder
Nature of
shareholder Class of shares
Increase/
decrease during
the reporting
period
Shares held at
the end of the
period
Shareholding
percentage
(%)
Number of
shares subject
to restrictions
on sales
Number of
pledged
or locked-
up shares
Cede & Co. Foreign
legal person
USD offshore
preference shares
– 147,000,000 47.9 – Unknown
The Bank of New York
Depository (Nominees) Limited Foreign
legal person
RMB offshore
preference shares
– 120,000,000 39.1 – Unknown
EUR offshore
preference shares
– 40,000,000 13.0 – Unknown
Notes: (1) The above data are based on the Bank’s register of offshore preference shareholders as at 30 June 2017.
(2) As the issuance was private offering, the register of preference shareholders presented the information on proxies of placees.
(3) The Bank is not aware of any connected relations or concert party action among the afore-mentioned preference shareholders and among the afore-mentioned preference shareholders and top 10 ordinary shareholders.
(4) “Shareholding percentage” refers to the percentage of offshore preference shares held by preference shareholders in total number of offshore preference shares.
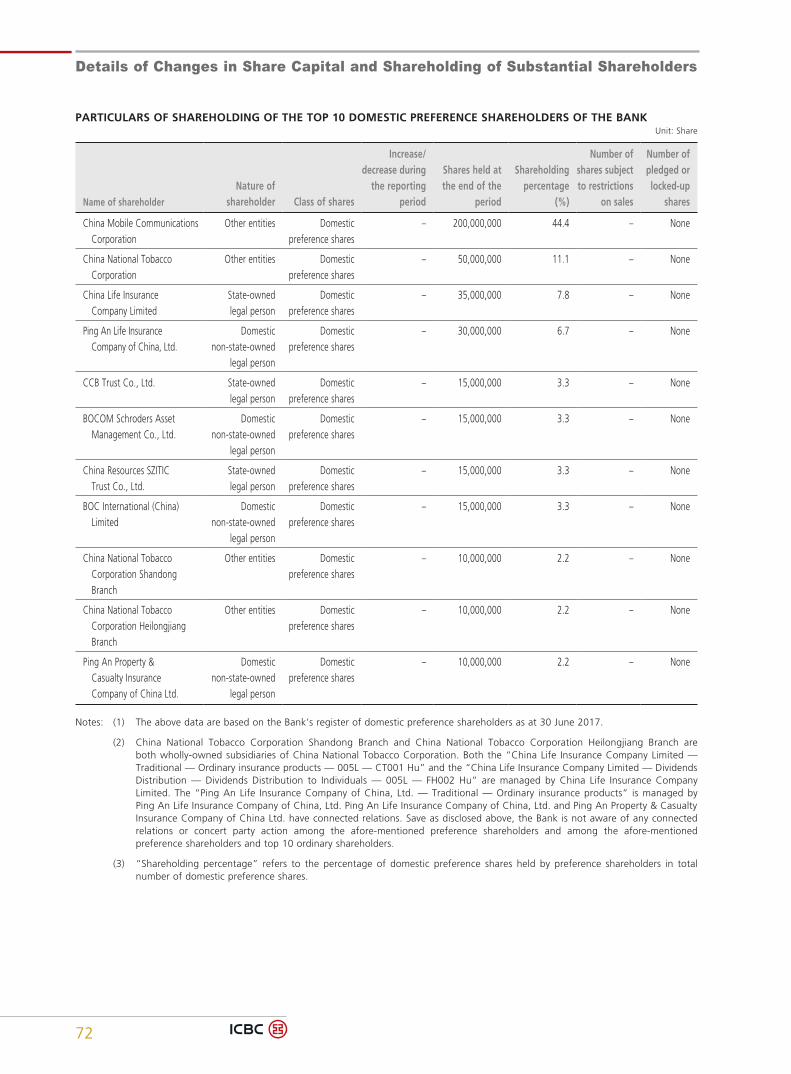
Details of Changes in Share Capital and Shareholding of Substantial Shareholders
72
PARTICULARS OF SHAREHOLDING OF THE TOP 10 DOMESTIC PREFERENCE SHAREHOLDERS OF THE BANKUnit: Share
Name of shareholder
Nature of shareholder Class of shares
Increase/decrease during
the reporting period
Shares held at the end of the
period
Shareholding percentage
(%)
Number of shares subject to restrictions
on sales
Number of pledged or locked-up
shares
China Mobile Communications Corporation
Other entities Domestic preference shares
– 200,000,000 44.4 – None
China National Tobacco Corporation
Other entities Domestic preference shares
– 50,000,000 11.1 – None
China Life Insurance Company Limited
State-owned legal person
Domestic preference shares
– 35,000,000 7.8 – None
Ping An Life Insurance Company of China, Ltd.
Domestic non-state-owned
legal person
Domestic preference shares
– 30,000,000 6.7 – None
CCB Trust Co., Ltd. State-owned legal person
Domestic preference shares
– 15,000,000 3.3 – None
BOCOM Schroders Asset Management Co., Ltd.
Domestic non-state-owned
legal person
Domestic preference shares
– 15,000,000 3.3 – None
China Resources SZITIC Trust Co., Ltd.
State-owned legal person
Domestic preference shares
– 15,000,000 3.3 – None
BOC International (China) Limited
Domestic non-state-owned
legal person
Domestic preference shares
– 15,000,000 3.3 – None
China National Tobacco Corporation Shandong Branch
Other entities Domestic preference shares
– 10,000,000 2.2 – None
China National Tobacco Corporation Heilongjiang Branch
Other entities Domestic preference shares
– 10,000,000 2.2 – None
Ping An Property & Casualty Insurance Company of China Ltd.
Domestic non-state-owned
legal person
Domestic preference shares
– 10,000,000 2.2 – None
Notes: (1) The above data are based on the Bank’s register of domestic preference shareholders as at 30 June 2017.
(2) China National Tobacco Corporation Shandong Branch and China National Tobacco Corporation Heilongjiang Branch are both wholly-owned subsidiaries of China National Tobacco Corporation. Both the “China Life Insurance Company Limited — Traditional — Ordinary insurance products — 005L — CT001 Hu” and the “China Life Insurance Company Limited — Dividends Distribution — Dividends Distribution to Individuals — 005L — FH002 Hu” are managed by China Life Insurance Company Limited. The “Ping An Life Insurance Company of China, Ltd. — Traditional — Ordinary insurance products” is managed by Ping An Life Insurance Company of China, Ltd. Ping An Life Insurance Company of China, Ltd. and Ping An Property & Casualty Insurance Company of China Ltd. have connected relations. Save as disclosed above, the Bank is not aware of any connected relations or concert party action among the afore-mentioned preference shareholders and among the afore-mentioned preference shareholders and top 10 ordinary shareholders.
(3) “Shareholding percentage” refers to the percentage of domestic preference shares held by preference shareholders in total number of domestic preference shares.

73
Details of Changes in Share Capital and Shareholding of Substantial Shareholders
I n t e r i m R e p o r t 2 0 1 7
� Dividend Distribution of Preference Shares
During the reporting period, the Bank did not distribute any dividend on preference shares.
� Redemption or Conversion of Preference Shares
During the reporting period, the Bank did not redeem or convert any preference share.
� Restoration of Voting Rights of Preference Shares
During the reporting period, the Bank did not restore any voting right of preference share.
� Accounting Policies Adopted for Preference Shares and Grounds
According to the Accounting Standard for Business Enterprises No. 22 — Recognition and Measurement of Financial Instruments, the Accounting Standard for Business Enterprises No. 37 — Presentation of Financial Instruments and the Rules for Distinguishing Financial Liabilities and Equity Instruments and Relevant Accounting Treatment (Cai Kuai [2014] No. 13) promulgated by MOF as well as the International Accounting Standard 39 — Financial Instruments: Recognition and Measurement and the International Accounting Standard 32 — Financial Instruments: Presentation promulgated by International Accounting Standards Board and other accounting standards and main issuance clauses of the Bank’s preference shares, issued and existing preference shares of the Bank excluded contractual obligations of cash on delivery or other financial assets and contractual obligations of settlement by delivering variable equity instruments, and shall be calculated as other equity instruments.

Directors, Supervisors, Senior Management, Employees and Institutions
74
Basic Information on Directors, Supervisors and Senior Management
As at the disclosure date of this report, the composition of the Board of Directors, the Board of Supervisors and the Senior Management of the Bank is as follows:
The Board of Directors of the Bank consists of 13 directors, including four Executive Directors: Mr. Yi Huiman, Mr. Gu Shu, Mr. Zhang Hongli and Mr. Wang Jingdong; three Non-executive Directors: Mr. Zheng Fuqing, Mr. Fei Zhoulin and Mr. Cheng Fengchao; and six Independent Non-executive Directors: Mr. Or Ching Fai, Mr. Hong Yongmiao, Mr. Anthony Francis Neoh, Mr. Yang Siu Shun, Ms. Sheila Colleen Bair and Mr. Shen Si.
The Board of Supervisors of the Bank consists of six members, including two Shareholder Supervisors, namely Mr. Qian Wenhui and Mr. Zhang Wei, two Employee Supervisors, namely Mr. Hui Ping and Mr. Huang Li, and two External Supervisors, namely Mr. Qu Qiang and Mr. Shen Bingxi.
The Bank has ten Senior Management members, namely Mr. Yi Huiman, Mr. Gu Shu, Mr. Zhang Hongli, Mr. Wang Jingdong, Mr. Wang Lin, Mr. Hu Hao, Mr. Li Yunze, Mr. Tan Jiong, Mr. Wang Bairong and Mr. Guan Xueqing.
During the reporting period, the Bank did not implement any share incentives. None of the existing Directors, Supervisors and Senior Management members of the Bank or those who left office during the reporting period, except Mr. Zhang Hongli who held 2,000 H shares of the Bank, held shares or share options or were granted restricted shares of the Bank, and there was no change during the reporting period.
Appointment and Removal
� Directors
At the Annual General Meeting for the Year 2015 held on 24 June 2016, Mr. Shen Si was appointed as Independent Non-executive Director of the Bank, and his qualification was approved by CBRC in March 2017. At the First Extraordinary General Meeting of 2016 held on 29 November 2016, Ms. Sheila Colleen Bair was appointed as Independent Non-executive Director of the Bank, and her qualification was approved by CBRC in March 2017. At the Annual General Meeting for the Year 2016 held on 27 June 2017, Mr. Ye Donghai, Ms. Mei Yingchun and Mr. Dong Shi were appointed as Non-executive Directors of the Bank, and their qualifications remain to be approved by CBRC.
In January 2017, Mr. Fu Zhongjun ceased to act as Non-executive Director of the Bank due to expiration of the term of office. In March 2017, Mr. Kenneth Patrick Chung ceased to act as Independent Non-executive Director of the Bank due to expiration of the term of office. In June 2017, Ms. Wang Xiaoya and Ms. Ge Rongrong ceased to act as Non-executive Directors of the Bank due to change of job assignments.
� Senior Management members
On 28 October 2016, the Board of Directors of the Bank appointed Mr. Tan Jiong as Senior Executive Vice President of the Bank, and his qualification was approved by CBRC in January 2017.
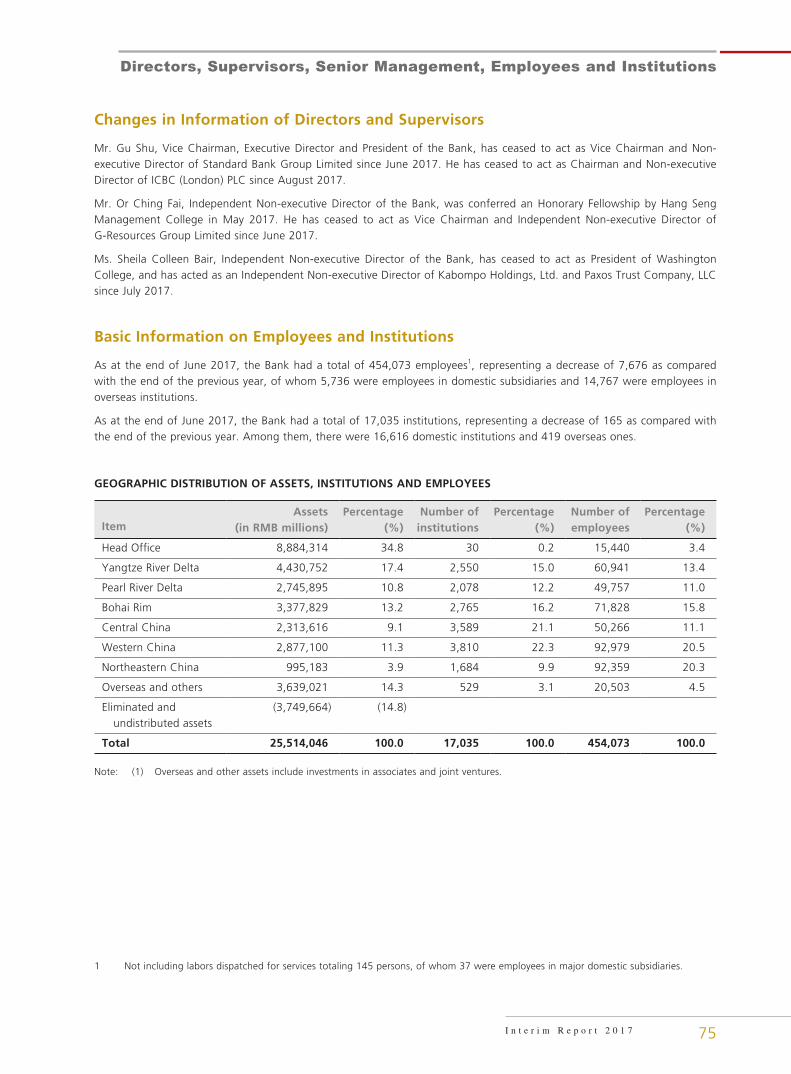
75
Directors, Supervisors, Senior Management, Employees and Institutions
I n t e r i m R e p o r t 2 0 1 7
Changes in Information of Directors and Supervisors
Mr. Gu Shu, Vice Chairman, Executive Director and President of the Bank, has ceased to act as Vice Chairman and Non-executive Director of Standard Bank Group Limited since June 2017. He has ceased to act as Chairman and Non-executive Director of ICBC (London) PLC since August 2017.
Mr. Or Ching Fai, Independent Non-executive Director of the Bank, was conferred an Honorary Fellowship by Hang Seng Management College in May 2017. He has ceased to act as Vice Chairman and Independent Non-executive Director of G-Resources Group Limited since June 2017.
Ms. Sheila Colleen Bair, Independent Non-executive Director of the Bank, has ceased to act as President of Washington College, and has acted as an Independent Non-executive Director of Kabompo Holdings, Ltd. and Paxos Trust Company, LLC since July 2017.
Basic Information on Employees and Institutions
As at the end of June 2017, the Bank had a total of 454,073 employees1, representing a decrease of 7,676 as compared with the end of the previous year, of whom 5,736 were employees in domestic subsidiaries and 14,767 were employees in overseas institutions.
As at the end of June 2017, the Bank had a total of 17,035 institutions, representing a decrease of 165 as compared with the end of the previous year. Among them, there were 16,616 domestic institutions and 419 overseas ones.
GEOGRAPHIC DISTRIBUTION OF ASSETS, INSTITUTIONS AND EMPLOYEES
ItemAssets
(in RMB millions)Percentage
(%)Number of
institutionsPercentage
(%)Number of employees
Percentage (%)
Head Office 8,884,314 34.8 30 0.2 15,440 3.4
Yangtze River Delta 4,430,752 17.4 2,550 15.0 60,941 13.4
Pearl River Delta 2,745,895 10.8 2,078 12.2 49,757 11.0
Bohai Rim 3,377,829 13.2 2,765 16.2 71,828 15.8
Central China 2,313,616 9.1 3,589 21.1 50,266 11.1
Western China 2,877,100 11.3 3,810 22.3 92,979 20.5
Northeastern China 995,183 3.9 1,684 9.9 92,359 20.3
Overseas and others 3,639,021 14.3 529 3.1 20,503 4.5
Eliminated and undistributed assets
(3,749,664) (14.8)
Total 25,514,046 100.0 17,035 100.0 454,073 100.0
Note: (1) Overseas and other assets include investments in associates and joint ventures.
1 Not including labors dispatched for services totaling 145 persons, of whom 37 were employees in major domestic subsidiaries.

Significant Events
76
Corporate Governance
Corporate Governance and Measures for Improvement During the reporting period, the Bank strictly complied with relevant laws and regulations and continued to improve its corporate governance on the basis of the Bank’s situation.
• The Bank improved the structure and relevant mechanisms of the Board of Directors. It selected and appointed directors as required, changed the chairman and members of some special committees of the Board of Directors, and continued to improve the mechanism for supporting duty performance by the Board of Directors to ensure the Bank operated in compliance with the laws and regulations.
• It strengthened the development of the corporate governance system and optimized the corporate governance framework. Pursuant to the national requirement to incorporate Party-building work into the articles of association and the latest requirements of CBRC, SEHK and other domestic and overseas regulators on corporate governance and taking into consideration the actual conditions of the Bank’s corporate governance, the Bank amended its Articles of Association. The amended Articles of Association was approved at the Annual General Meeting for the Year 2016 held on 27 June 2017. It is now pending approval by CBRC.
• It attached importance to the supervisory function of the Board of Supervisors. It focused on the bank-wide central tasks, conducted supervisions in depth and earnestly gave effect to the important role of the Board of Supervisors in corporate governance.
• It improved the comprehensive risk management system, and strengthened the consolidated risk management of the Group. It conducted prevention and control of global risks, and enhanced its forward-looking analysis of risks and the response capacities. It continuously improved the internal control and compliance management mechanism and enhanced the capability of whole-process management of compliance risks and operational risks of the Group. It carried out risk-oriented audits in an in-depth way, and improved human resources management by accelerating human resources structure adjustment and strengthening talent cultivation for key areas.
• It continuously increased the level of transparency, disclosed information in a legal and compliant manner, continuously enhanced the Group’s voluntary information disclosure, and effectively ensured the investors’ right to be informed. It organized domestic and overseas roadshows and reverse roadshows and other activities for managing important investor relations, and reinforced communication with the capital market.
Corporate Governance Code During the reporting period, the Bank fully complied with the principles, code provisions and the recommended best practices as stipulated in the Corporate Governance Code under Appendix 14 of the Hong Kong Listing Rules.
Shareholders’ General Meeting During the reporting period, the Bank convened the Annual General Meeting for the Year 2016 on 27 June 2017. It was convened and held in strict compliance with relevant laws and regulations and the Articles of Association of the Bank. The Bank disclosed relevant announcement of resolutions and legal options in a timely manner in accordance with regulatory requirements. For details of the meeting, please refer to the announcement of the Bank dated 27 June 2017 on the websites of SSE, SEHK and the Bank.
Profits and Dividends Distribution
The formulation and implementation of the Bank’s cash dividend policy, which has been reviewed and approved by the Independent Non-executive Directors, accords with the provisions stipulated in the Articles of Association and the requirements provided in the resolutions of the Shareholders’ General Meeting. The dividend distribution standards and proportion are clear and explicit, and the decision-making procedure and mechanism are complete. Minority shareholders can fully express their opinions and appeals to completely safeguard their legitimate rights.

77
Significant Events
I n t e r i m R e p o r t 2 0 1 7
Upon the approval at the Annual General Meeting for the Year 2016 held on 27 June 2017, the Bank has distributed cash dividends of about RMB83,506 million, or RMB2.343 per ten shares (pre-tax), for the period from 1 January 2016 to 31 December 2016 to the ordinary shareholders whose names appeared on the share register after the close of market on 10 July 2017. The Bank will not declare or distribute interim dividends for 2017, nor will it convert any capital reserves to share capital.
During the reporting period, the Bank did not distribute any dividend on preference shares.
Use of Proceeds from Fundraising Activities
The proceeds raised from the Bank’s fundraising activities were used for the purposes as disclosed in the prospectuses, namely, strengthening the capital base to support the ongoing growth of the Bank.
For future development and planning disclosed in the public disclosure documents such as previous offering prospectuses and fundraising prospectuses issued by the Bank which has continued during the reporting period, its implementation progress conformed to the planning as described upon verification and analysis.
For details on the use of proceeds raised from the issue of preference shares of the Bank, please refer to “Details of Changes in Share Capital and Shareholding of Substantial Shareholders — Preference Shares”.
Material Legal Proceedings and Arbitration The Bank was involved in several legal proceedings in the ordinary course of business. Most of these legal proceedings were initiated by the Bank to recover non-performing loans. The rest are mainly related to disputes with customers. As at 30 June 2017, the amount of pending proceedings in which the Bank and its subsidiaries acted as defendants totaled RMB5,483 million. The Bank does not expect any material adverse effect from the above-mentioned pending legal proceedings on the Bank’s business, financial position or operating results.
Credit Standing During the reporting period, there was not any significant court judgment with which the Bank and its controlling shareholders had not complied, nor was there any outstanding debt of significant amount.
Material Assets Acquisition, Sale and Merger During the reporting period, the Bank had no material assets acquisition, sale and merger.
Material Related Party Transactions
During the reporting period, the Bank did not enter into any material related party transactions.
Please refer to “Note 45. to the Financial Statements: Related Party Disclosures” for particulars on the related party transactions defined under the laws, regulations and accounting standards of China.
Material Contracts and Performance of Obligations thereunder
Material Trust, Sub-contract and Lease During the reporting period, the Bank did not hold on trust to a material extent or enter into any material sub-contract or lease arrangement in respect of assets of other corporations, which were subject to disclosure, and no other corporation held on trust to a material extent or entered into any material sub-contract or lease arrangement in respect of the Bank’s assets, which were subject to disclosure.

Significant Events
78
Material Guarantees The provision of guarantees is in the ordinary course of business of the Bank. During the reporting period, the Bank did not have any material guarantee that needs to be disclosed except for the financial guarantee services within the business scope as approved by PBC and CBRC.
Commitments
As at 30 June 2017, all of the continuing commitments made by the shareholders were properly fulfilled, and the relevant commitments are listed as follows:
ShareholderType of
commitmentTime and term of
commitment
Legal document under which the commitment is
made CommitmentFulfillment of commitment
Huijin Commitment of non-competition
October 2006/No specific term
Prospectus of Industrial and Commercial Bank of China Limited on Initial Public Offering (A Share)
Provided that Huijin continues to hold any share of the Bank or is deemed as the controlling shareholder of the Bank or the related party of the controlling shareholder of the Bank according to the laws or listing rules of China or the listing place of the Bank, Huijin will not engage in or participate in any competitive commercial banking business including but not limited to granting loans, attracting deposits and providing settlement, fund custody, bank card and money exchange services. However, Huijin can engage in or participate in some competitive businesses by investing in other commercial banks. In this regard, Huijin has committed that it will (1) fairly treat the investments in commercial banks and will not make any decision or judgment that will have adverse impact on the Bank or be beneficial to other commercial banks by taking advantage of the status of being a shareholder of the Bank or information obtained by taking advantage of the status of being a shareholder of the Bank; and (2) perform the shareholders’ rights for the maximum interests of the Bank.
As at 30 June 2017, Huijin strictly fulfilled the above commitment and did not do anything in violation of the commitment.November 2010/
No specific termProspectus on A Share Rights Issue of Industrial and Commercial Bank of China Limited
Save as disclosed above, neither the Bank nor any of its other related parties made any commitments.
79
Significant Events
I n t e r i m R e p o r t 2 0 1 7
Penalties by Authorities During the reporting period, neither the Bank nor any of its Directors, Supervisors, Senior Management members and controlling shareholders was subject to any investigation by competent authorities, coercive measures taken by judicial authorities or disciplinary inspection departments, transferred to judicial authorities or charged with criminal responsibility, case filing investigation or administrative penalty by CSRC, restricted access to market, identification as unqualified, major administrative penalty by other administrative authorities of environmental protection, taxation, safety supervision, etc. or public reprimand by the stock exchanges.
Purchase, Sale and Redemption of Securities During the reporting period, neither the Bank nor any of its subsidiaries purchased, sold or redeemed any listed securities of the Bank.
Securities Transactions of Directors and Supervisors The Bank has adopted a set of codes of conduct concerning the securities transactions by directors and supervisors which are no less stringent than the standards set out in the Model Code for Securities Transactions by Directors of Listed Issuers, Appendix 10 to the Hong Kong Listing Rules. After making enquiries with all directors and supervisors of the Bank, the Bank is satisfied that during the reporting period, all directors and supervisors have complied with the provisions of the aforesaid codes of conduct.
Interests in Shares, Underlying Shares, and Debentures Held by Directors and Supervisors As at 30 June 2017, Mr. Zhang Hongli, Executive Director and Senior Executive Vice President of the Bank, held 2,000 H shares of the Bank, and the spouse of Mr. Or Ching Fai, Independent Non-executive Director of the Bank, held 1,316,040 H shares of the Bank. Save as stated above, as at 30 June 2017, none of the Directors or Supervisors of the Bank had any interests or short positions in the shares, underlying shares or debentures of the Bank or any of its associated corporations (as defined in Part XV of the Securities and Futures Ordinance of Hong Kong) which have to be notified to the Bank and SEHK under Divisions 7 and 8 of Part XV of the Securities and Futures Ordinance of Hong Kong (including interests or short positions therein that they shall be deemed to have pursuant to such provisions of the Securities and Futures Ordinance of Hong Kong), or any interests or short positions which have to be recorded in the register under Section 352 of the Securities and Futures Ordinance of Hong Kong, or any interests or short positions which have to be notified to the Bank and SEHK pursuant to the Model Code for Securities Transactions by Directors of Listed Issuers as set out in Appendix 10 to the Hong Kong Listing Rules.
Implementation of Share Incentive Plan and Employee Stock Ownership Plan during the Reporting Period During the reporting period, the Bank did not implement any share incentive plan or any employee stock ownership plan.
Review of the Interim Report
The 2017 interim financial report prepared by the Bank in accordance with PRC GAAP and IFRSs have been reviewed by KPMG Huazhen LLP and KPMG in accordance with Chinese and international standards on review engagements, respectively.
The Interim Report has been reviewed and approved by the Audit Committee of the Board of Directors of the Bank.
Warning and Explanation on the Prediction that the Accumulated Net Profits from the Beginning of the Year to the End of the Next Reporting Period May Be Negative or Have Substantial Changes Compared to the Same Period of Last Year Not applicable.

Review Report and Interim Financial Report
- Review Report
- Interim Financial Report
- Unaudited Supplementary Financial Information
CONTENTS
81I n t e r i m R e p o r t 2 0 1 7
Pages
REVIEW REPORT 82
UNAUDITED INTERIM CONSOLIDATED
FINANCIAL STATEMENTS
Statement of profit or loss 83
Statement of profit or loss and
other comprehensive income 84
Statement of financial position 85
Statement of changes in equity 86
Cash flow statement 89
NOTES TO THE UNAUDITED INTERIM
FINANCIAL REPORT
1. Corporate Information 91
2. Basis of Preparation and Accounting Policies 91
3. Net Interest Income 95
4. Net Fee and Commission Income 95
5. Net Trading Income 96
6. Net Loss on Financial Assets and
Liabilities Designated at Fair Value
Through Profit or Loss 96
7. Net Gain on Financial Investments 96
8. Other Operating Income, Net 96
9. Operating Expenses 97
10. Impairment Losses on Assets Other than
Loans and Advances to Customers 97
11. Income Tax Expense 98
12. Dividends 98
13. Earnings Per Share 99
14. Cash and Balances with Central Banks 99
15. Due from Banks and
Other Financial Institutions 100
16. Financial Assets Held for Trading 100
17. Financial Assets Designated at
Fair Value Through Profit or Loss 101
18. Derivative Financial Instruments 101
19. Reverse Repurchase Agreements 105
20. Loans and Advances to Customers 106
21. Financial Investments 108
22. Investments in Associates and
Joint Ventures 111
Pages
23. Property and Equipment 114
24. Deferred Income Tax Assets and Liabilities 115
25. Other Assets 117
26. Financial Liabilities Designated at
Fair Value through Profit or Loss 117
27. Due to Banks and Other Financial Institutions 118
28. Repurchase Agreements 118
29. Certificates of Deposit 118
30. Due to Customers 118
31. Debt Securities Issued 119
32. Other Liabilities 123
33. Share Capital 123
34. Other Equity Instruments 124
35. Reserves 128
36. Other Comprehensive Income 130
37. Involvement with Unconsolidated
Structured Entities 130
38. Notes to the Consolidated Statement of
Cash Flows 132
39. Transferred Financial Assets 132
40. Share Appreciation Rights Plan 134
41. Commitments and Contingent Liabilities 134
42. Designated Funds and Loans 135
43. Assets Pledged 135
44. Fiduciary Activities 135
45. Related Party Disclosures 136
46. Segment Information 141
47. Financial Instrument Risk Management 146
48. Fair Value of Financial Instruments 170
49. After the Reporting Period Event 176
50. Comparative Amounts 176
51. Approval of the Unaudited Interim
Financial Report 176
UNAUDITED SUPPLEMENTARY FINANCIAL
INFORMATION 177
Review Report
82
To the board of directors of Industrial and Commercial Bank of China Limited
(Incorporated in the People’s Republic of China with limited liability)
Introduction
We have reviewed the interim financial report set out on pages 83 to 176, which comprises the consolidated statement of financial position of Industrial and Commercial Bank of China Limited (the “Bank”) and its subsidiaries (collectively the “Group”) as of 30 June 2017 and the related consolidated statement of profit or loss, the consolidated statement of profit or loss and other comprehensive income, the consolidated statement of changes in equity and consolidated cash flow statement for the six month period then ended, and explanatory notes. The Rules Governing the Listing of Securities on The Stock Exchange of Hong Kong Limited require the preparation of an interim financial report to be in compliance with the relevant provisions thereof and International Accounting Standard 34, Interim Financial Reporting, issued by the International Accounting Standards Board. The directors are responsible for the preparation and presentation of the interim financial report in accordance with International Accounting Standard 34.
Our responsibility is to form a conclusion, based on our review, on the interim financial report and to report our conclusion solely to you, as a body, in accordance with our agreed terms of engagement, and for no other purpose. We do not assume responsibility towards or accept liability to any other person for the contents of this report.
Scope of review
We conducted our review in accordance with International Standard on Review Engagements 2410, Review of Interim Financial Information Performed by the Independent Auditor of the Entity, issued by the International Auditing and Assurance Standards Board. A review of the interim financial report consists of making enquiries, primarily of persons responsible for financial and accounting matters, and applying analytical and other review procedures. A review is substantially less in scope than an audit conducted in accordance with International Standards on Auditing and consequently does not enable us to obtain assurance that we would become aware of all significant matters that might be identified in an audit. Accordingly we do not express an audit opinion.
Conclusion
Based on our review, nothing has come to our attention that causes us to believe that the interim financial report as at 30 June 2017 is not prepared, in all material respects, in accordance with International Accounting Standard 34, Interim Financial Reporting.
KPMGCertified Public Accountants8th Floor, Prince’s Building10 Chater RoadCentral, Hong Kong
30 August 2017
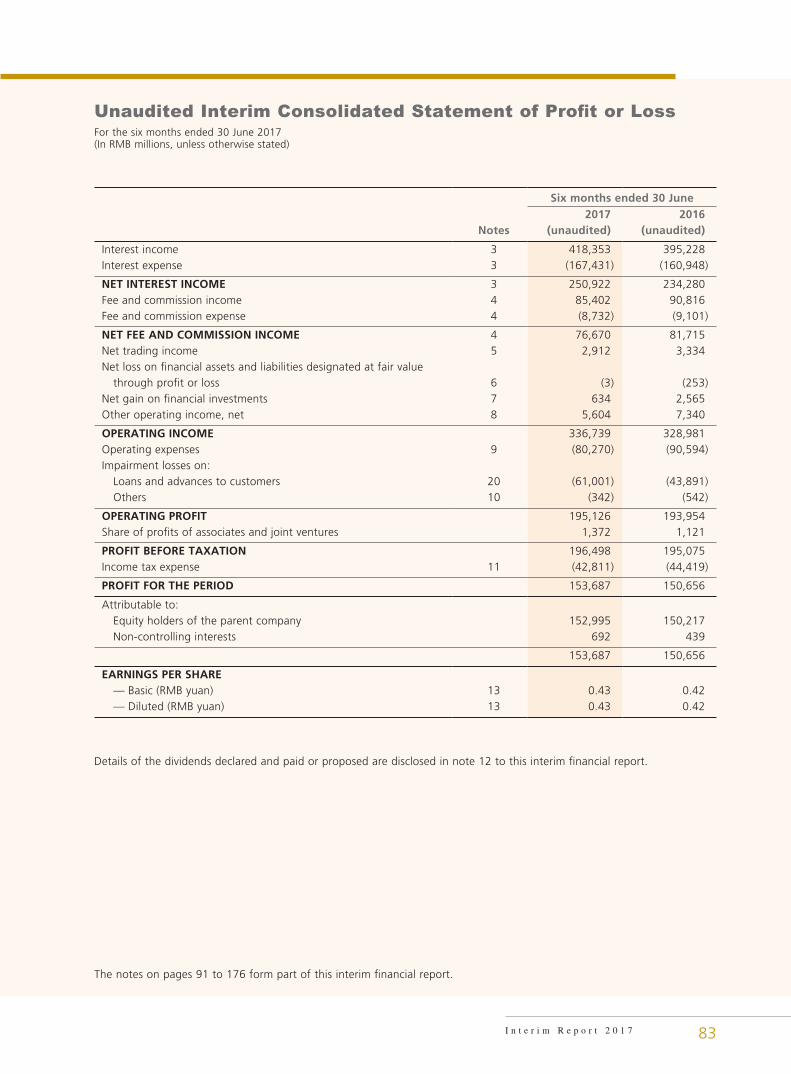
For the six months ended 30 June 2017(In RMB millions, unless otherwise stated)
Unaudited Interim Consolidated Statement of Profit or Loss
83I n t e r i m R e p o r t 2 0 1 7
The notes on pages 91 to 176 form part of this interim financial report.
Six months ended 30 June2017 2016
Notes (unaudited) (unaudited)
Interest income 3 418,353 395,228Interest expense 3 (167,431) (160,948)
NET INTEREST INCOME 3 250,922 234,280Fee and commission income 4 85,402 90,816Fee and commission expense 4 (8,732) (9,101)
NET FEE AND COMMISSION INCOME 4 76,670 81,715Net trading income 5 2,912 3,334Net loss on financial assets and liabilities designated at fair value through profit or loss 6 (3) (253)Net gain on financial investments 7 634 2,565Other operating income, net 8 5,604 7,340
OPERATING INCOME 336,739 328,981Operating expenses 9 (80,270) (90,594)Impairment losses on: Loans and advances to customers 20 (61,001) (43,891) Others 10 (342) (542)
OPERATING PROFIT 195,126 193,954Share of profits of associates and joint ventures 1,372 1,121
PROFIT BEFORE TAXATION 196,498 195,075Income tax expense 11 (42,811) (44,419)
PROFIT FOR THE PERIOD 153,687 150,656
Attributable to: Equity holders of the parent company 152,995 150,217 Non-controlling interests 692 439
153,687 150,656
EARNINGS PER SHARE — Basic (RMB yuan) 13 0.43 0.42 — Diluted (RMB yuan) 13 0.43 0.42
Details of the dividends declared and paid or proposed are disclosed in note 12 to this interim financial report.
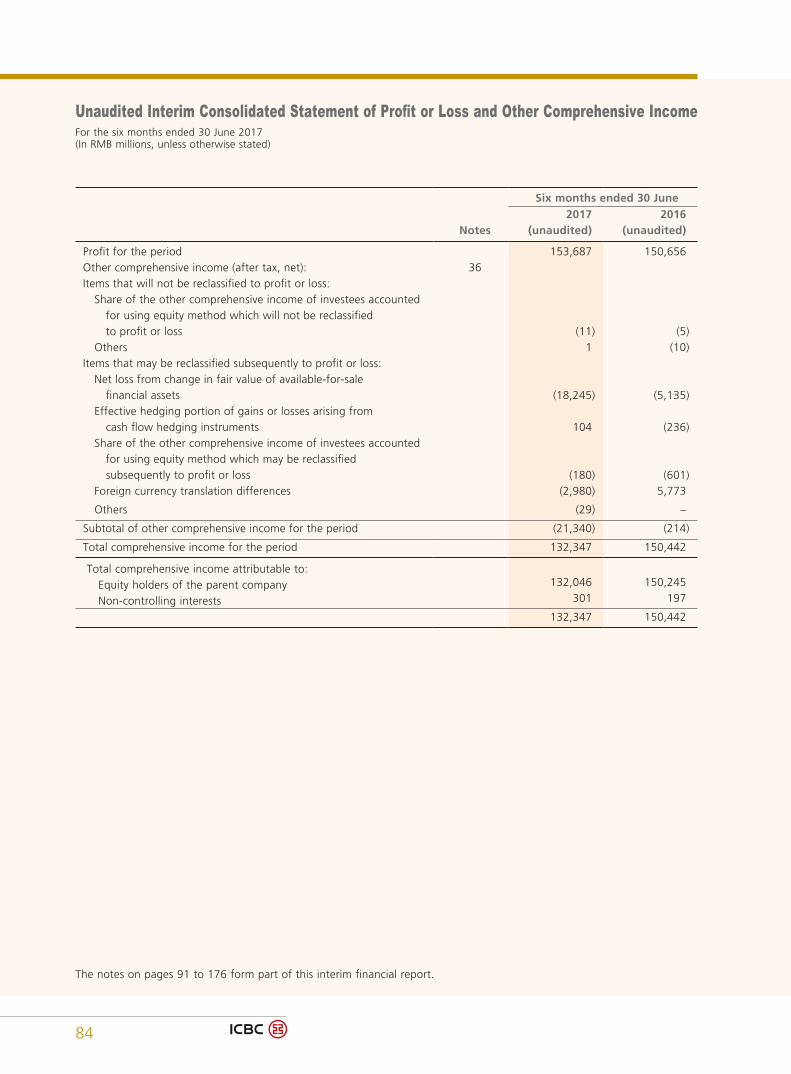
Unaudited Interim Consolidated Statement of Profit or Loss and Other Comprehensive IncomeFor the six months ended 30 June 2017(In RMB millions, unless otherwise stated)
84
The notes on pages 91 to 176 form part of this interim financial report.
Six months ended 30 June2017 2016
Notes (unaudited) (unaudited)
Profit for the period 153,687 150,656Other comprehensive income (after tax, net): 36Items that will not be reclassified to profit or loss: Share of the other comprehensive income of investees accounted for using equity method which will not be reclassified to profit or loss (11) (5) Others 1 (10)Items that may be reclassified subsequently to profit or loss: Net loss from change in fair value of available-for-sale financial assets (18,245) (5,135) Effective hedging portion of gains or losses arising from cash flow hedging instruments 104 (236) Share of the other comprehensive income of investees accounted for using equity method which may be reclassified subsequently to profit or loss (180) (601) Foreign currency translation differences (2,980) 5,773
Others (29) –
Subtotal of other comprehensive income for the period (21,340) (214)
Total comprehensive income for the period 132,347 150,442
Total comprehensive income attributable to: Equity holders of the parent company 132,046 150,245
Non-controlling interests 301 197
132,347 150,442
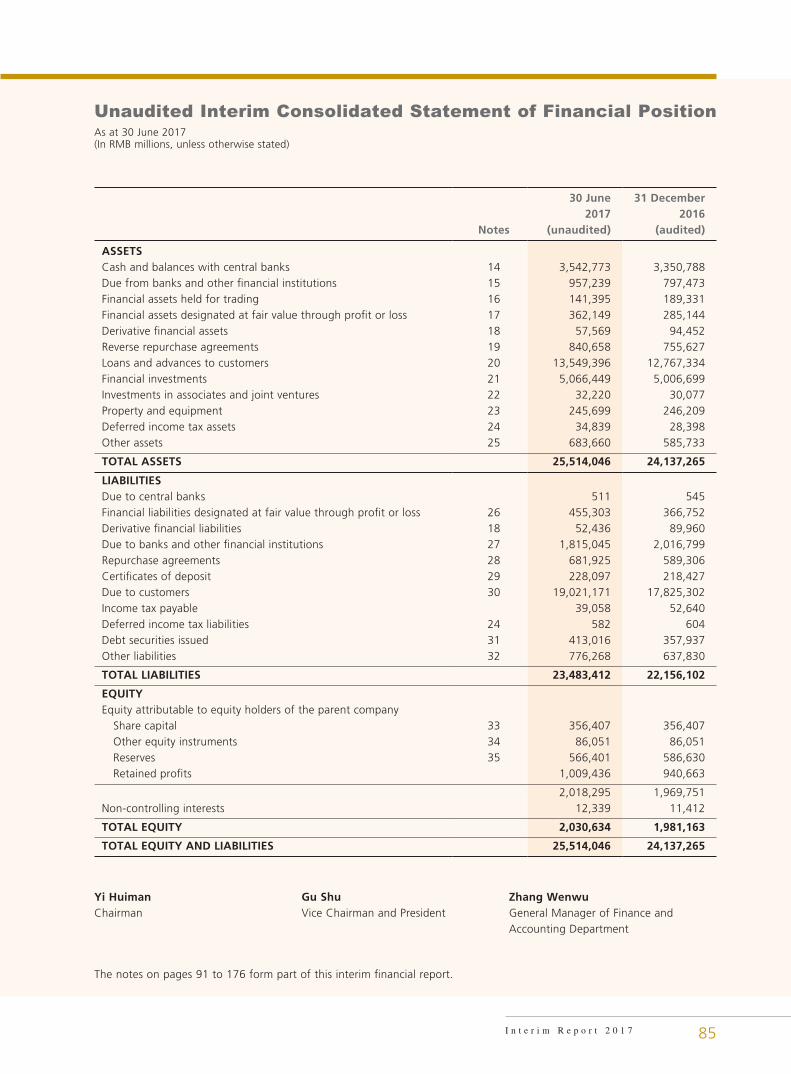
As at 30 June 2017(In RMB millions, unless otherwise stated)
Unaudited Interim Consolidated Statement of Financial Position
85I n t e r i m R e p o r t 2 0 1 7
The notes on pages 91 to 176 form part of this interim financial report.
30 June 31 December2017 2016
Notes (unaudited) (audited)
ASSETSCash and balances with central banks 14 3,542,773 3,350,788Due from banks and other financial institutions 15 957,239 797,473Financial assets held for trading 16 141,395 189,331Financial assets designated at fair value through profit or loss 17 362,149 285,144Derivative financial assets 18 57,569 94,452Reverse repurchase agreements 19 840,658 755,627Loans and advances to customers 20 13,549,396 12,767,334Financial investments 21 5,066,449 5,006,699Investments in associates and joint ventures 22 32,220 30,077Property and equipment 23 245,699 246,209Deferred income tax assets 24 34,839 28,398Other assets 25 683,660 585,733
TOTAL ASSETS 25,514,046 24,137,265
LIABILITIESDue to central banks 511 545Financial liabilities designated at fair value through profit or loss 26 455,303 366,752Derivative financial liabilities 18 52,436 89,960Due to banks and other financial institutions 27 1,815,045 2,016,799Repurchase agreements 28 681,925 589,306Certificates of deposit 29 228,097 218,427Due to customers 30 19,021,171 17,825,302Income tax payable 39,058 52,640Deferred income tax liabilities 24 582 604Debt securities issued 31 413,016 357,937Other liabilities 32 776,268 637,830
TOTAL LIABILITIES 23,483,412 22,156,102
EQUITYEquity attributable to equity holders of the parent company Share capital 33 356,407 356,407 Other equity instruments 34 86,051 86,051 Reserves 35 566,401 586,630 Retained profits 1,009,436 940,663
2,018,295 1,969,751Non-controlling interests 12,339 11,412
TOTAL EQUITY 2,030,634 1,981,163
TOTAL EQUITY AND LIABILITIES 25,514,046 24,137,265
Yi Huiman Gu Shu Zhang WenwuChairman Vice Chairman and President General Manager of Finance and
Accounting Department

Unaudited Interim Consolidated Statement of Changes in EquityFor the six months ended 30 June 2017(In RMB millions, unless otherwise stated)
86
The notes on pages 91 to 176 form part of this interim financial report.
Attributable to equity holders of the parent company
ReservesForeign
Issued Other Investment currency Cash flow Non-share equity Capital Surplus General revaluation translation hedging Other Retained controlling Total
capital instruments reserve reserve reserve reserve reserve reserve reserves Subtotal profits Total interests equityBalance as at 1 January 2017 356,407 86,051 152,043 205,021 251,349 1,133 (18,050) (4,645) (221) 586,630 940,663 1,969,751 11,412 1,981,163Profit for the period – – – – – – – – – – 152,995 152,995 692 153,687Other comprehensive income (note 36) – – – – – (17,997) (2,804) 69 (217) (20,949) – (20,949) (391) (21,340)
Total comprehensive income – – – – – (17,997) (2,804) 69 (217) (20,949) 152,995 132,046 301 132,347
Dividends – ordinary shares 2016 final (note 12) – – – – – – – – – – (83,506) (83,506) – (83,506)Appropriation to surplus reserve (i) – – – 292 – – – – – 292 (292) – – –Appropriation to general reserve (ii) – – – – 424 – – – – 424 (424) – – –Capital injection by non-controlling shareholders – – – – – – – – – – – – 792 792Dividends or interests to non-controlling shareholders – – – – – – – – – – – – (166) (166)Others – – – – – – – – 4 4 – 4 – 4
Balance as at 30 June 2017 (unaudited) 356,407 86,051 152,043 205,313 251,773 (16,864) (20,854) (4,576) (434) 566,401 1,009,436 2,018,295 12,339 2,030,634
(i) Includes the appropriation made by overseas branches and subsidiaries in the amounts of RMB49 million and RMB243 million,
respectively.
(ii) Includes the appropriation made by overseas branches and subsidiaries in the amounts of RMB21 million and RMB403 million,
respectively.

Unaudited Interim Consolidated Statement of Changes in EquityFor the six months ended 30 June 2017
(In RMB millions, unless otherwise stated)
87I n t e r i m R e p o r t 2 0 1 7
The notes on pages 91 to 176 form part of this interim financial report.
Attributable to equity holders of the parent company
ReservesForeign
Issued Other Investment currency Cash flow Non-share equity Capital Surplus General revaluation translation hedging Other Retained controlling Total
capital instruments reserve reserve reserve reserve reserve reserve reserves Subtotal profits Total interests equityBalance as at 1 January 2016 356,407 79,375 152,026 178,040 246,356 29,956 (31,432) (3,926) 684 571,704 781,988 1,789,474 11,045 1,800,519Profit for the period – – – – – – – – – – 150,217 150,217 439 150,656Other comprehensive income (note 36) – – – – – (4,881) 5,726 (201) (616) 28 – 28 (242) (214)Total comprehensive income – – – – – (4,881) 5,726 (201) (616) 28 150,217 150,245 197 150,442Dividends – ordinary shares 2015 final (note 12) – – – – – – – – – – (83,150) (83,150) – (83,150)Appropriation to surplus reserve (i) – – – 400 – – – – – 400 (400) – – –Appropriation to general reserve (ii) – – – – 123 – – – – 123 (123) – – –Change in shareholding in subsidiaries – – 8 – – – – – – 8 – 8 12 20Dividends to non-controlling shareholders – – – – – – – – – – – – (70) (70)Others – – – – – – – – 16 16 – 16 – 16Balance as at 30 June 2016 (unaudited) 356,407 79,375 152,034 178,440 246,479 25,075 (25,706) (4,127) 84 572,279 848,532 1,856,593 11,184 1,867,777
(i) Includes the appropriation made by overseas branches and subsidiaries in the amounts of RMB73 million and RMB327 million,
respectively.
(ii) Includes the appropriation made by subsidiaries in the amount of RMB123 million.
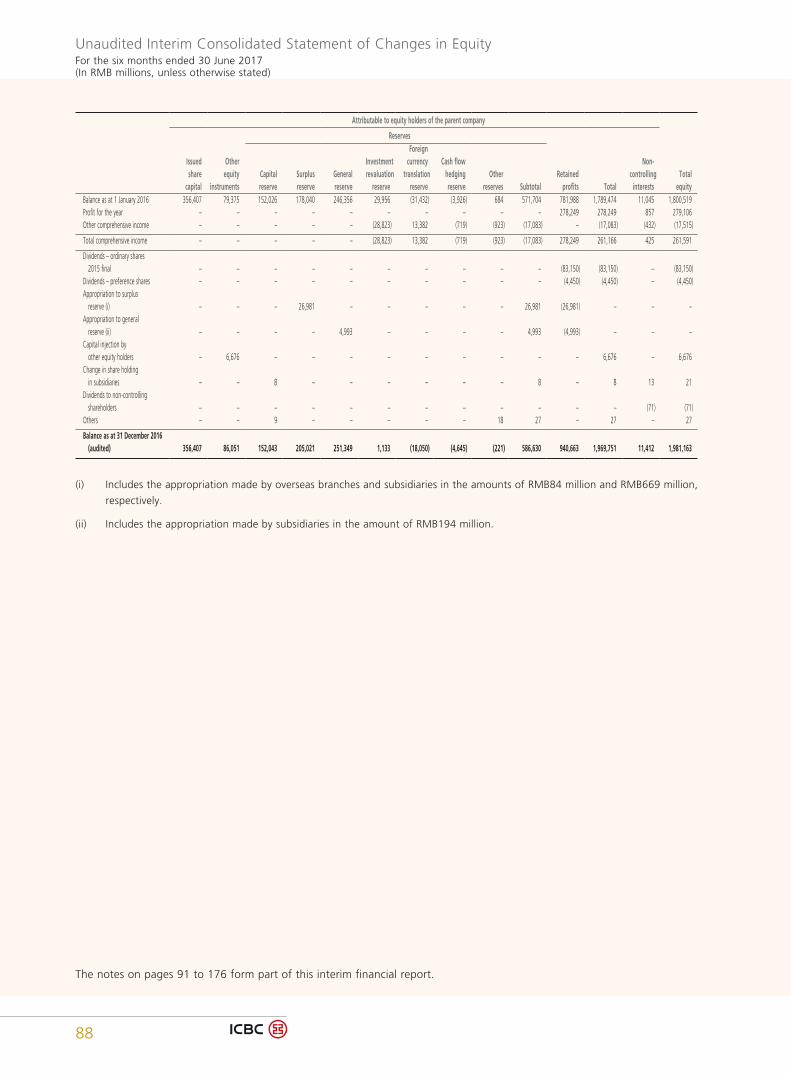
Unaudited Interim Consolidated Statement of Changes in EquityFor the six months ended 30 June 2017(In RMB millions, unless otherwise stated)
88
The notes on pages 91 to 176 form part of this interim financial report.
Attributable to equity holders of the parent company
ReservesForeign
Issued Other Investment currency Cash flow Non-share equity Capital Surplus General revaluation translation hedging Other Retained controlling Total
capital instruments reserve reserve reserve reserve reserve reserve reserves Subtotal profits Total interests equityBalance as at 1 January 2016 356,407 79,375 152,026 178,040 246,356 29,956 (31,432) (3,926) 684 571,704 781,988 1,789,474 11,045 1,800,519Profit for the year – – – – – – – – – – 278,249 278,249 857 279,106Other comprehensive income – – – – – (28,823) 13,382 (719) (923) (17,083) – (17,083) (432) (17,515)
Total comprehensive income – – – – – (28,823) 13,382 (719) (923) (17,083) 278,249 261,166 425 261,591
Dividends – ordinary shares 2015 final – – – – – – – – – – (83,150) (83,150) – (83,150)Dividends – preference shares – – – – – – – – – – (4,450) (4,450) – (4,450)Appropriation to surplus reserve (i) – – – 26,981 – – – – – 26,981 (26,981) – – –Appropriation to general reserve (ii) – – – – 4,993 – – – – 4,993 (4,993) – – –Capital injection by other equity holders – 6,676 – – – – – – – – – 6,676 – 6,676Change in share holding in subsidiaries – – 8 – – – – – – 8 – 8 13 21Dividends to non-controlling shareholders – – – – – – – – – – – – (71) (71)Others – – 9 – – – – – 18 27 – 27 – 27
Balance as at 31 December 2016 (audited) 356,407 86,051 152,043 205,021 251,349 1,133 (18,050) (4,645) (221) 586,630 940,663 1,969,751 11,412 1,981,163
(i) Includes the appropriation made by overseas branches and subsidiaries in the amounts of RMB84 million and RMB669 million,
respectively.
(ii) Includes the appropriation made by subsidiaries in the amount of RMB194 million.

For the six months ended 30 June 2017(In RMB millions, unless otherwise stated)
Unaudited Interim Consolidated Cash Flow Statement
89I n t e r i m R e p o r t 2 0 1 7
The notes on pages 91 to 176 form part of this interim financial report.
Six months ended 30 June2017 2016
Notes (unaudited) (unaudited)
CASH FLOWS FROM OPERATING ACTIVITIESProfit before taxation 196,498 195,075Adjustments for: Share of profits of associates and joint ventures (1,372) (1,121) Depreciation 9,365 9,380 Amortisation 9 1,006 1,073 Amortisation of financial investments 13,762 (3,907) Impairment losses on loans and advances to customers 20 61,001 43,891 Impairment losses on assets other than loans and advances to customers 10 342 542 Unrealised loss/(gain) on foreign exchange 2,634 (14,008) Interest expense on debt securities issued 7,736 6,844 Accreted interest on impaired loans 3 (1,632) (2,648) Gain on disposal of available-for-sale financial assets, net 7 (520) (2,461) Net trading (gain)/loss on equity investments 5 (231) 47 Net loss on financial assets and liabilities designated at fair value through profit or loss 6 3 253 Net gain on disposal and overage of property and equipment and other assets (other than repossessed assets) (720) (378) Dividend income 7 (114) (104)
287,758 232,478
Net (increase)/decrease in operating assets: Due from central banks (140,013) (162,821) Due from banks and other financial institutions (5,595) 118,833 Financial assets held for trading 49,206 (44,629) Financial assets designated at fair value through profit or loss (75,970) (49,032) Reverse repurchase agreements (22,890) (9,721) Loans and advances to customers (877,588) (761,127) Other assets (102,190) (178,183)
(1,175,040) (1,086,680)
Net increase/(decrease) in operating liabilities: Financial liabilities designated at fair value through profit or loss 88,314 43,436 Due to central banks (34) 170 Due to banks and other financial institutions (186,068) (34,695) Repurchase agreements 92,619 7,838 Certificates of deposit 14,580 12,929 Due to customers 1,225,931 1,066,410 Other liabilities 55,294 129,769
1,290,636 1,225,857
Net cash flows from operating activities before tax 403,354 371,655Income tax paid (56,812) (74,023)
Net cash flows from operating activities 346,542 297,632

Unaudited Interim Consolidated Cash Flow StatementFor the six months ended 30 June 2017(In RMB millions, unless otherwise stated)
90
The notes on pages 91 to 176 form part of this interim financial report.
Six months ended 30 June2017 2016
Notes (unaudited) (unaudited)
CASH FLOWS FROM INVESTING ACTIVITIESPurchases of property and equipment and other assets (6,485) (12,489)Proceeds from disposal of property and equipment and other assets (other than repossessed assets) 1,476 428Purchases of financial investments (1,150,318) (1,395,585)Proceeds from sale and redemption of financial investments 1,037,197 980,624Investments in associates and joint ventures (1,510) (426)Dividends received 730 548
Net cash flows from investing activities (118,910) (426,900)
CASH FLOWS FROM FINANCING ACTIVITIESCapital injection by non-controlling shareholders 792 1,520Proceeds from issuance of debt securities 407,043 458,522Interest paid on debt securities (6,271) (5,617)Repayment of debt securities (350,054) (450,724)Dividends or interests paid to non-controlling shareholders (166) –
Net cash flows from financing activities 51,344 3,701
NET INCREASE/(DECREASE) IN CASH AND CASH EQUIVALENTS 278,976 (125,567)Cash and cash equivalents at beginning of the period 1,189,368 1,441,298Effect of exchange rate changes on cash and cash equivalents (10,654) 15,786
CASH AND CASH EQUIVALENTS AT END OF THE PERIOD 38 1,457,690 1,331,517
NET CASH FLOWS FROM OPERATING ACTIVITIES INCLUDE:Interest received 446,317 390,728Interest paid (163,140) (155,513)

For the six months ended 30 June 2017(In RMB millions, unless otherwise stated)
Notes to the Unaudited Interim Financial Report
91I n t e r i m R e p o r t 2 0 1 7
1. CORPORATE INFORMATION
Industrial and Commercial Bank of China Limited (the “Bank”), which was previously known as Industrial and Commercial Bank of China (“ICBC”), used to be a wholly-state-owned commercial bank established on 1 January 1984 based on the authorisation of the State Council and the People’s Bank of China (the “PBOC”) of the People’s Republic of China (the “PRC”). On 28 October 2005, with the approval of the State Council, ICBC was restructured and incorporated as a joint-stock limited company. The joint-stock limited company undertook all the assets and liabilities of ICBC upon the restructuring.
The Bank obtained its finance permit No. B0001H111000001 from the China Banking Regulatory Commission (the “CBRC”) of the PRC. The Bank obtained its business license with unified social credit code 91100000100003962T from the State Administration for Industry and Commerce of the PRC. The legal representative is Yi Huiman and the registered office is located at No. 55 Fuxingmennei Avenue, Xicheng District, Beijing, the PRC.
The Bank’s A Shares and H Shares are listed on the Shanghai Stock Exchange and the Stock Exchange of Hong Kong Limited and the stock codes are 601398 and 1398, respectively. The Bank’s offshore preference shares are listed on the Stock Exchange of Hong Kong Limited and the stock codes are 4603, 4604 and 84602, respectively. The Bank’s domestic preference shares are listed on the Shanghai Stock Exchange and the stock code is 360011.
The principal activities of the Bank and its subsidiaries (collectively referred to as the “Group”) comprise corporate and personal banking, treasury operations, investment banking, asset management, trust, financial leasing, insurance and other financial services. Domestic establishments refer to the Head Office of the Bank, branches and subsidiaries established inside Mainland China. Overseas establishments refer to branches and subsidiaries established under local jurisdictions outside Mainland China.
2. BASIS OF PREPARATION AND ACCOUNTING POLICIESBasis of preparation
The interim financial report has been prepared in accordance with the applicable disclosure provisions of the Rules Governing the Listing of Securities on the Stock Exchange of Hong Kong Limited, and compliance with International Accounting Standard (“IAS”) 34, Interim Financial Reporting, issued by the International Accounting Standards Board. It was authorised for issue on 30 August 2017.
The condensed consolidated interim financial statements and notes thereon do not include all of the information required for full set of financial statements prepared in accordance with International Financial Reporting Standards (“IFRSs”), and should be read in conjunction with the Group’s last annual financial report for the year ended 31 December 2016.
The interim financial report has been reviewed by the Bank’s auditors, KPMG, in accordance with International Standard on Review Engagements 2410, Review of Interim Financial Information Performed by the Independent Auditor of the Entity, issued by International Auditing and Assurance Standards Boards (“IAASB”).
Accounting judgements and estimates
The preparation of the interim financial report in conformity with IAS 34 requires management to make judgements, estimates and assumptions that affect the application of policies and reported amounts of assets and liabilities, income and expenses on a year to date basis. Actual results may differ from these estimates.
The significant judgements made by management in applying the Group’s accounting policies and key sources of uncertainty were the same as those applied in the preparation of the consolidated financial statements for the year ended 31 December 2016.
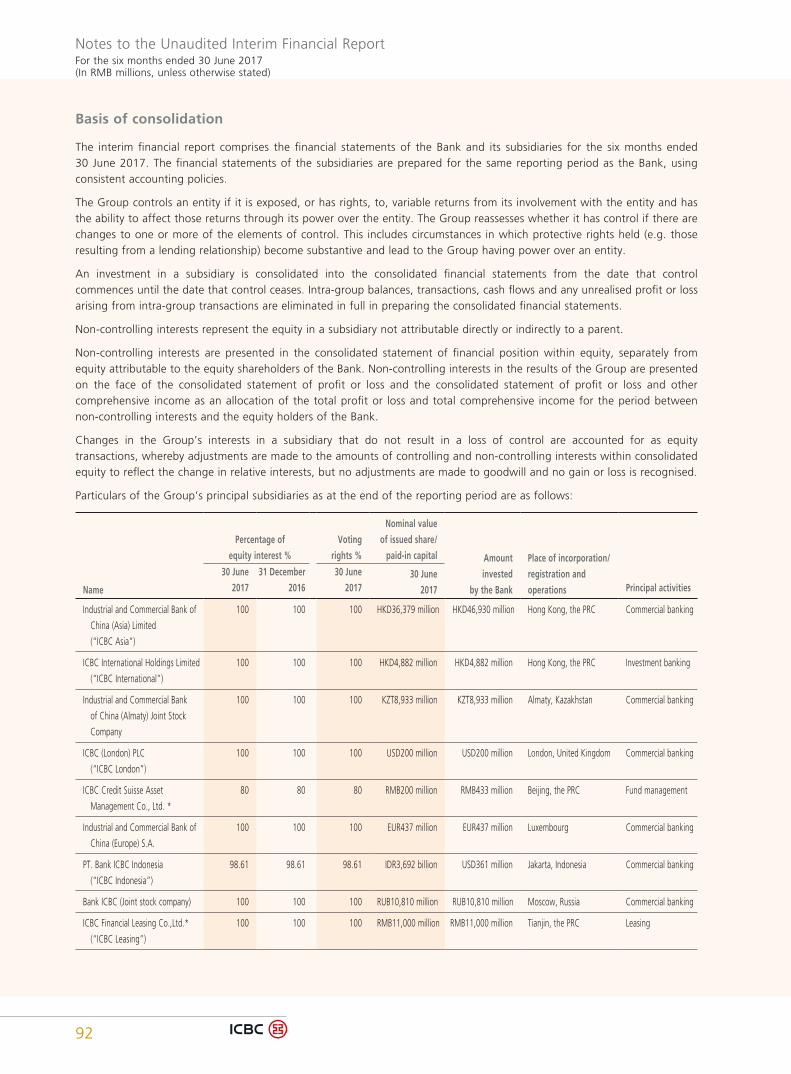
Notes to the Unaudited Interim Financial ReportFor the six months ended 30 June 2017(In RMB millions, unless otherwise stated)
92
Basis of consolidation
The interim financial report comprises the financial statements of the Bank and its subsidiaries for the six months ended 30 June 2017. The financial statements of the subsidiaries are prepared for the same reporting period as the Bank, using consistent accounting policies.
The Group controls an entity if it is exposed, or has rights, to, variable returns from its involvement with the entity and has the ability to affect those returns through its power over the entity. The Group reassesses whether it has control if there are changes to one or more of the elements of control. This includes circumstances in which protective rights held (e.g. those resulting from a lending relationship) become substantive and lead to the Group having power over an entity.
An investment in a subsidiary is consolidated into the consolidated financial statements from the date that control commences until the date that control ceases. Intra-group balances, transactions, cash flows and any unrealised profit or loss arising from intra-group transactions are eliminated in full in preparing the consolidated financial statements.
Non-controlling interests represent the equity in a subsidiary not attributable directly or indirectly to a parent.
Non-controlling interests are presented in the consolidated statement of financial position within equity, separately from equity attributable to the equity shareholders of the Bank. Non-controlling interests in the results of the Group are presented on the face of the consolidated statement of profit or loss and the consolidated statement of profit or loss and other comprehensive income as an allocation of the total profit or loss and total comprehensive income for the period between non-controlling interests and the equity holders of the Bank.
Changes in the Group’s interests in a subsidiary that do not result in a loss of control are accounted for as equity transactions, whereby adjustments are made to the amounts of controlling and non-controlling interests within consolidated equity to reflect the change in relative interests, but no adjustments are made to goodwill and no gain or loss is recognised.
Particulars of the Group’s principal subsidiaries as at the end of the reporting period are as follows:
Percentage of
equity interest %
Voting
rights %
Nominal value
of issued share/
paid-in capital Amount
invested
by the Bank
Place of incorporation/
registration and
operationsName
30 June
2017
31 December
2016
30 June
201730 June
2017 Principal activities
Industrial and Commercial Bank of
China (Asia) Limited
(“ICBC Asia”)
100 100 100 HKD36,379 million HKD46,930 million Hong Kong, the PRC Commercial banking
ICBC International Holdings Limited
(“ICBC International”)
100 100 100 HKD4,882 million HKD4,882 million Hong Kong, the PRC Investment banking
Industrial and Commercial Bank
of China (Almaty) Joint Stock
Company
100 100 100 KZT8,933 million KZT8,933 million Almaty, Kazakhstan Commercial banking
ICBC (London) PLC
(“ICBC London”)
100 100 100 USD200 million USD200 million London, United Kingdom Commercial banking
ICBC Credit Suisse Asset
Management Co., Ltd. *
80 80 80 RMB200 million RMB433 million Beijing, the PRC Fund management
Industrial and Commercial Bank of
China (Europe) S.A.
100 100 100 EUR437 million EUR437 million Luxembourg Commercial banking
PT. Bank ICBC Indonesia
(“ICBC Indonesia”)
98.61 98.61 98.61 IDR3,692 billion USD361 million Jakarta, Indonesia Commercial banking
Bank ICBC (Joint stock company) 100 100 100 RUB10,810 million RUB10,810 million Moscow, Russia Commercial banking
ICBC Financial Leasing Co.,Ltd.*
(“ICBC Leasing”)
100 100 100 RMB11,000 million RMB11,000 million Tianjin, the PRC Leasing
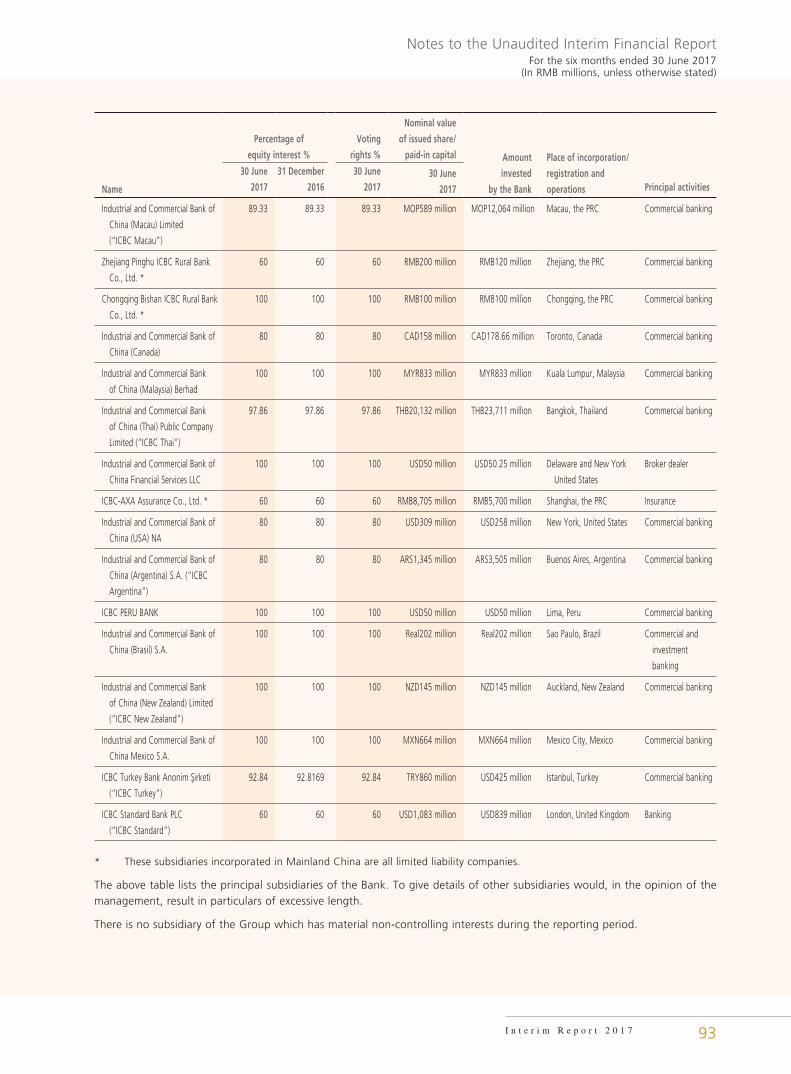
Notes to the Unaudited Interim Financial ReportFor the six months ended 30 June 2017
(In RMB millions, unless otherwise stated)
93I n t e r i m R e p o r t 2 0 1 7
Percentage of
equity interest %
Voting
rights %
Nominal value
of issued share/
paid-in capital Amount
invested
by the Bank
Place of incorporation/
registration and
operationsName
30 June
2017
31 December
2016
30 June
201730 June
2017 Principal activities
Industrial and Commercial Bank of
China (Macau) Limited
(“ICBC Macau”)
89.33 89.33 89.33 MOP589 million MOP12,064 million Macau, the PRC Commercial banking
Zhejiang Pinghu ICBC Rural Bank
Co., Ltd. *
60 60 60 RMB200 million RMB120 million Zhejiang, the PRC Commercial banking
Chongqing Bishan ICBC Rural Bank
Co., Ltd. *
100 100 100 RMB100 million RMB100 million Chongqing, the PRC Commercial banking
Industrial and Commercial Bank of
China (Canada)
80 80 80 CAD158 million CAD178.66 million Toronto, Canada Commercial banking
Industrial and Commercial Bank
of China (Malaysia) Berhad
100 100 100 MYR833 million MYR833 million Kuala Lumpur, Malaysia Commercial banking
Industrial and Commercial Bank
of China (Thai) Public Company
Limited (“ICBC Thai”)
97.86 97.86 97.86 THB20,132 million THB23,711 million Bangkok, Thailand Commercial banking
Industrial and Commercial Bank of
China Financial Services LLC
100 100 100 USD50 million USD50.25 million Delaware and New York
United States
Broker dealer
ICBC-AXA Assurance Co., Ltd. * 60 60 60 RMB8,705 million RMB5,700 million Shanghai, the PRC Insurance
Industrial and Commercial Bank of
China (USA) NA
80 80 80 USD309 million USD258 million New York, United States Commercial banking
Industrial and Commercial Bank of
China (Argentina) S.A. (“ICBC
Argentina”)
80 80 80 ARS1,345 million ARS3,505 million Buenos Aires, Argentina Commercial banking
ICBC PERU BANK 100 100 100 USD50 million USD50 million Lima, Peru Commercial banking
Industrial and Commercial Bank of
China (Brasil) S.A.
100 100 100 Real202 million Real202 million Sao Paulo, Brazil Commercial and
investment
banking
Industrial and Commercial Bank
of China (New Zealand) Limited
(“ICBC New Zealand”)
100 100 100 NZD145 million NZD145 million Auckland, New Zealand Commercial banking
Industrial and Commercial Bank of
China Mexico S.A.
100 100 100 MXN664 million MXN664 million Mexico City, Mexico Commercial banking
ICBC Turkey Bank Anonim Sirketi
(“ICBC Turkey”)
92.84 92.8169 92.84 TRY860 million USD425 million Istanbul, Turkey Commercial banking
ICBC Standard Bank PLC
(“ICBC Standard”)
60 60 60 USD1,083 million USD839 million London, United Kingdom Banking
* These subsidiaries incorporated in Mainland China are all limited liability companies.
The above table lists the principal subsidiaries of the Bank. To give details of other subsidiaries would, in the opinion of the management, result in particulars of excessive length.
There is no subsidiary of the Group which has material non-controlling interests during the reporting period.

Notes to the Unaudited Interim Financial ReportFor the six months ended 30 June 2017(In RMB millions, unless otherwise stated)
94
Significant accounting policies
The accounting policies adopted in the preparation of the interim financial report are consistent with those followed in the preparation of the Group’s annual financial report for the year ended 31 December 2016, except for the accounting policy changes that are expected to be reflected in the 2017 annual financial statements. The principal effects of new and revised International Financial Reporting Standards (“IFRSs”, including International Accounting Standards (“IASs”)) are as follows:
Amendments to IAS 12, Income taxes “Recognition of deferred tax assets for unrealised losses”
The amendments stemmed from a request to clarify the requirements on recognition of deferred tax assets for unrealised losses on debt instruments measured at fair value. However, the amendments address a broader area of accounting for deferred tax assets in general.
The amendments clarify that the existence of a deductible temporary difference depends solely on a comparison of the carrying amount of an asset and its tax base at the end of the reporting period, and is not affected by possible future changes in the carrying amount or expected manner of recovery of the asset.
The amendments also provide guidance on how an entity should determine future taxable profits to support the recognition of a deferred tax asset arising from a deductible temporary difference.
The adoption will not have any material impact on the financial position and the financial result of the Group.
Annual Improvements to IFRSs 2014–2016 Cycle- Amendments to IFRS 12, Disclosure of interests in other entities
The amendments to IFRS 12 clarify that the disclosure requirements of IFRS 12, other than the requirements to disclose summarised financial information, also apply to an entity’s interests in other entities classified as held for sale or discontinued operations in accordance with IFRS 5.
The adoption will not have any material impact on the financial position and the financial result of the Group.
The Group does not adopt any issued but not yet effective international financial reporting standards, interpretation and amendments.

Notes to the Unaudited Interim Financial ReportFor the six months ended 30 June 2017
(In RMB millions, unless otherwise stated)
95I n t e r i m R e p o r t 2 0 1 7
3. NET INTEREST INCOME
Six months ended 30 June
2017 2016
Interest income on: Loans and advances to customers (i) — Corporate loans and advances 180,089 182,513 — Personal loans 88,968 77,768 — Discounted bills 8,986 10,468 Financial investments (ii) 90,927 87,675 Due from central banks 23,018 21,730 Due from banks and other financial institutions 26,365 15,074
418,353 395,228
Interest expense on: Due to customers (127,754) (129,967) Due to banks and other financial institutions (30,198) (22,598) Debt securities issued (9,479) (8,383)
(167,431) (160,948)
Net interest income 250,922 234,280
The above interest income and expense are related to financial instruments which are not at fair value through profit or loss.
(i) Included in interest income on loans and advances to customers for the period is an amount of RMB1,632 million (six months ended 30 June 2016: RMB2,648 million) with respect to the accreted interest on impaired loans.
(ii) Included in interest income on financial investments for the period is an amount of RMB6 million (six months ended 30 June 2016: RMB18 million) with respect to interest income on impaired debt securities.
4. NET FEE AND COMMISSION INCOME
Six months ended 30 June
2017 2016
Bank card business 18,792 18,859Personal wealth management and private banking services (i) 17,421 20,877Investment banking business 14,729 16,109Settlement, clearing business and cash management 14,076 13,787Corporate wealth management services (i) 10,103 11,276Guarantee and commitment business 4,290 3,195Asset custody business (i) 3,487 3,965Trust and agency services (i) 1,088 1,105Others 1,416 1,643
Fee and commission income 85,402 90,816Fee and commission expense (8,732) (9,101)
Net fee and commission income 76,670 81,715
(i) Included in personal wealth management and private banking services, corporate wealth management services, asset custody business and trust and agency services above for the period is an amount of RMB10,848 million (six months ended 30 June 2016: RMB11,610 million) with respect to trust and other fiduciary activities.
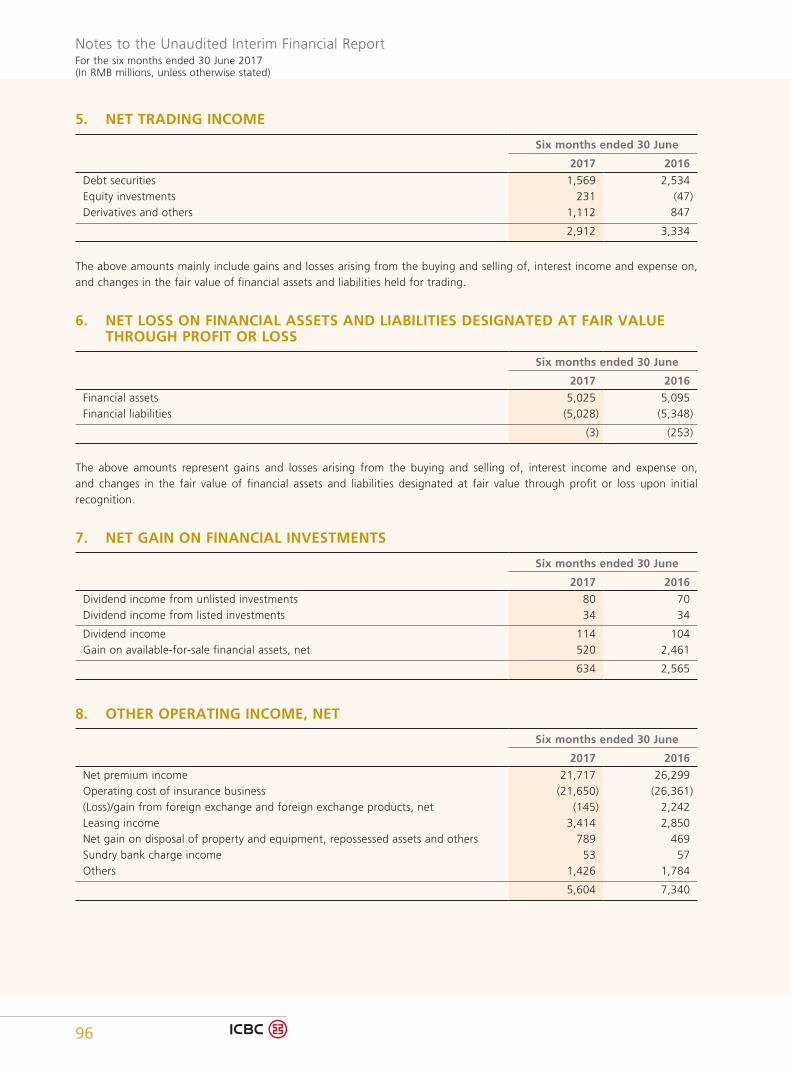
Notes to the Unaudited Interim Financial ReportFor the six months ended 30 June 2017(In RMB millions, unless otherwise stated)
96
5. NET TRADING INCOME
Six months ended 30 June
2017 2016
Debt securities 1,569 2,534Equity investments 231 (47)Derivatives and others 1,112 847
2,912 3,334
The above amounts mainly include gains and losses arising from the buying and selling of, interest income and expense on, and changes in the fair value of financial assets and liabilities held for trading.
6. NET LOSS ON FINANCIAL ASSETS AND LIABILITIES DESIGNATED AT FAIR VALUE THROUGH PROFIT OR LOSS
Six months ended 30 June
2017 2016
Financial assets 5,025 5,095Financial liabilities (5,028) (5,348)
(3) (253)
The above amounts represent gains and losses arising from the buying and selling of, interest income and expense on, and changes in the fair value of financial assets and liabilities designated at fair value through profit or loss upon initial recognition.
7. NET GAIN ON FINANCIAL INVESTMENTS
Six months ended 30 June
2017 2016
Dividend income from unlisted investments 80 70Dividend income from listed investments 34 34
Dividend income 114 104Gain on available-for-sale financial assets, net 520 2,461
634 2,565
8. OTHER OPERATING INCOME, NET
Six months ended 30 June
2017 2016
Net premium income 21,717 26,299Operating cost of insurance business (21,650) (26,361)(Loss)/gain from foreign exchange and foreign exchange products, net (145) 2,242Leasing income 3,414 2,850Net gain on disposal of property and equipment, repossessed assets and others 789 469Sundry bank charge income 53 57Others 1,426 1,784
5,604 7,340
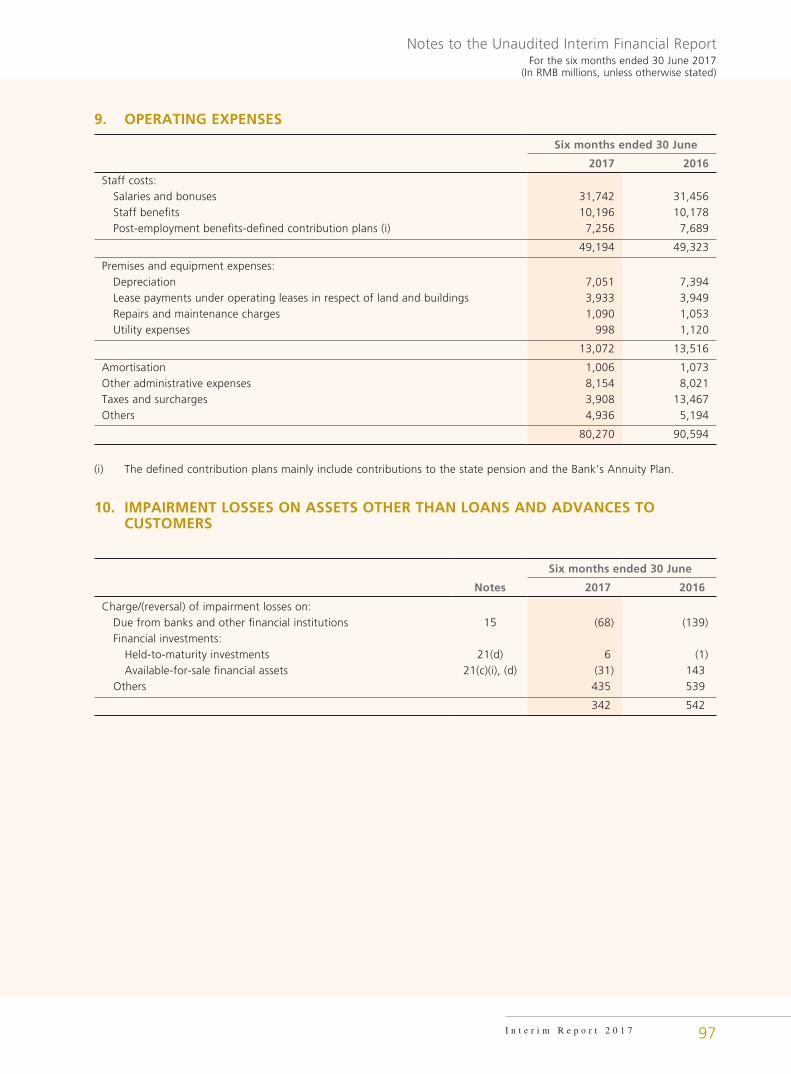
Notes to the Unaudited Interim Financial ReportFor the six months ended 30 June 2017
(In RMB millions, unless otherwise stated)
97I n t e r i m R e p o r t 2 0 1 7
9. OPERATING EXPENSES
Six months ended 30 June
2017 2016
Staff costs: Salaries and bonuses 31,742 31,456 Staff benefits 10,196 10,178 Post-employment benefits-defined contribution plans (i) 7,256 7,689
49,194 49,323
Premises and equipment expenses: Depreciation 7,051 7,394 Lease payments under operating leases in respect of land and buildings 3,933 3,949 Repairs and maintenance charges 1,090 1,053 Utility expenses 998 1,120
13,072 13,516
Amortisation 1,006 1,073Other administrative expenses 8,154 8,021Taxes and surcharges 3,908 13,467Others 4,936 5,194
80,270 90,594
(i) The defined contribution plans mainly include contributions to the state pension and the Bank’s Annuity Plan.
10. IMPAIRMENT LOSSES ON ASSETS OTHER THAN LOANS AND ADVANCES TO CUSTOMERS
Six months ended 30 June
Notes 2017 2016
Charge/(reversal) of impairment losses on: Due from banks and other financial institutions 15 (68) (139) Financial investments: Held-to-maturity investments 21(d) 6 (1) Available-for-sale financial assets 21(c)(i), (d) (31) 143 Others 435 539
342 542

Notes to the Unaudited Interim Financial ReportFor the six months ended 30 June 2017(In RMB millions, unless otherwise stated)
98
11. INCOME TAX EXPENSE(a) Income tax
Six months ended 30 June
2017 2016
Current income tax expense: Mainland China 40,701 36,794 Hong Kong and Macau 994 868 Overseas 1,556 1,412
43,251 39,074Adjustments in respect of income tax of prior years (22) (189)Deferred income tax expense (418) 5,534
42,811 44,419
(b) Reconciliation between income tax and accounting profit
PRC income tax has been provided at the statutory rate of 25% in accordance with the relevant tax laws in Mainland China during the period. Taxes on profits assessable elsewhere have been calculated at the applicable rates of tax prevailing in the countries/regions in which the Group operates, based on existing legislation, interpretations and practices in respect thereof. A reconciliation of the income tax expense applicable to profit before taxation at the PRC statutory income tax rate to income tax expense at the Group’s effective income tax rate is as follows:
Six months ended 30 June
2017 2016
Profit before taxation 196,498 195,075
Tax at the PRC statutory income tax rate (25%) 49,125 48,769Effects of different applicable rates of tax prevailing in other countries/regions (453) (344)Non-deductible expenses (i) 3,736 2,389Non-taxable income (ii) (10,448) (6,490)Profits attributable to associates and joint ventures (343) (280)Adjustment in respect of income tax of prior years (22) (189)Others 1,216 564
Income tax expense 42,811 44,419
(i) The non-deductible expenses mainly represent non-deductible impairment provision and write-offs.
(ii) The non-taxable income mainly represents interest income arising from the PRC government bonds and municipal debts, which is exempted from income tax.
12. DIVIDENDS
Six months ended 30 June
2017 2016
Dividends on ordinary shares declared and paid or proposed: Final dividend on ordinary shares for 2016: RMB0.2343 per share (2015: RMB0.2333 per share) 83,506 83,150
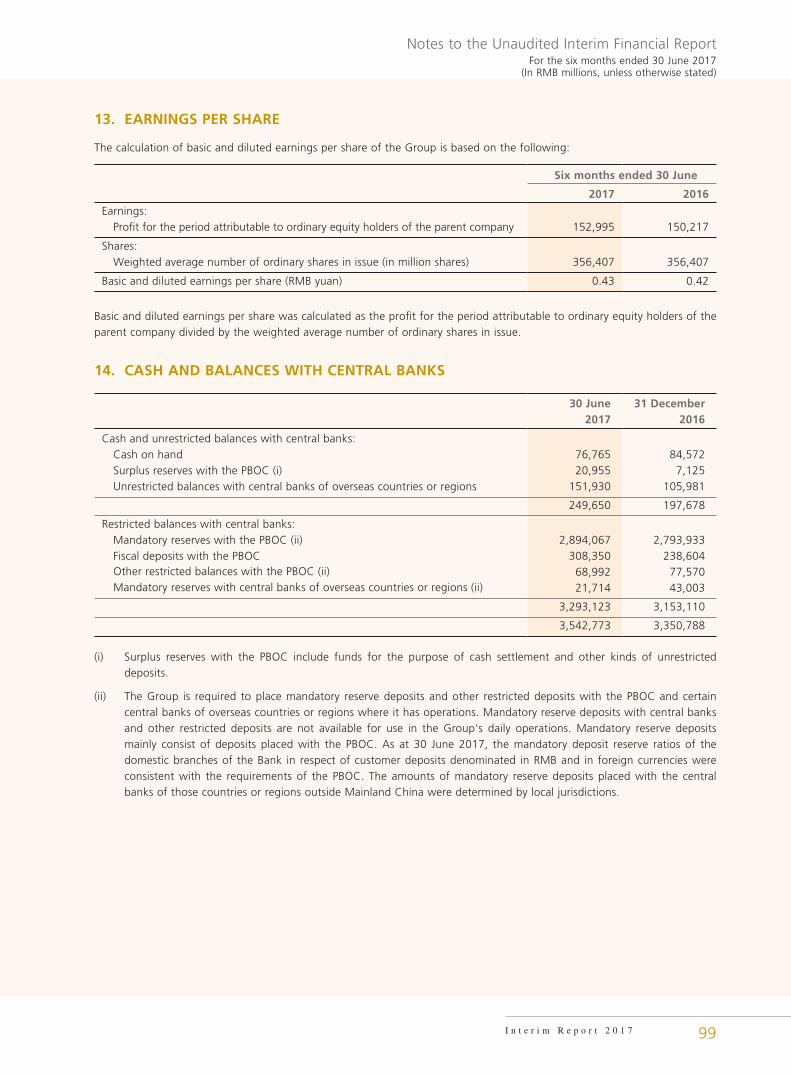
Notes to the Unaudited Interim Financial ReportFor the six months ended 30 June 2017
(In RMB millions, unless otherwise stated)
99I n t e r i m R e p o r t 2 0 1 7
13. EARNINGS PER SHARE
The calculation of basic and diluted earnings per share of the Group is based on the following:
Six months ended 30 June
2017 2016
Earnings: Profit for the period attributable to ordinary equity holders of the parent company 152,995 150,217
Shares: Weighted average number of ordinary shares in issue (in million shares) 356,407 356,407
Basic and diluted earnings per share (RMB yuan) 0.43 0.42
Basic and diluted earnings per share was calculated as the profit for the period attributable to ordinary equity holders of the parent company divided by the weighted average number of ordinary shares in issue.
14. CASH AND BALANCES WITH CENTRAL BANKS
30 June2017
31 December2016
Cash and unrestricted balances with central banks: Cash on hand 76,765 84,572 Surplus reserves with the PBOC (i) 20,955 7,125 Unrestricted balances with central banks of overseas countries or regions 151,930 105,981
249,650 197,678
Restricted balances with central banks: Mandatory reserves with the PBOC (ii) 2,894,067 2,793,933 Fiscal deposits with the PBOC 308,350 238,604 Other restricted balances with the PBOC (ii) 68,992 77,570 Mandatory reserves with central banks of overseas countries or regions (ii) 21,714 43,003
3,293,123 3,153,110
3,542,773 3,350,788
(i) Surplus reserves with the PBOC include funds for the purpose of cash settlement and other kinds of unrestricted deposits.
(ii) The Group is required to place mandatory reserve deposits and other restricted deposits with the PBOC and certain central banks of overseas countries or regions where it has operations. Mandatory reserve deposits with central banks and other restricted deposits are not available for use in the Group’s daily operations. Mandatory reserve deposits mainly consist of deposits placed with the PBOC. As at 30 June 2017, the mandatory deposit reserve ratios of the domestic branches of the Bank in respect of customer deposits denominated in RMB and in foreign currencies were consistent with the requirements of the PBOC. The amounts of mandatory reserve deposits placed with the central banks of those countries or regions outside Mainland China were determined by local jurisdictions.

Notes to the Unaudited Interim Financial ReportFor the six months ended 30 June 2017(In RMB millions, unless otherwise stated)
100
15. DUE FROM BANKS AND OTHER FINANCIAL INSTITUTIONS
30 June2017
31 December2016
Due from banks and other financial institutions: Banks operating in Mainland China 361,975 223,884 Other financial institutions operating in Mainland China 3,570 1,071 Banks and other financial institutions operating outside Mainland China 82,166 45,430
447,711 270,385Less: Allowance for impairment losses (263) (327)
447,448 270,058
Placements with banks and other financial institutions: Banks operating in Mainland China 123,791 105,798 Other financial institutions operating in Mainland China 238,557 301,776 Banks and other financial institutions operating outside Mainland China 147,557 119,959
509,905 527,533Less: Allowance for impairment losses (114) (118)
509,791 527,415
957,239 797,473
As at 30 June 2017, the amount of the placements from the Group with non-principal guaranteed wealth management products sponsored by the Group is RMB23,530 million (31 December 2016: RMB94,914 million). During the reporting period, the maximum exposure of the placements from the Group with non-principal guaranteed wealth management products sponsored by the Group is RMB112,725 million (2016: RMB163,062 million). The transactions were conducted in the ordinary course of business under normal terms and conditions.
Movements of the allowance for impairment losses during the period are as follows:
Due frombanks and other
financial institutions
Placements withbanks and other
financial institutions Total
At 1 January 2016 329 39 368(Reversal)/charge for the year (2) 79 77
At 31 December 2016 and 1 January 2017 327 118 445Reversal for the period (64) (4) (68)
At 30 June 2017 263 114 377
16. FINANCIAL ASSETS HELD FOR TRADING
30 June2017
31 December2016
Debt securities 134,593 183,315Equity investments 6,802 6,016
141,395 189,331
Debt securities analysed into: Listed in Hong Kong 4,105 1,248 Listed outside Hong Kong 14,469 7,598 Unlisted 116,019 174,469
134,593 183,315
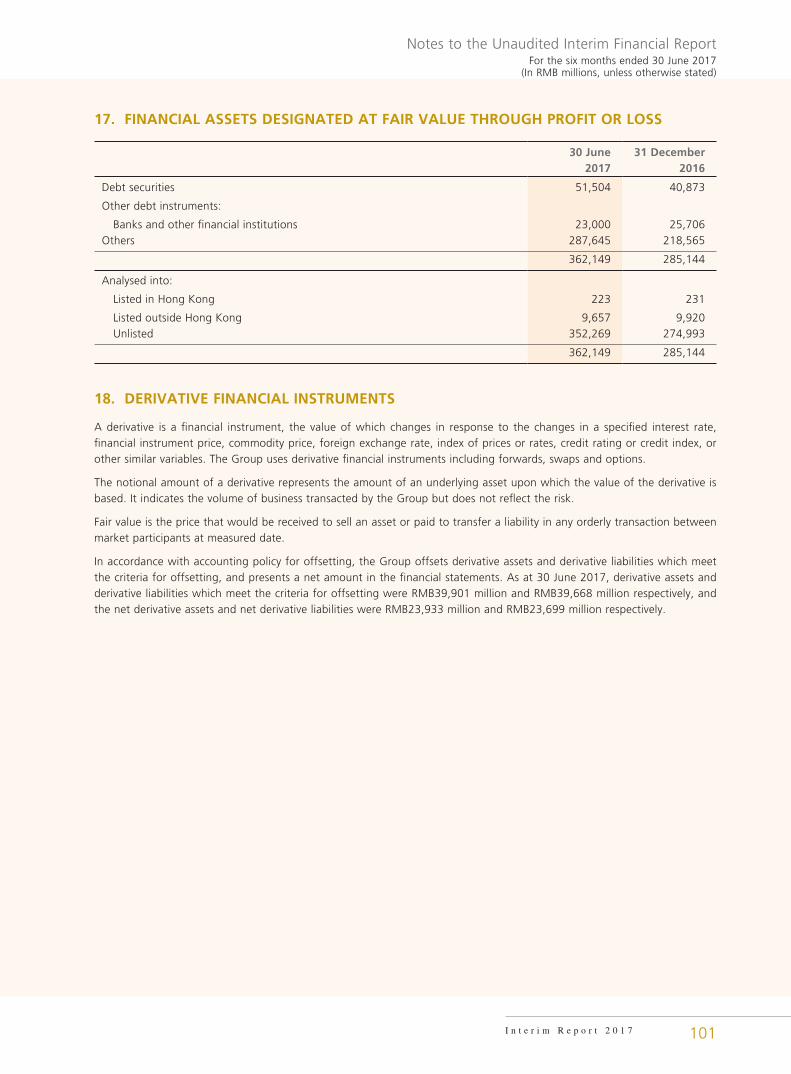
Notes to the Unaudited Interim Financial ReportFor the six months ended 30 June 2017
(In RMB millions, unless otherwise stated)
101I n t e r i m R e p o r t 2 0 1 7
17. FINANCIAL ASSETS DESIGNATED AT FAIR VALUE THROUGH PROFIT OR LOSS
30 June2017
31 December 2016
Debt securities 51,504 40,873
Other debt instruments:
Banks and other financial institutions 23,000 25,706Others 287,645 218,565
362,149 285,144
Analysed into:
Listed in Hong Kong 223 231
Listed outside Hong Kong 9,657 9,920 Unlisted 352,269 274,993
362,149 285,144
18. DERIVATIVE FINANCIAL INSTRUMENTS
A derivative is a financial instrument, the value of which changes in response to the changes in a specified interest rate, financial instrument price, commodity price, foreign exchange rate, index of prices or rates, credit rating or credit index, or other similar variables. The Group uses derivative financial instruments including forwards, swaps and options.
The notional amount of a derivative represents the amount of an underlying asset upon which the value of the derivative is based. It indicates the volume of business transacted by the Group but does not reflect the risk.
Fair value is the price that would be received to sell an asset or paid to transfer a liability in any orderly transaction between market participants at measured date.
In accordance with accounting policy for offsetting, the Group offsets derivative assets and derivative liabilities which meet the criteria for offsetting, and presents a net amount in the financial statements. As at 30 June 2017, derivative assets and derivative liabilities which meet the criteria for offsetting were RMB39,901 million and RMB39,668 million respectively, and the net derivative assets and net derivative liabilities were RMB23,933 million and RMB23,699 million respectively.
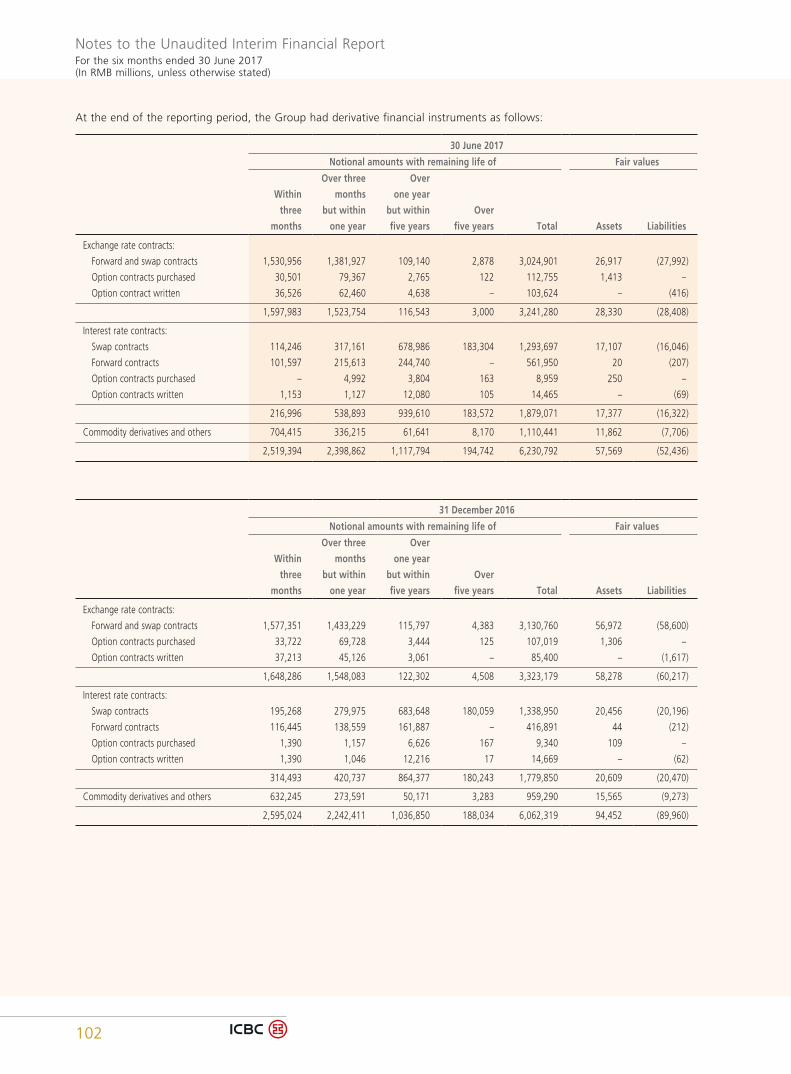
Notes to the Unaudited Interim Financial ReportFor the six months ended 30 June 2017(In RMB millions, unless otherwise stated)
102
At the end of the reporting period, the Group had derivative financial instruments as follows:
30 June 2017
Notional amounts with remaining life of Fair values
Within
three
months
Over three
months
but within
one year
Over
one year
but within
five years
Over
five years Total Assets Liabilities
Exchange rate contracts:
Forward and swap contracts 1,530,956 1,381,927 109,140 2,878 3,024,901 26,917 (27,992)
Option contracts purchased 30,501 79,367 2,765 122 112,755 1,413 –
Option contract written 36,526 62,460 4,638 – 103,624 – (416)
1,597,983 1,523,754 116,543 3,000 3,241,280 28,330 (28,408)
Interest rate contracts:
Swap contracts 114,246 317,161 678,986 183,304 1,293,697 17,107 (16,046)
Forward contracts 101,597 215,613 244,740 – 561,950 20 (207)
Option contracts purchased – 4,992 3,804 163 8,959 250 –
Option contracts written 1,153 1,127 12,080 105 14,465 – (69)
216,996 538,893 939,610 183,572 1,879,071 17,377 (16,322)
Commodity derivatives and others 704,415 336,215 61,641 8,170 1,110,441 11,862 (7,706)
2,519,394 2,398,862 1,117,794 194,742 6,230,792 57,569 (52,436)
31 December 2016
Notional amounts with remaining life of Fair values
Within
three
months
Over three
months
but within
one year
Over
one year
but within
five years
Over
five years Total Assets Liabilities
Exchange rate contracts:
Forward and swap contracts 1,577,351 1,433,229 115,797 4,383 3,130,760 56,972 (58,600)
Option contracts purchased 33,722 69,728 3,444 125 107,019 1,306 –
Option contracts written 37,213 45,126 3,061 – 85,400 – (1,617)
1,648,286 1,548,083 122,302 4,508 3,323,179 58,278 (60,217)
Interest rate contracts:
Swap contracts 195,268 279,975 683,648 180,059 1,338,950 20,456 (20,196)
Forward contracts 116,445 138,559 161,887 – 416,891 44 (212)
Option contracts purchased 1,390 1,157 6,626 167 9,340 109 –
Option contracts written 1,390 1,046 12,216 17 14,669 – (62)
314,493 420,737 864,377 180,243 1,779,850 20,609 (20,470)
Commodity derivatives and others 632,245 273,591 50,171 3,283 959,290 15,565 (9,273)
2,595,024 2,242,411 1,036,850 188,034 6,062,319 94,452 (89,960)

Notes to the Unaudited Interim Financial ReportFor the six months ended 30 June 2017
(In RMB millions, unless otherwise stated)
103I n t e r i m R e p o r t 2 0 1 7
Cash flow hedges
The Group’s cash flow hedges consist of interest rate swap contracts, currency swap contracts, currency forward contracts and equity derivatives that are used to protect against exposures to variability of future cash flows.
Among the above derivative financial instruments, those designated as hedging instruments in cash flow hedges are set out below:
30 June 2017
Notional amounts with remaining life of Fair values
Within
three
months
Over three
months
but within
one year
Over
one year
but within
five years
Over
five years Total Assets Liabilities
Interest rate swap contracts – 4,034 7,046 2,167 13,247 212 (27)
Currency swap contracts 23,643 2,358 12,141 1,093 39,235 272 (2,695)
Currency forward contracts 6 6 – – 12 – –
Equity derivatives 51 49 56 – 156 20 (9)
23,700 6,447 19,243 3,260 52,650 504 (2,731)
31 December 2016
Notional amounts with remaining life of Fair values
Within
three
months
Over three
months
but within
one year
Over
one year
but within
five years
Over
five years Total Assets Liabilities
Interest rate swap contracts – 4,213 9,415 2,108 15,736 245 (20)
Currency swap contracts 211 35,304 748 – 36,263 10 (2,257)
Currency forward contracts – 4 – – 4 2 –
Equity derivatives 64 53 44 – 161 14 (5)
275 39,574 10,207 2,108 52,164 271 (2,282)
There was no ineffectiveness recognised in profit or loss that arose from the cash flow hedge for the current period (six months ended 30 June 2016: Nil).
Fair value hedges
Fair value hedges are used by the Group to protect against changes in the fair value of financial assets and financial liability due to movements in market interest rates. Interest rate swaps are used as hedging instruments to hedge the interest risk of financial assets and financial liabilities, respectively.
The effectiveness of hedges based on changes in fair value of the derivatives and the hedged items attributable to the hedged risk recognised in the statement of profit or loss during the period is presented as follows:
Six months ended 30 June
2017 2016
(Loss)/gain arising from fair value hedges, net: — Hedging instruments (264) 34 — Hedged items attributable to the hedged risk 238 (75)
(26) (41)
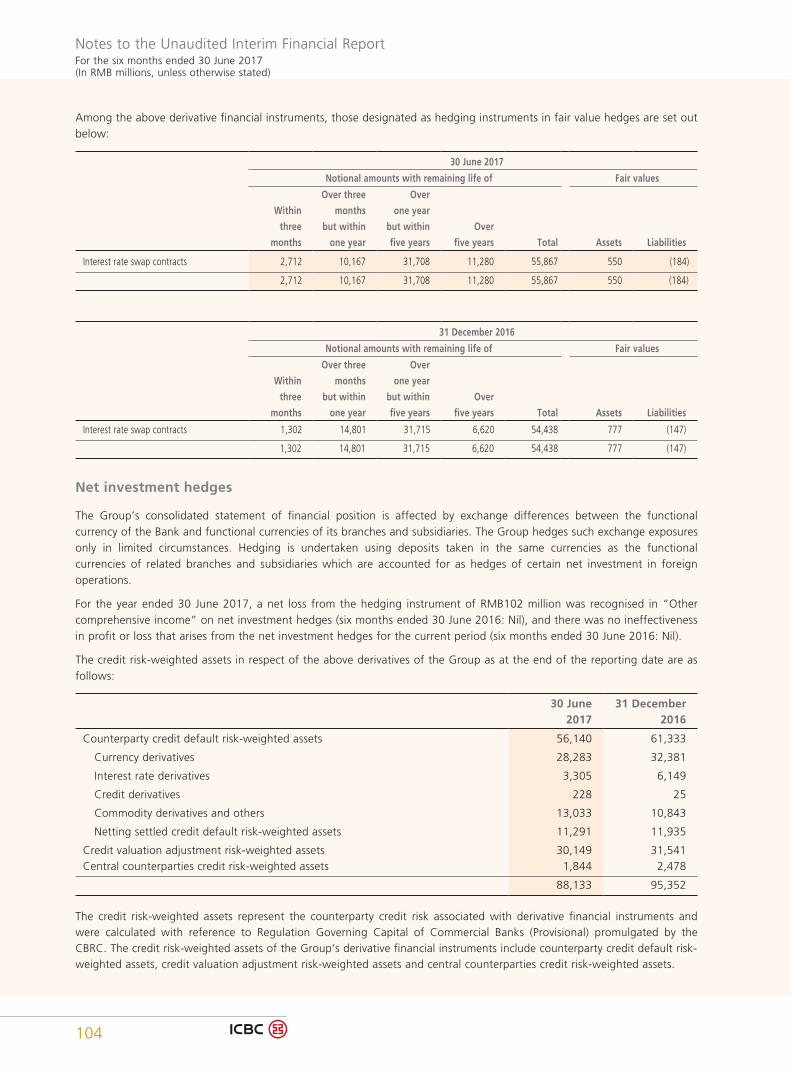
Notes to the Unaudited Interim Financial ReportFor the six months ended 30 June 2017(In RMB millions, unless otherwise stated)
104
Among the above derivative financial instruments, those designated as hedging instruments in fair value hedges are set out below:
30 June 2017
Notional amounts with remaining life of Fair values
Within
three
months
Over three
months
but within
one year
Over
one year
but within
five years
Over
five years Total Assets Liabilities
Interest rate swap contracts 2,712 10,167 31,708 11,280 55,867 550 (184)
2,712 10,167 31,708 11,280 55,867 550 (184)
31 December 2016
Notional amounts with remaining life of Fair values
Within
three
months
Over three
months
but within
one year
Over
one year
but within
five years
Over
five years Total Assets Liabilities
Interest rate swap contracts 1,302 14,801 31,715 6,620 54,438 777 (147)
1,302 14,801 31,715 6,620 54,438 777 (147)
Net investment hedges
The Group’s consolidated statement of financial position is affected by exchange differences between the functional currency of the Bank and functional currencies of its branches and subsidiaries. The Group hedges such exchange exposures only in limited circumstances. Hedging is undertaken using deposits taken in the same currencies as the functional currencies of related branches and subsidiaries which are accounted for as hedges of certain net investment in foreign operations.
For the year ended 30 June 2017, a net loss from the hedging instrument of RMB102 million was recognised in “Other comprehensive income” on net investment hedges (six months ended 30 June 2016: Nil), and there was no ineffectiveness in profit or loss that arises from the net investment hedges for the current period (six months ended 30 June 2016: Nil).
The credit risk-weighted assets in respect of the above derivatives of the Group as at the end of the reporting date are as follows:
30 June2017
31 December 2016
Counterparty credit default risk-weighted assets 56,140 61,333
Currency derivatives 28,283 32,381
Interest rate derivatives 3,305 6,149
Credit derivatives 228 25
Commodity derivatives and others 13,033 10,843
Netting settled credit default risk-weighted assets 11,291 11,935
Credit valuation adjustment risk-weighted assets 30,149 31,541Central counterparties credit risk-weighted assets 1,844 2,478
88,133 95,352
The credit risk-weighted assets represent the counterparty credit risk associated with derivative financial instruments and were calculated with reference to Regulation Governing Capital of Commercial Banks (Provisional) promulgated by the CBRC. The credit risk-weighted assets of the Group’s derivative financial instruments include counterparty credit default risk-weighted assets, credit valuation adjustment risk-weighted assets and central counterparties credit risk-weighted assets.
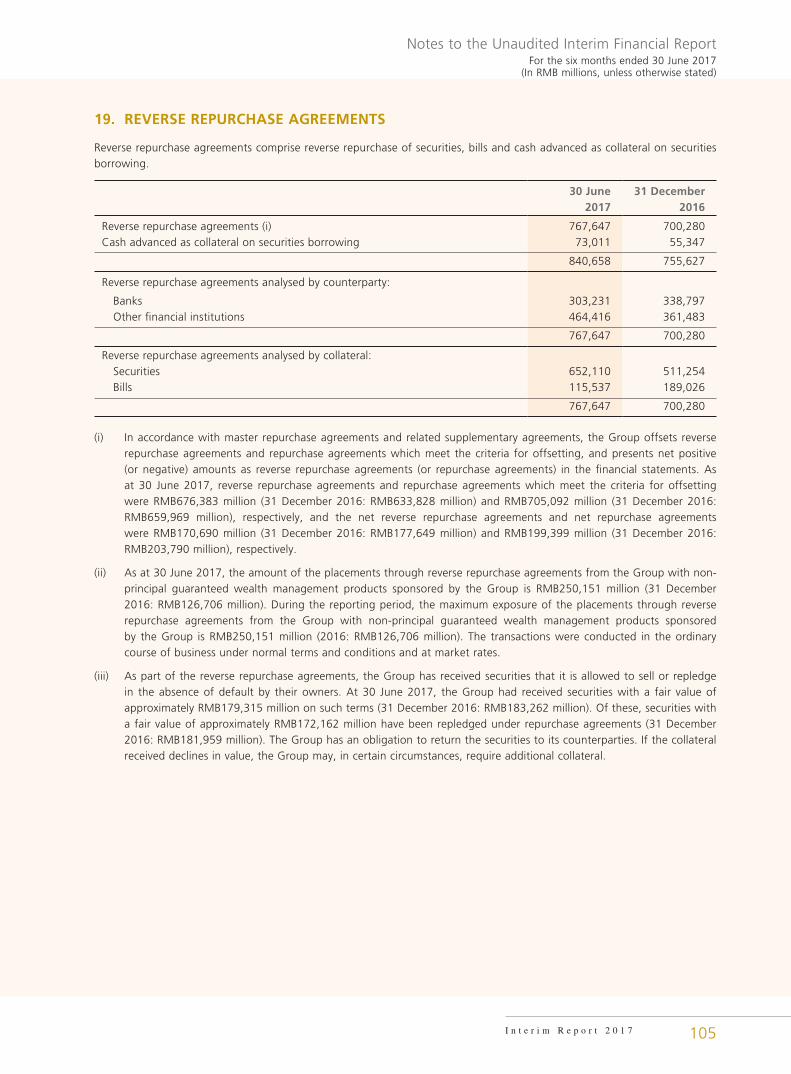
Notes to the Unaudited Interim Financial ReportFor the six months ended 30 June 2017
(In RMB millions, unless otherwise stated)
105I n t e r i m R e p o r t 2 0 1 7
19. REVERSE REPURCHASE AGREEMENTS
Reverse repurchase agreements comprise reverse repurchase of securities, bills and cash advanced as collateral on securities borrowing.
30 June 2017
31 December 2016
Reverse repurchase agreements (i) 767,647 700,280Cash advanced as collateral on securities borrowing 73,011 55,347
840,658 755,627
Reverse repurchase agreements analysed by counterparty:
Banks 303,231 338,797 Other financial institutions 464,416 361,483
767,647 700,280
Reverse repurchase agreements analysed by collateral: Securities 652,110 511,254 Bills 115,537 189,026
767,647 700,280
(i) In accordance with master repurchase agreements and related supplementary agreements, the Group offsets reverse repurchase agreements and repurchase agreements which meet the criteria for offsetting, and presents net positive (or negative) amounts as reverse repurchase agreements (or repurchase agreements) in the financial statements. As at 30 June 2017, reverse repurchase agreements and repurchase agreements which meet the criteria for offsetting were RMB676,383 million (31 December 2016: RMB633,828 million) and RMB705,092 million (31 December 2016: RMB659,969 million), respectively, and the net reverse repurchase agreements and net repurchase agreements were RMB170,690 million (31 December 2016: RMB177,649 million) and RMB199,399 million (31 December 2016: RMB203,790 million), respectively.
(ii) As at 30 June 2017, the amount of the placements through reverse repurchase agreements from the Group with non-principal guaranteed wealth management products sponsored by the Group is RMB250,151 million (31 December 2016: RMB126,706 million). During the reporting period, the maximum exposure of the placements through reverse repurchase agreements from the Group with non-principal guaranteed wealth management products sponsored by the Group is RMB250,151 million (2016: RMB126,706 million). The transactions were conducted in the ordinary course of business under normal terms and conditions and at market rates.
(iii) As part of the reverse repurchase agreements, the Group has received securities that it is allowed to sell or repledge in the absence of default by their owners. At 30 June 2017, the Group had received securities with a fair value of approximately RMB179,315 million on such terms (31 December 2016: RMB183,262 million). Of these, securities with a fair value of approximately RMB172,162 million have been repledged under repurchase agreements (31 December 2016: RMB181,959 million). The Group has an obligation to return the securities to its counterparties. If the collateral received declines in value, the Group may, in certain circumstances, require additional collateral.
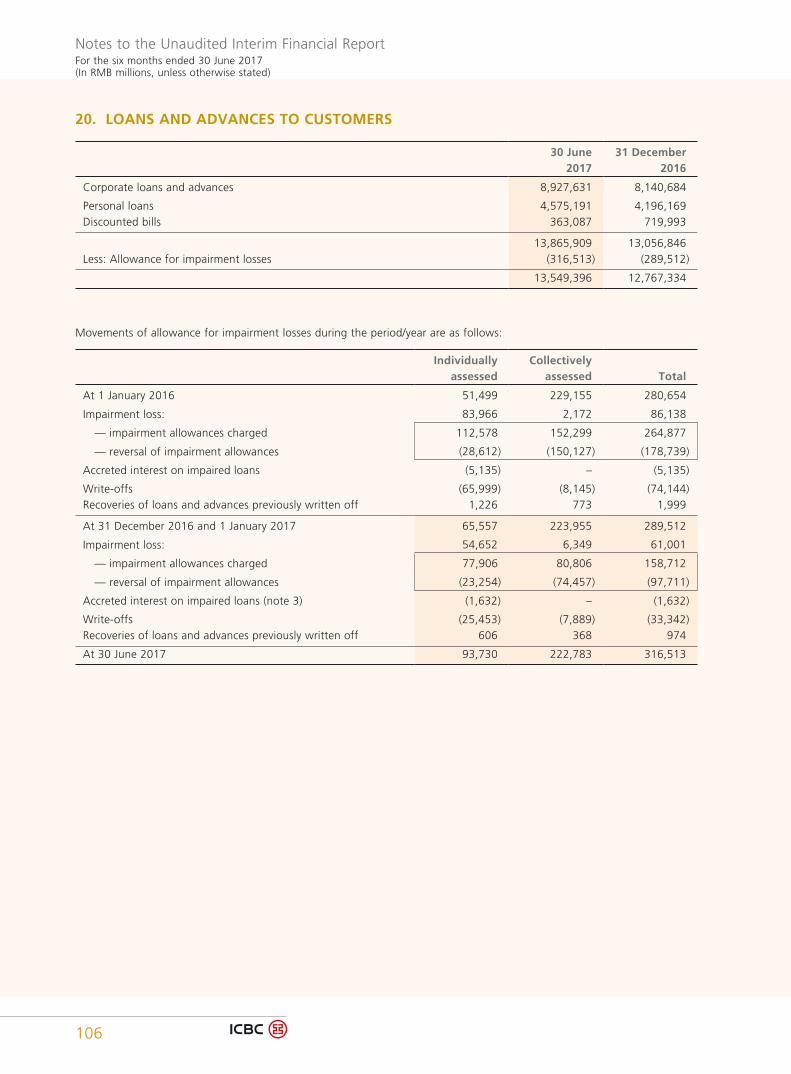
Notes to the Unaudited Interim Financial ReportFor the six months ended 30 June 2017(In RMB millions, unless otherwise stated)
106
20. LOANS AND ADVANCES TO CUSTOMERS
30 June2017
31 December 2016
Corporate loans and advances 8,927,631 8,140,684
Personal loans 4,575,191 4,196,169Discounted bills 363,087 719,993
13,865,909 13,056,846Less: Allowance for impairment losses (316,513) (289,512)
13,549,396 12,767,334
Movements of allowance for impairment losses during the period/year are as follows:
Individuallyassessed
Collectivelyassessed Total
At 1 January 2016 51,499 229,155 280,654
Impairment loss: 83,966 2,172 86,138
— impairment allowances charged 112,578 152,299 264,877
— reversal of impairment allowances (28,612) (150,127) (178,739)
Accreted interest on impaired loans (5,135) – (5,135)
Write-offs (65,999) (8,145) (74,144)Recoveries of loans and advances previously written off 1,226 773 1,999
At 31 December 2016 and 1 January 2017 65,557 223,955 289,512
Impairment loss: 54,652 6,349 61,001
— impairment allowances charged 77,906 80,806 158,712
— reversal of impairment allowances (23,254) (74,457) (97,711)
Accreted interest on impaired loans (note 3) (1,632) – (1,632)
Write-offs (25,453) (7,889) (33,342)Recoveries of loans and advances previously written off 606 368 974
At 30 June 2017 93,730 222,783 316,513

Notes to the Unaudited Interim Financial ReportFor the six months ended 30 June 2017
(In RMB millions, unless otherwise stated)
107I n t e r i m R e p o r t 2 0 1 7
Movements of allowance for impairment losses during the period/year analysed into those attributable to corporate loans and advances and discounted bills and personal loans are as follows:
Corporate loans and
advances and discounted bills Personal loans Total
At 1 January 2016 187,487 93,167 280,654
Impairment loss: 73,050 13,088 86,138
— impairment allowances charged 194,365 70,512 264,877
— reversal of impairment allowances (121,315) (57,424) (178,739)
Accreted interest on impaired loans (5,135) – (5,135)
Write-offs (65,999) (8,145) (74,144)Recoveries of loans and advances previously written off 1,226 773 1,999
At 31 December 2016 and 1 January 2017 190,629 98,883 289,512
Impairment loss: 57,045 3,956 61,001
— impairment allowances charged 129,514 29,198 158,712
— reversal of impairment allowances (72,469) (25,242) (97,711)
Accreted interest on impaired loans (note 3) (1,632) – (1,632)
Write-offs (25,453) (7,889) (33,342)Recoveries of loans and advances previously written off 606 368 974
At 30 June 2017 221,195 95,318 316,513
30 June2017
31 December2016
Loans and advances for which allowance for impairment losses are:
Individually assessed 170,111 160,469 Collectively assessed 13,695,798 12,896,377
13,865,909 13,056,846
Less: Allowance for impairment losses:
Individually assessed (93,730) (65,557) Collectively assessed (222,783) (223,955)
(316,513) (289,512)
Net loans and advances for which allowance for impairment losses are:
Individually assessed 76,381 94,912 Collectively assessed 13,473,015 12,672,422
13,549,396 12,767,334
Identified impaired loans and advances 217,072 211,801
Percentage of impaired loans and advances 1.57% 1.62%
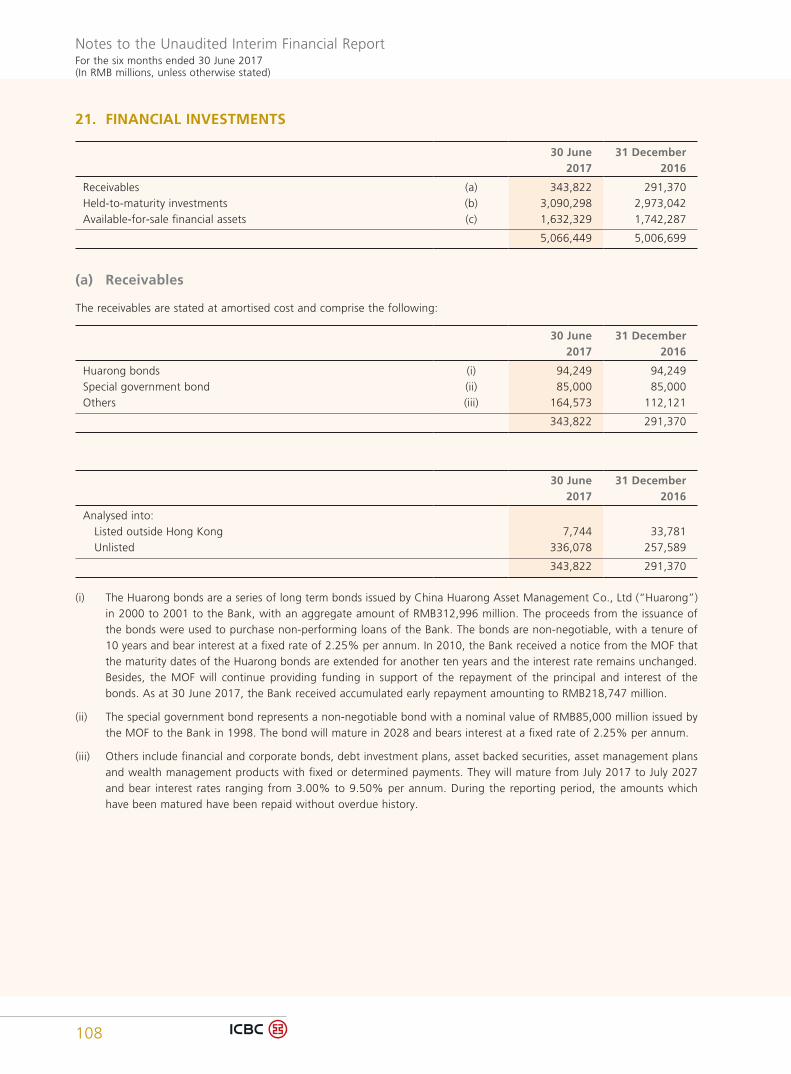
Notes to the Unaudited Interim Financial ReportFor the six months ended 30 June 2017(In RMB millions, unless otherwise stated)
108
21. FINANCIAL INVESTMENTS
30 June 2017
31 December2016
Receivables (a) 343,822 291,370Held-to-maturity investments (b) 3,090,298 2,973,042Available-for-sale financial assets (c) 1,632,329 1,742,287
5,066,449 5,006,699
(a) Receivables
The receivables are stated at amortised cost and comprise the following:
30 June2017
31 December 2016
Huarong bonds (i) 94,249 94,249Special government bond (ii) 85,000 85,000Others (iii) 164,573 112,121
343,822 291,370
30 June2017
31 December 2016
Analysed into: Listed outside Hong Kong 7,744 33,781 Unlisted 336,078 257,589
343,822 291,370
(i) The Huarong bonds are a series of long term bonds issued by China Huarong Asset Management Co., Ltd (“Huarong”) in 2000 to 2001 to the Bank, with an aggregate amount of RMB312,996 million. The proceeds from the issuance of the bonds were used to purchase non-performing loans of the Bank. The bonds are non-negotiable, with a tenure of 10 years and bear interest at a fixed rate of 2.25% per annum. In 2010, the Bank received a notice from the MOF that the maturity dates of the Huarong bonds are extended for another ten years and the interest rate remains unchanged. Besides, the MOF will continue providing funding in support of the repayment of the principal and interest of the bonds. As at 30 June 2017, the Bank received accumulated early repayment amounting to RMB218,747 million.
(ii) The special government bond represents a non-negotiable bond with a nominal value of RMB85,000 million issued by the MOF to the Bank in 1998. The bond will mature in 2028 and bears interest at a fixed rate of 2.25% per annum.
(iii) Others include financial and corporate bonds, debt investment plans, asset backed securities, asset management plans and wealth management products with fixed or determined payments. They will mature from July 2017 to July 2027 and bear interest rates ranging from 3.00% to 9.50% per annum. During the reporting period, the amounts which have been matured have been repaid without overdue history.

Notes to the Unaudited Interim Financial ReportFor the six months ended 30 June 2017
(In RMB millions, unless otherwise stated)
109I n t e r i m R e p o r t 2 0 1 7
(b) Held-to-maturity investments
Held-to-maturity investments are stated at amortised cost and comprise the following:
30 June2017
31 December 2016
Debt securities 3,090,410 2,973,149Less: Allowance for impairment losses (112) (107)
3,090,298 2,973,042
30 June2017
31 December 2016
Analysed into: Listed in Hong Kong 33,374 24,732 Listed outside Hong Kong 117,816 86,594 Unlisted 2,939,108 2,861,716
3,090,298 2,973,042
Market value of listed debt securities 151,190 111,326
The Group disposed of securities classified as held-to-maturity investments with a total carrying amount of RMB12,507 million prior to their maturity with remaining maturity more than three months for the period (six months ended 30 June 2016: RMB11,555 million). The carrying amount of held-to-maturity securities sold accounted for 0.40% of the total amount of the Group’s held-to-maturity investments (30 June 2016: 0.37%).

Notes to the Unaudited Interim Financial ReportFor the six months ended 30 June 2017(In RMB millions, unless otherwise stated)
110
(c) Available-for-sale financial assets
Available-for-sale financial assets comprise the following:
30 June2017
31 December 2016
Debt securities, at fair value (i) 1,613,323 1,720,630Other debt instruments, at fair value 4,378 8,804Equity investments: At fair value (i) 12,760 11,452 At cost (ii) 1,868 1,401 Debt for equity swaps 973 973 Others 1,571 1,106 Less: Allowance for impairment losses of equity investments, at cost (676) (678)
1,632,329 1,742,287
Debt securities analysed into: Listed in Hong Kong 68,030 63,010 Listed outside Hong Kong 236,513 169,339 Unlisted 1,308,780 1,488,281
1,613,323 1,720,630
Equity investments analysed into: Listed in Hong Kong 577 677 Listed outside Hong Kong 2,312 2,451 Unlisted 11,739 9,725
14,628 12,853
Market value of listed securities: Debt securities 304,543 232,349 Equity investments 2,889 3,128
307,432 235,477
(i) When impairment of an available-for-sale investment measured at fair value occurs, any impairment loss recognised is recorded in the carrying amount directly. As at 30 June 2017, the available-for-sale financial assets measured at fair value include impaired debt securities whose carrying amount was RMB106 million (31 December 2016: RMB70 million), and impaired equity investments whose carrying amount was RMB38 million (31 December 2016: RMB65 million) with the reversal of impairment loss recognised in profit or loss for the period of RMB56 million (six months ended 30 June 2016: the accrual of impairment loss of RMB143 million) on available-for-sale debt securities, and the accrual of impairment loss recognised in profit or loss for the period of RMB25 million (six months ended 30 June 2016: Nil) on available-for-sale equity investments.
(ii) Certain available-for-sale unlisted equity investments which do not have any quoted market prices and whose fair values cannot be measured reliably are stated at cost less any impairment losses. There is no active market for these investments and it is the Group’s intention to dispose of them as opportunities arise. During the six months ended 30 June 2017, the Group did not dispose any of these equity investments (six months ended 30 June 2016: Nil).

Notes to the Unaudited Interim Financial ReportFor the six months ended 30 June 2017
(In RMB millions, unless otherwise stated)
111I n t e r i m R e p o r t 2 0 1 7
(d) Movements of allowance for impairment losses of held-to-maturity investments and available-for-sale equity investments measured at cost during the period are as follows:
Held-to-maturity
investments
Available-for-sale equity
investments Total
At 1 January 2016 95 673 768Charge for the year 13 – 13Reversals (7) – (7)Others 6 5 11
At 31 December 2016 and 1 January 2017 107 678 785Charge for the period 6 – 6Others (1) (2) (3)
At 30 June 2017 112 676 788
22. INVESTMENTS IN ASSOCIATES AND JOINT VENTURES
Investments in associates and joint ventures are as follows:
30 June2017
31 December 2016
Interest in associates (a) 28,097 27,443Interest in joint ventures (b) 4,123 2,634
32,220 30,077
30 June2017
31 December 2016
Share of net assets 21,605 19,663Goodwill 10,963 10,762
32,568 30,425Less: Allowance for impairment losses (348) (348)
32,220 30,077

Notes to the Unaudited Interim Financial ReportFor the six months ended 30 June 2017(In RMB millions, unless otherwise stated)
112
(a) Interest in associates
(i) Particulars of the Group’s only material associate is as follows:
Percentage ofequity interest %
Votingrights %
Name30 June
201731 December
201630 June
2017Place of incorporation/
registration Principal activities
Standard Bank Group Limited (“Standard Bank”) (i)
20.08 20.08 20.08 Johannesburg,Republic of South Africa
Commercialbanking
(i) Standard Bank, a listed commercial bank in Republic of South Africa and a strategic partner for the Group, enables the Group to widen its customer base in Africa.
The market value of the Group’s investment in Standard Bank is RMB24,238 million as at 30 June 2017 (31 December 2016: RMB25,067 million).
The summarised financial information of Standard Bank, being consistent with the Group’s accounting policies, and reconciled to the carrying amounts using equity method in the Group’s consolidated financial statements:
30 June2017
31 December 2016
Gross amounts of the associateAssets 1,011,059 993,396Liabilities 915,875 902,225Net assets 95,184 91,171Revenue 25,794 48,603Profit from continuing operations 6,452 10,808Other comprehensive income (937) (5,512)Total comprehensive income 5,515 5,296Dividends received from the associate 3,712 5,579Reconciled to the Group’s interests in the associateGross amounts of net assets of the associate attribute to the parent company 81,200 78,814Group’s effective interest 20.08% 20.08%
Group’s share of net assets of the associate 16,306 15,825Goodwill 10,927 10,726
Carrying amount of the Group’s interest in Standard Bank in the consolidated financial statements 27,233 26,551
(ii) The following tables illustrate the summarised financial information of the associates that are not individually material to the Group:
Six months ended
30 June 2017 2016
Aggregate amounts of the Group’s share of those associates: Profit from continuing operations 7 29 Other comprehensive income – 306
Total comprehensive income 7 335

Notes to the Unaudited Interim Financial ReportFor the six months ended 30 June 2017
(In RMB millions, unless otherwise stated)
113I n t e r i m R e p o r t 2 0 1 7
(iii) Reconciliation of carrying amounts to the Group’s total interests in the associates:
30 June2017
31 December 2016
Carrying amount of material associates — Standard Bank 27,233 26,551Carrying amount of individually immaterial associates 1,212 1,240Less: Allowance for impairment losses (348) (348)
Interest in associates in the consolidated financial statements 28,097 27,443
All of the above associates are accounted for using the equity method in the consolidated financial statements.
(b) Interest in joint ventures
The Group has interests in a number of individually immaterial joint ventures. The following tables illustrate the summarised financial information of the joint ventures that are not individually material to the Group:
30 June2017
31 December 2016
Aggregate carrying amount of individually immaterial joint ventures in the consolidated financial statements 4,123 2,634
Six months ended
30 June 2017 2016
Aggregate amounts of the Group’s share of those joint ventures:
Profit from continuing operations 75 405 Other comprehensive income (6) 21
Total comprehensive income 69 426
All of the above joint ventures are accounted for using the equity method in the consolidated financial statements.

114
Notes to the Unaudited Interim Financial ReportFor the six months ended 30 June 2017(In RMB millions, unless otherwise stated)
23. PROPERTY AND EQUIPMENT
Properties and
buildings
Construction
in progress
Leasehold
improvements
Office
equipment
and motor
vehicles
Aircraft and
vessels Total
Cost:
At 1 January 2016 134,233 26,142 9,509 71,175 92,785 333,844
Additions 1,076 6,849 762 6,911 38,252 53,850
CIP transfer in/(out) 5,359 (9,741) – 404 3,978 –
Disposals (830) (241) (198) (2,497) (12,508) (16,274)
At 31 December 2016 and 1 January 2017 139,838 23,009 10,073 75,993 122,507 371,420
Additions 101 4,360 151 433 9,378 14,423
CIP transfer in/(out) 756 (1,414) – 12 646 –
Disposals (626) (30) (61) (4,192) (4,447) (9,356)
At 30 June 2017 140,069 25,925 10,163 72,246 128,084 376,487
Accumulated depreciation and impairment:
At 1 January 2016 45,667 41 6,585 50,103 7,022 109,418
Depreciation charge for the year 5,646 – 1,067 7,947 5,101 19,761
Impairment charge for the year – – – – 492 492
Disposals (499) – (169) (2,453) (1,339) (4,460)
At 31 December 2016 and 1 January 2017 50,814 41 7,483 55,597 11,276 125,211
Depreciation charge for the period 2,836 – 486 3,729 2,314 9,365
Disposals (428) – (37) (2,268) (1,055) (3,788)
At 30 June 2017 53,222 41 7,932 57,058 12,535 130,788
Carrying amount:
At 31 December 2016 89,024 22,968 2,590 20,396 111,231 246,209
At 30 June 2017 86,847 25,884 2,231 15,188 115,549 245,699
As at 30 June 2017, the process of obtaining the legal titles for the Group’s properties and buildings with an aggregate carrying value of RMB12,934 million (31 December 2016: RMB13,342 million) was still in progress. Management is of the view that the aforesaid matter would neither affect the rights of the Group to these assets nor have any significant impact on the business operation of the Group.
As at 30 June 2017, the carrying value of aircraft and vessels leased out by the Group under operating leases was RMB115,549 million (31 December 2016: RMB111,231 million).
As at 30 June 2017, the carrying value of aircraft and vessels owned by the Group that have been pledged as security for liabilities due to banks and other financial institutions was RMB73,598 million (31 December 2016: RMB34,174 million).

115I n t e r i m R e p o r t 2 0 1 7
Notes to the Unaudited Interim Financial ReportFor the six months ended 30 June 2017
(In RMB millions, unless otherwise stated)
24. DEFERRED INCOME TAX ASSETS AND LIABILITIES(a) Analysed by nature
Deferred income tax assets:
As at 30 June 2017 As at 31 December 2016Deductible/
(taxable)temporary
differences
Deferredincome tax
assets/(liabilities)
Deductible/(taxable)
temporarydifferences
Deferredincome tax
assets/(liabilities)
Allowance for impairment losses 130,471 32,541 114,765 28,616Change in fair value of available-for-sale financial assets 19,804 5,020 (4,005) (973)Change in fair value of financial instruments at fair value through profit or loss (10,013) (2,498) (9,544) (2,385)Accrued staff costs 20,460 5,115 28,104 7,026Others (21,772) (5,339) (15,847) (3,886)
138,950 34,839 113,473 28,398
Deferred income tax liabilities:
As at 30 June 2017 As at 31 December 2016Taxable/
(deductible)temporary
differences
Deferredincome taxliabilities/
(assets)
Taxable/(deductible)
temporarydifferences
Deferredincome taxliabilities/
(assets)
Allowance for impairment losses (2,075) (511) (1,460) (365)Change in fair value of available-for-sale financial assets 706 122 563 120Others 3,858 971 3,368 849
2,489 582 2,471 604
(b) Movements of deferred income tax
Deferred income tax assets:
As at1 January
2017Recognised inprofit or loss
Recognised inequity
As at30 June
2017
Allowance for impairment losses 28,616 3,925 – 32,541Change in fair value of available-for-sale financial assets (973) – 5,993 5,020Change in fair value of financial instruments at fair value through profit or loss (2,385) (113) – (2,498)Accrued staff costs 7,026 (1,911) – 5,115Others (3,886) (1,507) 54 (5,339)
28,398 394 6,047 34,839
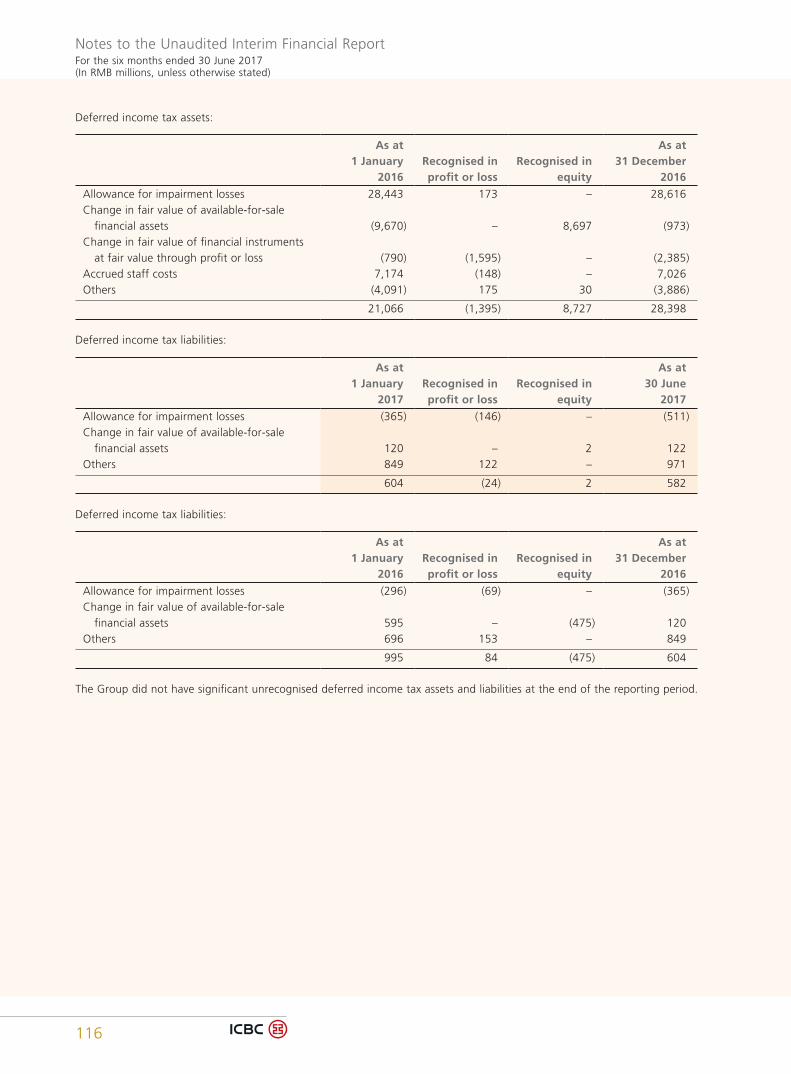
116
Notes to the Unaudited Interim Financial ReportFor the six months ended 30 June 2017(In RMB millions, unless otherwise stated)
Deferred income tax assets:
As at1 January
2016Recognised inprofit or loss
Recognised in equity
As at31 December
2016
Allowance for impairment losses 28,443 173 – 28,616Change in fair value of available-for-sale financial assets (9,670) – 8,697 (973)Change in fair value of financial instruments at fair value through profit or loss (790) (1,595) – (2,385)Accrued staff costs 7,174 (148) – 7,026Others (4,091) 175 30 (3,886)
21,066 (1,395) 8,727 28,398
Deferred income tax liabilities:
As at1 January
2017Recognised inprofit or loss
Recognised inequity
As at30 June
2017
Allowance for impairment losses (365) (146) – (511)Change in fair value of available-for-sale financial assets 120 – 2 122Others 849 122 – 971
604 (24) 2 582
Deferred income tax liabilities:
As at1 January
2016Recognised inprofit or loss
Recognised in equity
As at31 December
2016
Allowance for impairment losses (296) (69) – (365)Change in fair value of available-for-sale financial assets 595 – (475) 120Others 696 153 – 849
995 84 (475) 604
The Group did not have significant unrecognised deferred income tax assets and liabilities at the end of the reporting period.
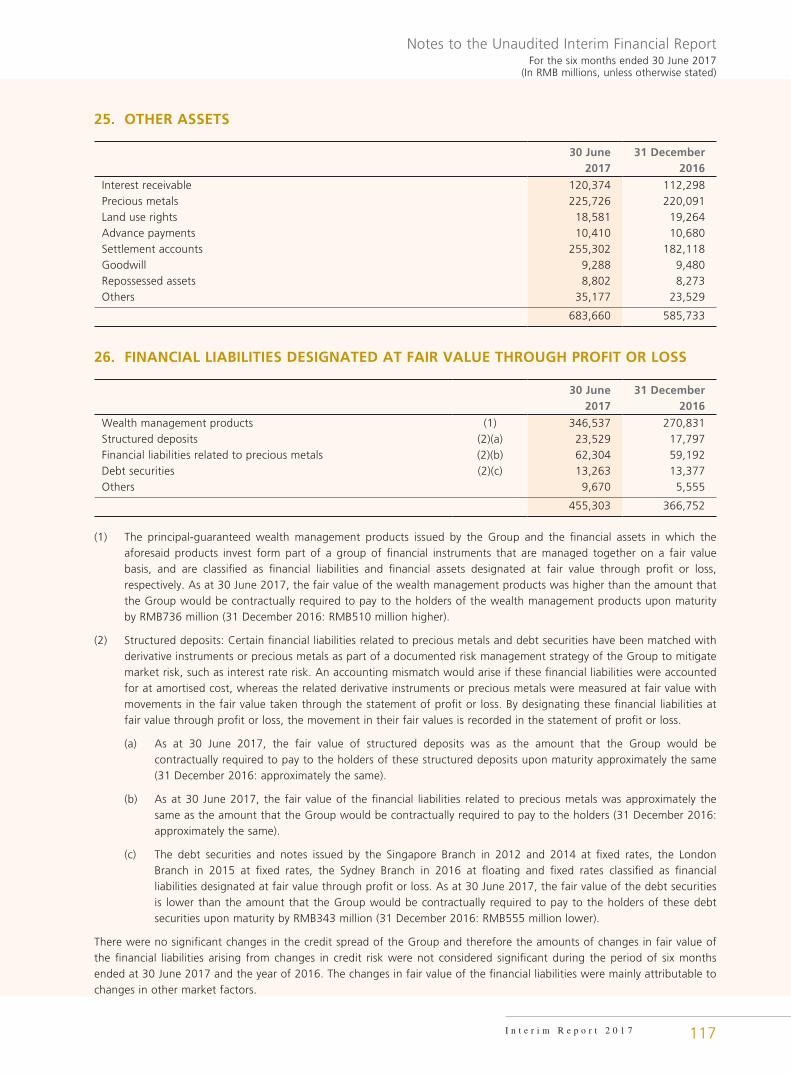
117I n t e r i m R e p o r t 2 0 1 7
Notes to the Unaudited Interim Financial ReportFor the six months ended 30 June 2017
(In RMB millions, unless otherwise stated)
25. OTHER ASSETS
30 June2017
31 December 2016
Interest receivable 120,374 112,298Precious metals 225,726 220,091Land use rights 18,581 19,264Advance payments 10,410 10,680Settlement accounts 255,302 182,118Goodwill 9,288 9,480Repossessed assets 8,802 8,273Others 35,177 23,529
683,660 585,733
26. FINANCIAL LIABILITIES DESIGNATED AT FAIR VALUE THROUGH PROFIT OR LOSS
30 June2017
31 December 2016
Wealth management products (1) 346,537 270,831Structured deposits (2)(a) 23,529 17,797Financial liabilities related to precious metals (2)(b) 62,304 59,192Debt securities (2)(c) 13,263 13,377Others 9,670 5,555
455,303 366,752
(1) The principal-guaranteed wealth management products issued by the Group and the financial assets in which the aforesaid products invest form part of a group of financial instruments that are managed together on a fair value basis, and are classified as financial liabilities and financial assets designated at fair value through profit or loss, respectively. As at 30 June 2017, the fair value of the wealth management products was higher than the amount that the Group would be contractually required to pay to the holders of the wealth management products upon maturity by RMB736 million (31 December 2016: RMB510 million higher).
(2) Structured deposits: Certain financial liabilities related to precious metals and debt securities have been matched with derivative instruments or precious metals as part of a documented risk management strategy of the Group to mitigate market risk, such as interest rate risk. An accounting mismatch would arise if these financial liabilities were accounted for at amortised cost, whereas the related derivative instruments or precious metals were measured at fair value with movements in the fair value taken through the statement of profit or loss. By designating these financial liabilities at fair value through profit or loss, the movement in their fair values is recorded in the statement of profit or loss.
(a) As at 30 June 2017, the fair value of structured deposits was as the amount that the Group would be contractually required to pay to the holders of these structured deposits upon maturity approximately the same (31 December 2016: approximately the same).
(b) As at 30 June 2017, the fair value of the financial liabilities related to precious metals was approximately the same as the amount that the Group would be contractually required to pay to the holders (31 December 2016: approximately the same).
(c) The debt securities and notes issued by the Singapore Branch in 2012 and 2014 at fixed rates, the London Branch in 2015 at fixed rates, the Sydney Branch in 2016 at floating and fixed rates classified as financial liabilities designated at fair value through profit or loss. As at 30 June 2017, the fair value of the debt securities is lower than the amount that the Group would be contractually required to pay to the holders of these debt securities upon maturity by RMB343 million (31 December 2016: RMB555 million lower).
There were no significant changes in the credit spread of the Group and therefore the amounts of changes in fair value of the financial liabilities arising from changes in credit risk were not considered significant during the period of six months ended at 30 June 2017 and the year of 2016. The changes in fair value of the financial liabilities were mainly attributable to changes in other market factors.

118
Notes to the Unaudited Interim Financial ReportFor the six months ended 30 June 2017(In RMB millions, unless otherwise stated)
27. DUE TO BANKS AND OTHER FINANCIAL INSTITUTIONS
30 June2017
31 December2016
Deposits: Banks and other financial institutions operating in Mainland China 1,220,450 1,437,462 Banks and other financial institutions operating outside Mainland China 98,956 79,230
1,319,406 1,516,692
Money market takings: Banks and other financial institutions operating in Mainland China 105,782 134,736 Banks and other financial institutions operating outside Mainland China 389,857 365,371
495,639 500,107
1,815,045 2,016,799
28. REPURCHASE AGREEMENTS
Repurchase agreements comprise repurchase of securities, bills, and cash received as collateral on securities lending.
30 June2017
31 December 2016
Repurchase (note 19(i)) 636,967 561,031Cash received as collateral on securities lending 44,958 28,275
681,925 589,306
Repurchase analysed by counterparty: Banks 454,958 366,384 Other financial institutions 182,009 194,647
636,967 561,031
Repurchase analysed by collateral: Securities 626,496 553,278 Bills 10,471 7,753
636,967 561,031
29. CERTIFICATES OF DEPOSIT
Certificates of deposit issued by Hong Kong Branch, Tokyo Branch, Luxembourg Branch, Seoul Branch, Doha Branch, New York Branch, Sydney Branch, London Branch, Dubai (DIFC) Branch, ICBC London, ICBC Asia, ICBC Macau, ICBC New Zealand and ICBC Standard were recognised at amortised cost.
30. DUE TO CUSTOMERS
30 June2017
31 December 2016
Demand deposits: Corporate customers 5,749,174 5,271,686 Personal customers 3,791,001 3,720,374Time deposits: Corporate customers 4,583,355 4,176,834 Personal customers 4,698,735 4,419,907Others 198,906 236,501
19,021,171 17,825,302

119I n t e r i m R e p o r t 2 0 1 7
Notes to the Unaudited Interim Financial ReportFor the six months ended 30 June 2017
(In RMB millions, unless otherwise stated)
31. DEBT SECURITIES ISSUED
30 June2017
31 December 2016
Subordinated bonds and Tier 2 Capital Notes issued by (1) The Bank 181,682 181,999
Subsidiaries 12,486 12,812
194,168 194,811
Other debt securities issued by (2)
The Bank 143,992 97,447
Subsidiaries 74,856 65,679
218,848 163,126
413,016 357,937
As at 30 June 2017, the amount of debt securities issued due within one year was RMB35,611 million (31 December 2016: RMB28,277 million).
(1) Subordinated bonds and Tier 2 Capital Notes
The Bank:
As approved by the PBOC and the CBRC, the Bank issued callable subordinated bonds through open market bidding in 2009, 2010, 2011, 2012 and 2014. Approved by the PBOC, these subordinated bonds were traded in the bond market among banks. The relevant information on these subordinated bonds is set out below:
Name Issue date
Issue price AmountEnding
balance
Coupon rate Value date Maturity date Circulation date Notes (In RMB) (In RMB) (In RMB)
(million) (million)
09 ICBC 02 Bond 16/07/2009 100 Yuan 24,000 24,000 4.00% 20/07/2009 20/07/2024 20/08/2009 (i)10 ICBC 02 Bond 10/09/2010 100 Yuan 16,200 16,200 4.10% 14/09/2010 14/09/2025 03/11/2010 (ii)11 ICBC 01 Bond 29/06/2011 100 Yuan 38,000 38,000 5.56% 30/06/2011 30/06/2031 30/08/2011 (iii)11 ICBC 02 Bond 29/12/2011 100 Yuan 50,000 50,000 5.50% 30/12/2011 30/12/2026 17/01/2012 (iv)12 ICBC 01 Bond 11/06/2012 100 Yuan 20,000 20,000 4.99% 13/06/2012 13/06/2027 13/07/2012 (v)14 ICBC 01 Bond 04/08/2014 100 Yuan 20,000 20,000 5.80% 05/08/2014 05/08/2024 24/09/2014 (vi)
(i) The Bank has the option to redeem all or part of the bonds at face value on 20 July 2019. If the Bank does not exercise this option, the annual coupon rate will increase by 300 basis points thereafter.
(ii) The Bank has the option to redeem all of the bonds on 14 September 2020 upon the approval of the relevant regulatory authorities.
(iii) The Bank has the option to redeem all of the bonds on 30 June 2026 upon the approval of the relevant regulatory authorities.
(iv) The Bank has the option to redeem all of the bonds on 30 December 2021 upon the approval of the relevant regulatory authorities.
(v) The Bank has the option to redeem all of the bonds on 13 June 2022 upon the approval of the relevant regulatory authorities.
(vi) The Bank has the option to redeem all of the bonds on 5 August 2019 upon the approval of the relevant regulatory authorities

120
Notes to the Unaudited Interim Financial ReportFor the six months ended 30 June 2017(In RMB millions, unless otherwise stated)
In 2015, the Bank issued Tier 2 Capital Notes denominated in USD. Approved by the Stock Exchange of Hong Kong Limited for listing and dealing, the Notes are listed on the Stock Exchange of Hong Kong Limited. The relevant information is set out below:
Name Issue date Currency Issue price
AmountEnding
balance
Coupon rate Value date Maturity date Circulation date Note(original
currency) (In RMB)
(million) (million)
15 USD Tier 2 Capital Notes 15/09/2015 USD 99.189 2,000 13,600 4.875% 21/09/2015 21/09/2025 22/09/2015 (vii)
(vii) On 15 September 2015, the Bank issued Tier 2 Capital Notes with an aggregate nominal amount of USD2,000 million, bearing a fixed interest rate of 4.875% per annum. The listing and permission to deal in the Stock Exchange of Hong Kong Limited became effective on 22 September 2015. The Notes were issued at the price fixed at 99.189% of the nominal amount with maturity due on 21 September 2025 and cannot be redeemed before maturity.
The Bank has not had any defaults of principal or interest or other breaches with respect to the subordinated bonds during the period (six months ended 30 June 2016: Nil).
Subsidiaries:
On 30 November 2010, ICBC Asia issued a subordinated bond with an aggregate nominal amount of USD500 million, bearing a fixed interest rate of 5.125% per annum. The bond was issued at the price fixed at 99.737% of the nominal amount with maturity due on 30 November 2020.
On 10 October 2013, ICBC Asia issued a subordinated bond with an aggregate nominal amount of USD500 million, bearing a fixed interest rate of 4.5% per annum. The bond was issued at the price fixed at 99.463% of the nominal amount with maturity due on 10 October 2023.
On 10 September 2014, ICBC Macau issued a subordinated bond with an aggregate nominal amount of USD320 million, bearing a floating interest rate. The bond was issued at the price fixed at 99.298% of the nominal amount with maturity due on 10 September 2024.
On 2 December 2009, ICBC Standard issued a subordinated bond with an amount of USD500 million, bearing a fixed interest rate of 8.125% per annum and with maturity due on 2 December 2019.
The above subordinated bonds and notes are separately listed on the Stock Exchange of Hong Kong Limited and the London Stock Exchange Plc. ICBC Asia, ICBC Macau and ICBC Standard have not had any defaults of principal or interest or other breaches with respect to the subordinated bonds and notes during the period (six months ended 30 June 2016: Nil).

121I n t e r i m R e p o r t 2 0 1 7
Notes to the Unaudited Interim Financial ReportFor the six months ended 30 June 2017
(In RMB millions, unless otherwise stated)
(2) Other debt securities issued
As at 30 June 2017, the Group’s other debt securities issued include:
The Bank:
(i) Sydney Branch issued debt securities amounting to RMB14,927 million denominated in AUD, CHF, RMB, EUR, HKD and USD with maturities between the second half of 2017 and 2024 at fixed or floating interest rates. Of which, in 2017, Sydney Branch issued debt securities amounting to RMB2,604 million denominated in AUD with maturity in 2018 and 2020 at floating interest rates.
(ii) Singapore Branch issued debt securities amounting to RMB29,183 million denominated in RMB and USD with maturities between 2018 and 2022 at fixed or floating interest rates. Of which, in 2017, Singapore Branch issued notes amounting to RMB13,562 million denominated USD with maturity in 2022 at floating interest rates.
(iii) Tokyo Branch issued debt securities or notes amounting to RMB2,258 million denominated in JPY and RMB with maturities in the second half of 2017 and 2019 at fixed interest rates. Of which, in 2017, Tokyo Branch issued notes amounting to RMB848 million denominated in JPY with maturities in the second half of 2017 at fixed interest rates.
(iv) New York Branch issued debt securities or notes amounting to RMB40,412 million denominated in USD with maturities between the second half of 2017 and 2021 at fixed or floating interest rates. Of which, in 2017, New York Branch issued notes amounting to RMB7,309 million denominated in USD with maturities in the second half of 2017 and 2018 at fixed interest rates.
(v) Luxembourg Branch issued notes amounting to RMB16,687 million denominated in USD with maturities between the second half of 2017 and 2019 at fixed or floating interest rates. Of which, in 2017, Luxembourg Branch issued debt securities amounting to RMB1,112 million denominated in USD with maturities in the second half of 2017 and 2018 at fixed or floating interest rates.
(vi) Dubai (DIFC) Branch issued debt securities amounting to RMB16,285 million denominated in EUR and USD with maturities between 2019 and 2022 at fixed or floating interest rates. Of which, in 2017, Dubai (DIFC) Branch issued debt securities amounting to RMB8,851 million denominated in EUR and USD with maturity in 2020 and 2022 at floating interest rates.
(vii) Hong Kong Branch issued debt securities amounting to RMB21,643 million denominated in USD with maturities between 2019 and 2022 at fixed or floating interest rates. Of which, in 2017, Hong Kong Branch issued debt securities amounting to RMB18,267 million denominated in USD with maturity in 2020 and 2022 at fixed or floating interest rates.
(viii) The Head Office issued debt securities in London and Hong Kong amounting to RMB1,199 million denominated in RMB with maturity in 2018 and 2019 at fixed interest rates.
(ix) In 2017, the Head Office issued interbank deposits amounting to RMB1,398 million denominated in RMB with maturities in the second half of 2017 at fixed interest rates.

122
Notes to the Unaudited Interim Financial ReportFor the six months ended 30 June 2017(In RMB millions, unless otherwise stated)
Subsidiaries:
(i) ICBC Asia issued notes amounting to RMB870 million denominated in HKD and RMB with maturities between the second half of 2017 and 2020 at fixed interest rates. Of which, in 2017, ICBC Asia issued interbank deposits amounting to RMB290 million denominated in RMB with maturities in 2018 at fixed interest rates.
(ii) ICBC Financial Leasing issued medium-term debt securities amounting to RMB57,118 million denominated in RMB and USD with maturities between 2018 and 2026 at fixed or floating interest rates.
Of which, Skysea International Capital Management Limited (“Skysea International”), which is controlled by the Group, issued guaranteed notes of USD750 million with a fixed interest rate of 4.875% in 2011. As at 30 June 2017, Skysea International has redeemed USD153 million and the carrying amount of the Notes were RMB4,038 million. The Notes were guaranteed by Hong Kong Branch and were issued at the price fixed at 97.708% of the nominal amount with maturities due on 7 December 2021. By satisfying certain conditions, Skysea International has the option to redeem all of the notes at any time. The Notes were listed on the Stock Exchange of Hong Kong Limited.
ICBCIL Finance Co. Ltd, which is controlled by the Group, issued medium-term notes amounting to RMB51,905 million denominated in RMB and USD, with maturities between 2018 and 2026 at fixed or floating interest rates. Of which, in 2017, ICBCIL Finance Co. Ltd issued medium-term notes amounting to RMB13,272 million denominated in USD, with maturities in 2020 and 2022 at fixed interest rates. By satisfying certain conditions, ICBCIL Finance Co. Ltd has the option to redeem all of the notes at any time. Above notes were guaranteed by ICBC Financial Leasing Co. Ltd and listed on the Irish Stock Exchange and the Stock Exchange of Hong Kong Limited respectively.
Hai Jiao 1400 limited, which is controlled by the Group, issued a private placement bond amounting to RMB1,175 million denominated in USD with maturity in 2025 at a fixed interest rate. The bond was guaranteed by The Export-Import Bank of Korea.
(iii) ICBC Thai issued debt securities or notes amounting to RMB6,023 million denominated in THB with maturities between the second half of 2017 and 2026 at fixed interest rates. Of which, in 2017, ICBC Thai issued debt securities or notes amounting to RMB1,658 million denominated in THB with maturities between the second half of 2017 and 2021 at fixed interest rates.
(iv) ICBC International issued medium-term bonds amounting to RMB9,087 million denominated in USD with maturity in 2019 and 2020 at a fixed interest rate. Of which, in 2017, ICBC International issued medium-term bond amounting to RMB4,373 million denominated in USD with maturities in 2020 at fixed interest rate.
(v) ICBC New Zealand issued medium-term bonds amounting to RMB1,468 million denominated in NZD, AUD and USD with maturities between the second half of 2017 and 2021 at fixed or floating interest rates. Of which, in 2017, ICBC New Zealand issued medium-term bonds amounting to RMB958 million denominated in NZD and AUD with maturity in the second half of 2017 and 2021 at a fixed or floating interest rates.
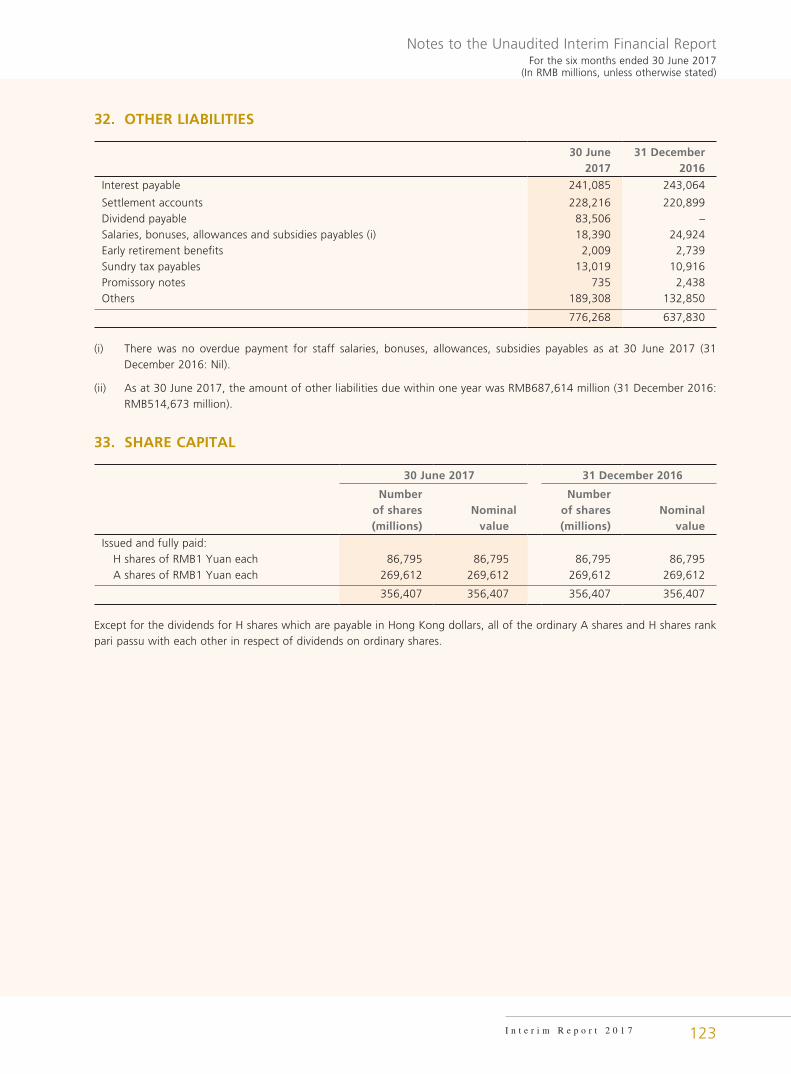
123I n t e r i m R e p o r t 2 0 1 7
Notes to the Unaudited Interim Financial ReportFor the six months ended 30 June 2017
(In RMB millions, unless otherwise stated)
32. OTHER LIABILITIES
30 June2017
31 December 2016
Interest payable 241,085 243,064
Settlement accounts 228,216 220,899Dividend payable 83,506 –Salaries, bonuses, allowances and subsidies payables (i) 18,390 24,924Early retirement benefits 2,009 2,739Sundry tax payables 13,019 10,916Promissory notes 735 2,438Others 189,308 132,850
776,268 637,830
(i) There was no overdue payment for staff salaries, bonuses, allowances, subsidies payables as at 30 June 2017 (31 December 2016: Nil).
(ii) As at 30 June 2017, the amount of other liabilities due within one year was RMB687,614 million (31 December 2016: RMB514,673 million).
33. SHARE CAPITAL
30 June 2017 31 December 2016
Numberof shares (millions)
Nominalvalue
Numberof shares
(millions)Nominal
value
Issued and fully paid: H shares of RMB1 Yuan each 86,795 86,795 86,795 86,795 A shares of RMB1 Yuan each 269,612 269,612 269,612 269,612
356,407 356,407 356,407 356,407
Except for the dividends for H shares which are payable in Hong Kong dollars, all of the ordinary A shares and H shares rank pari passu with each other in respect of dividends on ordinary shares.
124
Notes to the Unaudited Interim Financial ReportFor the six months ended 30 June 2017(In RMB millions, unless otherwise stated)
34. OTHER EQUITY INSTRUMENTS(1) Preference shares(a) Preference shares outstanding at the end of the period
Financial instrumentoutstanding Issue date
Accounting classification Dividend rate Issue price
Amount(million
shares)
In originalcurrency (million)
In RMB(million) Maturity
Conversioncondition Conversion
Overseas Preference Shares in: USD 2014-12-10 Equity 6.00% 20USD/Share 147 2,940 17,991 None Mandatory No EUR 2014-12-10 Equity 6.00% 15EUR/Share 40 600 4,558 None Mandatory No RMB 2014-12-10 Equity 6.00% 100RMB/Share 120 12,000 12,000 None Mandatory NoDomestic Preference Shares in: RMB 2015-11-18 Equity 4.50% 100RMB/Share 450 45,000 45,000 None Mandatory No
Total 757 79,549
Less: Issue fees 174
Book value 79,375
(b) Main Clauses
(1) Overseas preference shares
a. Dividend
Fixed rate for a certain period (5 years for USD and RMB tranche and 7 years for EUR tranche) after issuance.
Dividend reset every 5 years thereafter to the sum of the benchmark rate and the Fixed Spread.
The Fixed Spread will be equal to the spread between the dividend rate at the time of issuance and the benchmark rate. The Fixed Spread will remain unchanged throughout the term of the Preference Shares.
Dividends will be paid annually.
b. Conditions to distribution of dividends
The Group could pay dividends while the Group still has distributable after-tax profit after making up previous years’ losses, contributing to the statutory reserve and making general provisions, and the Group’s capital adequacy ratio meets regulatory requirements. Preference shareholders of the Group are senior to the ordinary shareholders on the right to dividends. The Group may elect to cancel any dividend, but such cancellation will require a shareholder’s resolution to be passed.
c. Dividend stopper
If the Group cancels all or part of the dividends to the Preference Shareholders, the Group shall not make any dividend distribution to ordinary shareholders before the Group pays the dividends for the current dividend period to the Preference Shareholders in full.
d. Order of distribution and liquidation method
The USD, EUR and RMB Preference Shareholders as well as the Domestic Preference Shareholders will rank equally for payment. The Preference Shareholders will be subordinated to the depositors, ordinary creditors, holders of subordinated debt, holders of convertible bonds, holders of Tier 2 capital bonds and holders of other Tier 2 capital instruments of the Group, but will be senior to the ordinary shareholders.
125I n t e r i m R e p o r t 2 0 1 7
Notes to the Unaudited Interim Financial ReportFor the six months ended 30 June 2017
(In RMB millions, unless otherwise stated)
e. Mandatory conversion trigger events
Upon the occurrence of an Additional Tier 1 Capital Trigger Event (Core Tier 1 Capital Adequacy Ratio of the Group falling to 5.125% or below), the Group shall have the right to convert all or part of the Preference Shares into H shares, in order to restore the Core Tier 1 Capital Adequacy Ratio of the Group to above 5.125%; If Preference Shares were converted to H shares, they may not be converted to Preference Shares again.
Upon the occurrence of a Non-Viability Trigger Event (Earlier of the two situations: (1) CBRC has determined that the Group would become non-viable if there is no conversion or write-down of capital; or (2) the relevant authorities have determined that a public sector injection of capital or equivalent support is necessary, without which the Group would become non-viable), the Group shall have the right to convert all Preference Shares into H shares. If Preference Shares were converted to H shares, they may not be converted to Preference Shares again.
f. Redemption
Under the premise of obtaining the approval of the CBRC and condition of redemption, the Group has right to redeem all or some of overseas preference shares in first call date and subsequent any dividend payment date (redemption price is equal to issue price plus accrued dividend in current period).
USD Preference Shares: the First Redemption Date is five years after issuance
EUR Preference Shares: the First Redemption Date is seven years after issuance
RMB Preference Shares: the First Redemption Date is five years after issuance
g. Dividend setting mechanism
Non cumulative dividend is a dividend on preference shares which does not cumulate upon omission of payment so as to require payment of a passed or omitted dividend of one year out of earnings of a following year. After receiving dividend at agreed dividend rate, preference shareholders of the Group will not participate the distribution of residual profits with ordinary shareholders.
The Group could pay dividends while the Group still has distributable after-tax profit after making up previous years’ losses, contributing to the statutory reserve and making general provisions, and the Group’s capital adequacy ratio meets regulatory requirements. Preference shareholders of the Group are senior to the ordinary shareholders on the right to dividends.
The Group shall distribute dividends for the Preference Shares in cash, based on the total amount of the issued and outstanding Preference Shares on the corresponding times (i.e. the product of the issue price of preference shares and the number of the issued and outstanding preference shares). Interest method of the Preference Shares of the Group is once a year.
(2) Domestic preference shares
a. Dividend
Fixed rate for a certain period (5 years) after issuance.
Dividend reset every 5 years thereafter to the sum of the benchmark rate and the Fixed Spread.
The Fixed Spread will be equal to the spread between the dividend rate at the time of issuance and the benchmark rate. The Fixed Spread will remain unchanged throughout the term of the Preference Shares.
Dividends will be paid annually.

126
Notes to the Unaudited Interim Financial ReportFor the six months ended 30 June 2017(In RMB millions, unless otherwise stated)
b. Conditions to distribution of dividends
The Group could pay dividends while the Group still has distributable after-tax profit after making up previous years’ losses, contributing to the statutory reserve and making general provisions, and the Group’s capital adequacy ratio meets regulatory requirements. The paying order of domestic preference shares is equal to overseas preference shares. Preference shareholders of the Group are senior to the ordinary shareholders on the right to dividends. The Group may elect to cancel any dividend, but such cancellation will require a shareholder’s resolution to be passed.
c. Dividend stopper
If the Group cancels all or part of the dividends to the Preference Shareholders, the Group shall not make any dividend distribution to ordinary shareholders before the Group pays the dividends for the current dividend period to the Preference Shareholders in full.
d. Order of distribution and liquidation method
The Domestic Preference Shareholders as well as Overseas Preference Shareholders will rank equally for payment. The Preference Shareholders will be subordinated to the depositors, ordinary creditors, holders of subordinated debt, holders of convertible bonds, holders of Tier 2 capital bonds and holders of other Tier 2 capital instruments of the Group, but will be senior to the ordinary shareholders.
e. Mandatory conversion trigger events
Upon the occurrence of an Additional Tier 1 Capital Trigger Event (Core Tier 1 Capital Adequacy Ratio of the Group falling to 5.125% or below), the Group shall have the right to convert all or part of the Preference Shares into A shares, in order to restore the Core Tier 1 Capital Adequacy Ratio of the Group to above 5.125%; If Preference Shares were converted to A shares, they may not be converted to Preference Shares again.
Upon the occurrence of a Non-Viability Trigger Event (Earlier of the two situations: (1) CBRC has determined that the Group would become non-viable if there is no conversion or write-down of capital; or (2) the relevant authorities have determined that a public sector injection of capital or equivalent support is necessary, without which the Group would become non-viable), the Group shall have the right to convert all Preference Shares into A shares. If Preference Shares were converted to A shares, they may not be converted to Preference Shares again.
f. Redemption
After five years have elapsed since the date of issuance (18 November 2015), under the premise of obtaining the approval of the CBRC and compliance with regulatory requirements, the Group has right to redeem all or some of domestic preference shares. The redemption period of preference shares ranges from the start date of redemption to the date of full redemption or conversion (redemption price is equal to book value plus accrued dividend in current period).
g. Dividend setting mechanism
Non cumulative dividend is a dividend on preference shares which does not cumulate upon omission of payment so as to require payment of a passed or omitted dividend of one year out of earnings of a following year. After receiving dividend at agreed dividend rate, preference shareholders of the Group will not participate the distribution of residual profits with ordinary shareholders.
The Group could pay dividends while the Group still has distributable after-tax profit after making up previous years’ losses, contributing to the statutory reserve and making general provisions, and the Group’s capital adequacy ratio meets regulatory requirements. Preference shareholders of the Group are senior to the ordinary shareholders on the right to dividends.

127I n t e r i m R e p o r t 2 0 1 7
Notes to the Unaudited Interim Financial ReportFor the six months ended 30 June 2017
(In RMB millions, unless otherwise stated)
The Group shall distribute dividends for the Preference Shares in cash, based on the total amount of the issued and outstanding Preference Shares on the corresponding times (i.e. the product of the issue price of preference shares and the number of the issued and outstanding preference shares). Interest method of the Preference Shares of the Group is once a year.
(c) Changes in preference shares outstanding
Preference SharesOverseas Domestic
Financial instrument outstanding USD EUR RMB RMB Total
1 January 2017 and 30 June 2017
Amount (million shares) 147 40 120 450 757In original currency (million) 2,940 600 12,000 45,000 N/AIn RMB (million) 17,991 4,558 12,000 45,000 79,549
Note: The RMB amounts of offshore preference shares in U.S. dollar and Euro on 30 June 2017 are translated at the spot exchange
rate on issuance date.
(2) Perpetual Bond(a) Perpetual bond outstanding at the end of the period
Financial instrumentoutstanding Issue date
Accounting classification Interest rate Issue price
Amount (millionpieces)
In original currency (million)
In RMB (million) Maturity
Conversion condition Conversion
USD Perpetual bond 2016-07-21 Equity 4.25% 1,000USD/Piece 1 1,000 6,691 None None No
Total 1 6,691
Less: Issue fees 15
Book value 6,676
Note: USD perpetual bond was issued by ICBC Asia, a subsidiary of the Bank.
(b) Main Clauses
On 21 July 2016, ICBC Asia issued Basel III-compliant Non-Cumulative Subordinated Additional Tier 1 Capital Securities (hereinafter referred to as “Perpetual Bond”) in the aggregate amount of US$1 billion (equivalent to approximately RMB6,676 million net of related issuance costs). Fixed rate for the first 5 years after issuance of the bond is 4.25%. If perpetual bonds are not called, distribution will be reset based on the then prevailing 5-year USA national bonds yield plus a fixed initial spread (3.135 per cent. Per annum) every 5 years.
The distribution shall be payable semi-annually, with the first distribution payment date being 21 January 2017. ICBC Asia has the right to cancel distribution payment (subject to the requirement as set out in the terms and conditions of the perpetual bond) and the distribution cancelled shall not be cumulative.
The perpetual bond will be written off up to the amount as directed by the Hong Kong Monetary Authority (hereinafter referred to as “HKMA”) if the HKMA notifies ICBC Asia that in the opinion of the HKMA or a relevant government body, ICBC Asia would become non-viable if there is no written off of the principal. The perpetual bond also contain Hong Kong Bail-in Power. Each holder of the perpetual bond shall be subject to the exercise by the Hong Kong Resolution Authority to any or a combination of the following:
(1) reduction or cancellation of all or a part of the principal and/or distribution of the perpetual bond;
(2) the conversion of all or a part of the principal and/or distribution of the perpetual bond into shares of ICBC Asia or another person; and/or
128
Notes to the Unaudited Interim Financial ReportFor the six months ended 30 June 2017(In RMB millions, unless otherwise stated)
(3) the amendment of the maturity, distribution payment date and/or the distribution amount of the perpetual bond.
ICBC Asia has a call option to redeem all the outstanding perpetual bond from 21 July 2021 or any subsequent distribution payment date thereafter.
(c) Changes in perpetual bond outstanding
1 January 2017 Movement during the period 30 June 2017
Financial instrument
outstanding
Amount
In original
currency In RMB Amount
In original
currency In RMB Amount
In original
currency In RMB
(million pieces) (million) (million) (million pieces) (million) (million) (million pieces) (million) (million)
USD Perpetual bond 1 1,000 6,691 – – – 1 1,000 6,691
Total 1 1,000 6,691 – – – 1 1,000 6,691
Note: The RMB amount of perpetual bond on 30 June 2017 is translated at the spot exchange rate on issuance date.
(3) Interests attributable to equity instruments’ holders
Equity instrument 1 January 2017 30 June 2017
1. Total equity attributable to equity holders of the parent company 1,969,751 2,018,295(1) Equity attributable to ordinary equity holders of the parent company 1,883,700 1,932,244(2) Equity attributable to other equity holders of the parent company 86,051 86,051
2. Total equity attributable to non-controlling interests 11,412 12,339(1) Equity attributable to non-controlling interests of ordinary shares 11,412 12,339(2) Equity attributable to non-controlling interests of other equity instruments – –
35. RESERVES(a) Capital reserve
Capital reserve mainly includes share premium arising from the issuance of new shares at prices in excess of par value.
(b) Surplus reserves(i) Statutory surplus reserve
The Bank is required to appropriate 10% of its profit for the year pursuant to the Company Law of the People’s Republic of China and the Articles to the statutory surplus reserve until the reserve balance reaches 50% of its registered capital.
Subject to the approval of the shareholders, the statutory surplus reserve may be used to offset accumulated losses of the Bank, if any, and may also be converted into capital of the Bank, provided that the balance of the statutory surplus reserve after such capitalisation is not less than 25% of the registered capital immediately before capitalisation.
(ii) Discretionary surplus reserve
After making the appropriation to the statutory surplus reserve, the Bank may also appropriate its profit for the year determined under PRC GAAP to the discretionary surplus reserve upon approval by the shareholders in general meetings. Subject to the approval by the shareholders, the discretionary surplus reserve may be used to offset accumulated losses of the Bank, if any, and may be converted into capital.
129I n t e r i m R e p o r t 2 0 1 7
Notes to the Unaudited Interim Financial ReportFor the six months ended 30 June 2017
(In RMB millions, unless otherwise stated)
(iii) Other surplus reserve
The Bank’s overseas entities appropriate their profits to the surplus reserve in accordance with the relevant regulations promulgated by the local regulatory bodies.
(c) General reserve
From 1 July 2012, the Bank is required by the MOF to maintain a general reserve within equity, through the appropriation of profit, which should not be less than 1.5% of the year-end balance of its risk assets.
The Bank’s subsidiaries appropriate their profits to the general reserve according to the applicable local regulations.
(d) Investment revaluation reserve
The investment revaluation reserve records the fair value changes of available-for-sale financial assets.
(e) Foreign currency translation reserve
The foreign currency translation reserve is used to record exchange differences arising from the translation of the financial statements of the subsidiaries and branches incorporated outside Mainland China.
(f) Cash flow hedging reserve
The cash flow hedge reserve comprises the effective portion of the gain or loss on the hedging instrument.
(g) Other reserves
Other reserves represent reserves of subsidiaries and share of reserves of associates and joint ventures other than the items listed above.
(h) Distributable profits
The Bank’s distributable profits are based on the retained profits of the Bank as determined under PRC GAAP and IFRSs, whichever is lower. The amount that the Bank’s subsidiaries can legally distribute is determined by reference to their profits as reflected in their financial statements prepared in accordance with the accounting regulations and principles promulgated by the local regulatory bodies of the respective countries/regions. These profits may differ from those dealt with in these financial statements, which are prepared in accordance with IFRSs.

130
Notes to the Unaudited Interim Financial ReportFor the six months ended 30 June 2017(In RMB millions, unless otherwise stated)
36. OTHER COMPREHENSIVE INCOME
Six months ended 30 June
2017 2016
Items that will not be reclassified to profit or loss: Share of the other comprehensive income of investees accounted for using equity method which will not be reclassified to profit or loss (11) (5) Others 1 (10)Items that may be reclassified subsequently to profit or loss: Net loss from change in fair value of available-for-sale financial assets (24,022) (5,600) Less: Transfer to profit or loss arising from disposal/impairment (214) (1,326) Income tax effect 5,991 1,791
(18,245) (5,135)
Effective hedging portion of gains or losses arising from cash flow hedging instruments: Gains/(losses) during the period 50 (288) Less: Income tax effect 54 52
104 (236)
Share of the other comprehensive income of investees accounted for using equity method which may be reclassified subsequently to profit or loss (180) (601) Foreign currency translation differences (2,980) 5,773 Others (29) –
(21,340) (214)
37. INVOLVEMENT WITH UNCONSOLIDATED STRUCTURED ENTITIES(a) Structured entities sponsored by third party institutions in which the Group holds an
interest
The Group holds an interest in some structured entities sponsored by third party institutions through investments in the notes issued by these structured entities. Such structured entities include investment funds, wealth management products, segregated asset management plans, trust plans and asset-backed securities and the Group does not consolidate these structured entities. The nature and purpose of these structured entities are to generate fees from managing assets on behalf of investors and are financed through the issue of notes to investors.
The following table sets out an analysis of the carrying amounts of interests held by the Group as at 30 June 2017 in the structured entities sponsored by third party institutions:
30 June 2017 31 December 2016
Carryingamount
Maximumexplosure
Carryingamount
Maximumexplosure
Investment funds 10,566 10,566 8,570 8,570Wealth management products 989 989 6,189 6,189Segregated asset management plan 321,327 321,327 243,722 243,722Trust plan 15,052 15,052 12,560 12,560Asset-backed securities 10,873 10,873 11,214 11,214
358,807 358,807 282,255 282,255

131I n t e r i m R e p o r t 2 0 1 7
Notes to the Unaudited Interim Financial ReportFor the six months ended 30 June 2017
(In RMB millions, unless otherwise stated)
The following table sets out an analysis of the line items in the statement of financial position as at 30 June 2017 in which assets are recognised relating to the Group’s interests in structured entities sponsored by third party institutions:
30 June 2017
Held-to-maturity
investments
Available-for-sale financial
assets
Financialassets
designatedat fair value
throughprofit or loss Receivables
Investment funds – 8,514 552 1,500Wealth management products – 289 – 700Segregated asset management plans – 4,088 233,424 83,815Trust plans – – – 15,052Asset-backed securities 111 9,713 – 1,049
111 22,604 233,976 102,116
31 December 2016
Held-to-maturity
investments
Available-for-sale financial
assets
Financialassets
designatedat fair value
throughprofit or loss Receivables
Investment funds – 7,070 – 1,500Wealth management products – 4,125 – 2,064Segregated asset management plans – 4,679 207,963 31,080Trust plans – – – 12,560Asset-backed securities 179 9,367 619 1,049
179 25,241 208,582 48,253
The maximum exposures to loss in the above investment funds, wealth management products, segregated asset management plans, trust plans and asset-backed securities are the amortised cost or fair value of the assets held by the Group at the reporting date in accordance with the line items of these assets recognised in the statement of financial positions.
(b) Structured entities sponsored by the Group which the Group does not consolidate but holds an interest.
The types of unconsolidated structured entities sponsored by the Group include investment funds and non-principal-guaranteed wealth management products. The nature and purpose of these structured entities are to generate fees from managing assets on behalf of investors. These structured entities are financed through the issue of notes to investors. Interest held by the Group includes investments in notes issued by these structured entities and fees charged by providing management services. As at 30 June 2017, the carrying amounts of the investments in the notes issued by these structured entities and fee receivables being recognised are not material in the statement of financial positions.
As at 30 June 2017, the amount of assets held by the unconsolidated non-principal-guaranteed wealth management products and investment funds, which are sponsored by the Group, were RMB2,363,113 million (31 December 2016: RMB2,423,950 million) and RMB1,394,137 million (31 December 2016: RMB1,127,964 million) respectively.
132
Notes to the Unaudited Interim Financial ReportFor the six months ended 30 June 2017(In RMB millions, unless otherwise stated)
(c) Unconsolidated structured entities sponsored by the Group during the period which the Group does not have an interest in as at 30 June 2017
During the reporting period, the amount of fee and commission income received from such category of non-principal-guaranteed wealth management products by the Group was RMB1,652 million (six months ended 30 June 2016: RMB529 million).
During the reporting period, the amount of income received from such category of investment funds was RMB20 million (six months ended 30 June 2016: RMB0.5 million).
The aggregated amount of the non-principal-guaranteed wealth management products sponsored and issued by the Group after 1 January 2017 but matured before 30 June 2017 was RMB431,749 million (The aggregated amount of the non-principal-guaranteed wealth management products sponsored and issued by the Group after 1 January 2016 but matured before 30 June 2016 was RMB93,806 million).
The aggregated amount of the investment funds sponsored and issued by the Group after 1 January 2017 but matured before 30 June 2017 was RMB28,680 million (The aggregated amount of the investment funds sponsored and issued by the Group after 1 January 2016 but matured before 30 June 2016 was RMB3,863 million).
38. NOTES TO THE CONSOLIDATED STATEMENT OF CASH FLOWSAnalysis of balances of cash and cash equivalents
Note30 June
201730 June
2016
Cash on hand 14 76,765 77,763Balances with central banks other than restricted deposits 14 172,885 211,544Nostro accounts with banks and other financial institutions with original maturity of three months or less 287,045 125,719Placements with banks and other financial institutions with original maturity of three months or less 202,667 295,923Reverse repurchase agreements with original maturity of three months or less 718,328 620,568
1,457,690 1,331,517
39. TRANSFERRED FINANCIAL ASSETS
The Group enters into transactions in the normal course of business by which it transfers recognised financial assets to third parties or to structured entities. In some cases where these transfers may give rise to full or partial derecognition of the financial assets concerned. In other cases where the transferred assets do not qualify for derecognition as the Group has retained substantially all the risks and rewards of these assets, the Group continued to recognise the transferred assets.
Repurchase transactions and securities lending transactions
Transferred financial assets that do not qualify for derecognition mainly include debt securities held by counterparties as collateral under repurchase agreements and debt securities lent to counterparties under securities lending agreements. The counterparties are allowed to sell or repledge those securities sold under repurchase agreements in the absence of default by the Group, but has an obligation to return the securities at the maturity of the contract. If the securities increase or decrease in value, the Group may require or be required to pay additional cash collateral in certain circumstances. The Group has determined that it retains substantially all the risks and rewards of these securities and therefore has not derecognised them. In addition, it recognises a financial liability for cash received as collateral.
133I n t e r i m R e p o r t 2 0 1 7
Notes to the Unaudited Interim Financial ReportFor the six months ended 30 June 2017
(In RMB millions, unless otherwise stated)
The following table analyses the carrying amount of the above mentioned assets transferred to third parties that did not qualify for derecognition and their associated financial liabilities:
30 June 2017 31 December 2016Carrying
amount oftransferred
assets
Carryingamount ofassociated
liabilities
Carryingamount of
transferredassets
Carryingamount ofassociated
liabilities
Repurchase agreements 29,023 28,894 25,228 25,160Securities lending agreements 95,538 – 75,081 –
124,561 28,894 100,309 25,160
Securitisation transactions
The Group enters into securitisation transactions in the normal course of business by which it transfers credit assets to structured entities which issue asset-backed securities to investors.
As the Group neither transfers nor retains substantially all the risks and rewards of ownership of the financial asset and it has retained control of them, the Group retains interests in the form of subordinated tranches which would give rise to the Group’s continuing involvement in the transferred assets. Those financial assets are recognised on the balance sheet to the extent of the Group’s continuing involvement. The extent of the Group’s continuing involvement is the extent to which the Group is exposed to changes in the value of the transferred assets. As of 30 June 2017, loans with an original carrying amount of RMB49,296 million (31 December 2016: RMB45,290million) have been securitised by the Group under arrangements in which the Group retains a continuing involvement in such assets in the form of subordinated tranches. As at 30 June 2017, the carrying amount of assets that the Group continues to recognise was RMB2,181 million (31 December 2016: RMB2,107million).
With respect to the securitisation of financial assets that do not qualify for derecognition, the relevant financial assets are not derecognised, and the consideration paid by third parties are recorded as a financial liability. As of 30 June 2017, the Group does not have carrying amount of transferred assets that did not qualify for derecognition and carrying amount of their associated liabilities (31 December 2016: Nil).

134
Notes to the Unaudited Interim Financial ReportFor the six months ended 30 June 2017(In RMB millions, unless otherwise stated)
40. SHARE APPRECIATION RIGHTS PLAN
The Bank’s share appreciation rights plan was approved in 2006, which allows share appreciation rights to be granted to eligible participants including directors, supervisors, senior management and other key personnel designated by the board of directors. The share appreciation rights will be granted and exercised based on the price of the Bank’s H shares and will be valid for 10 years. As at the approval date of these financial statements, no share appreciation rights have been granted.
41. COMMITMENTS AND CONTINGENT LIABILITIES(a) Capital commitments
At the end of the reporting period, the Group had capital commitments as follows:
30 June 2017
31 December 2016
Authorised, but not contracted for 615 535Contracted, but not provided for 34,678 27,833
35,293 28,368
(b) Operating lease commitments
At the end of the reporting period, the Group leased certain of its office properties under operating lease arrangements, and the total future minimum lease payments in respect of non-cancellable operating leases were as follows:
30 June 2017
31 December 2016
Within one year 5,312 5,455Over one year but within five years 9,287 9,899Over five years 1,210 2,266
15,809 17,620
(c) Credit commitments
At any given time, the Group has outstanding commitments to extend credit. These commitments are in the form of approved loans and undrawn credit card limits.
The Group provides letters of credit and financial guarantees to guarantee the performance of customers to third parties.
Bank acceptances comprise undertakings by the Group to pay bills of exchange drawn on customers. The Group expects most acceptances to be settled simultaneously with the reimbursement from the customers.
The contractual amounts of credit commitments by category are set out below. The amounts disclosed in respect of loan commitments and undrawn credit card limit are under the assumption that the amounts will be fully advanced. The amounts for bank acceptances, letters of credit and guarantees represent the maximum potential losses that would be recognised at the end of the reporting period had the counterparties failed to perform as contracted.
30 June 2017
31 December 2016
Bank acceptances 254,378 271,691Guarantees issued Financing letters of guarantees 154,730 137,076 Non-financing letters of guarantees 317,985 295,471Sight letters of credit 31,404 45,752Usance letters of credit and other commitments 147,379 143,393Loan commitments With an original maturity of under one year 239,801 173,392 With an original maturity of one year or over 1,213,182 1,064,189Undrawn credit card limit 794,090 647,448
3,152,949 2,778,412
135I n t e r i m R e p o r t 2 0 1 7
Notes to the Unaudited Interim Financial ReportFor the six months ended 30 June 2017
(In RMB millions, unless otherwise stated)
30 June 2017
31 December 2016
Credit risk-weighted assets of credit commitments (i) 1,410,082 1,231,376
(i) Internal Ratings-Based approach was adopted to calculate the credit risk-weighted assets according to the scope approved by the CBRC, and others were calculated by weighted approach.
(d) Legal proceedings
As at 30 June 2017, there were a number of legal proceedings outstanding against the Bank and/or its subsidiaries with a claimed amount of RMB5,483 million (31 December 2016: RMB5,515 million).
In the opinion of management, the Group has made adequate allowance for any probable losses based on the current facts and circumstances, and the ultimate outcome of these lawsuits will not have a material impact on the financial position or operations of the Group.
(e) Redemption commitments of government bonds
As an underwriting agent of the Government, the Bank underwrites certain PRC government bonds and sells the bonds to the general public, in which the Bank is obliged to redeem these bonds at the discretion of the holders at any time prior to maturity. The redemption price for the bonds is based on the nominal value of the bonds plus any interest accrued up to the redemption date. As at 30 June 2017, the Bank had underwritten and sold bonds with an accumulated amount of RMB87,089 million (31 December 2016: RMB97,646 million) to the general public, and these government bonds have not yet matured nor been redeemed. Management expects that the amount of redemption of these government bonds through the Bank prior to maturity will not be material.
The MOF will not provide funding for the early redemption of these government bonds on a back-to-back basis but is obliged to repay the principal and the respective interest upon maturity.
(f) Underwriting obligations
As at 30 June 2017, the Group had no unexpired securities underwriting obligations (31 December 2016: Nil).
42. DESIGNATED FUNDS AND LOANS
30 June 2017
31 December 2016
Designated funds 1,230,146 1,170,264Designated loans 1,229,572 1,169,979
The designated funds represent the funding that the trustors have instructed the Group to use to make loans to third parties as designated by them. The credit risk remains with the trustors.
The designated loans represent the loans granted to specific borrowers designated by the trustors on their behalf according to the entrust agreements signed by the Group and the trustors. The Group does not bear any risk.
43. ASSETS PLEDGED
Financial assets of the Group including securities, bills and loans have been pledged as collateral for liabilities or contingent liabilities, mainly repurchase agreements and derivative contracts. As at 30 June 2017, the carrying value of the Group’s financial assets pledged as collateral amounted to approximately RMB467,867 million (31 December 2016: RMB341,593 million).
44. FIDUCIARY ACTIVITIES
The Group provides custody, trust and asset management services to third parties. Revenue from such activities is included in “net fee and commission income” set out in note 4. Those assets held in a fiduciary capacity are not included in the Group’s consolidated statement of financial position.

136
Notes to the Unaudited Interim Financial ReportFor the six months ended 30 June 2017(In RMB millions, unless otherwise stated)
45. RELATED PARTY DISCLOSURES
In addition to the transactions detailed elsewhere in this interim financial report, the Group had the following transactions with related parties during the period:
(a) Shareholders with significant influence(i) The MOF
The MOF is a ministry under the State Council, primarily responsible for, among others, state fiscal revenues, expenses and taxation policies. As at 30 June 2017, the MOF directly owned approximately 34.60% (31 December 2016: approximately 34.60%) of the issued share capital of the Bank. The Group enters into banking transactions with the MOF in its normal course of business, including the subscription and redemption of government bonds issued by the MOF. Details of the material transactions are as follows:
30 June 2017
31 December 2016
Balances at end of the period/year: The PRC government bonds and the special government bond 849,231 847,923
Six months ended 30 June
2017 2016
Transactions during the period: Subscription of the PRC government bonds 162,071 55,603 Redemption of the PRC government bonds 94,864 31,152 Interest income on the PRC government bonds 15,082 14,044
Interest rate ranges during the period are as follows: % % Bond investments 2.10 to 6.15 2.16 to 6.34
As at 30 June 2017, the Group holds a series of long term bonds issued by Huarong, which is under the control of the MOF, with an aggregate amount of RMB94,249 million (31 December 2016: RMB94,249 million). The details of Huarong bonds are included in note 21.
Other related party transactions between the Group and enterprises under the control or joint control of the MOF are disclosed in note 45(g) “transactions with state-owned entities in the PRC”.
(ii) Huijin
As at 30 June 2017, Central Huijin Investment Ltd. (“Huijin”) directly owned approximately 34.71% (31 December 2016: approximately 34.71%) of the issued share capital of the Bank. Huijin is a state-owned investment company established on 16 December 2003 under the Company Law of the PRC. Huijin has a total registered and paid-in capital of RMB828,209 million. Huijin is a wholly-owned subsidiary of China Investment Corporation, and in accordance with the authorisation by the State, Huijin makes equity investments in the key state-owned financial institutions, and shall, to the extent of its capital contribution, exercise the rights and perform the obligations as an investor on behalf of the State in accordance with applicable laws to achieve the goal of preserving and enhancing the value of state-owned financial assets. Huijin does not engage in other business activities, and does not intervene in the day-to-day business operations of the key state-owned financial institutions it controls.
As at 30 June 2017, Huijin Bonds held by the Bank had an aggregate face value of RMB16.91 billion (31 December 2016: RMB16.91 billion), with terms ranging from 3 to 30 years and coupon rates ranging from 3.16% to 4.20% per annum. The Huijin Bonds are government-backed and the Bank’s subscription of the Huijin Bonds was conducted in the ordinary course of business, in compliance with relevant regulatory requirements and the corporate governance of the Bank.
137I n t e r i m R e p o r t 2 0 1 7
Notes to the Unaudited Interim Financial ReportFor the six months ended 30 June 2017
(In RMB millions, unless otherwise stated)
The Group entered into banking transactions with Huijin in the ordinary course of business under normal commercial terms and at the market rates. Details of the material transactions are as follows:
30 June 2017
31 December 2016
Balances at end of the period/year: Debt securities purchased 16,568 16,786 Interest receivable 510 200 Loans and advances to customers 17,000 – Due to customers 2,335 5 Interest payable 0 50 Financial liabilities designated at fair value through profit or loss – 2,800
Six months ended 30 June
2017 2016
Transactions during the period: Interest income on debt securities purchased 303 312 Interest income on loans and advances to customers 83 – Interest expense on due to customers 38 30 Net loss on financial liabilities designated at fair value through profit or loss 26 136
Interest rate ranges during the period are as follows: % % Debt securities purchased 3.16 to 4.20 3.16 to 4.20 Loans and advances to customers 3.92 – Due to customers 0.30 to 1.76 0.30 to 2.17
Huijin has equity interests in certain other banks and financial institutions under the direction of the Government. The Group enters into transactions with these banks and financial institutions in the ordinary course of business under normal commercial terms. Management considers that these banks and financial institutions are competitors of the Group. Significant transactions during the period conducted with these banks and financial institutions, and the corresponding balances as at 30 June 2017 are as follows:
30 June 2017
31 December 2016
Balances at end of the period/year: Debt securities purchased 623,627 781,753 Due from banks and other financial institutions 62,596 59,283 Loans and advances to customers 400 702 Derivative financial assets 1,537 2,329 Due to banks and other financial institutions 127,549 140,601 Derivative financial liabilities 1,413 2,533 Due to customers 12,840 18,317 Credit commitments 16,688 13,530
Six months ended 30 June
2017 2016
Transactions during the period: Interest income on debt securities purchased 11,966 14,822 Interest income on amounts due from banks and other financial institutions 138 115 Interest income on loans and advances to customers 7 48 Interest expense on due to customers 140 196 Interest expense on amounts due to banks and other financial institutions 821 898
Interest rate ranges during the period are as follows: % % Debt securities purchased 0.13 to 7.67 1.05 to 6.15 Due from banks and other financial institutions 0 to 10.55 0 to 6.21 Loans and advances to customers 4.35 to 5.40 1.44 to 3.80 Due to customers 0.30 to 2.00 0.01 to 2.00 Due to banks and other financial institutions 0 to 5.55 0 to 7.50

138
Notes to the Unaudited Interim Financial ReportFor the six months ended 30 June 2017(In RMB millions, unless otherwise stated)
The interest rates disclosed above vary across product groups and transactions depending on the maturity date, credit risk of counterparty and currency. In particular, given local market conditions, the spread of certain significant or long dated transactions can vary across the market.
(b) Subsidiaries
30 June 2017
31 December 2016
Balances at end of the period/year: Debt securities purchased 23,787 25,971 Due from banks and other financial institutions 384,222 427,149 Loans and advances to customers 14,162 15,442 Derivative financial assets 2,735 8,757 Due to banks and other financial institutions 387,589 435,283 Derivative financial liabilities 4,176 3,643 Reverse repurchase agreements 7,317 18,456 Repurchase agreements 8,825 21,328 Financial investments 4,563 3,599 Credit commitments 120,513 103,473
Six months ended 30 June
2017 2016
Transactions during the period: Interest income on debt securities purchased 132 58 Interest income on amounts due from banks and other financial institutions 870 343 Interest income on loans and advances to customers 698 135 Interest expense on amounts due to banks and other financial institutions 540 337 Fee and commission income 1,109 922
Interest rate ranges during the period are as follows: % % Debt securities purchased 0.72 to 4.50 0.90 to 4.50 Due from banks and other financial institutions 0 to 105.00 0 to 3.50 Loans and advances to customers 0.25 to 6.15 0.70 to 6.61 Due to banks and other financial institutions 0 to 40.00 0 to 6.30
The material balances and transactions with subsidiaries have been eliminated in the consolidated financial statements.

139I n t e r i m R e p o r t 2 0 1 7
Notes to the Unaudited Interim Financial ReportFor the six months ended 30 June 2017
(In RMB millions, unless otherwise stated)
(c) Associates and affiliates
30 June 2017
31 December 2016
Balances at end of the period/year: Due from banks and other financial institutions 277 1,714 Loans and advances to customers 1,653 1,802 Derivative financial assets 1,021 1,151 Due to banks and other financial institutions 10,936 8,588 Due to customers 227 7 Derivative financial liabilities 676 941 Credit commitments 68 43
Six months ended 30 June
2017 2016
Transactions during the period: Interest income on amounts due from banks and other financial institutions 0 41 Interest income on loans and advances to customers 22 144 Interest expense on amounts due to banks and other financial institutions 53 51 Interest expense on due to customers 1 –
Interest rate ranges during the period are as follows: % % Due from banks and other financial institutions 0 to 0.35 0 to 9.81 Loans and advances to customers 0.50 to 4.28 1.46 to 13.00 Due to banks and other financial institutions 0 to 0.72 0 to 4.47 Due to customers 0 to 1.79 0 to 0.30
The major transactions between the Group and the associates and their affiliates mainly comprised due from banks and other financial institutions, loans and advances to customers and due to banks and other financial institutions and the corresponding interest income and interest expense. In the opinion of management, the transactions between the Group and the associates and their affiliates were conducted under normal commercial terms and conditions.
(d) Joint ventures and affiliates
30 June 2017
31 December 2016
Balances at end of the period/year:
Loans and advances to customers 64 – Due to customers 216 227
Six months ended 30 June
2017 2016
Transactions during the period:
Interest income on loans and advances to customers 1 – Interest expense on due to customers 3 –
Interest rate ranges during the period are as follows: % % Loans and advances to customers 3.03 – Due to customers 0.01 to 1.30 0.30
In the opinion of management, the transactions between the Group and the aforementioned parties were conducted in the ordinary course of business under normal terms and conditions and at market rates.
140
Notes to the Unaudited Interim Financial ReportFor the six months ended 30 June 2017(In RMB millions, unless otherwise stated)
(e) Key management personnel
The key management personnel are those persons who have the authority and responsibility to plan, direct and control the activities of the Group, directly or indirectly, including members of the board of directors, the supervisory board and executive officers.
The aggregate compensation for the period is as follows:
Six months ended 30 June
2017 In RMB’000
2016 In RMB’000
Short term employment benefits 5,254 4,594Post-employment benefits 291 206
5,545 4,800
Companies or corporations of which the key management of the Group or their close relatives are shareholders or key management personnel who are able to exercise control directly or indirectly are also considered as related parties of the Group.
The transactions between the Group and the aforementioned parties for the period are as follows:
30 June 2017
31 December 2016
RMB’000 RMB’000
Loans – 2,693
For the six months ended 30 June 2017, there were no material transactions and balances with key management personnel on an individual basis. The Group enters into banking transactions with key management personnel in the normal course of business.
The aggregated balance of loans and credit card overdrafts to the persons which are considered as related parties according to the relevant rules of Shanghai Stock Exchange was RMB36.75 million as at 30 June 2017 (31 December 2016: RMB28.58 million).
In the opinion of management, the transactions between the Group and the aforementioned parties were conducted in the ordinary course of business under normal terms and conditions and at market rates.
(f) Annuity Fund
In addition to the obligations for defined contributions to the Annuity Fund, Annuity Fund does not hold any share or bond issued by the Group as at 30 June 2017 (31 December 2016: Nil).
(g) Transactions with state-owned entities in the PRC
The Group operates in an economic environment predominated by enterprises directly or indirectly owned and/or controlled by the Government through its authorities, affiliates or other organisations (collectively the “state-owned entities”). During the reporting period, the Group entered into extensive banking transactions with these state-owned entities including, but not limited to, lending and deposit taking, taking and placing of interbank balances, entrusted lending and the provision of intermediary services, the sale, purchase, underwriting and redemption of bonds issued by other state-owned entities, and the sale, purchase, and leasing of properties and other assets.
Management considers that transactions with state-owned entities are activities conducted in the ordinary course of business, and that the dealings of the Group have not been significantly or unduly affected by the fact that the Group and those state-owned entities are ultimately controlled or owned by the Government. The Group has also established market pricing policies for products and services and such pricing policies do not depend on whether or not the customers are state-owned entities.
141I n t e r i m R e p o r t 2 0 1 7
Notes to the Unaudited Interim Financial ReportFor the six months ended 30 June 2017
(In RMB millions, unless otherwise stated)
46. SEGMENT INFORMATION(a) Operating segments
For management purposes, the Group is organised into different operating segments, namely corporate banking, personal banking and treasury operations, based on internal organisational structure, management requirement and internal reporting system.
Corporate banking
The corporate banking segment covers the provision of financial products and services to corporations, government agencies and financial institutions. The products and services include corporate loans, trade financing, deposit-taking activities, corporate wealth management services, custody activities and various types of corporate intermediary services, etc.
Personal banking
The personal banking segment covers the provision of financial products and services to individual customers. The products and services include personal loans, deposit-taking activities, card business, personal wealth management services and various types of personal intermediary services, etc.
Treasury operations
The treasury operations segment covers the Group’s treasury operations which include money market transactions, investment securities, foreign exchange transactions and the holding of derivative positions, for its own accounts or on behalf of customers, etc.
Others
This segment covers the Group’s assets, liabilities, income and expenses that are not directly attributable or cannot be allocated to a segment on a reasonable basis.
Management monitors the operating results of the Group’s business units separately for the purpose of making decisions about resources allocation and performance assessment. Segment information is prepared in conformity with the accounting policies adopted for preparing and presenting this interim financial report of the Group.
Transactions between segments mainly represent the provision of funding to and from individual segments. These transactions are conducted on terms determined with reference to the average cost of funding and have been reflected in the performance of each segment. Net interest income and expense arising on internal fund transfer are referred to as “internal net interest income/expense”. Net interest income and expense relating to third parties are referred to as “external net interest income/expense”.
142
Notes to the Unaudited Interim Financial ReportFor the six months ended 30 June 2017(In RMB millions, unless otherwise stated)
Segment revenues, expenses, results, assets and liabilities include items directly attributable to a segment as well as those that can be allocated on a reasonable basis. The basis for allocation is mainly based on occupation of or contribution to resources. Income taxes are managed on a group basis and are not allocated to operating segments.
Six months ended 30 June 2017
Corporate banking
Personal banking
Treasury operations Others Total
External net interest income 123,129 25,386 102,407 – 250,922Internal net interest (expense)/income (2,710) 62,314 (59,604) – –Net fee and commission income 44,385 32,139 146 – 76,670Other income, net (i) 3,748 21 3,365 2,013 9,147
Operating income 168,552 119,860 46,314 2,013 336,739Operating expenses (30,936) (39,005) (7,856) (2,473) (80,270)Impairment (losses)/reversal on: Loans and advances to customers (57,045) (3,956) – – (61,001) Others (252) (62) 78 (106) (342)
Operating profit/(loss) 80,319 76,837 38,536 (566) 195,126Share of profits of associates and joint ventures – – – 1,372 1,372
Profit before taxation 80,319 76,837 38,536 806 196,498
Income tax expense (42,811)
Profit for the period 153,687
Other segment information: Depreciation 3,107 2,578 1,223 143 7,051 Amortisation 461 328 190 27 1,006 Capital expenditure 6,498 5,368 2,547 302 14,715
As at 30 June 2017
Corporate banking
Personal banking
Treasury operations Others Total
Segment assets 9,359,769 4,640,695 11,356,649 156,933 25,514,046
Including: Investments in associates and joint ventures – – – 32,220 32,220Property and equipment 97,039 80,290 37,988 30,382 245,699Other non-current assets (ii) 19,883 7,087 4,299 11,197 42,466
Segment liabilities 10,967,016 8,721,836 3,533,373 261,187 23,483,412
Other segment information: Credit commitments 2,358,859 794,090 – – 3,152,949
(i) Includes net trading income, net loss on financial assets and liabilities designated at fair value through profit or loss, net gain
on financial investments and other operating income (net).
(ii) Includes long-term receivables, intangible assets, goodwill, long-term deferred expenses and other non-current assets.

143I n t e r i m R e p o r t 2 0 1 7
Notes to the Unaudited Interim Financial ReportFor the six months ended 30 June 2017
(In RMB millions, unless otherwise stated)
Six months ended 30 June 2016
Corporate banking
Personal banking
Treasury operations Others Total
External net interest income 125,951 11,606 96,723 – 234,280Internal net interest (expense)/income (12,384) 73,885 (61,501) – –Net fee and commission income 45,615 35,891 209 – 81,715Other income/(expense), net (i) 3,128 (101) 8,189 1,770 12,986
Operating income 162,310 121,281 43,620 1,770 328,981Operating expenses (38,149) (41,922) (8,170) (2,353) (90,594)Impairment losses on: Loans and advances to customers (37,688) (6,203) – – (43,891) Others (35) – (453) (54) (542)
Operating profit/(loss) 86,438 73,156 34,997 (637) 193,954Share of profits of associates and joint ventures – – – 1,121 1,121
Profit before taxation 86,438 73,156 34,997 484 195,075
Income tax expense (44,419)
Profit for the period 150,656
Other segment information: Depreciation 3,306 2,642 1,294 152 7,394 Amortisation 494 341 208 30 1,073 Capital expenditure 7,206 5,693 2,810 339 16,048
As at 31 December 2016
Corporate banking
Personal banking
Treasury operations Others Total
Segment assets 8,914,597 4,245,097 10,840,773 136,798 24,137,265
Including: Investments in associates and joint ventures – – – 30,077 30,077Property and equipment 99,810 79,878 39,045 27,476 246,209Other non-current assets (ii) 19,817 7,189 4,547 11,390 42,943
Segment liabilities 10,088,166 8,376,975 3,536,514 154,447 22,156,102
Other segment information: Credit commitments 2,130,964 647,448 – – 2,778,412
(i) Includes net trading income, net loss on financial assets and liabilities designated at fair value through profit or loss, net gain
on financial investments and other operating income (net).
(ii) Includes long-term receivables, intangible assets, goodwill, long-term deferred expenses and other non-current assets.
144
Notes to the Unaudited Interim Financial ReportFor the six months ended 30 June 2017(In RMB millions, unless otherwise stated)
(b) Geographical information
The Group operates principally in Mainland China, and also has branches and subsidiaries operating outside Mainland China (including: Hong Kong, Macau, Singapore, Frankfurt, Luxembourg, Seoul, Tokyo, London, Almaty, Jakarta, Moscow, Doha, Dubai, Abu Dhabi, Sydney, Toronto, Kuala Lumpur, Hanoi, Bangkok, New York, Karachi, Mumbai, Phnom Penh, Vientiane, Lima, Buenos Aires, Sao Paulo, Auckland, Kuwait City, Mexico City, Yangon, Riyadh, Istanbul and Prague, etc.).
The distribution of the geographical areas is as follows:
Mainland China (Head Office and domestic branches):
Head Office (“HO”): the HO business division (including institutions directly controlled by the HO and their offices);
Yangtze River Delta: including Shanghai, Jiangsu, Zhejiang and Ningbo;
Pearl River Delta: including Guangdong, Shenzhen, Fujian and Xiamen;
Bohai Rim: including Beijing, Tianjin, Hebei, Shandong and Qingdao;
Central China: including Shanxi, Henan, Hubei, Hunan, Anhui, Jiangxi and Hainan;
Western China: including Chongqing, Sichuan, Guizhou, Yunnan, Guangxi, Shaanxi, Gansu, Qinghai, Ningxia, Xinjiang, Inner Mongolia and Tibet; and
Northeastern China: including Liaoning, Heilongjiang, Jilin and Dalian.
Overseas and others: branches located outside Mainland China, domestic and overseas subsidiaries, and investments in associates and joint ventures.
Six months ended 30 June 2017
Mainland China (HO and domestic branches)
Head Office
Yangtze
River Delta
Pearl
River Delta
Bohai
Rim
Central
China
Western
China
Northeastern
China
Overseas
and others Eliminations Total
External net interest income 99,978 24,080 22,949 14,404 23,808 34,778 7,277 23,648 – 250,922
Internal net interest (expense)/income (66,296) 13,940 6,639 33,401 6,858 4,091 3,843 (2,476) – –
Net fee and commission income 3,259 19,665 13,282 12,997 10,292 10,822 2,642 3,723 (12) 76,670
Other (expense)/income, net (i) (1,178) 394 587 3,497 78 407 (81) 5,463 (20) 9,147
Operating income 35,763 58,079 43,457 64,299 41,036 50,098 13,681 30,358 (32) 336,739
Operating expenses (8,040) (11,348) (8,868) (13,212) (11,540) (13,192) (5,158) (8,944) 32 (80,270)
Impairment (losses)/reversal on:
Loans and advances to customers (5,730) (8,408) (9,411) (15,306) (9,239) (9,201) (2,440) (1,266) – (61,001)
Others 144 (35) 103 (42) (370) (76) (6) (60) – (342)
Operating profit 22,137 38,288 25,281 35,739 19,887 27,629 6,077 20,088 – 195,126
Share of profits of associates and
joint ventures – – – – – – – 1,372 – 1,372
Profit before taxation 22,137 38,288 25,281 35,739 19,887 27,629 6,077 21,460 – 196,498
Income tax expense (42,811)
Profit for the period 153,687
Other segment information:
Depreciation 871 974 668 1,055 1,241 1,454 583 205 – 7,051
Amortisation 258 116 97 81 143 177 42 92 – 1,006
Capital expenditure 207 1,477 70 157 196 200 92 12,316 – 14,715
(i) Includes net trading income, net loss on financial assets and liabilities designated at fair value through profit or loss, net gain
on financial investments and other operating income (net).

145I n t e r i m R e p o r t 2 0 1 7
Notes to the Unaudited Interim Financial ReportFor the six months ended 30 June 2017
(In RMB millions, unless otherwise stated)
As at 30 June 2017
Mainland China (HO and domestic branches)
Head Office
Yangtze
River Delta
Pearl
River Delta
Bohai
Rim
Central
China
Western
China
Northeastern
China
Overseas
and others Eliminations Total
Assets by geographical areas 8,884,314 4,430,752 2,745,895 3,377,829 2,313,616 2,877,100 995,183 3,639,021 (3,784,503) 25,479,207
Including: Investments in associates and
joint ventures – – – – – – – 32,220 – 32,220
Property and equipment 12,282 29,182 10,447 16,861 18,149 22,084 9,837 126,857 – 245,699
Other non-current assets (i) 10,890 5,804 3,584 3,791 5,506 7,523 1,402 3,966 – 42,466
Unallocated assets 34,839
Total assets 25,514,046
Liabilities by geographical areas 7,244,610 4,644,922 2,800,710 5,156,992 2,593,157 2,989,066 1,118,726 680,092 (3,784,503) 23,443,772
Unallocated liabilities 39,640
Total liabilities 23,483,412
Other segment information:
Credit commitments 813,772 500,937 416,563 510,024 200,918 259,914 76,007 374,814 – 3,152,949
(i) Includes long-term receivables, intangible assets, goodwill, long-term deferred expenses and other non-current assets.
Six months ended 30 June 2016
Mainland China (HO and domestic branches)
Head Office
Yangtze
River Delta
Pearl
River Delta
Bohai
Rim
Central
China
Western
China
Northeastern
China
Overseas
and others Eliminations Total
External net interest income 102,998 22,942 20,848 11,184 21,579 34,265 7,269 13,195 – 234,280
Internal net interest (expense)/income (69,559) 14,288 6,509 33,932 7,890 3,573 3,941 (574) – –
Net fee and commission income 2,219 21,598 13,035 14,431 11,821 11,751 3,701 3,338 (179) 81,715
Other income, net (i) 1,422 449 498 2,963 230 682 70 6,672 – 12,986
Operating income 37,080 59,277 40,890 62,510 41,520 50,271 14,981 22,631 (179) 328,981
Operating expenses (10,550) (13,617) (9,864) (14,691) (13,247) (15,080) (5,764) (7,960) 179 (90,594)
Impairment (losses)/reversal on:
Loans and advances to customers (4,556) (8,663) (6,591) (7,211) (5,917) (8,408) (799) (1,746) – (43,891)
Others 182 (37) (286) (90) (81) (60) (5) (165) – (542)
Operating profit 22,156 36,960 24,149 40,518 22,275 26,723 8,413 12,760 – 193,954
Share of profits of associates and
joint ventures – – – – – – – 1,121 – 1,121
Profit before taxation 22,156 36,960 24,149 40,518 22,275 26,723 8,413 13,881 – 195,075
Income tax expense (44,419)
Profit for the period 150,656
Other segment information:
Depreciation 941 1,042 715 1,090 1,296 1,513 583 214 – 7,394
Amortisation 325 117 94 76 138 187 35 101 – 1,073
Capital expenditure 633 305 87 240 294 359 161 13,969 – 16,048
(i) Includes net trading income, net loss on financial assets and liabilities designated at fair value through profit or loss, net gain
on financial investments and other operating income (net).
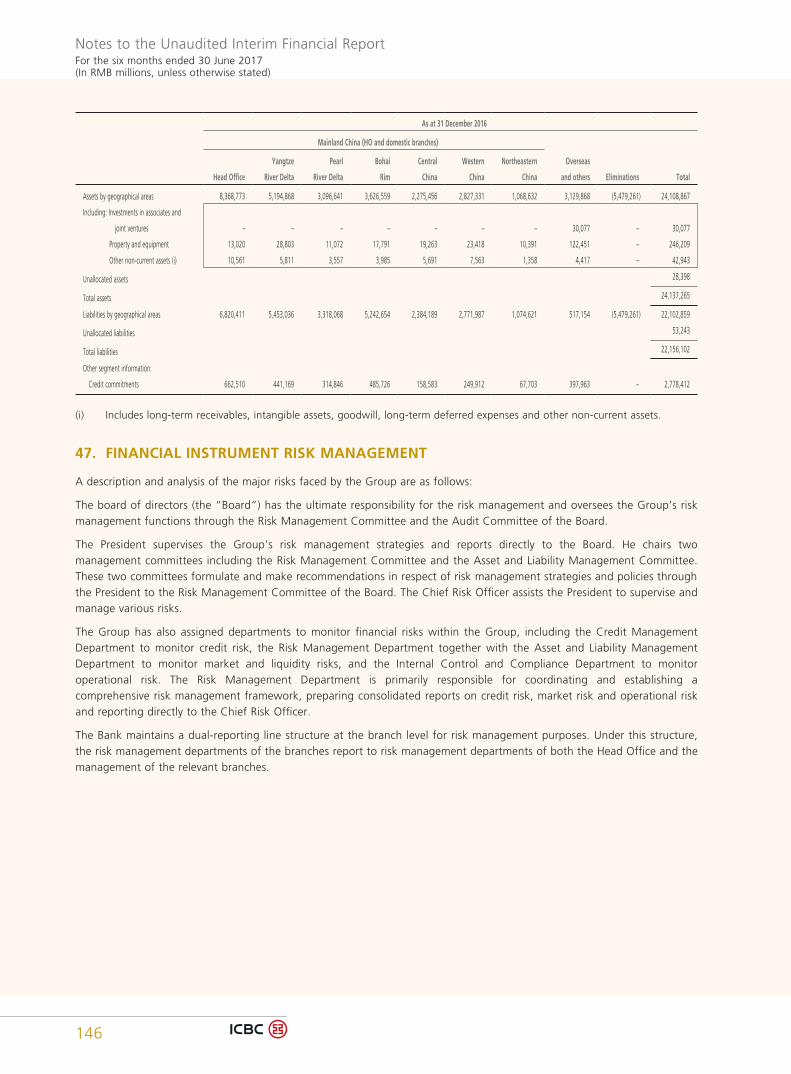
146
Notes to the Unaudited Interim Financial ReportFor the six months ended 30 June 2017(In RMB millions, unless otherwise stated)
As at 31 December 2016
Mainland China (HO and domestic branches)
Head Office
Yangtze
River Delta
Pearl
River Delta
Bohai
Rim
Central
China
Western
China
Northeastern
China
Overseas
and others Eliminations Total
Assets by geographical areas 8,368,773 5,194,868 3,096,641 3,626,559 2,275,456 2,827,331 1,068,632 3,129,868 (5,479,261) 24,108,867
Including: Investments in associates and
joint ventures – – – – – – – 30,077 – 30,077
Property and equipment 13,020 28,803 11,072 17,791 19,263 23,418 10,391 122,451 – 246,209
Other non-current assets (i) 10,561 5,811 3,557 3,985 5,691 7,563 1,358 4,417 – 42,943
Unallocated assets 28,398
Total assets 24,137,265
Liabilities by geographical areas 6,820,411 5,453,036 3,318,068 5,242,654 2,384,189 2,771,987 1,074,621 517,154 (5,479,261) 22,102,859
Unallocated liabilities 53,243
Total liabilities 22,156,102
Other segment information:
Credit commitments 662,510 441,169 314,846 485,726 158,583 249,912 67,703 397,963 – 2,778,412
(i) Includes long-term receivables, intangible assets, goodwill, long-term deferred expenses and other non-current assets.
47. FINANCIAL INSTRUMENT RISK MANAGEMENT
A description and analysis of the major risks faced by the Group are as follows:
The board of directors (the “Board”) has the ultimate responsibility for the risk management and oversees the Group’s risk management functions through the Risk Management Committee and the Audit Committee of the Board.
The President supervises the Group’s risk management strategies and reports directly to the Board. He chairs two management committees including the Risk Management Committee and the Asset and Liability Management Committee. These two committees formulate and make recommendations in respect of risk management strategies and policies through the President to the Risk Management Committee of the Board. The Chief Risk Officer assists the President to supervise and manage various risks.
The Group has also assigned departments to monitor financial risks within the Group, including the Credit Management Department to monitor credit risk, the Risk Management Department together with the Asset and Liability Management Department to monitor market and liquidity risks, and the Internal Control and Compliance Department to monitor operational risk. The Risk Management Department is primarily responsible for coordinating and establishing a comprehensive risk management framework, preparing consolidated reports on credit risk, market risk and operational risk and reporting directly to the Chief Risk Officer.
The Bank maintains a dual-reporting line structure at the branch level for risk management purposes. Under this structure, the risk management departments of the branches report to risk management departments of both the Head Office and the management of the relevant branches.

147I n t e r i m R e p o r t 2 0 1 7
Notes to the Unaudited Interim Financial ReportFor the six months ended 30 June 2017
(In RMB millions, unless otherwise stated)
(a) Credit risk
Credit risk is the risk of loss arising from a borrower’s or counterparty’s inability to meet its obligations. Credit risk can also arise from operational failures that result in an unauthorised or inappropriate guarantee, commitment or investment of funds. The Group is exposed to credit risk primarily due to loans, guarantees and other credit related commitments.
The principal features of the Group’s credit risk management function include:
• Centralised credit management procedures;
• Risk management rules and procedures that focus on risk control throughout the entire credit business process, including customer investigation and credit rating, granting of credit limits, loan evaluation, loan review and approval, granting of loan and post-disbursement loan monitoring;
• Stringent qualification system for the loan approval officers; and
• Information management systems designed to enable a real time risk monitoring.
To enhance credit risk management practices, the Group also hold training programs periodically for credit officers at different levels.
In addition to the credit risk exposures on credit-related assets and amounts due from or lending to banks and other financial institutions, credit risk also arises in other areas. For instance, credit risk exposure also arises from derivative financial instruments which are, however, limited to those with positive fair values, as recorded in the statement of financial position. In addition, the Group also makes available to its customers guarantees which may require the Group to make payments on their behalf. Such payments are collected from customers based on the terms of the agreements signed. They expose the Group to similar risks as loans and these are mitigated by the same control processes and policies.
The Group will normally sign an International Swaps and Derivatives Association (“ISDA”) Master Agreement, a China Interbank Market Financial Derivatives Master Agreement (“NAFMII master agreement”) with its counterparties for documenting over-the-counter derivatives activities. Each of these master agreements provides the contractual framework within which derivatives dealing activities are conducted. Under each of these master agreements, close-out netting shall be applied across all outstanding transactions covered by the agreement if either party defaults.
Risk concentration
Credit risk is often greater when counterparties are concentrated in one single industry or geographical location or have comparable economic characteristics.
Impairment assessment
The main considerations for the loan impairment assessment include whether any payments of principal or interest are overdue or whether there are any liquidity problems of counterparties, credit rating downgrades, or infringement of the original terms of the contract. The Group addresses impairment assessment in two areas: individually assessed impairment and collectively assessed impairment.
Individually assessed loans
All corporate loans and discounted bills are individually reviewed for objective evidence of impairment and classified based on a five-tier classification system. Corporate loans and discounted bills that are classified as substandard, doubtful or loss are assessed individually for impairment.
148
Notes to the Unaudited Interim Financial ReportFor the six months ended 30 June 2017(In RMB millions, unless otherwise stated)
(a) Credit risk (continued)
If there is objective evidence that an impairment loss on a loan or advance has incurred on an individual basis, the amount of the loss is measured as the difference between the asset’s carrying amount and the present value of estimated future cash flows discounted at the asset’s original effective interest rate. The allowance for impairment loss is deducted in the carrying amount. The impairment loss is recognised in the statement of profit or loss. In determining allowances on an individual basis, the following factors are considered:
• The sustainability of the counterparty’s business plan;
• The borrower’s ability to improve performance once a financial difficulty has arisen;
• Projected receipts and the expected payout should bankruptcy ensue;
• The availability of other financial support and the realisable value of collateral; and
• The timing of the expected cash flows.
It may not be possible to identify a single, discrete event that caused the impairment, but it may be possible to identify impairment through the combined effect of several events. The impairment losses are evaluated at the end of each reporting period, unless unforeseen circumstances require more careful attention.
Collectively assessed loans
Loans that are assessed for impairment losses on a collective basis include the following:
• Homogeneous groups of loans, including all personal loans; and
• All loans for which no impairment can be identified individually, either due to the absence of any loss events or due to an inability to measure reliably the impact of potential loss events on future cash flows.
For the purpose of collective assessment, assets are grouped on the basis of similar credit risk characteristics that are indicative of the debtors’ ability to pay all amounts due according to the contractual terms.
Objective evidence of impairment losses on a collective basis consists of observable data indicating a measurable decrease in the estimated future cash flows from a portfolio of loans since the initial recognition of those loans, including:
• Adverse changes in the payment status of borrowers in the Group of loans; and
• National or local economic conditions that correlate with defaults on assets in the portfolio of loans.
Homogenous groups of loans not considered individually significant
For homogeneous groups of loans, the Group uses a collective assessment approach for impairment losses. The approach analyses historical trends of probability of default and the amount of the consequential loss, as well as evaluates current economic conditions that may have a consequential impact on inherent losses in the portfolio.
149I n t e r i m R e p o r t 2 0 1 7
Notes to the Unaudited Interim Financial ReportFor the six months ended 30 June 2017
(In RMB millions, unless otherwise stated)
(a) Credit risk (continued)
Individually assessed loans with no objective evidence of impairment
Individually assessed loans with no objective evidence of impairment are grouped together in portfolios of similar credit risk characteristics for the purpose of assessing a collective impairment loss. The collective impairment loss is assessed after taking into account:
• Historical loss experience in portfolios of similar risk characteristics; and
• The current economic and credit environment and, whether these, in management’s experience, indicate that the actual level of incurred but not yet identified losses is likely to be greater or less than that suggested by historical experience.
As soon as information that specifically identifies objective evidence of impairment on individual assets in a pool is available, those assets are excluded and individually assessed. Assets that are individually assessed for impairment and for which an impairment loss is or continues to be recognised are not included in a collective assessment for impairment.
Collateral
The amount and type of collateral required depend on the assessment of the credit risk of the counterparty. Guidelines are in place specifying the types of collateral and valuation parameters which can be accepted.
Reverse repurchase business is mainly collateralised by bills, loans or investment securities. As part of the reverse repurchase agreements, the Group has received securities that it is allowed to sell or repledge in the absence of default by their owners. Fair value of collateral is shown in note 19.
Corporate loans are mainly collateralised by properties or other assets. As at 30 June 2017, the carrying value of corporate loans amounted to RMB9,290,718 million (31 December 2016: RMB8,860,677 million), of which credit exposure of corporate loans covered by collateral amounted to RMB3,457,660 million (31 December 2016: RMB3,771,915 million).
Personal loans are mainly collateralised by residential properties. As at 30 June 2017, the carrying value of personal loans amounted to RMB4,575,191 million (31 December 2016: RMB4,196,169 million), of which credit exposure of personal loans covered by collateral amounted to RMB4,021,439 million (31 December 2016: RMB3,666,608 million).
The Group prefers more liquid collateral with relatively stable market value and does not accept collateral that is illiquid, with difficulties in registration or high fluctuations in market value. The value of collateral should be assessed and confirmed by the Group or valuation agents identified by the Group. The value of collateral should adequately cover the outstanding balance of a loan. The loan-to-value ratio depends on types of collateral, usage condition, liquidity, price volatility and realisation cost. All collateral has to be registered in accordance with the relevant laws and regulations. The credit officers inspect the collateral and assess the changes in the value of collateral regularly.
Although collateral can be an important mitigation of credit risk, the Group grants loans based on the assessment of the borrowers’ ability to meet obligations out of their cash flow, instead of the value of collateral. The necessity of a collateral is dependent on the nature of the loan. In the event of default, the Group might sell the collateral for repayment. The fair value of collateral of past due but not impaired loans and impaired loans are disclosed in note 47(a)(iii).
Management monitors the market value of collateral periodically and requests additional collateral in accordance with the underlying agreement when it is considered necessary.
It is the Group’s policy to dispose of repossessed assets in an orderly manner. In general, the Group does not occupy repossessed assets for business use.

150
Notes to the Unaudited Interim Financial ReportFor the six months ended 30 June 2017(In RMB millions, unless otherwise stated)
(a) Credit risk (continued)(i) Maximum exposure to credit risk without taking account of any collateral and other credit
enhancements
As at the end of the reporting period, the maximum credit risk exposure of the Group without taking account of any collateral and other credit enhancements is set out below:
30 June 2017
31 December 2016
Balances with central banks 3,466,008 3,266,216Due from banks and other financial institutions 957,239 797,473Financial assets held for trading 134,593 183,315Financial assets designated at fair value through profit or loss 362,149 285,144Derivative financial assets 57,569 94,452Reverse repurchase agreements 840,658 755,627Loans and advances to customers 13,549,396 12,767,334Financial investments — Receivables 343,822 291,370 — Held-to-maturity investments 3,090,298 2,973,042 — Available-for-sale financial assets 1,617,701 1,729,434Others 390,042 315,725
24,809,475 23,459,132Credit commitments 3,152,949 2,778,412
Total maximum credit risk exposure 27,962,424 26,237,544
(ii) Risk concentrations
Credit risk is often greater when counterparties are concentrated in one single industry or geographic location or have comparable economic features. In addition, different geographic areas and industrial sectors have their unique characteristics in terms of economic development, and could present a different credit risk.
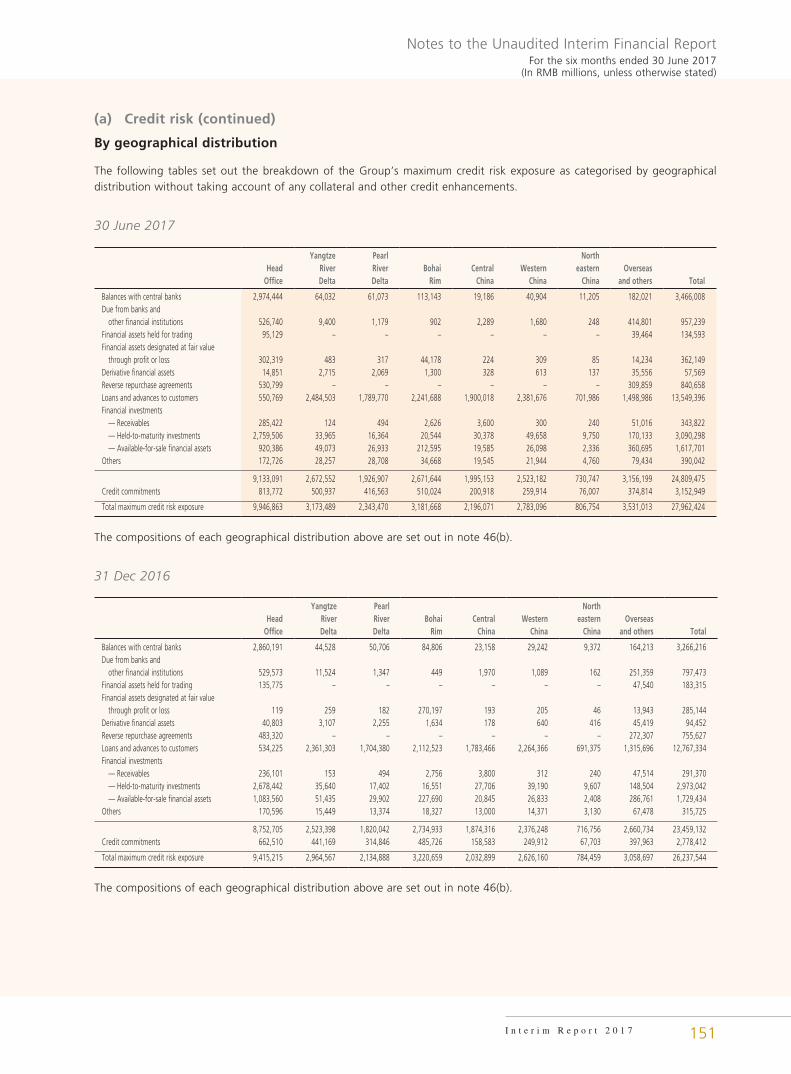
151I n t e r i m R e p o r t 2 0 1 7
Notes to the Unaudited Interim Financial ReportFor the six months ended 30 June 2017
(In RMB millions, unless otherwise stated)
(a) Credit risk (continued)
By geographical distribution
The following tables set out the breakdown of the Group’s maximum credit risk exposure as categorised by geographical distribution without taking account of any collateral and other credit enhancements.
30 June 2017
Head Office
Yangtze River Delta
Pearl River Delta
Bohai Rim
Central China
Western China
Northeastern
ChinaOverseas
and others Total
Balances with central banks 2,974,444 64,032 61,073 113,143 19,186 40,904 11,205 182,021 3,466,008Due from banks and other financial institutions 526,740 9,400 1,179 902 2,289 1,680 248 414,801 957,239Financial assets held for trading 95,129 – – – – – – 39,464 134,593Financial assets designated at fair value through profit or loss 302,319 483 317 44,178 224 309 85 14,234 362,149Derivative financial assets 14,851 2,715 2,069 1,300 328 613 137 35,556 57,569Reverse repurchase agreements 530,799 – – – – – – 309,859 840,658Loans and advances to customers 550,769 2,484,503 1,789,770 2,241,688 1,900,018 2,381,676 701,986 1,498,986 13,549,396Financial investments — Receivables 285,422 124 494 2,626 3,600 300 240 51,016 343,822 — Held-to-maturity investments 2,759,506 33,965 16,364 20,544 30,378 49,658 9,750 170,133 3,090,298 — Available-for-sale financial assets 920,386 49,073 26,933 212,595 19,585 26,098 2,336 360,695 1,617,701Others 172,726 28,257 28,708 34,668 19,545 21,944 4,760 79,434 390,042
9,133,091 2,672,552 1,926,907 2,671,644 1,995,153 2,523,182 730,747 3,156,199 24,809,475Credit commitments 813,772 500,937 416,563 510,024 200,918 259,914 76,007 374,814 3,152,949
Total maximum credit risk exposure 9,946,863 3,173,489 2,343,470 3,181,668 2,196,071 2,783,096 806,754 3,531,013 27,962,424
The compositions of each geographical distribution above are set out in note 46(b).
31 Dec 2016
Head Office
Yangtze RiverDelta
Pearl River Delta
Bohai Rim
Central China
Western China
Northeastern
ChinaOverseas
and others Total
Balances with central banks 2,860,191 44,528 50,706 84,806 23,158 29,242 9,372 164,213 3,266,216Due from banks and other financial institutions 529,573 11,524 1,347 449 1,970 1,089 162 251,359 797,473Financial assets held for trading 135,775 – – – – – – 47,540 183,315Financial assets designated at fair value through profit or loss 119 259 182 270,197 193 205 46 13,943 285,144Derivative financial assets 40,803 3,107 2,255 1,634 178 640 416 45,419 94,452Reverse repurchase agreements 483,320 – – – – – – 272,307 755,627Loans and advances to customers 534,225 2,361,303 1,704,380 2,112,523 1,783,466 2,264,366 691,375 1,315,696 12,767,334Financial investments — Receivables 236,101 153 494 2,756 3,800 312 240 47,514 291,370 — Held-to-maturity investments 2,678,442 35,640 17,402 16,551 27,706 39,190 9,607 148,504 2,973,042 — Available-for-sale financial assets 1,083,560 51,435 29,902 227,690 20,845 26,833 2,408 286,761 1,729,434Others 170,596 15,449 13,374 18,327 13,000 14,371 3,130 67,478 315,725
8,752,705 2,523,398 1,820,042 2,734,933 1,874,316 2,376,248 716,756 2,660,734 23,459,132Credit commitments 662,510 441,169 314,846 485,726 158,583 249,912 67,703 397,963 2,778,412
Total maximum credit risk exposure 9,415,215 2,964,567 2,134,888 3,220,659 2,032,899 2,626,160 784,459 3,058,697 26,237,544
The compositions of each geographical distribution above are set out in note 46(b).

152
Notes to the Unaudited Interim Financial ReportFor the six months ended 30 June 2017(In RMB millions, unless otherwise stated)
(a) Credit risk (continued)
By industry distribution
The credit risk exposures of the Group mainly comprise loans and advances to customers and investments in securities. Details of the composition of the Group’s investments in debt securities are set out in note 47(a)(iv) to the financial statements. The composition of the Group’s gross loans and advances to customers by industry is analysed as follows:
30 June 2017
31 December 2016
Transportation, storage and postal services 1,780,868 1,640,498Manufacturing 1,707,198 1,550,544Leasing and commercial services 958,633 828,686Production and supply of electricity, heating, gas and water 956,424 891,870Wholesale and retail 801,450 776,739Real estate 714,595 642,423Water, environment and public utility management 667,613 536,718Finance 292,336 251,733Mining 280,914 274,273Construction 240,496 212,450Science, education, culture and sanitation 138,484 136,799Others 388,620 397,951
Subtotal of corporate loans and advances 8,927,631 8,140,684
Personal mortgage and business loans 3,845,409 3,497,110Others 729,782 699,059
Subtotal of personal loans 4,575,191 4,196,169
Discounted bills 363,087 719,993
Total loans and advances to customers 13,865,909 13,056,846
(iii) Loans and advances to customers
The total credit risk exposures of loans and advances to customers are summarised as follows:
30 June 2017
31 December 2016
Neither past due nor impaired 13,549,323 12,706,016Past due but not impaired 99,514 139,029Impaired 217,072 211,801
13,865,909 13,056,846Less: Allowance for impairment losses (316,513) (289,512)
13,549,396 12,767,334

153I n t e r i m R e p o r t 2 0 1 7
Notes to the Unaudited Interim Financial ReportFor the six months ended 30 June 2017
(In RMB millions, unless otherwise stated)
(a) Credit risk (continued)
Neither past due nor impaired
The balance of loans and advances to customers of the Group that are neither past due nor impaired analysed by five-tier classification and by collateral are as follows:
30 June 2017 31 December 2016
PassSpecial
Mention Total PassSpecial
Mention Total
Unsecured loans 4,022,329 59,654 4,081,983 3,445,069 60,195 3,505,264Guaranteed loans 1,855,146 142,975 1,998,121 1,676,309 137,312 1,813,621Loans secured by mortgages 5,919,367 226,991 6,146,358 5,561,633 227,619 5,789,252
Pledged loans 1,304,126 18,735 1,322,861 1,570,704 27,175 1,597,87913,100,968 448,355 13,549,323 12,253,715 452,301 12,706,016
Past due but not impaired
The following tables present the ageing analysis of each category of loans and advances to customers of the Group subject to credit risk which are past due but not impaired as at the end of the reporting period:
30 June 2017 31 December 2016Corporate loans and advances
Personal loans Total
Corporate loans and advances
Personal loans Total
Past due for: Less than one month 47,354 16,208 63,562 57,540 17,324 74,864 One to two months 11,014 6,471 17,485 13,414 7,437 20,851
Two to three months 10,365 8,102 18,467 33,458 9,856 43,314 Total 68,733 30,781 99,514 104,412 34,617 139,029
Fair value of collateral held 66,265 62,450 128,715 103,327 67,707 171,034
Impaired
Impaired loans and advances are defined as those loans and advances having objective evidence of impairment as a result of one or more events that occur after initial recognition and that event has an impact on the estimated future cash flows of loans and advances that can be reliably estimated. These loans and advances include corporate loans and personal loans which are graded as “Substandard”, “Doubtful” or “Loss”.
The fair values of collateral that the Group hold relating to loans individually determined to be impaired as at 30 June 2017 amounted to RMB34,967 million (31 December 2016: RMB42,046 million). The collateral mainly consists of land and buildings, equipment and others.

154
Notes to the Unaudited Interim Financial ReportFor the six months ended 30 June 2017(In RMB millions, unless otherwise stated)
(a) Credit risk (continued)
Renegotiated loans and advances to customers
The Group has formulated a set of loan restructuring policies to renegotiate the contractual terms with customers, to maximise the collectability of loans and to manage customer relationships.
The carrying amount of renegotiated loans and advances to customers is as follows:
30 June 2017
31 December 2016
Renegotiated loans and advances to customers 5,996 5,541
Impaired loans and advances to customers included in the above 2,720 2,085
Collateral repossessed
During the reporting period, the Group took possession of collateral held as security with a carrying amount of RMB846 million (six months ended 30 June 2016: RMB810 million). Such collateral mainly comprises land and buildings, equipment and others.
(iv) Debt securities
The credit risk of debt securities mainly arises from the risk that the issuer might default on a payment or go into liquidation. Debt securities by different types of issuers are generally subject to different degrees of credit risk.
The following tables present an analysis of the Group’s total credit risk exposures of debt securities by type of issuer and by investment:
30 June 2017
Receivables
Held-to-maturity
investments
Available-for-sale
financial assets
Financial assets held for trading
Financial assets
designated at fair value
through profit or loss Total
Neither past due nor impaired: Governments and central banks 85,000 2,128,553 550,859 21,971 – 2,786,383 Policy banks – 844,862 288,369 3,167 24,701 1,161,099 Public sector entities 2,220 21,579 139,046 6,310 2,798 171,953 Banks and other financial institutions 133,262 64,990 331,488 40,662 16,470 586,872 Corporate entities 20,974 30,334 303,455 62,483 7,535 424,781
Subtotal 241,456 3,090,318 1,613,217 134,593 51,504 5,131,088Less: Collective allowance for
impairment losses – (20) – – – (20)
Subtotal 241,456 3,090,298 1,613,217 134,593 51,504 5,131,068Impaired (*): Banks and other financial institutions – 67 – – – 67 Corporate entities – 25 344 – – 369
– 92 344 – – 436Less: Individual allowance for
impairment losses – (92) (238) – – (330)
Subtotal – – 106 – – 106
Total 241,456 3,090,298 1,613,323 134,593 51,504 5,131,174

155I n t e r i m R e p o r t 2 0 1 7
Notes to the Unaudited Interim Financial ReportFor the six months ended 30 June 2017
(In RMB millions, unless otherwise stated)
(a) Credit risk (continued)31 December 2016
Receivables
Held-to-maturity
investments
Available-for-sale
financial assets
Financial assets held for trading
Financial assets
designated at fair value
through profit or loss Total
Neither past due nor impaired: Governments and central banks 85,000 1,897,917 545,382 14,188 – 2,542,487 Policy banks – 969,849 334,477 4,548 10,576 1,319,450 Public sector entities 2,200 22,236 141,405 10,938 2,212 178,991 Banks and other financial institutions 134,579 47,724 369,938 107,963 21,277 681,481 Corporate entities 22,386 35,329 329,358 45,678 6,808 439,559
Subtotal 244,165 2,973,055 1,720,560 183,315 40,873 5,161,968Less: Collective allowance for
impairment losses – (13) – – – (13)
Subtotal 244,165 2,973,042 1,720,560 183,315 40,873 5,161,955Impaired (*): Banks and other financial institutions – 68 – – – 68 Corporate entities – 26 427 – – 453
– 94 427 – – 521Less: Individual allowance for
impairment losses – (94) (357) – – (451)
Subtotal – – 70 – – 70
Total 244,165 2,973,042 1,720,630 183,315 40,873 5,162,025
(*) Impaired debt securities above were mainly individually assessed. In determining whether a debt security was impaired, the
Group considers the evidence of a loss event and the decreases in estimated future cash flows. No collateral was held by the
Group as security of the impaired debt securities.
(b) Liquidity risk
Liquidity risk is the risk that capital will not be sufficient or funds will not be raised at a reasonable cost in a timely manner to meet the need of asset growth or repayment of debts due, although the Group remains solvent. This may arise from amount or maturity mismatches of assets and liabilities.
The Group manages its liquidity risk through the Asset and Liability Management Department and aims at:
• Optimising the structure of assets and liabilities;
• Maintaining the stability of the deposit base;
• Projecting cash flows and evaluating the level of current assets; and
• In terms of liquidity of the branches, maintaining an efficient internal fund transfer mechanism.
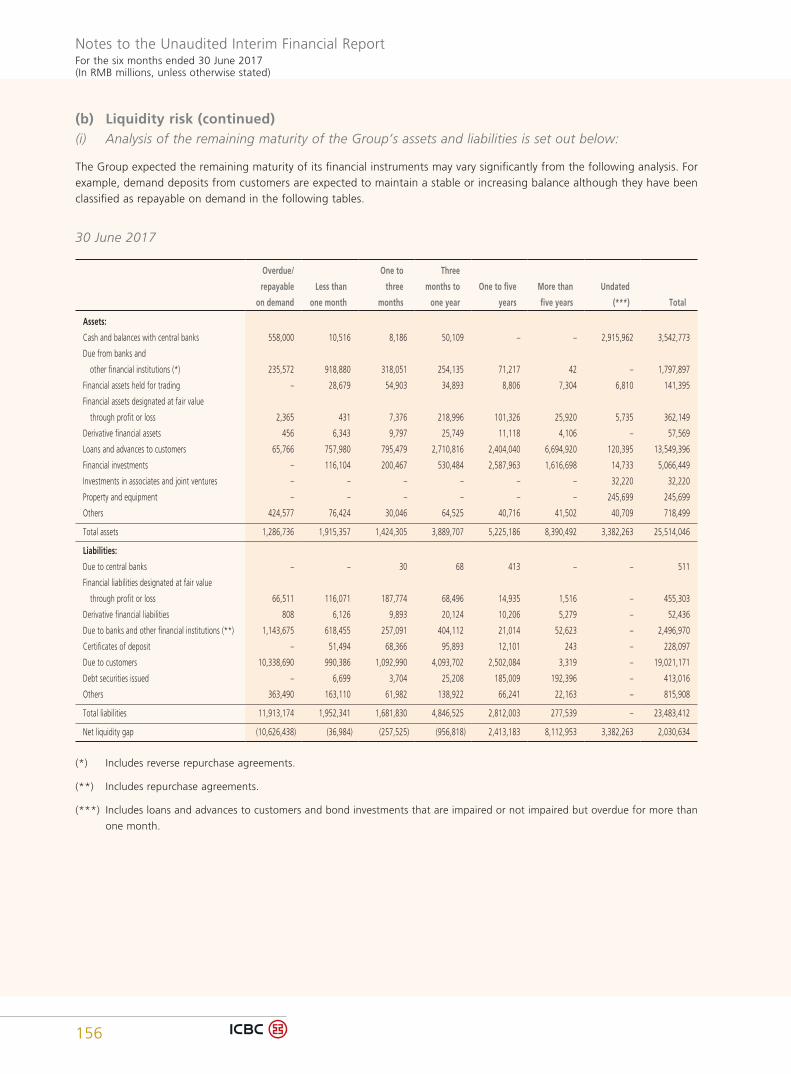
156
Notes to the Unaudited Interim Financial ReportFor the six months ended 30 June 2017(In RMB millions, unless otherwise stated)
(b) Liquidity risk (continued)(i) Analysis of the remaining maturity of the Group’s assets and liabilities is set out below:
The Group expected the remaining maturity of its financial instruments may vary significantly from the following analysis. For example, demand deposits from customers are expected to maintain a stable or increasing balance although they have been classified as repayable on demand in the following tables.
30 June 2017
Overdue/
repayable
on demand
Less than
one month
One to
three
months
Three
months to
one year
One to five
years
More than
five years
Undated
(***) Total
Assets:
Cash and balances with central banks 558,000 10,516 8,186 50,109 – – 2,915,962 3,542,773
Due from banks and
other financial institutions (*) 235,572 918,880 318,051 254,135 71,217 42 – 1,797,897
Financial assets held for trading – 28,679 54,903 34,893 8,806 7,304 6,810 141,395
Financial assets designated at fair value
through profit or loss 2,365 431 7,376 218,996 101,326 25,920 5,735 362,149
Derivative financial assets 456 6,343 9,797 25,749 11,118 4,106 – 57,569
Loans and advances to customers 65,766 757,980 795,479 2,710,816 2,404,040 6,694,920 120,395 13,549,396
Financial investments – 116,104 200,467 530,484 2,587,963 1,616,698 14,733 5,066,449
Investments in associates and joint ventures – – – – – – 32,220 32,220
Property and equipment – – – – – – 245,699 245,699
Others 424,577 76,424 30,046 64,525 40,716 41,502 40,709 718,499
Total assets 1,286,736 1,915,357 1,424,305 3,889,707 5,225,186 8,390,492 3,382,263 25,514,046
Liabilities:
Due to central banks – – 30 68 413 – – 511
Financial liabilities designated at fair value
through profit or loss 66,511 116,071 187,774 68,496 14,935 1,516 – 455,303
Derivative financial liabilities 808 6,126 9,893 20,124 10,206 5,279 – 52,436
Due to banks and other financial institutions (**) 1,143,675 618,455 257,091 404,112 21,014 52,623 – 2,496,970
Certificates of deposit – 51,494 68,366 95,893 12,101 243 – 228,097
Due to customers 10,338,690 990,386 1,092,990 4,093,702 2,502,084 3,319 – 19,021,171
Debt securities issued – 6,699 3,704 25,208 185,009 192,396 – 413,016
Others 363,490 163,110 61,982 138,922 66,241 22,163 – 815,908
Total liabilities 11,913,174 1,952,341 1,681,830 4,846,525 2,812,003 277,539 – 23,483,412
Net liquidity gap (10,626,438) (36,984) (257,525) (956,818) 2,413,183 8,112,953 3,382,263 2,030,634
(*) Includes reverse repurchase agreements.
(**) Includes repurchase agreements.
(***) Includes loans and advances to customers and bond investments that are impaired or not impaired but overdue for more than
one month.

157I n t e r i m R e p o r t 2 0 1 7
Notes to the Unaudited Interim Financial ReportFor the six months ended 30 June 2017
(In RMB millions, unless otherwise stated)
(b) Liquidity risk (continued)31 December 2016
Overdue/
repayable
on demand
Less than
one month
One to
three
months
Three
months to
one year
One to five
years
More than
five years
Undated
(***) Total
Assets:
Cash and balances with central banks 436,282 11,639 18,517 47,281 – – 2,837,069 3,350,788
Due from banks and
other financial institutions (*) 158,433 849,479 244,926 228,917 71,304 41 – 1,553,100
Financial assets held for trading – 46,100 25,488 102,658 935 8,134 6,016 189,331
Financial assets designated at fair value
through profit or loss 1,448 206 14,260 36,078 205,253 23,791 4,108 285,144
Derivative financial assets 254 14,989 20,320 39,732 14,489 4,668 – 94,452
Loans and advances to customers 62,087 874,345 774,633 2,785,447 2,970,082 5,144,336 156,404 12,767,334
Financial investments – 70,726 185,303 610,237 2,534,397 1,593,183 12,853 5,006,699
Investments in associates and joint ventures – – – – – – 30,077 30,077
Property and equipment – – – – – – 246,209 246,209
Others 377,080 44,195 28,506 53,039 33,428 35,983 41,900 614,131
Total assets 1,035,584 1,911,679 1,311,953 3,903,389 5,829,888 6,810,136 3,334,636 24,137,265
Liabilities:
Due to central banks – – – 118 427 – – 545
Financial liabilities designated at fair value
through profit or loss 59,279 75,000 168,142 46,949 15,144 2,238 – 366,752
Derivative financial liabilities 409 10,099 21,143 36,924 15,687 5,698 – 89,960
Due to banks and other financial institutions (**) 1,283,492 816,224 191,175 239,314 24,320 51,580 – 2,606,105
Certificates of deposit – 29,968 67,031 103,774 17,201 453 – 218,427
Due to customers 9,783,195 859,223 1,286,200 3,705,472 2,185,850 5,362 – 17,825,302
Debt securities issued – 6,006 8,318 13,953 136,514 193,146 – 357,937
Others 300,535 72,155 60,357 135,012 70,885 52,130 – 691,074
Total liabilities 11,426,910 1,868,675 1,802,366 4,281,516 2,466,028 310,607 – 22,156,102
Net liquidity gap (10,391,326) 43,004 (490,413) (378,127) 3,363,860 6,499,529 3,334,636 1,981,163
(*) Includes reverse repurchase agreements.
(**) Includes repurchase agreements.
(***) Includes loans and advances to customers and bond investments that are impaired or not impaired but overdue for more than
one month.
(ii) Maturity analysis of contractual undiscounted cash flows
The tables below summarise the maturity profile of the Group’s financial instruments based on the contractual undiscounted cash flows. The balances of some items in the tables below are different from the balances on the statement of financial position as the tables incorporate all cash flows relating to both principal and interest. The Group’s expected cash flows on these instruments may vary significantly from the following analysis. For example, demand deposits from customers are expected to maintain a stable or increasing balance although they have been classified as repayable on demand in the following tables.

158
Notes to the Unaudited Interim Financial ReportFor the six months ended 30 June 2017(In RMB millions, unless otherwise stated)
(b) Liquidity risk (continued)30 June 2017
Overdue/repayable
on demandLess than
one month
One to three
months
Three months to
one yearOne to
five yearsMore than five years
Undated (***) Total
Non-derivative cash flows:Financial assets:Cash and balances with central banks 558,000 10,516 12,123 50,109 – – 2,915,962 3,546,710Due from banks and other financial institutions (*) 235,588 920,903 320,984 264,813 73,936 49 – 1,816,273Financial assets held for trading – 28,687 55,299 35,842 10,290 8,713 6,810 145,641Financial assets designated at fair value through profit or loss 2,365 451 7,402 219,186 103,702 26,163 5,735 365,004Loans and advances to customers (**) 66,646 822,597 956,271 3,281,676 4,530,516 9,924,951 253,024 19,835,681Financial investments – 118,300 205,126 551,472 2,689,330 1,673,303 14,733 5,252,264Others 403,723 69,175 6,455 8,736 3,864 297 1,843 494,093
1,266,322 1,970,629 1,563,660 4,411,834 7,411,638 11,633,476 3,198,107 31,455,666
(*) Includes reverse repurchase agreements.
(**) The maturity profile of the renegotiated loans’ contractual undiscounted cash flows is determined according to the negotiated
terms.
(***) Includes loans and advances to customers and bond investments that are impaired or not impaired but overdue for more than
one month.
30 June 2017
Overdue/repayable
on demandLess than
one month
One to three
months
Three months to
one yearOne to
five yearsMore than five years Undated Total
Non-derivative cash flows:Financial liabilities:Due to central banks – – 30 68 413 – – 511Financial liabilities designated at fair value through profit or loss 66,511 116,432 191,663 74,634 23,409 2,037 – 474,686Due to banks and other financial institutions (*) 1,144,077 1,100,148 285,691 414,625 23,080 62,385 – 3,030,006Certificates of deposit – 51,654 68,693 96,231 12,447 263 – 229,288Due to customers 10,339,983 998,650 1,108,299 4,131,606 2,630,829 3,678 – 19,213,045Debt securities issued – 7,874 6,705 36,464 242,344 246,837 – 540,224Others 323,447 29,994 8,550 19,427 18,377 7,473 – 407,268
11,874,018 2,304,752 1,669,631 4,773,055 2,950,899 322,673 – 23,895,028
Derivative cash flows:Derivative financial instruments settled on net basis – (2,069) 116 862 448 3 – (640)Derivative financial instruments settled on gross basis— Cash inflow 104,355 1,203,316 953,296 1,688,648 179,124 20,048 – 4,148,787— Cash outflow (104,197) (1,202,091) (951,506) (1,679,254) (176,961) (19,305) – (4,133,314)
158 1,225 1,790 9,394 2,163 743 – 15,473
(*) Includes repurchase agreements.
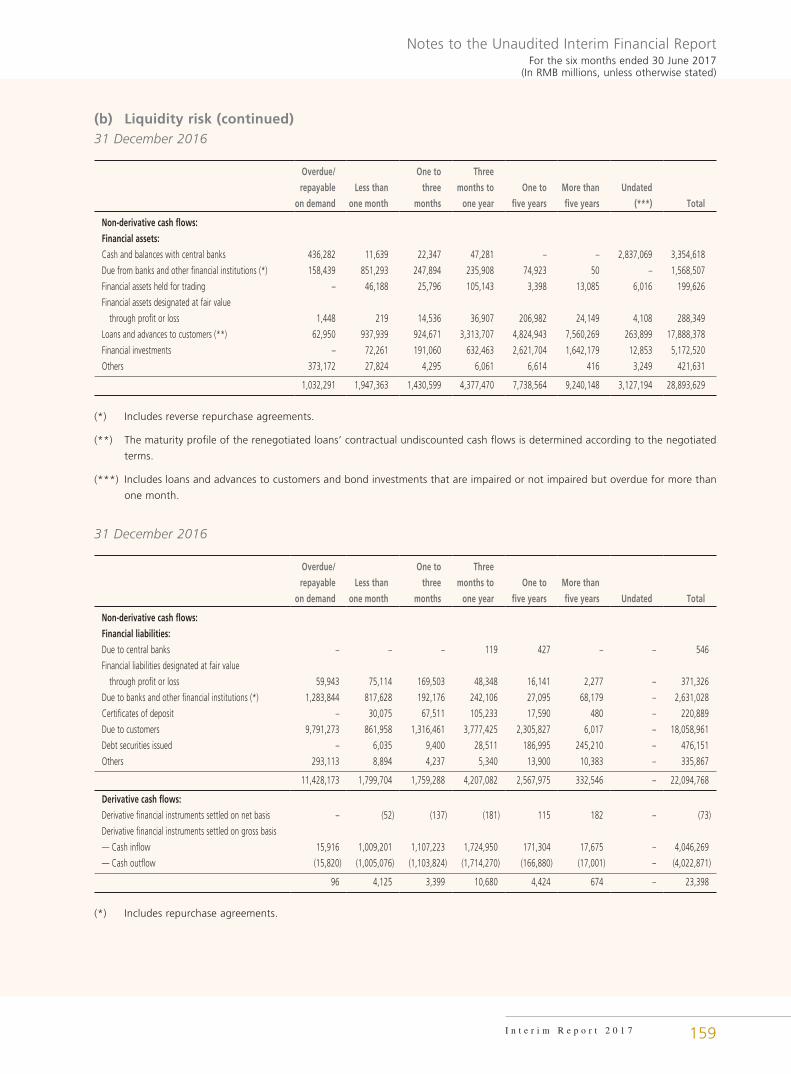
159I n t e r i m R e p o r t 2 0 1 7
Notes to the Unaudited Interim Financial ReportFor the six months ended 30 June 2017
(In RMB millions, unless otherwise stated)
(b) Liquidity risk (continued)31 December 2016
Overdue/
repayable
on demand
Less than
one month
One to
three
months
Three
months to
one year
One to
five years
More than
five years
Undated
(***) Total
Non-derivative cash flows:
Financial assets:
Cash and balances with central banks 436,282 11,639 22,347 47,281 – – 2,837,069 3,354,618
Due from banks and other financial institutions (*) 158,439 851,293 247,894 235,908 74,923 50 – 1,568,507
Financial assets held for trading – 46,188 25,796 105,143 3,398 13,085 6,016 199,626
Financial assets designated at fair value
through profit or loss 1,448 219 14,536 36,907 206,982 24,149 4,108 288,349
Loans and advances to customers (**) 62,950 937,939 924,671 3,313,707 4,824,943 7,560,269 263,899 17,888,378
Financial investments – 72,261 191,060 632,463 2,621,704 1,642,179 12,853 5,172,520
Others 373,172 27,824 4,295 6,061 6,614 416 3,249 421,631
1,032,291 1,947,363 1,430,599 4,377,470 7,738,564 9,240,148 3,127,194 28,893,629
(*) Includes reverse repurchase agreements.
(**) The maturity profile of the renegotiated loans’ contractual undiscounted cash flows is determined according to the negotiated
terms.
(***) Includes loans and advances to customers and bond investments that are impaired or not impaired but overdue for more than
one month.
31 December 2016
Overdue/
repayable
on demand
Less than
one month
One to
three
months
Three
months to
one year
One to
five years
More than
five years Undated Total
Non-derivative cash flows:
Financial liabilities:
Due to central banks – – – 119 427 – – 546
Financial liabilities designated at fair value
through profit or loss 59,943 75,114 169,503 48,348 16,141 2,277 – 371,326
Due to banks and other financial institutions (*) 1,283,844 817,628 192,176 242,106 27,095 68,179 – 2,631,028
Certificates of deposit – 30,075 67,511 105,233 17,590 480 – 220,889
Due to customers 9,791,273 861,958 1,316,461 3,777,425 2,305,827 6,017 – 18,058,961
Debt securities issued – 6,035 9,400 28,511 186,995 245,210 – 476,151
Others 293,113 8,894 4,237 5,340 13,900 10,383 – 335,867
11,428,173 1,799,704 1,759,288 4,207,082 2,567,975 332,546 – 22,094,768
Derivative cash flows:
Derivative financial instruments settled on net basis – (52) (137) (181) 115 182 – (73)
Derivative financial instruments settled on gross basis
— Cash inflow 15,916 1,009,201 1,107,223 1,724,950 171,304 17,675 – 4,046,269
— Cash outflow (15,820) (1,005,076) (1,103,824) (1,714,270) (166,880) (17,001) – (4,022,871)
96 4,125 3,399 10,680 4,424 674 – 23,398
(*) Includes repurchase agreements.
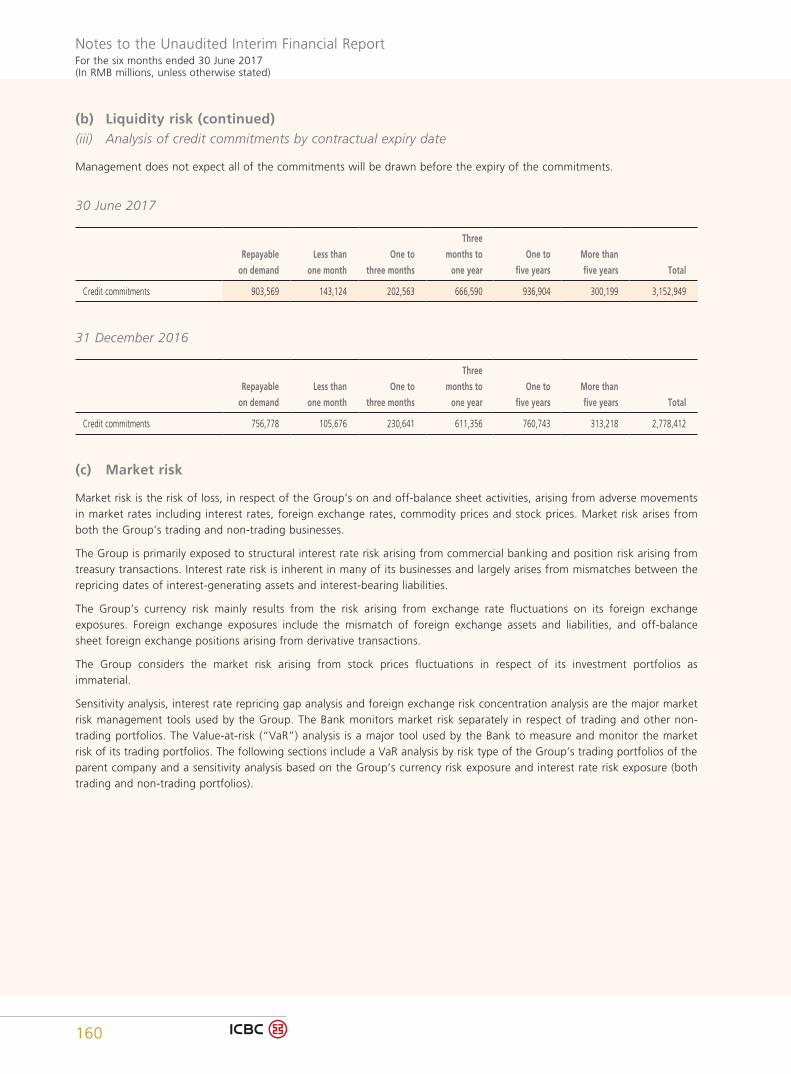
160
Notes to the Unaudited Interim Financial ReportFor the six months ended 30 June 2017(In RMB millions, unless otherwise stated)
(b) Liquidity risk (continued)(iii) Analysis of credit commitments by contractual expiry date
Management does not expect all of the commitments will be drawn before the expiry of the commitments.
30 June 2017
Repayable
on demand
Less than
one month
One to
three months
Three
months to
one year
One to
five years
More than
five years Total
Credit commitments 903,569 143,124 202,563 666,590 936,904 300,199 3,152,949
31 December 2016
Repayable
on demand
Less than
one month
One to
three months
Three
months to
one year
One to
five years
More than
five years Total
Credit commitments 756,778 105,676 230,641 611,356 760,743 313,218 2,778,412
(c) Market risk
Market risk is the risk of loss, in respect of the Group’s on and off-balance sheet activities, arising from adverse movements in market rates including interest rates, foreign exchange rates, commodity prices and stock prices. Market risk arises from both the Group’s trading and non-trading businesses.
The Group is primarily exposed to structural interest rate risk arising from commercial banking and position risk arising from treasury transactions. Interest rate risk is inherent in many of its businesses and largely arises from mismatches between the repricing dates of interest-generating assets and interest-bearing liabilities.
The Group’s currency risk mainly results from the risk arising from exchange rate fluctuations on its foreign exchange exposures. Foreign exchange exposures include the mismatch of foreign exchange assets and liabilities, and off-balance sheet foreign exchange positions arising from derivative transactions.
The Group considers the market risk arising from stock prices fluctuations in respect of its investment portfolios as immaterial.
Sensitivity analysis, interest rate repricing gap analysis and foreign exchange risk concentration analysis are the major market risk management tools used by the Group. The Bank monitors market risk separately in respect of trading and other non-trading portfolios. The Value-at-risk (“VaR”) analysis is a major tool used by the Bank to measure and monitor the market risk of its trading portfolios. The following sections include a VaR analysis by risk type of the Group’s trading portfolios of the parent company and a sensitivity analysis based on the Group’s currency risk exposure and interest rate risk exposure (both trading and non-trading portfolios).
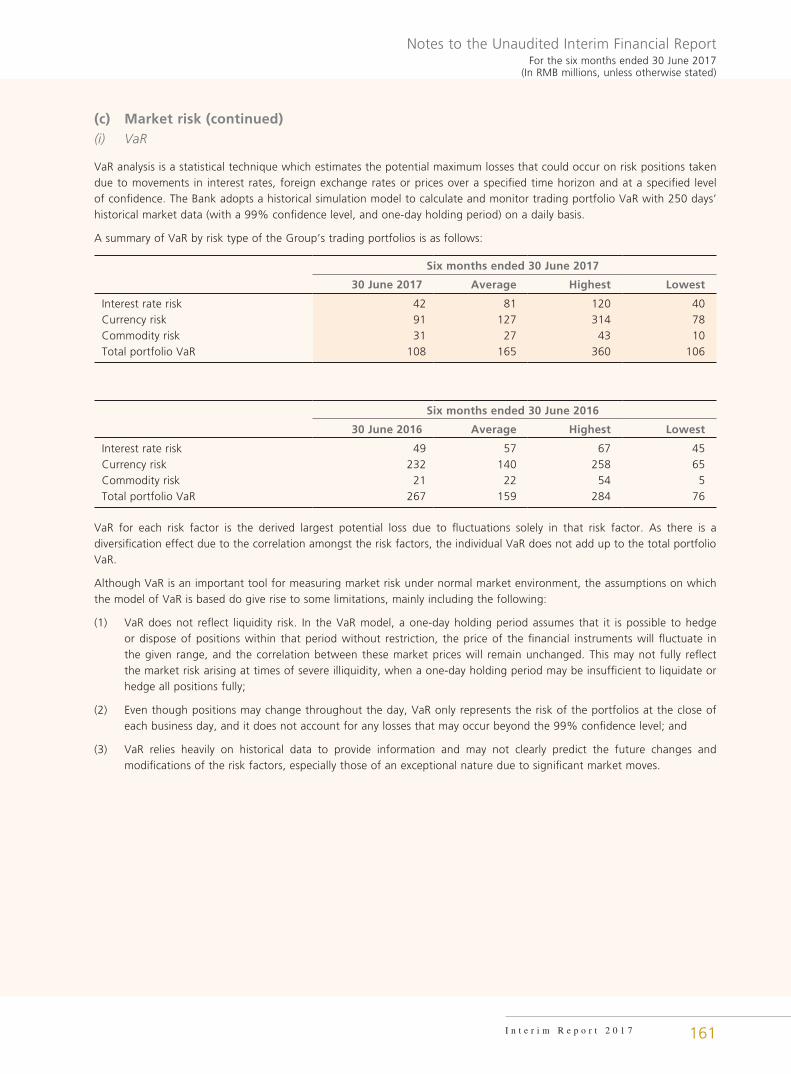
161I n t e r i m R e p o r t 2 0 1 7
Notes to the Unaudited Interim Financial ReportFor the six months ended 30 June 2017
(In RMB millions, unless otherwise stated)
(c) Market risk (continued)(i) VaR
VaR analysis is a statistical technique which estimates the potential maximum losses that could occur on risk positions taken due to movements in interest rates, foreign exchange rates or prices over a specified time horizon and at a specified level of confidence. The Bank adopts a historical simulation model to calculate and monitor trading portfolio VaR with 250 days’ historical market data (with a 99% confidence level, and one-day holding period) on a daily basis.
A summary of VaR by risk type of the Group’s trading portfolios is as follows:
Six months ended 30 June 2017
30 June 2017 Average Highest Lowest
Interest rate risk 42 81 120 40Currency risk 91 127 314 78Commodity risk 31 27 43 10Total portfolio VaR 108 165 360 106
Six months ended 30 June 2016
30 June 2016 Average Highest Lowest
Interest rate risk 49 57 67 45Currency risk 232 140 258 65Commodity risk 21 22 54 5Total portfolio VaR 267 159 284 76
VaR for each risk factor is the derived largest potential loss due to fluctuations solely in that risk factor. As there is a diversification effect due to the correlation amongst the risk factors, the individual VaR does not add up to the total portfolio VaR.
Although VaR is an important tool for measuring market risk under normal market environment, the assumptions on which the model of VaR is based do give rise to some limitations, mainly including the following:
(1) VaR does not reflect liquidity risk. In the VaR model, a one-day holding period assumes that it is possible to hedge or dispose of positions within that period without restriction, the price of the financial instruments will fluctuate in the given range, and the correlation between these market prices will remain unchanged. This may not fully reflect the market risk arising at times of severe illiquidity, when a one-day holding period may be insufficient to liquidate or hedge all positions fully;
(2) Even though positions may change throughout the day, VaR only represents the risk of the portfolios at the close of each business day, and it does not account for any losses that may occur beyond the 99% confidence level; and
(3) VaR relies heavily on historical data to provide information and may not clearly predict the future changes and modifications of the risk factors, especially those of an exceptional nature due to significant market moves.

162
Notes to the Unaudited Interim Financial ReportFor the six months ended 30 June 2017(In RMB millions, unless otherwise stated)
(c) Market risk (continued)(ii) Interest rate risk
The Group’s interest rate risk mainly arises from the mismatches between the repricing dates of interest-generating assets and interest-bearing liabilities. The Group’s interest-generating assets and interest-bearing liabilities are mainly denominated in RMB.
The Group manages its interest rate risk by:
• Regularly monitoring the macroeconomic factors that may have impact on the PBOC benchmark interest rates;
• Optimising the differences in timing between contractual repricing (maturities) of interest-generating assets and interest-bearing liabilities; and
• Managing the deviation of the pricing of interest-generating assets and interest-bearing liabilities from the PBOC benchmark interest rates.
A principal part of the Group’s management of interest rate risk is to monitor the sensitivity of projected net interest income under varying interest rate scenarios (simulation modeling). The Group aims to mitigate the impact of prospective interest rate movements which could reduce future net interest income, while balancing the cost of such hedging on the current revenue.
The following tables demonstrate the sensitivity to a reasonably possible change in interest rates, with all other variables held constant, of the Group’s net interest income and equity.
The effect on the net interest income is the effect of the assumed changes in interest rates on the net interest income, arising from the financial assets and financial liabilities held at period/year end that are subject to repricing within the coming year, including the effect of hedging instruments. The effect on equity is the effect of the assumed changes in interest rates on other comprehensive income, calculated by revaluing fixed rate available-for-sale financial assets held at period/year end, including the effect of any associated hedges.
Group
30 June 2017
Increased by 100 basis points Decreased by 100 basis points
Currency
Effect on net interest
incomeEffect on
equity
Effect on net interest
incomeEffect on
equity
RMB (24,238) (41,908) 24,238 45,016USD 71 (5,128) (71) 5,131HKD 66 – (66) –Others 263 (724) (263) 724
Total (23,838) (47,760) 23,838 50,871
31 December 2016
Increased by 100 basis points Decreased by 100 basis points
Currency
Effect on net interest
incomeEffect on
equity
Effect on net interest
incomeEffect on
equity
RMB (8,885) (46,604) 8,885 50,242USD (178) (4,450) 178 4,453HKD 139 (8) (139) 8Others 467 (635) (467) 635
Total (8,457) (51,697) 8,457 55,338

163I n t e r i m R e p o r t 2 0 1 7
Notes to the Unaudited Interim Financial ReportFor the six months ended 30 June 2017
(In RMB millions, unless otherwise stated)
(c) Market risk (continued)
The interest rate sensitivities set out in the tables above are for illustration only and are based on simplified scenarios. The figures represent the effect of the pro forma movements in net interest income and equity based on the projected yield curve scenarios and the Group’s current interest rate risk profile. This effect, however, does not incorporate actions that would be taken by management to mitigate the impact of interest rate risk. The projections above also assume that interest rates of all maturities move by the same amount and, therefore, do not reflect the potential impact on net interest income and equity in the case where some rates change while others remain unchanged.
The tables below summarise the contractual repricing or maturity date, whichever is earlier, of the Group’s assets and liabilities:
30 June 2017
Less than three
months
Three months to
one yearOne to
five yearsMore than five years
Non-interest-bearing Total
Assets:Cash and balances with central banks 3,088,847 – – – 453,926 3,542,773Due from banks and other financial institutions (*) 1,442,408 254,135 71,217 42 30,095 1,797,897Financial assets held for trading 86,199 34,933 6,779 6,674 6,810 141,395Financial assets designated at fair value through profit or loss 8,873 218,997 100,258 25,921 8,100 362,149Derivative financial assets – – – – 57,569 57,569Loans and advances to customers 4,636,224 8,552,753 185,038 109,324 66,057 13,549,396Financial investments 474,070 521,561 2,454,453 1,601,632 14,733 5,066,449Investments in associates and joint ventures – – – – 32,220 32,220Property and equipment – – – – 245,699 245,699Others 7,073 159 – – 711,267 718,499
Total assets 9,743,694 9,582,538 2,817,745 1,743,593 1,626,476 25,514,046
Liabilities:Due to central banks 30 68 413 – – 511Financial liabilities designated at fair value through profit or loss 294,280 65,458 9,672 – 85,893 455,303Derivative financial liabilities – – – – 52,436 52,436Due to banks and other financial institutions (**) 2,015,040 400,371 17,288 52,623 11,648 2,496,970Certificates of deposit 134,656 90,512 2,686 243 – 228,097Due to customers 12,177,094 4,090,540 2,500,664 3,319 249,554 19,021,171Debt securities issued 69,998 16,776 139,385 186,857 – 413,016Others 3,437 – – 650 811,821 815,908
Total liabilities 14,694,535 4,663,725 2,670,108 243,692 1,211,352 23,483,412
Interest rate mismatch (4,950,841) 4,918,813 147,637 1,499,901 N/A N/A
(*) Includes reverse repurchase agreements.
(**) Includes repurchase agreements.

164
Notes to the Unaudited Interim Financial ReportFor the six months ended 30 June 2017(In RMB millions, unless otherwise stated)
(c) Market risk (continued)31 December 2016
Less than three
months
Three months to
one yearOne to
five yearsMore than five years
Non-interest-bearing Total
Assets:Cash and balances with central banks 2,950,175 – – – 400,613 3,350,788Due from banks and other financial institutions (*) 1,281,652 175,706 65,244 41 30,457 1,553,100Financial assets held for trading 73,827 102,259 4,126 3,103 6,016 189,331Financial assets designated at fair value through profit or loss 16,157 40,807 203,561 19,063 5,556 285,144Derivative financial assets – – – – 94,452 94,452Loans and advances to customers 8,042,786 4,331,521 154,613 139,700 98,714 12,767,334Financial investments 403,284 637,160 2,375,341 1,578,061 12,853 5,006,699Investments in associates and joint ventures – – – – 30,077 30,077Property and equipment – – – – 246,209 246,209Others 9,294 209 – – 604,628 614,131
Total assets 12,777,175 5,287,662 2,802,885 1,739,968 1,529,575 24,137,265
Liabilities:Due to central banks – 118 427 – – 545Financial liabilities designated at fair value through profit or loss 247,084 45,217 9,870 – 64,581 366,752Derivative financial liabilities – – – – 89,960 89,960Due to banks and other financial institutions (**) 2,285,839 270,853 12,912 10,200 26,301 2,606,105Certificates of deposit 118,407 93,236 6,331 453 – 218,427Due to customers 11,660,480 3,705,066 2,166,979 5,362 287,415 17,825,302Debt securities issued 34,242 16,039 116,722 190,934 – 357,937Others 8,569 382 2,264 1,584 678,275 691,074
Total liabilities 14,354,621 4,130,911 2,315,505 208,533 1,146,532 22,156,102
Interest rate mismatch (1,577,446) 1,156,751 487,380 1,531,435 N/A N/A
(*) Includes reverse repurchase agreements.
(**) Includes repurchase agreements.

165I n t e r i m R e p o r t 2 0 1 7
Notes to the Unaudited Interim Financial ReportFor the six months ended 30 June 2017
(In RMB millions, unless otherwise stated)
(c) Market risk (continued)(iii) Currency risk
The Group conducts it businesses mainly in RMB, with certain transactions denominated in USD, HKD, to a lesser extent in other currencies. Transactions in foreign currencies mainly arise from the Group’s treasury operations, foreign exchange dealings and overseas investments.
The exchange rate of RMB to USD is managed under a floating exchange rate system. The HKD exchange rate is pegged to the USD and therefore the exchange rate of RMB to HKD has fluctuated in line with the changes in the exchange rate of RMB to USD.
The Group manages its currency risk through various methods, including limitation management and risk hedging to hedge foreign exchange risk, and performing currency risk sensitivity analysis and stress testing regularly.
The tables below indicate a sensitivity analysis of exchange rate changes of the currencies to which the Group had significant exposure on its monetary assets and liabilities and its forecasted cash flows. The analysis calculates the effect of a possible movement in the currency rates against RMB, with all other variables held constant, on profit before tax and equity. A negative amount in the table reflects a potential net reduction in profit before tax or equity, while a positive amount reflects a potential net increase. This effect, however, is based on the assumption that the Group’s foreign exchange exposures as at the period/year end are kept unchanged and, therefore, have not incorporated actions that would be taken by the Group to mitigate the adverse impact of this foreign exchange risk.
CurrencyChange in
currency rate
Effect on profit before tax Effect on equity
30 June 2017
31 December 2016
30 June 2017
31 December 2016
USD -1% (73) 66 (341) (313)HKD -1% 233 275 (982) (929)
While the table above indicates the effect on profit before tax and equity of 1% depreciation of USD and HKD, there will be an opposite effect with the same amount if the currencies appreciate by the same percentage.

166
Notes to the Unaudited Interim Financial ReportFor the six months ended 30 June 2017(In RMB millions, unless otherwise stated)
(c) Market risk (continued)
A breakdown of the assets and liabilities analysed by currency is as follows:
30 June 2017
USD HKD Others
RMB
(equivalent
to RMB)
(equivalent
to RMB)
(equivalent
to RMB) Total
Assets:
Cash and balances with central banks 3,260,376 189,962 23,039 69,396 3,542,773
Due from banks and other financial institutions (*) 1,184,674 559,498 7,075 46,650 1,797,897
Financial assets held for trading 121,609 8,067 – 11,719 141,395
Financial assets designated at fair value
through profit or loss 347,913 9,197 1,685 3,354 362,149
Derivative financial assets 22,013 20,441 5,667 9,448 57,569
Loans and advances to customers 12,149,954 880,041 242,523 276,878 13,549,396
Financial investments 4,694,528 271,904 17,466 82,551 5,066,449
Investments in associates and joint ventures 1,679 1,552 1,383 27,606 32,220
Property and equipment 128,490 115,059 773 1,377 245,699
Others 400,690 121,033 4,319 192,457 718,499
Total assets 22,311,926 2,176,754 303,930 721,436 25,514,046
Liabilities:
Due to central banks 30 – – 481 511
Financial liabilities designated at fair value
through profit or loss 370,496 21,449 – 63,358 455,303
Derivative financial liabilities 16,907 20,800 4,955 9,774 52,436
Due to banks and other financial institutions (**) 1,592,763 731,149 39,048 134,010 2,496,970
Certificates of deposit 20,884 138,624 11,054 57,535 228,097
Due to customers 17,797,487 779,072 267,621 176,991 19,021,171
Debt securities issued 183,277 205,054 701 23,984 413,016
Others 665,343 121,015 13,666 15,884 815,908
Total liabilities 20,647,187 2,017,163 337,045 482,017 23,483,412
Net position 1,664,739 159,591 (33,115) 239,419 2,030,634
Credit commitments 2,508,617 463,481 32,668 148,183 3,152,949
(*) Includes reverse repurchase agreements.
(**) Includes repurchase agreements.
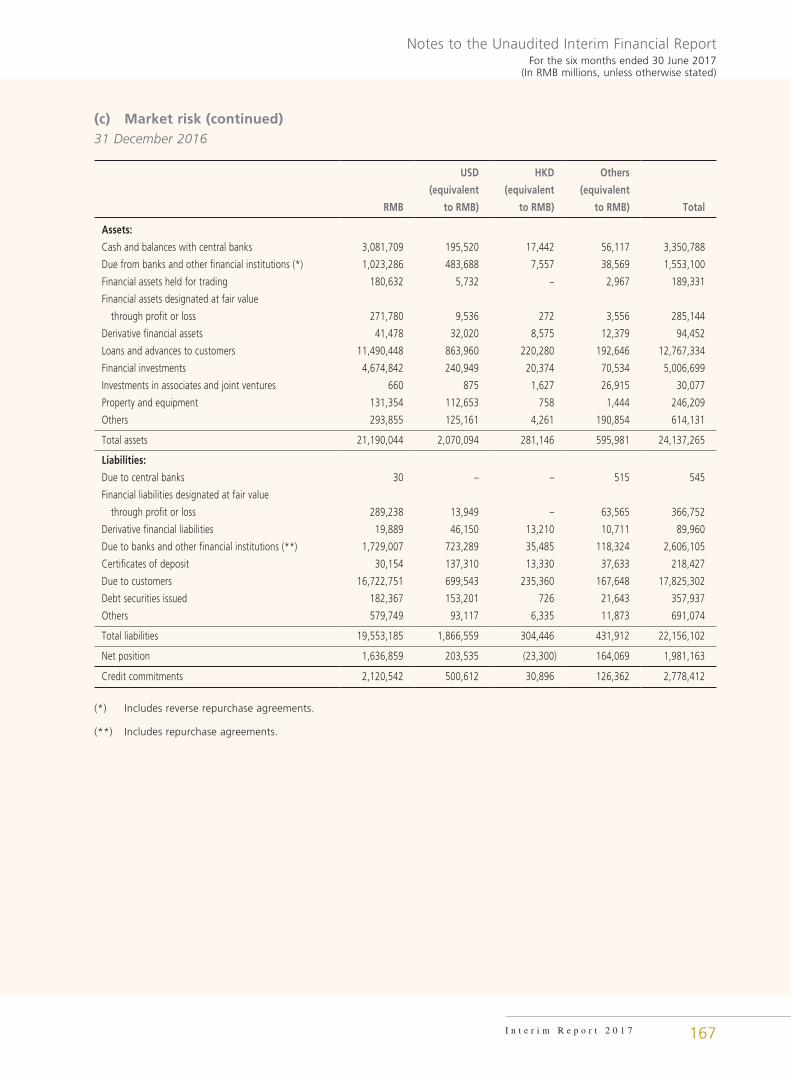
167I n t e r i m R e p o r t 2 0 1 7
Notes to the Unaudited Interim Financial ReportFor the six months ended 30 June 2017
(In RMB millions, unless otherwise stated)
(c) Market risk (continued)31 December 2016
USD HKD Others
RMB
(equivalent
to RMB)
(equivalent
to RMB)
(equivalent
to RMB) Total
Assets:
Cash and balances with central banks 3,081,709 195,520 17,442 56,117 3,350,788
Due from banks and other financial institutions (*) 1,023,286 483,688 7,557 38,569 1,553,100
Financial assets held for trading 180,632 5,732 – 2,967 189,331
Financial assets designated at fair value
through profit or loss 271,780 9,536 272 3,556 285,144
Derivative financial assets 41,478 32,020 8,575 12,379 94,452
Loans and advances to customers 11,490,448 863,960 220,280 192,646 12,767,334
Financial investments 4,674,842 240,949 20,374 70,534 5,006,699
Investments in associates and joint ventures 660 875 1,627 26,915 30,077
Property and equipment 131,354 112,653 758 1,444 246,209
Others 293,855 125,161 4,261 190,854 614,131
Total assets 21,190,044 2,070,094 281,146 595,981 24,137,265
Liabilities:
Due to central banks 30 – – 515 545
Financial liabilities designated at fair value
through profit or loss 289,238 13,949 – 63,565 366,752
Derivative financial liabilities 19,889 46,150 13,210 10,711 89,960
Due to banks and other financial institutions (**) 1,729,007 723,289 35,485 118,324 2,606,105
Certificates of deposit 30,154 137,310 13,330 37,633 218,427
Due to customers 16,722,751 699,543 235,360 167,648 17,825,302
Debt securities issued 182,367 153,201 726 21,643 357,937
Others 579,749 93,117 6,335 11,873 691,074
Total liabilities 19,553,185 1,866,559 304,446 431,912 22,156,102
Net position 1,636,859 203,535 (23,300) 164,069 1,981,163
Credit commitments 2,120,542 500,612 30,896 126,362 2,778,412
(*) Includes reverse repurchase agreements.
(**) Includes repurchase agreements.

168
Notes to the Unaudited Interim Financial ReportFor the six months ended 30 June 2017(In RMB millions, unless otherwise stated)
(d) Capital management
The Group’s objectives on capital management are:
• Maintain a reasonable capital adequacy ratio to continuously meet regulatory requirements on capital. Keeping a stable capital base to ensure the Group’s business growth and the implementation of business development and strategic plan in order to achieve comprehensive, coordinated and sustainable development;
• Adopt the advanced measurement approaches, improve the internal capital adequacy assessment process (ICAAP), disclose information on capital management, cover all types of risks, and ensure the stable operation of the Group;
• Integrate the quantified results of various risks into daily management, establish a bank value management system with economic capital as the core tool, improve the policy, process and application management system, strengthen the capital constraint and incentive mechanism, enhance the product pricing and decision-making capabilities, and improve the capital allocation efficiency; and
• Make reasonable use of various capital instruments, continuously enhance capital strengths, refine capital structure, improve capital quality, reduce capital cost, and maximize shareholder returns.
The Group manages its capital structure and makes adjustments in light of changes in economic conditions and the risk profile of its activities. In order to maintain or adjust the capital structure, the Group may adjust its profit distribution policy, issue or repurchase own shares, qualifying other tier 1 capital instruments, qualifying tier 2 capital instruments and convertible bonds, etc.
The Group’s Management monitors the capital adequacy ratios regularly based on regulations issued by the CBRC. The required information is respectively filed with the CBRC by the Group and the Bank semi-annually and quarterly.
From 1 January 2013, the Group commenced to calculate its capital adequacy ratios in accordance with Regulation Governing Capital of Commercial Banks (Provisional) and other relevant regulations promulgated by the CBRC. In April 2014, CBRC officially approved the Bank to adopt advanced capital management approaches. With the scope of the approval, the foundation internal ratings-based (IBR) approach is adopted to corporate credit risk, the IRB approach to retail credit risk, the internal model approach (IMA) to market risk, and the standardized approach to operational risk meeting regulatory requirements.
The CBRC requires commercial banks to meet the requirements of capital adequacy ratios by the end of 2018 in accordance with Regulation Governing Capital of Commercial Banks (Provisional). For systemically important banks, CBRC requires minimum core tier 1 capital adequacy ratio, tier 1 capital adequacy ratio and capital adequacy ratio of 8.50%, 9.50% and 11.50%, respectively. For non-systemically important banks, CBRC requires corresponding minimum ratios of 7.50%, 8.50% and 10.50%, respectively. In addition, overseas entities are directly regulated by local banking regulatory commissions, and the requirements of capital adequacy ratios differ by countries.
The Group calculates the following core tier 1 capital adequacy ratio, tier 1 capital adequacy ratio and capital adequacy ratio in accordance with Regulation Governing Capital of Commercial Banks (Provisional) and relevant requirements promulgated by the CBRC. The requirements pursuant to these regulations may have certain differences comparing to those applicable in Hong Kong and other jurisdictions.
The capital adequacy ratios and related components of the Group are calculated in accordance with the statutory financial statements of the Group prepared under PRC GAAP. During the period, the Group has complied in full with all its externally imposed capital requirements.

169I n t e r i m R e p o r t 2 0 1 7
Notes to the Unaudited Interim Financial ReportFor the six months ended 30 June 2017
(In RMB millions, unless otherwise stated)
(d) Capital management (continued)
The capital adequacy ratios calculated after implementation of the advanced capital management approaches are as follows:
30 June 2017 31 December 2016
Core tier 1 capital 1,934,598 1,886,536
Paid-in capital 356,407 356,407
Valid portion of capital reserve 152,002 151,998
Surplus reserve 205,308 205,021
General reserve 251,767 251,349
Retained profits 1,008,879 940,237
Valid portion of minority interests 2,432 3,164
Others (42,197) (21,640)
Core tier 1 capital deductions 11,063 11,560
Goodwill 8,810 9,001
Other intangible assets other than land use rights 1,157 1,477
Cash flow hedge reserves that relate to the hedging of items
that are not fair valued on the balance sheet (4,604) (4,618)
Investments in core tier 1 capital instruments issued by
financial institutions that are under control but not subject to
consolidation 5,700 5,700
Net core tier 1 capital 1,923,535 1,874,976
Additional tier 1 capital 79,894 79,794
Additional tier 1 capital instruments and related premium 79,375 79,375
Valid portion of minority interests 519 419
Net tier 1 capital 2,003,429 1,954,770
Tier 2 capital 193,155 178,292
Valid portion of tier 2 capital instruments and related premium 134,863 154,861
Surplus provision for loan impairment 54,954 19,195
Valid portion of minority interests 3,338 4,236
Tier 2 capital deductions 500 5,600
Significant minority investments in tier 2 capital instruments
issued by financial institutions that are not subject to consolidation 500 5,600
Net capital base 2,196,084 2,127,462
Risk-weighted assets (i) 15,183,975 14,564,617
Core tier 1 capital adequacy ratio 12.67% 12.87%
Tier 1 capital adequacy ratio 13.19% 13.42%
Capital adequacy ratio 14.46% 14.61%
(i) Refers to risk-weighted assets after capital floor and adjustments.

170
Notes to the Unaudited Interim Financial ReportFor the six months ended 30 June 2017(In RMB millions, unless otherwise stated)
48. FAIR VALUE OF FINANCIAL INSTRUMENTS
Fair value estimates are generally subjective in nature, and are made as of a specific point in time based on the characteristics of the financial instruments and relevant market information. The Group uses the following hierarchy for determining and disclosing the fair value of financial instruments:
Level 1: quoted (unadjusted) prices in active markets for identical assets or liabilities;
Level 2: other techniques for which all inputs which have a significant effect on the recorded fair value are observable, either directly or indirectly; and
Level 3: techniques which use inputs which have a significant effect on the recorded fair value that are not based on observable market data.
The Group has established policies and internal controls with respect to the measurement of fair values, specifically the framework of fair value measurement of financial instrument, fair value measurement methodologies and procedures. Fair value measurement policies specify valuation techniques, parameter selection and relevant concepts, models and parameter solutions. Operating procedures specify measurement operating procedures, valuation date, market parameter selection and corresponding allocation of responsibilities. In the process of fair value measurement, front office is responsible for daily transactions management. Financial Accounting Department plays a lead role of developing accounting policies of fair value measurement, valuation methodologies and system implementation. Risk Management Department is responsible for verifying trade details and valuation models.
The following is a description of the fair value of the financial instruments recorded at fair value which are determined using valuation techniques. These incorporate the Group’s estimate of assumptions that a market participant would make when valuing the instruments.
Financial investments
Financial investments valued using valuation techniques consist of debt securities and asset-backed securities. The Group values such securities in use of a discounted cash flow analysis which incorporates either only observable data or both observable and non-observable data. Observable inputs include assumptions regarding current interest rates; unobservable inputs include assumptions regarding expected future default rates, prepayment rates and market liquidity discounts.
A majority of the debt securities classified as level 2 are RMB bonds. The fair value of these bonds are determined based on the valuation results provided by China Central Depository & Clearing Co., Ltd., which are determined based on a valuation technique for which all significant inputs are observable market data.
Derivatives
Derivatives valued using a valuation technique with market observable inputs are mainly interest rate swaps, foreign exchange forwards, swaps and options, etc. The most frequently applied valuation techniques include discounted cash flow model and Black-Scholes model. The models incorporate various inputs including foreign exchange spot and forward rates, foreign exchange rate volatility, interest rate yield curves, etc.
Structured products are mainly valued using dealer’s quotations.
Other liabilities designated at fair value through profit or loss
For unquoted other liabilities designated at fair value through profit or loss, a discounted cash flow model is used based on current yield curve appropriate for the remaining term to maturity adjusted for market liquidity and credit spreads; and the Heston model is applied based on yield curves, foreign exchange forward rates, foreign exchange rate volatilities, etc., which is calibrated by active market quotes of standard European options with the same underlying.
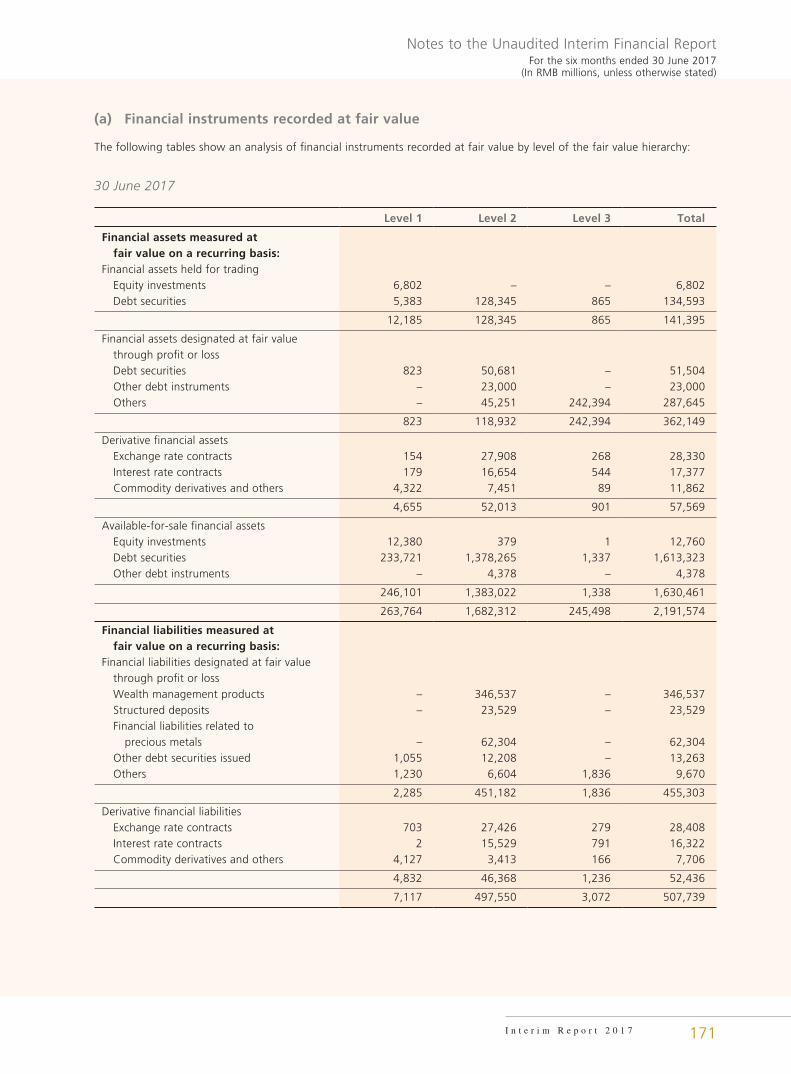
171I n t e r i m R e p o r t 2 0 1 7
Notes to the Unaudited Interim Financial ReportFor the six months ended 30 June 2017
(In RMB millions, unless otherwise stated)
(a) Financial instruments recorded at fair value
The following tables show an analysis of financial instruments recorded at fair value by level of the fair value hierarchy:
30 June 2017
Level 1 Level 2 Level 3 Total
Financial assets measured at fair value on a recurring basis:Financial assets held for trading Equity investments 6,802 – – 6,802 Debt securities 5,383 128,345 865 134,593
12,185 128,345 865 141,395
Financial assets designated at fair value through profit or loss Debt securities 823 50,681 – 51,504 Other debt instruments – 23,000 – 23,000 Others – 45,251 242,394 287,645
823 118,932 242,394 362,149
Derivative financial assets Exchange rate contracts 154 27,908 268 28,330 Interest rate contracts 179 16,654 544 17,377 Commodity derivatives and others 4,322 7,451 89 11,862
4,655 52,013 901 57,569
Available-for-sale financial assets Equity investments 12,380 379 1 12,760 Debt securities 233,721 1,378,265 1,337 1,613,323 Other debt instruments – 4,378 – 4,378
246,101 1,383,022 1,338 1,630,461
263,764 1,682,312 245,498 2,191,574
Financial liabilities measured at fair value on a recurring basis:Financial liabilities designated at fair value through profit or loss Wealth management products – 346,537 – 346,537 Structured deposits – 23,529 – 23,529 Financial liabilities related to precious metals – 62,304 – 62,304 Other debt securities issued 1,055 12,208 – 13,263 Others 1,230 6,604 1,836 9,670
2,285 451,182 1,836 455,303
Derivative financial liabilities Exchange rate contracts 703 27,426 279 28,408 Interest rate contracts 2 15,529 791 16,322 Commodity derivatives and others 4,127 3,413 166 7,706
4,832 46,368 1,236 52,436
7,117 497,550 3,072 507,739
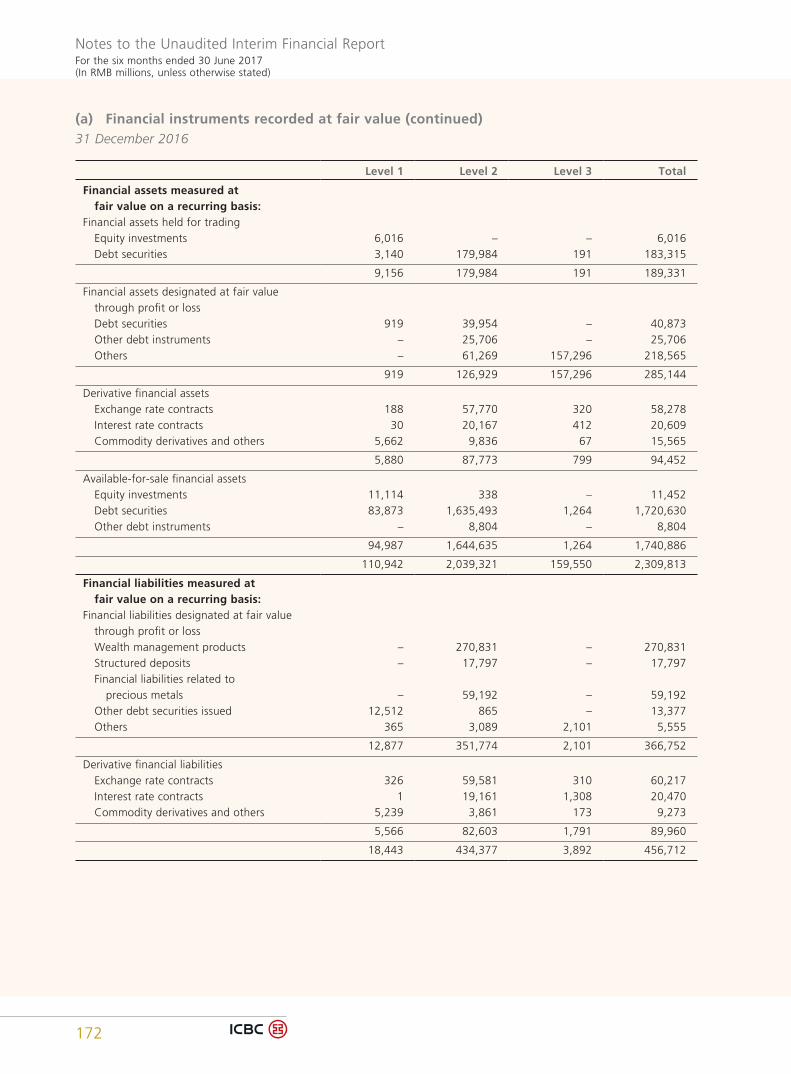
172
Notes to the Unaudited Interim Financial ReportFor the six months ended 30 June 2017(In RMB millions, unless otherwise stated)
(a) Financial instruments recorded at fair value (continued)31 December 2016
Level 1 Level 2 Level 3 Total
Financial assets measured at fair value on a recurring basis:Financial assets held for trading Equity investments 6,016 – – 6,016 Debt securities 3,140 179,984 191 183,315
9,156 179,984 191 189,331
Financial assets designated at fair value through profit or loss Debt securities 919 39,954 – 40,873 Other debt instruments – 25,706 – 25,706 Others – 61,269 157,296 218,565
919 126,929 157,296 285,144
Derivative financial assets Exchange rate contracts 188 57,770 320 58,278 Interest rate contracts 30 20,167 412 20,609 Commodity derivatives and others 5,662 9,836 67 15,565
5,880 87,773 799 94,452
Available-for-sale financial assets Equity investments 11,114 338 – 11,452 Debt securities 83,873 1,635,493 1,264 1,720,630 Other debt instruments – 8,804 – 8,804
94,987 1,644,635 1,264 1,740,886
110,942 2,039,321 159,550 2,309,813
Financial liabilities measured at fair value on a recurring basis:Financial liabilities designated at fair value through profit or loss Wealth management products – 270,831 – 270,831 Structured deposits – 17,797 – 17,797 Financial liabilities related to precious metals – 59,192 – 59,192 Other debt securities issued 12,512 865 – 13,377 Others 365 3,089 2,101 5,555
12,877 351,774 2,101 366,752
Derivative financial liabilities Exchange rate contracts 326 59,581 310 60,217 Interest rate contracts 1 19,161 1,308 20,470 Commodity derivatives and others 5,239 3,861 173 9,273
5,566 82,603 1,791 89,960
18,443 434,377 3,892 456,712

173I n t e r i m R e p o r t 2 0 1 7
Notes to the Unaudited Interim Financial ReportFor the six months ended 30 June 2017
(In RMB millions, unless otherwise stated)
(b) Movement in level 3 financial instruments measured at fair value
The following table shows a reconciliation of the opening and closing balance of level 3 financial assets and liabilities which are recorded at fair value and the movement during the reporting period:
As at 1 January
2017
Total gains/(losses)
recorded in profit or loss
Total losses recorded in other
comprehensive income Additions Disposals Settlements
Transfer out of level 3
As at 30 June
2017
Financial assets:Derivative financial assets Exchange rate contracts 320 (57) – 16 (10) (1) – 268 Interest rate contracts 412 136 – 1 (5) – – 544 Commodity derivatives and others 67 43 – 1 (8) (14) – 89Financial assets held for trading 191 (10) – 696 – (12) – 865Financial assets designated at fair value through profit or loss 157,296 4,933 – 83,729 (3,551) (13) – 242,394Available-for-sale financial assets Debt securities 1,264 4 1 72 (4) – – 1,337 Equity investments – – – 1 – – – 1
159,550 5,049 1 84,516 (3,578) (40) – 245,498
Financial liabilities:Financial liabilities designated at fair value through profit or loss (2,101) (47) – (234) – 546 – (1,836)Derivative financial liabilities Exchange rate contracts (310) 37 – (17) 10 1 – (279) Interest rate contracts (1,308) 511 – (1) 5 2 – (791) Commodity derivatives and others (173) (29) – – 8 29 (1) (166)
(3,892) 472 – (252) 23 578 (1) (3,072)
As at 1 January
2016
Total gains/(losses)
recorded in profit or loss
Total losses recorded in other
comprehensive income Additions Disposals Settlements
Transfer out of level 3
As at 31 December
2016
Financial assets:Derivative financial assets Exchange rate contracts 228 72 – 15 (3) (27) 35 320 Interest rate contracts 715 (21) – 2 (139) (179) 34 412 Commodity derivatives and others 101 (13) – 33 (8) (46) – 67Financial assets held for trading – 96 – 497 (92) (310) – 191Financial assets designated at fair value through profit or loss 181,376 7,258 – 11,659 (13,493) – (29,504) 157,296Available-for-sale financial assets Debt securities 5,520 10 (38) 239 (900) (3,567) – 1,264 Equity investments 626 – – – (316) – (310) –
188,566 7,402 (38) 12,445 (14,951) (4,129) (29,745) 159,550
Financial liabilities:Financial liabilities designated at fair value through profit or loss (2,211) 67 – 12 92 (83) 22 (2,101)Derivative financial liabilities Exchange rate contracts (234) (24) – (9) (3) 36 (76) (310) Interest rate contracts (2,181) 736 – (2) 147 26 (34) (1,308) Commodity derivatives and others (55) (39) – (134) 6 48 1 (173)
(4,681) 740 – (133) 242 27 (87) (3,892)
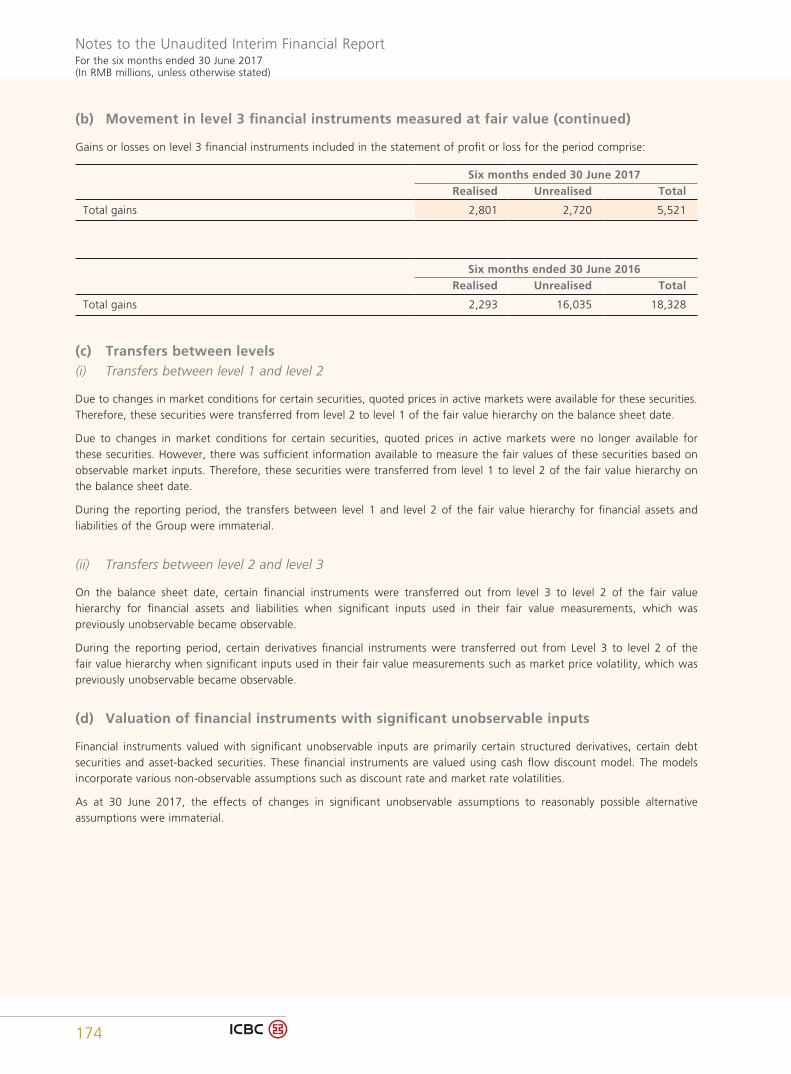
174
Notes to the Unaudited Interim Financial ReportFor the six months ended 30 June 2017(In RMB millions, unless otherwise stated)
(b) Movement in level 3 financial instruments measured at fair value (continued)
Gains or losses on level 3 financial instruments included in the statement of profit or loss for the period comprise:
Six months ended 30 June 2017Realised Unrealised Total
Total gains 2,801 2,720 5,521
Six months ended 30 June 2016Realised Unrealised Total
Total gains 2,293 16,035 18,328
(c) Transfers between levels(i) Transfers between level 1 and level 2
Due to changes in market conditions for certain securities, quoted prices in active markets were available for these securities. Therefore, these securities were transferred from level 2 to level 1 of the fair value hierarchy on the balance sheet date.
Due to changes in market conditions for certain securities, quoted prices in active markets were no longer available for these securities. However, there was sufficient information available to measure the fair values of these securities based on observable market inputs. Therefore, these securities were transferred from level 1 to level 2 of the fair value hierarchy on the balance sheet date.
During the reporting period, the transfers between level 1 and level 2 of the fair value hierarchy for financial assets and liabilities of the Group were immaterial.
(ii) Transfers between level 2 and level 3
On the balance sheet date, certain financial instruments were transferred out from level 3 to level 2 of the fair value hierarchy for financial assets and liabilities when significant inputs used in their fair value measurements, which was previously unobservable became observable.
During the reporting period, certain derivatives financial instruments were transferred out from Level 3 to level 2 of the fair value hierarchy when significant inputs used in their fair value measurements such as market price volatility, which was previously unobservable became observable.
(d) Valuation of financial instruments with significant unobservable inputs
Financial instruments valued with significant unobservable inputs are primarily certain structured derivatives, certain debt securities and asset-backed securities. These financial instruments are valued using cash flow discount model. The models incorporate various non-observable assumptions such as discount rate and market rate volatilities.
As at 30 June 2017, the effects of changes in significant unobservable assumptions to reasonably possible alternative assumptions were immaterial.
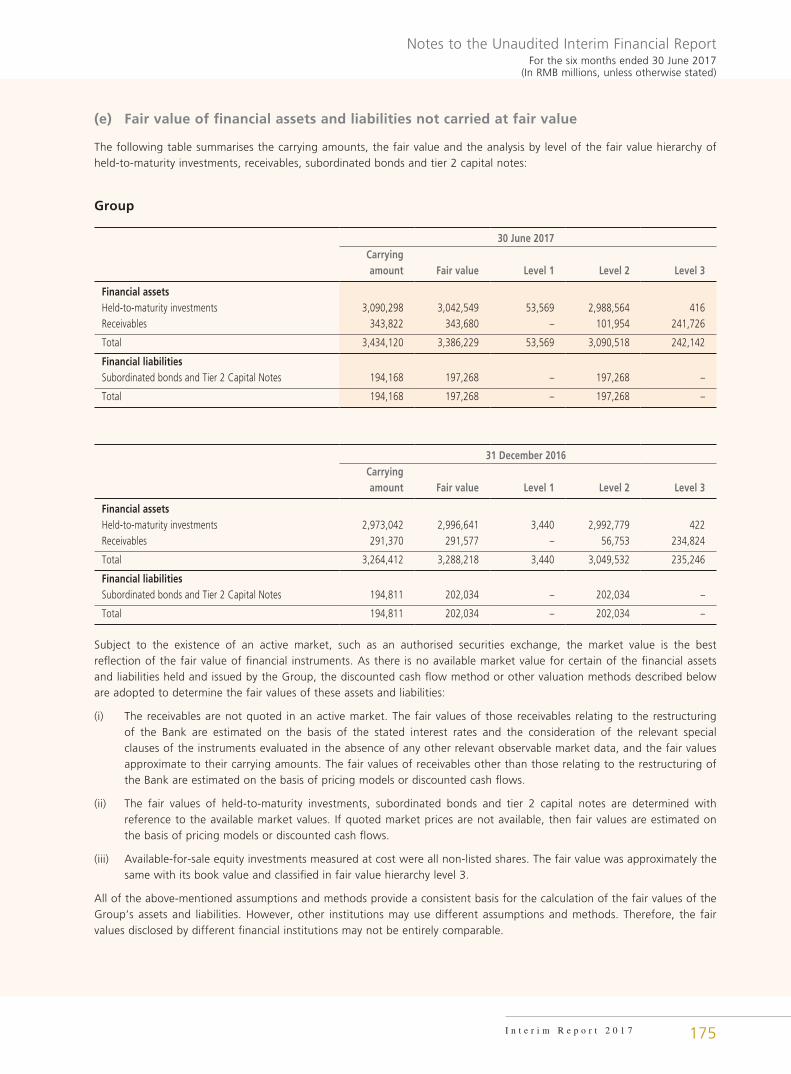
175I n t e r i m R e p o r t 2 0 1 7
Notes to the Unaudited Interim Financial ReportFor the six months ended 30 June 2017
(In RMB millions, unless otherwise stated)
(e) Fair value of financial assets and liabilities not carried at fair value
The following table summarises the carrying amounts, the fair value and the analysis by level of the fair value hierarchy of held-to-maturity investments, receivables, subordinated bonds and tier 2 capital notes:
Group
30 June 2017Carrying amount Fair value Level 1 Level 2 Level 3
Financial assetsHeld-to-maturity investments 3,090,298 3,042,549 53,569 2,988,564 416Receivables 343,822 343,680 – 101,954 241,726
Total 3,434,120 3,386,229 53,569 3,090,518 242,142
Financial liabilitiesSubordinated bonds and Tier 2 Capital Notes 194,168 197,268 – 197,268 –
Total 194,168 197,268 – 197,268 –
31 December 2016Carrying amount Fair value Level 1 Level 2 Level 3
Financial assetsHeld-to-maturity investments 2,973,042 2,996,641 3,440 2,992,779 422Receivables 291,370 291,577 – 56,753 234,824
Total 3,264,412 3,288,218 3,440 3,049,532 235,246
Financial liabilitiesSubordinated bonds and Tier 2 Capital Notes 194,811 202,034 – 202,034 –
Total 194,811 202,034 – 202,034 –
Subject to the existence of an active market, such as an authorised securities exchange, the market value is the best reflection of the fair value of financial instruments. As there is no available market value for certain of the financial assets and liabilities held and issued by the Group, the discounted cash flow method or other valuation methods described below are adopted to determine the fair values of these assets and liabilities:
(i) The receivables are not quoted in an active market. The fair values of those receivables relating to the restructuring of the Bank are estimated on the basis of the stated interest rates and the consideration of the relevant special clauses of the instruments evaluated in the absence of any other relevant observable market data, and the fair values approximate to their carrying amounts. The fair values of receivables other than those relating to the restructuring of the Bank are estimated on the basis of pricing models or discounted cash flows.
(ii) The fair values of held-to-maturity investments, subordinated bonds and tier 2 capital notes are determined with reference to the available market values. If quoted market prices are not available, then fair values are estimated on the basis of pricing models or discounted cash flows.
(iii) Available-for-sale equity investments measured at cost were all non-listed shares. The fair value was approximately the same with its book value and classified in fair value hierarchy level 3.
All of the above-mentioned assumptions and methods provide a consistent basis for the calculation of the fair values of the Group’s assets and liabilities. However, other institutions may use different assumptions and methods. Therefore, the fair values disclosed by different financial institutions may not be entirely comparable.
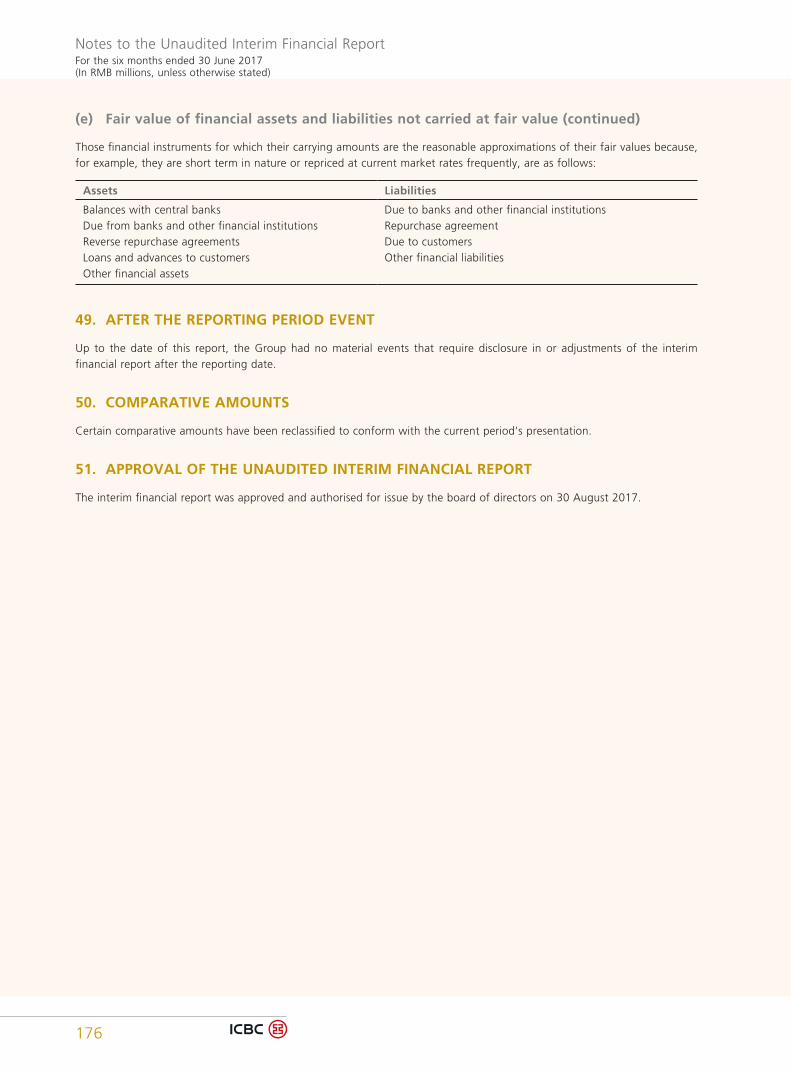
176
Notes to the Unaudited Interim Financial ReportFor the six months ended 30 June 2017(In RMB millions, unless otherwise stated)
(e) Fair value of financial assets and liabilities not carried at fair value (continued)
Those financial instruments for which their carrying amounts are the reasonable approximations of their fair values because, for example, they are short term in nature or repriced at current market rates frequently, are as follows:
Assets Liabilities
Balances with central banks Due to banks and other financial institutionsDue from banks and other financial institutions Repurchase agreementReverse repurchase agreements Due to customersLoans and advances to customers Other financial liabilitiesOther financial assets
49. AFTER THE REPORTING PERIOD EVENT
Up to the date of this report, the Group had no material events that require disclosure in or adjustments of the interim financial report after the reporting date.
50. COMPARATIVE AMOUNTS
Certain comparative amounts have been reclassified to conform with the current period’s presentation.
51. APPROVAL OF THE UNAUDITED INTERIM FINANCIAL REPORT
The interim financial report was approved and authorised for issue by the board of directors on 30 August 2017.

For the six months ended 30 June 2017(In RMB millions, unless otherwise stated)
Unaudited Supplementary Financial Information
177I n t e r i m R e p o r t 2 0 1 7
(a) Illustration of differences between the financial statements prepared based on IFRSs and those prepared under PRC GAAP
There are no differences between the profit attributable to equity holders of the parent company based on PRC GAAP and IFRSs for the six months ended 30 June 2017 (for the six months ended 30 June 2016: no differences). There are no differences between the equity attributable to equity holders of the Bank based on PRC GAAP and IFRSs as at 30 June 2017 (31 December 2016: no differences).
(b) Liquidity ratio
As at 30 June
2017
Average for the period
ended 30 June
2017
As at 31 December
2016
Average for the year ended
31 December 2016
RMB current assets to RMB current liabilities 40.48% 38.10% 35.72% 35.81%Foreign currency current assets to foreign currency current liabilities 87.97% 85.13% 82.28% 94.37%
The above liquidity ratios are calculated in accordance with the formula promulgated by the CBRC and based on the financial information prepared in accordance with PRC GAAP.
The Group prepares the liquidity ratio on a semi-annual basis and the disclosed average liquidity ratio is the arithmetic mean of two consecutive liquidity ratios as at 30 June and 31 December.
(c) Foreign currency concentrations
As at 30 June 2017USD HKD Others Total
Spot assets 2,060,143 301,774 692,453 3,054,370 Spot liabilities (1,982,278) (336,539) (482,017) (2,800,834) Forward purchases 2,527,434 265,880 911,693 3,705,007 Forward sales (2,573,505) (171,978) (1,097,413) (3,842,896) Net option position (47,793) (271) 228 (47,836)
Net (short)/long position (15,999) 58,866 24,944 67,811
Net structural position 81,726 1,650 28,983 112,359
As at 31 December 2016
USD HKD Others Total
Spot assets 1,956,566 278,761 567,622 2,802,949 Spot liabilities (1,836,172) (303,924) (431,912) (2,572,008) Forward purchases 2,797,668 173,932 1,007,928 3,979,528 Forward sales (2,887,047) (104,903) (1,122,168) (4,114,118) Net option position (43,266) 543 (102) (42,825)
Net (short)/long position (12,251) 44,409 21,368 53,526
Net structural position 83,141 1,863 28,359 113,363

Unaudited Supplementary Financial InformationFor the six months ended 30 June 2017(In RMB millions, unless otherwise stated)
178
The net option position is calculated using the delta equivalent approach required by the Hong Kong Monetary Authority. The net structural position of the Group includes the structural positions of the Bank’s overseas branches, banking subsidiaries and other subsidiaries substantially involved in foreign exchange. Structural assets and liabilities include:
• property and equipment, net of depreciation charges;
• capital and statutory reserves of overseas branches; and
• investments in overseas subsidiaries, associates and joint ventures.
(d) International claims
International claims refers to the sum of cross-border claims in all currencies and local claims in foreign currencies, including loans and advances to customers, balances with central banks, amounts due from banks and other financial institutions and debt investments.
A country or geographical area is reported where it constitutes 10% or more of the aggregate amount of international claims, after taking into account any risk transfers. Risk transfers are only made if the claims are guaranteed by a party in a country which is different from that of the counterparty or if the claims are on an overseas branch of a bank whose Head Office is located in another country.
As at 30 June 2017
Banks and other financial
institutionsOfficial
sector
Non-bank private sector Others Total
Asia Pacific 431,904 241,673 1,069,315 78,658 1,821,550 — of which attributed to Hong Kong 40,846 36,683 276,614 70,821 424,964 North and South America 53,142 100,936 122,916 10,027 287,021
485,046 342,609 1,192,231 88,685 2,108,571
As at 31 December 2016
Banks and other financial
institutionsOfficial
sector
Non-bank private sector Others Total
Asia Pacific 350,812 180,831 928,700 73,934 1,534,277 — of which attributed to Hong Kong 21,608 16,904 262,675 69,083 370,270 North and South America 50,526 100,621 124,562 9,332 285,041
401,338 281,452 1,053,262 83,266 1,819,318
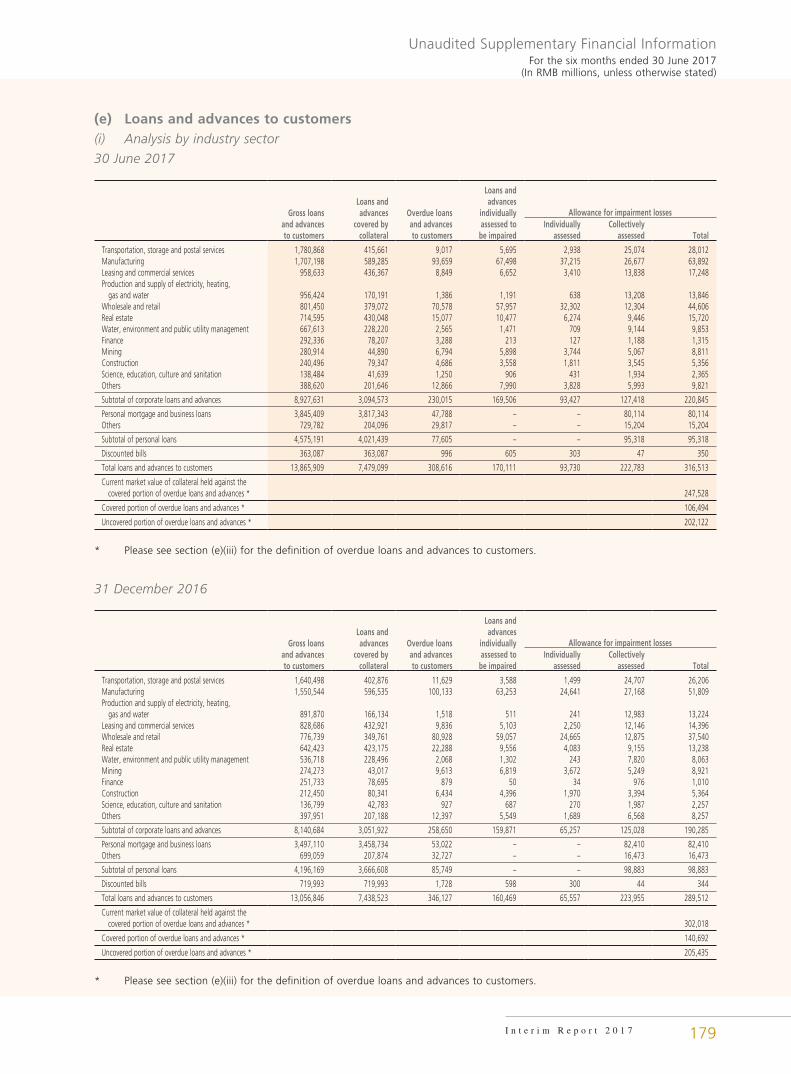
Unaudited Supplementary Financial InformationFor the six months ended 30 June 2017
(In RMB millions, unless otherwise stated)
179I n t e r i m R e p o r t 2 0 1 7
(e) Loans and advances to customers(i) Analysis by industry sector
30 June 2017
Gross loans and advances to customers
Loans and advances
covered by collateral
Overdue loans and advances to customers
Loans and advances
individually assessed to
be impaired
Allowance for impairment lossesIndividually
assessedCollectively
assessed Total
Transportation, storage and postal services 1,780,868 415,661 9,017 5,695 2,938 25,074 28,012Manufacturing 1,707,198 589,285 93,659 67,498 37,215 26,677 63,892Leasing and commercial services 958,633 436,367 8,849 6,652 3,410 13,838 17,248Production and supply of electricity, heating, gas and water 956,424 170,191 1,386 1,191 638 13,208 13,846Wholesale and retail 801,450 379,072 70,578 57,957 32,302 12,304 44,606Real estate 714,595 430,048 15,077 10,477 6,274 9,446 15,720Water, environment and public utility management 667,613 228,220 2,565 1,471 709 9,144 9,853Finance 292,336 78,207 3,288 213 127 1,188 1,315Mining 280,914 44,890 6,794 5,898 3,744 5,067 8,811Construction 240,496 79,347 4,686 3,558 1,811 3,545 5,356Science, education, culture and sanitation 138,484 41,639 1,250 906 431 1,934 2,365Others 388,620 201,646 12,866 7,990 3,828 5,993 9,821
Subtotal of corporate loans and advances 8,927,631 3,094,573 230,015 169,506 93,427 127,418 220,845
Personal mortgage and business loans 3,845,409 3,817,343 47,788 – – 80,114 80,114Others 729,782 204,096 29,817 – – 15,204 15,204
Subtotal of personal loans 4,575,191 4,021,439 77,605 – – 95,318 95,318
Discounted bills 363,087 363,087 996 605 303 47 350
Total loans and advances to customers 13,865,909 7,479,099 308,616 170,111 93,730 222,783 316,513
Current market value of collateral held against the covered portion of overdue loans and advances * 247,528
Covered portion of overdue loans and advances * 106,494
Uncovered portion of overdue loans and advances * 202,122
* Please see section (e)(iii) for the definition of overdue loans and advances to customers.
31 December 2016
Gross loans and advances to customers
Loans and advances
covered by collateral
Overdue loans and advances to customers
Loans and advances
individually assessed to
be impaired
Allowance for impairment lossesIndividually
assessedCollectively
assessed Total
Transportation, storage and postal services 1,640,498 402,876 11,629 3,588 1,499 24,707 26,206Manufacturing 1,550,544 596,535 100,133 63,253 24,641 27,168 51,809Production and supply of electricity, heating, gas and water 891,870 166,134 1,518 511 241 12,983 13,224Leasing and commercial services 828,686 432,921 9,836 5,103 2,250 12,146 14,396Wholesale and retail 776,739 349,761 80,928 59,057 24,665 12,875 37,540Real estate 642,423 423,175 22,288 9,556 4,083 9,155 13,238Water, environment and public utility management 536,718 228,496 2,068 1,302 243 7,820 8,063Mining 274,273 43,017 9,613 6,819 3,672 5,249 8,921Finance 251,733 78,695 879 50 34 976 1,010Construction 212,450 80,341 6,434 4,396 1,970 3,394 5,364Science, education, culture and sanitation 136,799 42,783 927 687 270 1,987 2,257Others 397,951 207,188 12,397 5,549 1,689 6,568 8,257
Subtotal of corporate loans and advances 8,140,684 3,051,922 258,650 159,871 65,257 125,028 190,285
Personal mortgage and business loans 3,497,110 3,458,734 53,022 – – 82,410 82,410Others 699,059 207,874 32,727 – – 16,473 16,473
Subtotal of personal loans 4,196,169 3,666,608 85,749 – – 98,883 98,883
Discounted bills 719,993 719,993 1,728 598 300 44 344
Total loans and advances to customers 13,056,846 7,438,523 346,127 160,469 65,557 223,955 289,512
Current market value of collateral held against the covered portion of overdue loans and advances * 302,018
Covered portion of overdue loans and advances * 140,692
Uncovered portion of overdue loans and advances * 205,435
* Please see section (e)(iii) for the definition of overdue loans and advances to customers.

Unaudited Supplementary Financial InformationFor the six months ended 30 June 2017(In RMB millions, unless otherwise stated)
180
(ii) Analysis by location of the counterparties
30 June 2017
31 December 2016
Mainland China 12,807,840 12,053,041Asia Pacific (excluding Mainland China) 664,512 622,803 of which attributed to Hong Kong 460,641 449,217North and South America 168,701 152,646Europe 128,384 112,985Africa 96,472 115,371
13,865,909 13,056,846
(iii) Overdue loans and advances to customers
30 June 2017
31 December 2016
Gross loans and advances to customers of the Group which have been overdue with respect to either principal or interest for periods of: Between 3 and 6 months 26,440 24,128 Between 6 and 12 months 40,900 51,422 Over 12 months 129,026 119,462
196,366 195,012
As a percentage of the total gross loans and advances to customers: Between 3 and 6 months 0.19% 0.18% Between 6 and 12 months 0.29% 0.39% Over 12 months 0.93% 0.91%
1.41% 1.48%
The definition of overdue loans and advances to customers is set out as follows:
Loans and advances with a specific repayment date are classified as overdue when the principal or interest is overdue.
For loans and advances repayable by regular instalments, if part of the instalments is overdue, the whole amounts of these loans and advances would be classified as overdue.
(iv) Overdue and impaired loans and advances to customers by geographical distribution
30 June 2017
Overdue loans and advances to customersImpaired loans and
advances to customers
Gross amount
Individually assessed to
be impaired
Individually assessed
allowance for impairment
losses
Individually assessed to
be impaired
Individually assessed
allowance for impairment
losses
Collectively assessed
allowance for impairment
losses
Head Office 18,519 1,458 1,092 1,458 1,092 20,550Bohai Rim 67,723 39,524 19,649 39,798 19,708 36,984Western China 55,355 25,446 14,626 27,810 15,965 41,729Central China 46,456 24,442 12,761 25,704 13,248 32,362Pearl River Delta 42,592 30,253 18,896 30,655 19,010 30,160Yangtze River Delta 40,210 23,831 12,688 25,182 13,088 42,042Northeastern China 18,696 11,454 7,038 11,498 7,043 10,925Overseas and others 19,065 6,586 3,366 8,006 4,576 8,031
Total 308,616 162,994 90,116 170,111 93,730 222,783
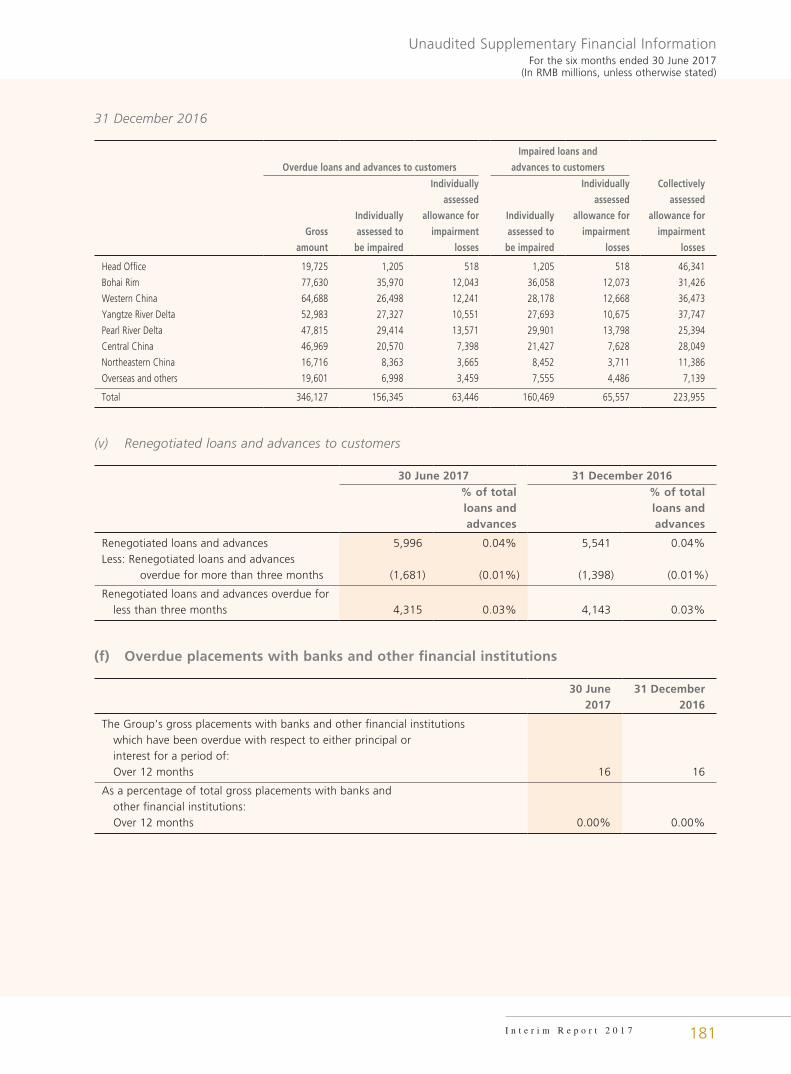
Unaudited Supplementary Financial InformationFor the six months ended 30 June 2017
(In RMB millions, unless otherwise stated)
181I n t e r i m R e p o r t 2 0 1 7
31 December 2016
Overdue loans and advances to customers
Impaired loans and
advances to customers
Gross
amount
Individually
assessed to
be impaired
Individually
assessed
allowance for
impairment
losses
Individually
assessed to
be impaired
Individually
assessed
allowance for
impairment
losses
Collectively
assessed
allowance for
impairment
losses
Head Office 19,725 1,205 518 1,205 518 46,341
Bohai Rim 77,630 35,970 12,043 36,058 12,073 31,426
Western China 64,688 26,498 12,241 28,178 12,668 36,473
Yangtze River Delta 52,983 27,327 10,551 27,693 10,675 37,747
Pearl River Delta 47,815 29,414 13,571 29,901 13,798 25,394
Central China 46,969 20,570 7,398 21,427 7,628 28,049
Northeastern China 16,716 8,363 3,665 8,452 3,711 11,386
Overseas and others 19,601 6,998 3,459 7,555 4,486 7,139
Total 346,127 156,345 63,446 160,469 65,557 223,955
(v) Renegotiated loans and advances to customers
30 June 2017 31 December 2016% of total loans and advances
% of total loans and advances
Renegotiated loans and advances 5,996 0.04% 5,541 0.04%Less: Renegotiated loans and advances
overdue for more than three months (1,681) (0.01%) (1,398) (0.01%)
Renegotiated loans and advances overdue for less than three months 4,315 0.03% 4,143 0.03%
(f) Overdue placements with banks and other financial institutions
30 June 2017
31 December 2016
The Group’s gross placements with banks and other financial institutions which have been overdue with respect to either principal or interest for a period of: Over 12 months 16 16
As a percentage of total gross placements with banks and other financial institutions: Over 12 months 0.00% 0.00%
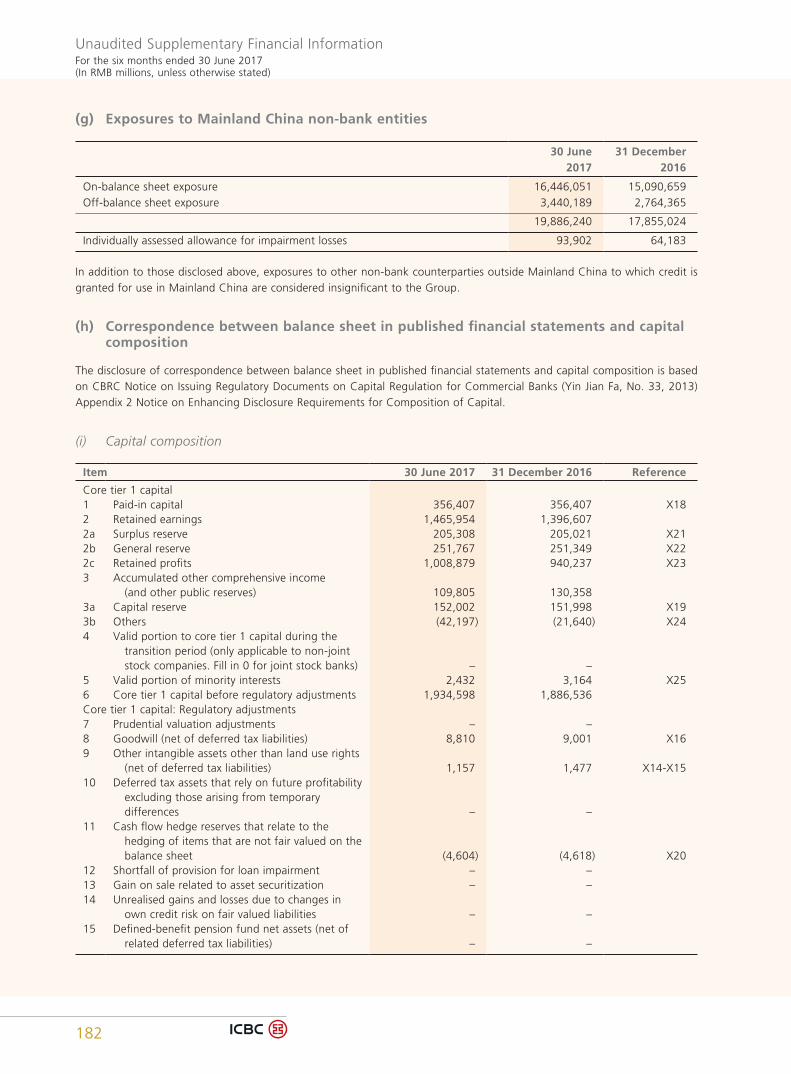
Unaudited Supplementary Financial InformationFor the six months ended 30 June 2017(In RMB millions, unless otherwise stated)
182
(g) Exposures to Mainland China non-bank entities
30 June 2017
31 December 2016
On-balance sheet exposure 16,446,051 15,090,659Off-balance sheet exposure 3,440,189 2,764,365
19,886,240 17,855,024
Individually assessed allowance for impairment losses 93,902 64,183
In addition to those disclosed above, exposures to other non-bank counterparties outside Mainland China to which credit is granted for use in Mainland China are considered insignificant to the Group.
(h) Correspondence between balance sheet in published financial statements and capital composition
The disclosure of correspondence between balance sheet in published financial statements and capital composition is based on CBRC Notice on Issuing Regulatory Documents on Capital Regulation for Commercial Banks (Yin Jian Fa, No. 33, 2013) Appendix 2 Notice on Enhancing Disclosure Requirements for Composition of Capital.
(i) Capital composition
Item 30 June 2017 31 December 2016 Reference
Core tier 1 capital1 Paid-in capital 356,407 356,407 X182 Retained earnings 1,465,954 1,396,6072a Surplus reserve 205,308 205,021 X212b General reserve 251,767 251,349 X222c Retained profits 1,008,879 940,237 X233 Accumulated other comprehensive income
(and other public reserves) 109,805 130,3583a Capital reserve 152,002 151,998 X193b Others (42,197) (21,640) X244 Valid portion to core tier 1 capital during the
transition period (only applicable to non-joint stock companies. Fill in 0 for joint stock banks) – –
5 Valid portion of minority interests 2,432 3,164 X256 Core tier 1 capital before regulatory adjustments 1,934,598 1,886,536Core tier 1 capital: Regulatory adjustments7 Prudential valuation adjustments – –8 Goodwill (net of deferred tax liabilities) 8,810 9,001 X169 Other intangible assets other than land use rights
(net of deferred tax liabilities) 1,157 1,477 X14-X1510 Deferred tax assets that rely on future profitability
excluding those arising from temporary differences – –
11 Cash flow hedge reserves that relate to the hedging of items that are not fair valued on the balance sheet (4,604) (4,618) X20
12 Shortfall of provision for loan impairment – –13 Gain on sale related to asset securitization – –14 Unrealised gains and losses due to changes in
own credit risk on fair valued liabilities – –15 Defined-benefit pension fund net assets (net of
related deferred tax liabilities) – –

Unaudited Supplementary Financial InformationFor the six months ended 30 June 2017
(In RMB millions, unless otherwise stated)
183I n t e r i m R e p o r t 2 0 1 7
Item 30 June 2017 31 December 2016 Reference
16 Directly or indirectly holding in own ordinary shares – –
17 Reciprocal cross-holdings in core tier 1 capital between banks or between banks and other financial institutions – –
18 Deductible amount of non-significant minority investment in core tier 1 capital instruments issued by financial institutions that are not subject to consolidation – –
19 Deductible amount of significant minority investment in core tier 1 capital instruments issued by financial institutions that are not subject to consolidation – –
20 Mortgage servicing rights N/A N/A21 Deductible amount in deferred tax assets arising
from temporary differences – –22 Deductible amount exceeding the 15% threshold
for significant minority capital investments in core tier 1 capital instruments issued by financial institutions that are not subject to consolidation and undeducted portion of deferred tax assets arising from temporary differences – –
23 Including: Deductible amount of significant minority investments in core tier 1 capital instruments issued by financial institutions – –
24 Including: Deductible amount of mortgage servicing rights N/A N/A
25 Including: Deductible amount in deferred tax assets arising from temporary differences – –
26a Investment in core tier 1 capital instruments issued by financial institutions that are under control but not subject to consolidation 5,700 5,700 X11
26b Shortfall in core tier 1 capital instruments issued by financial institutions that are under control but not subject to consolidation – –
26c Others that should be deducted from core tier 1 capital – –
27 Undeducted shortfall that should be deducted from additional tier 1 capital and tier 2 capital – –
28 Total regulatory adjustments to core tier 1 capital 11,063 11,56029 Core tier 1 capital 1,923,535 1,874,976Additional tier 1 capital:30 Additional tier 1 capital instruments and related
premium 79,375 79,37531 Including: Portion classified as equity 79,375 79,375 X2832 Including: Portion classified as liabilities – –33 Invalid instruments to additional tier 1 capital
after the transition period – –34 Valid portion of minority interests 519 419 X2635 Including: Invalid portion to additional tier 1
capital after the transition period – –36 Additional tier 1 capital before regulatory
adjustments 79,894 79,794
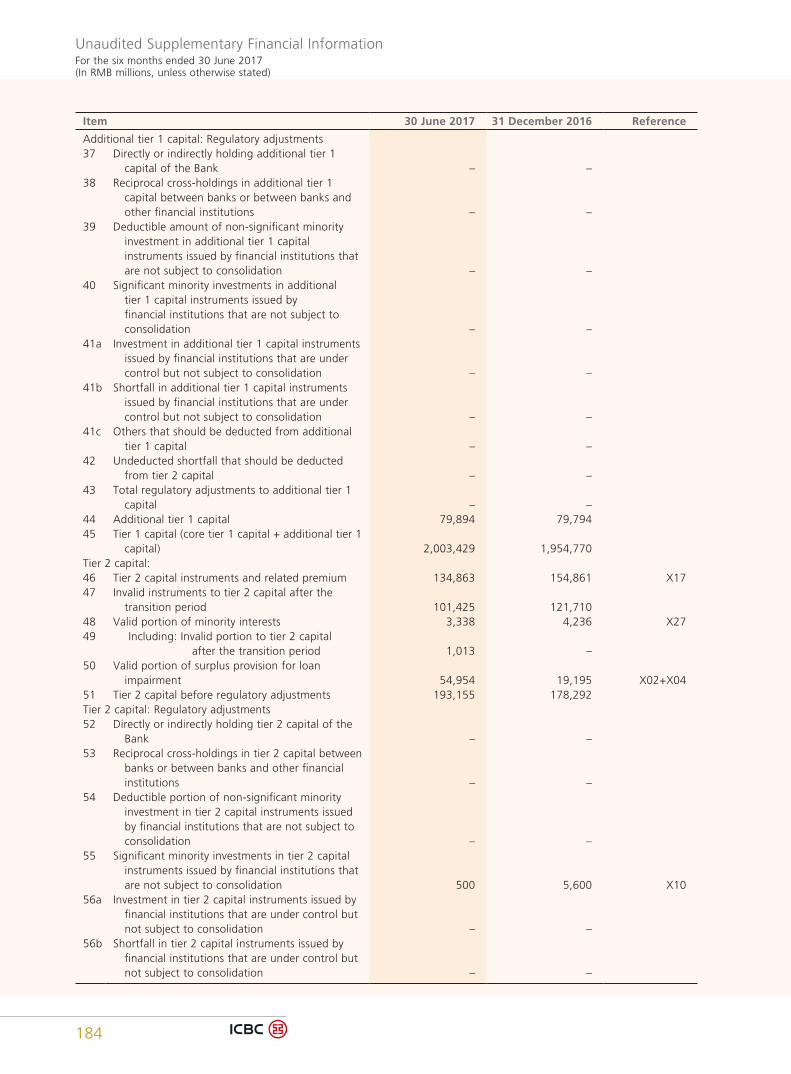
Unaudited Supplementary Financial InformationFor the six months ended 30 June 2017(In RMB millions, unless otherwise stated)
184
Item 30 June 2017 31 December 2016 Reference
Additional tier 1 capital: Regulatory adjustments37 Directly or indirectly holding additional tier 1
capital of the Bank – –38 Reciprocal cross-holdings in additional tier 1
capital between banks or between banks and other financial institutions – –
39 Deductible amount of non-significant minority investment in additional tier 1 capital instruments issued by financial institutions that are not subject to consolidation – –
40 Significant minority investments in additional tier 1 capital instruments issued by financial institutions that are not subject to consolidation – –
41a Investment in additional tier 1 capital instruments issued by financial institutions that are under control but not subject to consolidation – –
41b Shortfall in additional tier 1 capital instruments issued by financial institutions that are under control but not subject to consolidation – –
41c Others that should be deducted from additional tier 1 capital – –
42 Undeducted shortfall that should be deducted from tier 2 capital – –
43 Total regulatory adjustments to additional tier 1 capital – –
44 Additional tier 1 capital 79,894 79,79445 Tier 1 capital (core tier 1 capital + additional tier 1
capital) 2,003,429 1,954,770Tier 2 capital:46 Tier 2 capital instruments and related premium 134,863 154,861 X1747 Invalid instruments to tier 2 capital after the
transition period 101,425 121,71048 Valid portion of minority interests 3,338 4,236 X2749 Including: Invalid portion to tier 2 capital
after the transition period 1,013 –50 Valid portion of surplus provision for loan
impairment 54,954 19,195 X02+X0451 Tier 2 capital before regulatory adjustments 193,155 178,292Tier 2 capital: Regulatory adjustments52 Directly or indirectly holding tier 2 capital of the
Bank – –53 Reciprocal cross-holdings in tier 2 capital between
banks or between banks and other financial institutions – –
54 Deductible portion of non-significant minority investment in tier 2 capital instruments issued by financial institutions that are not subject to consolidation – –
55 Significant minority investments in tier 2 capital instruments issued by financial institutions that are not subject to consolidation 500 5,600 X10
56a Investment in tier 2 capital instruments issued by financial institutions that are under control but not subject to consolidation – –
56b Shortfall in tier 2 capital instruments issued by financial institutions that are under control but not subject to consolidation – –
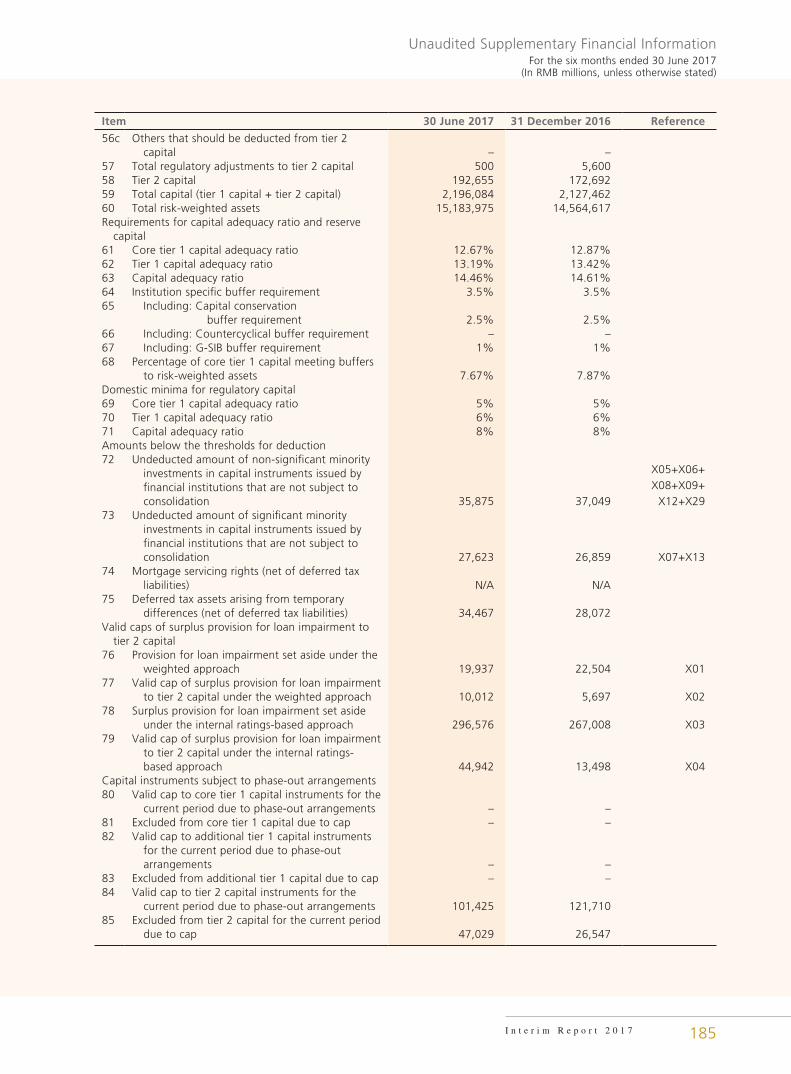
Unaudited Supplementary Financial InformationFor the six months ended 30 June 2017
(In RMB millions, unless otherwise stated)
185I n t e r i m R e p o r t 2 0 1 7
Item 30 June 2017 31 December 2016 Reference
56c Others that should be deducted from tier 2 capital – –
57 Total regulatory adjustments to tier 2 capital 500 5,60058 Tier 2 capital 192,655 172,69259 Total capital (tier 1 capital + tier 2 capital) 2,196,084 2,127,46260 Total risk-weighted assets 15,183,975 14,564,617Requirements for capital adequacy ratio and reserve capital61 Core tier 1 capital adequacy ratio 12.67% 12.87%62 Tier 1 capital adequacy ratio 13.19% 13.42%63 Capital adequacy ratio 14.46% 14.61%64 Institution specific buffer requirement 3.5% 3.5%65 Including: Capital conservation
buffer requirement 2.5% 2.5%66 Including: Countercyclical buffer requirement – –67 Including: G-SIB buffer requirement 1% 1%68 Percentage of core tier 1 capital meeting buffers
to risk-weighted assets 7.67% 7.87%Domestic minima for regulatory capital69 Core tier 1 capital adequacy ratio 5% 5%70 Tier 1 capital adequacy ratio 6% 6%71 Capital adequacy ratio 8% 8%Amounts below the thresholds for deduction72 Undeducted amount of non-significant minority
investments in capital instruments issued by financial institutions that are not subject to consolidation 35,875 37,049
X05+X06+X08+X09+
X12+X2973 Undeducted amount of significant minority
investments in capital instruments issued by financial institutions that are not subject to consolidation 27,623 26,859 X07+X13
74 Mortgage servicing rights (net of deferred tax liabilities) N/A N/A
75 Deferred tax assets arising from temporary differences (net of deferred tax liabilities) 34,467 28,072
Valid caps of surplus provision for loan impairment to tier 2 capital
76 Provision for loan impairment set aside under the weighted approach 19,937 22,504 X01
77 Valid cap of surplus provision for loan impairment to tier 2 capital under the weighted approach 10,012 5,697 X02
78 Surplus provision for loan impairment set aside under the internal ratings-based approach 296,576 267,008 X03
79 Valid cap of surplus provision for loan impairment to tier 2 capital under the internal ratings-based approach 44,942 13,498 X04
Capital instruments subject to phase-out arrangements80 Valid cap to core tier 1 capital instruments for the
current period due to phase-out arrangements – –81 Excluded from core tier 1 capital due to cap – –82 Valid cap to additional tier 1 capital instruments
for the current period due to phase-out arrangements – –
83 Excluded from additional tier 1 capital due to cap – –84 Valid cap to tier 2 capital instruments for the
current period due to phase-out arrangements 101,425 121,71085 Excluded from tier 2 capital for the current period
due to cap 47,029 26,547

Unaudited Supplementary Financial InformationFor the six months ended 30 June 2017(In RMB millions, unless otherwise stated)
186
(ii) Consolidated statement of financial position
30 June 2017Consolidated
balance sheetas in published
financial statements *
30 June 2017Balance sheet
under regulatoryscope of
consolidation *
31 December 2016Consolidated
balance sheetas in published
financial statements *
31 December 2016Balance sheet
under regulatoryscope of
consolidation *
AssetsCash and balances with central banks 3,542,773 3,542,773 3,350,788 3,350,788Due from banks and other financial institutions 447,448 440,863 270,058 262,582Precious metals 225,726 225,726 220,091 220,091Placements with banks and other financial institutions 509,791 509,791 527,415 527,415Financial assets at fair value through profit or loss 503,544 503,518 474,475 474,450Derivative financial assets 57,569 57,569 94,452 94,452Reverse repurchase agreements 840,658 840,380 755,627 755,557Loans and advances to customers 13,549,396 13,548,892 12,767,334 12,766,888Available-for-sale financial assets 1,632,329 1,598,304 1,742,287 1,708,102Held-to-maturity investments 3,090,298 3,089,462 2,973,042 2,972,444Receivables 343,822 294,105 291,370 245,221Long term equity investments 32,220 37,920 30,077 35,777Fixed assets 217,584 217,546 220,651 220,609Construction in progress 25,884 25,884 22,968 22,968Deferred income tax assets 34,839 34,839 28,398 28,398Other assets 460,165 435,585 368,232 353,794
Total assets 25,514,046 25,403,157 24,137,265 24,039,536
* Prepared in accordance with PRC GAAP.
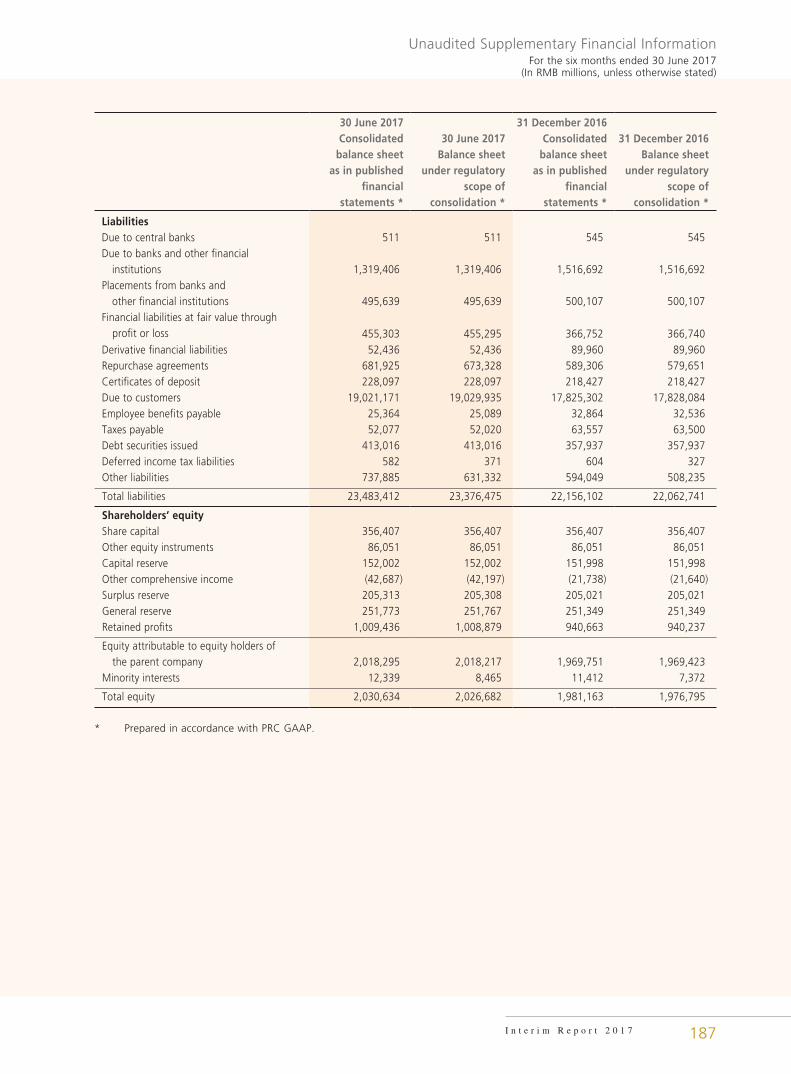
Unaudited Supplementary Financial InformationFor the six months ended 30 June 2017
(In RMB millions, unless otherwise stated)
187I n t e r i m R e p o r t 2 0 1 7
30 June 2017Consolidated
balance sheetas in published
financial statements *
30 June 2017Balance sheet
under regulatoryscope of
consolidation *
31 December 2016Consolidated
balance sheetas in published
financial statements *
31 December 2016Balance sheet
under regulatoryscope of
consolidation *
LiabilitiesDue to central banks 511 511 545 545Due to banks and other financial institutions 1,319,406 1,319,406 1,516,692 1,516,692Placements from banks and other financial institutions 495,639 495,639 500,107 500,107Financial liabilities at fair value through profit or loss 455,303 455,295 366,752 366,740Derivative financial liabilities 52,436 52,436 89,960 89,960Repurchase agreements 681,925 673,328 589,306 579,651Certificates of deposit 228,097 228,097 218,427 218,427Due to customers 19,021,171 19,029,935 17,825,302 17,828,084Employee benefits payable 25,364 25,089 32,864 32,536Taxes payable 52,077 52,020 63,557 63,500Debt securities issued 413,016 413,016 357,937 357,937Deferred income tax liabilities 582 371 604 327Other liabilities 737,885 631,332 594,049 508,235
Total liabilities 23,483,412 23,376,475 22,156,102 22,062,741
Shareholders’ equityShare capital 356,407 356,407 356,407 356,407Other equity instruments 86,051 86,051 86,051 86,051Capital reserve 152,002 152,002 151,998 151,998Other comprehensive income (42,687) (42,197) (21,738) (21,640)Surplus reserve 205,313 205,308 205,021 205,021General reserve 251,773 251,767 251,349 251,349Retained profits 1,009,436 1,008,879 940,663 940,237
Equity attributable to equity holders of the parent company 2,018,295 2,018,217 1,969,751 1,969,423Minority interests 12,339 8,465 11,412 7,372
Total equity 2,030,634 2,026,682 1,981,163 1,976,795
* Prepared in accordance with PRC GAAP.
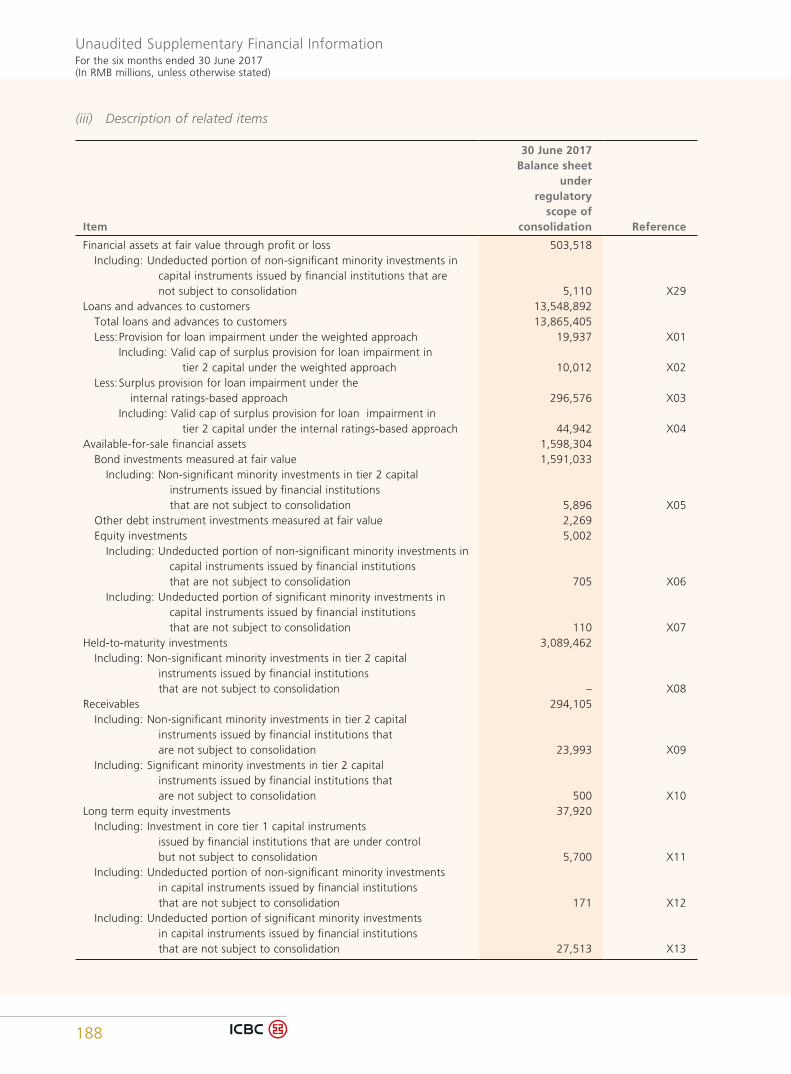
Unaudited Supplementary Financial InformationFor the six months ended 30 June 2017(In RMB millions, unless otherwise stated)
188
(iii) Description of related items
Item
30 June 2017 Balance sheet
under regulatory
scope of consolidation Reference
Financial assets at fair value through profit or loss 503,518 Including: Undeducted portion of non-significant minority investments in
capital instruments issued by financial institutions that are not subject to consolidation 5,110 X29
Loans and advances to customers 13,548,892 Total loans and advances to customers 13,865,405 Less: Provision for loan impairment under the weighted approach 19,937 X01
Including: Valid cap of surplus provision for loan impairment in tier 2 capital under the weighted approach 10,012 X02
Less: Surplus provision for loan impairment under the internal ratings-based approach 296,576 X03Including: Valid cap of surplus provision for loan impairment in
tier 2 capital under the internal ratings-based approach 44,942 X04Available-for-sale financial assets 1,598,304 Bond investments measured at fair value 1,591,033 Including: Non-significant minority investments in tier 2 capital
instruments issued by financial institutions that are not subject to consolidation 5,896 X05
Other debt instrument investments measured at fair value 2,269 Equity investments 5,002 Including: Undeducted portion of non-significant minority investments in
capital instruments issued by financial institutions that are not subject to consolidation 705 X06
Including: Undeducted portion of significant minority investments in capital instruments issued by financial institutions that are not subject to consolidation 110 X07
Held-to-maturity investments 3,089,462 Including: Non-significant minority investments in tier 2 capital
instruments issued by financial institutions that are not subject to consolidation – X08
Receivables 294,105 Including: Non-significant minority investments in tier 2 capital
instruments issued by financial institutions that are not subject to consolidation 23,993 X09
Including: Significant minority investments in tier 2 capital instruments issued by financial institutions that are not subject to consolidation 500 X10
Long term equity investments 37,920 Including: Investment in core tier 1 capital instruments
issued by financial institutions that are under control but not subject to consolidation 5,700 X11
Including: Undeducted portion of non-significant minority investments in capital instruments issued by financial institutions that are not subject to consolidation 171 X12
Including: Undeducted portion of significant minority investments in capital instruments issued by financial institutions that are not subject to consolidation 27,513 X13
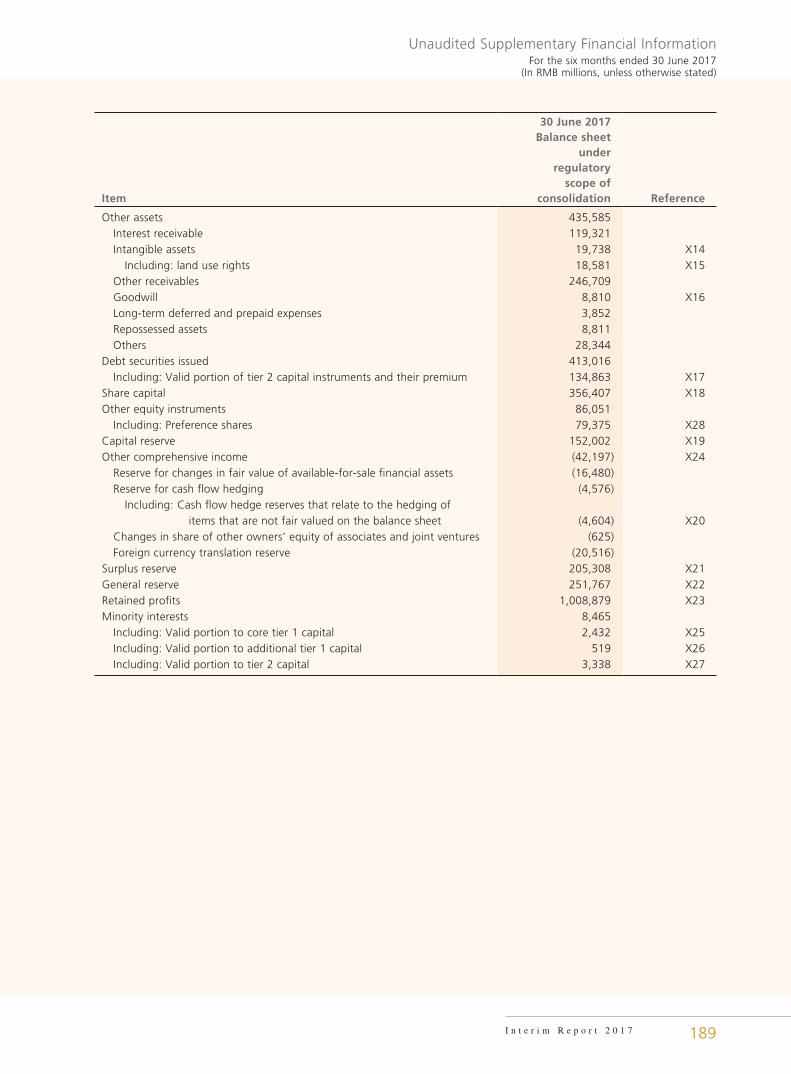
Unaudited Supplementary Financial InformationFor the six months ended 30 June 2017
(In RMB millions, unless otherwise stated)
189I n t e r i m R e p o r t 2 0 1 7
Item
30 June 2017 Balance sheet
under regulatory
scope of consolidation Reference
Other assets 435,585 Interest receivable 119,321 Intangible assets 19,738 X14 Including: land use rights 18,581 X15 Other receivables 246,709 Goodwill 8,810 X16 Long-term deferred and prepaid expenses 3,852 Repossessed assets 8,811 Others 28,344Debt securities issued 413,016 Including: Valid portion of tier 2 capital instruments and their premium 134,863 X17Share capital 356,407 X18Other equity instruments 86,051 Including: Preference shares 79,375 X28Capital reserve 152,002 X19Other comprehensive income (42,197) X24 Reserve for changes in fair value of available-for-sale financial assets (16,480) Reserve for cash flow hedging (4,576) Including: Cash flow hedge reserves that relate to the hedging of
items that are not fair valued on the balance sheet (4,604) X20 Changes in share of other owners’ equity of associates and joint ventures (625) Foreign currency translation reserve (20,516)Surplus reserve 205,308 X21General reserve 251,767 X22Retained profits 1,008,879 X23Minority interests 8,465 Including: Valid portion to core tier 1 capital 2,432 X25 Including: Valid portion to additional tier 1 capital 519 X26 Including: Valid portion to tier 2 capital 3,338 X27

Unaudited Supplementary Financial InformationFor the six months ended 30 June 2017(In RMB millions, unless otherwise stated)
190
(iv) Main features of eligible capital instruments
As at 30 June 2017, the main features of the Bank’s eligible capital instruments are set out as follows:
Main features of regulatory capital instrument
Ordinary shares(A share)
Ordinary shares(H share)
Preference shares(Offshore)
Preference shares(Offshore)
Preference shares(Offshore)
Preference shares(Domestic)
Issuer ICBC ICBC ICBC ICBC ICBC ICBCUnique identifier 601398 1398 4603 4604 84602 360011Governing law(s) of the instrument
Securities Law of the People’s Republic
of China/China
Securities and Futures Ordinance of Hong Kong/
Hong Kong, China
The creation and issue of the Offshore Preference
Shares and the rights and obligations (including
non-contractual rights and obligations) attached to them are governed by, and shall be
construed in accordance with, PRC law
The creation and issue of the Offshore Preference
Shares and the rights and obligations (including
non-contractual rights and obligations) attached to them are governed by, and shall be
construed in accordance with, PRC law
The creation and issue of the Offshore Preference
Shares and the rights and obligations (including
non-contractual rights and obligations) attached to them are governed by, and shall be
construed in accordance with, PRC law
Company Law of the People’s Republic of China, Securities Law of the People’s Republic
of China, Guidance of the State Council on Launch of
Preference Shares Pilot, Trial Administrative Measures
on Preference Shares, Guidance on the Issuance of
Preference Shares of Commercial Banks to
Replenish Tier 1 Capital/China
Regulatory treatment
Including: Transition arrangement of Regulation Governing Capital of Commercial Banks (Provisional)
Core tier 1 capital Core tier 1 capital Additional tier 1 capital Additional tier 1 capital Additional tier 1 capital Additional tier 1 capital
Including: Post-transition arrangement of Regulation Governing Capital of Commercial Banks (Provisional)
Core tier 1 capital Core tier 1 capital Additional tier 1 capital Additional tier 1 capital Additional tier 1 capital Additional tier 1 capital
Including: Eligible to the parent company/group level
Parent company/Group
Parent company/Group
Parent company/Group
Parent company/Group
Parent company/Group
Parent company/Group
Instrument type Core tier 1 capital instrument
Core tier 1 capital instrument
Additional tier 1 capital instrument
Additional tier 1 capital instrument
Additional tier 1 capital instrument
Additional tier 1 capital instrument
Amount recognised in regulatory capital (in millions, as at the latest reporting date)
RMB339,126 RMB169,202 RMB equivalent 17,928 RMB equivalent 4,542 RMB11,958 RMB44,947
Par value of instrument (in millions)
RMB269,612 RMB86,795 USD2,940 EUR 600 RMB12,000 RMB45,000
Accounting treatment Share capital, Capital reserve
Share capital, Capital reserve
Other equity Other equity Other equity Other equity
Original date of issuance 19 October 2006 19 October 2006 10 December 2014 10 December 2014 10 December 2014 18 November 2015Perpetual or dated Including: Original maturity date
Perpetual No maturity date
Perpetual No maturity date
Perpetual No maturity date
Perpetual No maturity date
Perpetual No maturity date
Perpetual No maturity date
Issuer call (subject to prior supervisory approval)
No No Yes Yes Yes Yes
Including: Optional call date, contingent call dates and redemption amount
N/A N/A The First Redemption Date is 10 December 2019,
in full or partial amount
The First Redemption Date is 10 December 2021,
in full or partial amount
The First Redemption Date is 10 December 2019,
in full or partial amount
The First Redemption Date is 18 November 2020,
in full or partial amount Including: Subsequent call dates, if applicable
N/A N/A 10 December in each year after the First Redemption Date
10 December in each year after the First Redemption Date
10 December in each year after the First Redemption Date
Commences on the First Redemption Date (18
November 2020) and ends on the completion date of
redemption or conversion of all the Domestic Preference
Shares
Coupons/dividends
Including: Fixed or floating dividend/coupon
Floating Floating Fixed to floating Fixed to floating Fixed to floating Fixed to floating
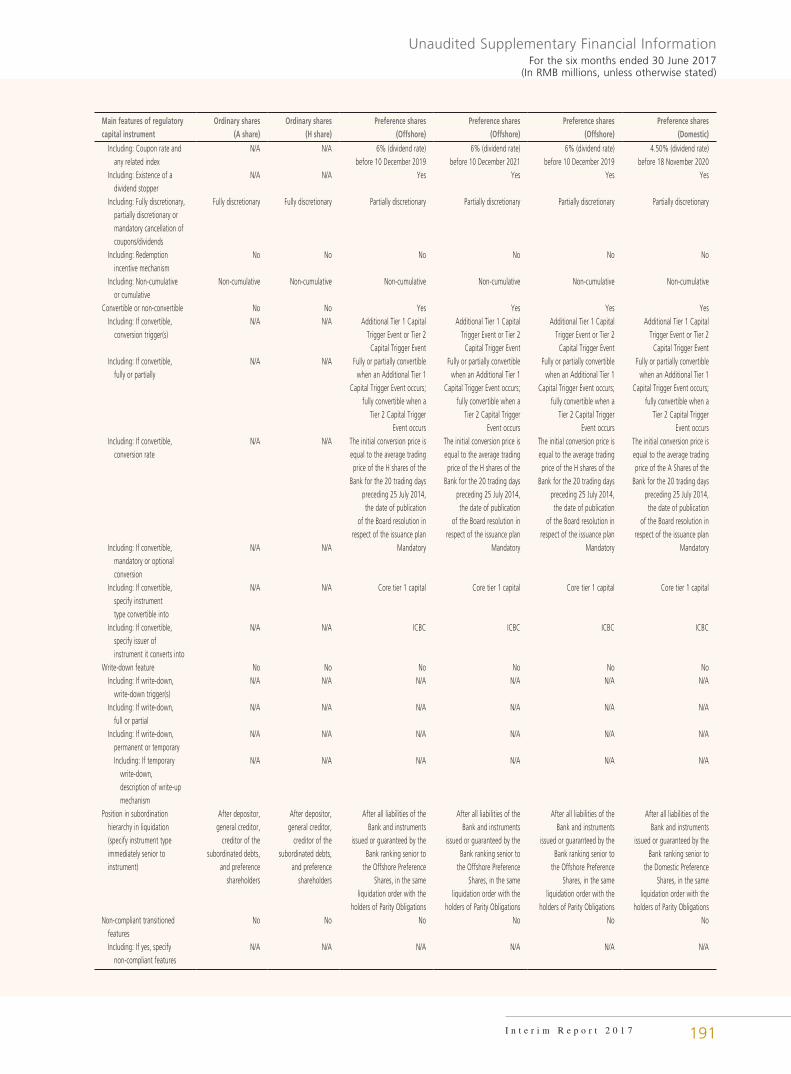
Unaudited Supplementary Financial InformationFor the six months ended 30 June 2017
(In RMB millions, unless otherwise stated)
191I n t e r i m R e p o r t 2 0 1 7
Main features of regulatory capital instrument
Ordinary shares(A share)
Ordinary shares(H share)
Preference shares(Offshore)
Preference shares(Offshore)
Preference shares(Offshore)
Preference shares(Domestic)
Including: Coupon rate and any related index
N/A N/A 6% (dividend rate) before 10 December 2019
6% (dividend rate) before 10 December 2021
6% (dividend rate) before 10 December 2019
4.50% (dividend rate) before 18 November 2020
Including: Existence of a dividend stopper
N/A N/A Yes Yes Yes Yes
Including: Fully discretionary, partially discretionary or mandatory cancellation of coupons/dividends
Fully discretionary Fully discretionary Partially discretionary Partially discretionary Partially discretionary Partially discretionary
Including: Redemption incentive mechanism
No No No No No No
Including: Non-cumulative or cumulative
Non-cumulative Non-cumulative Non-cumulative Non-cumulative Non-cumulative Non-cumulative
Convertible or non-convertible No No Yes Yes Yes Yes Including: If convertible, conversion trigger(s)
N/A N/A Additional Tier 1 Capital Trigger Event or Tier 2
Capital Trigger Event
Additional Tier 1 Capital Trigger Event or Tier 2
Capital Trigger Event
Additional Tier 1 Capital Trigger Event or Tier 2
Capital Trigger Event
Additional Tier 1 Capital Trigger Event or Tier 2
Capital Trigger Event Including: If convertible, fully or partially
N/A N/A Fully or partially convertible when an Additional Tier 1
Capital Trigger Event occurs; fully convertible when a
Tier 2 Capital Trigger Event occurs
Fully or partially convertible when an Additional Tier 1
Capital Trigger Event occurs; fully convertible when a
Tier 2 Capital Trigger Event occurs
Fully or partially convertible when an Additional Tier 1
Capital Trigger Event occurs; fully convertible when a
Tier 2 Capital Trigger Event occurs
Fully or partially convertible when an Additional Tier 1
Capital Trigger Event occurs; fully convertible when a
Tier 2 Capital Trigger Event occurs
Including: If convertible, conversion rate
N/A N/A The initial conversion price is equal to the average trading price of the H shares of the
Bank for the 20 trading days preceding 25 July 2014, the date of publication
of the Board resolution in respect of the issuance plan
The initial conversion price is equal to the average trading price of the H shares of the
Bank for the 20 trading days preceding 25 July 2014, the date of publication
of the Board resolution in respect of the issuance plan
The initial conversion price is equal to the average trading price of the H shares of the
Bank for the 20 trading days preceding 25 July 2014, the date of publication
of the Board resolution in respect of the issuance plan
The initial conversion price is equal to the average trading price of the A Shares of the
Bank for the 20 trading days preceding 25 July 2014, the date of publication
of the Board resolution in respect of the issuance plan
Including: If convertible, mandatory or optional conversion
N/A N/A Mandatory Mandatory Mandatory Mandatory
Including: If convertible, specify instrument type convertible into
N/A N/A Core tier 1 capital Core tier 1 capital Core tier 1 capital Core tier 1 capital
Including: If convertible, specify issuer of instrument it converts into
N/A N/A ICBC ICBC ICBC ICBC
Write-down feature No No No No No No Including: If write-down, write-down trigger(s)
N/A N/A N/A N/A N/A N/A
Including: If write-down, full or partial
N/A N/A N/A N/A N/A N/A
Including: If write-down, permanent or temporary
N/A N/A N/A N/A N/A N/A
Including: If temporary write-down, description of write-up mechanism
N/A N/A N/A N/A N/A N/A
Position in subordination hierarchy in liquidation (specify instrument type immediately senior to instrument)
After depositor, general creditor,
creditor of the subordinated debts,
and preference shareholders
After depositor, general creditor,
creditor of the subordinated debts,
and preference shareholders
After all liabilities of the Bank and instruments
issued or guaranteed by the Bank ranking senior to
the Offshore Preference Shares, in the same
liquidation order with the holders of Parity Obligations
After all liabilities of the Bank and instruments
issued or guaranteed by the Bank ranking senior to
the Offshore Preference Shares, in the same
liquidation order with the holders of Parity Obligations
After all liabilities of the Bank and instruments
issued or guaranteed by the Bank ranking senior to
the Offshore Preference Shares, in the same
liquidation order with the holders of Parity Obligations
After all liabilities of the Bank and instruments
issued or guaranteed by the Bank ranking senior to
the Domestic Preference Shares, in the same
liquidation order with the holders of Parity Obligations
Non-compliant transitioned features
No No No No No No
Including: If yes, specify non-compliant features
N/A N/A N/A N/A N/A N/A

Unaudited Supplementary Financial InformationFor the six months ended 30 June 2017(In RMB millions, unless otherwise stated)
192
Main features of regulatory capital instrument Tier 2 capital bonds Tier 2 capital bonds Tier 2 capital bonds
Issuer ICBC (Asia) ICBC ICBCUnique identifier ISIN: XS0976879279
BBGID:BBG005CMF4N61428009 Rule 144A ISIN:
US455881AD47 Regulation S ISIN:
USY39656AC06Governing law(s) of the instrument The Notes and any non-contractual
obligations arising out of or in connection
with the Notes will be governed by, and shall be construed in accordance
with English law, except that the provision of
the Notes relating to Subordination shall be governed by, and construed
in accordance with, the laws of Hong Kong
Securities Law of the People’s Republic of
China/China
The Notes and the Fiscal Agency
Agreement shall be governed by, and shall
be construed in accordance with, New York law, except that the provisions of the
Notes relating to subordination shall be
governed by, and construed in accordance
with, PRC law
Regulatory treatment
Including: Transition arrangement of Regulation Governing Capital of Commercial Banks (Provisional)
Tier 2 capital Tier 2 capital Tier 2 capital
Including: Post-transition arrangement of Regulation Governing Capital of Commercial Banks (Provisional)
Tier 2 capital Tier 2 capital Tier 2 capital
Including: Eligible to the parent company/group level
Group Parent company/Group Parent company/Group
Instrument type Tier 2 capital instrument Tier 2 capital instrument Tier 2 capital instrumentAmount recognised in regulatory capital (in millions, as at the latest reporting date)
RMB equivalent 1,385 RMB20,010 RMB equivalent 13,428
Par value of instrument (in millions) USD500 RMB20,000 USD2,000Accounting treatment Debt securities issued Debt securities issued Debt securities issuedOriginal date of issuance 10 October 2013 4 August 2014 21 September 2015Perpetual or dated Dated Dated Dated Including: Original maturity date 10 October 2023 5 August 2024 21 September 2025Issuer call (subject to prior supervisory approval)
Yes Yes No
Including: Optional call date, contingent call dates and redemption amount
10 October 2018, in full amount 5 August 2019, in full amount N/A
Including: Subsequent call dates, if applicable
N/A N/A N/A
Coupons/dividends
Including: Fixed or floating dividend/coupon Fixed Fixed Fixed Including: Coupon rate and any related index
4.50% 5.80% 4.875%
Including: Existence of a dividend stopper No No No Including: Fully discretionary, partially discretionary or mandatory cancellation of coupons/dividends
Mandatory Fully discretionary Mandatory
Including: Redemption incentive mechanism No No No Including: Non-cumulative or cumulative Cumulative Cumulative Cumulative
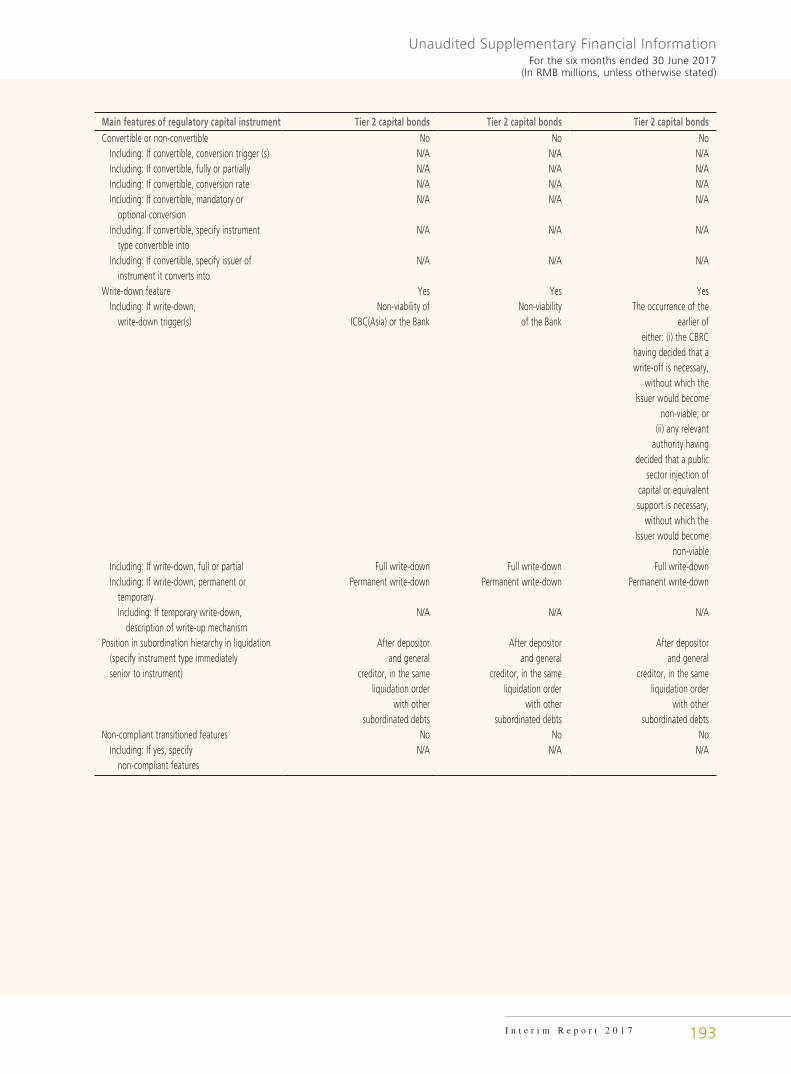
Unaudited Supplementary Financial InformationFor the six months ended 30 June 2017
(In RMB millions, unless otherwise stated)
193I n t e r i m R e p o r t 2 0 1 7
Main features of regulatory capital instrument Tier 2 capital bonds Tier 2 capital bonds Tier 2 capital bondsConvertible or non-convertible No No No Including: If convertible, conversion trigger (s) N/A N/A N/A Including: If convertible, fully or partially N/A N/A N/A Including: If convertible, conversion rate N/A N/A N/A Including: If convertible, mandatory or optional conversion
N/A N/A N/A
Including: If convertible, specify instrument type convertible into
N/A N/A N/A
Including: If convertible, specify issuer of instrument it converts into
N/A N/A N/A
Write-down feature Yes Yes Yes Including: If write-down, write-down trigger(s)
Non-viability of ICBC(Asia) or the Bank
Non-viability of the Bank
The occurrence of the earlier of
either: (i) the CBRC having decided that a write-off is necessary,
without which the Issuer would become
non-viable; or (ii) any relevant
authority having decided that a public
sector injection of capital or equivalent support is necessary,
without which the Issuer would become
non-viable Including: If write-down, full or partial Full write-down Full write-down Full write-down Including: If write-down, permanent or temporary
Permanent write-down Permanent write-down Permanent write-down
Including: If temporary write-down, description of write-up mechanism
N/A N/A N/A
Position in subordination hierarchy in liquidation (specify instrument type immediately senior to instrument)
After depositor and general
creditor, in the same liquidation order
with other subordinated debts
After depositor and general
creditor, in the same liquidation order
with other subordinated debts
After depositor and general
creditor, in the same liquidation order
with other subordinated debts
Non-compliant transitioned features No No No Including: If yes, specify non-compliant features
N/A N/A N/A

Unaudited Supplementary Financial InformationFor the six months ended 30 June 2017(In RMB millions, unless otherwise stated)
194
(i) Disclosure of Leverage Ratio
The following information is disclosed in accordance with the CBRC Administrative Measures for Leverage Ratio of Commercial Banks (Revised) (CBRC No.1, 2015) Appendix 3 Disclosure Templates of Leverage Ratio.
Comparison of Regulatory Leverage Ratio Items and Accounting Items
S/N Item30 June
201731 December
2016
1 Total consolidated assets as per published financial statements 25,514,046 24,137,2652 Consolidated adjustments for accounting purposes but outside
the scope of regulatory consolidation (110,889) (97,729)3 Adjustments for fiduciary assets – –4 Adjustments for derivative financial instruments 81,737 93,7335 Adjustment for securities financing transactions 55,523 57,2986 Adjustment for off-balance sheet items 1,938,279 1,725,5267 Other adjustments (11,063) (11,560)8 Balance of adjusted on- and off-balance sheet assets 27,467,633 25,904,533
Leverage Ratio, Net Tier 1 Capital, Balance of Adjusted On- and Off-balance Sheet Assets and Related Information
S/N Item30 June
201731 December
2016
1 On-balance sheet items (excluding derivatives and SFTs, but including collateral) 24,693,757 23,433,899
2 Less: Asset amounts deducted in determining Basel III Tier 1 capital (11,063) (11,560)3 Balance of adjusted on-balance sheet assets (excluding derivatives and SFTs) 24,682,694 23,422,3394 Replacement cost associated with all derivatives transactions
(ie net of eligible cash variation margin) 70,084 113,6695 Add-on amounts for PFE associated with all derivatives transactions 59,654 58,1166 Gross-up for derivatives collateral provided where deducted from the
balance sheet assets pursuant to the operative accounting framework – –7 Less: Deductions of receivables assets for cash variation margin provided
in derivatives transactions – –8 Less: Exempted CCP leg of client-cleared trade exposures (10,530) (14,896)9 Effective notional amount of written credit derivatives 58,409 58,81310 Less: Adjusted effective notional deductions for written credit derivatives (38,311) (27,517)11 Total derivative exposures 139,306 188,18512 Gross SFT assets (with no recognition of netting), after adjusting for
sale accounting transactions 651,831 511,18513 Less: Netted amounts of cash payables and cash receivables
of gross SFT assets – –14 CCR exposure for SFT assets 55,523 57,29815 Agent transaction exposures – –16 Total securities financing transaction exposures 707,354 568,48317 Off-balance sheet exposure at gross notional amount 3,892,498 3,435,09818 Less: Adjustments for conversion to credit equivalent amounts (1,954,219) (1,709,572)19 Balance of adjusted off-balance sheet assets 1,938,279 1,725,52620 Net tier 1 capital 2,003,429 1,954,77021 Balance of adjusted on- and off-balance sheet assets 27,467,633 25,904,53322 Leverage ratio 7.29% 7.55%
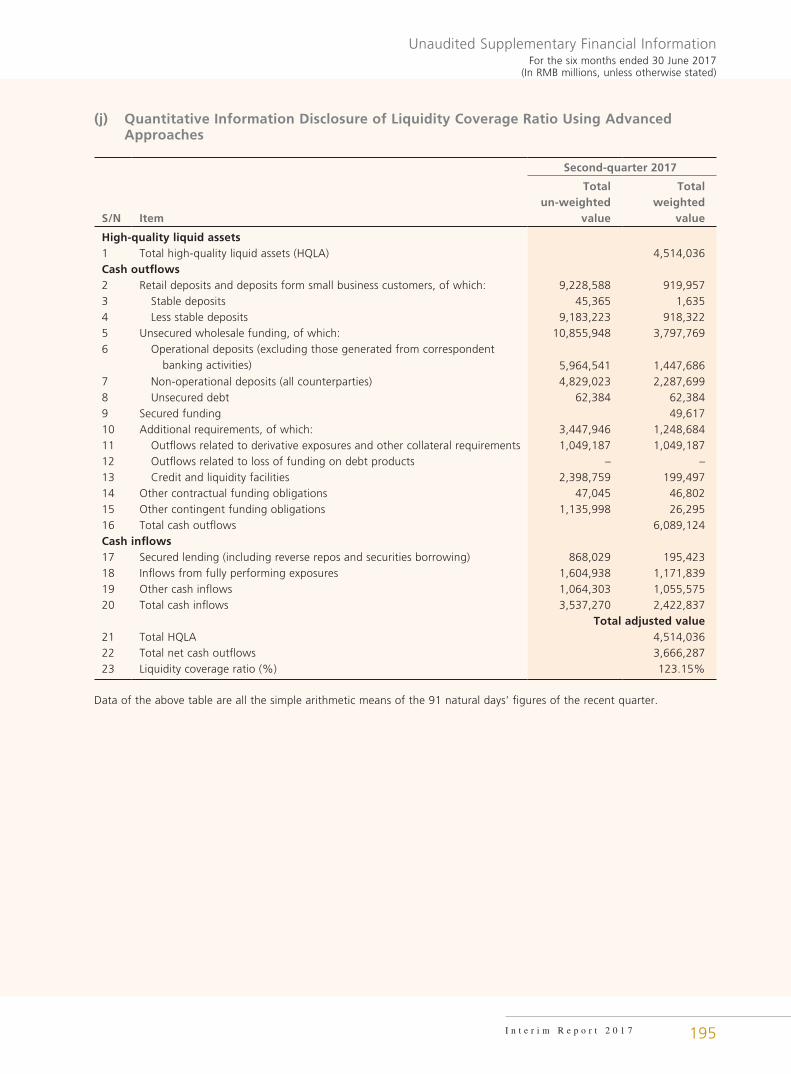
Unaudited Supplementary Financial InformationFor the six months ended 30 June 2017
(In RMB millions, unless otherwise stated)
195I n t e r i m R e p o r t 2 0 1 7
(j) Quantitative Information Disclosure of Liquidity Coverage Ratio Using Advanced Approaches
Second-quarter 2017
S/N Item
Total un-weighted
value
Total weighted
value
High-quality liquid assets1 Total high-quality liquid assets (HQLA) 4,514,036Cash outflows2 Retail deposits and deposits form small business customers, of which: 9,228,588 919,9573 Stable deposits 45,365 1,6354 Less stable deposits 9,183,223 918,3225 Unsecured wholesale funding, of which: 10,855,948 3,797,7696 Operational deposits (excluding those generated from correspondent
banking activities) 5,964,541 1,447,6867 Non-operational deposits (all counterparties) 4,829,023 2,287,6998 Unsecured debt 62,384 62,3849 Secured funding 49,61710 Additional requirements, of which: 3,447,946 1,248,68411 Outflows related to derivative exposures and other collateral requirements 1,049,187 1,049,18712 Outflows related to loss of funding on debt products – –13 Credit and liquidity facilities 2,398,759 199,49714 Other contractual funding obligations 47,045 46,80215 Other contingent funding obligations 1,135,998 26,29516 Total cash outflows 6,089,124Cash inflows17 Secured lending (including reverse repos and securities borrowing) 868,029 195,42318 Inflows from fully performing exposures 1,604,938 1,171,83919 Other cash inflows 1,064,303 1,055,57520 Total cash inflows 3,537,270 2,422,837
Total adjusted value21 Total HQLA 4,514,03622 Total net cash outflows 3,666,28723 Liquidity coverage ratio (%) 123.15%
Data of the above table are all the simple arithmetic means of the 91 natural days’ figures of the recent quarter.
List of Domestic and Overseas Branches and Offices
196
Domestic Institutions
GUANGXI AUTONOMOUS REGION BRANCHAddress: No. 15-1 Jiaoyu Road,
Nanning City, Guangxi Autonomous Region, China
Postcode: 530022Tel: 0771-5316617Fax: 0771-5316617/2806043
GUIZHOU PROVINCIAL BRANCHAddress: No. 200 Zhonghua North
Road, Guiyang City, Guizhou Province, China
Postcode: 550001Tel: 0851-88620004/88620018Fax: 0851-85963911
HAINAN PROVINCIAL BRANCHAddress: No. 54 Heping South
Road, Haikou City, Hainan Province, China
Postcode: 570203Tel: 0898-65303138/65342829Fax: 0898-65303138
HEBEI PROVINCIAL BRANCHAddress: Tower B, Zhonghua
Shangwu Tower, No. 188 Zhongshan West Road, Shijiazhuang City, Hebei Province, China
Postcode: 050051Tel: 0311-66001999/66000001Fax: 0311-66001889/66000002
HENAN PROVINCIAL BRANCHAddress: No. 99 Jingsan Road,
Zhengzhou City, Henan Province, China
Postcode: 450011Tel: 0371-65776888/65776808Fax: 0371-65776889/65776988
HEILONGJIANG PROVINCIAL BRANCHAddress: No. 218 Zhongyang Street,
Daoli District, Harbin City, Heilongjiang Province, China
Postcode: 150010Tel: 0451-84668023/84668577 (on duty)Fax: 0451-84698115
HUBEI PROVINCIAL BRANCHAddress: No. 31 Zhongbei Road,
Wuchang District, Wuhan City, Hubei Province, China
Postcode: 430071Tel: 027-69908676/69908658Fax: 027-69908040
HUNAN PROVINCIAL BRANCHAddress: No. 619 Furong Middle
Road Yi Duan, Changsha City, Hunan Province, China
Postcode: 410011Tel: 0731 -84428833/84420000Fax: 0731-84430039
JILIN PROVINCIAL BRANCHAddress: No. 9559 Renmin Avenue,
Changchun City, Jilin Province, China
Postcode: 130022Tel: 0431-89569718/89569712Fax: 0431-88923808
JIANGSU PROVINCIAL BRANCHAddress: No. 408 Zhongshan
South Road, Nanjing City, Jiangsu Province, China
Postcode: 210006Tel: 025-52858000Fax: 025-52858111
JIANGXI PROVINCIAL BRANCHAddress: No. 233, Fuhe North Road,
Nanchang City, Jiangxi Province, China
Postcode: 330008Tel: 0791-86695682/86695018Fax: 0791-86695230
LIAONING PROVINCIAL BRANCHAddress: No. 88 Nanjing North
Road, Heping District, Shenyang City, Liaoning Province, China
Postcode: 110001Tel: 024-23491603Fax: 024-23491609
ANHUI PROVINCIAL BRANCHAddress: No. 189 Wuhu Road,
Hefei City, Anhui Province, China
Postcode: 230001Tel: 0551-62869178/62868101Fax: 0551-62868077
BEIJING MUNICIPAL BRANCHAddress: Tower B, Tianyin Mansion,
No. 2 Fuxingmen South Street, Xicheng District, Beijing, China
Postcode: 100031Tel: 010-66410579Fax: 010-66410579
CHONGQING MUNICIPAL BRANCHAddress: No. 9 Jiangnan Road,
Nan’an District, Chongqing, China
Postcode: 400060Tel: 023-62918002Fax: 023-62918059
DALIAN BRANCHAddress: No. 5 Zhongshan Square,
Dalian City, Liaoning Province, China
Postcode: 116001Tel: 0411-82378888/82378000Fax: 0411-82808377
FUJIAN PROVINCIAL BRANCHAddress: No. 108 Gutian Road,
Fuzhou City, Fujian Province, China
Postcode: 350005Tel: 0591-88087819/88087000Fax: 0591-83353905/83347074
GANSU PROVINCIAL BRANCHAddress: No. 408 Qingyang Road,
Chengguan District, Lanzhou City, Gansu Province, China
Postcode: 730030Tel: 0931-8434172Fax: 0931-8435166
GUANGDONG PROVINCIAL BRANCHAddress: No. 123 Yanjiangxi
Road, Guangzhou City, Guangdong Province, China
Postcode: 510120Tel: 020-81308130/81308123Fax: 020-81308789

197
List of Domestic and Overseas Branches and Offices
I n t e r i m R e p o r t 2 0 1 7
INNER MONGOLIA AUTONOMOUS REGION BRANCHAddress: No. 10 East 2nd Ring Road,
Xincheng District, Hohhot City, Inner Mongolia Autonomous Region, China
Postcode: 010060Tel: 0471-6940297Fax: 0471-6940048
NINGBO BRANCHAddress: No. 218 Zhongshan
West Road, Ningbo City, Zhejiang Province, China
Postcode: 315010Tel: 0574-87361162Fax: 0574-87361190
NINGXIA AUTONOMOUS REGION BRANCHAddress: No. 901 Huanghe East
Road, Jinfeng District, Yinchuan City, Ningxia Autonomous Region, China
Postcode: 750002Tel: 0951-5029200Fax: 0951-5042348
QINGDAO BRANCHAddress: No. 25 Shandong Road,
Shinan District, Qingdao City, Shandong Province, China
Postcode: 266071Tel: 0532-85809988-621031Fax: 0532-85814711
QINGHAI PROVINCIAL BRANCHAddress: No. 2 Shengli Road, Xining
City, Qinghai Province, China
Postcode: 810001Tel: 0971-6169722/6152326Fax: 0971-6152326
SHANDONG PROVINCIAL BRANCHAddress: No. 310 Jingsi Road, Jinan
City, Shandong Province, China
Postcode: 250001Tel: 0531-66681622Fax: 0531-87941749
SHANXI PROVINCIAL BRANCHAddress: No. 145 Yingze Street,
Taiyuan City, Shanxi Province, China
Postcode: 030001Tel: 0351-6248888/6248011Fax: 0351-6248004
SHAANXI PROVINCIAL BRANCHAddress: No. 395 Dongxin Street,
Xi’an City, Shaanxi Province, China
Postcode: 710004Tel: 029-87602608/87602630Fax: 029-87602999
SHANGHAI MUNICIPAL BRANCHAddress: No. 9 Pudong Avenue,
Pudong New District, Shanghai, China
Postcode: 200120Tel: 021-58885888Fax: 021-58886888
SHENZHEN BRANCHAddress: North Block Financial
Center, No. 5055 Shennan East Road, Luohu District, Shenzhen City, Guangdong Province, China
Postcode: 518015Tel: 0755-82246400Fax: 0755-82246247
SICHUAN PROVINCIAL BRANCHAddress: No. 35 Zongfu Road,
Jinjiang District, Chengdu City, Sichuan Province, China
Postcode: 610020Tel: 028-82866000Fax: 028-82866025
TIANJIN MUNICIPAL BRANCHAddress: No. 123 Weidi Road, Hexi
District, Tianjin, ChinaPostcode: 300074Tel: 022-28400648Fax: 022-28400123/022-28400647
XIAMEN BRANCHAddress: No. 17 Hubin North
Road, Xiamen City, Fujian Province, China
Postcode: 361012Tel: 0592-5292000Fax: 0592-5054663
XINJIANG AUTONOMOUS REGION BRANCHAddress: No. 231 Remin Road,
Tianshan District, Urumqi, Xinjiang Autonomous Region, China
Postcode: 830002Tel: 0991-5981888Fax: 0991-2828608
TIBET AUTONOMOUS REGION BRANCHAddress: No. 31 Jinzhu Mid-Rd.,
Lhasa, Tibet Autonomous Region
Postcode: 850000Tel: 0891-6898019/6898002Fax: 0891-6898001
YUNNAN PROVINCIAL BRANCHAddress: Bank Mansion, No. 395
Qingnian Road, Kunming City, Yunnan Province, China
Postcode: 650021Tel: 0871-65536325/65536313Fax: 0871-63134637
ZHEJIANG PROVINCIAL BRANCHAddress: No. 150 Zhonghe Middle
Road, Hangzhou City, Zhejiang Province, China
Postcode: 310009Tel: 0571-87803888Fax: 0571-87808207
ICBC Credit Suisse Asset Management Co., Ltd.Address: Tower A, Xinsheng Plaza,
No. 5 Financial Street, Xicheng District, Beijing, China
Postcode: 100033Tel: 010-66583333Fax: 010-66583158
ICBC Financial Leasing Co., Ltd.Address: E5AB, Finance Street,
No. 20 Plaza East Road, Economic Development Zone, Tianjin
Postcode: 300457Tel: 022-66283766/010-66105888Fax: 022-66224510/010-66105999
ICBC-AXA Assurance Co., Ltd.Address: 19/F Mirae Asset Tower,
No. 166 Lujiazui Ring Road, Pudong New Area, Shanghai
Postcode: 200120Tel: 021-5879-2288Fax: 021-5879-2299
Chongqing Bishan ICBC Rural Bank Co., Ltd.Address: No. 1 Aokang Avenue,
Bishan District, ChongqingPostcode: 402760Tel: 023-85297704Fax: 023-85297709
Zhejiang Pinghu ICBC Rural Bank Co., Ltd.Address: No. 258 Chengnan West
Road, Pinghu, Zhejiang Province
Postcode: 314200Tel: 0573-85139616Fax: 0573-85139626
List of Domestic and Overseas Branches and Offices
198
Overseas Institutions
Industrial and Commercial Bank of China Limited, Hanoi BranchAddress: 3rd Floor Daeha Business
Center, No. 360, Kim Ma Str., Ba Dinh Dist.,
Hanoi, VietnamEmail: [email protected]: +84-2462698888Fax: +84-2462699800SWIFT: ICBKVNVN
Industrial and Commercial Bank of China Limited, Vientiane BranchAddress: Asean Road, Home
No. 358, Unit12, Sibounheuang Village, Chanthabouly District, Vientiane Capital, Lao PDR
Email: [email protected]: +856-21258888Fax: +856-21258897SWIFT: ICBKLALA
Industrial and Commercial Bank of China Limited, Phnom Penh BranchAddress: No. 15, Preah Norodom
Boulevard, Phsar Thmey I, Duan Penh, Phnom Penh, Cambodia
Email: [email protected]: +855-23955880Fax: +855-23965268SWIFT: ICBKKHPP
Industrial and Commercial Bank of China Limited, Doha (QFC) BranchAddress: Level 20, Burj Doha Tower,
Al Corniche Street, West Bay, Doha, QatarP.O. BOX: 11217Email: [email protected]: +974-44072761Fax: +974-44072751SWIFT: ICBKQAQAXXX
Industrial and Commercial Bank of China Limited, Abu Dhabi BranchAddress: C903, Al Bateen Tower,
C6, Bainuna Street, P.O. Box 62108, Abu Dhabi, United Arab Emirates
Email: [email protected],Tel: +971-24998600Fax: +971-24998622SWIFT: ICBKAEAA
Industrial and Commercial Bank of China Limited, Dubai (DIFC) BranchAddress: Floor 5&6, Gate Village
Building 1, Dubai International Financial Center, Dubai,
United Arab EmiratesP.O. Box: 506856Email: [email protected]: +971-47031111Fax: +971-47031199SWIFT: ICBKAEAD
Industrial and Commercial Bank of China Limited, Karachi BranchAddress: 15th & 16th Floor, Ocean
Tower, G-3, Block-9, Scheme # 5, Main Clifton Road, Karachi, Pakistan.P.C:75600
Tel: +92-2135208988Fax: +92-2135208930SWIFT: ICBKPKKAXXX
Industrial and Commercial Bank of China Limited, Mumbai BranchAddress: 801, 8th Floor, A Wing,
One BKC, C-66, G Block, Bandra Kurla Complex, Bandra East, Mumbai-400051, IndiaEmail: [email protected]: +91-2271110300Fax: +91-2271110353SWIFT: ICBKINBBXXX
Industrial and Commercial Bank of China Limited, Hong Kong BranchAddress: 33/F, ICBC Tower, 3
Garden Road, Central, Hong Kong
Email: [email protected]: + 852-25881188Fax: + 852-25881160SWIFT: ICBKHKHH
Industrial and Commercial Bank of China Limited, Singapore BranchAddress: 6 Raffles Quay #12-01,
Singapore 048580Email: [email protected]: +65-65381066Fax: +65-65381370SWIFT: ICBKSGSG
Industrial and Commercial Bank of China Limited, Tokyo BranchAddress: 2-1 Marunouchi 1-Chome,
Chiyoda-Ku Tokyo, 100-0005, JapanEmail: [email protected]: +813-52232088Fax: +813-52198502SWIFT: ICBKJPJT
Industrial and Commercial Bank of China Limited, Seoul BranchAddress: 16th Floor, Taepyeongno
Bldg., #73 Sejong-daero, Jung-gu, Seoul 100-767, Korea
Email: [email protected]: +82-237886670Fax: +82-27553748SWIFT: ICBKKRSE
Industrial and Commercial Bank of China Limited, Busan BranchAddress: 1st Floor, Samsung Fire &
Marine Insurance Bldg., #184, Jungang-daero, Dong-gu, Busan 601-728, Korea
Email: [email protected]: +82-514638868Fax: +82-514636880SWIFT: ICBKKRSE
199
List of Domestic and Overseas Branches and Offices
I n t e r i m R e p o r t 2 0 1 7
Industrial and Commercial Bank of China Limited, Yangon BranchAddress: 459 Pyay Road, Kamayut
Township, Yangon, Myanmar
Tel: +95-12306306-8810, 8830, 8821
Fax: +95-12306305-8805, 8806SWIFT: ICBKMMMY
Industrial and Commercial Bank of China Limited, Riyadh BranchAddress: Level 7&8, Al Faisaliah
Tower, Building No: 7277-King Fahad Road Al Olaya, Zip Code:12212, Additional No.:3333, Unit No.: 95, Riyadh, Kingdom of Saudi Arabia
Email: [email protected]: +966-112899800Fax: +966-112899879SWIFT: ICBKSARI
Industrial and Commercial Bank of China Limited, Kuwait BranchAddress: Building 2A (Al-Tijaria
Tower), Floor 7, Al-Soor Street, Al-Morqab, Block3, Kuwait City, Kuwait
Tel: +965-22281777Fax: +965-22281799SWIFT: ICBKKWKW
Industrial and Commercial Bank of China Limited, Sydney BranchAddress: Level 1, 220 George
Street, Sydney NSW 2000, Australia
Email: [email protected]: +612-94755588Fax: +612-92333982SWIFT: ICBKAU2S
Industrial and Commercial Bank of China Limited, Luxembourg BranchAddress: 32, Boulevard Royal,
L-2449 Luxembourg, B.P.278 L-2012 Luxembourg
Email: [email protected]: +352-2686661Fax: +352-26866666SWIFT: ICBKLULL
Industrial and Commercial Bank of China Limited, Frankfurt BranchAddress: Bockenheimer Anlage 15,
60322 Frankfurt am Main, Germany
Email: [email protected]: +49-6950604700Fax: +49-6950604708SWIFT: ICBKDEFF
Industrial and Commercial Bank of China Limited, London BranchAddress: 81 King William Street,
London EC4N 7BG, UKEmail: [email protected]: +44-2073978888Fax: +44-2073978890SWIFT: ICBKGB3L
Industrial and Commercial Bank of China Limited, New York BranchAddress: 725 Fifth Avenue, 20th
Floor, New York, NY 10022, USA
Email: [email protected]: +1-2128387799Fax: +1-2128386688SWIFT: ICBKUS33
Industrial and Commercial Bank of China (Asia) LimitedAddress: 33/F, ICBC Tower, 3
Garden Road, Central, Hong Kong
Email: [email protected]: +852-35108888Fax: +852-28051166SWIFT: UBHKHKHH
ICBC International Holdings LimitedAddress: 37/F, ICBC Tower, 3
Garden Road, Central, Hong Kong
Email: [email protected]: +852-26833888Fax: +852-26833900SWIFT: ICBHHKHH
Industrial and Commercial Bank of China (Macau) LimitedAddress: 18th Floor, ICBC Tower,
Macau Landmark, 555 Avenida da Amizade, MacauEmail: [email protected]: +853-28555222Fax: +853-28338064SWIFT: ICBKMOMX
Industrial and Commercial Bank of China (Malaysia) BerhadAddress: Level 35, Menara Maxis,
Kuala Lumpur City Centre, 50088 Kuala Lumpur, Malaysia
Email: [email protected]: +603-23013399Fax: +603-23013388SWIFT: ICBKMYKL
PT. Bank ICBC IndonesiaAddress: 32nd TCT ICBC Tower,
Jl. MH.Thamrin No. 81, Jakarta Pusat 10310, Indonesia
Email: [email protected]: +62-2123556000Fax: +62-2131996010SWIFT: ICBKIDJA
Industrial and Commercial Bank of China (Thai) Public Company LimitedAddress: 622 Emporium Tower
11th–13th Fl., Sukhumvit Road, Khlong Ton, Khlong Toei, Bangkok, ThailandTel: +66-26295588Fax: +66-26639888SWIFT: ICBKTHBK

List of Domestic and Overseas Branches and Offices
200
Industrial and Commercial Bank of China (Almaty) Joint Stock CompanyAddress: 150/230, Abai/Turgut
Ozal Street, Almaty, Kazakhstan. 050046
Email: [email protected]: +7-7272377085Fax: +7-7272377070SWIFT: ICBKKZKX
Industrial and Commercial Bank of China (New Zealand) LimitedAddress: Level 11, 188 Quay Street,
Auckland 1010, New ZealandEmail: [email protected]: +64-93747288Fax: +64-93747287SWIFT: ICBKNZ2A
ICBC (London) PLCAddress: 81 King William Street,
London EC4N 7BG, UKEmail: [email protected]: +44-2073978888Fax: +44-2073978899SWIFT: ICBKGB2L
Industrial and Commercial Bank of China (Europe) S.A.Address: 32, Boulevard Royal,
L-2449 LuxembourgEmail: [email protected]: +352-2686661Fax: +352-26866666SWIFT: ICBKLULU
Bank ICBC(Joint Stock Company)Address: Building 29,
Serebryanicheskaya embankment, Moscow, Russia Federation 109028
Email: [email protected]: +7-4952873099Fax: +7-4952873098SWIFT: ICBKRUMM
ICBC Standard Bank PLCAddress: 20 Gresham Street,
London, United Kingdom, EC2V 7JE
Email: [email protected]: +44-2031455000Fax: +44-2031895000SWIFT: SBLLGB2L
ICBC Turkey Bank Anonim SirketiAddress: Maslak Mah. Dereboyu,
2 Caddesi No: 13 34398 Sariyer, İSTANBUL
Email: [email protected]: +90-2123355162SWIFT: ICBKTRISXXX
Industrial and Commercial Bank of China (USA) NAAddress: 1633 Broadway, 28th
Floor, New York, NY 10019
Email: [email protected]: +1-2122388208Fax: +1-2122193211SWIFT: ICBKUS3N
Industrial and Commercial Bank of China Financial Services LLCAddress: 1633 Broadway, 28th
Floor, New York, NY, 10019, USA
Email: [email protected]: +1-2129937300Fax: +1-2129937349SWIFT: ICBKUS33FIN, ICBKUS3F
Industrial and Commercial Bank of China Mexico S.A.Address: Paseo de la Reforma 250, Piso 18, Col. Juarez, C.P.06600, Del. Cuauhtemoc, Ciudad de MexicoEmail: [email protected]: +52-5541253388SWIFT: ICBKMXMM
Industrial and Commercial Bank of China (Canada)Address: Unit 3710, Bay Adelaide
Centre, 333 Bay Street, Toronto, Ontario, M5H 2R2, Canada
Email: [email protected]: +1-4163665588Fax: +1-4166072000SWIFT: ICBKCAT2
Industrial and Commercial Bank of China (Argentina) S.A.Address: Blvd. Cecilia Grierson
355, (C1107 CPG) Buenos Aires, Argentina
Email: [email protected]: +54-1148209022Fax: +54-1148201901SWIFT: ICBKARBA
Industrial and Commercial Bank of China (Brasil) S.A.Address: Av. Brigadeiro Faria Lima,
3477-Block B-6 andar-SAO PAULO/SP-Brasil
Email: [email protected]: +55-1123956600Fax: +55-1123956600SWIFT: ICBKBRSP
ICBC PERU BANKAddress: Av.Juan de Arona 151,
Oficina 202, San Isidro, Lima27, Perú
Email: [email protected]: +51-16316801Fax: +51-16316803SWIFT: ICBKPEPL
Industrial and Commercial Bank of China Limited, African Representative OfficeAddress: 47 Price Drive, Constantia,
Cape Town, South Africa, 7806
Email: [email protected]: +27-212008006,
+27-761837882Fax: +27-212008012

2017Interim Report
Stock Code: 1398USD Preference Shares Stock Code: 4603EUR Preference Shares Stock Code: 4604RMB Preference Shares Stock Code: 84602
中國北京市西城區復興門內大街55號 郵編:100140No.55 Fuxingmennei Avenue, Xicheng District, Beijing, PRC
www.icbc.com.cn, www.icbc-ltd.comPost Code: 100140
2017Interim
Report