Integrating Web and Business Data
32
Spinning Web and Business Data into Gold
-
Upload
safe-software -
Category
Technology
-
view
85 -
download
2
Transcript of Integrating Web and Business Data

Spinning Web and Business Data
into Gold
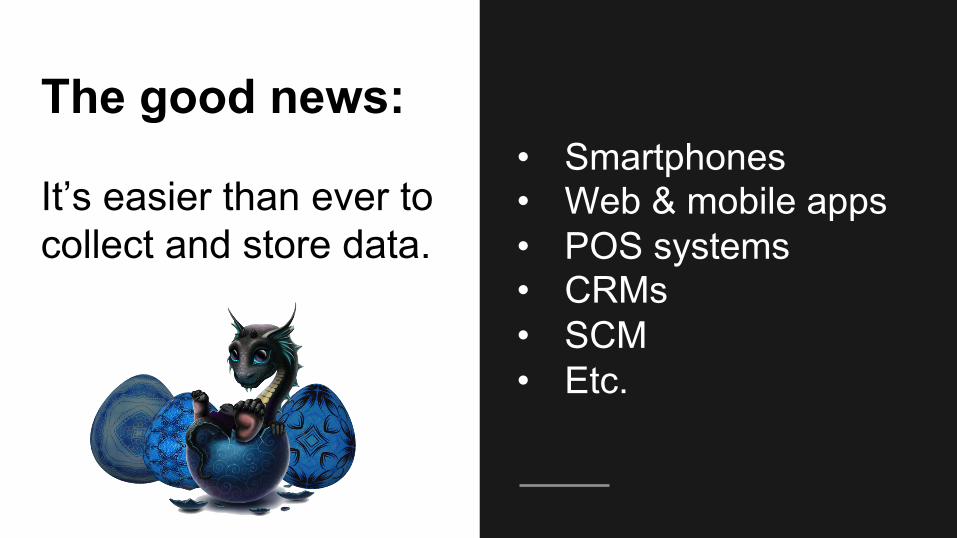
The good news: It’s easier than ever to collect and store data.
• Smartphones • Web & mobile apps • POS systems • CRMs • SCM • Etc.

The bad news: This data must be tamed!

Turning Frogs into Princes
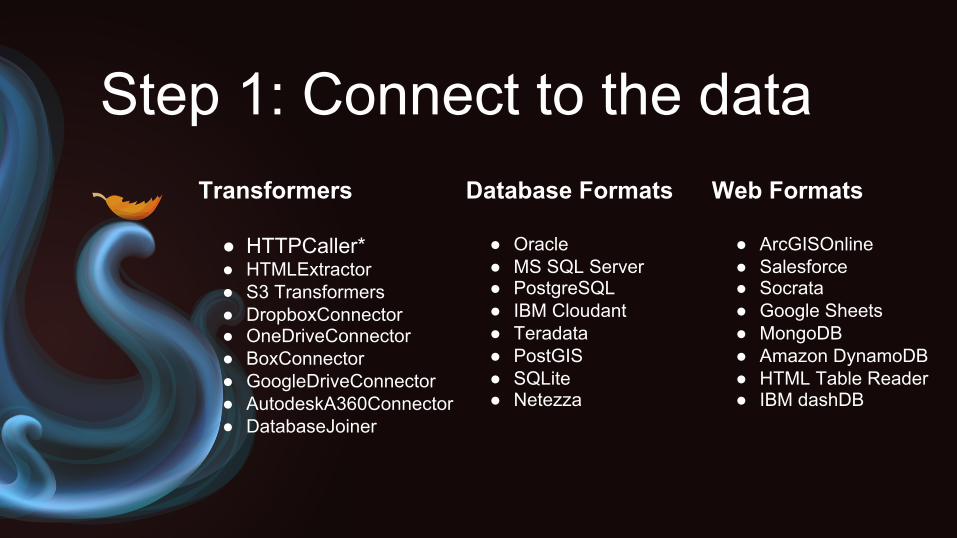
Step 1: Connect to the data Transformers ● HTTPCaller* ● HTMLExtractor ● S3 Transformers ● DropboxConnector ● OneDriveConnector ● BoxConnector ● GoogleDriveConnector ● AutodeskA360Connector ● DatabaseJoiner
Database Formats ● Oracle ● MS SQL Server ● PostgreSQL ● IBM Cloudant ● Teradata ● PostGIS ● SQLite ● Netezza
Web Formats ● ArcGISOnline ● Salesforce ● Socrata ● Google Sheets ● MongoDB ● Amazon DynamoDB ● HTML Table Reader ● IBM dashDB
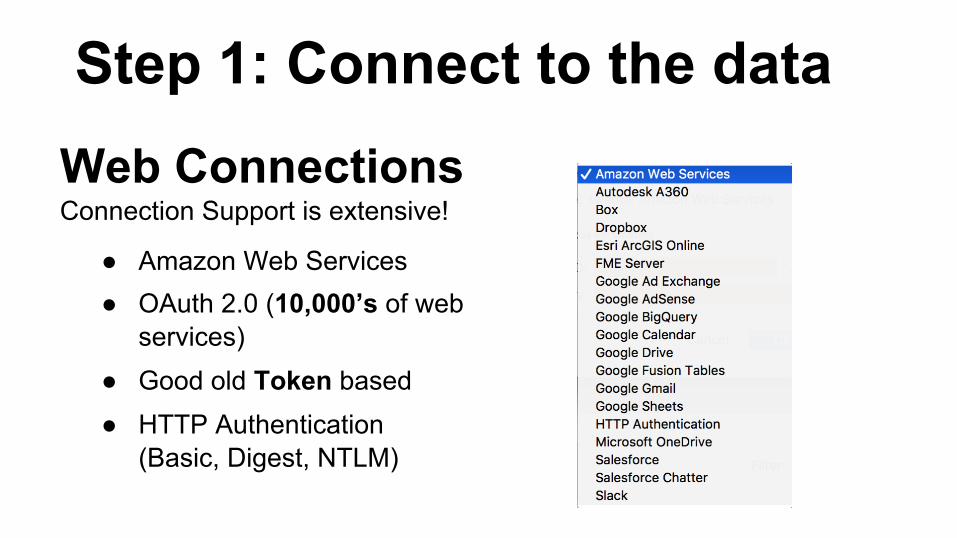
● Amazon Web Services
● OAuth 2.0 (10,000’s of web services)
● Good old Token based
● HTTP Authentication (Basic, Digest, NTLM)
Web Connections Connection Support is extensive!
Step 1: Connect to the data
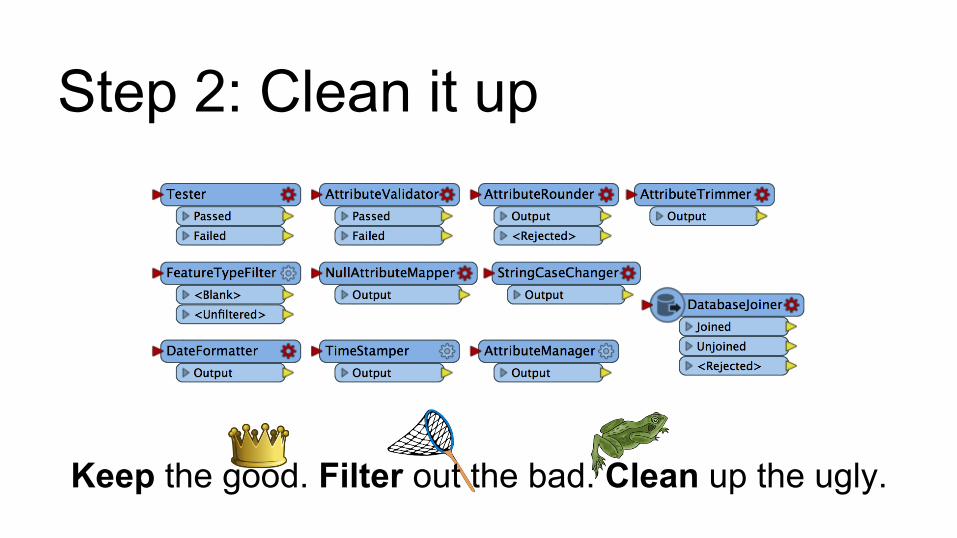
Step 2: Clean it up
Keep the good. Filter out the bad. Clean up the ugly.
Step 3: Make it presentable
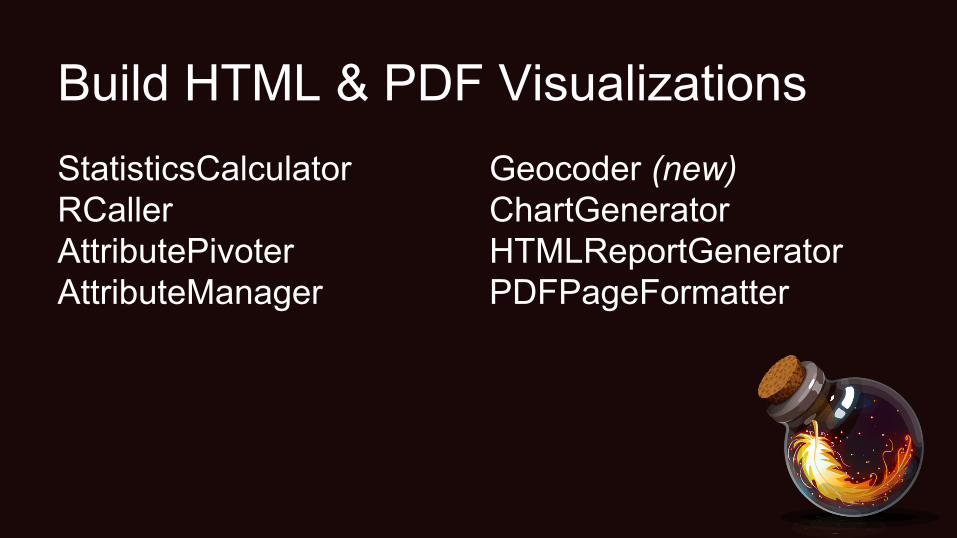
Build HTML & PDF Visualizations StatisticsCalculator RCaller AttributePivoter AttributeManager
Geocoder (new) ChartGenerator HTMLReportGenerator PDFPageFormatter

Story: Mapping Eye Health
University of Oxford
Jasleen Kaur Jolly, MSc BSc(Hons) MCOptom
On the blog: fme.ly/eyes
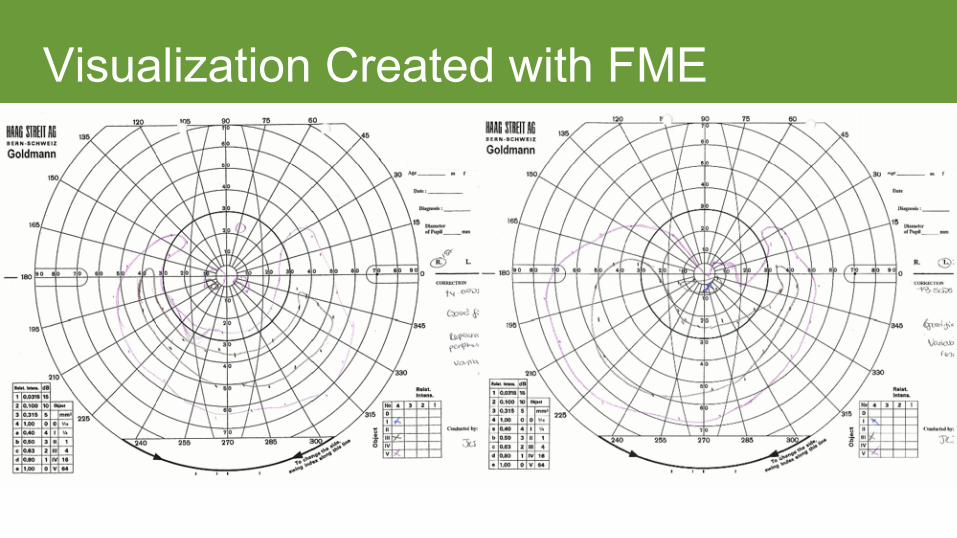
Visualization Created with FME
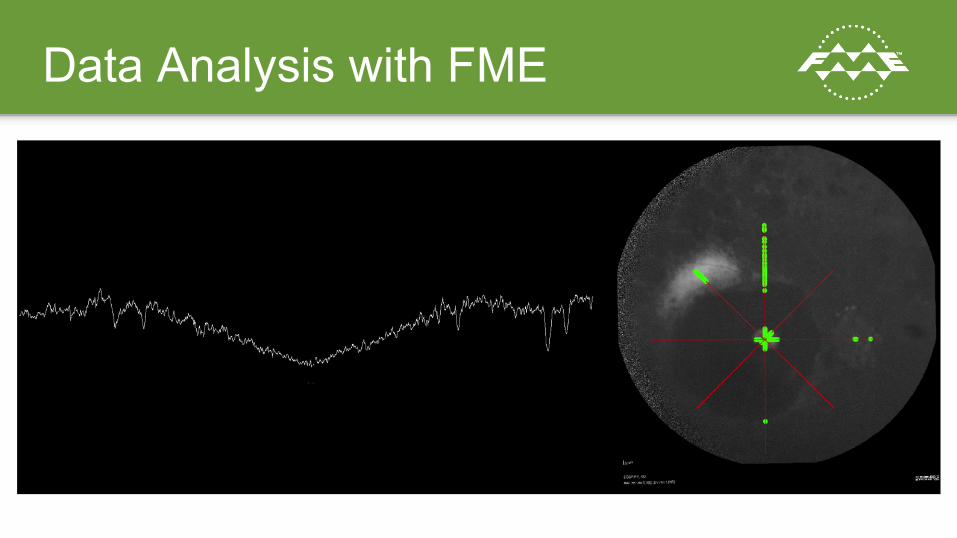
Data Analysis with FME
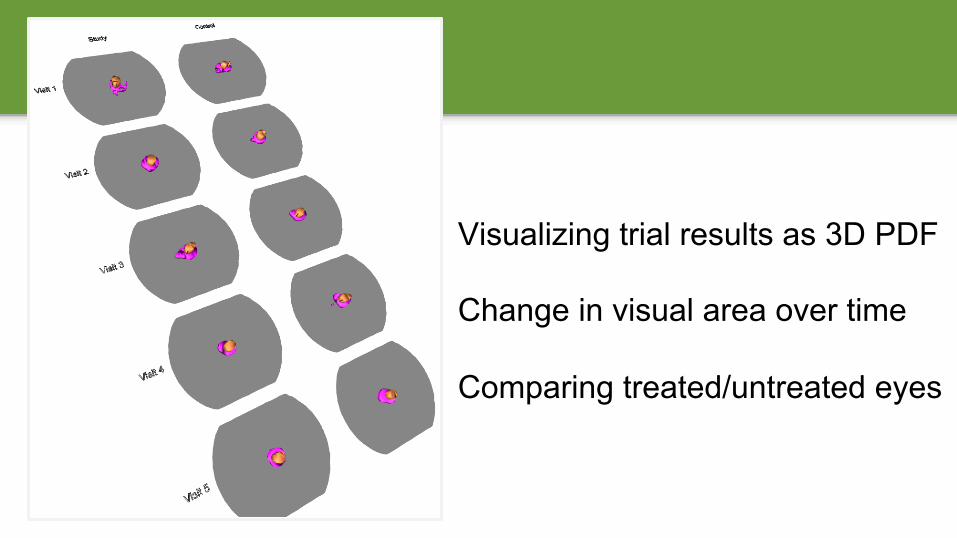
Visualizing trial results as 3D PDF Change in visual area over time Comparing treated/untreated eyes
Visualization Sorcery
Business Intelligence:
Making decisions by turning data into meaningful information.
Business Intelligence:
Making decisions by turning data into meaningful information.
Geospatial
^ geospatial
^
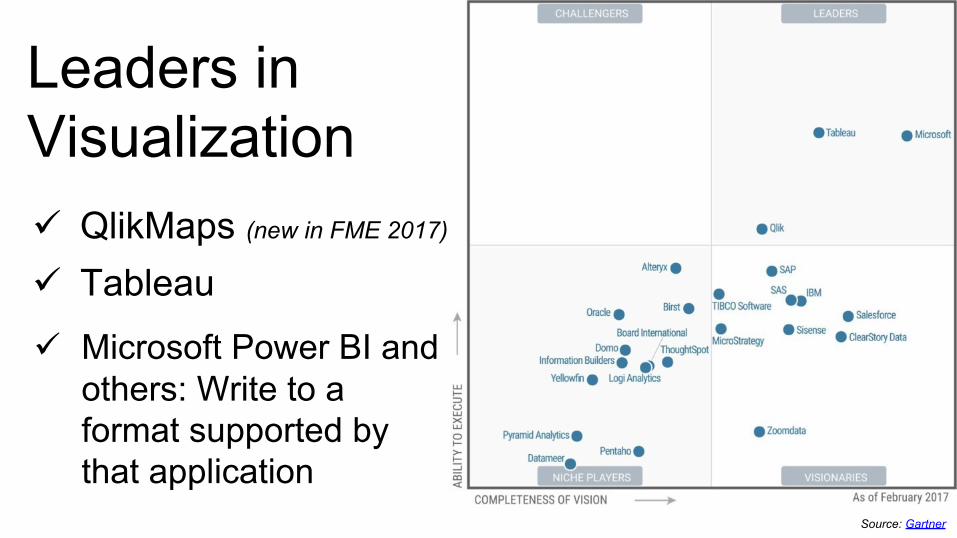
Leaders in Visualization ü QlikMaps (new in FME 2017)
ü Tableau
ü Microsoft Power BI and others: Write to a format supported by that application
Source: Gartner
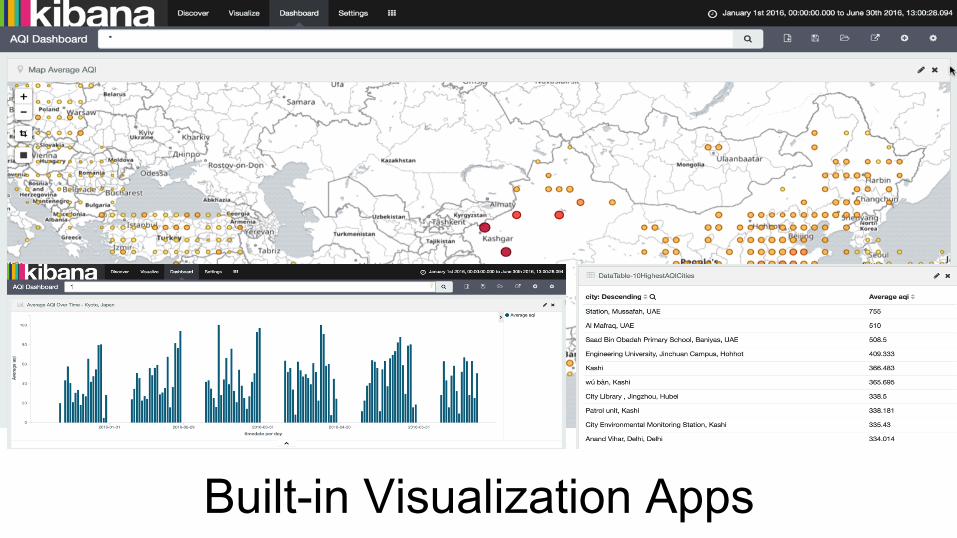
Built-in Visualization Apps
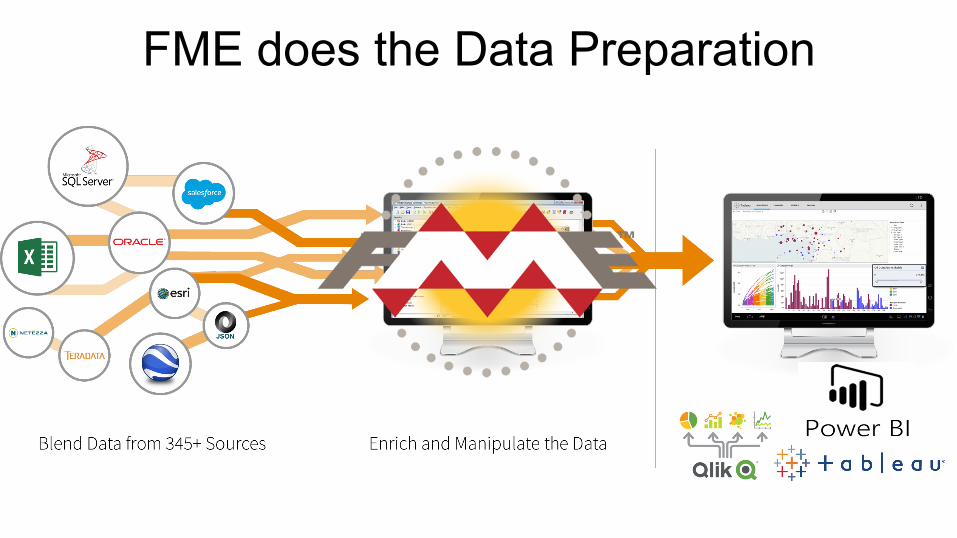
FME does the Data Preparation
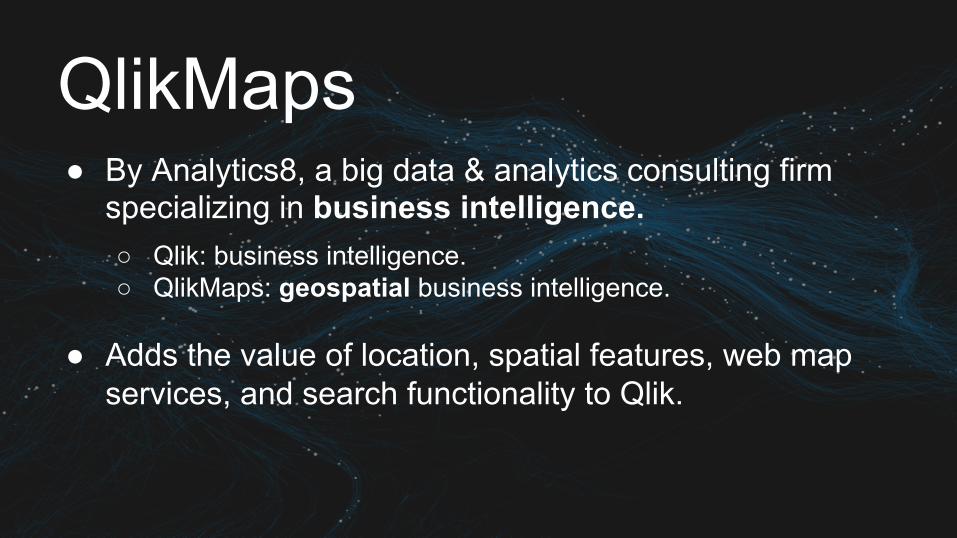
QlikMaps ● By Analytics8, a big data & analytics consulting firm
specializing in business intelligence. ○ Qlik: business intelligence. ○ QlikMaps: geospatial business intelligence.
● Adds the value of location, spatial features, web map services, and search functionality to Qlik.
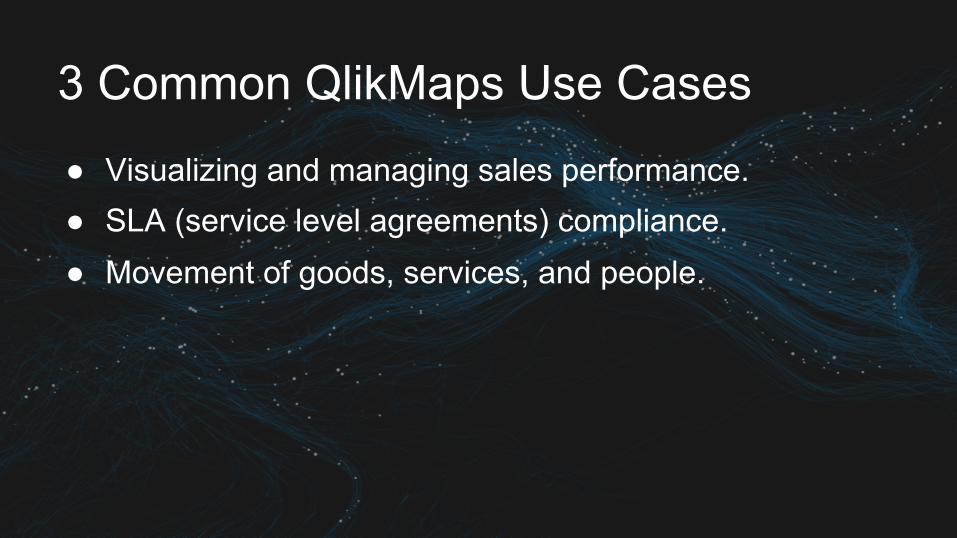
3 Common QlikMaps Use Cases
● Visualizing and managing sales performance. ● SLA (service level agreements) compliance. ● Movement of goods, services, and people.

Challenge: Passenger Flow at the Airport ● Track and improve passenger flow.
● Increase passenger satisfaction.
● Gain insight into commercial opportunities for retailers.
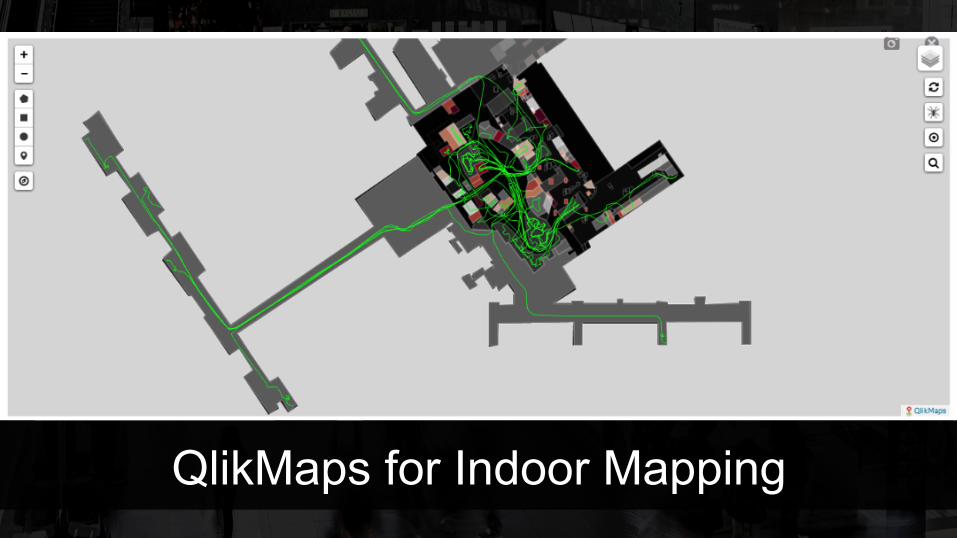
QlikMaps for Indoor Mapping
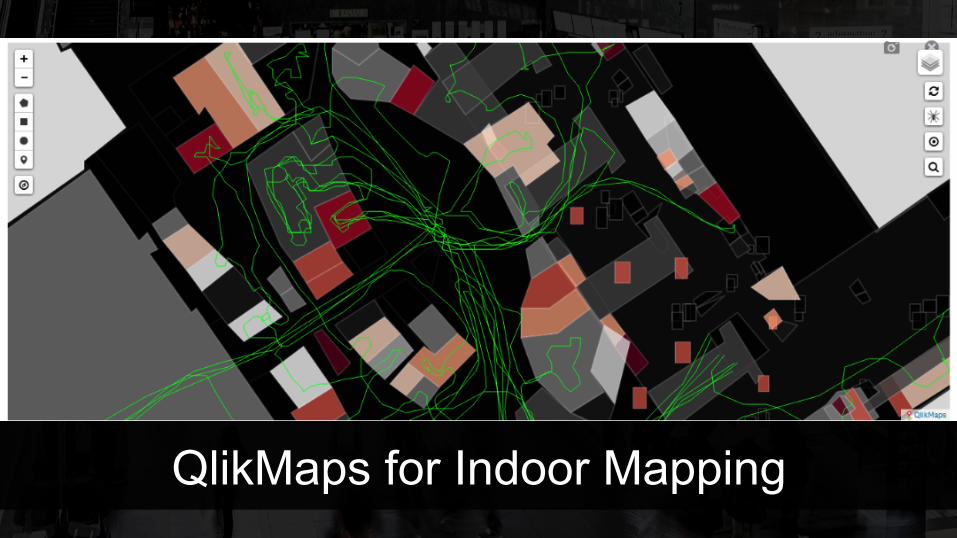
QlikMaps for Indoor Mapping
Challenge: Visualizing Sales KPIs
● Visualize by product group + by geographies.
● Look for regional trends.
● Cluster by distance.
● Present location analytics for meaningful insights.
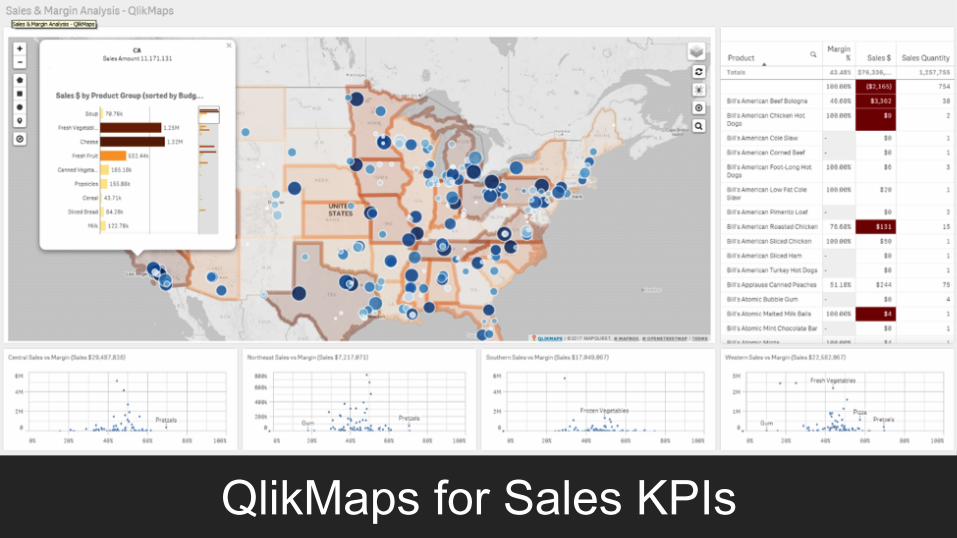
QlikMaps for Sales KPIs
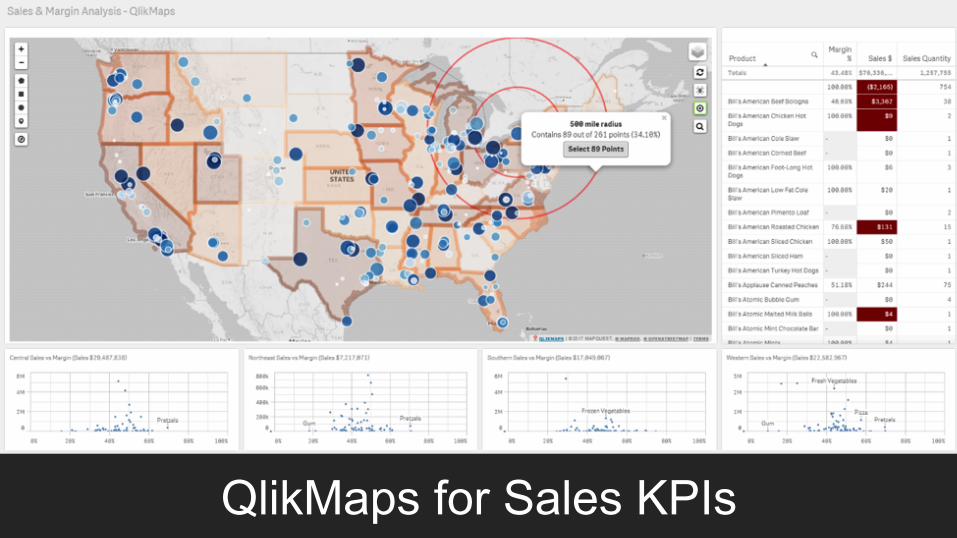
QlikMaps for Sales KPIs

Story: Dashboards for Infrastructure Asset
Management
Henri Veldhuis Jurgen van Tiggelen
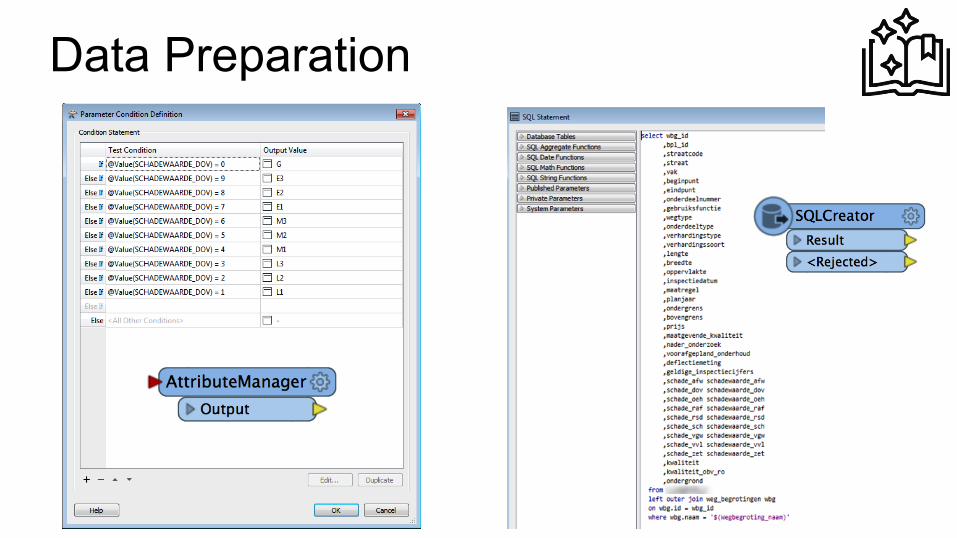
Data Preparation
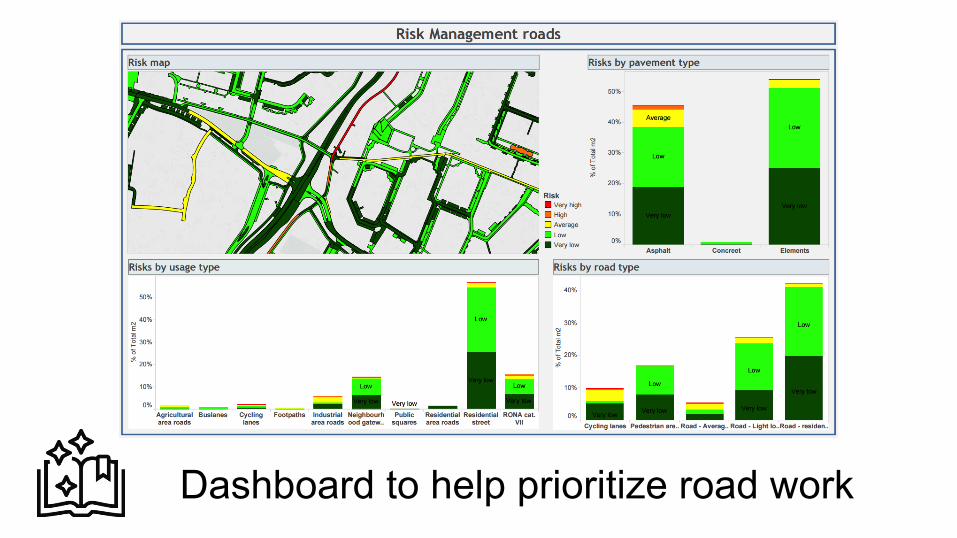
Dashboard to help prioritize road work
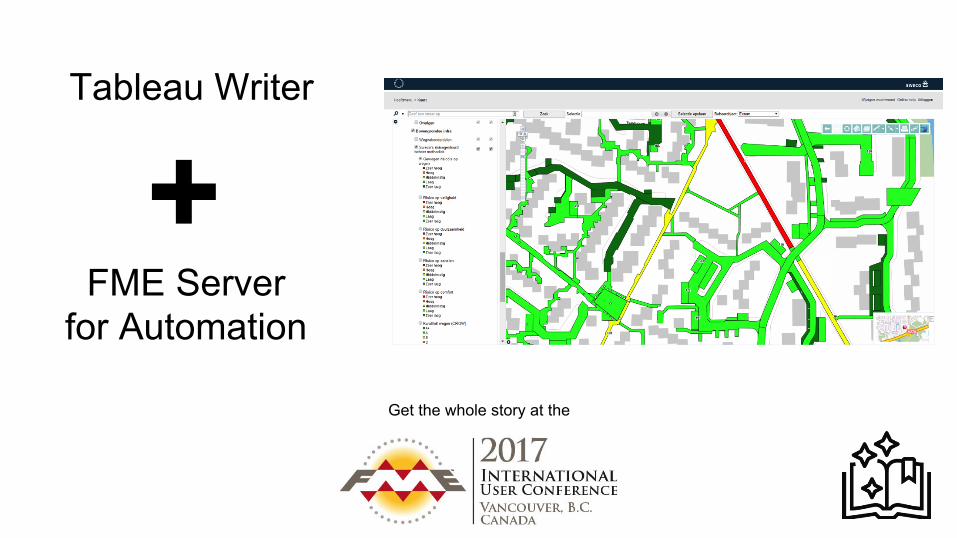
Tableau Writer
FME Server for Automation
+ Get the whole story at the

Questions?
● Tableau resources
safe.com/tableau
● HTML transformers blog
fme.ly/html
● FME + web blog
fme.ly/web
● Data quality checklist
fme.ly/quality
● FME + QlikMaps tutorial
fme.ly/qlikmaps