Instructions for use - HUSCAP...The direct shear box (DSB) test has been employed most commonly...
12
Instructions for use Title Strength of Sand as Observed in a Newly Developed Direct Shear Box Apparatus Author(s) Shibuya, Satoru; Mitachi, Toshiyuki; Kitajima, Akira; Takada, Masuo Citation 北海道大學工學部研究報告, 166, 1-11 Issue Date 1993-10-29 Doc URL http://hdl.handle.net/2115/42386 Type bulletin (article) File Information 166_1-12.pdf Hokkaido University Collection of Scholarly and Academic Papers : HUSCAP
Transcript of Instructions for use - HUSCAP...The direct shear box (DSB) test has been employed most commonly...

Instructions for use
Title Strength of Sand as Observed in a Newly Developed Direct Shear Box Apparatus
Author(s) Shibuya, Satoru; Mitachi, Toshiyuki; Kitajima, Akira; Takada, Masuo
Citation 北海道大學工學部研究報告, 166, 1-11
Issue Date 1993-10-29
Doc URL http://hdl.handle.net/2115/42386
Type bulletin (article)
File Information 166_1-12.pdf
Hokkaido University Collection of Scholarly and Academic Papers : HUSCAP
北海道大学工学部研究報告
第166号(i’:F一成5年)
Bulletin of the Faculty of Efigineering
Hol〈kaido University No. 166 (1993)
StreRgth of Sand as Observed in a newly Deveioped Direct Shear Box Apparatus
Satoru SHIBuyAi), Toshiyuki MITAcm2), Aklra KITAyMA3)
and Masuo TAKADA‘)
〈Received October 30, 1992)
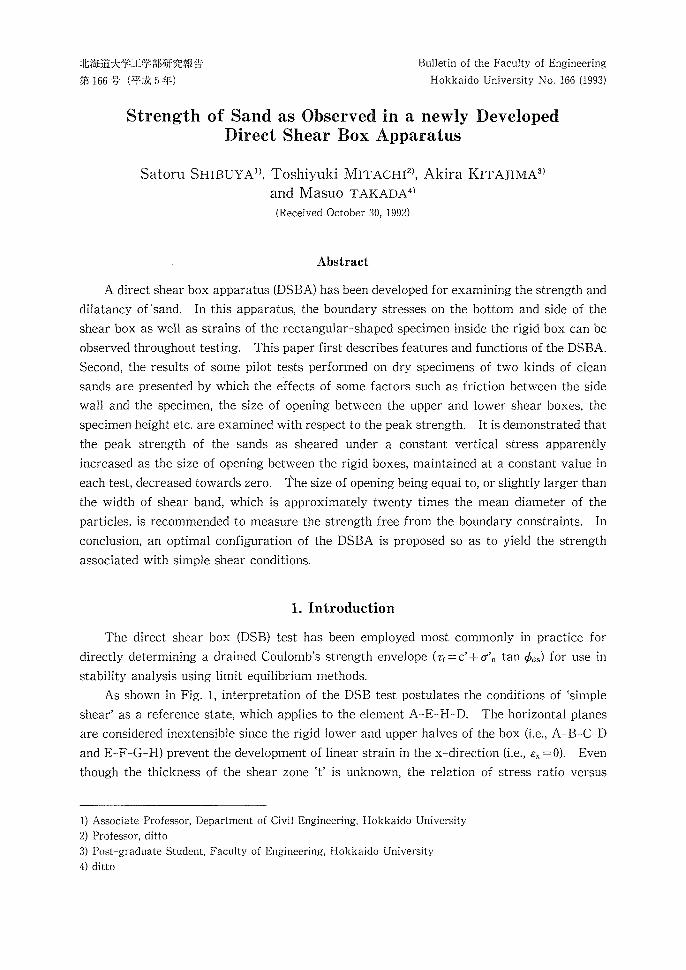
Abstract
A direct shear box apparatus (DSBA) has been developed for examining the strength and
dilataRcy of’saRd. ln this apparatus, the boundary stresses on the bottom and side of the
shear box as well as strains of £he rectangular-shaped speciraen lnside the rigid box can be
observed throughout testing. This paper first describes features and functions of the DSBA.
SecoRd, the results of some pilot tests performed on dry specimens of two 1〈inds of clean
sands are presented by which the effects of some factors such as friction between the side
wal} and the specimen, the size of opening between the upper and lower shear boxes, the
specimen helght etc. are examined with respect to the peak strength. lt is deinonstrated that
the peal〈 strength of tke sands as sheared under a constant vertical stress apparently
incr.eased as the size of opening between the rigid boxes, maintained at a constant value ln
each test, decreased towards zero. The size of opening being equal to, or slightly larger than
tke width of shear band, which is approximately twenty tiines the mean diameter of the
particles, is recommended to measure tke strength free from the boundary constraints. ln
conclusioR, an optimal configuration of the DSBA is proposed so as to yield the strength
associated with simple shear conditions.
1. lntroduction
The direct shear box (DSB) test has been employed most commonly in practice for
directly determining a drained Coulomb’s strength envelope (Tf ==c’十6’n tan ipds) for use in
stability analysis using limit equilibrium methods.
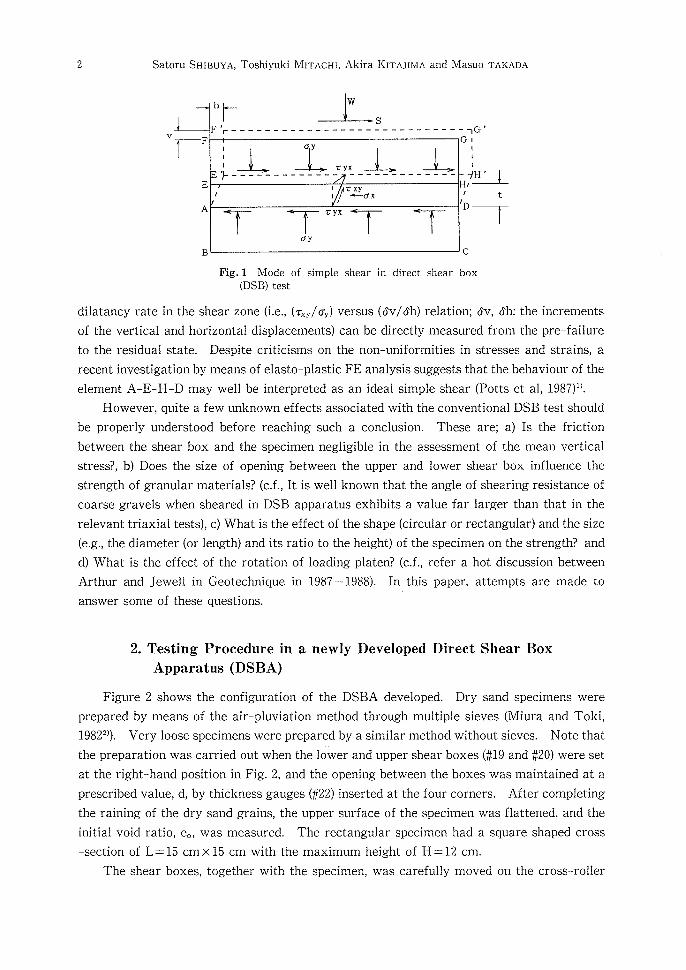
As shown in Fig. 1, interpretation of the DSB test postulates the conditions of tsimple
shear’ as a reference state, which applies to the element A-E-H-D. The horizontal p}anes
are considered inextensible since the rigid lower aRd upper halves of the box (i.e., A-B-C-D
and E-F-G-H) prevent the development of linear strain in the x-clirection (i.e., e. :e). Even
though the thicl〈ness of the shear zone “t’ is unknown, the relation of s£ress ratio versus
1) Associate Professor, Department of Civil Engineering, Hokkaido University
2) Professor, ditto
3) Post-graduate Student, Faculty of Engineering, Kokkaido University
4) ditto
2 Satoru SHIBuyA, Toshiyuki IMI’rAcl-li, Akira KiTAJiMA and Masuo TAKADA
v
hヒW S
F’「一一一一一一一一一一一一一一一一一一一一一一一一一一一一rG’
。LL工面⊥。._L「F
@ E
@ A
@ B
’ 1グ職・・
GI
τyx
ミy
Fig.1 Mode of simple shear in direct shear box (DSB) test
dilatancy rate in tke shear zoRe (i.e., (T.,/6y) versus (cSv/6h) relation; 6v, 6h: the increments
of the vertical and horizontal displacements) can be directly measured from the pre-failure
to the residual state. Despite criticisms on the non-uniformities in stresses and strains, a
recent investigation by means of elasto-plastic FE analysis suggests that the behaviour of the
elemene A-E-H-D may well be interpreted as an ideal simple shear (Potts et al, 1987)i).
However, quite a few unknown effects associated with the conventional DSB test should
be properly understood before reaching such a conclusioR. These are; a) ls the friction
between the shear box and the specimen negligible in the assessment of the mean vertical
stress?, b) Does the size of opening between the upper and lower shear box infiuence the
strength of graRular materials? (c.f., lt is well known that the angle of shearing resistance of
coarse gravels wheR sheared in DSB apparatus exhibits a value far larger than that iR the
relevant triaxiai tests), c) What is the effect of the shape (circular or rectangular) and the size
(e.g., the diameter (or length) and its ratio to the height) of the specimeR on the strength? and
d) Wha£ is the effect of the rotation of loading platen? (c.f., refer a hot discussion betweeR
Arthur and Jewell in Geotechnique in 1987-1988). ln this paper, attempts are made to
answer some of these questions.
2. Testing Procedure in a newly Developed Direct Shear Box
Appara加s(DSBA)
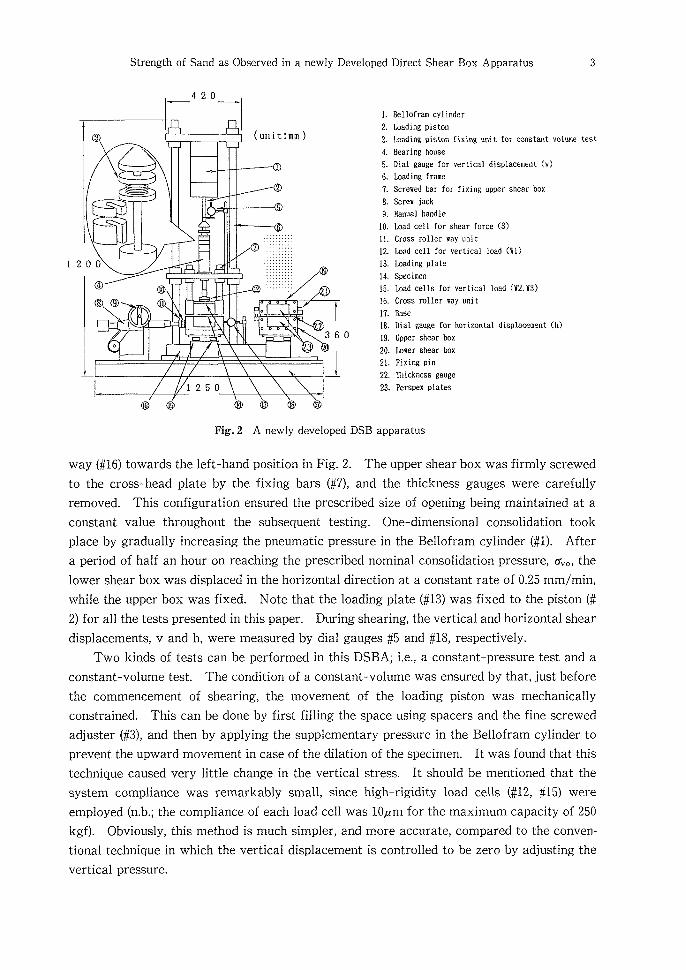
Figure 2 shows the configuration of the DSBA developed. Dry sand specimens were
prepared by meaRs of the air-pluviation method through muitipie sieves (Miura and Toki,
19822}). Very loose specimens were prepared by a similar method wiehout sieves. Note that
the preparation was carried out when the lower and upper shear boxes (#19 and #2e) were set
at the right-haltd position in Fig. 2, and the opening between the boxes was maiRtained at a
prescribed value, d, by thickness gauges (#22) inserted at the four corners. After comp}eting
the raining of the dry saRd grains, the upper surface of the specimen was flattened, and £he
initial void ratio, eo, was measured. The rectangu}ar specimen had a square shaped cross
-section of L=15 cm×15 cm with the maximum height of H = 12 cm
The shear boxes, together with the specimeR, was carefully moved on the cross-ro}ler
Strength of Sand as Observed in a newly Developed Direct Shear Box Apparatus 3
42e
1
i
③ (unrt:mm)
@①@②一導
00
C ⑳
G⑨ ⑳
⑫iii iii
o o
o o
36Vo↓
1250R ⑮ ⑭ ⑬ ⑱ ⑳
」
1. Bellofram cylinder
2. 1.oading piston
3, LoadiAg piston fixiAg uRit for constaAt vslllme test
4. Beari調g ho日se
5. Dial gauge for vertical displacement (v)
6, Loading frarne
Z Screwed bar for fixing upper shear box
8. Screve jack
9,・ Manual handle
10, boad cell for shear ferce (S)
H. Cross roller way unit
12. Loati cell for vertical load (Wl)
13, Loading plate
14, Specimen
l5. Load cells for vertical load (ve2, ff3)
16. Cross roller way unit
17. Base
1g. Dial gauge fer horizonta1 displaceasent (h)
19, Vpper shear box
20. bover shear box
21. Fixing pin
22, Thickness gauge
23. Perspex plates
Fig. 2 A newly developed DSB apparatus
way (#16) towards ehe left一一hand position in Fig. 2. The upper shear box was firmly screwed
to the cross-head plate by the fixing bars (#7), and the thicl〈ness gauges were carefully
rernoved. This coRfiguration ensured the prescribed size of opening being maintained at a
constant value throughout the subsequent testing. One-dimensional coRsolidation took
place by gradually increasiRg the pneumatic pressure in the Beilofram cylinder (#1). After
a period of haif an hour on reaching the prescribed nominal consoiidation pressure, cr.o, the
lower shear box was displaced in the horizontal direction at a constant rate of O.25 mm/min,
while the upper bex was fixed. Note that the loading plate (#13) was fixed to the piston (#
2) for alkhe tests preseRted ln this paper. During shearing, the vertical and horizontal shear
displacements, v and h, were measured by dial gauges #5 and #18, respectively.
Two 1〈inds of tests can be performed in this DSBA; i.e., a constant-pressure test and a
constant-volume test. The condition of a constaRt-volume was ensured by that, just before
the cemmencement of shearing, the movement of the loading piston was mechanically
constrained. This can be done by first fiiliRg the space using spacers and the fine screwed
adjuster (#3), and tken by applying the supplementary pressure in the Bellofram cylinder to
prevent the upward movement in case of the dilation of the specimen. lt was found that this
eechnique caused very }ittle change in the vertical stress. lt should be mentioned that the
system compliance was femarkably small, since high-rigidity load cells (#12, #15) were
employed (n.b.; the compiiance of each load cell was iOptm for the maximum capacity of 250
kgf). Obviously, this method is much simpler, and more accurate, compared to the conven-
tional technique in which the vertica} displacement is controlled to be zero by adjusting the
vertical pressure.
4 Satoru SHIBuyA, Toshiyuki MITAcHI, Akira KITAJIMA and Masuo TAKADA
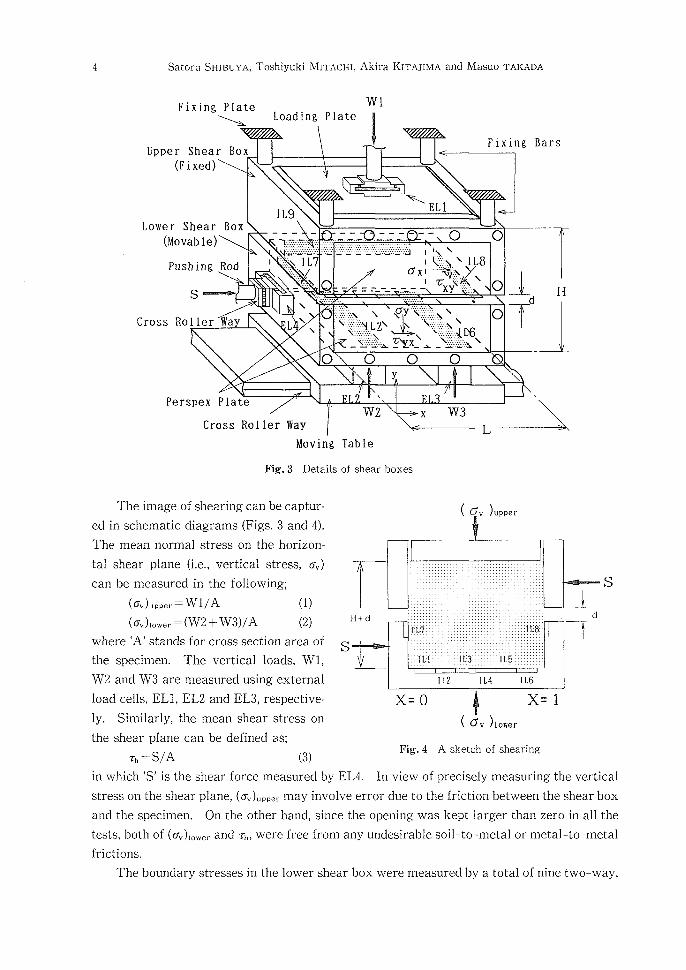
FixiBg Plate x Loading Plate
Bpper Shear Box (Fixed)
Wl
Lower Shear Box (Movable)
g
lL9
、細工
泌Ω
Fixing Bars
Pushing .Rod
Spti A
Cross Roller’Way
N
x
’‘i一一.
EL圭
Lx
㎜開 ≠pこ=.=.一 。
暴、\
脳8o
_..,
J...昌_≦::::::ね 1
σXI
Iel wwL
慧・……………P邊………嚢……1……毯≡…奏
d
qTH
o o
Perspex Plate
Cross Roller Way
o oy
N
W2 x W3L
Moving Table
Fig.3 Details of shear boxes
The image of shearing can be captur’ (cr, )uppered in schematic diagrams (Figs. 3 and 4).
The mean normal stress on the horizon一
蹴欝欝蹄∴丁.iiiiiiiiiiiiiii蘂iiiiiiiiiiiii蒙iiii l s
d (6v)iower= (W2十W3)/A (2) t
where “A’ stands for cross section area of s
the specimen. The vertical loads, Wl,
W2 and W3 are measured using external
i野dl盤。蕪雛1濫二喩 X=0(魯dv)_X”1
the shear plane can be defined as; Fig. 4 A sketch of shearing
T,= S/A (3)in which tS’ is the shear force measured by EL4. ln view of precisely measuring the vertical
stress on the shear plane, (6.).,,er may involve error due to the friction between the shear box
and the specimen. On the other hand, since the opening was kept larger than zero in all the
tests, both of (6v)ie.er and Th, were free from any undesirable soil-to-metal or metal-to-metal
frictions.
The boundary stresses in the lower shear box were measured by a total of nine two-way,
H寺d 頭i i晦i
奄撃猿F ii垂≒ii 鎚輯i
{12 IL4 IL6
Strength of Sand as Observed in a newly Developed Direct Shear Box Apparatus 5
high-rigidity load cells of ILI through IL9 (Fig. 3); i.e., the distribution of the vertical stress,
(crv)inner, together with the relevant shear stress, can be measured by ILI through IL6, each
of which is equipped with a plate of 2.16 cm in width and 13 cm in length. Similarly, the
normal stress on the vertica} plane, ifh, is detected by IL7, 8 and 9, each haviRg the dimension
of 1 cm in width and i3 cm iR length.
In most of tests, the side walls of the shear box were lubricated using latex membranes.
In this case, markers are installed on the membranes in the front. Though the results are not
presented in this paper, the local movement of sand inside the boxes can be 1〈nown by tracing
the movemeRt of the markers.
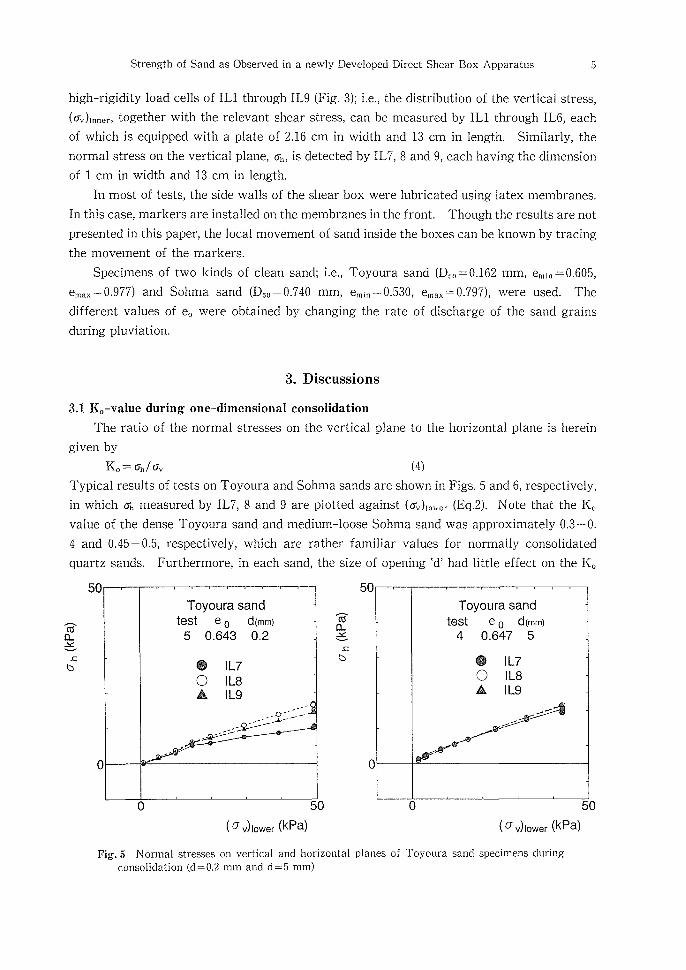
Specimens of two kiRds of c}ean saRd; i.e., Toyoura sand (E}so=e.162 mm, emin==O.605,
emax=O.977) aRd Sohma sand (Dso=e.740 mm, e.in=O.53e, e.,.:=e.797), were used. The
different values of eo were obtained by changing the rate of discharge of the sand grains
during pluviation.
3. Disc”ssions
3.1 K,一value during one一一dimensional conselidation
The ratio of the normal stresses on the vertical plane to the horizontal plane is herein
given by
Ko=6h/6v (4)Typical results of tests on Toyoura and Sohma sands are shown in Figs. 5 and 6, respectively,
in which crh measured by IL7, 8 and 9 are plotted against (cr.)i,.,, (Eq.2). Note that the Ko
value of the deRse Toyoura sand and medium-loose Sohma sand was approximately e.3-O.
4 and O.45-O.5, respectively, which are rather familiar values for Rormally consolidated
quartz sands. Furtherrnore, in each sand, the size of opening td’ had little effect on the K.
50rrTrew-r-rv-m 50
(住図)ニb
o
Toyoura sandtesセ eo d(mm)
5 0,643 0.2
齢 比7
O IL8盒 IL9
’@’
, ρ 旧
^〆
r-0’一1〆 〆’ 一▲〆
D, 揀m〆
o
( a v)iower (kPa)
50
(氏M>ぬ
b
o
Toyoura sandtest e o d(mm>
4 0.647 5
⑭ lL7○ ;L8
血 lL9
!ノ
∠U
o
( a v) Eower (kPa)
50
Fig. 5 Normal stresses on vertical and horizontal planes of Toyoura sand specimens during
consolidation (d :O,2 mm and d= 5 mm)
6 Satoru SHIBuyA, Toshiyuki MiTAcm, Akira KiTAJIMA and Masuo TAKADA
(乱臣)お
b
50
o
Sohma sand
test eo d(mm)
11 0.711 5
..A ,’ /D二8/,γ
,二!
〆㎡ρ多
e
( O v)lower (kPa)
50
A血Mv=b
50
o
Sohma saRd
狽?st eo d(阻m)
@16 0.701 0.2
o
( a v) iower (kPa)
50
Fig.6 Normal stresses on vertica王and horizontal planes of Sohma sand specimens during
consolidation (d=O.2 mm and d ;5 mm)
一value. This iRdicates that the opening of d==5 mm did not cause harmful non-uniformity
of stresses even at the edge of the poteRtial shear plane.
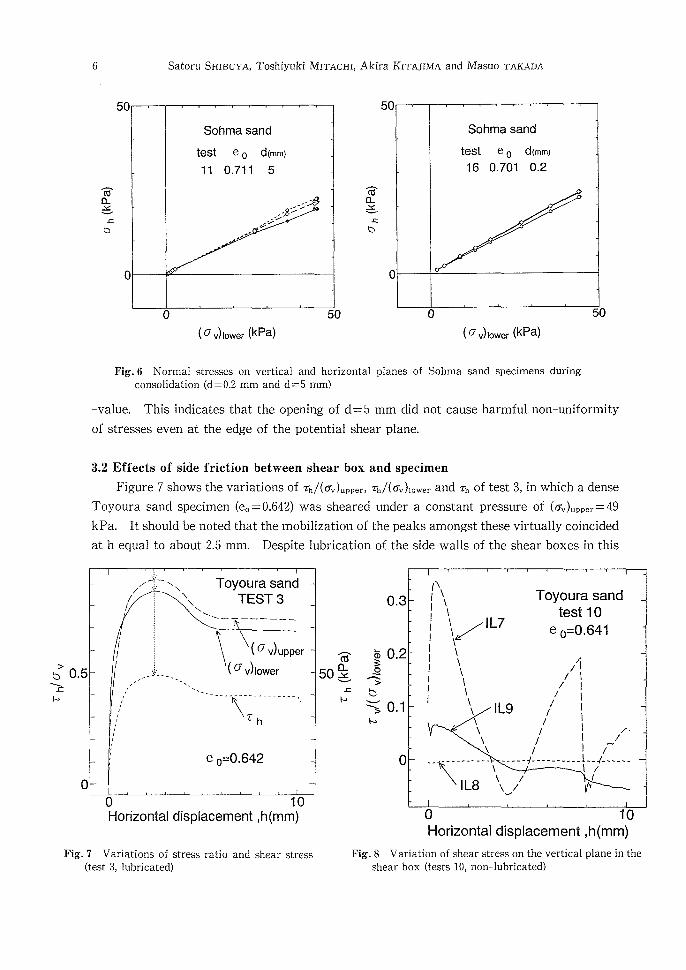
3.2 Effects of side friction between shear box and specimen
Figure 7 shows the variatioRs of Th/(cr.).,,er, Th/(6.)iower and Th of test 3, in which a dense
Toyoura sand specimen (e,=:O.642) was sheared uRder a conseant pressure of (cr.)upper=49
kPa. lt should be noted that the mobilization of the peaks amoRgst these virtually coincided
at h equal to about 2.5 mm. Despite lubricatioR of the side walls of the shear boxes in this
>
b>
O.5
o
.iJsi・ 1.3:HS xx. Toyoura sand
f/1 XIItx. ’;一EST 3
1 ×’x.s-r一.一.一一一h
触\(。認・per
i tt-一it’”一一Nss-N
ltl
l/” Fitk,,, ”X
lt
l eo=O.642
Horizontal dispiacement ,h(mni)
G
50隻 Nl:
O.3
ts O.2 )
零
巳xyD O.3
o
tN
iNi N
i
f
l
f
l
l
t
i
l
VN
1
\ノL7XNx
NX
x/lLg
x x
N
x
lし8 \/
v
ノ
_曜_一C_轄一一一一甲一__L一..IL一一一一.
Toyoura sand tesM O
e o=O.641
/1
/l
I I / i
/ i
/ 1 ノ/・
l /
{
vy
/
Fig.7 Variations of stress ratio and shear stress
(test 3, lubricated)
O 10 Horizontai displacement ,h(mrn)
Fig. 8 Variation of shear stress on the vertical plane in the
shear box (tests le, non-lubricated)
Strength of Sand as Observed in a newly Developed Direct Shear Box Apparatus 7
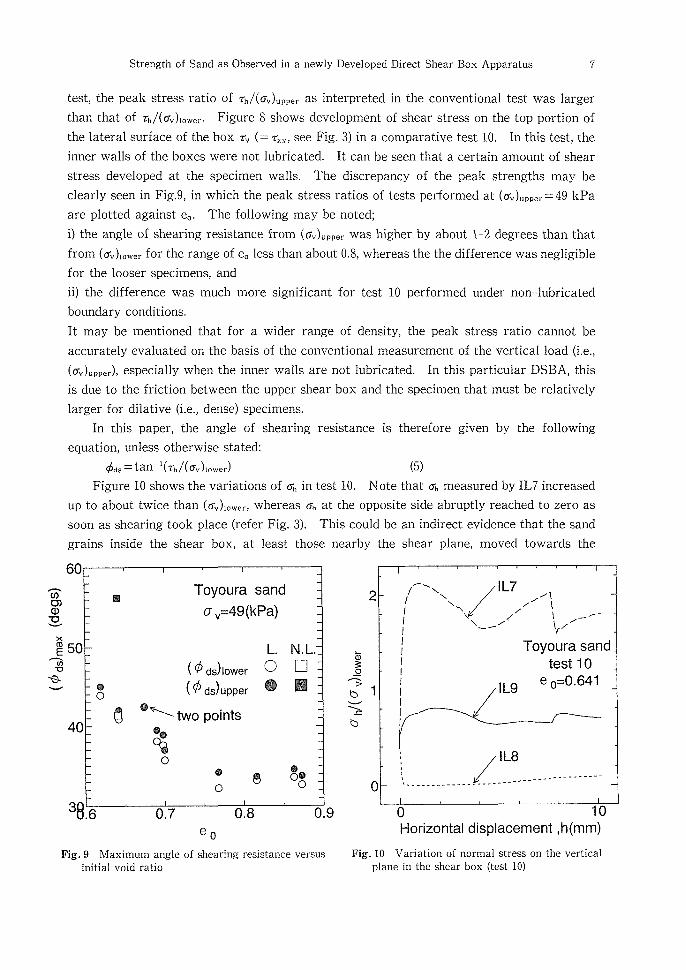
test, the peak stress ratio of Th/(cv)up,e, as interpreted in the conventional test was larger
than that of Th/(6v)iower. Figure 8 shows development of shear stress on the top portion of
the lateral surface of tke box rv (=T.,, see Fig. 3) in a comparative test 10. IR this test, the
inner wails of the boxes were not lubricated. lt can be seeR that a certain amount of shear
stress developed at the specimen walls. The discrepancy of the peak strengths may be
cleariy seen in Fig.9, in which the peak styess ratios of tests performed at (6v)upper :49 kPa
are plotted against eo. The following may be noted;
i) the angle of shearing reslstance from (tiv)upper was higher by about !-2 degrees than that
from (6v)iower for the range of eo less than about O.8, whereas the the difference was negligible
for the looser specimens, and
ii) the difference was much more significant for test 10 performed under non-lubricated
boundary conditions.
It may be meRtioned that for a wider range of density, the peak stress ratio cannot be
accurately evaluated oR the basis of the conventional measurement of the vertical }oad (i.e.,
(6v)upper), especially when the inner wails are not lubricated. ln this particular DSBA, this
is due to the friction between the upper shear box and the specimen that must be relatively
larger for dilative (i.e., dense) specimens.
In this paper, the angle of sheariRg resistance is therefore given by the following
equation, unless otherwise stated:
dids=tan-i(Th/(crv)iower) (5) Figure 10 shows the variations of sh in test IO. Note that 6h measured by IL7 increased
up £o about twice than (crv)iower, whereas 6h at the opposite side abruptly reached to zero as
soon as shearing took place (refer Flg. 3). This could be an indirect evidence that the sand
grains inside the shear box, at least those nearby the shear plane, moved towards the
60
菖
豊
建50
Aw’
sv
40
@
o
園
es
Toyoura sand a ,= 49(kPa)
L
(¢’d$)lower O
(¢ds)upper tw
@X two points
亀
o
@ 8
0
N.し.
D懸
@
o@ o
38.Lt一一“Mkrmkrm-o.7 O.8 O.9
eo
Fig. 9 Maximum angle of shearing resistance versus
initial void ratio
2
お
藁
Si苦
o
1へ\∴/1/…
1 Toyoura sand[ tes摂OI
l’ /IL9 eo=O.64111
N..一一一一一”一一m“r/一一一一LE9’
O 10 Norizontai displacement ,h(rrim)
Fig. IO Variation of normal stress on the vertical
plane in the shear box (test IO}
8 Satoru SHIBuyA, Toshiyuki MiTAcm, Akira KiTAJIMA and Masue TAKADA
δ
20,5今b }
o
f
t
i
/f̀
x.Toyoura sand
-
一 ’一
SL@pm T
Lrv一一」s
〆 ” 一 { v 一 一t
//
//
/ tests e o d(mm) ノ
/ 30.6423 L. ノノ 一一一IO O.641 3 N.し,
/
Horizontal displacement ,h(mm)
1.5毎 ε
≧
だ
G窪 §
冨
0.5モ5
壼
琶
0 >
Fig. 11 Variations of stress ratio and vertical
disp3acement in tests 3 and 10
L Φ
9今b 、 Φ c.⊆
今b)
2
G
〔;ヨ
test e o a v(kpa) HIL〈cmicm)
10 O.64i 49 G 2/15
.
A霞
tst
06
ノ
otw
[1 1]
A h=Omm( ¢ ds)max
Ah :10B3 rn
K’1
㌦ノ
X
Fig. 12 Distribution of normal stress on the
bottom of lower shear box in tests 3.
1
direction of the applied shear stress, Th. Accordingly, the horizontal direction may not be the
direction of zero-extension 〈refer Fig. 1). The tendency was more significant for tests
having lubricated boundary (i.e., soft boundary) conditions.
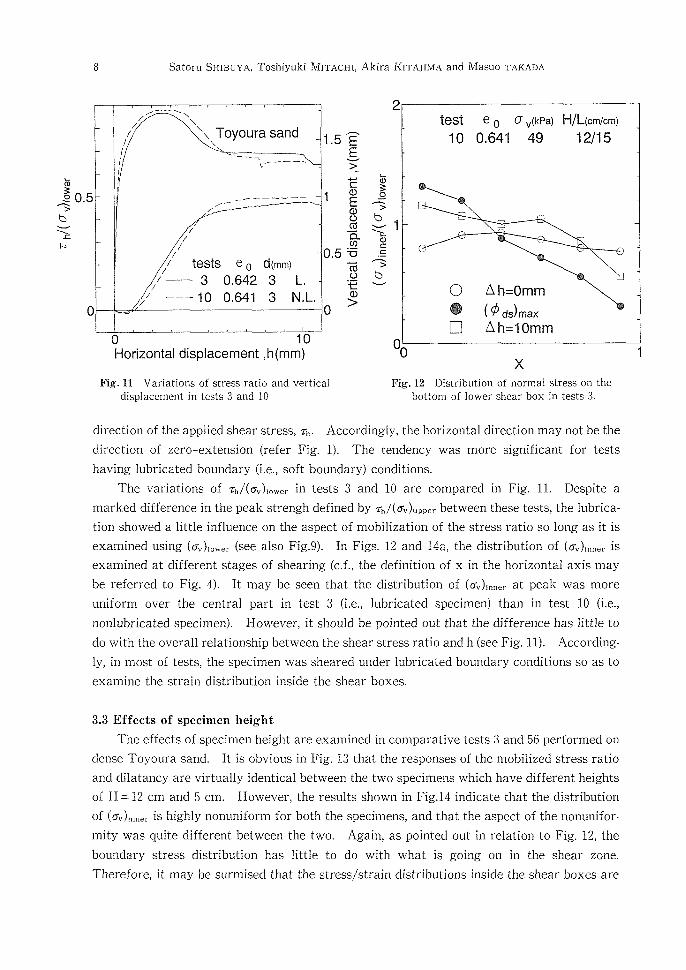
The variations of Th/(crv)iowe, in tests 3 and le are compared in Fig. 11. 1)espite a
marked difference in the peak strengh defined by Th/(cr.).,,e, between these tests, the lubrica-
tion showed a little iRfluence on the aspect of mobilization of the stress ratio so long as it is
examined using (cr.)i,.,, (see also Fig.9). ln Figs. 12 and 14a, the distribution of (6.)inner is
examined at different stages of shearing (c.f., the definition of x in the horizontal axis may
be referred to Fig. 4). lt may be seen that the distribution of (crv)inner at peak was more
uniform over the central part in test 3 (i.e., lubricated specimen) than in test 10 (i.e.,
nonlubricated specimen). However, it should be pointed out that the djfference has little to
do with the overall relationship between the shear stress ratio aRd h (see Fig. 11). According-
ly, in most of tests, the specimen was sheared under lubricated boundary conditions so as to
examine the strain distribution inside the shear boxes.
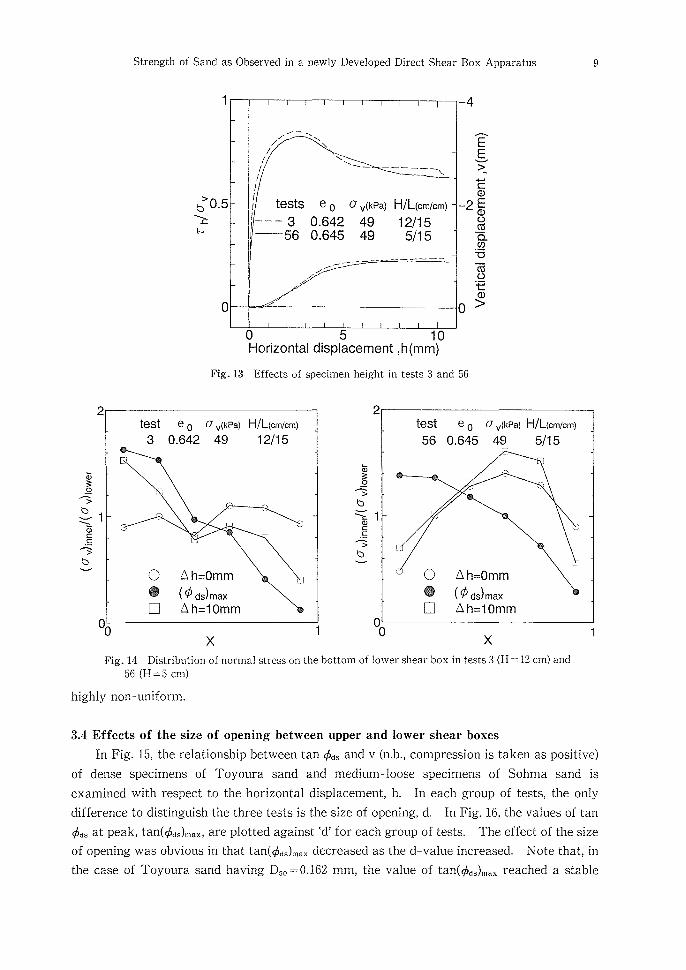
3.3 Effeets ef specimen height
The effects of specimen height are examined in comparative tests 3 and 56 performed on
dense Toyoura sand. lt is obvious in Fig. !3 that the responses of the mobilized stress ratio
and dilatancy are virtually identical between the two specimens which have different heights
of H :!2 cm and 5 crn. However, the results shown in Fig.i4 indicate that the distribution
of (crv)tnner is highiy nonuniform for both the specimens, and that the aspect of the nonunifor-
mity was quite different between the two. Again, as pointed out in relation to Fig. 12, the
beundary stress distribution has little to do with what is going on in the shear zone.
Therefore, it may be surmised亡hat the stress/strain distribu亡ions inside the shear boxes are
Strength of Sand as Observed in a newly Developed Direct Shear Box Apparatus 9
1
b’ O.5
]
o
/!『\\ / \ / / \ 1/ 、}i1/
1tests e。σ,(・・。)
ほ一一一3 0.642 49
56 0.645 49
Y
HIL(cm/cm>
12/155/1 5
ク
keti 一 一 t
一4
∈
∈
》
」 お
_2∈ 8
鐘
α の
v
o
O 5 IO Horizontal displacerraent ,h(mrn)
Fig. 13 Effects of specimen height iR tests 3 and 56
.om
ヒdi
>
お
9今b 、 Φ
,⊆
今b)
2
1
06
test e o cr.{kpa> H/L(cmfcm>
3 0642 49 12/15
驚
O.
o
D
疑…i}
.コ
Ah=Omm( ¢ ds)max
Ah=iOmrn
rk/
ミ.)
i
2
ts
9今bこ{1 2
菱 >
bv
o
test e o
56 O.645
影
。
口
th
av{kpa) HfL{cm/cm)
49 5/15 漏
Kl,
g.
〈t
Ah=Omm( ¢ ds)max
Ah=10mm
ミ)
ll!/i
X ’ XFig. 14 Distribtition of normal stress on the bottom of lower shear box in tests 3 (H ::= 12 cm) and
56 (H 一th 5 crn)
o 1
highly non-uniform.
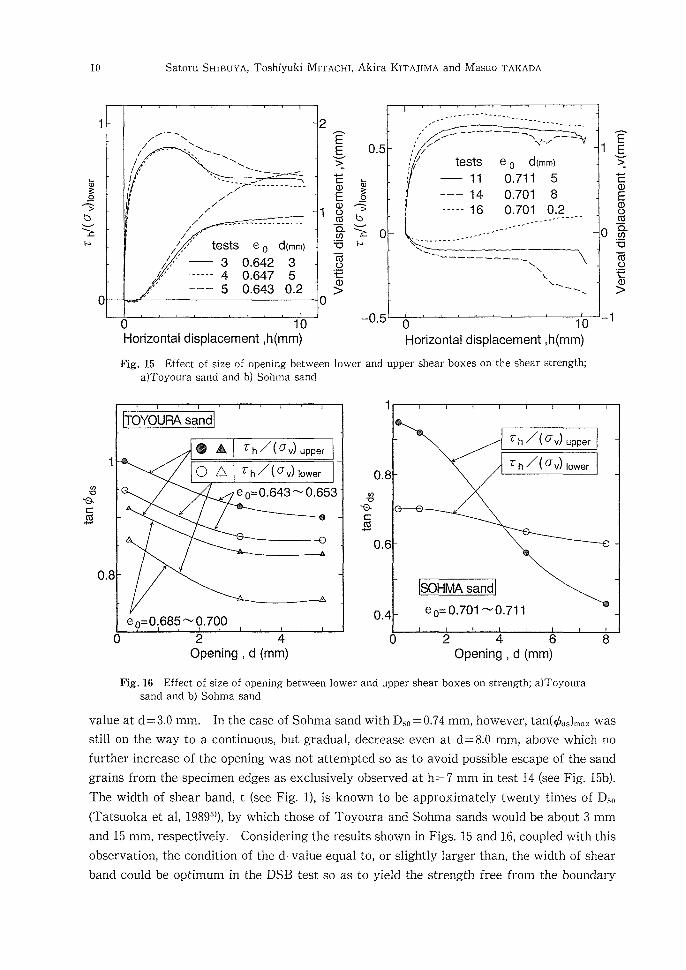
3.4 Effects of the slze of openiiig between upper and lower shear boxes
In Fig. 15, the relationship between tan dids and v (R.b., compression is taken as positive)
of dense specimens of Toyoura sand aRd medium-loose specimens of Sohma sand is
examined with respect to the horizontal displacement, h. ln each group of tests, the only
difference to distinguish the three tests is the size of opening, d. ln Fig. 16, the values of tan
dids at peak, tan(dids)max, are plotted against td’ for each group of tests. The effect of the size
of opening was obvious in that tan(ipds).a. decreased as the d-value iRcreased. Note that, in
the case of Toyoura sand having Dso :e.162 mm, the value of tan(did,).,. reached a stable
10 Satoru SHiBuyA, Toshiyuki MiTAcHI, Akira KITAJiMA and Masuo ’rAKADA
ts
9今。)
xV二
1
o
f /
t/・
ff’
i
l
ノヘヘ ノ へ/ 戸.一 、\\ ’ 、 、 、 、
, 、 \, 、 \
NN ・ % 「一-馳魑 〆 ~隔鴨r謄魑曽騨帰幽-_r騨 / / / / / / ノ リハハハリリ ロロ //,,
/:.,’” tests e o d(mrn>
∠//” 30,6423 髪” 9一』曽一一 4 0.647 5
ク.’ @ 一一一 5 0.643 α2
2 窟
9
ぜ
婁
蝿 薯
薯
タ
Horizontal displacernent ,h(mm)
Fig. 15
a)Toyottra sand and b) Sohma sand
o
O.5
6
零
s一.一
@〇
一〇.5
/ 辱F門句・
ノ ノヘノへへヘ ノ ノ ぬ
!’
I/ \・/~! /
!〆 tests eo d(mm>
1 11 0。71嘘5」
一一一14 α701 8
一一一一一16 0.701 0.2
、\
、、 、 \ \ \ \、 、、、
Horizontal displacement ,h(mm)
1
o
一1
∈ε
》」二Φ∈
ΦoΩ.
qり
冠
司.9
ゼΦ
〉
Effect of size of opening between lower and upper shear boxes on the shear strength;
の口
sc一
1
O.8
TOYOUFもへsand
ew pt
OATh/(av) upper
Th/(av) lower
e o= O,685 A一 Q700
eo=O.643NO,6s3
o 2 40penlng , d (m m)
のv魯
祠
t
e.s
O.6
e.4
th/(av) upper
Th/(av) lower
SOHMA sand
eo= o.701 ・Nve.7“
o 2 4 6 0pening,d (mm)
8
Fig. 16 Effect of size of opening between lower and upper shear boxes on strength; a)Toyoura
sand and b) Sohma sand
value at d=3.0 mm. ln the case of Sohrna sand with Dso==e.74 mm, however, tan(dids)max was
still oR the way to a continuous, but gradual, decrease even at d =8.0 mm, above which no
further increase of the opening was not attempted so as to avoid possible escape of the sand
grains from the specimen edges as exclusively observed at h =7 mm in test 14 (see Fig. 15b).
The width of shear band, t (see Fig. 1), is known to be approximately twenty times of Dso
(Tatsuoka et al, 19893)), by which those of Toyoura and Sohma sands would be about 3 mm
and 15 mm, respectively. Considering the results showR in Figs. 15 and 16, coupled with this
observatioR, the conditlon of the d-value equal to, or slightly larger than, the width of shear
band could be optimum in the DSB test so as to yield the strength free from the boundary
Strength of Sand as Observed in a newly Developed Direct Shear Bex Apparatus 11
constraints.
Finally, it should be mentioned that the relationship between tan(ipd,).a. and the initial
density from a series of the DSB tests on Toyoura sand was similar to that from the simple
shear tests using a hollow cyiindrical specimen.
Conch嚢s韮ons
In the direct shear box test, the reference state of shearing is the condition of simple
shear. To realize this particular mode of shearing, the direct shear box apparatus should
satisfy, at least, the foliowing configurations. The measurement of vertical load should
exclude ehe effect of friction on the inner wall of the shear boxes, which was found rather
slgnificant even as the wall was weil lubricated. Furthermore, the peak streRgth is affected
by the size of opening between the upper and lower shear boxes, d. From a point of yielding
the strength free from the boundary constraints, the optimum d-value may be equal to, or
slightly larger than, the width of shear band which may be about twenty times of the mean
diameter of the sand tested.
AckRowledgement
Toyoura sand tested was kindly supplied by Professor F. Tatsuoka, lnstitute of lndus-
trial Science, University of Tokyo.
1)
2)
References
Potts, D.M., Dounias, G.T. and Vaughan, P.R.V.(1987): Finite element analysis of the direct shear box test,
Geotechnique 37(1), 11-23.
Miura, S. and Toki, S. (1982): Sample preparation method and its effect on static and cyclic deformation-
strength properties of sand, Soils and Feundations, 22(1), 61-77.
3 ) Tatsuoka, R et al (1989): Discussion on the Paper by Hettler and Gudehus, Soils and Feundations 29(4),
146-154.