Content State of the Art - Current period Some findings Recommendations - Next programming period

Instructions for use
Title Vanadium Phosphorus Oxide Catalyst with Novel Structure Derived from Lamellar Compounds
Author(s) Kamiya, Yuichi
Citation 名古屋大学. 博士(工学)
Issue Date 2003
Doc URL http://hdl.handle.net/2115/20101
Type theses (doctoral)
File Information 20.神谷裕一.pdf
Hokkaido University Collection of Scholarly and Academic Papers : HUSCAP

Vanadium Phosphorus Oxide Catalyst with Novel Structure
Derived from Lamellar Compounds
Yuichi Kamiya

Vanadium Phosphorus Oxide Catalyst with Novel Structure
Derived from Lamellar Compounds
Yuichi Kamiya
Research & Development Center Tonen Chemical Corporation
Under the Supervision of Prof. Tadashi Hattori
2003

Preface
Heterogeneous catalysts playa major role in modern chemical industry. Maleic anhydride is a
raw material for some useful chemicals. At present, most of maleic anhydride is produced by a
selective oxidation of n-butane using (VOhPZ0 7 catalyst. Although numerous studies have been
devoted over the past 30 years, this reaction system has a serious problem that the yield of maleic
anhydride is low. It is thus strongly desired to improve the yield by improving the catalytic
performance.
So far, almost all developments of the (VOhP20 7 catalyst have been performed by a
trial-and-error method, however, now this method must be at the edge of its capabilities for improving
the catalytic performance. It is well known that the catalytic performance is sensitive to structure and
composition of the (VO)zPZ0 7 catalyst. In this thesis, the author thus presents another strategy for
developing the catalyst that design of the (VOhP20 7 catalyst on the basis of controlling the structure
and composition. Controlling these factors makes properties of the active sites improved,
consequently, the catalytic performance must be improved. However, there are two critical problems
to realize this: (1) It can not be imaged that what-like structure and composition are required to
improve the catalytic performance. (2) The present level of catalyst preparation of (VO)zPZ0 7 is far
from "designing" the structure and composition, even if one knows what-like structure and
composition are required.
The aim of this thesis is to design the vanadium phosphorus oxide catalysts with novel structure
on the basis of controlling the structure and composition. The first subject is to establish the concept
that how the properties of the active sites should be controlled to improve the catalytic performance.
The second subject is to develop the vanadium phosphorus oxide catalysts with novel structures on the
basis of controlling the structure and composition.
The present thesis has been carried out during 1994-1997 at Department of Applied Chemistry,
Graduate School of Engineering, Nagoya University under supervision of Professor Tadashi Hattori,
and subsequently, 1997-2002 at Research and Development Center, Tonen Chemical Corporation
under supervision of Dr. Eiichiro Nishikawa and Dr. Satoshi Ueki. A period of this work
(1997-2002) was supported by NEDO and Japan Chemical Industry Association (JCIA) for the project
on "Novel Catalysts and Chemical Reaction Processes for Selective Oxidation of Light Alkanes"
under supervision of the leader of this project, Professor Tadashi Hattori.
I would like to express my sincere appreciation for kind encouragement, fruitful discussion and

philosophical suggestion given by Professor Tadashi Hattori. I am also deeply grateful to Professor
Shinicbi Hirano, Professor Katsuhiko Takagi, and Assistant Professor Koichi Kikuta for reviewing this
thesis and making a number of helpful discussions.
I wish to express my deep gratitude to Professor Toshio Okuhara of Hokkaido University for his
valuable discussions, philosophical suggestion and careful reviewing of the manuscripts. This thesis
could never be completed without his continuous encouragement. I am also deeply grateful to
Assistant Professor Atsushi Satusma for his heartwarming advice, fruitful discussion, philosophical
suggestion and careful reviewing of the manuscripts. I wish to express my sincere gratitude to Dr.
Eiichiro Nishikawa for kind encouragement, meaningful discussions and teaching me beneficial
concepts for scientific research. I would like to express my deep gratitude to Dr. Satoshi Ueki for his
helpful comments and discussions. I would like to express my appreciation to Dr. Syunji Matsuo for
his cordial encouragement and supporting the project. I wish to express my gratitude to Professor
Noritaka Mizuno of the University of Tokyo for his valuable discussions and careful reviewing of the
manuscript.
I wish to thank Dr. Masahide Murata, a head of Research and Development Center, Mr. Tatsumi
Ichiki, a group reader of basic chemicals and intermediates research group, and my colleagues in
Tonen Chemical Corporation for their support, encouragement and valuable discussions. Also,
special thanks should be given to the board members of Tonen Chemical Corporation giving me the
opportunity of this work. I wish to thank the members in Laboratory of Catalysts Design led by
Professor Tadashi Hattori, especially to Mr. Shin-ichi Komai, Ms. Yenni Westi, Yuki Kijima, Miki
Yashiro and Mr. Takuya Ookura for the collaboration, and the members in Laboratory of Advanced
Material Chemistry led by Professor Toshio Okuhara, especially to Ms. Miki Yoshimune, Dr. Norihito
Hiyoshi and Dr. Naoki Yamamoto for the collaboration. Hearty thanks are made to Dr. Koji Nishi,
Dr. Ken-ichi Shimizu, Dr. Yoshitaka Inaki and Mr. Naruaki Sugiyama for valuable discussions.
would like to express my appreciation to my friend, Mr. Nobuyuki Takagi, Kenji Suzuki, Masatoshi
Kato and Mikio Takamatsu for their hospitality and comfortable time.
Finally, I wish to thank sincerely my wife, Yuka, my children, Moe, my brother, Noriyuki, my
sister mitsuko, my parents, Hisashi and Tomoko, and my parents-in-law, Syu-ichi and Teruko Okada
for their support, understanding, patience and continuous encouragement.
Kawasaki
December, 2002
11
Yuichi Kamiya

Contents
Preface
Chapter 1 General Introduction
Part I. Properties of Active Sites Controlling Catalytic Performance in
the Selective Oxidation of n-Butane
Chapter 2
Chapter 3
3.1
Reduction and Re-oxidation Properties as a Factor Controlling Catalytic
Performance in the Selective Oxidation of n-Butane
Acidic Property as a Factor Controlling Catalytic Performance in
the Selective Oxidation of n-Butane
Dimethylpyridine temperature programmed desorption method for
1
19
21
41
42
quantitative determination of Bmnsted and Lewis acid sites on solid acid catalysts
3.2 Quantitative determination of acid sites on vanadyl pyrophosphate 59
catalysts and their functions for MA formation
Part II. Vanadium Phosphorus Oxide Catalysts with Novel Structure 71
Chapter 4 Iron-doped Vanadyl Pyrophosphate Catalysts by Intercalation of Iron-complex 73
4.1 Preparation of lamellar vanadyl alkylphosphates as precursor 74
4.2 Vanadyl alkylphosphate inserting iron-complex into interJayer space 99
4.3 Catalytic property of iron-doped (VOhP20 7 catalyst prepared by 113
intercalation of Fe(acac)3
Chapter 5 Vanadyl Pyrophosphate Catalysts with Thin Film Morphology 135
Prepared by Intercalation, Exfoliation, and Reduction ofVOP04'2H20 in Alcohol

Chapter 6 Highly Porous Vanadium Phosphorus Oxides from Vanadyl Alkylphosphates 153
Chapter 7 Summary and General Conclusion 167
List of Publications 176

Chapter 1
General Introduction

Chapter I
1.1 Selective oxidation ofn-butane
Maleic anhydride (MA) is an intermediate for some useful chemicals such as unsaturated polyester
resins, succinic anhydride, y-butyrolactone, I ,4-butanediol, tetrahydrofuran, fumaric acid and so on (Scheme
I) [I]. At present, about one million tons/year of MA is produced in the world and 140 thousand tons/year
in Japan [2]. Most ofMA is now produced by selective oxidation ofn-butane using a crystalline (VOhP207
catalyst (eq. I). Although numerous studies including preparation methods, preparation conditions,
activation processes of the (VOhP20 7 catalyst and addition of various promoters have been performed over
the past 30 years, this reaction system still has a serious problem that is low yield of MA, ca. 55 mol%. It is
thus strongly desired to improve the yield by improving the catalytic performance.
~+ (eq. I)
Besides industrial viewpoint, this reaction system is attractive form scientific aspect. The selective
oxidation of n-butane to MA is a complex reaction, which proceeds through 14-electrons oxidation involving
the abstraction of 8-hydrogen atoms and insertion of 3-oxygen atoms. This complex reaction proceeds on
the (VO)2P207 catalyst without by-product except for COx' In addition, more reactive product (MA) is
formed from less reactive reactant (n-butane). Furthermore, since the (VO)2P207 catalyst is a crystalline
mixed oxide, this reaction system has been expected to be intriguing subject for elucidating a relationship
between microstructure of the catalyst and catalytic property.
1.2 History of maleic anhydride production
Before 1960's, most of MA was produced by selective oxidation of benzene over V lOs-MoO, catalyst
(eq. 2) [3-5].
o (eq.2)
In the 1970's, however, two important incidents for the benzene oxidation process occurred and would
trigger to switch the production from benzene oxidation process to C4-hydrocarbon one [5]: (I) the price of a
benzene jumped up, caused by its increasing use in lead-free automobile fuel. (2) a strict regulation on
benzene emission from MA production plants was introduced in the USA. In the benzene oxidation, two
2

Chapter I
carbon atoms are essentially consumed to form COx, so C4-hydrocarbons are also suitable feedstock for the
MA production in terms of COx emission.
0
0
Ethylene glycol
+H2 (cat.)
+H2 (cat.)
+H2 (cat. )
+H2 (cat.)
+H2O (cat.)
+H20 2 (cat.)
•
-f OCH2CH20C(=O)CH=CHC(=O) b,-o Unsaturated polyester
Succinic anhydride
0
Qo y-Butyrolactone
0
! ~OH
HO 1,4-Butanediol
! CO Tetrahyd rofu ran
H.>=<COOH
HOOC H Fumaric acid
1 +H20 (cat.)
HO~COOH
HOOC 1 Malic acid
0
HO OH
OH D,L Tartanic acid
HO
0
Scheme 1 Derivatives made from maleic anhydride
3

Chapler I
At first, the catalyst catalyzing butenes and butadiene to MA selectively was found out [6-8]. This
catalyst was Y20 5-P20 5 supported on Ah03 or Ti02, in which PN atomic ratio was around 1.6 and valence
of Y was 5+ [5]. By using this catalyst, Mitsubishi Chemical, BASF, and Bayer began to produce MA in
early 1970's [4]. However, this catalyst was non-selective for n-butane oxidation [5].
In parallel with this, many researches on the development of catalyst for selective oxidation of
n-butane strenuously carried out. Du Pont published that CoMo04 catalyzed the reaction of n-butane to
MA in 1954 [9], but the catalytic activity and selectivity was very low. In 1966, Bergman and Frisch found
out that the oxidation of n-butane to MA was catalyzed selectively by vanadium phosphorus mixed oxide
(YP oxide) [10]. At that time, however, the process was not economically viable in comparison with the
contemporary benzene oxidation process, because catalytic activity and selectivity to MA was still
insufficient [11]. As a result of considerable investigations, in 1971, researchers of Chevron Research Co.
discovered that crystalline YP oxide with PN ratio of 1.0-1.2 and vanadium of y4+ showed high catalytic
performance for the n-butane oxidation to MA [12]. This catalyst opened up the use of n-butane as
feedstock for commercial production of MA. Right after that (in 1974), Monsanto Company began the
commercial production of MA from n-butane. Now, over 70 % of MA are produced from n-butane [2].
1.3 Active phase for the selective oxidation of n-butane
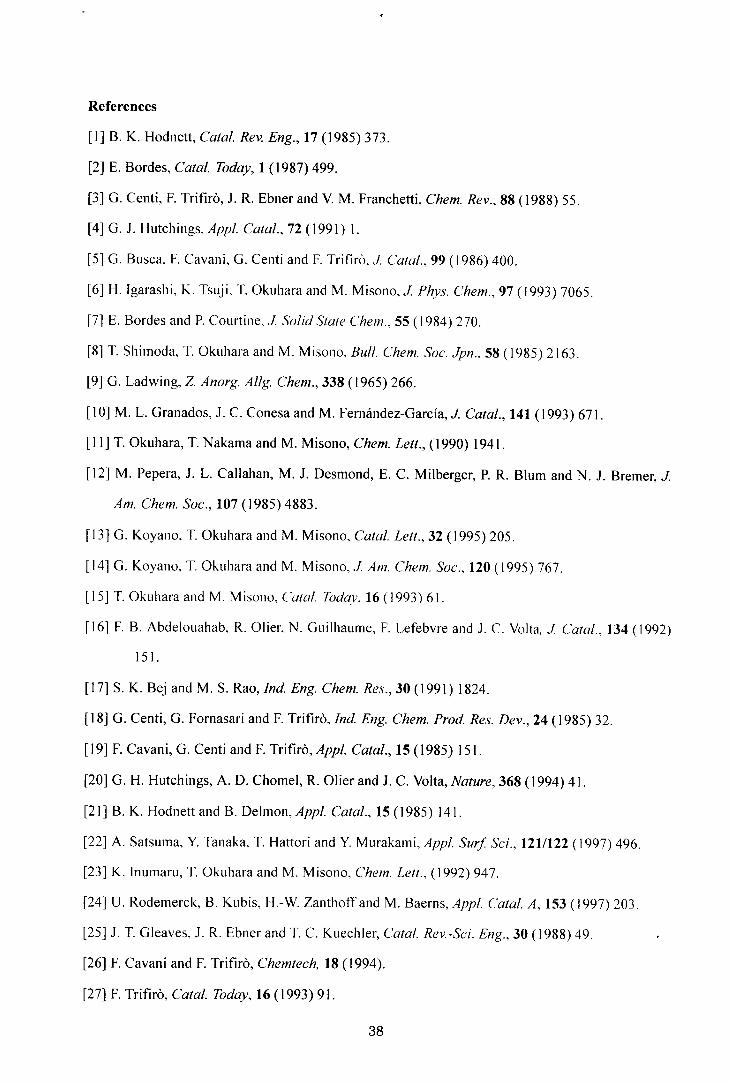
Table 1 lists YP oxides relating with the n-butane oxidation, in which PN ratios are 1.0 or 2.0, and
valences of Yare 4+ or 5+. Fig, 1 illustrates the structures of these YP oxides [13]. (YO)2P207,
YOHP04·0.5H20, and YO(P03h are the YP oxides of y4+. (YO)2P207 consists of edge-shared VOIl
octahedra connected with P20 7 unit (Fig. la-I, a-2), while YOHP04·0.5H20 consists of face-shared V06
octahedra connected with HP04 unit (Fig. 1 b). In the edge- and face-shared Y06 octahedra, two V4+ ions
adjoin through oxygen as shown by y4+_0_y4+. This part is usually called as "Y-O-Y pair sites". On the
contrary, P04 units surround VOG octahedras in YO(P03)2 (Fig. I c). For the VP oxides of V5~ , isolated VOIl
octahedras are connected by P04 units in a-VOP04 and P-VOP04 (Fig. le,f). VOP04·2H20 consists of
alternating V -O-P layers and H20 ones (Fig. I d). The V -O-P layer is made up with isolated V06 octahedra
linked with P04 tetrahedra as well as a-VOP04, and H20 is weakly held in the interlayer. The structure of
Y-, 0-YOP04 and X I phase are not fully solved. Electron diffractions of y- and 0-VOP04 suggested that
these compounds had the edge-share Y06 octahedras as (YOhP20 7 [14]. XI phase gives similar XRD
pattern [15] and Raman spectrum to o-YOP04 [16,17]. XI phase was confirmed to have the Y-O-Y pair
4

sites by EXAFS [17]
Table 1 Phases of vanadium phosphorus oxides
PN ratio yn-<-
5 . .§~YQI>Q<I,YQI>Q4·2I:I2Q':XJphase
_____________________________ ~ _________ (yQ)_~~lQ7Ly.QH~g(_Q:~_Jj_~Q __ (~~~~!_!~~_~~l _____________________ _
2 4 YO(P03h
Table 2 Catalytic performance of vanadium phosphorus oxides in the
oxidation of n-butane
Conversion/% Selectivity to MAI% Ref.
__ (yQh~JQ7 _____________ ?_Q ________________________ ?_~ __________________ }_~ ____ _ _ _ 5~: yQ~Q4. _____________ ?} ________________________ }_~ __________________ )_~ ____ _ _ _ ~: YQ~Q4. _____________ ?_~ ________________________ } _~ __________________ }_~ ____ _
---~! -p~-~~~- --- ----------?~ -------- ---------------- ~_Q --- ---------------}-~ -----
20
100
47
19,20
21
Chapter I
It has been discussed which one is the active phase for this reaction. Table 2 lists the catalytic data
reported in the literature [15,18-20] and that of the author [21]. The catalytic activities and selectivities
remarkably depend on the YP oxides. Among them, (YO)2P207 gave high selectivity and activity. In the
case of a-YOP04 and p-YOP04, the selectivity is very low, and that of XI phase is not high. Hutchings et
al. [19,20] reported that YO(P03)2 shows ultra high selectivity (100 %), but the data reported was only at a
very low conversion of n-butane (about I %), so it is suspected that the data include an large experimental
errors. Actually, the author tested YO(P03)2 under the practical conversion of n-butane and confirmed that
the selectivity was not high (47 % at 20 % conversion). These results indicates (YP)2P207 is the active
phase for the selective oxidation of n-butane. In addition, (YOhP20 7 is the main component of all
commercial catalysts. Considering the relationship between the structures and catalytic performances, the
primal characteristics of bulk structure of the catalyst for MA formation are Y -0-Y pair sites, valence state
ofy4+, and PN ratio of 1.0.
5

(a-2)
(a-I)
(b) (c)
I~" @ 7.4 A T
J __ 41' zt I ___ x
(e) 0 <-.,y
(d)
(f)
Fig.1 Structures of the YP oxides. (a) (YO)2P207, (b) YOHP04·O.5H20, (c) YO(PO,)2 (d) VOP04·2H20, (e) u-YOP04, (f) p-YOP04. [13]
6
Chapter 1

Chapter I
1.4 Preparation methods of conventional (VOhP20 7 catalyst
The (VOhP20 7 catalyst is usually obtained by dehydration of vanadyl hydrogen phosphate
hem i-hydrate, VOHP04·O.SH20. The transformation from VOHP04·O.SH20 to (VO)2P207 proceeds
topotactically with elimination of H20 and condensation of two P-OH [22,23]. Morphology and structural
characteristic of VOHP04·O.SH20 are basically retained during this transformation [22,23]. That is to say,
those of the (VO)2P207 catalyst are already directed at the time of preparing VOHP04·O.SH20.
So far, many preparation methods for VOHP04·O.SH20 are claimed in patents and research papers
[1,24-26], and these are classified into three types as follows: the precursor is prepared (I) in aqueous
medium, (2) in organic solvent which is called as "organic solvent method", and (3) by reduction of
VOP04·2H20 with alcohol. At the beginning, the precursor was prepared in the aqueous medium. In this
method, V 205 is reduced with Hel or oxalic acid in water, followed by reaction with H3P04• Nowadays,
most of the industrial catalysts are prepared by the organic solvent method [S,II,24]. H3P04 is allowed to
react with partially reduced V 20S in alcohol such as benzyl alcohol and isobutyl alcohol to form precipitate
of VOHP04·O.SH20. In the method by use of VOP04·2H20 as starting material, VOP04·2H20 is reduced
with alcohol to form VOHP04·O.SH20. The main differences in these preparation methods are morphology
and structural characteristics of VOHP04·O.SH20 crystallites. The VOHP04·O.SH20 crystallites obtained
in organic solvent, aqueous medium and by reduction of VOP04·2H20 have rose petal-like, block-like and
plate-like morphologies, respectively [18]. In the organic solvent method, VOHP04·O.SH20 crystallites
with structural disorder in the layer stacking are formed [27-29]. This structural disorder is induced by the
alcohol trapped between the layers [28]. On the contrary, weB-crystallized VOHP04·O.SH20 crystallites are
formed in aqueous medium [IS].
For improvement in the catalytic performance, numerous trials on preparation of the (VO)2P20 7
catalyst have been performed so far. These trials have been mostly carried out by a conventional
trial-and-error method, and almost all imaginable factors such as kinds of solvents and starting materials,
reactant P/V ratios, temperature, time of preparation and addition of various promoters and so on have been
already covered [S, II ,24]. The trial-and-error method attained some positive results in its own way.
However, the yield of MA is still low. Besides that, now there is very little room in the trial-and-error
method to improve the catalytic performance.
7

Chapter J
1.5 Structure sensitivity of catalytic performance
It is well known that the preparation method greatly affects the catalytic performance [5,11,24]. The
catalyst obtained by the organic solvent method shows high activity [29]. On the other hand, the (VO)2P207
having block-like and plate-like shapes exhibits high selectivity to MA even at high conversions, because the
consecutive oxidation of MA is suppressed over these catalysts [18]. The difference of the catalytic
performance have been considered to relate with that of the microstructure of (VOhP20 7 cry stall ites [18,29].
One of the factors controlling the catalytic performance is morphology, that is, crystal plane exposed
on the surface. It is generally accepted that the active sites for MA formation are located on the (100) plane.
Horowitz et al. [30] investigated the relationship between morphology and catalytic performance. They
prepared the catalysts with different morphology by changing the preparation conditions, and demonstrated
that the catalysts, in which the (100) plane is preferentially exposed, showed higher selectivity. Okuhara et
al. [31,32] performed that the (VOhP20 7 catalysts of plate-like morphology was first deactivated completely
by deposition of Si02 thin layer, and then fractured to create new side faces such as the (00 I) and (021)
planes. Since only CO and CO2 were formed by this catalyst, they concluded that the active sites for MA
formation exist on the (100) plane, on which the V-O-V pair sites are located. Koyano et al. [33,34]
elucidated using Raman spectroscopy that the (100) plane is oxidized to XI phase, while the side planes are
oxidized to ~-VOP04 which is non-selective phase for MA formation. These results support the hypothesis
that catalytic function is dependent on the crystal planes. Furthermore, Ziolkowski et al. [35] claimed that
the (100) plane is effective for MA formation from computational simulation by use of crystallochemical
model of the (100) plane.
Another factor is bulk structure of the catalyst. As mentioned in the former section (1.4), there is the
structural disorder along the (100) cleavage plane of the catalyst prepared in organic solvent (VPO-org).
VPO-org gave higher catalytic activity per surface area for MA formation than the catalyst prepared in
aqueous medium (VPO-aq) [29]. This suggests that the structural disorder influences the specific activity
for MA formation. In addition, it is known that catalytic activity and selectivity increase during the first
several hundred hours under the reaction conditions [36-38]. At beginning, the catalyst consists of low
crystalline (VO)2P207 and amorphous VP oxides, and then the crystallinity of (VO)2P207 rises as the
increasing in catalytic performance. This supports the hypothesis that the bulk structure of the catalyst
affects its catalytic performance. Since the catalytic reaction over the (VO)2P207 catalyst certainly proceeds
on its surface, the bulk structure must affect surface one.
8

Chapter I
1.6 Surface functional groups controlling the catalytic performance of (VO) 2P207 catalyst
Table 3 summarizes the type of functional groups thought to be present on the surface of (YOhP~07
[I]. Lewis and Bronsted acid sites, one-electron redox couples, terminal oxygens of Y=O-"o and Y=O". and
adsorbed molecular oxygen species exist on the surface. These are roughly classified to (1) oxygen species
(redox sites) and (2) acid sites. It is known that these two functional groups are involved in the MA
formation.
Table 3 Surface functional groups hypothesized to be present on (YO)2P207
Type of functional groups
Lewis and Bronsted acid sited
One-electron redox couple: y S+/y4+
Bridge oxygen in Y -0-Y, Y -O-P groups or triply bridged oxygen in YO(P)Y
Terminal oxygen in (Y=O(, (Y=0)2+
Adsorbed oxygen species as TJ2 -superoxo and TJ I-peroxo species
The selective oxidation of n-butane over the (YO)2P207 catalyst has been considered to proceed via a
redox mechanism between y4+ and y S+ at the top few surface layers [39-41]. Thus, the catalytic
performance must depend upon the reduction and re-oxidation properties of the catalyst directly. The
change of the structure of the surface on reduction and re-oxidation was investigated [40]. The surface of
(YO)2P207 transforms to XI phase (ySt) on the re-oxidation, and then, the formed XI phase is reduced to
(YO)2P207, reversibly. Satsuma and co-workers [42-44] investigated reactivity of active oxygen species on
the (YO)2P207 catalyst. The amount of the active oxygen species was estimated using NARP (nitric
oxide-ammonia rectangular plus) technique, and they demonstrated that YPO-org had the oxygen species
with higher specific activity than YPO-aq by the estimations of the formation rate of MA per active oxygen
species [42,43]. In order to elucidate a relationship between the redox property and catalytic performance,
each rate of re-oxidation and reduction has been measured. Busca et al. [27] measured the rate of
re-oxidation with air, and suggested the structural disorder enhances that rate. Hodnett et al. reported
[45,46] that the rate of both re-oxidation and reduction decreased as the bulk PlY ratios increased.
However, they measured the rates on not the surface but the bulk reduced or oxidized. Since the oxidation
of n-butane proceeds via a redox of the top few surface layers, the author conceives that the rates at the top
9

Chapter I
few surface layers need to be evaluated for elucidation of those relationships.
Acid sites as well as redox sites are considered to play significant role for selective oxidation of
paraffin over solid catalysts [47]. In addition, Lewis and Bronsted acid sites play different roles in the
selective oxidation, and the strength of respective acid sites strongly affects the catalytic performance [48].
For (VO)2P207, so far, determination of acid sites was reported and their role in the selective oxidation of
n-butane was suggested. Centi et al. [49] demonstrated that the acid sites are necessary for th is reaction.
since co-feed ammonia in the reaction feed and doping of potassium to the catalyst make the activity for MA
formation lowered. The presence of both Bronsted and Lewis acids on (VOhP20 7 was confirmed from IR
spectra of basic molecule adsorbed on the catalyst [50,51]. Lewis acid sites are presumed to be a
coordinatively unsaturated vanadium ions on the (100) plane, while Bronsted acid sites are P-OH group of
truncated p-o bonds in terminal phosphorus tetrahedra [50]. Trifiro et al. [52] suggested that n-butane is
activated on Lewis acid sites with basic lattice oxygen through abstraction of hydrogen, and Bronsted acid
sites facilitate desorption of water and MA. Busca et al. [50] detected the presence of greater amount of the
very strong Lewis acid sites on VPO-org as compared with VPO-aq, and suggested the higher specific rate of
n-butane activation in VPO-org due to the presence of these Lewis acid sites. However, even now
quantitative understanding the relationship between acidic property and catalytic performance are not
reached. The cause of this should be lack of analytical method for quantitative determinations of Bronsted
and Lewis acid sites separately.
1. 7 Concept and strategy for developing the advanced catalyst
The conventional trial-and-error method is the strategy to seek good catalyst by repeating preparations
of the catalyst and evaluating the catalytic performance time after time. For the (VOhP20 7 catalyst, this
strategy has already been ineffective to improve the catalytic performance any more. Another strategy for
developing the catalyst is to design the catalyst systematically, that is, first one pays much attention to the
causal relationships between the catalytic performance and catalyst preparation, and investigates those in
detail, and then designs the catalysts based upon the knowledge obtained. However, so far, development in
the (VOhP20 7 catalysts by such strategy has been scarcely performed.
The author presents the relationships between the catalytic performance and catalyst preparation of the
(VOhP20 7 catalyst as Scheme 2. Items existing between the catalytic performance and catalyst preparation
are structure/composition and properties of the active sites. The properties of the active sites are divided
lO

Chapter I
into two elements, that is, chemical and physical properties. As mentioned in the former section (1.6), two
important chemical properties of the active sites on the (VO)2P207 catalyst are reduction and re-oxidation
property, and acidic property. On the other hand, the physical property means number of the active sites.
Trial-and-error method m __ m ________ m __ m_mm_~ Catalyst Preparation
~ Structure/Composition
Properties of j Active Sites /~
(Chemical Property) (Physical Property)
Property of the active site
y '- __ m_m __ mm _____ mm __ ~ Catalytic Performance
Number of the active sites
Concept
Design the structure
and composition
Improve the
properties of the
active site
High catalytic
performance
Scheme 2 The relationships between catalytic performance and catalyst preparation, and the concept
for developing the catalyst of high performance.
The structure and composition of the (VO)2P207 catalyst greatly affects the catalytic performance.
This can be interpreted that the structure and composition influence the chemical and/or physical properties
of the active sites, consequently difference of those must cause that of the catalytic performance. On the
basis of these ideas, the author proposes the concept for developing the catalyst of high performance that
adequate design of the structure/composition makes the properties ofthe active sites improved, consequently,
catalytic performance must be improved. The author believes that executing the development of the
catalyst according to this concept brings the catalyst of high performance. However, there are two critical
problems to realize this. First is that present understanding of the relationship between the chemical
properties and catalytic performance is insufficient to understand how the chemical properties should be
controlled to improve the catalytic performance. In consequence, it can not be imaged that what-like
structure and composition are suitable to improve the chemical property of the active sites. Second is that
the present level of catalyst preparation of (VO)2P20 7 is far from "designing" the structure and composition,
even if one can know what-like structure and composition are required.
11

Catalyst Preparation
Structure/Composition
Property of Active Sites
Catalytic Performance
Intercalation of promoters (Chapter 4)
Promoters ) intercalated or
sandwiched
Chemical property of the active sites
Exfoliation method
(Chapter 5)
Crystal plane J
Chapter I
v-p oxide form
lamellar compound
(Chapter 6)
Surface area J
~ /
High catalytic performance
,..-------,
Number of the active site
/
Scheme 3 Strategy for developing the catalyst in this thesis.
Scheme 3 shows the strategy for developing the catalysts with high performance according to the
concept above mentioned. As will be elucidated in Chapter 2, the re-oxidation property should be
improved to improve the catalytic activity per active site. One of the ways for the improvement is addition
of promoters. However, retaining the characteristic structure of (VO)2P207 must be required, when
promoter is added to the catalyst. Besides that, the promoters added on the catalyst may form undesirable
site such as aggregated metal oxides, on which combustion of n-butane proceeds. "Intercalation" is a
reaction that hetero-atoms, molecules, and ions are inserted into the interlayer space of layered compound
[53]. The intercalation is characterized to proceed topotactically with retaining the two-dimensional
structure of host material. VOHP04·O.5H20 is a layered compound, so the author came up with the method
that VOHP04 ·O.5H20 is modified by intercalation of promoters followed by calcination. By this method,
the promoter can be expected to be introduced to (VO)2P207 catalyst uniformly or sandwiched between their
layers with the characteristic structure remaining (Fig. 2). These catalysts are hopeful to show higher
specific activity for MA formation. In addition, it can be expected that the acidic property also changes by
this method. However, since each V -O-P layers of VOHP04·O.5H20 are held tightly by strong hydrogen
bonding [22], it is difficult to modify by intercalation at present [54]. Consequently, new precursors are
12

required to realize the idea of this preparation method.
Precursor
Intercalation of promoters
• Precursor
inserting promoters
Calcination
Calcination
9 - . ,- • I
Catalyst
Catalyst
Fig. 2 Image of preparation method using intercalation of promoter
Chapter I
Uniformly dispersing type
Sandwich type
Concerning the physical property, i.e. number, of the active sites, two manners to increase the number
of the active sites can be thought. The author considers that preferential expose of the (100) plane of the
(VO)2P207 catalyst, that is, high exposure of the active surface area, is effective in developing the catalyst of
high performance, because the active sites for MA formation are located on the (100) plane. Another
manner for improving the number of the active sites is to increase the total surface area of the catalyst.
Recently, "exfoliation" is reported in some layered compounds such as clay [55], zirconium phosphate
[56], niobate [57], and titanate [58]. Exfoliation has been developed from extending the concept of
intercalation and is a technique of delaminating stacked inorganic sheets in solvent by infinite swelling of
their interlayer space. As mentioned above, preferential expose of the (IOO) plane can be effective in
developing the catalyst with high performance. To realize this, the author devised a method using
exfoliation of VOP04·2H20 as shown in Fig. 3. VOP04·2H20 possesses high intercalating capability [59].
Lamellar compound formed by intercalation of alcohols into VOP04·2H20 is exfoliated, and then the
thin-layers of VOP04 are reduced to from catalyst precursor. This method has the potential to obtain
(VO)2P207 crystallites of thin-sheet exposing preferentially the (100) plane.
~laHon ai
"'\'; EXfOlia~tion Reductio~ ~~" ~ ~~
~ 'i; -,-'
VOP04·2H20 Lamellar compound Thin layers
ofVOP04
Precursor
Fig. 3 Image of preparation method using exfoliation ofVOP04·2H20
13

Chapter I
Micro- and m,,~,)p\.)rous material~ generally have high surface area. For applications of these
materials w the ~dective oxidation catalysts, it is considered that mesoporous materials are rather suitable,
because the products may be ~tr\.)ngly adsorbed in the micropores causing the consecutive oxidation of the
PWdUCb, The author expects that the mesoporous V -P oxides with card house structure are obtained from
lamellar V-P compound~ (Fig. 4). This structure is probably formed by peculiar elimination of the organic
groups causing formation of the mesopores.
Elimination of organic groups
Fig. 4 Image of forming the mesoporous V -P oxide with card house structure from lamellar compound.
1.8 Objective and outline of the thesis
Mesopores
On the basis of these backgrounds, the aim of this thesis is to design the vanadium phosphorus oxide
catalyst with novel structure on the basis of controlling the structure and composition. The first subject of
this thesis (Part I ) is to establish the concepts that how the reduction and re-oxidation properties (Chapter 2)
and acidic property (Chapter 3) should be controlled to improve the catalytic performance. The second
subject of this thesis (Part II) is to develop the vanadium phosphorus oxide catalysts with novel structures on
the basis of controlling the structure and composition (Chapter 4,5,6). The outline of the thesis is as
follows.
Chapter 2 intends to investigate the relationship between the reduction and re-oxidation properties and
catalytic performance. The reduction and re-oxidation properties of the catalysts are evaluated from kinetic
analysis and measuring the rate of reduction with n-butane and re-oxidation with air. The relationship are
discussed by comparing with three types of the (VOhP20 7 catalyst with different microstructures.
In Chapter 3, the relationship between acidic properties and catalytic performance is investigated.
Chapter 3.1 establishes as a new characterization method for quantitative determination of both amount and
strength of Br!Zlnsted and Lewis acid sites separately using two kinds of dimethylpyridine as probes for TPD.
In Chapter 3.2, the acidic properties of the (VOhP20 7 catalysts are evaluated by this method, and the
relationship is elucidated.
14

Chapter J
In Chapter 4, iron-doped vanadyl pyrophosphate catalysts are developed by intercalation of
iron-complex. Chapter 4.1 develops lamellar vanadyl alkylphosphates, which is a new precursor, and
characterizes these compounds. Since the vanadyl alkylphosphates possess weakly held alcohol in their
interlayer spaces, these materials can accommodate guest molecules. Furthermore, catalytic properties of
V-P oxides obtained by calcination of the non-modified vanadyl alkylphosphates are investigated in order to
demonstrate a prospect of these materials as a catalyst precursor. In Chapter 4.2, intercalation of
iron-complex is investigated and the materials obtained are characterized systematically. Vanadyl
benzyl phosphate is used as a host and Fe(acac») and ferrocene as guests. In Chapter 4.3, the method
investigated in Chapter 4.2 is applied to modification of vanadyl n-hexylphosphate. The microstructure of
the catalyst obtained by calcination of this material is investigated. The catalytic performance for n-butane
oxidation is examined and a role of the iron incorporated will be discussed in relation to the reduction and
re-oxidation properties. Furthermore, the author suggests appropriate reaction conditions for the iron-doped
catalysts.
In Chapter 5, the author presents another potential method for the (VOhP20 7 catalyst preferentially
exposing the (100) plane by using intercalation, exfoliation and reduction ofVOP04·2H20 in alcohols. The
difference in the catalytic property and structures between this catalyst and conventional one is discussed.
In Chapter 6, highly porous vanadium phosphorus oxides of high surface area are synthesized by
thermal treatment of vanadyl alkylphosphates. Micropore and mesopore size distributions are characterized
from adsorption isotherm of argon and adsorption-desorption isotherm of nitrogen, respectively.
Chapter 7 includes the summary, conclusion, and future prospects.
References
[I] F. Cavani, F. Trifiro, CHEMTECH, 25, (1994) 18.
[2] S. Uchida, in "Sekiyukagakupurosesu" E. Kikuchi Eds, Kodansha, (2001) p.159.
[3] N. Yamazoe, in "Syokubai kouza. 14. kogyosyokubai han-nou f' Y. Murakami Eds, (1985) p. 145.
[4] I. Matsuura, Hyomen, 20 (1982) 605.
[5] B.K. Hodnett, Cafal. Rev. -Sci. Eng., 27 (1985) 373.
[6] Mitsubishi Kasei Kogyo, Japan Kokai 7889 (1965).
[7] BASF, GP 1443452 (1968).
15

[8] Petro-Tex, USP 3366648 (1968).
[9] Du Pont, USP 2691660 (1954).
[10] Princeton Chemical Research, USP 3293268 (1966).
[11] GJ. Hutchings, Appl. Catal., 72 (1991) 1.
[12] Chevron Research Co., USP 3864289 (1972).
[13] E. Bordes, Catal. Today, 1 (1987) 499.
Chapter J
[14] Z.G. Li, R.L. Harlow, N. Herron, N.S. Horowitz, and E.M. MaCarron,J. Catai., 171 (1997) 506.
[15] T. Shimoda, T. Okuhara, and M. Misono, Bull. Chern. Soc. Jpn., 58 (1985) 2163.
[16] F. Banabdelouahab, R. Olier, N. Guilhaume, F. Lefebvre, and J .C. Volta, J. Catal., 134 (1992) 151.
[17] G. Koyano, T. Okuhara, and M. Misono, J. Am. Chern. Soc., 120 (1998) 767.
[18] H. Igarashi, K. Tsuji, T. Okuhara, and M. Misono, J. Phys. Chern., 97 (1993) 7065.
[19] M.T. Sananes, G.J. Hutchings, and J.e.Volta, J. Chern. Soc., Chern. Commun., (1995) 243.
[20] M.T. Sananes, G.J. Hutchings, and J.e. Volta, J. Cafal., 154 (1995) 253.
[21] Private data.
[22] J.w. Johnson, D.e. Johnston, AJ. Jacobson, and J.F. Brody,J. Am. Chern. Soc., 106 (1984) 8123.
[23] E. Bordes and P. Courtine, J. Solid State Chern., 55 (1984) 270.
[24] G. Centi, F. Trifiro, J.R. Ebner, and Y.M. Franchetti, Chern. Rev., 88 (1988) 55.
[25] F. Cavani and F. Trifiro, in "Catalysis Volume 11", Royal Society of Chemistry, Cambridge, (1994)
p.246.
[26] F. Trifiro, F. Cavani, J.A. Horsley, and S.R. Vatcha, "Selective Partial Oxidation of Hydrocarbons and
Related Oxidations", Catalytica Studies Division 4193 So, Mountain View, CA (1994).
[27] M.L. Granados, J.e. Conesa, and M. Fernandez-Garcia,J. Catal., 141 (1993) 671.
[28] G. Busca, F. Cavani, G. Centi, and F. Trifiro,.J Calal., 99 (1986) 400.
[29] F. Cavani, G. Centi, and F. Trifiro,.J Chern. Soc., Chern. Commun., (1985) 492.
[30] H.S. Horowitz, e.M. Blackstone, A.W. Sleight, and G. Teufer. Appl. Catal., 38 (1988) 193.
[31] T. Okuhara, K. Inumaru, and M. Misono, Chern. Lett., (1992) 1955.
[32] T. Okuhara, K. Inumaru, and M. Misono, in "Catalytic Selective Oxidation", ACS Symposium Series
523, (1993) p.156.
[33] G. Koyano, T. Saito, and M. Misono, Chern. Lett., (1997) 415.
[34] G. Koyano, T. Saito, and M. Misono,.J Mol. Catal. A, 155 (2000) 31.
16

Chapter 1
[35] J. Ziolkowski, E. Bordes, and P. Courtine,J Calal., 122 (1990) 126.
[36] A.F. Ben, R. Olier, N. Guilhaume, F. Lefevre, and .J .C. Volta, J Catal., 134 (1992) 151.
[37] R.A. Overbeek, M. Versluijs-Helder, P.A. Warringa, E.J. Bosna, and J.W. Geus, Stud. Surf Sci. Calal.,
82 (1994) 1 83.
[38] M. Abon, K.E. Bere, A. Tuel, and P. Delichere, J Calal., 156 (1995) 28.
[39] M. Pepera, J.L. Callahan, MJ. Desmond, E.C. Milberger, P.R. Blum, and N.J. Bremer, J Am. Chern.
Soc., 107(1985)4883.
[40] G. Koyano, T. Okuhara, and M. Misono, J Am. Chern. Soc., 120 (1998) 767.
[41] T. Okuhara and M. Misono, Cata!' Today, 16 (1993) 61.
[42] A. Satsuma, Y. Tanaka, T. Hattori, and Y. Murakami, Appl. Surf Sci. 1211122 (1997) 496.
[43] A. Satusma, Y. Tanaka, T. Hattori, and Y. Murakami, in "Science and Technology in Catalysis 1994",
Kodansha, (1995) 281.
[44] D. Ye, A. Satsuma, A. Hattori, T. Hattori, and Y. Murakami, Catal. Today, 16 (1993) 113.
[45] B.K. Hodnett and B. Delmon, Appl. Calal., 15 (1985) 141.
[46] B.K. Hodnett and B. Delmon, J Calal., 88 (1984) 43.
[47] K. Tanabe, M. Misono, Y. Ono, and H. Hattori, in "New Solid Acid and Bases" Kodansha-Elsevier,
Tokyo (1989) p.320.
[48] A. Corm a, Chern. Rev., 95 (1995) 559.
[49] G. Centi, G. Golinelli, and F. Trifiro, Appl. Calal., 48 (1989) 13.
[50] G. Busca, G. Centi, F. Trifiro, and V. Lorenzelli, J Phys. Chern., 90 (1986) 1337.
[51] L.M.Cornaglia, E.A. Lombardo, J.A. Anderson, andG. Fierro, Appl. Catal. A, 100 (1993) 37.
[52] G. Busca, G. Centi, and F. Trifiro, Appl. Calal., 25 (1986) 265.
[53] M. Ogawa and K. Kuroda, Hyornen, 32 (1994) 696.
[54] T. Nakato, Y. Furllmi, N. Terao, and T. Okuhara, J Maler. Chern., 10 (2000) 737.
[55] E.R. Kleinfeld and G.S. Furgson, Science, 265 (1994) 370.
[56] S.w. Kelle, H.-N. Kim, and T.E. Mallollk, J Am. Chern. Soc., 116 (1994) 8817.
[57] R. Abe, K. Shinohara, A. Tanaka, M. Hara, J.N. Kondo, and K. Domen, Chern. Mater., 9 (1997) 2179.
[58] T. Sasaki, S. Nakato, S. Yamauchi, and M. Watanabe, Chern. Maler., 9 (1997) 602.
[59] G. Ladwig, Z. Anorg. AUg. Chern., 338 (1965) 266.
17


Part I
Properties of Active Sites Controlling
Catalytic Performance
in the Selective Oxidation of n-Butane


Chapter 2
Reduction and Re-oxidation Properties as a Factor
Controlling Catalytic Performance in the Selective
Oxidation of n-Butane

Chapter 2
Abstract
Relationship between the reduction and re-oxidation properties, and catalytic performances was
investigated by using three types of the (VO)2P207 catalysts with different microstructures. The
catalysts were prepared in organic solvent (VPO-org), by reduction of VOP04·2H20 (VPO-redu), and
in aqueous medium (VPO-aq). The rates of MA formation per surface area greatly depended on the
catalysts; VPO-org was much active, especially at the high partial pressure of n-butane. Reaction
kinetics suggested that VPO-org had higher re-oxidation ability, by which the surface of VPO-org was
retained as a higher oxidation state during the reaction. Actually, it was confirmed that the V5"
density of VPO-org during the reaction was about twice those of the other catalysts, and VPO-org
showed higher rates of re-oxidation estimated by measurement of re-oxidation with air. It was
concluded that the high catalytic activity of VPO-org is due to this high ability of re-oxidation. This
would be caused from enhancement of the migration of the oxygen ions near the surface induced by
the structural disorder of the catalyst. These results established the concept that the re-oxidation
ability should be improved for improving the catalytic activity.
Introduction
Maleic anhydride (abbreviated as MA) is a useful feedstock for unsaturated polyester resins,
agricultural chemicals, and food additives and has recently been utilized as a raw material for
I A-butanediol, tetrahydrofuran, and y-butyrolactone. In industry at present, MA is mainly produced
by selective oxidation of n-butane with vanadium-phosphorous mixed oxide catalyst. Vanadyl
pyrophosphate «VOhP20 7) has been claimed to be a main component of the commercial catalyst for
the MA production [\-4].
It is well known that the microstructure of (VOhP20 7 crystallites greatly influences their
catalytic performances for n-butane oxidation [\ ,5-8]. The (VO)2P207 crystallites having a block-like
and a plate-like shape exhibited high selectivities to MA even at high conversions, because the
consecutive oxidation of MA was suppressed over these catalysts [6]. On the other hand, (VO)2P207
having a rose-petal shape, which was prepared by the so-called organic solvent method, showed the
high activity [6].
In this chapter, a relationship between reduction and re-oxidation properties, and catalytic
performance of (VO)2P207 catalysts was investigated. Three types of (VO)2P207 with different
microstructures were used. The redox property of the catalysts were evaluated from kinetic analysis,
22

Chapter 2
and measurement of rates in re-oxidation with O2 and reduction with n-butane. The difference of the
catalytic properties in these (VO)2P207 catalysts will be discussed in relation to the reduction and
re-oxidation properties. On the basis of these investigations, the concept concerning the reduction
and re-oxidation properties to develop the catalyst of high catalytic activity will be established.
Experimental
Preparation of catalysts
Three types of precursors, vanadium hydrogen phosphate-hemihydrate (VOHP04·0.5H20),
were prepared according to the literature [6].
Prec-org: This precursor was obtained by the so-called organic solvent method [5]. V20 S (0.08
mol; Koso Chemical Co., Ltd.) was added to a mixture of 90 cm3 of isobutyl alcohol (Koso Chemical
Co., Ltd.) and 60 cm' of benzyl alcohol (Koso Chemical Co., Ltd.). This suspension was refluxed at
378 K for 3 h, and was cooled to room temperature. Then, 99 % H3P04 (0.16 mol; MERCK Ltd.)
was added to the suspension and the mixture was again refluxed at 378 K for 3 h. The resulting light
blue solid was filtered, washed with acetone and dried at room temperature for 16 h.
Prec-redu: This precursor was prepared by reducing VOP04·2H20 with 2-butanol (Koso
Chemical Co., Ltd.), as follows. V20 5 (0.14 mol) was added to an aqueous solution of 85 % H3P04
(600 cm3; 1.9 mol of H3P04). This mixture was stirred under reflux for 16 h at 378 K. The
resulting yellow solid was filtered, washed with acetone and dried at room temperature for 16 h. The
obtained solid was confirmed to be VOP04'2H20 by XRD [9]. The powder of VOP04'2H20 (14 g)
was reduced with 2-butanol (150 cm}) for 18 h at 353 K. The resulting light blue solid was filtered,
washed with acetone, and dried at room temperature for 16 h.
Prec-aq: This precursor was prepared by reducing V20 S with NH20H·HCI in aqueous solution.
V20 S (0.1 mol) was added to an aqueous solution (200 cm3) of NH20H'HCI (0.2 mol, Wako Pure
Chern. Ltd.) and 85% H3P04 (0.2 mol) at 353 K, and then stirred for 1 hat 353 K. This solution was
evaporated at 403 K overnight. Water (20 cm3) was added to the solid and the mixture was boiled for
10 min. The resulting light blue solid was filtered, washed with acetone and dried at room
temperature for 16 h.
These precursors were pretreated at 823 K for 2 h in N2 flow (300 cm3 min-I). The catalysts
obtained from Prec-org, Prec-redu, and Prec-aq are denoted as VPO-org, VPO-redu, and VPO-aq,
respectively.
23

Chapter 2
Characterization
XRO patterns of the catalysts were measured by using an X-ray diffractometer (Rigaku
RINT-1400) with Cu K" radiation (A = 0.154 nm). Infrared spectra of the catalysts were measured
with an IR spectrometer (Perkin Elmer model 1600). The mixture of the catalyst powder and KBr
was pressed into a disk. SEM images of the catalysts were taken with a scanning electron
microscope (SEM; HITACHI S-2l00B). X-ray photoelectron spectra (XPS) were obtained with a
Physical Electronics Model 5600ci spectrometer with Mg K" radiation. The PlY ratios of catalyst
bulk were determined by an inductively coupled plasma atomic emission spectrometer (ICP-AES;
Shimadzu ICPS-8000). The catalyst powder was dissolved into hot H2S04, and the solution was
diluted with water to about 30 ppm of V or P. The surface area of the catalyst was measured by the
BET method using N2 with a Carlo Erba Sorptomatic Model-1800 after the sample was evacuated at
473 K for 2 h.
Time-profiles of reduction and re-oxidation
Time-profi les of reduction of the catalyst with n-butane and re-oxidation with air were measured
by using a TG/OTA apparatus (Seiko Instruments, TG/OTA 200). The degrees of reduction and
re-oxidation of the catalysts were monitored by the weight decrease in a flow of 10 % n-butane (N2
balance, 50 cm3 min-I of total flow rate) and the weight increase in air (50 cm3 min-I of total flow rate),
respectively. Prior to the measurements, the catalyst was aged in a flow of 5.0 % n-butane in air
(total flow rate: 20 cm3 min-I) at 723 K for 20 h. After the catalyst was cooled to room temperature
in a N2 flow, a part of the catalyst (""-' 1 0 mg) was set on an AI pan in the apparatus. Temperature of
the sample was then raised in a N2 flow (50 cm3 min-I) to 663 K at 10 K min-I and was kept there.
After no further decrease in weight was detected at 663 K, the feed gas was changed to J 0 % n-butane
(N2 balance, 50 cm' min-I) to obtain the time-profile of reduction at 663 K. After the catalyst weight
become constant, the system was purged with a N2 flow (50 cm' min-I) for 2 h, and again the feed gas
was changed to dry air (50 cm3 min-I) at 663 K to obtain the time-profile of re-oxidation.
Catalytic oxidation of n-hutane
Catalytic oxidation of n-butane was carried out in a conventional fixed-bed reactor of stainless
tubing (inside diameter: 10 mm) under atmospheric pressure_ A mixture of n-butane and O2 (N2
balance) at the total flow rate of 20 cm3 min-I was fed over the catalyst bed at 663 K. The
24

Chapl(>/' 2
concentrations were varied from 0.75 %to 5.0 % for n-butane and from 10 % to 30 % for O2,
respectively. The conversion of n-butane was controlled by the weight of the catalyst under a
constant total flow rate (20 cm3 min-I), where the flow rates were precisely controlled by thermal mass
flow controllers (STEC SEC-310). The products were analyzed with on-line gas chromatographs
(FlO (Shimadzu 14A or Shimadzu 9A) and TCD (Shimadzu 9A)) equipped with a Porapak QS
column (inside diameter 2.2 mm, length I m) for n-butane and MA, and a Porapak N column (inside
diameter 2.2 mm, length 2 m) for CO2• A Molecular Sieve 13X column (inside diameter 2.2mm,
length 4 m) was also used to separate O2, N2 and CO. CO and CO2 were converted to methane by
using a Methanizer (Shimadzu MTN-I) to be detected more sensitively by the FIO-GC.
Prior to the reaction, the catalysts were aged in the reaction mixture at 723 K for 20 h, and then
the temperature was lowered to 663 K in the presence of the reaction mixture.
Results
Microstructure of catalysts
The XRD patterns of catalysts are shown in Fig. 1. The XRD peak positions of these catalysts
were same as those reported [6]. On the other hand, the relative intensities and the line-widths were
greatly different depending on the catalysts. The diffraction line of the (100) plane on VPO-org was
very weak and broad, while those on VPO-redu and VPO-aq were strong and sharp.
Fig. 2 shows the infrared spectra of the catalysts. These catalysts gave peaks at 635 cm- I
(B(P03)), 743 cm-I (v(P-O-P)), 799 cm-I (v(V -O=V)), 968 cm-I (v(V=O)) and those at 1081, 1142,
1218, and 1244 cm- I (V(P03)) [5,10]. In the cases of VPO-redu and VPO-aq, the peaks at
1218 cm -I (v(P03)) were well separated, whereas the peak of VPO-org appeared as a shoulder. The
peak of 799 cm-l(v(V -O=V)) for VPO-org was very weak and broad [5,10].
The SEM images are shown in Fig. 3. VPO-org was rose-like, VPO-redu was plate-like, and
VPO-aq was block-like; such results are consistent with the literature [6].
25

••
10 20
,-.... o o
• •
30 40 2 e / deg.
50
(a)
(b)
(c) .. 60
Fig. 1 XRD patterns of (a) VPO-org, (b) VPO-redu, and (c) VPO-aq.
1400
, ,-;-
E u
00
N
1200 1000
, ' , E ,u , 0",0",t-,
800 Wavenumber / em-I
600
Fig. 2 IR spectra of (a) VPO-org, (b) VPO-redu, and (c) VPO-aq.
26
Chapter 2

~ _1
Fig.3 SEM images of (a) VPO-org, (b) YPO-redu, and (c) YPO-aq.
Table 1 Composition and surface area of (YO):,P20 7 catalysts.
YPO-org YPO-redu YPO-aq
P/V ratio Surface area --b-u-I-k-a~-'--- surfac~D-- m2g.1
1.04 1.2 33.0 1.06 1.2 24.0 1.07 1.5 5.4
aOetermined by ICP-AES.
bOetermined by XPS. These ratios were calculated as 2.75 X I(P) I I(V) [11].
Chapler 2

-;'
Chapter 2
The bulk and surface PN ratios and the BET surface areas are summarized in Table I. Here
the surface PN ratios were determined by multiplying the XPS peak intensity (I(P)/I(V» by a
correction factor (2.75) [II]. As shown in Table I, the bulk PN ratios of the catalysts, which were
analyzed by ICP, were close to I. In addition, it was found that the surface PN ratios of VPO-org
and VPO-redu were 1.2, while that of VPO-aq was 1.5. There were no difference in the XPS peak
positions and shapes of V (517.2 eV) and P (133.9 eV). The BET surface areas were determined to
be 33.0, 24.0 and 5.4 111" g-I for VPO-org, VPO-redu, and VPO-aq, respectively.
Rates of reduction and re-oxidation
Figure 4 provides the time-profile of reduction with 10 % n-butane at 663 K. It is generally
accepted that the selective oxidation of n-butane over (VO)2P207 proceeds via a redox cycle between
V4+ and V5
+ [12,13], and that n-butane reacts with the oxidized surface of (VO)2P207 [12-14]. Thus
the author assumes that the valence of V of the catalyst is 4+, when the decrease of catalyst weight
from the reduction with n-butane becomes negligible. The reaction is expressed by eq. (1):
(1 )
400 400 -;'
01) a 4.06 01)
4.06 E 0 E 0 E 300 ::l E 300
'"0 :::t C<:l :::t a
--- c ---
::l '"0
C<:l c
4.04 ~ + 4.04 C<:l .,., ;;-> 200 "'-
0 "'-0 <1)
...... \ U C \
4.02 c
::l , , <1)
0 100 , , "@ E > <t
, , c -------._. __ ._-_.- '-
0 4.00 0 30 60 90 120 150
Time / min
Fig. 4 Time-profiles of reduction with 10 % n-butane (N2 balance) at 663 K. Prior to the reduction, the catalysts were pretreated under 5.0 % n-butane in air at 723 K for 20 h. (a) VPO-org, (b) VPO-redu, and (c) VPO-aq.
28
+ .,., > 200 "'o "'-0 ...... c ::l 100 0 E <t
0 0
<1) u c
b 4.02 <1) C<:l
> c
~ .- ----. -.--.--. ---------- 4.00 30 60 90 120 ISO
Time/min
Fig. 5 Time-profiles of re-oxidation with air at 663 K. The catalysts were reduced by 10 % n-butane (N2 balance) at 663 K for 150 min prior to measurement. (a) VPO-org, (b) VPO-redu, and (c) VPO-aq.

Chapter 2
The author can estimate the amount of y 5+ of the catalyst during the reduction process from eq. (2).
5 I W t 0 Wend Amount of Y + (mol gO ) = ---
8X Wend (2)
Here WI (g) and Wend (g) represent the catalyst weight at a reductio':l time and the end of reduction,
respectively.
Pepera et al. reported that the number of surface layers involved in the redox processes during
the oxidation of n-butane is about unity [12]. In addition, Okuhara et al. showed that the diffusion of
oxygen atoms is limited to a few surface layers of (VO)2P207 during the oxidation of n-butane from
the isotopic study [15]. Furthermore, Koyano et al. also revealed that (YO)2P207 was oxidized at a
top few surface layers with O2 at 733 K [13]. Therefore, it is considered that Figs. 4 and 5 show the
time-profiles of reduction and re-oxidation at a top few surface layers of catalyst, respectively.
The amounts of y S" at the initial state were in the order YPO-org (372 f.1 mol gO I ) > YPO-redu
(176 f.1 mol gol) > YPO-aq (32 f.1 mol gol). These amounts of y S, correspond to 6.4 %, 3.0 %, and
0.4 % of total amounts of V in VPO-org, VPO-redu, and VPO-aq, respectively. The amount of y S+
per unit surface area (as listed in Table I) was estimated to be 11.2 f.1 mol m02 for VPO-org, which is
higher than those for VPO-redu (7.4 f.1 mol m02
) and VPO-aq (6.0 f.1 mol m02
). At the initial stage,
rapid decreases in catalyst weight were observed over VPO-org and VPO-redu.
Figure 5 shows the time-profiles of re-oxidation with air at 663 K. The initial rate of
re-oxidation (estimated from the slope of the curve) was in the order: YPO-org > YPO-redu > YPO-aq.
In the case ofVPO-org, about 3.2 % ofY in the catalyst was oxidized after 120 min.
The initial rates of re-oxidation of the catalysts are summarized in Table 2. The order of the
initial rates of re-oxidation was YPO-org (264 f.1 mol gol 1,-1) > YPO-redu (104 f.1 mol g"1 hOi) >
YPO-aq (28 f.1 mol gol 1,-1). The re-oxidation rate per unit surface area were 8.0 f.1 mol m02 hoi for
VPO-org and 4.4 - 5.2 f.1 mol m02 hoi for VPO-redu and VPO-aq.
Table 2 Initial rates of re-oxidation of (VO)2P207 catalysts.
VPO-org VPO-redu YPO-aq
Initial rate of re-oxidation3
264 8.0 104 4.4 28 5.2
aThe initial rate was estimated by the weight increase in air at 663 K.
29

t:
. 2 ~ (\)
>t: o
U
Chapter 2
Catalytic oxidation ofn-butane
Typical time courses of the conversion and selectivity during the aging process at 723 Kover
VPO-org are given in Fig. 6, where the concentration of n-butane was 1.5 % (Fig. 6 (a» or 5.0 % (Fig.
6 (b». The carbon balance was confirmed to be 98 - 100 %. At the initial stage of the reaction, the
conversion of n-butane and selectivity to MA increased slightly with time for both reaction conditions.
After 15 h, both the conversion and the selectivity reached nearly stationary values for both reaction
conditions. Since VPO-redu and VPO-aq gave similar time courses to VPO-org, the catalysts were
aged in each reaction mixture at 723 K for 20 h.
Figure 7 shows the dependence of conversion on WIF with 5.0 % n-butane and 20 % 0" at
663 K, where W is the catalyst weight and F is the flow rate of n-butane. While the conversion
increased as WIF increased for all catalysts, the slope of the curve became smaller at high values of
WIF. The reaction rates were calculated from the slope of the linear portions of the curves at
conversions less than 15 %.
60.----------------------. (a)
o~----~----~----~----~
~ 40
~.-.ea.e 20
o~----~----~----~----~ o 5 10
Time / h
IS 20
Fig. 6 Time courses of catalytic oxidation
of n-butane over VPO-org at 723 K with
20 % O2• Concentrations of n-butane were
(a) 1.5 %, or (b) 5.0 %. WIF (catalyst
weight I flow rate) were 97 and 100 g h
(mol of n-butaner J for 1.5 % and 5.0 % n-butane, respectively: (e) conversion of
n-butane and (0) selectivity to maleic
anhydride.
30
60
50
~ 40 ---::: 0
'Cij 30 .... <U > ::: 0 20 u
10
500 1000 1500 2000 2500
W F- J / g h morJ
Fig. 7 Dependencies of conversion of
n-butane on WIF at 663 K. Reaction was
carried out with 5.0 % n-butane and 20 %
O2: (0) VPO-org, (6) VPO-redu, and (D)
VPO-aq.

Chapter 2
The dependence for the rate of MA or COx (CO + CO2) formation on the concentration of
n-butane is given in Fig. 8, where the concentration of n-butane was varied from 0.75 % to 5.0 %,
being the concentration of O2 (20 %) being constant. The rates are expressed for unit surface area.
Since the conversions were less than 15 %, the consecutive oxidation of MA would be negligible
[6,16-19]. The rates of MA formation increased as the n-butane concentration increased. It should
be emphasized that the rates of MA formation on VPO-org increased by 3.5 times as the n-butane
concentration increased from 0.75 % to 5.0 %, while those on VPO-redu and VPO-aq increased by
only 2.0 times. The reaction orders for MA formations estimated from the slopes in the rights of
Fig. 8 were about 0.6, 0.3 and 0.3 on VPO-org, VPO-redu, and VPO-aq, respectively. The reaction
orders for COx formation were nearly zero on VPO-org and 0.1 for VPO-redu, and VPO-aq, the rates
of COx formation were in this order: VPO-redu < VPO-aq < VPO-org.
The influence of n-butane concentration on the selectivity to MA is summarized in Table 3,
where the data were collected at the conversions less than 15 %. The selectivity to MA was in the
order: VPO-org (45 %) < VPO-aq (54 %) < VPO-redu (63 %) with 0.75 % n-butane. The selectivity
increased from 45 % to 74 % on VPO-org as the concentration of n-butane increased from 0.75 % to
5.0 %. Those on VPO-redu and VPO-aq increased slightly: from 63 % to 67 % on VPO-redu and
from 54 % to 61 % on VPO-aq.
Figure 9 shows the dependence of rates on the O2 concentration; here the concentration of
n-butane was adjusted to 5.0 %. The reaction order for MA formation on the O2 concentration was
close to 0.4 on all catalysts. On the other hand, the reaction orders on COx formation were about 0.4
on VPO-org and 0.6 on VPO-redu and VPO-aq.
Table 3 Influence of concentration of n-butane on selectivity to maleic
anhydride in n-butane oxidation over (VO)2P207 catalysts".
Catalyst
VPO-org VPO-redu VPO-aq
0.75 %C 45 63 54
Selectivity_ to maleic_~n~ydrideb 1.5 %C 3.0 %C
57 63 67 68 58 67
"The reaction was carried out with 20 % O2 at 663 K. bSelectivity to maleic anhydride at conversions less than 15 %. cConcentration of n-butane.
31
5.0 %C
74 67 61

c.v t-:)
40
I I 1.5 ..c 30 ";1
a :><: -0 0
a 20 8 1 0 0 0 0
bI} D :::t
-----
0 - 0 D ll.
x
8 10 --c::r- 0 0
0 0.5 D
2S Ii ll. l-i D
-ll.
O~ 2S
~ 0
I
30 ~ 1.5
..c N Q
I
8 -< -0
8 20 0 J. 1 bI}
:::t 0 ------~ 10 ~ 0.5
l-i
o ,1--____ --'-____ -----1 o 1-' ___ ...I..-__ ---L ___ --J
o 0.03 0.06 -2.5 -2 -1.5 -1 Concentration of n-butane (P n-butane) / atm log (P n-butane / atm)
Fig. 8 Dependencies of rates for maleic anhydride and COx formation on the concentration of n-butane. The concentration of
Oc is 20 % and the reaction temperature is 663 K. rMA, rcox and PI/-butane represent rate for maleic anhydride. COx formation and concentration ofn-butane. respectively: (C::) VPO-org, (6) VPO-redu, and (D) VPO-aq.
Chapter 2

w w
40,~--------------~
~ 30 N
'e -820 ::t
----><: 010 ::i
o ~~~--------~----------~
~ 30 N
'e -820 ::t
----~10
I-c
o 'L...-____ ---'-____ ---'
o 0.2 0.4 Concentration of O 2 (P 02) / atm
5
4
o 3 ::i bl)
..9 2
1
o f-I ---..J....-------'-----I
4
-<3 ~
I-c bl)
..9 2
1
o L-' ----'-----....1...-------' -l.2 -0.9 -0.6 -OJ
log (P 02 / atm)
Fig. 9 Dependencies of rates for maleic anhydride and COx formation on the concentration of O2. The concentration of
n-butane is 5.0 % and the reaction temperature is 663 K. rMA, rcox and Pn-butane represent rate for maleic anhydride, COx formation and concentration ofn-butane, respectively: (0) VPO-org, (D) VPO-redu, and (D) VPO-aq.
Chapter 2

Discussion
Kinetics and sUrface oxidation state
From Figs. 8 and 9, the kinetics for MA formation are shown by eqs. (3) and (4), where rMA
and r'MA are rates of MA formation. PII-butane and Pm are concentrations of n-butane and O2,
respectively, and k and k' represent the rate constants.
kP 0.6p 0.4 rMA = II-butane 02
, - k'P 0.3 p 0.4 r MA - II-butane 02
(VPO-org)
(VPO-redu and VPO-aq)
(3)
(4)
The higher reaction order of n-butane concentration on VPO-org gives rise to the higher catalytic
performance at the high n-butane concentration.
The selective oxidation of n-butane over (VO)2P207 has been considered to proceed via a
redox mechanism at the surface layers [12,13,16,20]. On the basis of this mechanism, the MA
formation can simply be described in the fol lowing two steps [12, 17], where [ ] and [0] represent
the amount of reduced sites and the amount of oxidized site of catalyst, respectively. O2, Bu and
MA represent oxygen, n-butane and MA in a gas phase, and kox and kre are reaction constants of
re-oxidation and reduction of catalyst surface, respectively.
kox ~ [0]
[0] + Bu
(5)
(6)
When the reaction reached the stationary state, the rate of re-oxidation is equal to that of reduction,
and the stationary oxidation state of the surface is proportional to ko, / kre . The general expression
for the rate of MA formation is expressed in eq. (7) from this process [12].
(7)
a +---
kre P n -butane
Here a indicates the stoichiometric number of moles of O2 required for this reaction (a =3.5).
In the expression, if the rate of reduction is much lower than that of re-oxidation (kox»kre), the
34

· d t k P I.0p 0.0 expressIon re uces 0 re n-butane 02. On the contrary, if the rate of reduction much higher than
that of re-oxidation (kre»kox), the expression becomes koxu- I Pn-butaneOOP02l.o. The ratio of the
reaction order on n-butane concentration (n) to that of O2 concentration (m) is thus related to the
ratio of the rate of re-oxidation to that of reduction, i.e., koxlkre . As the kox/kre becomes higher, nlm
will become larger. It is suggested that koxlkre on VPO-org is higher than those on VPO-redu and
VPO-aq from the ratio of nlm; 1.5 on VPO-org and 0.75 on VPO-redu and VPO-aq. This
indicates that the surface of VPO-org is in a higher oxidation state during the reaction. As shown
in Fig. 4, the estimated amounts of V5+ at the stationary state differed greatly from one catalyst to
another. The density of V5" was 11.2, 7.4, and 6.0 !1 mol m-2 on VPO-org, VPO-redu, and
VPO-aq, respectively; that is, the V5+ density of VPO-org was about twice those of VPO-redu and
VPO-aq, which indicates that VPO-org is more readily oxidized with O2, and in the higher
oxidation state during the catalytic oxidation of n-butane. As a matter of fact, the specific rate of
re-oxidation of VPO-org was higher than those of VPO-redu and VPO-aq (Fig. 5 and Table 2).
The high catalytic performance of VPO-org at the high n-butane concentration is due to the high
re-oxidizability. By this, the catalyst surface is retained to be an appropriate oxidation state under
the highly reducing reaction conditions.
The next question is why the surface of VPO-org is more readily oxidized compared to that
of VPO-redu and VPO-aq. Two possible reasons should be considered. The first is the influence
of the PlY ratios. Hodnett et al. reported [21] that the rate of the re-oxidation of (VO)2P207
decreased as the bulk PlY ratios increased. However, as shown in Table 1, both the bulk and
surface PlY ratios of VPO-org were almost the same as those of VPO-redu. Therefore it is
difficult to explain the different kinetics between VPO-org and VPO-redu in terms of a difference
in the PlY ratios.
The second is the influence of the structural disorder of the catalyst. Busca et al. suggested
[5] that the structural disorder affected the redox property of (VO)2P207. Satsuma et al. also
reported [22] that the activity of the surface v=o species depended on the structural disorder of the
catalyst. It is generally accepted that the reflection peak of the (100) plane of (VO)2P207 prepared
by the organic solvent method is broad due to the disorder of the (VO)2P207 crystallites along the
vertical direction against the (100) plane [5, I 0]. As shown in Fig. I, the diffraction from the
(100) plane of VPO-org was broader than those of the VPO-redu and VPO-aq. Furthermore, as
35

shown in Fig. 2, the peaks of 799 cm- I (v (Y -O=Y)) and 1218 cm- I (v (PO})) of YPO-org were
weaker than those of YPO-redu and YPO-aq. These results also suggest the existence of
structural disorder in YPO-org [5,6, I 0]. Therefore, it is concluded that the structural disorder of
YPO-org is responsible for the high re-oxidizability ofYPO-org.
An isotopic study revealed that the rate-determining step is a hydrogen abstraction from
n-butane [12]. The surface oxygen atoms supplied from gas-phase O2 are probably active oxygen
species, because n-butane was oxidized only after the (YO)2P207 was oxidized with O2 in the pulse
study [12-14]. For this key step, the abstraction of hydrogen from n-butane, it is likely that the
specific reaction rate (per active site) is proportional to the pressure of n-butane under a certain
oxidation state of the surface, since the adsorption of n-butane at the sites is weak. The overall
reaction rate is considered to the product of the specific reaction rate (per active site) and the
amount of active oxygen atoms. The amount of active oxygen atoms corresponds to that of y S •.
It is reasonably deduced that the amount of y 5+ during the reaction is negatively dependent on the
concentration of n-butane. By combination of the specific reaction rate (ex: Pn_butaneIO) and the
amount of y 5+ (ex: PII_butane-X, 0 < x < 1), the reaction order of n-butane concentration might be less
than unity.
On the other hand, the kinetics for COx formation are shown by eqs. (8) and (9) from Figs. 8
and 9, where rco, and r' COx are the rates of COx formation.
00 04 rco, = kco, PI1-butanc Pm (YPO-org)
, k' pOI P 06 r CO, = COx II-bulane 02 (YPO-redu and YPO-aq)
(8)
(9)
COx formation has been considered to take place on the different sites from those of MA formation
[23]; for example, this concerns with adsorbed oxygen species [24,25]. As a matter of fact, the
reaction order of n-butane concentration for COx formation was nearly zero, which was different
from that of the MA formation.
Applications to operations at high concentrations of n-butane
From an industrial viewpoint, the operation under a higher n-butane concentration makes it
possible to achieve a higher space-time yield of MA. To realize such a operation, we need a
36

catalyst exhibiting a high activity, selectivity and stability under the high n-butane concentration.
As shown in Fig. 6, it was confirmed that the deactivation of VPO-org was little under 5.0 %
n-butane.
As shown in Fig. 8, the rate of MA formation effectively increased over VPO-org as the
n-butane concentration increased. On the other hand, the rate of CO, formation was independent
of n-butane concentration over VPO-org, while those over VPO-redu and VPO-aq slightly
increased with the increase in n-butane concentration. As the result, the selectivity to MA on
VPO-org increased greatly with the increase in n-butane concentration (Table 3). It was
demonstrated that VPO-org is suitable for operation under the high n-butane concentration for both
high activity and selectivity.
It is well known that the characteristic properties of an "equilibrated catalyst", which has
been kept in a reaction mixture for several hundreds hours, is a good crystallinity [3,26,27] and the
formation of stable V4+ [27]. Shima et al. [28] reported that the equilibrated catalysts exhibit a
great dependence of the catalytic activity on the O2 concentration, and also pointed out the
importance of re-oxidation process over the equilibrated catalysts.
The selectivity to MA decreases at a high conversions due to the consecutive oxidation of
MA [6, \8,29]. In the case of the operation under a high n-butane concentration, the MA
concentration becomes higher. Therefore the influence of these concentration for the consecutive
oxidation of MA is of great importance if one operates at the high n-butane concentration.
Conclusion
Selective oxidation of n-butane to MA was investigated with a wide range partial pressures
of n-butane and O2 using three types of (VO)2P207 catalysts. It was revealed that the catalysts,
exhibiting the higher catalytic performance for MA formation, possessed high redox ability,
especially re-oxidation. The higher ability of re-oxidation caused appropriate oxidation state of
the surface for MA formation. The higher redox ability is probably brought about from the
structural disorder of the catalyst. These results established that the re-oxidation ability should be
improved for improving the catalytic activity.
37
References
[1] B. K. Hodnett, Cata!. Rev. Eng., 17 (1985) 373.
[2] E. Bordes, Cata!' Today, 1 (1987) 499.
[3] G. Centi, F. Trifiro, J. R. Ebner and V. M. Franchetti, Chern. Rev., 88 (1988) 55.
[4] G. J. Hutchings,Appl. Cata!., 72 (1991) 1.
[5] G. Busca, F. Cavani, G. Centi and F. Trifiro, J. Catal., 99 (1986) 400.
[6] H. Igarashi, K. Tsuji, T. Okuhara and M. Misono, J. Phys. Chern., 97 (1993) 7065.
[7] E. Bordes and P. Courtine, J. Solid State Chem., 55 (1984) 270.
[8] T. Shimoda, T. Okuhara and M. Misono, Bull. Chem. Soc. Jpn., 58 (1985) 2163.
[9] G. Ladwing, Z. Anorg. Allg. Chem., 338 (1965) 266.
[10] M. L. Granados, J. C. Conesaand M. Fernandez-Garcia,J. Cata!., 141 (1993) 671.
[11] T. Okuhara, T. Nakama and M. Misono, Chern. Lett., (1990) 1941.
[12] M. Pepera, J. L. Callahan, M. J. Desmond, E. C. Milberger, P. R. Blum and N. J. Bremer, J.
Am. Chern. Soc., 107 (1985) 4883.
[13] G. Koyano, T. Okuhara and M. Misono, Cata!. Lett., 32 (1995) 205.
[14] G. Koyano, T. Okuhara and M. Misono,.J. Am. Chem. Soc., 120 (1995) 767.
[15] T. Okuhara and M. Misono, Calal. Today, 16 (1993) 61.
[16] F. B. Abdelouahab, R. Olier, N. Guilhaume, F. Lefebvre and J. C. Volta . .J. Cata/., 134 (1992)
151.
[17] S. K. Bej and M. S. Rao,Ind. Eng. Chem. Res., 30 (1991) 1824.
[18] G. Centi, G. Fornasari and F. Trifiro, Ind. Eng. Chern. Prod. Res. Dev., 24 (1985) 32.
[19] F. Cavani, G. Centi and F. Trifiro, Appl. Catal., 15 (1985) 151.
[20] G. H. Hutchings, A. D. Chomel, R. Olier and J. C. Volta, Nature, 368 (1994) 41.
[21] B. K. Hodnett and B. Delmon, Appl. Cata!., 15 (1985) 141.
[22] A. Satsuma, Y. Tanaka. T. Hattori and Y. Murakami, Appl. Surf Sci., 1211122 (1997) 496.
[23] K.lnumaru, T. Okuhara and M. Misono, Chem. Lett., (1992) 947.
[24] U. Rodemerck, B. Kubis, H.-W. Zanthoff and M. Baerns, Appl. Cata!' A, 153 (1997) 203.
[25] J. T. Gleaves, J. R. Ebner and T. C. Kuechler, Catal. Rev.-Sci. Eng., 30 (1988) 49.
[26] F. Cavani and F. Trifiro, Chem/ech, 18 (1994).
[27] F. Trifiro, Cata!. Today, 16 (1993) 91.
38

[28] K. Shima and M. Hatano, Appl. Surf Sci., 1211122 (1997) 452.
[29] T. P. Moser, R. W. Wenig and G. L. Schrader, Appl. Catal .. 34 (1987) 39.
39


Chapter 3
Acidic Property as a Factor Controlling Catalytic
Performance in the Selective Oxidation of
n-Butane

Chapter 3
3.1 Dimethylpyridine-temperature programmed desorption method for
quantitative determination of Brensted and Lewis acid sites on solid acid
catalysts
Abstract
Temperature-programmed desorption of dimethylpyridine (DMP-TPD) was established for
quantitative measurement of strengths and amounts of Brensted acid and Lewis acid sites on metal
oxide catalysts.
typical samples.
Alumina, alumina-boria, silica-magnesia, and silica-alumina were employed as
From IR spectra of adsorbed pyridine and ammonia, it was confirmed that Lewis
acid sites were abundant on alumina, Bremsted acid sites were abundant on alumina-boria, and both
were present on silica-magnesia and silica-alumina surfaces. TPD spectra of 2,6-DMP on alumina
depended on purging temperatures. The amount of desorbed 2,6-DMP decreased with the increase in
the purging temperature, and only negligible amount of 2,6-DMP was detected with the purging of
523 K. These results suggested the selective adsorption of 2,6-DMP on the Brensted acid sites.
Selective adsorption of 2,6-DMP on Brensted acid sites was also confirmed from in-situ IR spectra.
The steric hindrance of the methyl groups would be due to the selective adsorption on the Brensted
acid sites. On the other hand, 3,5-DMP was adsorbed on Lewis acid sites of alumina. In the case of
alumina-boria on which Brensted acid sites are abundant, both 2,6-DMP-TPD and 3,5-DMP-TPD
spectra showed similar desorption profiles. Profiles of acid strength determined from DMP-TPD
were agreed well with those determined from IR spectra of 3,5-DMP adsorbed on silica-magnesia.
From these results, it was elucidated that 3,5-DMP-TPD, 2,6-DMP-TPD and the differential spectra
indicate the total. Brensted and Lewis acid sites, respectively.
Introduction
Temperature-programmed desorption of basic molecules is a popular method for determination
of acid amount of solid catalysts as well as acid strength, because this is an easy and reproducible
method [1-5]. Ammonia is frequently used as a probe molecule because of its small molecular size,
stability and strong basicity (pKa=9.2). Theoretical analysis ofNH3-TPD spectra has also been done,
thus, one can estimate the change of enthalpy and the activation energy for desorption of NH3 on the
42

Chapter 3
basis of such a theoretical analysis [6-11]. There have also been some attempts by using pyridine as
a probe molecule in TPD [12,13]. Although the application of Py-TPD is not suitable for porous
materials because the steric factor plays a dominant role in diffusion in zeolite channels [10], it was
demonstrated that Py-TPD is applicable to superacids and binary oxide catalysts [13,14]. A good
correlation can be obtained between the Ho values of the highest acid strength (Ho,max) determined by
the Hammett method and the termination temperature of pyridine desorption.
Since ammonia and pyridine adsorb on both Bronsted and Lewis acid sites, the determination of
respective strength of acid sites is impossible by using only NH}-TPD and Py-TPD. Bronsted and
Lewis acid sites play different roles in various types of catalytic reactions, and the strength of
respective acid sites strongly affects the catalytic performance [4]. Therefore, there is a significant
motivation to develop an easy and reproducible method for the quantitative measurement of both
strength and amount of Bronsted and Lewis acid sites, separately. It has been reported that
dimethylpyridine (DMP) is useful probe for the selective determination of the Bronsted acid sites.
Benesi [15] suggested that 2,6-dimethylpyridine (2,6-DMP) can be used as a proton specific probe.
Several researchers also applied 2,6-DMP as a probe for Bronsted acid sites in static IR measurements
[16-19]. Jacobs et al. [16] reported that 2,6-DMP was strongly adsorbed on Bronsted acid sites of
Y -zeolite, but it also formed weaker bonds with Lewis acid sites. The formation of weak bonds
between 2,6-DMP and Lewis acid sites was also reported in the cases of alumina and boron phosphate
as well as Y -zeolite [17-19]. According to their reports, suitable adsorption temperature must be
required in order to apply 2,6-DMP as a selective probe for detection of the Bronsted acid sites.
Although Sato et al. [20] suggested the possibility of use of 2,6-DMP for the determination of
Bronsted acid sites, the selective adsorption of 2,6-DMP was not verified and the scope ofthis method
is still unclear.
In this section, the possibility of use of 2,6-DMP and 3,5-DMP as probe molecules for the
determination of the acid strength of Bronsted and Lewis acid sites was investigated. For the
verification of use of DMP-TPD, the adsorption state of DMP molecules are studied by in-situ IR
spectra.
43

Chapter 3
Experimental
Catalysts
Solid acid catalysts used in this study are listed in Table 1. Alumina, silica-magnesia,
silica-alumina and H-mordenite were supplied from the Committee on Reference Catalysts of the
Catalyst Society of Japan. Alumina-boria catalyst was prepared by impregnation of alumina
(JRC-ALO-I A) with an aqueous solution of H3B04 followed by evaporation at 353 K for 5 h [21].
The content of supported boria was 30 wt%. The obtained solid was dried at 403 K for 3 h in air and
then calcined at 673 K for 5 h in air.
Table 1 List of solid acid catalysts examined in this study.
catalyst
alumina silica-magnesia silica-alumina alumina-boria H-mordenite
source
JRC-ALO-l A (Sumitomo Chemical) JRC-SM-l (Mizusawa Industrial Chemicals) JRC-SAH-l (Catalysts & Chemicals) Prepared (70wt% alumina- 30wt% boria) JRC-Z-HMIO (Tosoh Corp.)
Temperature Programmed Desorption (TPD)
BET surface area /
2 -I mg 160 353 513 86
TPD measurement was performed by using the same apparatus reported in the literature [14].
Pyridine (Py), 2,6-dimethylpyridine (2,6-DMP) and 3,5-dimethylpyridine (3,5-DMP) were used as
probe molecules. A U-shaped tube made of quartz was used as the sample cell. A catalyst of 100
mg was placed in a sample cell and pretreated at 673 K for 2 h in flowing dehydrated helium at
150 cm' min-I. After cooling to prescribed temperature, the catalyst was exposed to a stream of the
probe molecule diluted in helium for 30 min. The probe molecule was saturated in helium at
300-330 K. The equilibrium adsorption was confirmed by the concentration of the probe molecule
passed through the catalyst. Then, the sample was left in flowing helium at the same temperature for
120 min in order to purge any excess and/or weakly adsorbed probe molecule. This temperature was
termed "purging temperature" hereafter. Finally, the TPD measurement was performed from the
purging temperature to 1073 K at 5 K min-I. The desorbed probes were detected with a
flame-ionization detector (FlO) because of its high sensitivity to organic molecules and no influence
by water vapor. The line between the sample cell and the FlO detector was heated at 400 K.
44

Chapter 3
In-situ Infrared Spectra
The infrared spectra were measured with JASCO FT/IR-300 equipped with a quartz cell and a
flow system similar to that used in the TPD measurement [14]. A self-supported catalyst disk (ca.
40 mg) was placed in a quartz cell. The sample was pretreated at 673 K for 120 min in helium at
150 cm3 min-I. A background spectrum was measured in flowing helium after cooling to the
prescribed temperature, and then 20 mm3 of probe molecule or 20 cm3 of ammonia was injected into a
stream of helium with heating. After purging in flowing helium for 120 min, infrared spectra were
measured in the following conditions: scan, 100 times; resolution, 2 em-I; detector, TGS.
Results and discussion
IR spectra of adsorbed pyridine
Table 2 summarized the absorption bands of pyridine adsorbed on the metal oxide catalysts at
473 K. In the case of alumina, the adsorption bands were observed at 1620, 1614, 1575, 1492 and
1450 em-I. These bands were assigned to coordinately held pyridine [22]. No band was observed in
OH stretching region, 3700-3800 cm- I. These results indicate that Lewis acid sites are abundant on
alumina surface, being in agreement with the general knowledge that alumina is a typical solid Lewis
acid [18]. On silica-magnesia and silica-alumina, the bands for pyridine adsorbed on both Bronsted
and Lewis acid sites were observed. Negative bands were also observed at 3730-3740 em-I after the
adsorption of pyridine, indicating the adsorption of pyridine on surface OH group. With increasing
in the purging temperature, the absorption bands of pyridine almost disappeared on silica-magnesia at
773 K, while the small bands due to pyridine adsorbed on Lewis acid sites remained on silica-alumina.
In the case of alumina-boria, although the bands around 1640-1428cm· 1 and negative band
around 3702-3686 em-I were observed, absorbance below 1600cm-1 was near to zero because of strong
absorption of alumina-boria itself. The negative bands around OH stretching region indicates the
presence of Bronsted acid sites, however, the presence or absence of Lewis acid sites cannot be
determined. Then, the presence of Lewis acid sites on alumina-bolia was examined with IR spectra
of adsorbed ammonia at 423 K. At the boria content of 3wt%, a small absorption band was observed
at 1620 cm- I, which is attributable to ammonia adsorbed on Lewis acid sites [22]. At the boria
content of 30%, the band at 1620 cm- I was not observed and the negative bands at 3671-3705 cm- I
45

Chapter 3
were observed, indicating the increase in Bmnsted acid sites at the sacrifice of disappearance of Lewis
acid sites. This result agreed well with the report that the boria content of 30 wt% is enough amount
for the covering all the surface of alumina with boria [21].
Consequently, the solid acid catalysts examined in this study were classified into three
categories: (I) Alumina having Lewis acid sites in abundance, (2) 30wt% alumina-boria having
Bnmsted acid sites in abundance, and (3) silica-magnesia and silica-alumina having both Bmnsted
acid and Lewis acid sites, and the Lewis acid sites of the silica-alumina were very stmng.
Table 2 Wavenumber of absorption bands on IR spectra of adsorbed pyridine at 473 K.
mode assignment a) wavenumber / cm-' alumina silica-magnesia silica-alumina
8a B 1637 1636 8a L 1620, 1614 1607 1620 8b Band/or L 1575 1573 1575 19b B 1543 1542 19a Band/or L 1492 1490 1491 19b L 1450 1446 1454
a) B, pyridinium ion on Bmnsted acid site; L, coordinately held pyridine on Lewis acid site
Alumina: Selectivity in adsorption of dimethylpyridines on Lewis acid sites
In order to examine the selectivity in adsorption of dimethylpyridines on Lewis acid sites,
alumina was employed as a model for Lewis acid catalyst. Fig. I shows the TPD spectra for
2,6-DMP adsorbed on alumina after purging at various temperatures. The spectrum after purging at
423 K showed a sharp desorption peak having a maximum at ca. 500 K and a broad peak at 650-900 K.
The integrated amount of desorbed 2,6-DMP was 1.59 x 10⁻⁴ mmol mol. As the purging temperature
increased, the amount of desorbed 2,6-DMP significantly decreased. When 2,6-DMP was purged at
523 K, only a negligible amount of2,6-DMP (2.33 x 10⁻⁶ mmolm-C) desorbed at 520 - 1073 K.
Figs. 2a and 2b show 3,5-DMP-TPD spectra of alumina. When the TPD run started fmm 423
K, the spectrum showed a bmad peak having a small shoulder above 600 K. Starting from 523 K, the
single peak having a maximum at 640 K was observed. The desorbed amount of 3,5-DMP started
form 523 K was 2.33 x 10⁻⁴ mmol m-2, which was larger enough than that of2,6-DMP (Fig. 2c).
46

Chapter 3
20~---------------------"7 ~
N , 8 15 ...... 0 8 8
r--, 10 0 ......
---Q)
~ ;....,
c 5 23 K 0 .-...... e-. 0 (/) Q)
0 0
400 500 600 700 800 900 1000 1100 Temperature (K)
Fig. 1 TPD spectra for 2,6-DMP adsorbed on alumina after purging at various temperatures.
N
'8 30 ........ o 8 8
r--o 20 ......
---Q)
~ ;....,
c 10 o .-...... e-. o (/) Q)
o 0
a
b ~ ... , \
I \ I \
I \ I \ I \ I \
I \ I \
I , I \
I ' I
~~~~~~~~~~~--~~~
400 500 600 700 800 900 10001100
Temperature (K)
Fig. 2 TPD spectra for dimethylpyridines adsorbed on alumina. 3,5-DMP after purging at
(a) 423 K and (b) 523 K, and (c) 2,6-DMP after purging at 523 K.
47

Chapter 3
Figure 3 shows the IR spectra of 2,6-DMP adsorbed on alumina at various temperatures. The
absorption bands were observed at 1618, 1574, 1462, and 1387 cm- I in IR spectra of adsorbed
2,6-DMP at 423 K. According to the assignment in literature [16-19], the bands at 1618 and 1574
cm- I was attributed to 8a mode of the 2,6-DMP adsorbed on the Lewis acid sites, and those at 1462
and 1387 cm- I to DasCH, stretching and DsCH, stretching mode, respectively. These absorption bands
gradually decreased with the purging temperature. The weak bands at 1648 and 1633 cm- I may be
due to 8a and 8b mode of dimethylpyridinium ion adsorbed on Bronsted acid sites, and the intensities
of these bands steeply decreased at 473 K. The detection of Bronsted acid sites by 2,6-DMP may be
due to the stronger basicity, i.e., higher pKa value, of 2,6-DMP than pyridine, however, the Bronsted
acid sites are very weak because adsorbed 2,6-DMP molecules were purged at 523 K. Thus, the
results indicate that there is no contribution of Bronsted acid on 2,6-DMP adsorption after purging
above 523 K. The band at 1490 cm- I was attributed to the 19a mode of2,6-DMP on both Bronsted
and Lewis acid sites. Because of the disappearance of the bands at 1633 and 1648 em-I at 523 K, the
band at 1490 em-I was assigned to 2,6-DMP on Lewis acid sites. After purging at 523 K, the
intensities of all bands finally became very small, indicating that the purging at 523 K is practically
sufficient for eliminating adsorbed 2,6-DMP on Lewis acid sites of alumina.
0.5.-_______ -, 1.0 r--------------------,
Abs.
423K
Abs.
3400
1618
1633
16481 1
1
1462
1574 149() 13R7
1
423K
473K
523K
Wavenumber/cm- I
Fig.3 IR spectra of2,6-DMP adsorbed on alumia at various temperatures.
48

Chapter 3
From the IR spectra, it was clarified that 2,6-DMP was coordinately held on Lewis acid sites at
lower temperature. This may be due to rather weak effect of the steric hindrance caused from the
two methyl groups neighboring basic site of pyridine. The weak bond between 2,6-DMP and Lewis
acid sites at low temperature was also reported previously [16-19]. The amount of 2,6-DMP
adsorption was strongly dependent on the purging temperature, and it was found that the coordinately
adsorbed 2,6-DMP on Lewis acid sites can be eliminated by purging at appropriate temperature, i.e.,
above 573 K. Therefore, for the selective adsorption of 2,6-DMP on Bremsted acid sites, the
importance of purging temperature in TPD experiment was indicated. As a result of comparison
between 2,6- and 3,5-DMP-TPD, the amount of desorbed 2,6-DMP was less than I % of that of
3,5-DMP, which is a practically negligible amount for the measurement of respective amount of
Bmnsted and Lewis acid sites using these probe molecules.
Consequently, by employing the appropriate purging temperature, 2,6-DMP is selectively
eliminated from Lewis acid sites, and, on the other hand, 3,5-DMP adsorbs both Bmnsted and Lewis
acid sites. Thus, in order to obtain the selective adsorption of 2,6-DMP on Bronsted acid sites, the
purging temperature of DMP-TPD was fixed at 573 K, hereafter.
Alumina-Boria: Comparison ofTPDprofiles of2,6-DMP and 3,5-DMP
Fig. 4 shows the IR spectra of 2,6-DMP adsorbed on alumina-boria. The absorption band was
observed at 1630, 1642 and 1685 cm-1• Below 1600cm-1
, no signal was observed because of strong
absorption band of B-O vibration [21]. The bands at 1630 and 1642 cm- I were attributed to the
dimethylpyridinium ion adsorbed on alumina-boria [16-19]. This assignment was also supported
from the changes in the spectra at OH stretching band region, i.e., the negative absorption bands were
observed at 3686, 3702 and 3785 cm- I, those should be due to a bond between 2,6-DMP and Bmnsted
acid site on alumina-boria. The intensities of these bands were monotonously decreased and the
negative bands above 3600 cm- I recovered with increasing temperature. These results indicate that
2,6-DMP was adsorbed on the Bmnsted acid sites of the alumina-boria.
49

Chapter 3
0.2,....---------2.0 ,....-________________ _
1642
1685
Abs. Abs. 423K
473K
523K
673K
0.0 L-..L-...l..---L---L-L.--L---L--l 0.0 '--_'--~'----l_--'_---L_---L_---L_---L_----.J 3800 3700 3600 1700 1600 1500 1400 1300
Wavenumber/cm- 1 Wavenumber/cm- '
Fig.4 IR spectra of2,6-DMP adsorbed on alumina-boria at various temperatures.
By using alumina-boria having Bmnsted acid as abundant acid sites, difference of the
adsorption temperatures for 2,6-DMP and 3,S-DMP was compared. Fig. S shows the TPD spectra of
pyridine, 2,6-DMP and 3.S-DMP from alumina-boria catalyst. The TPD measurements were started
from S23 K, as described in previous section. On the contrary to the DMP-TPD of alumina, the
2,6-DMP and 3,S-DMP-TPD spectra of alumina-boria showed similar desorption profiles, i.e., the
maximum rate was observed at ca. 620 K, and the desorption of DMP terminated at 8S0 K. 2,6-DMP
desorbed at slightly higher temperatures than 3,S-DMP. The integrated amount of des orbed DMP
was 7.40 x 10⁻⁴ mmol m-2 for 3,S-DMP and 7.S2 x 10-4 mmol m-2 for 2,6-DMP, respectively. The
Py-TPD spectrum of the same catalyst gave a sharper profile than the DMP-TPD spectra. The
termination temperature in Py-TPD spectrum was 2S K lower than those ofDMP-TPD.
so

~ 60 ("'.l
I s ........
t-
o S S O ........
---
40
~ 20 ~
c .-....... e-
b
~ 0 ~ L-~~ __ L-~~ __ L-~~ __ ~-L~~
o 500 600 700 800 900 10001100 Temperature / K
Chapter 3
Fig.5 TPD spectra of (a) 3,5-DMP, (b) 2,6-DMP, and (c) pyridine adsorbed on alumina-boria.
On Bronsted acid sites, 3,5-DMP and 2,6-DMP gave similar TPD profiles. As confirmed in
the previous section, 3,5-DMP adsorbs on Lewis acid sites, while the adsorption of2,6-DMP on Lewis
acid sites is negligible. These results suggest that it is possible to distinguish the profile of acid
strength of Bnmsted and Lewis acid sites by using DMP-TPD. The Py-TPD spectrum was, however,
different from those of 2,6- and 3,5-DMP-TPD, due to the difference in the basic strength. The basic
strength of the probe molecules, pKa, is 5.25 for pyridine, 6.15 for 2,6-DMP, and 6.77 for 2,5-DMP
[18]. Since pyridine is weaker base than DMPs, the Py-TPD spectrum was observed at a lower
temperature as a sharper peak. On the other hand, the integrated amounts of desorbed 2,6-DMP and
3,5-DMP were almost the same, indicating both 2,6-DMP and 3,5-DMP adsorbed on the same acid
sites. Because of the abundance of Bronsted acid sites on alumina-boria and selective adsorption of
2,6-DMP on Bremsted sites in the conditions employed, both 2,6-DMP and 3,5-DMP should desorb
from Bronsted acid sites. Furthermore, these DMP-TPD spectra gave the similar profile. Therefore,
small difference in the values of pKa can be neglected in the DMP-TPD spectra, and thus, the
differential spectrum of 2,6-DMP and 3,5-DMP may be an indicator of relative strength of Lewis acid
sites.
51

Chapter 3
Silica-Magnesia: DMP-TPDfor Determination of Brons ted and Lewis Acid Sites
Fig. 6 shows the TPD spectra for 2,6-DMP and 3,5-DMP adsorbed on silica-magnesia.
Although both probes exhibited a single peak, the profiles of desorption and integrated amounts were
different. The desorption of 2,6-DMP terminated at 853 K, while that of 3,5-DMP terminated at
80 K higher than 2,6-DMP, i.e., 933 K. The amounts of desorbed DMPs were 3.20 x 10⁻⁴ mmol m-"
for 3,5-DMP and 1.70 x 10⁻⁴ mmol m-2 for 2,6-DMP, respectively. Fig. 6c shows the differential
spectrum of 3,5-DMP-TPD (6a) and 2,6-DMP-TPD (6b). Since it was confirmed in the previous
section that effect of basic strength of 2,6-DMP and 3,5-DMP on desorption temperature is negligible,
the differential spectrum of Fig. 6c and spectrum of 2,6-DMP may indicate the relative strength of
Lewis acid sites and Bf0nsted acid sites on silica-magnesia.
20~----------------------~
~ ";1
8 15 -0 b 8
8 ... ~ I \ r- \
I I \ 0 10
, \ ...- , \
---, \ , \
~ , \
~ , \ , \
~ , \
e 5 ' C )-'-'-', 0 , /'-,,, ,- f /_.r_,,_a/ " '..''Ii, ....... e ' / \
'/ \
0 U \ Ul Ii \
~ 1/ \
Cl 0 .,'
500 600 700 800 900 1000 1100 Temperature (K)
Fig. 6 TPD spectra of (a) 3,5-DMP and (b) 2,6-DMP adsorbed on silica-magnesia and
(c) a differential spectrum of(a)-(b).
Fig. 7 shows IR spectra of 3,5-DMP adsorbed on silica-magnesia. The absorption bands were
observed at 1624, 1600, 1564, 1465, 1434, 1389 and 1330 cm,l. Since the assignment of absorption
bands of 3,5-DMP has not been well examined so far, the IR spectra of 3,5-DMP adsorbed on
H-mordenite (HM) and alumina were also examined, as shown in Table 3. The absorption bands of
52

Chapter 3
3,5-DMP on HM calcined at 673 K were observed at 1624, 1567, 1465, 1390 cm'l, After calcination
at 873 K, the bands at 1600 and 1444 cm'l appeared, and the intensities of the bands at 1567 and 1465
cm'l reduced. It is well known that calcination of zeolites at higher temperature results in the
increase in Lewis acid sites [24]. In the case of alumina, absorption bands were observed at 1611,
1601, 1440 and 1388 cm'l. Thus, the bands at 1600 and 1444 cm'l can be attributed to 3,5-DMP
coordinately held on Lewis acid sites, while the bands at 1567 and 1465 cm'l to dimethylpyridinium
ion on Bmnsted acid sites. As for silica-magnesia, bands attributed to 3,5-DMP on both Bmnsted
acid and Lewis acid sites were observed. As shown in Fig. 7, these bands monotonously decreased
with increasing purging temperature. At 723 K, both the bands at 1600 and 1564 cm'l remained. A
negative band at 3736 cm'l in OH stretching region was also observed at 723 K. The trend in the IR
bands suggests that the strength of Bremsted and Lewis acid sites on silica-magnesia are comparable.
For a detail analysis of the desorption of 3,5-DMP, the IR bands at 1600 cm'l and 1564 cm'l
were deconvoluted using Gaussian curve, as shown in Fig.8. The integrated intensity of the IR bands
and the amount of adsorbed dimethylpyridine determined from the DMP-TPD were compared in Fig.
9. The depletion of the band at 1564 cm'l was agreed very well with that of the integrated
2,6-DMP-TPD spectrum. The intensity of the band at 1600 em'l decreased along with the integrated
amount of the differential spectrum of 3,5-DMP and 2,6-DMP. These results clearly demonstrates
that the combination of 2,6- and 3,5-DMP-TPD is applicable for the separation of the profiles of acid
strength of Bremsted and Lewis acid sites on metal oxide catalysts.
Table 3 Wavenumber of absorption bands on IR spectra of 3,5-DMP adsorbed on catalysts at 423 K.
tentative wavenumber / em" assignment a) HM calcined HM calcined alumina sil ica-magnesia
at 673 K at 873 K Band/or L 1624 1620 1611 1624
L 1600 1601 1600 B 1567 1567 1564 B 1465 1465 1465 L 1444 1440 1434
Band/or L 1390 1390 1388 1389
a) B, dimethylpyridinium ion on Bmnsted acid site; L, coordinately held dimethylpyridine on Lewis acid site
53

Chapter 3
I.0r--_________________ -,
1600 1434
1564
3800 Wavenumber/cm- I 3700 Wavenumber/cm- I
Fig. 7 IR spectra of 3,5-DMP adsorbed on silica-magnesia at various temperatures.
0.15
1i 0.1 oj
-€ ~ -'" < 0 05
oL-~~~_~~~~~L-L--
1640 1610 1600 1580
015 623K
" u c: oj
-'" ~
01
;'i: 0.05
0.15
g 0.1
.e ~ -'" « 0 05
1620 1600 1580 1560
723K
1540
o~~~~~-~~~~-~
1640 1610 1600 1580 1560 1540
Wavenumber I CI11-1
Fig. 8 Deconvolution of IR band of
3,5-DMP adsorbed on silica-magnesia at
523 K, 673 K and 723 K.
~ 20~------------------,3 E • '0 E E
Cl
1=10
0-~
, , , , Jii.,
:; \~ ~ , -£ \.
0::
2 c
~ " ... ~ 0 0
500 600 700 800 900 1000 1100 Temperature / K
Fig. 9 Comparison of integrated amount of
adsorbed dimethylpyridines on
silica-magnesia detected by DMP-TPD and
in-situ IR. Lines represent the amount of
Bmnsted acid (solid line) and Lewis acid
(broken line) determined from DMP-TPD.
Symbols represent the integrated intensity of
IR bands of 3,5-DMP at 1564cm- I(.) and
1 t:()(,~.~-I { \
54

Chapter 3
Silica-Alumina: Scope of application of DMP-TPD
Fig. 10 shows the TPD spectra for DMP adsorbed on silica-alumina. As for the 3,5-DMP-TPD
spectra, two desorption peaks were observed at 620 K and 900 K, respectively. The desorption
temperature was about 100 K higher that that of 3,5-DMP-TPD spectrum of silica-magnesia. This is
reasonable that HO,max of these metal oxides is -11.99 for silica-alumina and -8.2 for silica-magnesia,
respectively [14]. 2,6-DMP-TPD showed a broad peak at 620 K, and terminated at 900 K.
~ N
'8 -I"-
o 8 8 '0 .-. -~ s:: o .~ o en Q)
o
15r-----------------------~
10
5
o
, , \
\ \ \ \ \ \ \ \ \
~~~--~~--~~--~~~~~~~
500 600 700 800 900 1000 1100 Temperature (K)
Fig. 10 TPD spectra of (a) 3,5-DMP and (b) 2,6-DMP adsorbed on silica-alumina.
Fig. II shows the IR spectra of2,6-DMP adsorbed on silica-alumina. The band at 1638,1618,
and 1582 cm- I were deconvoluted in the same manner as shown in Fig. 8. The intensity of the band
at 1638 cm- I, due to 2,6-DMP on Bmnsted acid sites, decreased with increasing temperature. On the
other hand, the intensities of the band at 1618 cm- I, due to 2,6-DMP on Lewis acid sites, was almost
unchanged. Furthermore, 2,6-DMP on Lewis acid sites remained after purging at 573 K which is 50
K higher than the purging temperature used in this study. The strong adsorption of 2,6-DMP on
silica:"alumina suggests that DMP-TPD is not effective for catalysts having very strong Lewis acid
sites, such as silica-alumina. Good performance of DMP-TPD can be obtained in the measurement
of solid acid catalysts having moderate acid sites such as silica-magnesia.
55

0.3,---------------,
~ O. t: ., ~
6 '" ~ 0.1
523 K
O . .lr--------------,
8 0 ~ of o ~ 0.1
573 K
Wavenumber / em-I
Fig. 11 Deconvolution of IR band of 2,6-DMP adsorbed on silica-alumina at 523 K, 673 K and 723 K.
Chapter 3
Table 4 summarized the amount of adsorbed
dimethylpyridines determined by DMP-TPD. The total
acid amount determined from 3,5-DMP-TPD was in the
range of 2.3-7.4 x 10⁻⁴ mmol m-2 for the catalysts
examined. In the case of alumina, the amount of
desorbed 3,5-DMP (2.33 x 10⁻⁷ mol m-2 = 0.14 nm-2) was
only about I % of surface AI'- site on (I II) plane of
y-Ab03 (14.5 A13+ nm-2
) [24]. DMP-TPD can detect
only a part of surface acid sites. The high purging
temperature, Le_, 523 K, may be one of the reasons for the
small amount of detectable acid sites. Large molecular
diameter of dimethylpyridines is also the possible reason.
However, the advantage in the use of the combination of
DMP-TPD is the applicability to determination of
Bronsted acid and Lewis acid strength of metal oxide
catalysts having moderate acid strength.
Table 4 Amount of dimethylpyridines adsorbed on metal oxide catalysts.
probe
3,5-DMpaj
26-DMpb) , (3,5-DMP) - (2,6-DMP)
alumina 2.33 0.02 2.31
a) 3,5-dimethylpyridine, b) 2,6-dimethylpyridine
Conclusion
desorbed amount / 10-4mmol m-2
boria-alumia 7.40 7.52
silica-magnesia 3.20 1.77 1.43
silica-alumina 3.73 1.70 2.03
The potential of DMP-TPD for the quantitative determ ination of both acid strength and amount
of Bronsted acid and Lewis acid sites on solid acid catalysts were examined, and the scope of this
method was clarified. The verification of the use of DMP was examined by using alumina and
56

Chapter 3
alumina-boria, on which Lewis acid sites and Bf0nsted acid sites are abundant on the surface,
respectively. The purging temperature should be more than 523 K, to obtain the selective adsorption
of 2,6-DMP on Bronsted acid sites. From the examination of DMP-TPD spectra of alumina-boria
catalyst of which the Bremsted acid sites are abundant, it was demonstrated that the small difference in
pKa of 2,6-DMP and 3,5-DMP is negligible in the desorption temperature of TPD profiles. It was
also demonstrated that the profiles of acid strength of Bf0nsted and Lewis acid sites on solid catalysts
can be measured by using both 2,6- and 3,5-DMP-TPD. The scope of the DMP-TPD was also
indicated, i.e., solid acids having very strong Lewis acid sites, such as silica-alumina, cannot be
determined with the measurement conditions used in this study.
References
[1] R. J. Cvetanovic, and Y. Amenomiya, Adv. Catal., 17 (1967) 103.
[2] K. Tanabe, in "Solid Acids and Bases - Their Catalytic Properties" Kodansha, Tokyo, Academic
Press, New York, (1970).
[3] K. Tanabe, M. Misono, Y. Ono and H. Hattori, in "New Solid Acids and Bases"
Kodansha-Elsevier, Tokyo (1989).
[4] A. Corma, Chern. Rev., 95 (1995) 559.
[5] W. E. Farneth and R. J. Gorte. Chern. Rev., 95 (1995) 615.
[6] M. Niwa, M.lwamoto. and K. Segawa, Bull. Chern. Soc. Jpn., 59 (1986) 3735.
[7] M. Sawa, M. Niwa and Y. Murakami, Zeolites, 10 (1990) 307.
[8] M. Niwa, N. Katada, M. Sawa, and Y. Murakami, J Phys. Chern., 99 (1995) 8812.
[9] N. Katada, H. igi, J. H. Kim, and M. Niwa, J Phys. Chern. B, 101 (1997) 5969.
[10] H. G. Karge, V. Dondur, and J. Weitkamp, J Phys. Chern., 95 (1991) 283.
[11] H. G. Karge and V. Dondur, J Phys. Chern., 94 (1990) 765.
[12] M. Kojima, M. W. Rautenbach and C. T. O'Connor, J Cata/., 112 (1988) 495.
[13] H. Matsuhashi, H. Motoi and K. Arata, Catal. Lett., 26 (1994) 325.
[14] A. Satsuma, Yenni Westi, Y. Kamiya, T. Hattori and Y. Murakami, Bull. Chern. Soc. Jpn., 70
(1997) 13 I I.
[15] H. A. Benesi, J Calaf., 28 (1973) 176.
57

[16] P. A. Jacobs, and C. F. Heylen, J. Calal., 34 (1974) 267.
[17] H. Knozinger, H. Krietenbrink, P. Ratnasamy, J. Calal., 48 (1977) 436.
[18] A. Corma, C. Rodellas, and V. Fornes, J. Calal., 88 (1984) 374.
[19] H. Miyata and J. B. Moffat, J. Calal., 62 (1980) 357.
Chapter 3
[20] S. Sato, M. Tokumitsu, T. Sodesawa, and F. Nozaki, Bull. Chern. Soc. Jpn., 64 (1991) 1005.
[21] Y. Izumi and T. Shiba, Bull. Chern. Soc. Jpn., 37 (1964) 1797.
[22] H. Knozinger, Adv. Calal., 25 (1976) 184.
[23] J. Ward, in J. A. Rabo, (Ed.), "Zeolite Chemistry and Catalysis (ACS Monograph, 171)" Am.
Chern. Soc., Washington, D. C., (1976) p. 140.
[24] H. Knozinger and P. Ratnasamy, Calal. Rev. Sci. Eng., 17 (1978) 31.
58

Chapter 3
3.2 Quantitative determination of acid sites on vanadyl pyrophosphate
catalysts and their function for MA formation
Abstract
Acidic properties of three types of (YO)2P207 catalysts were investigated by temperature
programmed desorption (TPD) using 3,5- and 2,6-dimethylpyridine as probes, and the selective
oxidation of n-butane to maleic anhydride (MA) was performed. YPO-org was prepared in organic
solvent, YPO-redu was obtained by reduction ofYOP04·2H20, and VPO-aq was prepared in aqueous
medium. 3,5-Dimethylpyridine (3,5-DMP) is adsorbed on both Bmnsted and Lewis acid sites,
whereas 2,6-dimethylpyridine (2,6-DMP) is selectively adsorbed on Bremsted acid sites due to the
steric hindrance of the two methyl groups, so the amounts and strengths of the Bmnsted and Lewis
acid sites could be determined separately. The (YO)2P207 catalysts had four types of acid sites: weak
and strong Bmnsted acid sites, and weak and strong Lewis acid sites. The acidic properties were
greatly dependent on the preparation methods as follows: YPO-org had a larger amount of the strong
Bmnsted acid sites and these acid sites were relatively weak. YPO-redu had a larger amount of the
strong Lewis acid sites and YPO-aq had fewer acid sites. The selectivity to MA at low conversion
increased with the amount of strong Lewis acid sites, indicating that the strong Lewis acid sites are
important for MA formation. The strong Bremsted acid sites may promote the consecutive oxidation
ofMA.
Introduction
Yanadyl pyrophosphate, (YO)2P207, demonstrates a characteristic activity for the selective
oxidation of n-butane to maleic anhydride (MA), and is used as the main component of industrial
catalysts for this reaction [1-4]. The catalytic performance of this catalyst greatly depends on the
preparation method and conditions [2,3]. Although many investigations have focused on this
reaction system, the nature of the active sites on the (YO)2P207 catalyst is still controversial.
Both redox sites and acid sites may be significantly involved in the selective oxidation of
paraffins over solid catalysts [5]. In addition, Bmnsted and Lewis acid sites have different functions
in selective oxidation, and the strength of these respective acid sites strongly affects the catalytic
nerformance [6]. Investigation of the involvement and function of acid sites on (VO)2P207 catalysts
59

Chapter 3
in the selective oxidation of n-butane has shown that the acid sites are necessary for this reaction,
since adding ammonia to the reaction feed and doping of potassium to the catalyst make the activity
for MA formation lowered [7]. Both Bmnsted and Lewis acids are present on (VOhP20 7 based on
the IR spectra of basic molecules adsorbed on the catalyst [8]. The ratio of Lewis to Bmnsted acid
sites has been estimated from the IR spectra of pyridine adsorbed on (VO)2P207 [9]. However,
quantitative determinations of individual Bronsted and Lewis acid sites have not been performed.
Temperature programmed desorption (TPD) of basic molecules is a useful method for the
determination of acid amount as well as acid strength of solid catalysts [10-13]. Ammonia is used
frequently as the probe molecule, but the amount and strength of the Bronsted and Lewis acid sites can
not be estimated separately, because of the non-selective adsorption of ammonia. Benesi [14]
suggested that 2,6-dimethylpyridine (2,6-DMP) could be used as a probe to selectively detect the
protonic sites due to steric hindrance of the two methyl groups near the nitrogen atom. In contrast,
3,5-dimethylpyridine (3,5-DMP) is adsorbed on both Bremsted and Lewis acid sites non-selectively.
Consequently, if both dimethylpyridines are used as probe molecules for TPD measurement, both the
amount and strength of Bronsted and Lewis acid sites can be determined.
The present section examined the acidic properties of (VO)2P207 catalysts by the DMP-TPD
method developed in former section (3.1). Further, the catalytic performance of three types of
(VO)2P207 catalysts were assessed for the selective oxidation of n-butane based on acidic properties.
On the basis of these investigations, the concept concerning the acidic property of the (VO)2P207
catalyst will be established to develop the catalyst of high catalytic performance.
Experimental
Preparation of catalysts
The same catalysts as the fonner section (Chapter 2) , that is, VPO-org, VPO-redu, and VPO-aq,
were used.
Temperature programmed desorption ojdimelhyipyridine (DMP-TPD)
DMP-TPD was performed using the same apparatus of the former section. 2,6-DMP and
3,5-DMP were used as the probe molecules. The sample powder (100 mg) was placed in the sample
cell and pretreated at 673 K for 2 h in a flow of dehydrated He at 150 cm3 min-I. After cooling to 523
60

Chapter 3
K under the He flow, the sample powder was exposed to a stream of the probe molecules diluted in He
for 30 min. Equilibrium adsorption was confirmed by measurement of the concentration of probe
molecules passed through the sample cell. The sample was kept at 523 K for 2 h in the He flow to
purge excess or weakly adsorbed probe molecules. The temperature of the sample powder was then
raised from 523 K to 1073 K at 5 K min-I in the He flow and the probe molecules desorbed from the
sample were detected with a flame-ionization detector (FlO, Shimadzu GC-9A). The line between
the sample cell and the detector was heated at 400 K.
Catalytic oxidation of butane
Catalytic oxidation of n-butane was carried out in a flow reactor (Pyrex tube, inside diameter of 6
mm) under atmospheric pressure at 723 K. A mixture of 1.5 vol% butane, 20 vol% O2 and N2
(balance) at a total flow rate of 10 cm3 min-I was fed over the catalyst bed. The conversion of butane
was controlled by the weight of the catalyst under the constant flow rate. The products were
analyzed with on-line gas chromatographs (FlO (Shimadzu 14A, Shimadzu 9A) and TCD (Shimadzu
9A)) equipped with a Porapak QS column (inside diameter 2.2 mm, length I m) for butane and MA,
and a Porapak N column (inside diameter 2.2 mm, length 2 m) for CO2• A Molecular Sieve 13X
column (inside diameter 2.2mm, length 4 m) was also used to separate O2, N2 and CO. CO and CO2
were converted to methane by using a Methanizer (Shimadzu MTN-I) for more sensitive detection by
the FIO-GC. Prior to the analysis, the catalysts were aged in the reaction mixture at 723 K for 10 h.
Results and discussion
Acidic property of the catalysts
Fig. I shows the TPD spectra of 2,6-DMP and 3,5-DMP, with the desorption rates expressed per
unit surface area. The differential spectra calculated by subtracting the 2,6-DMP-TPD spectra from
3,5-DMP-TPD ones are also shown. As verified in the former section (3-1), 2,6-DMP is adsorbed on
the BreJl1sted acid sites selectively with purging at 523 K for 2 h, unless very strong Lewis acid sites
with exceptional behavior are present. 3,5-DMP is adsorbed on both Bronsted and Lewis acid sites.
In the TPD spectrum of 3,5-DMP for silica-magnesia which has no very strong Lewis acid sites,
desorption of 3,5-DMP continued up to 950 K, but this desorption was scarcely observed over 900 K
for the (VO)2P207 catalysts. These results indicate that the (VO)2P207 catalysts do not have the very
61

5 N
I
E • 4
Q) ....... +-> I
~ ~ c · 3 o ..-.- 0 0.. E 5 E 2 rJ) \0 Q) I
m o 0 t-.:l
~ 1
-----0
I (a) I (b)
600 700 800 900 Temperature IK
600 700 800 Temperature IK
I (c)
900
('hapter 3
600 700 800 900 Temperature IK
Fig. 1 TPD spectra for ( ) 3,5-DMP, (- - - - - - ) 2,6-DMP adsorbed on (a) VPO-org, (b) VPO-redu, and (c) VPO-aq and (_. _. -. - . - ) differential spectra of (3,5-DMP) - (2,6-DMP).

Chapter 3
strong Lewis acid sites. The desorption temperatures of 2,6-DMP and 3,5-DMP adsorbed on one
material are demonstrated to be almost the same, although the chemical properties, e.g., pKb and
vaporization enthalpy, of these isomers are slightly different. Therefore, 3,5-DMP-TPD,
2,6-DMP-TPD and the differential spectra indicate the total, Bmnsted and Lewis acid sites,
respecti ve Iy.
The spectra confirmed that the (VOhP20 7 catalysts have both Bmnsted and Lewis acid sites [8].
The spectra of Bmnsted and Lewis acid sites exhibited two desorption peaks, indicating the existence
of at least four types of acid sites, that is, weak and strong Bmnsted acid sites, and weak and strong
Lewis acid sites, which are denoted as Bweak' B.,trong, Lweak and Lstrong, respectively. The acidic
properties of these catalysts depended onJhe preparation methods.
The densities of the acid sites and the temperatures of the maximum desorption rates (abbreviated
as T max) are summarized in Table 1. These estimates defined the weak and strong acid sites for
VPO-org and VPO-redu as the acid sites below and above 650 K of the desorption temperatures,
respectively, whereas this temperature was defined as 620 K for VPO-aq. VPO-aq had a higher
density of B weak• The density of L'/rImg on VPO-redu was higher than on the other two catalysts, in the
order VPO-aq (0.081 )lmol mol) < VPO-org (0.096 )lmol mo2) < VPO-redu (0.138 )lmol mo2). The
density of B"nmg was almost the same for VPO-redu and VPO-aq. On the other hand, the density of
B s,rong on VPO-org was almost twice as high as on VPO-redu and VPO-aq.
The T max of Lstrong was in the following order: VPO-aq (655 K) < VPO-org (680 K) < VPO-redu
(690 K). Niwa et al. [15] demonstrated that Tmax is shifted toward higher temperatures with the
increase in acid sites in the measurement system by ammonia-TPD, which indicates that the product of
the sample weight (g) and the concentration of acid sites ()lmol gol). In this study, these spectra were
measured with the same sample weight (100 mg), SQ the amount of the acid sites in the measurement
system was different for each experiment. The amount of L,'orn!!. in the measurement system was as
follows; VPO-aq (0.044 )lmol) < VPO-org (0.317 )lmol) < VPO-redu (0.331 )lmol). This order is
consistent with that of Tm3x ' In addition to that, these amounts were roughly correlated with Tmax.
Therefore, it is reasonable to consider that the Ls'nm!!. of these catalysts had similar strength.
63

0) ~
Table 1 Densities of acid sites and temperature of maximum desorption ratea measured by dimethylpyridine-temperature
programmed desorption.
Catalyst Bmnsted acidb
/ Ilmol m-2 Lewis acid' / Ilmol m-2
Weake Stronge Weake Stronge Totald
(Ilmol m-2)
VPO-org 0.040 (595 K) 0.055 (695 K) 0.121 (605 K) 0.096 (680 K) VPO-redu 0.031 (590 K) 0.025 (720 K) 0.104 (600 K) 0.138 (690 K) VPO-aq 0.110 (590 K) 0.023 (685 K) 0.042 (595 K) 0.081 (655 K)
a The figures in parentheses are temperature of maximum desorption rate.
b Density of Bmnstead acid sites was estimated from 2,6-dimethylpyridine-TPD spectra.
c Density of Lewis acid sites was calculated by subtracting that of Bmnsted acid sites from that oftotal acid sites.
d Density of total acid sites was estimated from 3,5-dimethylpyridine-TPD spectra.
e For VPO-org and VPO-redu, weak and strong acids were defined as below and above 650 K of desorption
temperature, respectively, and this temperature was defined as 620 K for VPO-aq.
0.312 0.298 0.259
Chapter 3

Chapter 3
The Tmax of B,'rrmg was in the following order: VPO-aq (685 K)<VPO-org (695 K)<VPO-redu
(720 K). In contrast, amount of B"rrmg in the measurement system was as follows: VPO-aq (0.012
~mol)<VPO-redu (0.060_~mol)<VPO-org (0.176 ~mol). VPO-org had almost the same Tmax as
VPO-aq, but the amount of B"rrmg in the measurement system on VPO-org was about IS-times that of
VPO-aq. Furthermore, VPO-org had lower Tmax than VPO-redu, whereas the total amount of B'lrollg
in the measurement system on VPO-org was larger than that of VPO-redu. These results indicate that
the B"mng of VPO-org was relatively weak compared to the other two catalysts.
The acidic properties of the catalysts can be summarized as follows: (1) VPO-org has a higher
density of B"rrmg, but the B,,'rong are relatively weak compared to the other two catalysts. (2) VPO-redu
has a higher density of L,,'mng. (3) VPO-aq has fewer acid sites except for B weak .
The bulk PN ratios of the catalysts were almost unity, that is the stoichiometric number of
(VO)2P207, but the surface PN ratios were larger than unity, indicating that there is excess phosphorus
on the surface. The surface PN ratio of VPO-aq (1.5) was higher than those of VPO-org and
VPO-redu (1.2) as shown in Table I of Chapter 2. This is consistent with the density of Bweak as
listed in Table I. VPO-org catalysts with various bulk PN ratios show that the density of Bweak
increases with the surface PN ratio [16]. Therefore, Bweak can be attributed to P-OH groups, like
H3P04, derived from the excess phosphorus on the catalyst surface.
The DMP-TPD spectra indicate that there are at least three types of acid sites in addition to Bweak .
The Bmnsted and Lewis acid sites on (VO)2P207 may be attributed to P-OH groups belonging to
truncated p-o bonds in terminal phosphorus tetrahedra and coordinatively unsaturated vanadium ions
on the (100) planes, respectively [8]. Although it is difficult to make reasonable assignments for
these acid sites from only the data of this study, further quantitative measurement of acidic property of
well-characterized (VO)2P207 by the DMP-TPD method can be expected to clarify the structure of
these acid sites.
Correlation between acidic properties and catalytic performance of (VOhP207 catalysts
Figure 2 shows the changes in selectivity to MA as a function of the conversion of n-butane.
VPO-redu showed the highest selectivity among these catalysts. The selectivity decreased with
increased conversion, but the trends of the catalysts were greatly different. The selectivity to MA of
VPO-org fell remarkably, but that for VPO-redu scarcely decreased. This decrease of the is due to
65

Chapter 3
consecutive oxidation of MA [17].
The catalytic data are summarized in Table 2, in which the data for catalytic activity were
obtained at around 20 % conversion. The extent of consecutive oxidation of MA (ECOMA) was
defined as the difference of the selectivity between 80 % and 20 % of the conversion, and was
calculated from Eq. (1).
ECOMA (%) = Selectivity80 % conversion - Selectivity20 % conversion (1)
The selectivity at 20 % conversion was in the following order: VPO-aq (54 %) < VPO-org (60 %)
< VPO-redu (66 %). On the other hand, ECOMA was as follows: VPO-org (-9 %) < VPO-aq (-4 %) <
VPO-redu (-2 %).
100
'cf( "- 80
~ 0 -.t:. zs 2S: Ii> II I:J. I:>.
A --6-...... 60 » ...... . ;; .-...... u ~ 40 v r/1
200 20 40 60 80 100
Conversion / %
Fig.2 Selectivity to MA as a function of the conversion ofn-butane: (0) VPO-org, (6) VPO-redu, and (0) VPO-aq. The reaction was performed with n-butane (1.5 %), O2 (20 %), and N2 (balance) at 723 K.
Table 2 Activity and selectivity to maleic anhydride in n-butane oxidation over (VOhP20 7 catalysts".
Catalyst
VPO-org VPO-redu VPO-ag
Activit/' (~.I.Inol m·2 1,-1)
132 55 70
Selectivity to maleic anhydrideC (%)
20 % 80 % 60 51 66 64 54 50
Difference of selectivity between 80 % and 20 % of
conversionsd (%) -9.2 -1.6 -4.4
a The reaction was carried out with 1.5 % n-butane and 20 % O2 in N2 (balance) at 723 K.
b Calculated from the data at around 20 % of the conversion.
C Selectivity to maleic anhydride at 20 % or 80 % of the conversions.
d Calculated by subtracting selectivity to MA at 80 % conversion from that at 20 % conversion.
66

~ -~ 0 +-'
~ +-' .-;> . -+-' C) Q) .-. Q)
r:/)
Chapter 3
The catalytic activity of VPO-org was greater than those of the other two catalysts, but this
difference could not be explained by the acidic properties, possibly because the catalytic activity is
strongly affected by the redox properties of the catalyst as investigated in Chapter 2.
Figure 3 shows the relationship between the selectivity at 20 % conversion and the density of
Lstrong. The selectivity increased with increased density of Lstrong- n-Butane may be selectively
activated on strong Lewis acid sites through abstraction of hydrogen atoms from butane, and then, the
formed olefinic-like intermediate is quickly oxidized up to MA by neighboring oxygen atoms [4].
The trend of Fig. 3 supports this proposal, indicating that L,{mng is important for MA formation. The
higher density of Lstrong is one of the reasons for the high selectivity ofVPO-redu.
100
80
60
40
0.05 0.1 0.15 0.2 Strong Lewis acid / f.1 mol m-2
Fig. 3 Correlation between the selectivity to
MA at 20 % conversion and the density of
the strong Lewis acid sites.
67
~ -« ~
0 U ~
0
• -5 •
-10 •
-15~--~--~--~--~--~ o 0.2 0.4 0.6 0.8 1 (Density of Bstrong)/(Density of Lstrong)
Fig. 4 Relationship between the extent of
consecutive oxidation of MA and the ratio of
(density of the strong Bmnsted acid
sites)/(density of the strong Lewis acid
sites). Y axis (ECOMA ) was calculated by
subtracting selectivity at 80 % conversion
from that at 20 % conversion.

Chapter 3
It has been considered that the V -rich sites on (VO)2P207, where the surface PlY ratio is relatively
low, are highly active for the consecutive oxidation of MA [17,18]. However, the surface PlY ratio
of VPO-org is the same as that of VPO-redu, as shown in Table I of Chapter 2. In addition, the
surface PlY ratio ofVPO-aq is rather higher than that ofVPO-org. Therefore, it is difficult to explain
the difference in the consecutive oxidation of MA as suggested in the literature. As shown in Fig. 4,
a correlation between ECOMA and the ratio of (density of Bs/rong)/( density of L.,/rong) was observed, but
no correlation with only the density of Bnmsted or Lewis acid sites. If MA is readily desorbed from
the surface of a catalyst, MA is not subject to consecutive oxidation. It is generally accepted that
acid sites are necessary for catalytic formation of anhydride or acidic molecules over solid catalysts,
because these sites promote desorption of the product [19]. As shown in Fig. 4, L Hrong is likely to
have a good influence for the selectivity to MA. In contrast, B,'rong will promote the consecutive
oxidation of MA. Protons are readily added to the carbonyl group of carboxylic acid derivatives, as
in the Bmnsted acid-catalyzed hydrolysis of ester [20]. The strong Bmnsted acid may activate the
carbonyl of MA to induce subsequently oxidation into COx. Therefore, the consecutive oxidation of
MA is probably more accelerated on catalysts with higher densities of Bs/rong such as VPO-org.
Conclusion
Acidic properties of three types of (VO)2P207 catalysts were investigated by DMP-TPD.
VPO-org had a higher density of B'lrong and these B,'rong sites were relatively weak compared with the
other catalysts. VPO-redu had a higher density of LS/rot/g. VPO-aq had fewer acid sites except for
Bweak . VPO-redu had a high selectivity to MA at low conversion, and a higher density of L"rong. The
extent of consecutive oxidation of MA is related to the ratio of (density of B,'rong)/( density of L"rollg).
B"rong may promote the consecutive oxidation of MA, whereas L'/rong hinders this oxidation. These
results established the concept that he density of the strong Lewis acid sites increases, and contrary
that of the strong Bmnsted acid sites decreases to improve the catalytic performance.
References
[I] Hodnett, B. K., Catal. Rev. -Sci. Eng., 17 (1985) 373.
[2] Bordes, E., Catal. Today, 1 (1987) 499.
[3] Centi, G., Trifiro, F., Ebner, J. R., Franchetti, V. M., Chem. Rev., 88 (1988) 55.
68

Chapter 3
[4] Cavani, F., Trifiro, F., Cherntech, 24 (1994) 18.
[5] Tanabe, K., Misono, M., Ono, Y., Hattori, H., "New Solid Acid and Bases," Kodansha-Elsevier,
Tokyo (1989), p.320-325.
[6] Corma, A., Chern. Rev., 95 (1995) 559.
[7] Centi, G., Golinelli, G, Trifiro, F., Appl. Catal., 48 (1989) 13.
[8] Busca, G., Centi, G., Trifiro, F., Lorenzelli, v., J. Phys. Chern., 90 (1986) 1337.
[9] Cornaglia, L. M., Lombardo, E. A., Anderson, J. A., Fierro, G., Appl. Catal. A, 100 (1993) 37.
[10] Cvetanovic, R. J., Amenomia, Y., Adv. Catal., 17 (1967) 103.
[11] Tanabe, K., Misono, M., Ono, Y., Hattori, H., "New Solid Acid and Bases," Kodansha-Elsevier,
Tokyo (1989), p.5-14.
[12] Niwa, M., Iwamoto, M., Segawa. K., Bull. Chern. Soc. Jpn., 59 (1986) 3735.
[13] Katada, N., Igi, H., Kim, J. H., Niwa, M., J. Phys. Chern. B, 101 (1997) 5969.
[14] Benesi, H. A., J. Catal., 28 (1973) 176.
[15] Niwa, M., Katada, N., Sawa, M., Murakami, Y.. J. Phys. Chern., 99 (1995) 8812.
[16] Private data
[17] I~arashi, H., Tsuji, K., Okuhara, T., Misono, M., J. Phys. Chern., 97 (1993) 7065.
[18] Moser, T. P., Wenig, R. w., Schrader, G. L.,App. Catal., 34 (1987) 39.
[19] Albonetti, S., Cavani, F., Trifiro, F., Catal. Rev. -Sci. Eng., 38 (1996) 413.
[20] Pine S. H., Hendrickson J. B., Cram D. J., Hammond G. S., "Organic Chernistry. 4th edition,"
McGraw-Hili International Book Co., (1981) p.319-320.
69


Partll
Vanadium Phosphorus Oxide Catalysts
with Novel Structure


Chapter 4
Iron-doped Vanadyl Pyrophosphate Catalysts
by Intercalation of Iron-complex

Chapter 4
4.1 Preparation of lamellar vanadyl alkylpbospbates as precursor
Abstract
Vanadyl alkylphosphates consisting of V4+ and pS+ were synthesized by reaction of a solid
mixture of V20 S and V40 9 (2:3 in mol) with P20S in primary aliphatic (from C1 to Cg), secondary
aliphatic (C, and C4), and alicyclic (Cs) alcohols, and were characterized by means of elemental
analysis, thermogravimetric analysis, X-ray diffraction, IR spectroscopy, and magnetic susceptibility.
The chemical formulae of the products were determined to be VO(ROMHO)1_xP03'(ROH)y (x =
0.5-0.7, y = 0.3-0.5 for primary aliphatic alcohols; x = 0.1-0.2, y = 0.4-0.9 for secondary aliphatic and
alicyclic alcohols; and R = organic group). X-ray diffraction revealed that the compounds had a
lamellar structure, where the organic groups existed as double layers with a tilt of about 56° against
the basal plane. Magnetism and IR spectroscopy demonstrated that the construction of basal planes
in the vanadyl alkyl phosphates was similar to that of VOHP04·O.5H20 which consists of the V4+
dimers linked with P04, except for vanadyl sec-butylphosphate consisting of isolated V4+ monomers.
Calcination of vanadyl methylphosphate and vanadyl cyclopentylphosphate brought about crystallites
of (VO)2P207. These (VOhP20 7 exhibited high selectivities to maleic anhydride (65-68 %) for
selective oxidation ofn-butane under high concentration ofn-butane (5.0 %).
Introduction
Selective oxidation of n-butane to maleic anhydride (abbreviated as MA) is an important
commercial process, because MA is a useful raw material for agricultural chemicals, food additives,
and unsaturated polymer resins. Furthermore, at present, this reaction has only a few commercialized
applications in gas-solid catalytic oxidations of lower alkanes with molecular oxygen [I]. Vanadyl
pyrophosphate, (VO)2P207, is claimed to be a efficient phase for this reaction and is a main component
of the commercial catalyst [2-4]. The (VO)2P207 catalyst is usually formed by a topotactic
transformation of VOHP04·O.5H20 [5,6], which is a prevailing precursor. So far, preparation
methods, preparation conditions, and activation processes have been extensively studied, and present
yield of MA is ca. 55 % reported in patent literatures [7-9]. However, further improvement of the
yield is still desired greatly.
74

Chapter 4
A series of vanadium phosphorus (V -P) oxides have attracted a great deal of attentions, because
of their structural diversity and unique catalytic property. So far, there are many reports on the
various V -P oxides such as lamellar compounds [10-16], large crystallites [17], mesostructured
materials [18-21], and thin-layer compounds [22-24]. Lamellar compounds are demonstrated by
vanadyl alkylphosphonates and alkylphosphates consisting of alternating inorganic V -p-o layers and
organiC group ones. Vanadyl alkylphosphonates are shown by VO(RP03)'nH20, in which the
oxidation numbers of V and Pare +4 and +3, respectively, and R is alkyl group. These compounds
contain P-C bonds. Johnson et al. synthesized a number of vanadyl alkylphosphonates from V 205
and a variety of corresponding alkylphosphonic acid, RPO(OH)2 [12-14, 16]. Guliants et al. claimed
that vanadyl methylphosphonate was transformed to (VOhP20 7 by calcination [II).
On the contrary, there are only few reports about vanadyl alkylphosphates, in which ester bonds
of (O=)P-O-C are included, and V and Pare 4+ and 5+, respectively. Researchers of DuPont
described vanadyl alkylphosphates synthesized by the reaction of V20 S with P20 S in alcohol [10].
However, the alkylphosphates incorporated are limited to only those obtained from primary aliphatic
alcohols. In addition, the structure has been characterized insufficiently.
In this section, in order to realized the preparation method by usmg intercalation of
methal-complex mentioned in Chapter 1, the vanadyl alkylphosphates were develped as new
precursors. In addition, these compounds were systematically characterized by means of elemental
analysis, X-ray diffraction, IR spectroscopy, thermogravimetric analysis, and magnetic susceptibility.
The catalytic properties of the V -P oxides obtained from these vanadyl alkylphosphates were also
investigated for the selective oxidation of n-butane. Their catalytic performances will be discussed in
relation to microstructure of the catalyst crystallites.
Experimental
Materials
Vanadyl alkylphosphates were prepared as follows. V20 S (29.2 g (0.16 mol), Koso Chemical
Co., Ltd.) was reduced with a mixture of isobutyl alcohol (180 cm', Koso Chemical Co., Ltd.), and
benzyl alcohol (120 cm', Koso Chemical Co., Ltd.) at the refluxing temperature (387 K) for 3 h. The
obtained black solid was separated by filtration. The powder XRD pattern revealed that this solid
75

Chapter 4
was a mixture of Y 205 and Y 409. The average oxidation number of Y was determined by a titration
method26 to be +4.73, indicating that Y 205 and Y 409 coexisted at the molar ratio of 2:3. The Y 20473
(20 g) obtained was added to 300 cm' of each alcohol. The following alcohols were used: primary
aliphatic alcohol; methanol, ethanol, I-propanol, I-butanol (Koso Chemical Co., Ltd.), I-hexanol, and
I-octanol (Tokyo Kasei Kogyo Co., Ltd.), secondary aliphatic alcohol; 2-propanol and 2-butanol
(Koso Chemical Co., Ltd.), and alicyclic alcohol; cyclopentanol (Tokyo Kasei Kogyo Co., Ltd.). A
mixture of P20 S (29.6 g (0.21 mol), Koso Chemical Co., Ltd.) and toluene (70 cm3, Koso Chemical
Co., Ltd.) was slowly added to the alcoholic suspension with stirring at room temperature. The
mixture was then refluxed until color of the suspension changed to light blue, e.g., methanol (80 h),
ethanol (30 h), I-propanol (18 h), I-butanol (3 h), I-hexanol (2 h), I-octanol (2 h), 2-propanol (40 h),
and cyclopentanol (20 h). In the case of 2-butanol, the mixture was refluxed for 100 h, and the
suspension of greenish brown was obtained instead of light blue suspension. The resulting vanadyl
alkylphosphates were separated by filtration, washed with acetone and dried at room temperature for
16 h. Hereafter, these vanadyl alkylphosphates will be denoted to YAP-alcohol name, e.g.,
YAP-methanol.
As a reference, vanadyl hydrogen phosphate hemihydrate, VOHP04·O.5H20, was prepared
according to the literature [27]. Y20 S (14.7 g (0.08 mol)) was added to a mixture of 90 cm' of
isobutyl alcohol and 60 cm' of benzyl alcohol. The suspension was refluxed at 387 K for 3 h, and
was cooled to room temperature. 99 % H,P04 (15.8 g (0.16 mol), MERCK Ltd.) was added to the
suspension, followed by refluxing at 387 K for 3 h. The resulting solid was filtered, washed with
acetone and dried at room temperature for 16 h. The XRD pattern of this material was in good
agreement with that ofYOHP04·0.5H20 reported in the literature [27,28].
Characterization
XRD patterns were recorded on an X-ray diffractometer (Rigaku RINT -1400) with Cu K"
radiation (A=0.154 nm) at room temperature. Infrared spectra were obtained with an IR spectrometer
(Perkin Elmer model 1600) at room temperature using pressed disks of mixture of the samples and
KBr. Magnetic susceptibility was collected on a SQUID magnetometer (Quantum Design MPMS-5)
with magnetic field (H) of I kG. The sample was evacuated at 323 K for I h, and then the
76

Chapter 4
temperature of the sample was swept from 300 K to 2 K.
Elemental analysis of the compound was performed with a Mikroanalytisches Labor Pascher
(Germany) for V, P, C, and H. The content of oxygen in the sample was calculated by subtracting the
sum of weights of V, P, C, and H. Prior to the analysis, the sample was evacuated at 323 K for 24 h.
The average oxidation number of V was determined by a redox titration method using KMn04 and
FeS04(NH4)2S04·6H20 according to the literature [26]. The surface area was measured by a BET
method with automatic adsorption system (BELSORP 28SA, BEL Japan Inc.). SEM Images were
taken with scanning electron microscope (HITACHI S-21 00).
Thermogravimetric analysis (TG/DTA) was performed using a TG/DTA 200 of Seiko
Instruments. The sample was pretreated in a flow of dried air (50 cm3 min-I) at 323 K for 24 h, then
temperature of the sample was raised to 853 K at a rate of 5 K minot in the flow.
Temperature programmed decomposition ofVAP-methanol was carried out using a flow system.
The sample powder (10 mg) was placed in a flow reactor (Pyrex-tube, 6 mm of inside diameter) and
pretreated in a flow of dried air (10 cm' min-I) at 323 K for 24 h. The temperature was raised from
323 K to 493 K at a rate of 5 K min-I and molecules desorbed from the sample were collected in a
U-shaped tube at 77 K. Then the molecules trapped were analyzed by a gas chromatograph (TeO
(GL science, GC-380» equipped with Chromosorb 105 column.
Catalytic oxidation of n-butane
Catalytic oxidation of n-butane was carried out in a fixed bed reactor (Stainless tube, 10 mm of
inside diameter) under an atmospheric pressure at 703 K. Prior to the reaction, the vanadyl
alkylphosphates were calcined in a flow of a mixture of O2 (10 %) and N2 (90 %) for 2 h. The
calcination temperatures were adjusted to 703 K for YAP-methanol, VAP-2-propanol, and
VAP-2-butanol, and 803 K for VAP-i-butanol, VAP-i-oelanol, and VAP-cyclopenlanol. These
calcination temperatures approximately correspond to the end temperatures of weight decrease on the
TG profiles. The catalysts obtained are denoted to VPO(alcohol name). VOHP04·O.5H20 was
treated in a flow ofN2 at 823 K for 2 h.
The reaction mixture consisting of 5.0 % n-butane, 20 % O2, and N2 (balance) was fed to the
catalyst (1.5 g) at a rate of 30 cm3 min-I, and temperature of the reactor was raised from room
77

lhapler .f
temperature to 703 K at a rate of 5 K min'l. Since the stationary activity and selectivity were
obtained after about 25 h of the reaction at 703 K, the data were collected at 30 h of the reaction, The
products were analyzed with on-line gas chromatographs (FID (Shimadzu 14A, Shimadzu 9A) and
TCD (Shimadzu 9A)). For n-butane and MA, a Porapak QS column (inside diameter 2.2 mm, length
I m) was used. A Molecular Sieve 13X column (inside diameter 2.2 mm, length 4 m) was utilized
for O2, N2 and CO and a Porapak N column (inside diameter 2.2 mm, length 2 m) for CO2, CO and
CO2 were converted to methane by using a Methanizer (Shimadzu MTN-I) for an FID analysis.
Results
Vanadyl alkyl phosphates obtained from primary aliphatic alcohols
Table I summarizes the results of elemental chemical analysis for the vanadyl alkylphosphates
from primary aliphatic alcohols (abbreviated as YAPs-Prj). The PN ratios of all the compounds
were 1.00 ± 0.03. Expectedly, the C/P ratio increased as the carbon number of the starting alcohol
increased. The RIP ratios calculated from the C/P ratios were 1.00 ± 0.11, where R shows an alkyl
group. The oxidation numbers of V in these compounds were determined to 4.00 ± 0.02.
IR spectra of VAPs-Pri are
shown in Fig. 1. The IR bands at
around 900 - 1300 cm'l are due to
the lattice vibration of V -P-O
layers of these compounds, The
bands of 1192, 1095, and
1054 cm'l are assigned to v(P03)
and that at 981 cm'l is due to
v(V=O) [29]. The vibrations of
P-O-C bond were detected at
Wavenumber / em ,I
Fig. 1 Infrared spectra ofvanadyl alkyl phosphate obtained
from (a) methanol, (b) I-propanol, and (c) I-octano!.
around 1161 cm'l as shoulder peaks [30]. The C-H vibration of alkyl groups appeared at 2850-3000
cm,l, where intensities of these bands greatly depended on the kinds of alkyl groups. Furthermore,
two bands at 3528 and 3581 cm'l are assignable to free OH stretching [31].
78

Chapter 4
Table 1. Elemental chemical analysis for vanadyl alkylphosphates synthesized from primary aliphatic alcohols
Elemental analysis/wt%a) Atomic ratio of Atomic ratio of
Alcohol V P C H Ob) PN C/P Formula methanol 28.1 17.4 6.5 2.0 46.1 1.02 0.96 VO{ (CH3)05/Ho5} P04'(CH3OH)05
(27.4) (16.7) (6.5) (2.2) (47.3) ethanol 24.8 15.1 12.8 3.1 44.2 1.00 2.19 VO{ (C2H5)07/Ho.3} P04' (C2H5OH)o.4
-l ~ (25.4) (15.4) (13.2) (3.1 ) (43.0)
I-propanol 25.0 15.0 15.6 3.3 41.1 0.99 2.68 VO{ (n-C3H7)06/Ho.4} P04' (n-C3H7OH)03 (24.8) (15.1) (15.8) (3.2) (41.2)
I-butanol 23.3 14.3 21.1 4.2 37.2 1.01 3.81 VO{ (n-C4H9)07/Ho.3} P04' (n-C4H9OH)o.3 (22.7) (13.8) (21.4) (4.3 ) (37.8)
I-hexanol 19.3 12.0 30.5 6.0 32.2 1.02 6.56 VO{ (n-C6H13)oJHo.4} P04' (n-C6HI3OH)05 (19.3) (11.7) (30.0) (5.7) (33.3)
l-octanol 17.3 10.2 34.4 6.8 31.3 0.97 8.71 VO{ (n-CgHI7)oJHo.4} P04' (n-CgH17OH)05 {l7.3} {lO.S} {35.8} (6.6) {29.8)
a) The figures in parentheses are the values calculated from the formulae.
b) The oxygen content was estimated by subtracting the sum of weights of V, P, C, and H.

Chapter 4
TG/DTA profiles of VAPs-Pri are illustrated in Fig. 2. As shown in Fig. 2a, the weight
decreased in two steps for YAP-methanol. The first weight loss observed below 490 K with a slight
endothermic and the second one above 570 K was exothermic. The molecules desorbed from
YAP-methanol measured by the temperature programmed decomposition were mostly methanol (97
mol%) and a small amount of water. As will be discussed below, the first and second weight losses
correspond to the desorption of intercalated methanol and the combustion of methyl group connected
by covalent bond, respectively. The TG profiles of other VAPs-Pri showed loose changes (Fig. 2b-d).
The sharp exothermic peaks were detected above 500 K for the all compounds and the magnitudes of
the peaks increased with increase in the carbon number of the alcohol.
Figure 3 presents the XRD patterns of VAPs-Pri. All compounds gave intense lines at less
than 10° of 28. The compounds from smaller alcohol such as methanol, ethanol, and I-propanol
showed similar XRD patterns (Figs. 3a-c). On the other hand, YAP-I-butanol, VAP-I-hexanol and
VAP-I-oetano! gave typical patterns due to lamellar compounds (Figs. 3d-f). For example,
VAP-I-oelano! (Fig. 3f) has the reflections at 28 = 3.720
(2.37 nm), 7.38 0 (1.20 nm), 11.000 (0.80
nm), af)d 14.680 (0.60 nm), which were assignable to the (001), (002), (003), and (004) reflections of
lamellar phase, respectively. The basal spacings (d(OO I» were estimated from 28 of the (00 I)
reflections to be 0.91 nm (VAP-methanol), 1.04 nm (VAP-ethanol), 1.23 nm (VAP-I-propnaol),
1.54 nm (VAP-I-butanol), 1.93 nm (VAP-I-hexanol), and 2.37 nm (VAP-I-oetanol), respectively.
The d(OOl) value increased as the carbon number of the starting alcohol increased.
80

100 (a)
to • x I ",, _________ Q)
.'
90
80~~----~----~~
100 =-----------------, (b)
'<f( 90 t ~ ---.E
--, , --, ........ '-
. !:!l
~ 80
70~~----~----~~
100 1'""":::----------------, (c)
80
60
40~~--~----~~
400 600 800
Temperature / K
Fig. 2 TG/DTA profiles of vanadyl alkylphosphates measured in air. The
vanadyl alkylphosphates were obtained
from (a) methanol, (b) I-propanol, and (c) I-octanol.
;:::s cd
---.c ..... tI}
s= (!) ..... s= -
Chapter 4
,,-... ...... 0 0 '-'2.37 nm
,,-... C"l 0 0 ,,-...
'-' '<T 0
(f) 0 '-'
1.93 nm
(e)
x 2
1.54 nm
(d)
1.23 nm
(c)
(b)
0.91 nm
(a)
10 20 30 40 50 2 e / deg.
Fig. 3 XRD patterns of vanadyl alkyl phosphates
obtained from (a) methanol, (b) ethanol, (c) I-propanol, (d) I-butanol, (e) I-hexanol, and
(f) I-octanol.
81

Chapter .j
Figure 4 provides a correlation between the d(OO I) value and molecular length of the starting
alcohol, where the molecular length as the distance between H of OH (KOH ) and farthest H from H-OH
was estimated on the basis of the covalent bond lengths with MOPAC (FUJITSU, WinMOPAC
Version 1.0). It was found that the d(OO I) values increased in proportional to the length of the
alcohol.
3r---------------------,
2 5 E s::
-------0 0 ~
O~------~------~----~ o 0.5 1.5
Length of alcohol / nm
Fig. 4 Correlation between the d(OO I) values of vanadyl alkylphosphates and length of the
starting alcohol. The vanadyl alkylphosphates were obtained from primary aliphatic alcohol
(0) (I) methanol, (2) ethanol, (3) I-propanol, (4) I-butanol, (5) I-hexanol, (6) I-octanol;
secondary aliphatic alcohol (_) (7) 2-propanol, (8) 2-butanol; and alicyclic alcohol (&) (9)
cyclopentanol.
Figure 5 shows the dependencies of magnetic susceptibility on temperature for YAP-methanol
(Fig. 5a) and VAP-i-oelano/ (Fig. 5b). Magnetic susceptibility is an indication of existence of
exchange coupled V4+ dimers in various V -P oxides [5, 11,32]. When the temperature decreased from
300 K, M gradually increased, and then decreased through a maximum around 45 K. These changes
were similar to those ofVOHP04·0.5H20 [5] and VOHP03 ·1.5H20 [32] in the literatures, which have
the y4+ dimers. These results indicate the presence of the y4+ dimers in the vanadyl alkylphosphates.
The data can be analyzed by the Bleaney-Bowers expression (eq. I) for isolated dimer model
containing two S = 112 cations with isotopic g tensor [33]:
x = X;J + C;I(T-8) + 4Ci(T(3 + exp(-2J/ksT») (I)
82

Chapter 4
where XJJ is the temperature-independent parameter; C and e, the constants associated with the
magnetic impurities (i.e. the residual isolated paramagnetic y4- monomers); T, temperature; Cd, Curie
constant associated with the y4- dimer; J, the coupling constant within the y4" dimer: and kll'
Boltzman's constant. The results of least-squares fit in the whole temperature range are shown in Fig.
5 (solid line) and the parameters are listed in Table 2 along with the data for YOHP04·0.5H20.
3 (b)
-;-OIl
"" E 2 u 'r, :::, --...
01!
?<
0~------~~------~---------4
3
'OIl
"" 2 E u
or,
:::, --...
01) I ?<
(a)
O~--------~--------~--------~ o 100 200 300
Temperature / K
Fig. 5 Magnetic susceptibility of vanadyl alkylphosphates obtained from
(a) methanol and (b) I-octano!. Solid lines represent the result simulated by using
the Bleaney-Bowers expression.
83

Chapter .J
Table 2. Parameters used to fit the magnetic susceptibility ofvanadyl alkylphosphates synthesized from various alcohols and VOHP04·O.5H20
Alcohol XI! c, e Cd C J ~ 1007 cm3 K gO! 1005 cm.l K a
ol deg. 1003 cm3 K go! 100
' cmo' K gO! ----:r 1:2 cm I:!:B
VOHP04 • 0.5H20"1 2.5 15.3 -0.6 1.99 -30.6 1.72 methanol 0.8 9.9 -3.4 1.69 -26.1 1.63
00 l-octanol 5.6 3.0 -2.4 1.31 -27.5 1.77 .... 2-propanol 3.2 5.6 -1.3 1.59 -29.5 1.66 cyc\opentanol 0.5 8.1 -0.9 1.70 -28.8 1.69 2-butanol -15.4 -9.1 1.86 1.90
a) VOHP04 • 0.5H20 which was prepared by the so-called organic solvent method [27].

Chapter 4
Vanadyl alkyl phosphates obtainedfrom secondary aliphatic and alicyclic alcohols.
The compositions of VAP-2-propanol, VAP-2-butanol, and VAP-cyclopentanol are listed in
Table 3. The PlY ratios were near unity in all the compounds. The RIP ratios of VAP-2-butanol
and VAP-2-propanol were 0.98 and 0.88, respectively. On the other hand, the ratio of
VAP-cyclopentanol was 0.55. The oxidation numbers of V for these vanadyl alkylphosphates were
4.00 ± 0.04.
Figure 6 shows XRD patterns of VAP-2-propanol, VAP-2-butanol, and VAP-cyclopentanol.
These compounds gave intense diffraction lines at less than 28 = 10°. For VAP-2-propanol (Fig. 6a),
a weak diffraction line (28 = 6.7°) at a slightly lower 28 angle of the intense one (28 = 7.6°) was
observed. Since this weak line accompaning the (200) at 13.8°, this phase is probably a contaminant
lamellar phase. The d(OO]) values were 1.]6 nm (VAP-2-propanol), ].37 nm (VAP-2-butanol), and
1.23 nm (VAP-cyclopentanol), respectively. The correlation between the d(OO]) value and
molecular length of the starting alcohol was in good accordance with that for VAPs-Pri (Fig. 4).
1.23 nm
~ A. (e)
1.37 nm
~ --"- A.-(b)
1.16 nm
-' " (a)
10 20 30 40 50 2 e / deg.
Fig. 6 XRD patterns of vanadyl alkylphosphates
obtained from (a) 2-propanol, (b) 2-butanol, and
(c) cyclopentanol.
85
30.--------------------------.
-;-Of) 20
"'E u
,,-,
o
100 200 300
Temperature / K
Fig. 7 Magnetic susceptibility of vanadyl
alkylphosphate obtained from 2-butanol.
Solid line represents the result simulated by
using the Curie-Weiss expression.

Chapter ./
Table 3. Elemental analysis for vanadyl alkylphosphates synthesized from secondary aliphatic and alicyclic alcohols
Elemental analysis/wt%a) Atomic ratio of Atomic ratio of
Alcohol V P C H 0 0) PlY C/P Formula 2-propanol 24.3 15.9 16.2 3.5 40.1 1.07 2.64 VO {(sec-C3H7 )o2/Hos} POdsec-C ,H7OH)07
(23.9) (14.5) ( 15.2) (3.7) (42.7) 00 2-butanol 21.0 13.7 20.7 4.8 39.8 1.07 3.90 VO{ (sec-C4H9)Ol/Ho9} POdsec-C4H9OH)09 m
(22.0) (13.4) (22.5) (4.7) (37.4) cyclopentanol 25.4 15.7 16.7 2.8 39.4 1.02 2.74 VO{ (C5H9)02/Hos} POdC5H90H)o 4
{24.2) (14.7) (17.1 ) (3.1 ) (40.92
a) The figures in parentheses are theoretical values calculated from formulae.
b) The oxygen content was estimated by subtracting the sum of weight of V, P, C, and H.

Chapter .;
As was not shown, the magnetic susceptibility ofVAP-2-propanol and VAP-cyclopentanol gave
a maximum of Xg around 45 K as well, showing the presence of the V4+ dimers in these compounds.
The data could be well fitted by the Bleaney-Bowers expression (eq. I). The parameters obtained are
listed in Table 2. As shown in Fig. 7, VAP-2-butanol showed a distinctly different profile of
magnetic susceptibility. When the temperature decreased from 300 K, Xg monotonously increased.
The data were well fitted to the Curie-Weiss expression (eq. 2) for whole temperature range as listed in
Table 2 and Fig. 7 (solid line).
(2)
As will be discussed below, isolated V4+ monomers exist in VAP-2-butanol.
As shown in Fig 8, the IR spectra ofVAP-2-propanol (Fig. 8a) and VAP-cyclopentanol (Fig. 8c)
were similar to those of VAPs-Pri. On the other hand, VAP-2-butanol gave a broad band around
1040 cm- I together with a broad band around 3380 em-I (Fig. 8b).
::l
~ <!) u c:: ell
-€ ~ '--_II"
.n <
4000 3500 :lOOO 2500 2000 1500 1000 Wavenumbcr / cm .)
Fig. 8 Infrared spectra of vanadyl alkylphosphate
obtained from (a) 2-propanol, (b) 2-butanol, and
(c) cyclopentanol.
SOO
)00 =----------, (e)
90
80
70~~==~==~~ )00 r-(b)
90
70
60 '--~-~-~----' )00.....,..--------,
(e)
90
so
400 600 soo lemperature' K
Fig.9 TG/OTA profiles ofvanadyl alkylphosphates measured
111 aIr. The vanadyl alkylphosphates were obtained from
(a) 2-propanol, (b) 2-butanol, and (c) cyclopentanol.
87

('hapter -I
TG/OTA profiles of VAP-2-propanol, VAP-2-butanol, and VAP-eyclopentanol are given in
Fig. 9. VAP-2-propanol and VAP-eyclopentanol gave loose changes of weight in TG profiles
(Fig. 9a and c) and indistinct exothermic peaks were observed. On the other hand, the TG profile of
VAP-2-butanol (Fig. 9b) showed a very sharp weight loss with endothermic at 440 K.
CafaZytic oxidation oln-butane
The surface area and the catalytic data are summarized in Table 4. As a reference. the data of a
typical (VOhP20 7 catalyst (abbreviated as VPO-org) obtained from VOHP04·O.5H 20 are shown.
The catalytic activity differed significantly depending on kinds of the precursors. VPO(methanol)
and VPO(eyclopentanol) were highly active because of the high surface areas, e.g., 37.6 and
21.2 m2 g-I, respectively. VPO(1-oetanol) and VPO(2-butanol) having a surface area less than
4 m2 gol showed low activities for the reaction. VPO(methanol) and VPO(eyclopentanol) exhibited
selectivities comparable to that of VPO-org. VPO( i-butanol), VPO( i-oetanol), and
VPO(2-propano/) are slightly less selective than VPO(methanol) and VPO(eyclopentanol). On the
other hand, VPO(2-butanol) gave low selectivity (31.0 % at 16.7 % conversion).
Table 4 Activity and selectivity of VP oxide catalysts for oxidation of n-butane"}
Catalystb)
VPO(methanol) VPO( i-butanol) VPO(1-oetanol) VPO(2-propanol) VPO(2-butanol) VPO( eyclopentanol) VPO-orgf)
SN) Conversiond Selectivitydj,e) / % / m2 gol / % -M-A----"--C-0-
2----C-0---
37.6 59.0 65.3 14.7 20.0 6.4 21.7 59.3 16.2 23.5 3.8 15.5 56.7 15.7 27.6 11.5 34.3 61.6 13.8 24.6 3.1 16.7 31.0 20.1 48.9 21.2 58.9 68.0 13.4 18.6 43.5 68.9 66.0 15.8 18.3
a) The reaction was performed at 703 K with the mixture of 5.0 % n-butane. 20 % O2• and N2
(balance). W/F (catalyst weight / flow rate) was 373 g h (mol of n-butane),l. b) The precursors
were previously calcined in a flow of a mixture of 10 % O2 and N2 (balance) for 2 h at 703 K
(VAP-methanol, VAP-2-propanol, VAP-2-butanol), 803 K (VAP-i-butanol, VAP-I-oetanol,
VAP-eyclopentanol). c) Surface area after the reaction. d) Stationary values obtained after 30 h of
the reaction. e) Selectivity based on butane. t) VPO-org which was prepared by the so-called
organic solvent method [27].
88

Chapter"
Powder XRD patterns of the catalysts after the reactions are given in Fig. 10. These samples
gave basically the patterns of (VO)2P207 except for VPO(2-butanol) (Fig. 10e). VPO(methanol),
VPO(cyclopentanol), and VPO-org were assigned to highly crystallized (VOhP20 7. Weak
diffraction lines of (VO)2P207 were observed for VPO(J-butanol) and VPO(J-octanol) with halo
patterns around 28 = 20° , indicating the presence of amorphous phase. VPO(2-propanol) gave
weak diffraction lines of y-VOP04, besides medium intense lines of (VO)2P207. On the other hand,
VPO(2-butanol) showed only diffraction lines due to a-VOP04 and Xl phase [34].
Fig. 10 XRD patterns of vanadium phosphorus oxide catalysts after the oxidation of n-butane.
(a) VPO(methanol), (b) VPO(J-butanol), (c) VPO(J-octanol), (d) VPO(2-propnaol),
(e) VPO(2-butanol), (t) VPO(cyclopentanol), and (g) VP oxide obtained from VOHP04·0.5H20.
(0) (VO)2P207, (.a.) y-VOP04, (x) XI phase, and (_) a-VOP04•
SEM images of the catalysts are given in Fig. 11. It was found that the morphology of these
compounds changed significantly depending on the alcohol. VPO(methanol) displayed sponge-like
shapes which consisted of microcrystallites of thin flakes (Fig. 11 a). VPO(J -butanol) showed
bunches of grapes (Fig. 11 b). VPO(cyclopentanol) displayed rose-petal morphology, which was
shown in the catalyst prepared by the so-called organic solvent method [27].
89

(.D
o
Fig. 11 SEM images of the catalysts after the ox idatioll of butane. (a) VPO(methano!), (b) VPO(l-bulanol),
and (e) VPO(cyclopentano/).
(,hapler .f.

Chapter -I
Discussion
Structure ofvanadyl alkyl phosphates synthesizedJrom primary aliphatic alcohols
VAPs-Pri have a lamellar structure, because these compounds showed a typical XRD pattern of
the lamellar phase as shown in Fig. 3. The linear correlation of the d(OO 1) values with the molecular
length of the starting alcohol (Fig. 4) indicates that these alkyl groups are present in the interlayer
space of these compounds. In other words, YAPs-Pri consists of alternating V -p-o layers and
organic group ones. In Fig. 4, the value of intercept 0.40 nm, of vertical axis is close to that of
VOP04 (0.41 I nm) [35]. If the alkyl groups existed as a single or double layer perpendicularly
against the V-P-O layer, the slope of the line in Fig. 4 would be 1.0 or 2.0, respectively. Since the
observed slope is 1.65, it is deduced that the alkyl groups are present as a double layer with a tilt of
about 56' in the interlayer space.
The PN atomic ratios ofVAPs-Pri were nearly unity and average oxidation numbers of V were
near to +4.0. The absorption bands of v(P03) and v(V=O) were observed at almost the same
positions as that for VOHP04·O.5H20 [5]. The magnetic susceptibility (Fig. 5) indicates the
existence of the y4+ dimers in these compounds. In addition, the coupling constants (.1) of
YAP-methanol (-26.lcm- l) and YAP-i-octanol (-27.5cm- l
) were almost the same as that of
VOHP04·O.5H20 (-30.6 em-I). The layered VOHP04·O.5H20 consists of alternating VOHP04 layers
and H20 ones. The VOHP04 layer is made up with edge-shared V06 octahedras, which is the y4+
dimers, connected through corners by P04 tetrahedras [5]. These results demonstrate that the V -P-O
layer of the VAPs-Pri are similar to that ofVOHP04·0.5H20.
The formula of YAP-methanol will be first discussed. The IR spectrum showed the vibration
of P-O-C (1161 em-I) for YAP-methanol (Fig. 1). Thus, the methyl group would exist as methyl
phosphate (P-O-CH3). Alkyl phosphate is known to be formed by a reaction of P20 S with
corresponding alcohol [36], supporting the existence of methyl phosphate in this compound. As
shown in Fig. 2a, the TG profile showed two step weight decreases, 8.7 wt% and 8.9 wt%. Since the
first decrease was the desorptions of methanol and small amount of water, this weight loss is due to the
removal of methanol intercalated. Considering the exothermic and the relatively high temperature,
the second weight loss is due to combustion of methyl group. From these results, the chemical
formula ofVAP-methanol is described as VO(CH30MHO)I_xP03·(CH30H)I_x. Since the C/P ratio of
91

Chapter 4
YAP-methanol was almost unity (0.96), the chemical formula of YAP-methanol is determined to
YO(CH30)os(HO)osP03·(CH30H)os. The composition calculated from this chemical formula is in
good agreement with the experimental values as listed in Table I. The two weight losses on the TG
profile (8.7 wt% and 8.9 wt%) are also consistent with calculated values (8.4 wt% and 8.7 wt%).
Next, we will estimate the chemical formulae of the other YAPs-Pri. Similarly to the case of
YAP-methanol, it was deduced that the exothermic weight losses were due to the combustion of alkyl
group on alkyl phosphate and the other weight losses due to the intercalated alcohol. From this
assumption, the chemical formulae of these YAPs-Pri were proposed as listed in Table 1. These
formulae are well consistent with the experimental data.
On the basis of these results, the schematic structure of YAP-methanol as a typical sample of
YAPs-Pri is depicted in Fig. 12. YAPs-Pri are lamellar compounds consisting of alternating of
Y -P-O layers with thickness of 0.40 nm and alkyl group layers. In this structure, the Y -P-O layer is
similar to YOHP04·0.5H20, in which the y4+ dimers are connected by P04 tetrahedra. About half of
P04 presents as alkyl phosphate and the others as hydrogen phosphate (H-O-P-). The alkyl groups of
alcohol and alkyl phosphate exist as a double layer with a tilt of about 56°. Since the XRD pattern of
the sample, which was the compound treated with an air flow at 450 K, was almost the same as that of
YAP-methanol, methyl groups of the methyl phosphate in the adjoining layers may be located in
contacted position. Two bands due to free OH vibration observed in IR spectra (Fig. 1) indicate that
the interaction between alcohol and hydrogen phosphate is weak. Probably, the alcohols are apart
from the hydrogen phosphates.
92

eo C;.:l
0.91 nm
~ , , , , , , , ,
,
~
, , ,
~ ~ , , , ,
/ , / , ,
, ,
~ / , , ,
/ , ,
~
, ,
~ ~
/ , , , , , / ,
~ / ,
/ , / ,
/ ,
, , ,
~
• V
OP
00 eC o H
Chapter 4
Fig. 12 Proposed model for structure of vanadyl methylphosphate as a typical sample of vanadyl alkylphosphates. The V -P-O layer consists of edge-shared V04 dimers connected through comers by (HO)P03 or (CH,O)PO, tetrahedra.

Chapter 4
Structure ofvanadyl alkyl phosphates synthesizedJrom secondary aliphatic and alicye!ic alcohols
The PN ratios and oxidation numbers of V for VAP-2-propnaol, VAP-2-butanol (abbreviated as
YAPs-sec), and VAP-cyclopentanol (abbreviated as VAP-cye!) are 1.02-1.07 and 3.99-4.04,
respectively, which are very close to those of VAPs-Pri. The good correlation between the d(OO I)
value and the length of the alcohol is also well-fitted (Fig. 4), indicating that the branched-alkyl and
alicyclic groups in these vanadyl alkylphosphates exist in the same configuration as straight alkyl
groups.
The IR spectra of VAP-2-propanol and VAP-cye!opentanol were similar to those of VAPs-Pri
and the magnetic susceptibility was accordance with the presence of the V4+ dimers (Table 2). Thus
it is considered that the structure of the V-P-O layer is analogous to those ofVAPs-Pri. The chemical
formulae of these compounds were estimated in the similar manner to VAPs-Pri (Table 3). Only 10-
20 % of total phosphorus exists as alkyl phosphate (R-O-P-) in these compounds, while 50-70 % of
total phosphorus was alkyl phosphate in VAPs-Pri. Hiyama et al. reported that secondary aliphatic
alcohol was readily dehydrated under presence of P20 S [38]. Since P20 S reacts with H20 to form
H3P04, the most of the added P20 S was probably converted to H3P04 Consequently, the
concentrations of alkyl phosphate formed from secondary alcohols would be low. By this, it IS
deduced that the incorporation of these alkyl phosphates into YAPs-sec and VAP-cye! was limited.
Contrary to the above compounds, the structure of v-p-o layers for VAP-2-butanol was
different from that of the other vanadyl alkylphosphates. As shown in Fig. 7, the magnetic
susceptibility of VAP-2-butanol obeyed the Curie-Weiss expression (eq. 2). The magnetism like this
was observed for vanadyl benzylphosphonate [12] and vanadyl n-pentylphosphonate [13], which have
isolated V4+ monomers. The IR spectra of VAP-2-butanol having the broad band around 1040 cm- I
in V-P-O lattice vibration region (Fig. 8) was also different from the others compounds. These broad
bands were observed in intercalated VOP04 compounds having isolated V06 octahedra, e.g.,
VOP04-aniline [39], VOP04-anilinoaniline [40], and VOP04-4-butylaniline [41]. These results
indicate that the isolated V4+ monomers exist in VAP-2-butanol. Furthermore, VAP-2-butanol gave
the broad band around 3380 cm- I in the IR spectra, suggesting that hydrogenphosphate (POH) of the
V -P-O layer interacts with OH of intercalated 2-butanol.
In summary, the structure of VAP-2-propanol and VAP-cyclopentanol is the same as those of
VAPs-Pri, while the ROP03/HOP03 ratios were smaller than those in VAPs-Pri. On the other hand,
94

Chapter -I
VAP-2-butanol has the different structure from that of the above compounds, and has isolated V4+
monomers linked with P04 tetrahedra.
Selective oxidation of n-butane with the catalysts obtained from vanadyl allo/lphosphates
Highly crystalline (VOhP20 7 phases were obtained from YAP-methanol and
VAP-cyclopentallol by the calcination, followed by the activation under the reaction conditions for 30
h. These vanadyl alkylphosphates with the structure containing the V4+ dimers were transformed to
(VO)2P207. On the other hand, only VAP-2-butanol having isolated V4+ monomers changed to the
mixture of a-VOP04 and Xl phases instead of (VO)2P207. The difference among these vanadyl
alkylphosphates would be brought about from the difference in the structures of V -p-o layers.
YAP-i-butanol and VAP-i-octanol were transformed to less crystalline (VO)2P207 with amorphous
V-P oxides. YAP-i-butanol and VAP-i-octanol gave large exothermic peaks over 500 K in TG/DTA
as compared to that for YAP-methanol and VAP-cyclopentanol (Fig. 2). Therefore, the amorphous
V -P oxides would arise from local temperature excursions resulted from exothermic combustion of
these alkyl phosphates.
The concentrations of butane used for the commercial processes of selective oxidation of
n-butane are usually about 1.5 vol.% and 4.0 vol.% for fixed-bed and fluidized-bed reactor,
respectively. From an industrial viewpoint, the operation under higher concentrations of n-butane is
preferred for higher space-time yield of MA. The catalytic performances were thus evaluated at 5.0
vol.% of n-butane.
VPO(methanol) and VPO(cyclopentanol) showed the high catalytic activities and selectivities to
MA (Table 4). The catalytic performances of these catalysts were comparable to that of VPO-org
(66 % of selectivity ), which was reported to be selective at 5 % ofn-butane [41]. On the other hand,
the selectivities of VPO(1-butanol), VPO(1-octanol), and VPO(2-propanol) were not high (about
60 %) and that ofVPO(2-butanol) was low (31 % at 16.7 % conversion).
Shimoda et al. reported that VOP04 phases of V5+ such as a-VOP04 and ~-VOP04 as well as
amorphous and Xl phases were less selective than (VO)2P207 [34]. Therefore, the low selectivity of
VPO(?-butanol) is owing to the presence of Xl and a-VOP04 predominantly. It is also considered
that the presence of amorphous V -P oxides or y-VOP04 is responsible for relatively low selectivities
ofVPO(1-butanol), VPO(1-octanol), and VPO(2-propanol). On the other hand, the high selectivities
95

Chapter 4
ofVPO(methanol) and VPO(cyclopentanol) are due to the single phase of(VO)2P207.
It is known that the catalytic performance greatly depends on morphology of the catalyst as well.
The catalysts consisted of the the microcrystallites of thinner plates shows higher selectivity to MA
[42], because of higher exposure of the (100) plane of (VO)2P20 7. Both VPO(methanol) and
VPO(cyclopentanol) consisted of the microcrystallites of thinner plates (Fig. 11 a,c). This may be
another reason for higher selectivity to MA on these catalysts.
Conclusion
In the present section, the vanadyl alkylphosphates from various alcohols were developed and
their structures were characterized systematically. The vanadyl alkylphosphates have lamellar
structure and the alkyl groups exist as a double layers with a tilt of about 56° against the V -P-O layer.
The structure of the V-P-O layers is similar to that of VOHP04·0.5H20 having the V4~ dimers
connected by P04 tetrahedra except for vanadyl sec-butylphosphate. In vanadyl sec-butyl phosphate,
isolated V06 monomers exists. The ratios of (ROP03)/(total P) were 0.5-0.7 for the vanadyl
alkylphosphates obtained from primary aliphatic alcohols and 0.1-0.2 for that from secondary aliphatic
and alicyclic alcohols. These structural characteristics indicate that the vanadyl alkylphosphates
must be useful as host for intercalation of metal-complex.
The well crystallized (VO)2P20 7 catalysts were obtained from vanadyl methylphosphate and
vanadyl cyclopentylphosphate. These catalysts showed both high catalytic activity and selectivity to
MA under the high concentration of n-butane, which was comparative to the catalysts prepared by the
so-called organic solvent method.
References
[1] S. Albonetti, F. Cavani, and F. Trifiro, Catal. Rev. -Sci, Eng., 38 (1996) 413.
[2] G. J. Hutchings, Appl. Catal., 72 (1991) I.
[3] B. K. Hodnett, Catal. Rev. Eng., 17 (1985) 373.
[4] G. Centi, F. Trifiro, J. R. Ebner, and V. M. Franchetti, Chern. Rev., 88 (1988) 55.
[5] 1. W. Johnson, D. C. Johnston, A. J. Jacobson, and J. F. Brody, 1. Am. Chern. Soc., 106 (1984)
8123.
96

[6] E. Bordes and P. Courtine, J. Solid State Chern., 55 (1984) 270.
[7] S. Tomita, T. Ihara, and H. Suwa, Japan Kokai, 5-261292 (1993) to Mitsukasei Kogyo.
[8] I. Sawa, H. Suwa, and Y. Ishii, Japan Kokai, 11-92973 (1999) to Mitsubishi Kagaku.
[9] T. A. Byser Jr., Japan Kokai, 58-69577 (1983) to EI Du Pont de Memous and Company.
[10] S. H. Horowitz, WO Patent 98/15353 (1998) to EI Du Pont de Memous and Company.
Chapter 4
[11] V. V. Guliants, J. B. Benziger, S. Sundaresan, I. E. Wachs, and J.-M. Jehng, Chern. Mater., 7
(1995) 1493.
[12] J. W. Johnson, A. J. Jacobson, J. F. Brody, and J. T. Lewandowski, Inorg. Chern., 23 (1984) 3842.
[13] G. Huan, J. W. Johnson, J. F. Brody, D. P. Goshorn, and A. 1. Jacobson, Mater. Chern. Phys., 35,
(1993) 199.
[14] G. Huan, A. J. Jacobson, J. W. Johnson, and D. P. Goshorn, Chern. Mater., 4 (1992) 661.
[15] E. M. Sabbar, M. E. de Roy, A. Ennaqadi, C. Gueho, and J. P. Besse, Chern. Mater., 10 (1998)
3856.
[16] J. W. Johnson, J. F. Brody, and R. M. Alexander, Chern. Mater., 2 (1990) 198.
[17] N. Mizuno, H. Hatayama, S. Uchida, and A. Taguchi, Chern. Mater., 13 (2001) 179.
[18] T. Doi and T. Miyake,J. Chern. Soc., Chern. Cornrnun., (1996) 1635.
[19] T. Abe, A. Taguchi, and M. Iwamoto, Chern. Mater., 7 (1995) 1429.
[20] M. Roca, J. E. Haskouri, S. Cabrera, A. B. Porter, J. Alamo, D. B. Porter, M. D. Marcos, and P.
Amor6s, J. Chern. Soc., Chern. Cornrnun., (1998) 1883.
[21] H. Hatayama, M. Misono, A. Taguchi, and N. Mizuno, Chern. Lett., (2000) 884.
[22] N. Hiyoshi, N. Yamamoto, N. Terao, T. Nakato, and T. Okuhara, Stud. Surf Sci. Catai., 130
(2000) 1715.
[23] N. Hiyoshi, N. Yamamoto, and T. Okuhara, Chern. Lett., (2001) 484.
[24] T. Nakato, Y. Furumi, and T. Okuhara, Chern. Lett., (1998) 611.
[25] Y. Kamiya, E. Nishikawa, A. Satsuma, N. Mizuno, and T. Okuhara, Sekiyu Gakkaishi, 44 (200 I)
265.
[26] B. K. Hodnett, P. Permanne, and B. Delmon, Appi. Catai., 6 (1983) 231.
[27] H. Igarashi, K. Tsuji, T. Okuhara, and M. Misono, J. Phys. Chern., 97 (1993) 7065.
[28] F. Cavani, G. Centi, and F. Trifiro, Ind. Eng. Chern. Prod. Res. Des., 22 (1983) 570.
[29] G. Basca, F. Cavani, G. Centi, and F. Trifiro, J. Catai., 99 (1986) 400.
97

Chapter 4
[30] L. J. Bellamy, "The Infra-red Spectra of Complex Molecules," Chapman and Hall, London (1975),
Vol. 1, pp. 354.
[31] L. J. Bellamy, "The Infra-red Spectra of Complex Molecules," Chapman and Hall, London (1975),
Vol. 1, pp. 109.
[32] V. V. Guliants, J. B. Benziger, and S. Sundaresan, Chem. Mater., 7 (1995) 1485.
[33] B. B1eaney and K. D. Bowers, Proc. R. Soc. London. Ser. A, A214 (1952) 451.
[34] T. Shimoda, T. Okuhara, and M. Misono, Bull. Chem. Soc. Jpn., 58 (1985) 2163.
[35] E. Bordes, P. Courtine, and G. Pannetier, Ann. Chim. (Paris), 8 (1973) 105.
[36] Private data.
[37] D. F. Toy, "Comprehensive Inorganic Chemistry," Pergamon Press, Oxford (1968) p. 442.
[38] K. Hiyama, M. Suzuki, M. Nakamura, Y. Hatanaka, O. Kobayashi, and M. Higashihara, Sci. Ind.,
72 (1998) 89.
[39] H. Nakajima and G. Matsubayashi, Chem. Lett., (1993) 423.
[40] H. Nakaj ima and G. Matsubayashi, J Mater. Chem., 5 (1995) 105.
[41] T. Nakato, Y. Furumi, N. Terao, and T. Okuhara, J Mater. Chem., 10 (2000) 737.
[42] Y. Kamiya, E. Nishikawa, T. Okuhara, and T. Hattori, Appl. Catal. A, 206 (2001) 103.
[43] H. S. Horowitz, C. M. Bladostone. A. W. Sleight, and G. Teufer, Appl. Catal., 38 (1988) 193.
98

Chapter -I
4.2 Insertion of Iron-Complex to Lamellar Vanadyl Benzylphosphate for
Preparation of Well-Defined Catalyst
Abstract
A novel approach for preparation of promoted vanadium-phosphorous oxide (VPO) in
well-defined structure was examined. Lamellar vanadyl benzylphosphate (LV PO) was used as a host
and Fe-complex (Fe(acac)3 and ferrocene) as a guest. It was found that Fe-complex was successfully
inserted into LVPO by heating of LVPO and Fe-complex in toluene solution. The obtained material
was characterized by means of XRD, TEM, EDX, XPS, and FT/IR. It was confirmed that
Fe-complex was uniformly dispersed in the interlayer of LVPO without significant distraction of
lamellar structure of parent LVPO.
Introduction
(VO)2P207/or n-butane oxidation and effect o/promoters
Vanadyl pyrophosphate, (VOhP20 7, has been widely accepted as an active and selective phase
for partial oxidation of n-butane to maleic anhydride [1-7]. For improvement in catalytic
performance, industrial (VOhP20 7 catalysts contain additional cations those act as promoters of
different kind. Various types of elements, such as Co, Mo, Cr, Fe, Ce, Zn, Ti, Zr, Si and so on, can be
found in patents, and some of scientific literatures clarified the effect of those promoters.
Haber et al. [8] clarified that the incorporation of Li, Na, K, Cs, Be, Mg, Ca, and Ba can easily
donate electrons to the framework of vanadyl phosphate, leading to an increase in the negative charge
of oxygen atom and in the rate of n-butane oxidation. They concluded that the high activity in
n-butane oxidation and high selectivity to MA requires a fine tuning of the basicity of surface oxygen
atoms to accelerate the activation of n-butane and of the acidity of the surface to secure the appropriate
time of the reaction intermediates. Takita et al. [9] observed a linear relationship between catalytic
activity for MA formation and the frequency of the v=o vibration of solids containing different
promoters (Mn, Co, Fe, Zn, and Zr).
On the other hand, promoters can optimize prepration conditions and structures of (VOhP20 7.
As reported by Horowitz et al. [10], the addition of tetraethyl orthosilicate is thought to eliminate
water as a by-product in the organic solvent, leading to the formation of (VOhP20 7 having favorable
99

Chapter 4
morphology. The structural modification of (VO)2P207 is also regarded as an important effect of
promoters. The structural disorder, which is related to the broadening of the (200) line in XRD
patterns, is related to high activity of VPO prepared from organic media [11-14]. In the case of
promoted (VOhP20 7, Ye et al. [13] reported that the activity per surface v=o species was found to be
dependent on the disorder of VPO crystal along the (100) plane, which can be controlled by the
addition of various promoters.
These various roles of promoters have been categorized. Hutchings [4] classified into two
types of promoters which (I) enable the formation of the required V -P phase, and (2) form solid
solutions with the active phase and that regulate the catalytic activity. Cavati and Trifiro [6]
summarized that the additives can be divided into following three groups: (1) ions (Zn and Co) that
interact with free phosphoric acid acting as a tool of fine tuning of the optimal surface PlY ratio and
acidity, (2) ions (S and Si) that can substitute for phosphorous in the precursor controlling the
morphology and defects of (VO)2P207 after calcination, and (3) transition metal ions (e.g., Ti, Zr, Ceo
and Mo) that substitute for vanadium acting as real modifiers directly involved in the reaction pattern.
Latter two types of promoters directly interact to (VO)2P207, i.e., (1) modification of structural
features of (VO)2P207, (2) modification of chemical properties of (VO)2P207, e.g., acidity, basicity,
and V=O species as redox sites.
Since preparation method for addition of promoters often strongly affects on these features of
promoted VPO catalysts, a novel preparation method would result in fine control of promoted VPO
structures and be a possible break-through for the enhancement of catalytic performance.
Intercalation is one of the candidates for the preparation of tailored VPO catalysts, as Datta and Keller
demonstrated incorporation of Pd(NO,)2 into VOHP04·O.5H20 [15]. Although VPO catalysts are
usually prepared from VOHP04 ' 0.5H20 as a precursor, use of other material having wide range of
flexibility may result in the fine-control of the structure and chemical properties.
(VO)2P207 and related VPO compounds
It has been paid much attention on a series of vanadium phosphate (VPO) chemistry, because of
wide structural diversity and high dependence of catalytic performance on the crystal phase.
Currently, VPO compounds having novel structures have been synthesized by means of intercalation
of various organic compounds [16-25]. Benziger et at. [19, 21] demonstrated an intercalation of
100

Chapter 4
n-alkylamines into VOHP04·O.5H20. Formation of ordered lamellar structure of VPO compound
incorporating n-tetradecyltrimethyl ammonium into VOHP04 • 0.5H20 was clearly shown by Miyake
et al. [22]. Okuhara et al. [24,25] successfully demonstrated "exfoliation", which is intercalation of
4-butylaniline into VOP04·2H20 followed by stirring in THF, and deposition of thin lamellar sheets
onto alumina support.
A series of VPO compounds with lamellar structure is the most interesting materials. Vanadyl
alkylphosphonates [17,18,20,23] having the formula of VO(ROMHO)I_,PO,·(ROHMH20)7 has a
lamella structure with alternating inorganic and organic layers, and the intercalation property of
vanadyl alkylphosphonate was greatly dependent on shape and size of the alkyl group [26]. On the
other hand, DuPont's researchers recently claimed that vanadyl alkyl phosphate which has P-O-C bond
with a lamellar structure could be synthesized through reacting V20 S with P20 S in alcohol [27].
Although this method is only applicable for intercalation of primary aliphatic alcohol, Kamiya et al.
developed a different method which enables to intercalate not only primary alcohol but also secondary
aliphatic and alicyclic alcohols [28, 29]. This method can control the distance of interlayer in the
range from 0.91 to 2.37 nm, and the distance linearly increases with molecular diameter of alcohols,
indicating ordered filling of the interlayer with alcohols. It can be expected that the use of these
lamellar VPO materials as a precursor may open up a novel preparation method for fine control of
promoted VPO catalysts.
Possible method/or preparation o/well-defined VPO
Use of lamellar VPO materials as precursors for VPO catalysts would be very useful because of
high potential of interlayer nano-space for catalyst design. Since the interlayer ofVPO compounds is
acidic, intercalation of basic amine molecules may too much stabilize the lamellar structure, and thus
further modification is expected to be difficult. The lamellar VPO containing alcohols is expected to
be more suitable for further modification because of weaker connection of VPO layers. After
insertion of metal-complexes followed by calcination, promoter ions can be uniformly fixed in the
interlayer. This nano-structural modification of VPO may results in fine-control of oxidation activity
or acid-base property. Furthermore, the heteroatoms in the interlayer may cause some disorder of
VPO crystal, which often play an important role in the enhancement of catalytic performance.
In this section, the author demonstrate a potential method for preparation of well-defined
101

Chapter 4
promoted VPO catalysts. Lamellar VPO incorporating benzyl alcohol (lamellar vanadyl
benzylphosphate, LVPO) was used as a host, because of the sufficient distance of inter:aye{ space (ca.
1.8 nm) for various metal-complexes. The possible advantage of this material is the hydrophobic
property of the inter-layer, which makes the favorable filed for coordination compounds. This
section focuses on insertion of Fe-complexes into the interlayer of lamellar VPO. The obtained
materials are characterized to determine the layered structure and dispersion of metal compounds.
Experimental
Preparation oj catalysts
Vanadyl benzylphosphate (LVPO) was prepared by the method reported in the former section
(4.1). V20 5 (29.2 g, Kishida, 99 %) was reduced with mixture of isobutyl alcohol (180 cm', Kishida,
99.5 %) and benzyl alcohol (120 cm3, Kishida, 99.5 %) at refluxing temperature for 3 h. The resulted
black solid was separated by filtration and confirmed to be a mixture of V20 5 and V40 9 by XRD.
The solid was suspended in 300 cm3 of benzyl alcohol, then a suspension of P20 5 in 75 cm3 of toluene
was slowly added with stirring. Then the mixture was refluxed for 6 h until valence of vanadium in
obtained VPO reached +4. After cooling to room temperature, the obtained blue solid was filtered
and washed with 40 cm} of acetone, and then dried at room temperature in air for 12 h.
For the insertion of Fe-complex, benzyl alchol or toluene (Kishida, 99.5 %) was used as a
solvent, and Fe(acach (Kishida, 98 %) and ferrocene (Kishida, 98 %) were used as a guest molecule.
LVPO and Fe-compound at a loading ratio of FeN = 0.5 were dissolved in 36 cm' of the solution and
heated at 358 K with stirring for 3 h. The obtained solid was filtered, washed with 250 cm' of
acetone, and then dried at room temperature in air for 12 h. The preparation conditions of the
samples were summarized in Table 1.
Characterizations
XRD patterns were recorded with Rigaku RINT-1200 diffractometer using Cu Ka radiation.
XPS spectra were measured with Shimazu ESCA-3300 using Mg Ka radiation. SEM images were
taken by HITACHI S-800S. TEM and EDS images were taken by JEOL JEM-201 0 coupled with
Voyager III EDS analyzer, respectively. Chemical compositions of obtained materials were measured
by Jarrell-Ash 975 PLASMA ATOMCOMP inductive coupled plasma spectrometer. Elemental
102

analysis was performed by Microanalytisch Labor Pascher, Germany.
Results and Discussion
Preparation conditions
Chapter 4
Figure 1 shows XRD patterns of lamellar vanadyl benzyl phosphate and after the insertion of
Fe-complexes. Before insertion of Fe-complexes, the XRD pattern exhibited strong diffraction line
attributable to the (00 I) at 28 = 4.95 degree with a shoulder at 5.28 degree. Weak diffraction lines
were also observed at 9.76 and 14.6 degree, which can be attributable to the (002) and the (003),
representing lamellar structure of LYPO having the d(001) value of 1.78 nm [28). Weak lines were
also observed at 10.4 and 15.7 degree, representing contaminant lamella phase having the d(OO I) value
of 1.67 nm. The previous section (4.1) showed a linear correlation between the d(OOI) value and
molecular length of alcohol which corresponds to the distance between OH and farthest H.
Molecular length of benzyl alcohol (0.709 nm) and the d(OOI) values (1.78 nm) also agree well with
this correlation. Thus, benzyl alcohol existed in the interlayer space can be estimated as double layer
tilting 56.6 degree against inorganic layer having thickness of 0.40 nm. A series of diffraction lines
having the d(OO I) value of 1.67 nm indicates a minor phase. Since the molecular diameter of toluene
(0.592 nm), which was used as a diluent of P20 S, is smaller than benzyl alcohol (0.709 nm), the minor
phase could be lamella YPO phase incorporating toluene in the interlayer. After the insertion of
Fe-complexes, the diffraction patterns of all the samples showed lamellar structure. while decrease in
the interlayer distance was observed. The presence of minor lamellar phase was not significant.
The d(OOI) values of each samples were listed in Table 1.
Table I also shows the FeIY ratio of Fe-loaded LYPO. A part (17 % - 1.4 %) of Fe-complex
was loaded in LYPO, though the Fe content was dependent on the preparation conditions in the
sequence of A > B > C > D. The best condition for Fe-insertion was the use of Fe(acac)3 as iron
source and toluene as solvent. In the case of LYPO-Fe-A, the surface FelY ratio was only around
twice as in the bulk, suggesting most of Fe(acac)3 was inserted into LYPO bulk. The surface FeIY
ratio of other samples was 4 to II times higher than that in the bulk, suggesting higher concentration
of Fe in the surface.
103

Chapter -I
10 20 30 40 50
Fig. 1 XRD patterns of (a) parent LVPO, (b)LVPO-Fe-A, (c)LVPO-Fe-B,
(d ) LV PO-F e-C, (e ) LV PO-F e- D
As a consequence, it was found that the insertion of Fe-complexes into lamellar VPO is possible
without significant destruction of lamellar VPO structure. The use of toluene and Fe(acac), was
suggested to be the most suitable condition. In the next section, structure and Fe distribution of
LVPO-Fe-A catalyst are characterized in detail.
104

Chapter ./
Table 1 Preparation conditions, chemical compositions, and d(OOl) in parent LVPO and Fe-loaded LYPO
Sample Preeration Atom ratio in bulk FelY d(OOl) / nm Solvent Fe source PlY CIY OIY HIY FeN in surface
0 LYPO 0.94 8.56 5.44 10.4 < 0.001 < 0.01 1.78 VI
LYPO-Fe-A Toluene Fe(acach 1.01 5.71 5.69 7.19 0.084 0.18 1.46 LYPO-Fe-B Toluene ferrocene 0.99 5.34 5.46 6.73 0.023 0.09 1.33 LYPO-Fe-C Benzyl alcohol Fe(acach 1.02 5.20 5.53 6.69 0.020 0.09 1.33 LYPO-Fe-O Benzyl alcohol ferrocene 0.98 8.40 5.74 9.77 0.007 0.08 1.74

('//(//)Ier -I
Characferi::afiol1 oj Fe-illserfed lamellar VI'()
Figure 2a shows SCM image of LVPO-Fe-A. The particles of LVPO-Fe-A wcre composed of
plate-like crystallites. The size of crystallite was 1-3 I-un in diameter and 50-100 nm in thickness.
SEM images of parent LVPO and other Fe-loaded LVPO were almost the same in the shape of
crystall ites. Figure 2b shows TEM image of the side view of crystallites. The TEM image clearly
indicates the lamellar structure of LVPO-Fe-A. From the patterns of lamella, the interlayer distance
can be estimated as ca. 1.5 nm, which agrees well with the estimation from XRD patterns.
Fig 2 SEM image (Iert) and TEM image (right) of LVPO-Fe-i\.
Figure 3 shows TEM image of LVPO-Fe-A and EDX images of V, P and Fe. The white points
in the EOX images, which indicates the presenee of the atoms, are agreed well with each other and
TEM image. From these images, it is clear that those atoms are well dispersed, and there are no
aggregates such as iron oxides.
Uniform distribution of Fe atoms was also supported by the comparison of hulk and sllrf~lce
composition. [n the case of LVPO-Fe-A, FeN ratio was 0.084 in the bulk and 0.18 in the sLlrf~ICC.
If Fe(acac)j complex was only deposited on surfaec, the surface Fe/V ratio observed by XPS spectra
was above 1.05, taking the escape depth of 3 nm and average particle size of 75 nm observed from
106

Chapter -I
SEM images into account. However, the FeN ratio in surface was 10 times smaller (0.18) than the
estimated value. This fact indicates that Fe(acac), is mainly inserted into the interlayer of lamellar
YPO. On the other samples, the surface FeN ratio was 4 to II times higher than that in bulk,
suggesting Fe-complex is partly concentrated or aggregated in surface.
2.U m
Fig.3 TEM image of LVPO-Fe-A and EDS images ofY, P and Fe.
107

Chapter -I
Figure 4 shows FT/IR spectra of the parent LVPO and LVPO-Fe-A. LVPO shows the band at
695, 740, 975, 1045, 1085, 1160, 1185, 1395, 1456 and 1500 cm-'. These bands can be tentatively
assigned to v(P-O-C) for 1160 cm-', v(V=O) for 975 cm-', v(P03) or Ph-O stretch for 1045, 1085, 1185
cm-'. deformation mode of OH of benzyl alcohol for 1395, 1456 and 1500 cm-', respectively [30-32].
After the insertion of Fe(acac)" a small bands appeared at 1283,1368 and 1526 cm- I, while the bands
due to VPO layer (v(V=O), v(PO,), v(P-O-C» was hardly affected. Spectrum c more clearly shows
the difference in the spectrulll a and b. The spectrum c was very close to the spectrum of F e( acac h
and the bands newly observed at 936, 1283, 1368, 1526, and 1570 cm- I. These bands were attributed
to v(C-C) + v(C-O) for 936, 1283, 1526, and 1570 cm-' and os(CH3) for 1368 cm-', respectively [33].
The presence of these bands attributable to Fe(acach suggests that the structure of Fe(acac)} is not
significantly changed in the interlayer of LVPO.
X2
1500 1000 Wavenumber / em-I
Fig. 4 FTIIR spectra of (a) parent LVPO, (b) LVPO-Fe-A, (c) (LVPO-Fe-A)/(LVPO)
and (d) Fe(acach.
108

Chapter 4
From the chemical analysis shown in Table J, PlY ratio of all the samples was around unity, and
the samples are basically composed of ideal composition of Y -P sheet. From the CIY ratio, J.5 times
of benzyl alcohol relative to vanadium or phosphorous are in the internal layer. It is already clarified
that around a half of alcohol is settled in the layer by ester bond, and other by hydrogen bonded [28].
The TGA data of this LYPO material showed that the ratio in weak and strong bonded alcohol is
around 2: I. According to these characters, the rational formula of the original LYPO-compound is
YO((C7H70H)071/Ho28)P04' O.50C7H70H. On the other hand, the rational formula of LYPO-Fe-A is
YO((C7H70H)o 4s/Hoss)P04 . O.18C7H70H . O.08Fe(acac),. After the insertion of Fe(acach, the
number of benzylalcohol reduced into a half. The fact indicates that Fe(acac):l was replaced with the
internal alcohol. Actually, the loaded amount of Fe-complex was also almost equivalent to the
removed alcohol in the case of LYPO-Fe-B and -c. The elimination of alcohol also can be
rationalized by the decrease in the interlayer distance observed in XRD patters.
Conclusion
In the present section, a novel approach for the preparation of well-defined promoted YPO
catalysts was demonstrated. It was fund that heating of lamellar vanadyl benzylphosphate in toluene
with Fe(acac), be successfully introduced the Fe(acac), into the interlayer. Based on the results of
various characterizations, the insertion of Fe(acach into lamellar vanadyl benzylphosphate can be
depicted as shown in Figure 5, i.e., (J) internal benzyl alcohol was removed by the heating in toluene
with Fe(acach, (2) Fe(acach was replaced with benzyl alcohol, and (3) decrease in the internal
distance occurred due to the elimination of benzyl alcohol. Further investigation on the structure of
calcined YPO catalyst and catalytic profiles will be reported elsewhere.
109

Chapter 4
1.78 nm
1.46nm
Fig.5 Schematic model of LYPO before (a) and after (b) insertion of Fe(acac),o
110

References
[1] B. K. Hodnett, Catal. Rev. Eng., 17 (1985) 373.
[2] E. Bordes, Catal. Today, 1 (1987) 499.
[3] G. Centi, F. Trifiro, J. R. Ebner, and V. M. Franchetti, Chern. Rev., 88 (1988) 55.
[4] G. J. Hutchings, Appl. Cata/., 72 (1991) I.
[5] F. Cavani, F. Trifiro, Chemtech, April (1994) 18.
Chapter 4
[6] F. Cavani, F. Trifiro, "Catalysis. Vol. 11" p. 246, Royal Society of Chemistry, Cambridge (1994).
[7] B. K. Hodnett, "Heterogeneous Catalytic Oxidation, Chapter 5" p. 132, John Wiley & Sons, New
Tork (2001 ).
[8] V. A. Zazhigalov, J. Haber, J. Stoch, I. V. Bacherikova, G. A. Komashko, A. I. Pyatnitskaya, Appl.
Catal. A, 134 (1996) 225.
[9] Y. Takita, K. Tanaka, S. Ichimaru, Y. Mizuhara, Y. Abe, Y. Ishihara, Appl. Catal. A, 103 (1993)
281.
[10] H. S. Horowitz, C. M. Blackstone, A. W. Sleight, G. Teufer, Appl. Cafal., 38 (1988) 193 . . [II] G. Busca, F. Cavani, G. Centi and F. Trifiro,.J Catal., 99 (1986) 400.
[12] M. L. Granados, J. C. Conesa and M. F. Garcia,.J Catal., 141 (1993) 671.
[13] D. Ye, A. Satsuma, A. Hattori, T. Hattori, Y. Murakami, Catal. Today, 16 (1993) 113.
[14] A. Satsuma, Y. Tanaka, T. Hattori, Y. Murakami, Appl. Surf Sci., 1211122 (1996) 496.
[15] A. Datta and R. Y. Kelar, Chern. Commun., (1996) 89.
[16] K. Beneke and G. Lagaly, Inorg. Chern., 22 (1983) 1503.
[17] G. Huan, A. J. Jacobson, J. W. Johnson, and D. P. Goshorn, Chern. Mater., 4 (1992) 661.
[18] G. Huan, J. W. Johnson, J. F. Brody., D. P. Goshorn, and A. J. Jacobson, Mater. Chern. Phys., 35
(1993) 199.
[19] V. V. Guliants, J. B. Benzinger, and S. Sundaresan, Chern. Mater., 6 (1994) 353.
[20] V. V. Guliants, J. B. Benzinger, and S. Sundaresan, Chern. Mater., 7 (1995) 1493.
[21] J. B. Benziger, V. Guliants, S. Sundaresam, Catal. Today, 33 (1997) 49.
[22] T. Doi, T. Miyake, Chem. Commun., (1996) 1635.
[23] E. M. Sabbar, M. E. de Roy, A. Ennaqadi, C. Gueho, and J. P. Besse, Chern. Mater., 10 (1998)
3856.
[24] T. Nakato, Y. Furumi, T. Okuhara, Chern. Lett., (1998) 611.
111

Chapter -I
[25] T. Nakato, Y. Furumi, N. Terao, T. Okuhara. J. Mater. Cheem., 10 (2000) 737.
[26] J. W. Johnson, A. J. Jacobson, W. M. Butler, S.E. Rosenthatl, J. F. Brody, and J. T. Lewandowski,
J. Am. Chem. Soc., 111 (1989) 381.
[27] H. S. Horowitz, WO Patent 98/15353 (1998).
[28] Y. Kamiya, E. Nishikawa, Japan Kokai, 11-319860 (1999).
[29] Y. Kamiya, E. Nishikawa, A. Satsuma, and T. Okuhara, Bull. Chem. Soc. Jpn., (in press).
[30] C. J. Pouchert, "The Aldrich Library of Infrared Spectra (2nd Edition)" Aldrich Chemical
Company, Milwaukee, (1975).
[31] L. J. Bellamy, "The Infra-red Spectra of Complex Molecules", Chapman and Hall, London,
(1975), p. 353.
[32] G. Busca, F. Cavani, G. Centi and F. Trifiro. J. Catai., 99 (1986) 400.
[33] K. Nakamoto, "Infrared and Raman Spectra of Inorganic and Coordination Compounds (4th
Edition)", Wiley Interscience, New Yoak, (1986), p. 260.
112

Chapter 4
4.3 Catalytic property of iron-doped (VO)2P207 catalyst prepared by
intercalation of Fe(acach
Abstract
Intercalation of Fe(acac)3 into lamellar vanadyl n-hexylphosphate,
VO{(n-C6HJ3)o.JHo4}POdn-C6HJ30H)05, followed by calcination, has been investigated for
preparation of Fe-doped (VO)2P207 catalyst and selective oxidation of n-butane to maleic anhydride
was performed. Fe(acac)3 was successfully intercalated into the vanadyl n-hexylphosphate by
heating in toluene. The obtained precursor was transformed to single phase of (VOhP20 7 by a
calcination at 823 K in the presence of a mixture of 5 % n-butane and 20 % O2 in N2 (balance). The
doped Fe ions uniformly spread in the bulk of the catalyst and were substituted for V4+ in (VO)2P207
crystal. The catalytic activity for maleic anhydride formation per surface area on the Fe-doped
catalyst was higher than that on the Fe-free catalyst prepared by calcination of the vanadyl
n-hexylpho'Sphate. Rates of reduction with n-butane at a top few surface layers of the catalysts and
re-oxidation with air were estimated from weight decrease and increase detected on TG/DAT
apparatus. The Fe-dope catalysts gave high rates of both the reduction and re-oxidation, especially
re-oxidation. It was confirmed from XPS that the surface of the Fe-doped catalysts is in a higher
oxidation state under the steady state of the reaction. In addition, the Fe-doped catalysts showed a
smaller reaction order on partial pressure of O2. Therefore, it is concluded that the doped Fe can
enhance the redox ability, especially re-oxidation of the catalyst, resulting in the high catalytic
performance.
Introduction
Vanadyl pyrophosphate, (VO)2P207, has been recognized as an active and selective phase for
selective oxidation of n-butane to maleic anhydride (abbreviated as MA) [1-4]. Addition of wide
variety of promoters to the catalysts, such as Co, Mo, Cr, Fe, Ce, Zn, Ti, Zr, Si and so on, has been
attempted to improve catalytic performance [5-7]. Among them, Fe is known to be one of the
elements enhancing the catalytic performance [8-10] and contained in many industrial (VOhP20 7
catalysts [9, 11,12].
(VOhP20 7 consists of edge-shared V06 octahedras, which are V-O-V pair sites, linked with
113

Chapter 4
pyrophosphates (P20 7) [13]. The specificity of (V 0)2P207 for the selective oxidation of n-butane has
been claimed to be due to this characteristic structure, because some vanadyl phosphat(;s which do not
have the V-O-V pair sites, e.g., u-VOP04 and ~-VOP04' are non-selective for this reaction [14].
Therefore, retaining the characteristic structure of (VO)2P207 must be required, when promoter is
added to the catalyst. Besides that, the promoters added on the catalyst have possibility to form
undesirable site such as aggregated metal oxides, on which combustion of n-butane proceeds. Thus,
it is desired to develop more advanced method that can finely control introductions of the promoters.
It has been paid much attention on a series of vanadium phosphorus oxides, because of their
structural diversity and unique catalytic property. So far, there are many reports about synthesis of
various vanadium phosphorus oxides having novel structures, such as intercalation compounds [15,16],
lamellar compounds [17-20], mesostructured materials [21,22], and thin-layered compounds [23,24].
Vanadyl alkylphosphonates and vanadyl alkyl phosphates are lamellar compounds consisting of
alternating basal V -P-O layers and organic groups.
In Chapter 4.1, a synthetic method of vanadyl alkylphosphates, VO(RJH 1.x)P04·(ROH)y, where
R is straight-, branched-alkyl, alicyclic and aliphatic groups was developed. In the series of these
vanadyl alkylphosphates, an existence of the V -0-V pair sites was confinned. The vanadyl
alkylphosphates are transformed into (VOhP207 by calcination, and the obtained catalysts exhibit
good selectivity for the selective oxidation of n-butane. Since these vanadyl alkyl phosphates possess
weakly held alcohols (ROH) in their interlayer, it is expected that these materials can be used as host
for modification of their interlayer space by using metal-complexes. After intercalation of
metal-complex followed by calcination, the promoter may be fixed in the catalyst bulk uniformly. In
Chapter 4.2, the author found that iron-complex, such as Fe(acac hand ferrocene, was successfully
intercalated into interlayer of vanadyl benzyl phosphate by heating in toluene.
In this Chapter, the author applied this method for intercalation of Fe(acac), into vanadyl
n-hexylphosphate, followed by calcination. The obtained catalysts were characterized by means of
XRD, IR, XPS and elemental analysis. The catalytic performance for the selective oxidation of
n-butane was examined with a wide range of concentrations of n-butane (from 1.5 to 5.0 %) and O2
(from 10 to 30 %) and their redox properties were measured by uptake of O2 and by reduction with
n-butane. A role of the Fe will be discussed in relation to redox property, comparing with the Fe-free
(VOhP20 7 catalyst obtained by calcination of the vanadyl n-hexylphosphate.
114

Chapter 4
Experimental
Preparation of Fe-doped catalysts by intercalation of Fe (acach
Vanadyl n-hexylphosphate was prepared as described in Chapter 4.1. V 20S (29.2 g, Kishida
Chemical Co., Ltd.) was reduced in a mixture of isobutyl alcohol (180 cm" Kishida Chemical Co.,
Ltd.) and benzyl alcohol (120 cm', Kishida Chemical Co., Ltd.) at refluxing temperature for 3 h. The
obtained black solid was separated by filtration. The solid (about 20 g) was added to I-hexanol
(300 cm', Kishida Chemical Co., Ltd.). and then a mixture of P20, (29.6 g, Kishida Chemical Co ..
Ltd.) and toluene (75 cm', Kishida Chemical Co., Ltd.) was slowly added to the suspension with
stirring at room temperature. The mixture was then refluxed for 3 h. The resultant light-blue solid
was filtered, washed with acetone (250 cm3, Kishida Chemical Co., Ltd.), and dried at room
temperature for 12 h. Elemental analysis, IR, TG-DTA, and magnetic susceptibility reveal that the
obtained solid was VO{(n-C6H 13)o 6/Ho4}POdn-C6H 130H)o 5 (abbreviated as VHexP).
Powder of Fe(acac)3 (Kishida Chemical Co., Ltd.) was dissolved in 36 cm3 of toluene at room
temperature. Fe(acac), was loaded as molar ratio of Fe(acachIVHexP=O.1 or 0.5. VHexP (4.0 g)
was added to the solution at room temperature and then heated with stirring at 358 K for 3 h. Then,
the solid was filtered, washed with acetone (40 cm\ and dried at room temperature for 12 h.
Hereafter, these precursors obtained from the loading ration of Fe(acachIVHexP=O.1 and 0.5 are
denoted to Fe(O.l )-VHexP and Fe(0.5)-VHexP, respectively.
These precursors were calcined in a flow of a mixture of n-butane 5 %, O2 20% and N2 75%
(100 cm3 min'l) at 823 K for 12 h. The catalysts obtained from VHexP, Fe(O.l)-VHexP and
Fe(0.5)-VHexP are denoted to VHexP-VPO, Fe(O.I)-VPO, and Fe(0.5)-VPO, respectively.
Characterization
Powder XRD patterns were recorded on an X-ray diffractometer (Rigaku RINT-1200) with
Cu Ka radiation (A=0.154 nm). Infrared spectra were obtained with an IR spectrometer (JASCO
FTIR-470/Plus) using a pressed disk made from a mixture of the sample powder and KBr. Elemental
analysis of the compounds was performed with a Mikroanalytisches Labor Pascher (Germany).
Surface area of the catalyst was estimated by a BET method using adsorption isotherm of N2 at 77 K
measured with BELSORP 28 SA (BEL Japan Inc.), after the sample was evacuated at 473 K for 2 h.
X-ray photoelectron spectra (XPS) were recorded using a Surface Science Instruments S-Probe
115

Chapter .j
ESCA Model 2803 with Al Ka radiation. Prior to the measurements, 100 mg of the catalyst powder
after the reaction was aged in a flow of a mixture of 5 % n-butane, 20 % 02 and 75 % N2 (20 cm' min-I
of total flow rate) at 723 K for 2 h. After the pretreatment, the catalyst powder was cooled to room
temperature in N2 flow (20 cm' min-I) within 1 min. All spectra were referenced to the carbon 1 s
peak at a binding energy of285.0 eY.
Time-profiles of reduction and re-oxidation
Time-profiles of reduction of the catalyst with n-butane and re-oxidation with air were measured
by using a Seiko Instrument TG/DTA-6300. The level of the reduction and oxidation were
monitored by the weight decrease in a flow of 5 % n-butane (N2 balance) and the weight increase in a
flow of air, respectively. The catalyst sample was pretreated in the same way of the XPS
measurement. The pretreated sample (ca. \0 mg) was set on a sample holder in the TG/DTA
apparatus. The temperature of the sample was then rose in a N2 flow (50 cm3 min-I) to 723 K at a
rate of 10K min-I and was held there. After further decrease in the weight was not detected at 723 K,
the feed gas was changed to 5 % n-butane (N2 balance, 50 cm3 min-I of total flow rate) to obtain the
time-profile of reduction.
For a measurement ofre-oxidation profile, another part of the pretreated sample was used. After
further decrease in the weight was not detected in a N2 flow at 723 K, the feed gas was changed to air
(50 cm' min-I) to obtain the time-profile ofre-oxidation.
Catalytic oxidation of n-butane
Catalytic oxidation of n-butane was carried out in a conventional fixed-bed flow reactor of Pyrex
tubing (inside diameter of 6 mm) under atmospheric pressure. A mixture of n-butane and 02 (N2
balance) at a total flow rate of 20 cm3 min-I was fed over the catalyst bed at 723 K. The
concentrations were varied from 1.5 % to 5.0 % for n-butane and from 10 % to 30 % for 02,
respectively. The conversion of n-butane was adjusted in the range of 10 - 15 % by changing of the
catalyst weight under the constant total flow rate in order to estimate the reaction rate under
differential conditions. The flow rates were controlled by thermal mass flow controllers (STEC
SEC-310). The products were analyzed with on-line gas chromatographs (FlO (Shimadzu 14A,
Shimadzu 9A) and TCD (Shimadzu 9A)) equipped with a Porapak QS column (inside diameter 2.2
116

Chapter 4
mm, length I m) for n-butane and MA, and a Porapak N column (inside diameter 2.2 mm, length 2 m)
for CO2. A Molecular Sieve 13X column (inside diameter 2.2 mm, length 4 m) was also used to
separate O2, N2 and CO. CO and CO2 were converted to methane by using a Methanizer (Shimadzu
MTN-l) to be detected more sensitively by the FID-GC. Prior to the reaction, the catalysts were
aged in the reaction mixture at 723 K for 5 h.
Results
Intercalation of Fe (acac) 3 into lamellar vanadyl n-hexylphosphate
Figure I shows XRD patterns of untreated VHexP and the compounds treated with Fe(acac»).
The VHexP gave strong diffraction line attributed to the (00 I) of lamellar structure at 28 = 4.70",
indicating 1.88 nm of the d(OO I) value [25,26]. High order diffraction lines at 28 = 9.16° and
13.62° attributed to the (002) and (003) were also observed [25,26]. After the treatment with
Fe(acac)3, Fe(O.I)-VHexP and Fe(0.5)-VHexP gave the XRD patterns of lamellar structure as VHexP,
while the (001) diffraction lines were shifted to higher angle at 28 = 5.40° for Fe(O.I)-VHexP and
5.32° for Fe(0.5)-VHexP, which indicate decrease in the d(OOl) value to 1.63 nm and 1.66 nm,
respectively.
Table I lists the PN and FeN ratios of VHexP and the compounds treated with Fe(acack The
bulk PN ratios of these compounds were nearly unity. The bulk FeN ratios were 0.04 for
Fe(O.I)-VHexP and 0.08 for Fe(0.5)-VHexP, respectively. The bulk FeN ratio increased as the
loading ratio increased, but that was
significantly small in comparison with the
loading ratio. The surface FeN ratio was
the same as the bulk one within an
experimental error.
(b)
(a)
5 10 15 20 25
2e~
Fig. 1 XRD patterns of precursors. (a) VHexP,
(b) Fe(O.1 )-VHexP and (c) Fe(0.5)-VHexP.
117
Table 1 Bulk and surface composition ofthe precursors.
Precursor PN ratio FeN ratio
YHexP Fe(O.I)-YHexP Fe(O.S)-YHexP
Bulka Bulka Surfaceb
1.02 0.00 0.00 1.03 0.04 O.OS J .02 0.08 0.08
" Determined by ICP-AES. b Determined by XPS.
Microstructure of catalyst
Chapter 4
Table 2 lists compositions and surface area of the catalysts. The bulk PN ratios were about unity.
The bulk FeN ratios of the catalysts were almost the same as the FeN ratios of the precursors listed in
Table I. The surface FeN ratio was the same as the bulk one. The surface areas of the catalysts
were determined to be 2.9, 1.7, and 0.8 m2 gO] for YHexP-YPO, Fe(O.1 )-YPO, and Fe(O.S)-YPO,
respectively.
Table 2 Composition and surface area of the catalysts.
Catalyst PN ratio FeN ratio
YHexP-YPO Fe(O.I)-YPO Fe(O.S)-YPO
Bulka Bulka Surfaceb
1.0 I 0.00 0.00 1.05 0.05 0.05 1.04 0.08 0.08
a Determined by ICP-AES. b Determined by XPS. C Surface area after the selective oxidation of n-butane.
Surface area" ( 2 -I) m g
2.9 1.7 0.8
The XRD patterns of the catalysts after the calcination are shown in Fig. 2. The XRD patterns of
these catalysts basically showed that of (YOhP20 7 [2] and other diffraction lines were not observed.
The three catalysts gave almost the same relative intensities of the diffraction lines. YHexP-YPO
(Fig. 2a) gave almost the same angles of diffraction lines observed in a pure (YO)2P207 reported in the
literature [2]. The 28 angles were sifted to low-angle direction with increasing of the FeN ratio,
indicating some changes of lattice spacing. To estimate the lattice spacing precisely, the 28 angles of
the (200), (024) and (032) diffraction lines were measured with a step scan mode using Si powder as a
internal standard. The results are listed in Table 3. The lattice spacing of the (200) for YHexP-YPO
was 0.3867 nm. Those for the Fe-doped catalysts were larger by ca. 0.0010 nm than that for
YHexP-VPO, being 0.3877 nm for Fe(O.I)-YPO and 0.3879 nm for Fe(0.5)-YPO, respectively. The
118

Chapter .j
lattice spacings of the (024) and (032) for the Fe-doped catalysts were also larger than those for
VHexP-VPO.
Figure 3 presents infrared spectra of the catalysts. These catalysts gave bands approximately at
634 cm'! (S(P03)), 745 cm'! (v(P-O-P)), 797 cm'! (v(V-O=V)), 940 cm'! (v(P-OH)) 1002 cm'!
(v(V=O)), 1 070 cm'! (v(P03)), and 1 1 1 0 - 1280 cm'! (v(P03)) [29]. In the case of Fe(O. 1)-VPO and
Fe(0.5)-VPO, the band at 1002 cm'! for v(V=O) was weakened.
Table 3 The 28 angles of the (200), (024) and (032) diffraction lines of the Fe-doped (VOhP20 7 catalystsa
.
Catalyst
VHexP-VPO Fe(O. 1)-VPO Fe(0.5)-VPO
(200) 23.00 22.94 22.93
28 angle (deg.) (024) 28.51 28.48 28.46
(032) 30.01 29.95 29.94
Lattice spacing (nm) (200) (024) (032)
0.3867 0.3 1 3 1 0.2978 0.3877 0.3 134 0.2984 0.3879 0.3137 0.2985
a The 28 angles of diffraction lines were measured with Cu Ka radiation (A=0.1542 nm) by a step scan mode using Si powder as a internal standard.
119

tv o
Vl 0... C)
----.0 .-Vl c: Q) ...... c: ......
rOOO cps
20
1
81 °1 ~I
~I N 8
N'I C') 1
81
30 2 e /degree
(c)
(b)
(a)
40
Fig. 2 XRD patterns of catalysts after the calcination at 823 K
under 5 % n-butane and 20 % O2 in N2 balance for 12 h.
(a) VHexP-VPO, (b) Fe(O.I)-VPO and (c) Fe(0.5)-VPO.
;::::s
d
---<I) u a -€ o rJ)
~
1600
0-1 o o .........
1200 800 Wavenumber / em -1
(c)
(b)
(a)
Fig. 3 IR spectra of catalysts after the calcination.
(a) VHexP-VPO, (b) Fe(O.1 )-VPO and (c) Fe(0.5)-VPO.
Chapter -I

Chapter 4
Figure 4 provides the XPS spectra of the catalyst, where V(2pll2), V(2p3/2), Fe(2p1l2), and Fe(2p3/2)
peaks are observed. For VHexP-VPO, the peak of Y(2p3/2) was observed at 517.5 eY, while the
peaks of Fe(O.1 )-YPO and Fe(0.5)-VPO were shifted to 517.9 eV which was as 0.4 eV high as that of
YHexP-VPO. The Fe(2p3/2) peaks are observed at 713.1 eY for the Fe-doped catalysts and the peak
intensity increased in proportion to the FeN ratio.
15000 'P'
I
(A) (8) I I Fe(2p3/2)
V(2P3/2): I
V(2p 112)
(c)
(b)
525 740 730 720 710
Binding Energy (eV) Binding Energy (eV)
Fig. 4 X-ray photoelectron spectra of catalysts after the reaction. Part A (left),
vanadium; Part B (right), iron. Before measurements, the catalysts were pretreated
under 5.0 % n-butane and 20 % O2 in N2 balance at 723 K for 2 h. (a) VHexP-VPO,
(b) Fe(O.1 )-YPO and (c) Fe(0.5)-YPO.
121

Chapter 4
Rates of reduction and re-oxidation
Fig. 5 provides the time-profile of reduction with n-butane and re-oxidation with air at 723 K. In
the time profile of reduction (Fig. SA), level of the reduction was expressed as an amount of oxygen
abstracted from the catalyst. Amounts of abstracted oxygen (Amountabstract) and oxygen uptake
(Amountllptake) were estimated from Eq. (l), in which these amounts were expressed per surface area.
Amountabstract or Amountllpt"ke = ( I ) l6XWoXSA
Where Wo (g) and Wt (g) represent the catalyst weight at first and a certain time, respectively, and SA
( 1 -I). l:: m- g IS a surlace area.
o E :::t
--
O~---------------------. 150.--------------------.
o
;. 100
~ -50 -v ~ ... -VJ
.£; ro s:: v bJ) >. x o
-0-::l
[5 50 bJ) >. x o
-IOO~----~------~------~ o 20 40 60 20 40 60 Reduction time / min Oxidation time / min
Fig. 5 Time-profile of reduction with 5.0 % n-butane (A) and re-oxidation with air (8) at
723 K. Prior to the measurements, the catalysts were pretreated under 5.0 % n-butane and
20 % O2 in N2 balance at 723 K for 2 h. The amount of abstracted oxygen or oxygen
uptake were calculated from the weight decrease or increase monitored by TG/DTA
apparatus. (a) VHexP-VPO, (b) Fe(O.l )-VPO and (c) Fe(O.S)-VPO.
It is generally accepted that the selective oxidation of n-butane over (VO)2P207 catalyst proceeds
via a redox cycle between V4+ and V5~ [30,3 I]. Pepera et a!. reported that the number of surface
layers involved in the redox processes during the oxidation of n-butane is about unity [30]. In
addition, Okuhara et a!. showed that the diffusion of oxygen atoms is limited to a few layers of
(VO)2P207 during the reaction [32]. Therefore, it can be considered that Fig. 5 shows the
122

Chapter -I
time-profiles of reduction and re-oxidation at a top few surface layers of the catalyst.
As shown in Fig. 5A, YHexP-YPO and Fe(O.l)-YPO gave nearly same reduction profiles, while it
was observed that Fe(0.5)-YPO was reduced faster and deeper than YHexP-YPO and Fe(O.I)-YPO.
The initial reduction rates of the catalysts estimated from the slope of the curve within 10 min are
summarized in Table 4. The order of the initial reduction rates was Fe(O.l)-VPO (59 )lmol m-2 h-I) <
YHexP-VPO (68 )lmol m-2 h-1) < Fe(0.5)-VPO (100 )lmol m-2 h-1
). The reduction rate of
Fe(0.5)-VPO was about 1.5 times faster than that ofVHexP-VPO.
The re-oxidation rate increased with increasing of the FeN ratio as shown in Fig 5B. The initial
re-oxidation rates estimated from the slope of the curve within 10 min are summarized in Table 4.
The initial re-oxidation rates were 62, 92, and 269 )lmol'm-2'h- 1 for VhexP-YPO, Fe(O.I)-YPO, and
Fe(0.5)-YPO, respectively. The ratio of initial re-oxidation rate to reduction rate listed in Table 4 was
in the order: YHexP-VPO (0.9) < Fe(O.l)-YPO (1.6) < Fe(0.5)-YPO (2.7).
Table 4 Initial rates of reduction and re-oxidation of the catalystsa.
Catalyst Rate (l1mol m2 h-I) Ratio of reduction re-oxidation re-oxidation/reduction
VHexP-VPO Fe(O.I)-VPO Fe(0.5)-VPO
68 62 59 92
100 269
0.9 1.6 2.7
a The rate were estimated from the slop of the curve within 10 min on the re-oxidation
or reduction profile.
Catalytic oxidation oin-butane
Time courses of the conversion and selectivity over Fe(0.5)-YPO are given in Fig. 6. At the
initial stage of the reaction, the conversion gradually decreased with time for 5.0 % n-butane and was
nearly constant for 1.5 % n-butane. The selectivity increased with time for both 1.5 % and 5.0 %
n-butane. After 5 h, both the conversion and selectivity reached nearly stationary values for both
reaction conditions. Since the other catalysts gave similar time courses, the reaction rate and
selectivity were estimated from the data collected after 5 h.
123

Chapter 4
20
0 0 ~ 0 0 0 0 0 0 0 0
--- • • • • • c: • • 0 'Vi 10 s... <l)
> c: 0 u
Fig. 6 Changes of the conversion and
0 selectivity to maleic anhydride In the
"2f?-oxidation of n-butane over Fe(0.5)-VPO at
--- 0 0 0 0 0 0 0 723 K with 20 % O2• Concentrations of -< 60
0 0 n-butane were (.) 1.5 % and (0) 5.0 %, :E • • • 0 • • respectively. +-' • • >..
+-' .;; 40 .;;:;
u <l)
<l)
C/l
200 2 4 6 8
Time / h
The dependencies for the rates of MA or COx (CO+C02) formation on the concentration of
n-butane are given Fig. 7, where the concentration of O2 is 20 %. The rates are expressed per unit
surface area. Since the rate was estimated from the data that the conversion of n-butane was in the
range of 10- 15 %, consecutive oxidation of MA would be negligible [33,34]. The rates of MA and
COx formations for Fe(O.!)-VPO and Fe(0.5)-VPO were larger than that of VHexP-VPO, and these
rates increased with increasing of the FeN ratio. The reaction orders for MA and COx formation
estimated from the slopes in Fig 7B are listed in Table 5. The reaction orders for MA formation (n of
P"Il-butalle = 0.4) was unchanged by the addition of Fe. On the other hand, the addition caused the
decrease of the reaction order for CO, formation on the concentrations of n-butane from (p of Pl'n-butanc
=) 0.3 to 0.1.
Table 5 Reaction orders for MA and COx formation on the catalystsa.
e n m VHexP-VPO 550 0.4 0.2 297 0.3 0.3 Fe(O.I)-VPO 612 0.4 0.1 227 0.1 0.5 Fe(0.5)-VPO 725 0.4 0.1 463 0.1 0.6
a I -? I -I J.l.mo 'm -.,
124

N Vl
300 (A)
~ <;l
200 E -0 E ::t
I ---- ~. x 0 :.J
l-<
300'
~ <;l 200 E -0 E ::t
----
• •
~
2.51- (8)
x o :.J
l-<
bl) 2 ..2
1.5 2.5
« 2
l-<
~ 2
• • • .. "I"
~ 100 l-<
00 0.03 0.06 1.5' , I
-2 -1.5 -1 Concentration of n-butane I atm log(P n-butane/atm)
Fig. 7 Dependencies of rates for maleic anhydride and COx formation on concentration of l7-butane. The
concentration of O2 is 20 % and the reaction temperature is 723 K. rMA and rcox represent rate for maleic
anhydride and COx formation, respectively: (e) VHexP-VPO, (A) Fe(O.1 )-VPO and (_) Fe(0.5)-VPO.
Chapter 4

Chapter 4
Fig. 8 shows the dependence of the rates on the concentration of O2, where the concentration of
n-butane was 1.5 %. The rates of MA formation for Fe(O.I)-VPO and Fe(0.5)-VPO were larger than
that for VHexP-VPO. The reaction order for MA formation listed in Table 5 was decreased with the
addition of Fe, being (m ofPIII
02 =) 0.3, 0.1 and 0.1 on VHexP-VPO, Fe(O.l)-VPO and Fe(0.5)-VPO,
respectively. On the other hand, the reaction order for COx formation greatly increased with the
addition of Fe as (q of P"02 =) 0.3, 0.5 and 0.6 on VHexP-VPO, Fe(O.I)-VPO and Fe(0.5)-VPO,
respectively.
Figure 9 gives the dependence of the selectivity to MA on the concentrations of n-butane and O2,
The selectivity on VHexP-VPO scarcely varied with changes of n-butane and O2 concentrations. On
the contrary, the selectivity on the Fe-doped catalyst showed great dependence on these concentrations.
The selectivity at 1.5 % n-butane was in the order: Fe(0.5)-VPO < Fe(O.I)-VPO < VHexP-VPO. The
selectivity increased greatly on the Fe-doped catalyst as concentration of n-butane increased, because
the rates for COx formation on the catalysts was almost independent of n-butane concentration, while
those for MA formation increased (Fig. 7). Consequently, the order of the selectivity with 5.0 %
n-butane was counterchanged to Fe(0.5)-VPO < VHexP-VPO < Fe(O.l)-VPO. At low O2
concentration (10 %), Fe(O.1 )-VPO showed highest selectivity among these catalysts. Fe(0.5)-VPO
gave lowest selectivity to MA under the all experimental concentrations.
80~--------------------~ (A)
o 0.03 0.06 0 Concentration of n-butane / atm
(8)
0.2
Conventration of O 2 / atm
0.4
Fig. 9 Influences of selectivity to maleic anhydride on concentrations of (A) n-butane and (8) O2.
The reaction temperature is 723 K. The concentration of O2 and n-butane are 20 % for dependence on
n-butane (left) and 1.5 % for dependence on O2 (right), respectively. ( .) VHexP-VPO, (£)
Fe(O.! )-VPO and (_) Fe(0.5)-VPO.
126

-~
'";l 8 -0 8 ::i
---:><: 0 U
I-<
N -.J .
...s::: '";l 8 -0 8 ::i
---<t:
~
300
I 200
200
00
(A)
0.2 Concentration of 0 2 / atm
0.4
2.51- (8)
:><: o (i OJ) 2 ..s
1.51-1 ---...L.-------L---i
2.5
~ OJ) 2 ..s
. -----_.- -------
1.5' I , ,
-1.2 -0.9 -0.6 -0.3 log(P 02/atm)
Fig. 8 Dependencies of rates for maleic anhydride and COx formation on concentration of O2. The
concentration of n-butane is 5.0 % and the reaction temperature is 723 K. rMA and rcox represent rate for
maleic anhydride and COx formation, respectively: ( .) VHexP-VPO, ( ... ) Fe(O.l)-VPO and (.)
Fe(0.5)-VPO.
Chapter 4

Chapter 4
Discussion
Intercalation of Fe (acacJJ into lamellar vanadyl n-hexylphosphate
As listed in Table I, the bulk FeN ratios were almost the same as those of the surface FeN ratios
for both Fe(O.I)-VHexP and Fe(0.5)-VHexP. The XRD of VHexP showed a typical pattern for
lamellar compound [26]. After the treatments of Fe(acach, Fe(O.I)-VHexP and Fe(0.5)-VHexP also
kept the lamellar structure. even though the d(OO I) values slightly decreased. Considering from the
consistency with the bulk and surface FeN ratio, Fe(acac)3 was uniformly dispersed in the crystallites.
These results indicate that Fe(acac)3 was successfully intercalated into the interlayer ofVHexP.
As shown in Chapter 4.2, Fe(acac») can be intercalated into lamellar vanadyl benzyl phosphate
(abbreviated as VBzP), VO«C6HsCH2)07/Ho3HC6HsCH20H)05, by the same conditions of the
treatment. In the case ofVBzP, benzyl alcohols existed in the interIayer were replaced by Fe(acac)3
with causing little decrease of the d(OOI) value [28]. VHexP is shown to be
VO{(n-C6H13 )o 6/Ho4}POdn-C6HI30H)o 5 and has
alcohols in their interlayer space as well as VBzP [26]. Therefore, it can be expected that the
intercalation of Fe(acac)3 into VHexP occurred in accordance with the same mechanism for that into
VBzP.
It IS considered that an interaction between host (lamellar compounds) and guest
(metal-complexes) is greatly dependent on their properties, e.g., shape, size and kind of organic group,
charge density and interlayer distance for lamellar compounds, and size and kind of ligand for
metal-complexes. VHexP and VBzP have nearly the same basal spacing (1.78 nm for VBzP and
VHexP for 1.90 nm, respectively), but the character of interlayer space is different; i.e. benzyl or
n-hexyl group. In the case of VBzP [28], since the surface FeN ratio (0.18) was about twice as in
the bulk (0.08), it is considered that some part of Fe(acac)3 aggregates on the surface. On the other
hand. in the case of VHexP, the surface FeN ratio was almost the same as the bulk ratio as listed in
Table I. These results clearly demonstrate that VHexP is a suitable host material for the intercalation
of Fe(acac)3.
Structure of Fe-doped catalysts
The structure of the Fe-doped catalysts is basically (VO)2P207 as confirmed from XRD patterns
(Fig. 2), although lattice spacings of the Fe-doped catalysts spread in comparison with the Fe-free
(VO)2P207 as listed in Table 3. Since the surface FeN ratio of the Fe-doped catalysts was almost the
128

Chapter 4
same as the bulk one, Fe is considered to uniformly disperse in the bulk.
A question is where the Fe ions exist in (VO)2P207. Two possible cases should be considered;
the first is that the Fe ions are substituted for V4+, namely substitutional solid solution. The second is
that the Fe ions are located at interstitial positions, that is, interstitial solid solution. It is generally
known that interstitial compounds are formed, only when penetrating ions are significantly small in
comparison with lattice ions. Since the van der Waals radius of Fe3+ (0.079 nm) is rather larger than
that of V4+ (0.072 nm), it is quite unlikely that the Fe ions are located at interstitial positions of
As listed in Table 2, the lattice spacing increases linearly with the FeN ratio. In addition, the
vibration of v(V=O) was weakened by the addition of Fe as shown in Fig. 3, suggesting that the
number ofV4+ ions decreased. As mentioned above, Fe3
+ has rather larger van der Waals radius than
V4+. It is known that substitutional solid solution often takes place when the radius of penetrating
ions are close to that of lattice ions. Therefore, it is concluded that the Fe ions are substituted for V4+
Kinetics and role of Fe
From Figs. 7 and 8, the kinetics for MA formation are given in Eqs. 2-4, where rMA, r'MA and
r "MA are the rates for MA formation. PII-butane and POl are partial pressures of n-butane and O2,
respectively, and kVHexP, k 'Fe(O I) and k "Fe(DS) represent the rate constants.
k PDA pO.2 rMA = VHexP n-butane 02
, - k' p O.4 p O.1 r MA - Fe(O.I) II-butane 02
" k" pOA VO. 1 r MA = Fe(O.S) n-butane-< 02
(VHexP-VPO)
(Fe(O.I)-VPO)
(Fe(0.5)-VPO)
(2)
(3)
(4)
The rate constants are in the order: kVHexP < k'Fe(OI) < k"Fe(OS) (Table 5). The dope of Fe causes the
increase of the rate constant and the decrease of the reaction order on the partial pressure of O2,
indicating that the property of the active sites for MA formation is changed.
The overall reaction rate is considered to be a result of specific reaction rate (per active site) and
the number of the active sites. Okuhara et al. [35] demonstrated that MA is formed selectively on the
basal (200) plane of (VO)2P207, on the other hand, side planes are non-selective for this reaction.
Considering from that, the number of the active site can be greatly dependent on the proportion of
129

Chapter 4
exposure of the crystal plane, that is, morphology of the catalyst. VHexP-VPO was transformed
from VHexP by the calcination. The Fe-doped catalysts were also obtained from the intercalation
compounds that VHexP incorporates Fe(acac), in the interlayer space. As shown in Fig. 3, the
relative intensities in the XRD of these catalysts were almost the same. This result indicates that the
morphologies of these catalysts are resemble each other, that is, the ratio of the (200) planes having the
active sites for MA formation is almost the same. Therefore, it is considered that a role of the Fe is
mainly to enhance the specific reaction rate for MA formation.
The selective oxidation of n-butane over (VO)2P207 has been accepted to proceed via a redox
mechanism at a few surface layers [30-32]. On the basis of this mechanism, the MA formation can
be simplified to following two steps [30], where [ ] and [0] represent a vacant site and a oxidized
site of the catalyst surface, respectively. O2, Bu and MA represent oxygen, n-butane and maleic
anhydride in a gas phase, and k", and kre are rate constants of re-oxidation and reduction, respectively.
kox ] + O2 ~ [0]
kre [0] + Bu ~ MA + [
(5)
(6)
When the reaction reached the stationary state, the rate of re-oxidation (eq. 5) is equal to that of
reduction (eq. 6), and the stationary oxidation state of the surface is proportional to koJkre . A general
expression of the rate for MA formation is expressed in Eq. (7) from this process [30].
(7)
Here a indicates the stoichiometric number of O2 required for this reaction (a=3.5).
In this expression, if kre is much lower than kox (kre « kox ), the expression will be reduced to
k P LO pOo re n-blltane 02· On the contrary, if kre is much higher than kox (kre » kox ), the expression becomes
k -lpO.O pLO oxa n-blltane 02· Thus, the ratio of the reaction order on n-butane concentration (n) to that of O2
concentration (m) is related to the ratio of kox to kre • As koJkre becomes higher, nlm will become
larger. In addition, if both kox and kre become larger, the rate constant (kYHexP, k'Fe(OI) and k"Fe(05) of
MA formation in Eqs. 2-4 will become large.
The dope of Fe raises the rate constant for MA formation as listed in Table 5. As mentioned
above, that is due to the enhanced specific reaction rate by that dope. This result suggests that the
130

Chapter 4
dope of Fe can raise the rates of both reduction and re-oxidation. In addition, the dope of Fe also
causes the drop of the nlm ratio from 4.0 to 2.0, suggesting that the rate of re-oxidation becomes much
faster that that of reduction. As shown in Fig. 5. the Fe-doped catalysts, in fact. gave higher rate of
both reduction and re-oxidation. Furthermore, the ratio of re-oxidation to reduction rates increase
with increasing of the FeN ratio (Table 4), indicating that the rate of re-oxidation becomes much
faster than that of reduction.
The Fe ions exist not only in the bulk but also on the surface. The peak of V(2Pll2) was
observed at 517.5 eV on VHexP-VPO in XPS (Fig. 4a). On the other hand, Fe(O.I)-VPO and
Fe(0.5)-VPO gave the peak at 517.9 eV (Figs. 4b,c). According to the past reports about XPS for
vanadium phosphorus oxides [36-38], the binding energy of V5+(2p3/2) in VOP04 and V4+(2p3/2) in
(VOhP20 7 are observed in the range of
518.0-518.4 eV and 516.9-517.1 eV, respectively. In the present study, since the catalysts were
quenched at a stationary state of the selective oxidation of n-butane, the XPS spectra would reflect the
oxidation state of V ions at this state. The binding energies of these catalysts indicate that the surface
of the Fe-doped catalysts is in a higher oxidation state in comparison with the Fe-free catalyst. That
is consistent with the kinetics and the rates of reduction and re-oxidation. Therefore. it is concluded
that the Fe enhances the redox ability, especially re-oxidation of the active sites f~r MA formation.
This retains the catalyst surface at an appropriate oxidation state during the reaction, resulting in the
higher rate of MA formation.
The kinetics for COx formation are shown in Eqs. (8-10) from Figs. 7 and 8, where rcox, r 'cox and
r"co, are the rates of COx formation.
0] pO] reo., = qVlle,P p lI·butane 02
. . pO I pIJ4 r COx = q l:c(O I) II-butane 02
.... pOI pOll r Co, = q l"c(O 'i) II-butane OC
(VHexP-VPO)
(Fe(O.1 )-VPO)
(Fe(0.5)-VPO)
(8)
(9)
(10)
The dope of Fe causes increase of the rate constant, decreases of the reaction order on partial
pressure of n-butane, and increases of the reaction order on partial pressure of O2. COx formation has
been considered to take place on the different sites from those for MA formation [40]; for example,
this concerns with adsorbed oxygen species [40,41]. We deduce that the Fe3+ ions on the surface
form another active sites for COx formation, which reveal different dependencies on partial pressures
131

Chapter -I
of n-butane and O2•
Application of Fe-doped catalyst under high partial pressure ofn-butane
From an industrial viewpoint, the operation under high concentrations of n-butane can achieve a
higher space-time yield of MA. To realize such operation, a catalyst having high activity and
selectivity under the high concentrations of n-butane is required. In addition to that, concentration of
O2 falls to very low at a high conversion of n-butane under the reaction condition of high n-butane
concentration, because usually the feed of n-butane in air is industrially used as a reaction mixture.
Therefore, the catalyst is also desired to have a high activity and selectivity under the 10""
concentrations of O 2•
As shown in Fig. 7, the rate for MA formation is high on the whole partial pressure of n-butane.
Furthermore, the rate scarcely falls even at the low partial pressure of O2 on the Fe-doped catalysts
(Fig. 8). Consequently, the Fe-doped catalyst gave high selectivity to MA under both the high partial
pressure of n-butane and low partial pressure of O2 as shown in Fig. 9. These results demonstrated
that the dope of Fe by using of intercalation of Fe(acac)3 is promising technique for preparation of
efficient catalysts that is suitable for operation under the high partial pressure of n-butane.
Conclusion
Fe(acac), was successfully intercalated into vanadyl n-hexylphosphate by heating in toluene.
The obtained intercalation compound was transformed to (VOhP207 by calcination under the reaction
condition of n-butane oxidation. The Fe ions uniformly spread in (VO)2P207. The Fe-doped
catalyst exhibited the high catalytic performance for MA formation. It was revealed that the
Fe-doped catalyst possessed high redox ability, especially re-oxidation. The high redox ability on a
surface layers of the Fe-doped catalyst results in the high catalytic performance for the selective
oxidation of n-butane.
References
[I] B.K. Hodnett, Calal. Rev. -Sci. Eng., 17 (1985) 373.
[2] E. Bordes, Calal. Today, 1 (1987) 499.
[3] G. Centi, F. Trifiro, J.R. Ebner, Y.M. Franchetti, Chem. Rev., 88 (1988) 55.
132

[4] F. Cavani, F. Trifiro, Chemtech,24 (1994) 18.
[5] GJ. Hutchings, Appl. Catal., 72 (1991) 1.
Chapter oJ
[6] M.T. Sananes-Schultz, F. Ben Abdelouahab, GJ. Hutchings, J.e. Volta, J. Catal., 163 (1996) 346.
[7] D. Ye, A. Satsuma, A. Hattori, T. Hattori, Y. Murakami, Catal. Today, 16 (1993) 113.
[8] F.B. Abdelouahab, R. Olier, M. Ziyad, J.e. Volta, J. Catal., 157 (1995) 687.
[9] D. Ye, A. Satsuma, T. Hattori, Y. Murakami,J. Chern. Soc., Chern. Commun., (1990) 1337.
[10] G. Bagnasco, L. Benes, P. Galli, M.A. Massucci, P. Patrono, G. Russo, M. Turco, Stud. Surf Sci.
Catal., 119 (1998) 653.
[11] M. Hatano, M. Masayoshi, K. Shima, M. Ito, US Patent 5128299 (1992).
[12] MJ. Mummey, EP Patent 326536 A I (1989).
[13] J.w. Johnson, D.C. Johnston, AJ. Jacobson, J.F. Brody, J. Am. Chern. Soc., 100 (1984) 8123.
[14] T. Shimoda, T. Okuhara, M. Misono, Bull. Chern. Soc. Jpn., 58 (1985) 2163.
[15] K. Beneke, G. Lagaly, Inorg. Chern., 22 (1983) 1503.
[16] T. Nakato, Y. Furumi, N. Terao, T. Okuhara, J. Mater. Chern., 10 (2000) 737.
[17] v.v. Guriants, J.B. Benziger, S. Sundaresan, I.E. Wachs, J.-M. Jehng, Chern. Mater., 7 (1995)
1493.
[18] J.w. Johnson, AJ. Jacobson, J.F. Brody, J.T. Lewandowski, Inorg. Chern., 23 (1984) 3842.
[19] G. Huan, J.w. Johnson, J.F. Brody, D.P. Goshorn, AJ. Jacobson, Mater. Chern. Phys., 35 (4993)
199.
[20] E.M. Sabbar, M.E. de Roy, A. Ennaqadi, G. Gueho, J.P. Besse, Chern. Mater., 10 (1998) 3856.
[21] N, Mizuno, H. Hatayama, S. Uchida, A. Taguchi, Chern. Mater., 13 (2001) 179.
[22] M. Roca, J.E. Haskouri, S. Cabrera, A.B. Porter, J. Alamo, D.B. Porter, M.D. Marcos, P. Amor6s,
Chern. Commun., (1998) 1883.
[23] T. Nakato, Y. Furumi, T. Okuhara, Chern. Lett., (1998) 611.
[24] N. Hiyoshi, N. Yamamoto, Y. Okuhara, Chern. Lett., (2001) 484.
[25] Y. Kamiya, E. Nishikawa, A. Satsuma, N. Mizuno, T. Okuhara, J. Jpn. Petro. Inst., 44 (2001) 265.
[26] Y. Kamiya, E. Nishikawa, A. Satsuma, T. Okuhara, Bull. Chern. Soc. Jpn., (in press).
[27] N. Hiyoshi, N. Yamamoto, Y. Kamiya, E. Nishikawa, T. Okuhara, Catal. Today, 71 (2001) 129.
[28] A. Satsuma, Y. Kijima, S. Komai, Y. Kamiya, E. Nishikawa, T. Hattori, Catal. Today, 71 (200 I)
161.
[29] G. Busca, F. Cavani, G. Centi, F. Trifiro, J. Catal., 99 (1986) 400.
133

Chapter 4
[30] M. Pepera, J.L. Callaham, M.J. Desmond, E.e. Milberger, P.R. Blum, N.J. Bremer, J. Am. Chern.
Soc., 107 (1985) 4883.
[31] G. Koyano, T. Okuhara, M. Misono, J. Am. Chern. Soc., 120 (1998) 767.
[32] T. Okuhara_ M. Misono_ Calal. Today_ 16 (1993) 61.
[33] H. Igarashi. K. Tsuji_ T. Okuhara_ M. Misono_.! Phys. Chem._ 97 (1993) 7065.
[34] G. Centi, G. Fornasari, F. Trifiro, Ind. Eng. Chern. Prod. Res. Dev., 24 (1985) 32.
[35] K. Inumaru, T. Okuhara, M. Misono, Chern. Lett., (1995) 1992.
[36] N .B. Harrouch, H. Batis, A. Ghorbel, J .C. Vedrine, J .C. Volta, J. Catal., 128 (1991) 248.
[37] L.M. Cornaglia, e. Caspani, E.A. Lomgardo, Appl. Catal., 74 (1991) 15.
[38] T.P. Moser, G.L. Schrader, J. Catal,. 104 (1987) 99.
[40] U. Rodemerck, B. Kubis, H.-W. Zanthoff, M. Baerns, Appl. Catal. A, 153 (1997) 203.
[41] J.T. Gleaves, J.R. Ebner, T.e. Kuechler, Calal. Rev. -Sci. Eng. 30 (1988) 49.
134

Chapter 5
Vanadyl Pyrophosphate Catalysts with Thin Film
Morphology Prepared by Intercalation, Exfoliation
and Reduction ofVOP04- 2H20
in Alcohol

Chapter 5
Abstract
A new method through intercalation and exfoliation of VOP04'2H20 crystallites in primary
alcohol (I-propanol or I-butanol), followed by reduction with the alcohol, have been investigated for
the preparation of catalyst precursor. Lamellar compounds, consisting of V4+, p5
+ and alkyl group
with thin film-like morphology, were formed and was characterized by means of XRO, lR, TG/OTA,
and elemental analysis. The chemical formula of the precursor obtained by exfoliation-reduction in
I-butanol was shown to be VO{(n-C4H9)O.16Ho84}P04·0.8H20. On the other hand, a direct reduction
ofVOP04'2H20 in the alcohol gave a mixed phase shown by
(VOHP04·0.5H20)oJ(VO{(n-C4H9)oJHo.7} P04'3H20)07 comprising plate-like microcrystallites.
These precursors transformed to (VO)2P20 7 phase during an activation process at 703 K in the
presence of a mixture of n-butane 1.5 % and O2 17 % in He balance. The obtained (VO)2P207
through the exfoliation-reduction was well-crystallized and consisted of thin flaky crystallites. It was
found that (VOhP20 7 thus prepared through the exfoliation-reduction was highly active and selective
for oxidation of n-butane,
1ntroduction
Selective oxidation of n-butane to maleic anhydride (abbreviated-as MA) is one of
commercialized applications in the gas-phase oxidation of lower alkanes with oxygen [1]. Vanadyl
pyrophosphate, (VO)2P207, is a main component of a commercial catalyst for this reaction [2-5].
One of major problems in the commercial plant is the insufficient yield of MA. It is thus desirable to
improve the yield by development of the catalytic performance.
Since the catalytic activity and selectivity of (VO)2P207 are greatly dependent on the
microstructure of the crystallites [6-8], control of the microstructure is critical for improvement of the
catalytic performance. It is well known that vanadyl hydrogen phosphate hemihydrate,
(VOHP04·0.5H20) a precursor for (YO)2P207, can be also obtained by reduction of VOP04 '2H20
with alcohol [9]. Hutchings et at. [10,11] reported that the morphology of the precursor could be
controlled by a choice of alcohol used as reducing agent.
Exfoliation technique has been developed from intercalation of various layered materials like clay
[12], zirconium phosphate [13], niobates [14], and titanates [15], in which exfoliation is a method
delaminating stacked inorganic sheets in solvent by infinite swelling of their interlayer space.
VOP04' 2H20 is one of layered compounds and possesses a high intercalating capability [16].
136

Chapter 5
The aim of this Chapter is preparing the precursor and catalyst through intercalation, exfoliation
and reduction of VOP04 . 2H20 in primary alcohol in order to preferentially expose the (100) plane.
The obtained crystallites have been systematically characterized in order to elucidate the features of
this preparation method. Furthermore, the catalytic property for the selective oxidation of n-butane
has been examined, comparing with that of conventional catalyst.
Experimental
Preparation of precursors
VOP04·2H20 was prepared according to the literature [16]. A mixture of V20 S (24 g, Wako
Pure Chemical Ind. Ltd.) and 85%H3P04 (133 cm3, Wako Pure Chemical Ind. Ltd.) and H20 (577 cm3
)
was refluxed at 388 K for 16 h to form precipitates. The obtained solid was filtered, washed with
acetone, and dried at room temperature for 16 h. The solid was confirmed to be VOP04'2H20 by
XRD and IR. VOP04·2H20 (0.5 g) was added to I-propanol or I-butanol (50 cm3, Wako Pure
Chemical Ind. Ltd.) at room temperature. The suspension was stepwise heated at room temperature,
303, 323, or 343 K for I h at each temperature. Then the solution was further refluxed at 363 K
(I-propanol) or 383 K (I-butanol) for 24 h to obtain light-blue precipitates. The obtained solids from
I-propanol and I-butanol are denoted to EP( I-Pr) and EP(I-Bu), respectively.
As a reference, the precursors were separately prepared by the conventional methods, e.g., the
direct reduction ofVOP04·2H20 with alcohol [II] and the organic solvent method [8]. For the direct
reduction, VOP04·2H20 (5.0 g) was added to I-propanol, I-butanol or 2-butanol (50 cm3, Wako Pure
Chemical Ind. Ltd.) at room temperature, followed by refluxed at 363 K (I-propanol) or 383 K
(I-butanol and 2-butanol) for 18 h. The solids obtained from I-propanol, I-butanol and 2-butanol are
denoted to P(I-Pr), P(l-Bu) and P(2-Bu), respectively. For the organic solvent method, the precursor
VOHP04·O.5H20 (denoted as P-3) was prepared using isobutyl alcohol and benzyl alcohol [8], and the
corresponding (VO)2P207 (denoted as C-3) was obtained by the calcination at 773 K in 9.1 % O2 (He
balance).
Characterization
Powder XRD patterns were obtained on an X-ray diffractometer (Rigaku Miniflex) with CuK"
radiation (1.,=0.154 nm). Infrared spectra were recorded with an IR spectrometer (Bio-rad FTS-7) by
a KBr method. SEM images were taken by using a Hitachi S-2100A scanning electron microscope.
137

Chapter 5
Thermogravimetric analysis (TG/DTA) was performed in a flow of dry air (100 cm} min-I) by using a
Seiko Instruments TG/DTA-6300. The sample was heated from 303 K to S53 K at a rate of
10 K min-I.
Elemental analysis of the samples for C and H were carried out at the Center for Instrumental
analysis, Hokkaido University. The contents of V and P were determined by an inductively coupled
plasma atomic emission spectrometer (ICP-AES, Shimadzu ICPS-SOOO), in which the sample powder
was dissolved into hot H2S04, and the solution was diluted with water to about 30 ppm of V and P.
The content of oxygen in the sample was calculated by subtracting the sum of weights of V, P, C, and
H.
The average oxidation number of V was determined by a redox titration method according to the
literature [IS]. The surface area was measured by a BET method with automatic adsorption system
(BELSORP 2SSA, BEL Japan Inc.).
Catalytic oxidation of n-butane
Catalytic oxidation of n-butane was performed in a flow reactor (Pyrex tube, inside diameter of
10 mm) under an atmospheric pressure at 703 K using a mixture consisting of n-butane 1.5 vol%, O2
17 vol%, and He (balance). The precursor was activated in the reactant mixture by heating from
room temperature to 703 K at a rate of 10K min-I. The products were analyzed with gas
chromatographs, an FID-GC (Shimadzu SA) equipped with Porapak QS column for n-butane and MA,
and a high speed GC (TCD, Area Japan M-200) with Porapak Q and Molecular Sieves 5A columns for
O2, CO, and CO2. The catalysts derived from EP(I-Bu) and P(I-Bu) are denoted to EC(I-Bu) and
C( I-Bu), respectively.
Results and discussion
Catalyst precursors obtained through exfoliation OfVOPO{2H20
When the powder of VOP04"2H20 (lemon yellow) was stepwise heated in I-butanol at room
temperature, 303 K, 323 K, and 343 K for 1 h at each temperature, the alcohol suspension became
homogeneous yellow solution. By evaporating the resulting homogeneous solution at 333 K, a
yellow-green powder was formed. XRD pattern and IR spectrum of the solid were the same as those
of the starting VOP04·2H20 (the data were not shown). As will be discussed elsewhere [17,19,20],
VOP04 sheets were delaminated in I-butanol solution (exfoliation). Subsequent refluxing the
138

('/wpli!r 5
exfoliation solution for 24 h produced light-blue precipitates. Also in the case of I-propanol, a
homogeneous alcoholic solution was obtained and light-blue precipitate was formed by further
refluxing.
SEM images are shown in Fig. I. The starting VOPO~'2HoO consisted of square platelets with
the lateral dimensions of about 10 /-un and thickness of about I 1.1In (Fig. I a). As Figs. 1 band c show.
the precursor obtained by intercalation, exfoliation, and reduction (EP( I-Pr) and EP( I-Bu» consists of
thin films (thickness; less than 0.1 /-un) randomly gathered.
aggregates of plate-like microcrystallites (Fig. I d).
'N., li£lJt
On the other hand, P( I-Bu) was
Fig. 1 SEM micrographs of vanadium phosphorus oxides. (a) VOP04·2H20. (b) EP( l-Pr),
(c) EP( l-Bu), (d) P( l-Bu), (e) Ee( l-Bu), and (f) C(I-Bu).
139

Chapter 5
Table I summarizes the results of the elemental chemical analysis of EP(I-Bu) and P(I-Bu),
together with average oxidation numbers of V. The PlY ratios of both precursors were nearly unity
and the average oxidation numbers were about +4.0. The RiP ratio of EP(l-Bu) estimated from the
C/P ratio was 0.16 (R = n-C4H9), indicating n-butyl group is incorporated in EP( I-Bu). The RIP ratio
ofP(I-Bu) was 0.08, which was less than that ofEP(I-Bu).
Figure 2 shows the XRD patterns of starting VOP04·2H20 and the obtained precursors. The
XRD pattern of P(2-Bu) corresponds to that of VOHP04·O.5H20 with characteristic XRD lines (Fig.
11) [21]. As shown in Figs 2b and c, the XRD patterns of the precursors obtained by the
exfoliation-reduction process differ from that of P(2-Bu). EP( I-Pr) and EP(l-Bu) gave intense peaks
at less than 10° of 28, suggesting a lamellar compound with intercalated alcohol molecules.
Assuming that these intense peaks correspond to a diffraction from the (00 I) plane, the basal spacings
(doo )) are estimated to be 0.98 nm and 1.07 nm for EP(I-Pr) and EP(l-Bu), respectively, and these
values are larger than that of VOP04'2H20 (0.74 nm) (Fig. 2a). The XRD patterns show peaks
assignable to the (002) lines at 18.2° (0.49 nm) for EP(l-Pr) and 16.6° (0.53 nm) for EP(I-Bu),
respectively. Molecular lengths of I-propanol and I-butanol are 0.464 nm and 0.596 nm,
respectively, where the molecular length as the distance between 0 and H of -CH3 is estimated on the
basis of the covalent bond length with MOPAC (FUJITSU, WinMOPAC Ver. 3.0). Since the dool
value of EP(l-Bu) is larger than that of EP( I-Pr), it is considered that the alkyl groups play an
essential role in constructing the lamellar structure.
The precursors obtained by direct reduction in I-propanol and I-butanol also gave typical
patterns due to lamellar compound (Figs. 2d and e). The doo) values for P(l-Pr) and P(l-Bu) were
1.59 nm and 1.57 nm, respectively, which were larger than those of EP(l-Pr) and EP(I-Bu). Since
doo ) value changed scarcely when I-butanol was used instead of I-propanol, the size of alkyl group
dose not influence the basal spacing. For P(I-Pr) and P(I-Bu), a strong sharp line at 30.52° of28 was
observed, which agrees with a diffraction of the (220) plane for VOHP04·0.5H20. Furthermore, an
XRD line at 15.64° assigned to the (001) line for VOHP04·O.5H20 was observed. Hutchings et at.
[11] reported that similar process produced VOHP04·0.5H20 with a specific VPD (VOP04'2H 20
route) morphology which favor thin platelets in the [001] direction. Therefore, it is deduced that
P(I-Pr) and P(I-Bu) is a mixture ofVOHP04·0.5H20 and the lamellar compound.
140

"""' ,j::..
"""'
Table 1 Elemental analysis and average oxidation number of vanadium for the precursors obtained from VOP04·2H20 in I-butanol.
Precursora
v Weight percentageD Average oxidation
P C H Oc number of V Formula
EP(I-Bu) 24.79 15.83 3.76 2.95 52.67 (1.00) ( 1.05) (0.64)
3.95 VO{(C4H9)o 2HOS} P04·0.8H2O (6.01 ) (6.76)
P( l-Bu) 25.12 15.95 1.93 2.23 54.77 (1.00) (1.04) (0.33) ( 4.49) (6.94)
4.05 (VOHP04·O.5 ~hO)o ,(VO {(C4H9)o.3H07} P04·2H2O)07
aEP(I-Bu) and P(1-Bu) were obtained by exfoliation-reduction and direct reduction ofVOP04·2H20 in I-butanol, respectively.
b The figures in parentheses are relative atomic ratios.
C Oxygen content was estimated by subtracting the sum of weights of V, P, C, and H.
Chapter 5

...... ~ t-:)
o X 0.5 (f)
;j d
--->. I ..... 1.07 nnh .-r.I':J
t::
A Q) ..... X2 (c) t:: I
....... 1\
(b) ~ ~
0.74 nm I
XO.l (a)
10 20 30 40 50 2 e / deg.
Fig. 2 XRD patterns of vanadium phosphorus oxides.
(a) YOP04·2H20. (b) EP(I-Pr), (c) EP(I-Bu), (d) P(I-Pr),
(e) ~(I-Bu), and (f) P(2-Bu). (0) YOHP04·O.5H20.
('hapter 5
3371
:::l ro
v (.)
c
11 3557
11 3411
<C
3500 3000 2500 1500 1000 500 Wavenumber / em -1
Fig.3 Infrared spectra of vanadium phosphorus oxides.
(a) YOP04·2H20, (b) EP(I-Bu), (c) P(I-Bu), and (d) P(2-Bu).

Chapter 5
Infrared spectra of VOP04'2H20 and the precursors are given in Fig. 3. The spectrum of
P(2-Bu) are consistent with that of VOHP04·O.5H20 (Fig. 3d) [7]. The bands for P(2-Bu) were
assigned to v(P03) for 1197, 1103, and 1055 cm"\ 8(P-OH) for 1131 cm"l, v(V=O) for 977 cm"l, and
v(P-OH) for 932 cm"1 [7]. All precursors gave similar spectra to that of VOHP04·0.5H20 in lattice
vibration region (less that 1500 cm"I), indicating that a structure ofV-P-O layer for the precursors is
analogous to that of VOHP04·0.5H20. For EP( I-Bu), the bands at 1183, 1087, and 1062 cm"1 are
assigned to v(PO,) and 982 cm"1 to v(V=O) (Fig. 3b). In addition, the band at 933 cm'l (shoulder) is
assignable to v(P-OH). The P(I-Bu) displayed similar bands to P(2-Bu) in lattice vibration region,
although the bands were broadened. EP(I-Bu) and P(I-Bu) gave a broad band over 3000 cm,l, which
is similar to VOP04·2H20 (Fig. 3a), due to water weakly held in interlayer space.
TG/DTA profiles of EP(1-Bu), P(1-Bu) and
P(2-Bu) are illustrated in Fig. 4. As shown in Fig. 4a,
the sharp weight loss with endothermic below 450 K
and loose weight loss with exothermic above 500 K
were observed for EP( I-Bu). The initial weight loss
may be attributed to loss of intercalated water
molecules. Considering the exothermic and relatively
high temperatures, the weight loss above 500 K is
probably due to combustion of n-butyl group connected
by a covalent bond. From these results, the chemical
formula of EP(l-Bu) was estimated to be
VO{(n-C4H9)OI6Ho84}P04·0.8H20. For P(1-Bu), the
weight decreased in three steps at temperature range of
(I) below 400 K, (2) 400 - 570 K, and (3) above 570 K
(Fig. 4b). Endothermic valley observed at 650 K is
90
gO
,"--'
, , ,
,- t ~ " ""... u , "
I ......_
(a)
, ,_ ... , ",1 ' .....
I OO~-.L....--...l..---....L......{
~ 90 E ~
.~
~ gO
, , ~/"'''''''''_""
(b)
"
100F==±=:====-'----~
90
, , ,
(c)
... --- ..... ~,
",,
"..... ~ " , .....
' .. ' ...... , "
I'" , ~ attributed to transformation from VOHP04·0.5H20 to gO
(VO)2P207 as shown for P(2-Bu) (Fig. 4c). Since
P(I-Bu) is a mixture of VOHP04·0.5H20 and the
lamellar compound, the chemical formula of P(l-Bu)
is described as
143
70 '------:-40"-=0---:6..L00::----g::-:'0-=-'0
Temperature / K
Fig. 4 TG/DTA profile of vanadium
phosphorus oxides in air. (a) EP(I-Bu),
(b) P(1-Bu), and (c) P(2-Bu).

Chapter 5
We estimated x=O.3, y=O.3, and n=3 to satisfy the elemental analysis and TG result as listed in Table I.
Based on these results, the schematic structures of EP(l-Bu) and P(l-Bu) are depicted in Fig. 5.
The structure of V-P-O layer for both precursors is similar to VOHP04·O.5H20. For EP(I-Bu), the
alkyl group plays an essential role in constructing the lamellar structure. P(l-Bu) is a mixture of
VOHP04·O.5H20 and lamellar compound. The interlayer space of the lamellar compound is fulfilled
with intercalated water molecules to form the lamellar structure. That may be a reason that the basal
spacing of these compounds is not affected by the size of the alkyl groups.
1.07 nm (a)
1.57 nm (b)
Fig.5 Schematic structure of (a) EP(1-Bu) and (b) P(l-Bu).
144

Chapter 5
Catalytic oxidation of n-butane
Figure 6 shows the time course of the oxidation of n-butane over EC( I-Bu) and C( I-Bu). In
order to adjust the conversion, the reactions were performed in the different reaction conditions, that is,
W/F = 120 g'h'mor l for EC(I-Bu), and 163 g'h'mor l for C(I-Bu), respectively (W = catalyst weight
(g), and F = flow rate of n-butane (mol·h- I)). As shown in Fig 6, the conversion and selectivity to
MA increased at the initial stage of the reaction over both C(I-Bu) and EC(I-Bu). The stationary
values were obtained after about 80 h of the reaction, indicating that these catalysts were equilibrated.
Thus the reaction rate and selectivity were determined from the data collected around 100 h.
Figure 7 presents W/F dependence of the conversion of n-butane. The activity of EC( I-Bu) is
high compared with that ofC(I-Bu).
Figure 8 gives the change in the selectivity to MA as a function of the conversion of n-butane.
Fig. 8 demonstrates that EC( I-Bu) is more selective that C( I-Bu). In addition, it is noted that the
selectivity to MA was higher than 70 % at low conversions over EC( I-Bll).
In Table 2, the catalytic data are summarized. From the slope of the curve at low W IF region
(less than 80 g·h·mor l) in Fig. 7, the reaction rate was determined. The great difference in the
catalytic activity for EC(I-Bu) and C(I-Bu) is attributed to the difference in the surface area, since the
specific activity defined as the rate per surface area was comparable with each other. It should be
noted that EC(I-Bu) was more active than C-3, which is known to be effective for the n-butane
oxidation [1,4,8]. The selectivity of EC(l-Bu) was comparable to that ofC-3.
145

60
~
c 0
'Cii ..... <l)
> c 0 U
o~------~--------~------~
60 ~ o
.f'
.::: 40 u Q)
v CFJ
20
%~------4~0------~8~0-------1~20
Reaction time / h
Fig. 6 Changes of the conversion and
selectivity to maleic anhydride in the
oxidation of n-butane over various V -P oxide
catalysts: (0) EC(I-Bu); and (6) C(I-Bu).
The reaction was performed at 703 K with
n-butane (1.5 %), O2 (17 %), and He
(balance). W/F = 120 g'h'mor l for
EC(I-Bu), and 163 g·h·mor l for C(I-Bu),
respectively,
146
Chapter 5
80.-----------------~
~ 60
---t: 0
'Vi I-Q) ;> c:: 0 U
(W/F)/g,h,mor 1
Fig, 7 Dependence of the conversion of
n-butane on the contact time: (0) EC(I-Bu)
and (6) C(I-Bu). The reaction was
performed at 703 K with n-butane (1.5 %), O2
(17 %), and He (balance).
80.-------------------~
70 ~ ---,f' ;>
'';;:; (,) Q)
Q) VJ
60
50
20 40 60 80 Conversion I %
Fig. 8 Selectivity to MA as a function of the
conversion of n-butane: (0) EC(I-Bu) and
(6) C(l-Bu), The reaction was performed at
703 K with n-butane (1.5 %), O2 (17 %), and
He (balance),

"-' ~ -1
Table 2 Surface area, size of crystallites and catalytic performance of V -P oxides for oxidation of n-butanea
Catalystb
EC(I-Bu) C(I-Bu)
C-3
Surface area e
(m2 g-I)
41 22 36
Size of crystallites (nm)
length 1000 3000
a DSA
15 29
e DXRD
20 7
Rate (10-4 mol g-I h- I)
60 (1.5l 26 (1.2l 24 (0.7l
Selectivity to MN (%)
20 %" 50%h 71 67 59 53
ni a The reaction was performed with a mixture ofn-butane (1.5 %), O2 (17 %), and He (balance) at 703 K.
b EC(I-Bu) and C(l-Bu) were obtained from EP(I-Bu) and P(I-Bu), respectively, and C-3 is (VO)2P207
prepared by organic solvent method.
e Surface area after the reaction.
d Thickness estimated from surface area and density of (VO)2P207.
eThickness estimated with Scherrer's equation [23].
f Rate per surface area (10-4 mol m-2 h-I)
g Selectivity based on n-butane.
h Conversion of n-butane.
I Selectivity at 56 % of the conversion
Chapter 5

Chapter 5
As shown in Fig. I, the crystallites of EP( I-Bu) were fractured to small flaky crystallites by the
calcination under the reaction condition (Fig. I e). On the other hand. the plate-like morphology of
C( I-Bu) (Fig. I f) was basically kept to that of the precursor (Fig. 1 d).
Powder XRD patterns and IR spectra of the catalysts after the reaction are shown in Fig. 9.
Both EC( I-Bu) and C( I-Bu) gave XRD diffraction lines only due to (VO)2P207 (Fig. 9A). However,
the difference in the line-width was detected between these catalysts; EC(I-Bu) gave more sharp lines.
As shows in Fig. 9B, EC(I-Bu) gave IR bands at 632 em'! (8(P03», 744 em'! (v(P-O-P», 796 cm'!
(v(V-O=V», 970 cm'! (v(V=O», and 1092, 1143, 1220, and 1239 em'! (v(PO)) [7]. Contrary to
EC(I-Bu), the bands at 1099 cm'l and 1220 cm'l «v(PO,» were weak for C(1-Bu). XRD and IR data
suggest that the crystallinity of EC( I-Bu) is higher than that for C( I-Bu).
109~
1220~ A I (8)
(a)
1200 800
2 e I deg. Wavenumber I em ,I
Fig.9 XRD patterns (A, left) and IR spectra (B, right) ofV-P oxide catalysts after the reaction:
(a) EC(I-Bu) and (b) C(I-Bu).
The size of crystallites and surface area are summarized in Table 2. The surface area of
EC( I-Bu) was about two times higher than that of C( I-Bu). As will be discussed below. the thinner
microcrystallites are formed by the exfoliation-reduction metho. Thus the resulting crystallites have
high surface area. The thickness of the crystallites was estimated from surface area using the
148

Chapter 5
following equation 1 or from the XRD line-width of the (200) line using Scherrer's equation 2 [23].
2/DsA + 4/L= S . P ( I )
DXRD = (a . A)/(il2e . coseo) (2)
In eq. I, DSA is a thickness of crystallite, L is length of the crystallite, S is surface area, and p is the
density (3.34 X 10,12 g I1m,3) of (YOhP20 7 [24]. In eq. 2, DXRD is a thickness of crystallite, a is a
constant (1.0), il2e is a line-width of the (200) line, and eo is an angle of the (200) line.
DSA of EC( I-Bu) was estimated to be 15 nm which is approximately the same as DXRD (20 nm).
On the other hand, DSA (29 nm) of C(l-Bu) was greatly different from DXRD (7 nm). When XRD
lines are broadened by a structural disorder in the sample solid, the Scherrer's equation is considered
to underestimates a size of crystallites. C(l-Bu) gave broad lines in XRD, although DSA ofC(I-Bu)
is larger than that of EC(I-Bu). P(I-Bu) contains larger quantities of alkyl groups and water
molecules and larger dool value compared with EP(I-Bu), which may induce the structural disorder in
C(I-Bu) in the transformation of P(I-Bu) to C(I-Bu). This is the reason for the broader XRD lines
for C(I-Bu). Therefore, we chose DSA to estimate the thickness. The thickness of EC(I-Bu) was
about half of that ofC(I-Bu), resulting in the higher surface area ofEC(I-Bu).
Okuhara et al. [6] reported that the basal plane of (YO)2P207, on which characteristic pair sites
(y4+ -0-y 4+) are located, is selective for MA formation, but the side planes are non-selective for the
selective oxidation of n-butane. Since EC( I-Bu) consisted of thin flaky crystallites, the basal plane
was more exposed on EC(I-Bu) as compared with C(I-Bu). Therefore, one of the reason for the high
selectivity of EC( I-Bu) is the influence of the greater extent of the fraction of the basal plane. In
addition, the nature of the basal plane of EC(I-Bu) would be preferable for the selective formation of
MA. These results demonstrate that the present method utilizing intercalation, exfoliation and
reduction of VOP04·2H20 in primary alcohol is useful for development of efficient catalyst.
Conclusion
Powder of VOP04·2H20 was exfoliated by stepwise heating in I-butanol. The obtained
precursor was a lamellar compound and the chemical formula was YO{(n-C4H9)016H084}P04·0.8H20
with randomly gathered thin film. The precursor was transformed to (YOhP20 7 consisting of thin
149

Chapter 5
flaky crystallites during an activation process at 703 K in the presence of a reaction mixture. The
catalyst showed high activity and selectivity for the selective oxidation of n-butane in comparison with
the catalyst obtained by the direct reduction ofVOP04·2H20.
References
[I] S. Albonetti, F. Cavani, F. Trifiro, Calal. Rev. -Sci. Eng., 38 (1996) 413.
[2] E. Bordes, Calal. Todc~v, 1 (1987) 499.
[3] G. J. HlItchings, Appl. Catal., 72 (1991) I.
[4] G. Centi, F. Trifiro, J. R. Ebner, V. M. Franchetti, Chern. Rev., 88 (1988) 55.
[5] B. K. Hodnett, Calal. Rev. -Sci. Eng., 27 (1985) 373.
[6] K. Inumaru, T. Okuhara, M. Misono, Chern. Lett,. (1992) 947.
[7] G. Busca, F. Cavani, G. Centi, F. Trifiro, J. Catal., 99 (1986) 400.
[8] Y. Kamiya, E. Nishikawa, T. Okuhara, T. Hattori,Appl. Catal. A, 206 (2001) 103.
[9] J. W. Johnson, D. C. Johnston, A. J. Jacobson, J. F. Brody,J. Am. Chern. Soc., 106 (1984) 8123.
[10] I. J. Ellison, G. J. Hutchings, M. T. Sananes, J. C. Volta, J. Chern. Soc., Chern. Commun., (1994)
1093.
[II] M. T. Sananes, I. J. Ellison, S. Sajip, A. Burrows, C. J. Kiely, J. C. Volta, G. J. Hutchings, J.
Chem. Soc .. Faraday Trans. 92 (1996) 137.
[12] E. R. Kleinfeld, G. S. Furgson, Science, 265 (1994) 370.
[13] S. W. Kelle, H. -N. Kim, T. E. Mallouk,J. Am. Chern. Soc .. 116 (1994) 8817.
[14] R. Abe, K. Shinohara, A. Tanaka, M. Hara, J. N. Kondo, K. Domen, Chern. Mater., 9 (1997)
2179.
[15] T. Sakaki, S. Nakano, S. Yamauchi, M. Watanabe, Chern. Mater., 9 (1997) 602.
[16] G. Ladwig, Z. Anorg. Allg. Chem., 338 (1965) 266.
[17] N. Hiyoshi, N. Yamamoto, T. Okllhara, Chem. Lett., (2001) 484.
[18] B. K. Hodnett, P. Permanne, B. Delmon. Appl. Calal., 6 (1983) 231.
[19] T. Nakato, Y. Furumi, T. Okuhara, Chon. Lelt., (1998) 611.
[20] N. Yamamoto, N. Hiyoshi, T. Okuhara, Chern. Mater., (in press).
[21] H. Igarashi, K. Tsuji, T. Okuhara, M. Misono. J. Phys. Chern., 97 (1993) 7065.
150

[22] J. W. Johnson, A. J. Jacobson, J. F. Brody, S. M. Rich. Inorg. Chern., 21 (1982) 3820.
[23] P. Scherrer, Gdttinger Nachrichern, 2 (1918) 98.
[24] P. T. Nguyen, R. D. Hoffman, A. W. Sleight, Mater. Res. Bull., 30 (1995) 1055.
151
Chapter 5


Chapter 6
Highly Porous Vanadium Phosphorus Oxides from
Vanadyl Alkylphosphates

Chapter 6
Abstract
Highly porous vanadium phosphorus oxides of high specific surface area were synthesized by
thermal treatment oflayered vanadyl n-butylphosphate in N2. The surface area of vanadium phosphorus
oxides was greatly increased by thermal treatment within a temperature range of 500-550 K, and
reached 225 m2 g.1 after treatment at 568 K. The N2 adsorption-desorption isotherm of vanadium
phosphorus oxide is a Type IV isotherm, indicating that this material is mesoporous. Micropore and
mesopore size distributions were determined from Saito-Foley analysis using an Ar adsorption isotherm
and Dollimore-Heal analysis using an N2 desorption isotherm, respectively. The pores show a bimodal
distribution in the micropore and mesopore region, and the micropores show a broad distribution with
small volume (0.004 cm3 g-I). The mesopores, which have a size of 4.4 nm and a volume of
0.272 cm3 g-I, were probably formed from fractures of microcrystallites along layers of vanadyl
n-butylphosphate.
Introduction
Vanadium phosphorus oxides (V-P oxides) are highly functional materials in magnetism, catalysis,
electrodes, and other fields. Many reports address V -P oxides of various nanostructures; that is,
intercalation compounds [1-4], lamellar compounds [5-11], large crystallites [12], mesostructured
materials [13-16], and thin layered compounds [17,18). Among these oxides, vanadyl pyrophosphate
«VO)2P207) is the main component of a commercial catalyst for selective oxidation of n-butane to
maleic anhydride [19,20].
Porous V -P oxides of high specific surface area are desirable for use as catalysts, catalyst carriers,
and adsorbents. Although an intercalation compound ofvanadyl phosphate with Ni acetate was reported
to be microporous [23], most V -P oxides reported thus far, including (VO)2P207, VOP04, and VO(P04)2,
are non-porous or macroporous [21,22]. Various mesostructured V-P oxides have been synthesized by
surfactant templating methods [12-16]. However, removing the templates to form mesoporous V-P
oxides has proven difficult [12,15].
As reported in the Chapter 4, the author have synthesized a layered vanadyl n-butylphosphate,
VO{(n-C4H9)x1HI_x}POdn-C4H90H)y (x + y = 0.96). In the Chapter 7, a highly porous V-P oxide was
synthesized by thermal treatment ofthe vanadyl n-butylphosphate.
154

Experimental
Materials
Chapter 6
Vanadyl n-butylphosphate was prepared as described in the Chapter 4. V20 S (29.2 g, Koso
Chemical Co., Ltd.) was reduced with a mixture of isobutyl alcohol (180 cm3, Koso Chemical Co., Ltd.)
and benzyl alcohol (120 cm3, Koso Chemical Co., Ltd.) at the retluxing temperature (387 K) for 3 h.
The obtained black solid was separated by filtration. The solid (about 20 g) was added to 300 cm3 of
I-butanol, and then a mixture of P20 S (29.6 g, Koso Chemical Co., Ltd.) and toluene (70 cm', Koso
Chemical Co., Ltd.) was slowly added to the suspension with stirring at room temperature. The mixture
was then retluxed for 3 h. The resultant solid was separated by filtration, washed with acetone, and
dried at room temperature for 16 h. Elemental analysis and infrared spectroscopy reveal that the
obtained solid is VO{(n-C4H9VHI_JP04·(n-C4H90H)y (x + y = 0.96, abbreviated as VBuP) [24]. VBuP
(0.5 g) was placed in a Pyrex tubing reactor (inside diameter of 8 mm), and heated in a flow ofN2 (20
cm3 min-i) at a rate of 5 K min-i. The sample was maintained at constant temperature for 1 h, and cooled
to room temperature in the N2 flow. Hereafter, the V-P oxide obtained at a given temperature will be
denoted as V-P(treatment temperature).
Characterization
Both N2 adsorption-desorption and Ar adsorption isotherms were obtained by use of an automatic
adsorption-desorption system (BELSORP 28SA, BEL Japan Inc.), at liquid N2 temperature (77 K) and
liquid Ar temperature (87 K), respectively. Specific surface area of the V -P oxides was determined from
an N2 adsorption isotherm by the BET method. Mesopore and micropore size distributions were
obtained on the basis ofN2 desorption isotherms obtained by the Dollimore-Heal (DH) method [26] and
Ar adsorption isotherms obtained by the Saito-Foley method [27], respectively.
Powder X-ray diffraction (XRD) was recorded on an X-ray diffractometer (Rigaku RINT-1400)
with Cu K" radiation (IL = 0.154 nm). Infrared spectra were obtained with an IR spectrometer (JASCO
FTIR-470/Plus) using a pressed disk made from a mixture of the sample powder and KBr. SEM images
were taken by a Hitachi S-2l 00 B scanning electron microscope. Transmission electron micrographs
(TEM) were measured by a Hitachi H-7000 operated at 100 kY.
Elemental analysis of the compounds was performed with a Mikroanalytisches Labor Pascher
(Germany) for V, P, C, and H. The content of oxygen in the sample was calculated by subtracting the
155

-;-
l'hapter 6
sum of the weights of V, p, C, and H. The average oxidation number of V was determined by a redox
titration method using KMn04 and FeS04(NH4)2S04'6H20 in accordance with the literature [28].
Results and discussion
Surface area and pore size distribution
Figure I shows BET surface area as a function of treatment temperature. Fresh VBuP and V-P(508)
have surface areas of 8 and 6 m2 g-!, respectively. As seen in the figure, surface area increased greatly
after thermal treatment within the temperature range of 510 K-550 K, and maximum surface area
(225 m2 go!) was obtained at 568 K. Treatment above 700 K decreased the high surface area. When
VBuP was treated at 773 K, the produced V -P-oxide had a surface area of only 36 m2 gO!.
300 'bI)
bI)
<'18 6:' 150 f--< C/) -- 200 t\:S
~ t\:S Q) (.)
c.S I-. ;:::l
100 rJl
f--< ~ CO
500 600 700 800
Temperature I K
Fig. 1 Change in specific surface area as a
function of temperature of thermal treatment in
N2•
156
'-' M
8 ~ 100 Z 4-< o
a 50 .2 o >
0.5 Relative Pressure I (PIP 0)
Fig. 2 Nitrogen adsorption-desorption isotherm
at 77 K for vanadium phosphorus oxide obtained
by thermal treatment of the vanadyl
n-butylphosphate in N2 at 508 K (_, D), 568 K
( ., 0), and 773 K (., 6.). Solid and open
symbols correspond to adsorption and
desorption branches, respectively.

Chapter 6
Figure 2 shows N2 adsorption-desorption isotherms for V-P(S08), V-P(S68), and V-P(773).
V-P(S08) shows a Type V isotherm, indicating that V-P(S08) is mesoporous [29], and the hysteresis
loop is not clear. V -P(S68) shows a Type N isotherm, indicating that V -P(S68) is a mesoporous material
[29], and the hysteresis loop of V-P(S68) is much larger than that of V-P(S08). The shape of the
hysteresis loop at P/Po > O.S can be classified as a typical B type under de Boer classification [29],
suggesting the existence of slit-shaped pores. In addition, a steep increase in adsorption at very low
pressures suggests the presence of micro pores. In contrast, V-P(773) shows a Type III isotherm, which
is usually observed for non-porous or macroporous materials [29].
In order to determine the micropore size distribution of V -P(S68), an adsorption isotherm of Ar was
measured. Figure 3 shows the adsorption isotherm of Ar for V-P(568) within a low pressure range (PIPo
= 10-5 - 10-1
), in the form of a semi-log plot. A gentle transition of adsorption is observed at a relative
pressure of about 10-4 - 10-3
. Above 10-3, a nearly linear increase in the adsorption is observed. V -P(568)
shows low adsorption of Ar as compared with H-ZSM-S and NaY reported previously by Okuhara et al.
[30].
15 '7
00 ,--, P-. f-< r:rJ "-' 10 r <')
/ a u
---~ 4-< • 0
5 / 0 a ::l 0 > 00
00
0 o I I
10-5 10-4 10-3 10-2 10-1
Relative pressure I (PIP 0)
Fig. 3 Argon adsorption isotherm within low pressure range
for vanadium phosphorus oxide obtained by thermal
treatment of the vanadyl n-butylphosphate in N2 at S68 K.
157

Chapter 6
Figure 4 shows mesopore size distributions ofV-P(S08), V-P(S68), and V-P(773) and micropore
size distribution ofV-P(S68), the mesopore and micropore size distributions having been obtained from
the desorption branch of an N2 isotherm and the adsorption branch of an Ar isotherm, respectively.
V-P(S08) shows a very small peak at 3.S-S.0 nm, and V-P(773) has few mesopores. V-P(S68) has
bimodal pores, in the micropore and mesopore regions, with a narrow distribution and a large peak at 4.4
nm being observed in the mesopore region. In contrast, a broad, weak peak is detected in the micropore
region. Okuhara et al. reported that non-porous materials such as Si02 show no peak in the micropore
region when subjected to the same analysis of Ar adsorption isotherm [30]. Thus, micropores are
actually present in V-P(S68). Pore volumes of meso pore and micropore for V-P(S68) were estimated to
0.272 cm3 g-' and 0.004 cm3 g-', respectively. The surface areas of the walls of the mesopores and
micropores were estimated to be 312 m2 g-' and 19 m2 g-' from Eq. (1), respectively, indicating that the
mesopores contribute greatly to total surface area.
(I)
In Eq. (1), S is a surface area derived from the mesopores or micropores; Ri is pore radius, and Vi is p.ore
volume for pores of size R,.
";' 200 1000,,;, OJ) OJ)
";' ";'
E E s:: s:: ~ ISO 7S0 ,-...
N
<t:: Z .S" .S" '-' '-'
'" E 100 SOO '" E E E -- --11) 11)
E 2S0
E ::::l SO ::::l
0 0 > > 11) 11) .... .... 0 ~ -- , 0
0... 0 0 0...
0.4 0.8 1.2 2 3 4 5 6 7 8 910
Pore diameter / nm
Fig. 4. Mesopore and micropore size distributions for vanadium phosphorus oxide obtained by
thermal treatment ofvanadyl n-butylphosphate in N2 at S08 K (----), S68 K (-}, and 773 K
( -.-._). Mesopore size distribution was derived from the Dollimore-Heal method using the
desorption branch of the N2 isotherm. Micropore size distribution was obtained from the
Saito-Foley method using the Ar adsorption isotherm.
158

Figure 5 shows a I-plot for
V-P(568), which was obtained from the
N2 adsorption isotherm. The total
surface area estimated from the t-plot is
196 m2 g-I, which is consistent with the
BET surface area (225 m2 g-I). The
t-plot shows an upward deviation from
the straight line, which is attributable to
capillary condensation for mesopores
[29]. In contrast, a downward deviation
expected to result from the presence of
micropores is not observed clearly.
3.2 Formation o/pores
Chapter 6
150~--------------------~
'7 tl1) 100 M8 u --~ 8 ;::s - 50 0 >
0.5 1.5
tlnm
Fig. 5 The I-plot of vanadium phosphorus oxide obtained
by thermal treatment ofvanadyl n-butylphosphate in N2 at
568 K
Figure 6 shows the XRD patterns of VB uP, V-P(508), V-P(568), and V-P(773). The XRD pattern
of VBuP (Fig. 6a) suggests a layered compound with a basal spacing of 1.54 nm [24]. The layered
structure is maintained up to 508 K (Fig. 6b), but the oxide becomes amorphous after treatment at 568 K
(Fig. 6c). The great increase in surface area with treatment at 568 K suggests that the formation of pores
in the V-P oxides is probably related to destruction of the layered structure of VBuP. No crystalline
phases were detected, even for V -P(773) (Fig. 6d).
Figure 7 shows the IR spectra of VB uP, V-P(508), V-P(568), and V-P(773). The IR bands of VB uP
(Fig.7a) were assigned to v(P03) for 1057, 1093, and 1198 cm- I, v(V=O) for 981 cm- I, and vibration of a
P-O-C bond for 1151 cm- I (shoulder) [25]. The IR pattern is retained up to 508 K (Fig. 7b), but changes
greatly with treatment at 568 K (Fig. 7c). These findings are consistent with the results ofXRD. Since
C-H vibrations of n-butyl group at 2850-3000 cm-I [25] for VBuP (Fig. 6a) were not detected in
V-P(568), the layered structure of VBuP is thought to have been destructed with elimination of the
n-butyl groups.
159

~ (J') o
o ...... <:Il s::: Q) ...... s::: .......
Fig. 6
(d) ----(c)
~ (b)
IJL(\ (a) "I ~
10 20 30 40 50 2 e / deg.
Powder XRD patterns for (a) vanadyl
n-butylphosphate and vanadium phosphorus oxide obtained
by thermal treatment of vanadyl n-butylphosphate in N2 at
(b) 508 K, (c) 568 K, and (d) 773 K.
Q) u §
..0 '-o <:Il
..0 <C
3500 3000 2500 1500
Wavenumber / em-I
o N
1000
(d)
500
Fig. 7 IR spectra for (a) vanadyl n-butylphosphate and
vanadium phosphorus oxide obtained by thermal
treatment ofvanadyl n-butylphosphate in N2 at (b) 508 K,
(c) 568 K, and (d) 773 K.
('hapler 6

Chapter 6
Table I lists the results of elemental analysis for fresh VB uP and V-P(568), together with the
average oxidation number ofY. Since the CN ratio for VBuP (3.58) decreases to 0.58 for V-P(568), the
n-butyl groups that exist between V -p-o layers in VBuP are removed by thermal treatment. The
amounts of V, P, C, H, and 0 in V-P(568) were found to be 29.8, 18.2, 4.1, 0.8, and 47.1 wt%,
respectively. The PN atomic ratio ofV-P(568) is almost unity, and the average oxidation number of V
for V-P(568) is +3.75. On the basis of these data, the chemical formula ofV-P(568) is deduced to be
VP\00008' 0.69(HzO)·0.58C V and P having oxidation numbers of +3.75 and +5.00 respectively. The
carbon content ofV-P(568) is 4.1 wt%. When V-P(568) was treated in a mixture of O2 5 vol% and N2
95 vol% at 598 K for 4 h, the carbon content decreased to only 0.5 wt%, and surface area maintained a
high value (182 m2 g.I). Therefore, we can reasonably consider the pores and high surface area of
V -P(568) to have originated not from the carbonaceous materials, but from the V -P oxide itself. With
thermal treatment, the average oxidation number of the compound decreased from +4.01 for VBuP to
+3.75 for V-P(568) (Table 1). In other words, the treatment had an effect of drawing out oxygen from
the V -P-O layers, and this is a probable reason for the structure of the walls in V -P(568) being
amorphous.
Figure 8, shows SEM images of fresh VBuP and V-P(568). VBuP resembles bunches of grapes
(Fig.8a). V-P(568) shows essentially the same morphology as VBuP (Fig. 8b), with large numbers of
cracks present at the boundaries of the grape-bunches.
161

...... 0') ~
Table 1 Elemental analysis data and average oxidation number of vanadium for vanadyl n-butylphosphate and vanadium phosphorus oxide
obtained by thermal treatment ofvanadyl n-butylphosphate at 568 K in N 2.
Treatment temperature Elemental analysis (wt%) Atomic ratio Atomic ratio Oxidation number Y P C H Oa ofPN ofCN ofY
untreated 23.3 14.3 21.1 4.2 37.2 1.01 3.85 +4.01 ')68 K 29.8 18.2 4.1 0.8 47.1 1.00 0.58 +3.75
a Oxygen content was estimated by subtracting the sum of weights of Y, P, C, and H .
.~v " , "< :'! "
i",
,;, \'ti;;:~'", , 'iii ,,~J
" ", ,h" , " ), , "
.~" ,\1,' ",' 3f/fIlfv *'- "~ (- :.,~
, /" ,)".,~~~,,'i\!iII
'" '.~"~ .. ' ~ "
~ ~... ,~,
L-....- _' ,r.: ,\ :,~r~
Fig 8 Scanning electron micrographs of (a) vanadylil-butyiphosphate and (b) \anadium phosphorus oxide
obtained by thermal trcatmcnt of \ anadyln-butylphosphate in N2 at 568 K
Chapler 6

('hap/er ()
Figure 9 shows a typical TEM image ofV-P(568). Numerous sireaky gaps are observed as white
lines in microcrystallites. The gaps have an estimated width of about 5 nm, which is close to the size of
mesopores (4A nm) estimated from N1 isotherms. Thus, the mesopores are presumed to correspond to
the streaky gaps. VBuP is a layered compound consisting of alternating layers ofV-P-O (OAO nm) and
n-butyl (1.14 nm) [24]. When the n-butyllayers are removed from VBuP by thermal treatment, the
microcrystallites ofYBuP shrink in the direction of layer stacking. Atthis time, the microcrystallites are
partially fractured, due not to withstand stress acting on the microcrystallites. From the TEM image
(Fig. 9), the height of the one fragment in the microcrystallites is estimated to be about 8 nm. In view of
the height of the V -p-o layer (OAO nm), we would expect that one layer among about 20 might be
fractured.
Fig. 9 TEM image of vanadium phosphorus oxide obtained by thermal treatment
of vanadyl n-butylphosphate in N1 at 568 K.
Conclusions
Ilighly porous V-P oxides of high surface area were synthesized by the thermal treatment of
vanadyill-butyiphosphate in N, with treatment temperature ranging from 525 K to 705 K. Micropores
and 1l1esopores were characterized from Nl adsorption-desorption isotherms and Ar adsorption
isotherms. respectively. These porous V -P oxides were found to possess mainly mesopores having a
163

width of about 4.4 nm.
References
[I] K. Beneke, G. Lagaly, Inorg. Chern., 22 (1983) 1503.
[2] L. Benes, R. Hyklova, J. Kalousova, J. Votinsky, Inorg. Chim. Acta, 177 (1990) 71.
[3] A. De Stefan is, A. A. G. Tomlinson, J. Mater. Chern., 5 (1994) 319.
[4] T. Nakato, Y. Furumi, N. Terao, T. Okuhara, J. Mater. Chern., 10 (2000) 737.
[5] S. H. Horowitz, WO Patent (1998) 98115353.
Chapter 6
[6] V. V. Guliants, J. B. Benziger, S. Sundaresan, I. E. Wachs, J.-M. Jehng, Chern. Mater., 7 (1995) 1493.
[7] J. W. Johnson, A. J. Jacobson, J. F. Brody, J. T. Lewandowski, Inorg. Chern., 23 (1984) 3842.
[8] G. Huan, J. W. Johnson, J. F. Brody, D. P. Goshorn, A. J. Jacobson, Mater. Chern. Phys., 35 (1993)
199.
[9J G. Huan, A. J. Jacobson, J. W. Johnson. D. P. Goshorn, Chern. Mater .. 4 (1992) 661.
[10] E. M. Sabbar, M. E. de Roy, A. Ennaqadi, C. Gueho, J. P. Besse, Chern. Mater .• 10 (1998) 3856.
[II] J. W. Johnson, J. F. Brody, R. M. Alexander, Chern. Mater., 2 (1990) 198.
[12] N. Mizuno, H. Hatayama, S. Uchida, A. Taguchi, Chern. Mater., 13 (2001) 179.
[13] T. Doi, T. Miyake, Chern. Commun,. (1996) 1635.
[14] T. Abe, A. Taguchi, M. Iwamoto, Chern. Mater., 7 (1995) 1429.
[15] J. E. Haskouri, M. Roca, S. Cabrera, J. Alamo, A. B. Porter, D. B. Porter, M. D. Marcos, P. Amoros,
Chem. Mater., 11 (1999) 1446.
[\6] H. Hatayama. M. Misono, A. Taguchi, N. Mizuno, Chern. Lett., (2000) 884.
[17] N. Hiyoshi. N. Yamamoto, N. Terao, T. Nakato, T. Okuhara, Stud. Surf Sci. Calal., 130 (2000)
\ 715.
[18] T. Nakato, Y. Furumi, T. Okuhara, Chern. Lett., (1998) 611.
[\9] G. Centi, F. Trifiro, J. R. Ebner, V. M. Franchetti, Chern. Rev., 88 (1988) 55.
[20] B. K. Hodnett, Calal. Rev. Sci. Eng., 27 (1985) 373.
[21] M. T. Sananes, I. J. Ellison, S. Sajip, A. Burrows, C. J. Kiely, J. C. Volta, G. J. Hutchings, J. Chem.
Soc., Faraday Trans,. 92 (1996) 137.
[22] T. Shimoda, T. Okuhara, M. Misono, Bull. Chern. Soc. Jpn., 58 (1985) 2163.
164

Chapter 6
[23] B. G. Shpeizer, X. Ouyang, J. M. Heising, A. Clearfield, Chern. Mater., 13 (2001) 2288.
[24] Y. Kamiya, E. Nishikawa, A. Satsuma, N. Mizuno, T. Okuhara, J. Jpn. Petro. Inst., 44 (2001) 193.
[25] N. Hiyoshi, N. Yamamoto, Y. Kamiya, E. Nishikawa, T. Okuhara, Catal. Today (in press).
[26] D. Dollimore, G. R. Heal, J. Colloid Interface Sci., 33 (1970) 508.
[27] A. Saito, H. Foley, AIChE J., 37 (1991) 429.
[28] B. K. Hodnett, P. Permanne, B. Delmon, Appl. Catal., 6 (1983) 231.
[29] S. J. Gregg, K. S. W. Sing, Adsorption, "Surface Area and Porosi~v. 2nd edn." Academic Press,
London, (1982).
[30] T. Yamada, K. Johkan, T. Okuhara, Microporous Mesoporous Mater., 26 (1998) 109.
165


Chapter 7
Summary and General Conclusion

Chapter 7
7.1 Summary of each Chapter
As mentioned in Chapter I, the author proposed for developing the catalyst of high performance that
adequate design of the structure/composition makes the properties of the active sites improved, consequently,
the catalytic performance must be improved. The first subject of this thesis (Part I ) is to establish the
concepts that how the reduction and re-oxidation properties, and acidic property should be controlled to
improve the catalytic performance. The second subject of this thesis (Part II) is to develop the vanadium
phosphorus oxide catalysts with novel structure on the basis of controlling the structure and composition.
The main results obtained are summarized as follows.
Part I . Property of the Active Sites Controlling Catalytic Performance in the Selective
Oxidation of n-Butane.
Part I established the concepts that how the reduction and re-oxidation properties, and acidic property
should be controlled to improve the catalytic performance.
In Chapter 2, relationship between the reduction and re-oxidation properties, and catalytic
performances was investigated by using three types ofthe (VO)2P207 catalysts with different microstructures.
The catalysts were prepared in organic solvent (VPO-org), by reduction ofVOP04 '2H20 (VPO-redu), and in
aqueous medium (VPO-aq). The rates of MA formation per surface area greatly depended on the catalysts;
VPO-org was much active, especially at the high partial pressure of n-butane. Reaction kinetics suggested
that VPO-org had higher re-oxidation ability, by which the surface of VPO-org was retained as a higher
oxidation state during the reaction. Actually, it was confirmed that the V5+ density of VPO-org during the
reaction was about twice those of the other catalysts, and VPO-org showed higher rates of re-oxidation
estimated by measurement of re-oxidation with air. It was concluded that the' high catalytic activity of
VPO-org is due to this high ability of re-oxidation. This would be caused from enhancement of the
migration of the oxygen ions near the surface induced by the structural disorder of the catalyst. These
results established the concept that the re-oxidation ability should be improved for improving the catalytic
activity.
In Chapter 3, the relationship between acidic property and catalytic performance was investigated.
First (in Chapter 3.1), a new characterization method for quantitative determination of amount as well as
168

Chapter 7
strength of Bmnsted and Lewis acid sites separately was established. This method was a temperature
programmed desorption (TPD) using 3,5- and 2,6-dimethylpyridine (3,5-DMP and 2,6-DMP, respectively) as
probes. 2,6-DMP was confirmed to be adsorbed on Bmnsted acid sites selectively with the purging at 523
K, when catalyst had no very strong Lewis acid sites, whereas 3,5-DMP was adsorbed on both Bnmsted and
Lewis acid sites in this temperature. In addition, it was experimentally demonstrated that the desorption
temperatures of 2,6-DMP and 3,5-DMP adsorbed on one acid site were almost the same. From these results,
it was elucidated that 3,5-DMP-TPD, 2,6-DMP-TPD, and the differential spectra indicate the total, Bmnsted,
and Lewis acid sites, respectively.
Second (in Chapter 3.2), acidic properties of (VOhP20 7 catalysts were evaluated by the DMP-TPD
method, and then, the effects of the acidic properties on MA formation were elucidated. The (VO)2P207
catalysts had four types of acid sites: weak and strong Bremsted acid sites, and weak and strong Lewis acid
sites. The acidic properties greatly depended on the catalysts. VPO-org had a higher density of the strong
Bremsted acid sites, but these acid sites were relatively weak compared to the other catalysts. VPO-redu
had a higher density of the strong Lewis acid sites. VPO-aq had fewer acid sites except for the weak
Bmnsted acid sites. The selectivity to MA at low conversion increased with the density of the strong Lewis
acid sites, indicating the importance of these acid sites for MA formation. The strong Bmnsted acid sites
may promote the consecutive oxidation of MA. From the information obtained in Chapter 3, it can be
claimed that increase in the density of the strong Lewis acid sites, and contrary decrease in that of the strong
Bremsted acid sites are effective for improving the selectivity to MA.
Part H. Vanadium Phosphorus Oxide Catalysts with Novel Structures
Part II developed three types of vanadium phosphorus oxide catalysts with novel structures derived
from lamellar compounds on the basis of controlling the structure and composition.
In Chapter 4, iron-doped (VO)2P207 catalyst was developed by intercalation of iron-complex into
lamellar vanadyl alkylphosphate. First (in Chapter 4.1), novel lamellar vanadyl alkylphosphates were
synthesized and characterized systematically. The vanadyl alkylphosphates were synthesized by reaction of
a solid mixture ofV20 s and V40 S with P20 S in primary aliphatic, secondary aliphatic, alicyclic, and aliphatic
alcohols. These vanadyl alkylphosphates had primal characteristics of the bulk structure, that is, V-O-V
pair sites, valence state of V4+ and PN ratio of 1.0. Since the vanadyl alkylphosphates possessed weakly
held alcohol in their interlayer spaces, these materials were expected to accommodate guest molecules. The
169

Chapter 7
catalysts obtained from the vanadyl alkylphosphates showed high catalytic performance for the n-butane
oxidation to MA.
Second (in Chapter 4.2), intercalations of iron-complex such as Fe(acac)} and ferrocene were
investigated by using vanadyl benzylphosphate as host. The vanadyl benzyl phosphate and iron-complex
was heated at 358 K in toluene. From characterization of the compounds obtained, it was confirmed that
these iorn-complexs were successfully intercalated uniformly without significant distraction of the layer
structure.
Third (in Chapter 4.3), the method investigated in Chapter 4.2 was applied to modification of vanadyl
n-hexylphosphate and the catalytic properties in the selective oxidation of n-butane were investigated.
Fe(acac)3 was successfully intercalated uniformly in the case of the vanadyl n-hexylphosphate as well. The
obtained material was transformed to single phase of (VO)2P207 by a calcination. The doped Fe Ions
uniformly dispersed in the bulk and were mainly substituted for V4+ ions. The catalytic activity for MA
formation per unit surface area on the Fe-doped catalyst was higher than that on Fe-free catalyst. The
reaction kinetics suggested that the Fe-doped catalyst had higher reduction and especially re-oxidation ability.
The Fe-doped catalyst gave higher rate of both the reduction and especially re-oxidation than the Fe-free
catalyst, and the surface of the Fe-doped catalyst under the reaction was in a higher oxidation state. It was
concluded that the doped Fe ions can enhance the reduction and especially re-oxidation ability of the catalyst,
resulting in the higher catalytic performance in the n-butane oxidation.
Chapter 5 presented a new preparation method of the catalyst preferential expose of the (100) plane by
intercalation, exfoliation, and reduction of VOP04'2H20 in alcohols. The exfoliated sheets of
VOP04·2H20 were obtained by stepwise heating of VOP04'2H20 crystallites in I-butanol or I-propanol.
Subsequent reduction of these sheets produced the precursor. This precursor consisted of thin films-like
microcrystallites randomly gathered. On the contrary, the precursor obtained by direct reduction of
VOP04'2H20 was aggregates of plate-like microcrystal lites. The catalyst obtained through the exfoliation
(VPO-exf) was highly active and selective compared to the catalyst by the conventional method (VPO-conv).
It was confirmed that the thickness of VPO-exf was about half of that of VPO-conv, suggesting preferential
expose of the (100) plane. That is one of the reasons for the high selectivity on VPO-exf. In addition,
VPO-exf gave higher surface area, and showed high crystalline (VO)2P207. These would also contribute to
the high activity and selectivity ofVPO-exf.
In Chapter 6, highly porous vanadium phosphorus oxides of high surface area were synthesized by
170

Chapter 7
thermal treatment of the vanadyl n-butylphosphate in N2• The surface area of vanadium phosphorus oxides
was greatly increased by thermal treatment within a temperature range of 500-550 K, and reached 225 m2 g'!
after treatment at 568 K. The pores of the vanadium phosphorus oxides showed a bimodal distribution in
the micropore and mesopore region, and mainly consist of mesopores. The mesopores, which have a size
of 4.4 nm and a volume of 0.272 cm3 g'l, were probably formed from fractures of microcrystallites along
layers ofvanadyl n-butylphosphate by the thermal treatment in N2.
171

Chapter 7
7.2 General Conclusion
Almost all developments of the (VO)2P207 catalyst have been performed by the trial-and-error method,
however, now this method must be at the edge of its capabilities for improving their catalytic performances.
In this thesis, the author presented the relationships between the catalyst preparation and catalytic
performance as Scheme 2 in Chapter 1, and proposed the concept for developing the catalyst of high
performance that the adequate design of the structures and composition of the (VO)2P207 catalyst makes the
properties of the active sites improved, consequently, the catalytic performance must be improved.
However, there were the following critical two problems before the present thesis: (I) It could not be
imaged that what-like structure and composition were suitable to improve the chemical property of the active
sites, because understanding of the relationship between the chemical properties of the active sites and
catalytic performance was insufficient to understand how these properties should be controlled. (2) The
level of catalyst preparation of (VO)2P207 was far from "designing" the structure and composition, even if
one could know what-like structure and composition of (VO)2P207 were required.
The following conclusions can be drawn from the summary of each chapter mentioned above.
I. The re-oxidation ability should be improved to improve the catalytic performance per active sites.
Concerning the acidic property, increase in the density of the strong Lewis acid sites, and contrary
decrease in that of the strong Bmnsted acid sites are effective for improving the selectivity to MA.
2. The catalysts of novel structures with high catalytic performances in the selective oxidation of n-butane
can be developed on the basis of the adequately designing their structure and composition. (I) First, the
new precursors, vanadyl alkyl phosphates, were developed. The Fe ions uniformly dispersing in the
(VO)2P207 catalyst was synthesized by intercalation of iron-complex into lamellar vanadyl
alkylphosphates, followed by calcination. This catalyst had high reduction and especially re-oxidation
ability. (2) The catalyst with thin films-like microcrystallites, which had preferential expose of the (100)
plane, was synthesized by intercalation, exfoliation, and reduction of VOP04·2H20 in alcohol. (3)
Highly porous vanadium phosphorus oxides of high surface area (225 m2 g.) can be synthesized by
thermal treatment of lamellar vanadyl n-butylphosphate in N2. The pores mainly consist of mesopores,
172

Chapter 7
which are formed from fractures of micro crystallites along layers of the vanadyl n-butylphosphate.
3. Method for quantitative determination of amount and strength of Bronsted and Lewis acid sites separately
was established. This method will be available for investigations involving functions of acid sites on
solid acid catalysts as well as the (VO)2P207 catalyst.
173

Chapter 7
7.3 Future Prospects
The present thesis developed three types of the V -P oxide catalysts with the novel structures, that is,
the catalysts synthesized by (l) intercalation of iron-complex into lamellar vanadyl alkylphosphate, (2)
intercalation, exfoliation, and reduction of VOP04·2H20 in alcohol, and (3) thermal treatment of vanadyl
alkylphosphate in N2• Although each catalyst has a potential performance, the catalyst combined with these
three preparation methods will achieve the promising performances for the selective oxidation of n-butane.
For example, VOP04·2H20 is exfoliated in alcohol followed by addition of promoter and then, the exfoliated
sheets are reduced to form precursor. Besides that, thermal treatment of the vanadyl alkylphosphate
intercalating iron-complex will give the catalyst with both high surface area and reduction and re-oxidation
abilities. These are prospects for the catalyst with further high performance in the selective oxidation of
n-butane.
The present thesis demonstrated that the re-oxidation property, crystal plane and surface area can be
controlled by the three preparation methods. Acidic property is another factor controlling the catalytic
performance. Chapter 3 established the method for quantitative determination of Bronsted and Lewis acid
sites separately, and clarified the relationship between the acidic property and catalytic performance.
However, controlling the acidic property has been unachievable. The cause of this is lack of the
information on the structure of these acid sites at molecular level. Further quantitative estimation of acidic
property on well-characterized (VO)2P207 catalyst by the DMP-TPD method will clarify their structures.
Consequently, this information will open up adequately designing the acidic property for MA formation on
the basis of controlling the structure and composition of the (VO)2P207 catalyst.
So far, almost all commercial heterogeneous-catalysts have been developed by the conventional
trial-and-error method. In their initial studies, this method may be effective in seeking good catalyst and/or
improving the catalytic performance. Some of them were industrialized at a stretch. However, this
method must have a fate of reaching the end of the improvement eventually, because variable factors in the
preparation of the catalysts are not so much. Difficulties of latest target-reaction with which heterogeneous
catalysts are dealing are apt to increase. One of the ways to overcome this includes the multicomponent
catalyst. It can be expected that the multcomponent catalyst is highly structure sensitive. Recently, the
technique of combinatorial chemistry is applied in some developments of heterogeneous catalysts. This
technique is helpful for minimizing time for developing the multicomponent catalysts. However, the author
174

Chapter 7
conceives that it is also difficult to apply this technique in mature catalytic systems of structure sensitive
reaction systems, because this technique can performed no more than combination of many elements. The
present thesis demonstrated that adequate control ofthe structure and composition can improved the catalytic
performance of even mature catalytic system. This new strategy established in the present thesis proved
that mature catalytic system had a possibility of further improving its catalytic performance. The author
hopes to apply this strategy to the developments of other heterogeneous catalysts presumed to reach the limit
of improving their catalytic performances.
175

Chapter 7
List of publications
I .Original papers corresponding to this thesis.
Chapter 2.
I. Catalytic property of vanadyl pyrophosphates for selective oxidation of n-butane at high n-butane
concentrations.
Yuichi Kamiya, Eiichiro Nishikawa, Toshio Okuhara, Tadashi Hattori.
Appl. Catal. A, 206, 103-112 (200 I)
Chapter 3.
3.1
2. Dimethylpyridine-temperature programmed desorption (DMP-TPD) for measurement of strength of
Bronsted and Lewis acid sites on metal oxide catalysts.
3.2
Atsushi Satsuma, Yuichi Kamiya, Yenni Westi, Tadashi Hattori.
Appl. Catal. A, 194/195, 253-263 (2000).
3. The role of Bronsted and Lewis acid sites of vanadyl pyrophosphate measured by
dimethylpyridine-temperature programmed desorption in the selective oxidation of butane.
Yuichi Kamiya, Hiroyuki Nishiyama, Miki Yashiro, Atsushi Satsuma, Tadashi Hattori.
J Jpn. Petro. Inst. (in press)
Chapter 4.
4.1.
4. Synthesis of novel layered vanadyl alkylphosphates as catalyst precursors for selective oxidation of
n-butane.
Yuichi Kamiya, Eiichiro Nishikawa, Atsushi Satsuma, Noritaka Mizuno, Toshio Okuhara.
Sekiyu Gakkaishi (Letter), 44, 265-266 (2001).
176

Chap/a 7
5. Preparation and characterization of lamellar vanadyl alkylphosphates as catalyst precursors for selective
oxidation of n-butane.
Yuichi Kamiya, Eiichiro Nishikawa, Atsushi Satsuma, Toshio Okuhara.
Bull. Chem. Soc. Jpn. (in press)
6. Oxidation of n-butane over vanadyl pyrophosphates prepared from lamellar vanadyl alkylphosphates
Norihito Hiyoshi, Naoki Yamamoto, Yuichi Kamiya, Eiichiro Nishikawa, Toshio Okuhara.
Catal. Today, 71, 129-135 (200 I).
4.2
7. Insertion of iron-complex to lamellar vanadyl benzylphosphate for preparation of well-defined catalyst.
4.3
Atsushi Satsuma, Yuki Kijima, Shin-ichi Komai, Yuichi Kamiya, Eiichiro Nishikawa, Tadashi Hattori.
Catal. Today, 71,161-167 (2001).
8. Selective oxidation of n-butane over iron doped vanadyl pyrophosphate prepared from lamellar vanadyl
n-hexylphosphate.
Yuichi Kamiya, Yuki Kijima, Takuya Ohkura, Atsushi Satsuma, Tadashi Hattori.
Appl. Catal. A, (submitted).
Chapter 5.
9. Preparation of catalyst precursor for selective oxidation of n-butane by exfoliation-reduction of
YOPO{2H20 in primary alcohol.
Yuichi Kamiya, Satoshi Ueki, Norihito Hiyoshi, Naoki Yamamoto, Toshio Okuhara.
Catat. Today, (in press).
177

Chapter 6.
10. Highly porous vanadium phosphorus oxides derived from vanadyl n-butylphosphate.
Yuichi Kamiya, Eiichiro Nishikawa, Atsushi Satsuma, Miki Yoshimune, Toshio Okuhara.
Microporous and Mesoporous Mater., 54, 277-283 (2002).
II. Other pUblications.
Chapter 7
11. Determination of the acid strength of binary oxide catalysts using temperature programmed desorption
of pyridine.
Atsushi Satsuma, Yenni Westi, Yuichi Kamiya, Tadashi Hattori, Yuichi Murakami.
Bull. Chem. Soc. Jpn., 70, 1311-1317 (1997).
12. Radical type catalytic oxidation of butane at low temperatures over in-situ prepared silica species.
Atsushi Satsuma, Naruaki Sugiyama, Yuichi Kamiya, Tadashi Hattori.
Chem. Lett., 1051-1052 (1997).
13. Low temperature radical oxidation of butane over in-situ prepared silica species.
Atsushi Satsuma, Naruaki Sugiyama, Yuichi Kamiya, T. Kamatani, Tadashi Hattori.
Stud. Surf Sci. Catal., 130, 1799-1804 (2000).
178