Innovative Protection Study for the North West Area …apic/uploads/Forum/P7.pdf · Innovative...
30
Innovative Protection Study for the North West Area Co-ordination APIC Presentation Gary Webster & Daniel Wong – Nov 6th, 2013
Transcript of Innovative Protection Study for the North West Area …apic/uploads/Forum/P7.pdf · Innovative...
Innovative Protection Study for the North West Area Co-ordination APIC Presentation
Gary Webster & Daniel Wong – Nov 6th, 2013
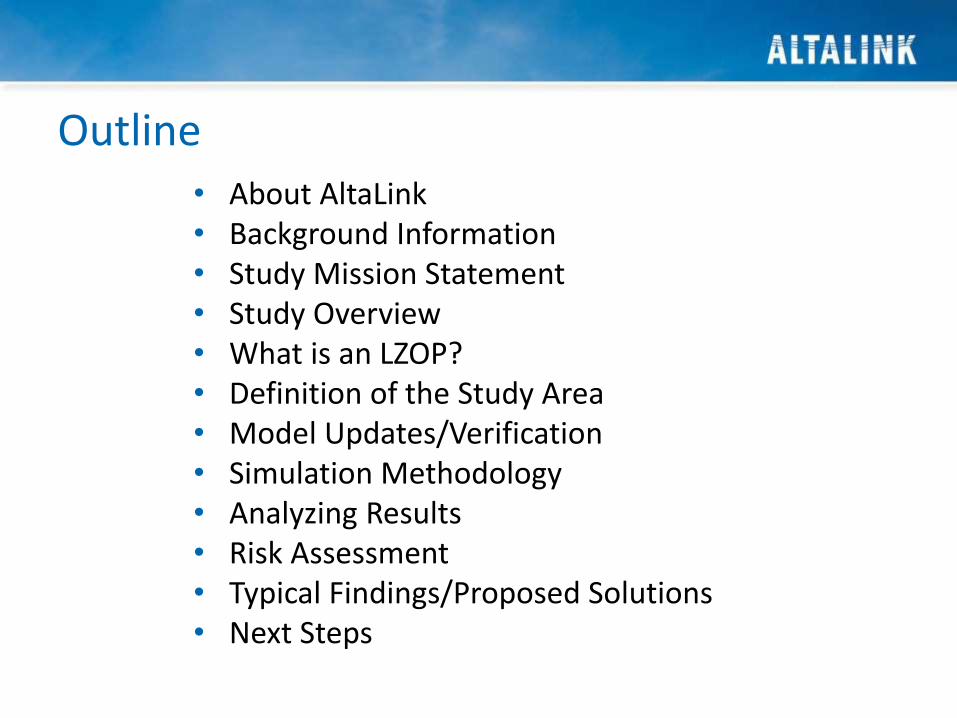
Outline • About AltaLink • Background Information • Study Mission Statement • Study Overview • What is an LZOP? • Definition of the Study Area • Model Updates/Verification • Simulation Methodology • Analyzing Results • Risk Assessment • Typical Findings/Proposed Solutions • Next Steps
About AltaLink
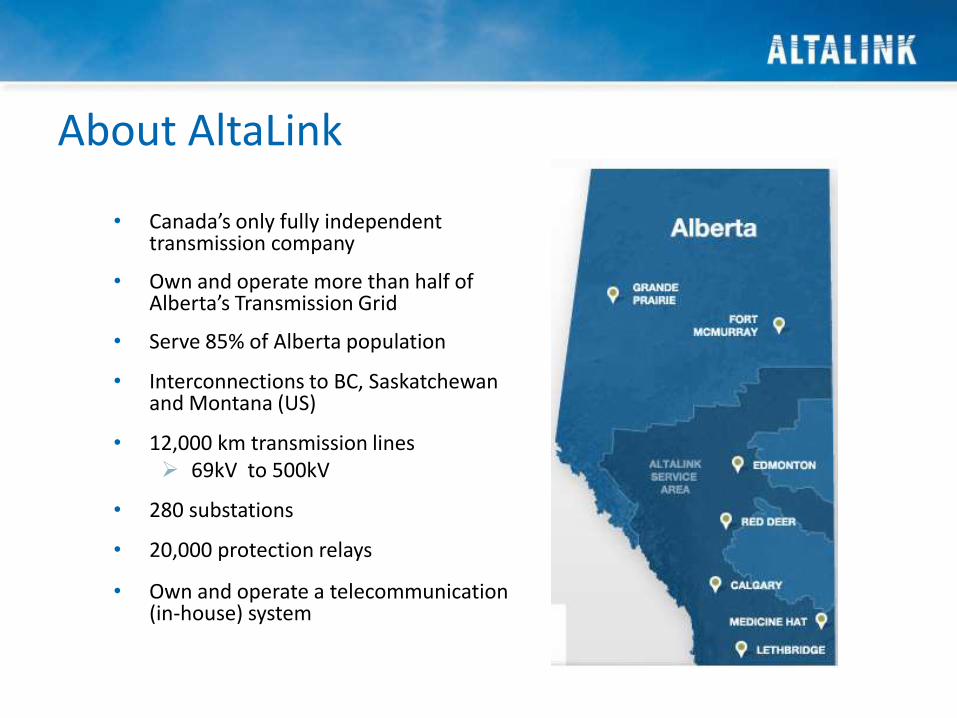
• Canada’s only fully independent transmission company
• Own and operate more than half of Alberta’s Transmission Grid
• Serve 85% of Alberta population
• Interconnections to BC, Saskatchewan and Montana (US)
• 12,000 km transmission lines 69kV to 500kV
• 280 substations
• 20,000 protection relays
• Own and operate a telecommunication (in-house) system
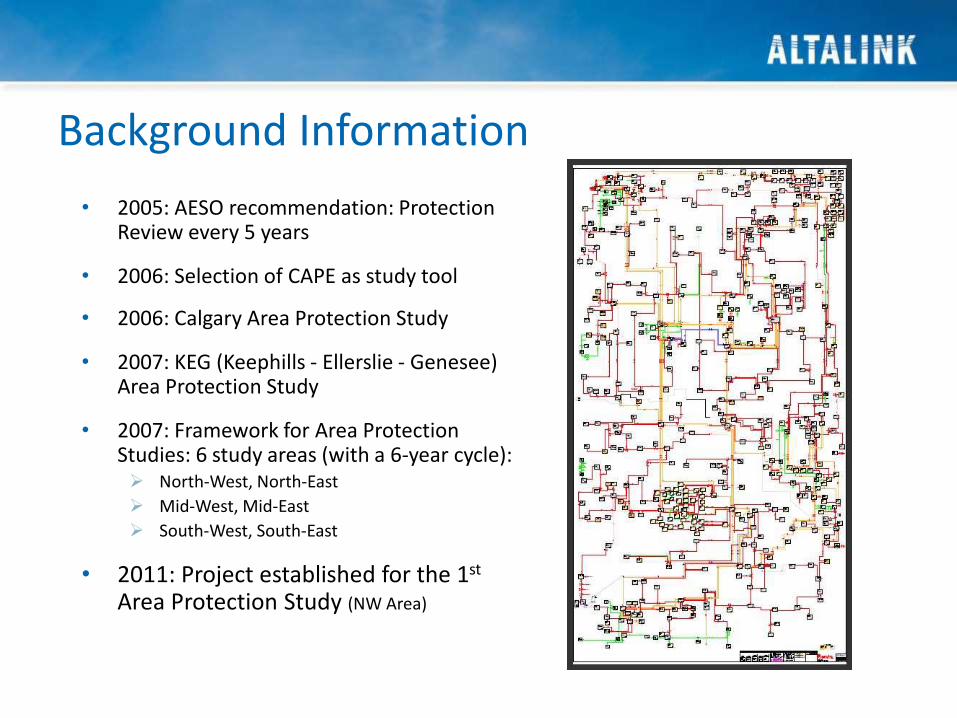
Background Information • 2005: AESO recommendation: Protection
Review every 5 years
• 2006: Selection of CAPE as study tool
• 2006: Calgary Area Protection Study
• 2007: KEG (Keephills - Ellerslie - Genesee) Area Protection Study
• 2007: Framework for Area Protection Studies: 6 study areas (with a 6-year cycle): North-West, North-East
Mid-West, Mid-East
South-West, South-East
• 2011: Project established for the 1st Area Protection Study (NW Area)

Study Mission Statement
The main goal of this area protection coordination review was to proactively determine which areas of the protection system currently have coordination deficiencies and to help assess the amount of risk associated with each deficiency. The results of the study will then be used to prioritize the work that is required to rectify the deficiencies so that these protection systems can be optimized, thus improving the reliability of the electrical transmission system.
Study Overview • Defined the study area
• Updated/verified the network model and protection model for the study area and froze the model
• Used CAPE System Simulator to run stepped event analysis for multiple automated fault simulations on every network component/LZOP (i.e.. line, transformer, etc.) in the study area
• Summarized output reports from automated simulations
• Performed risk assessment and assigned priorities

What is an LZOP? • Term from CAPE - Local Zone of Protection
• A set of equipment that will be isolated by the tripping of breakers if a fault is detected on any of the equipment within the set
• CAPE uses LZOPs to define the equipment that the protection relay is expected to protect, and the breakers that are opened when a given protection relay trips
• A miscoordination occurs when a protection trips that does not include the faulted equipment within its LZOP
LZOP Examples
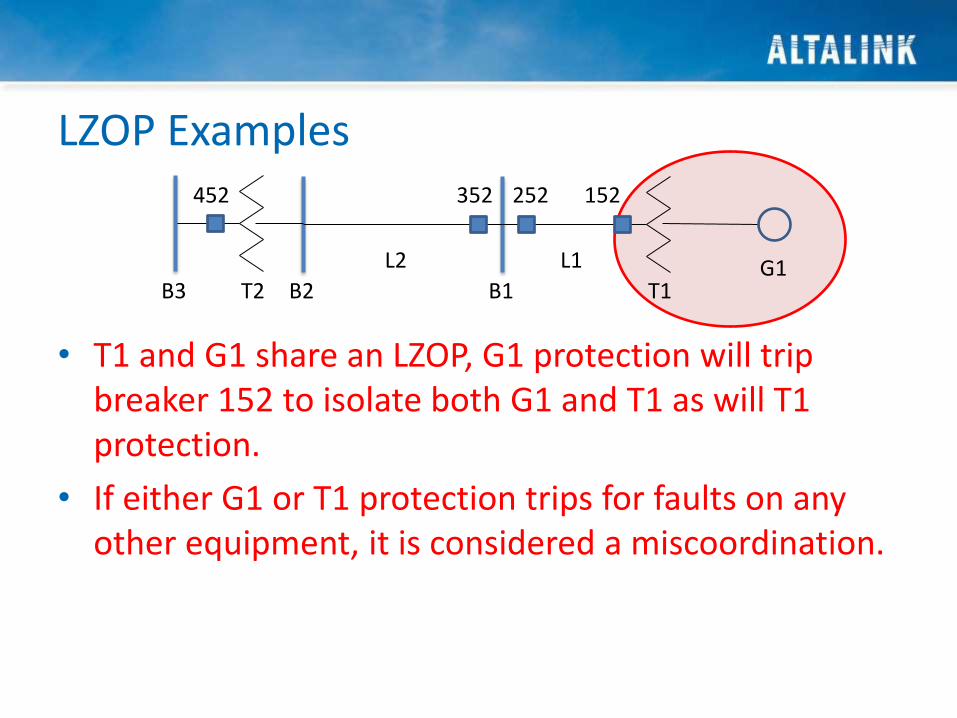
• T1 and G1 share an LZOP, G1 protection will trip breaker 152 to isolate both G1 and T1 as will T1 protection.
• If either G1 or T1 protection trips for faults on any other equipment, it is considered a miscoordination.
T1 G1 L1
B1
L2
B2 T2 B3
152 252 352 452
LZOP Examples
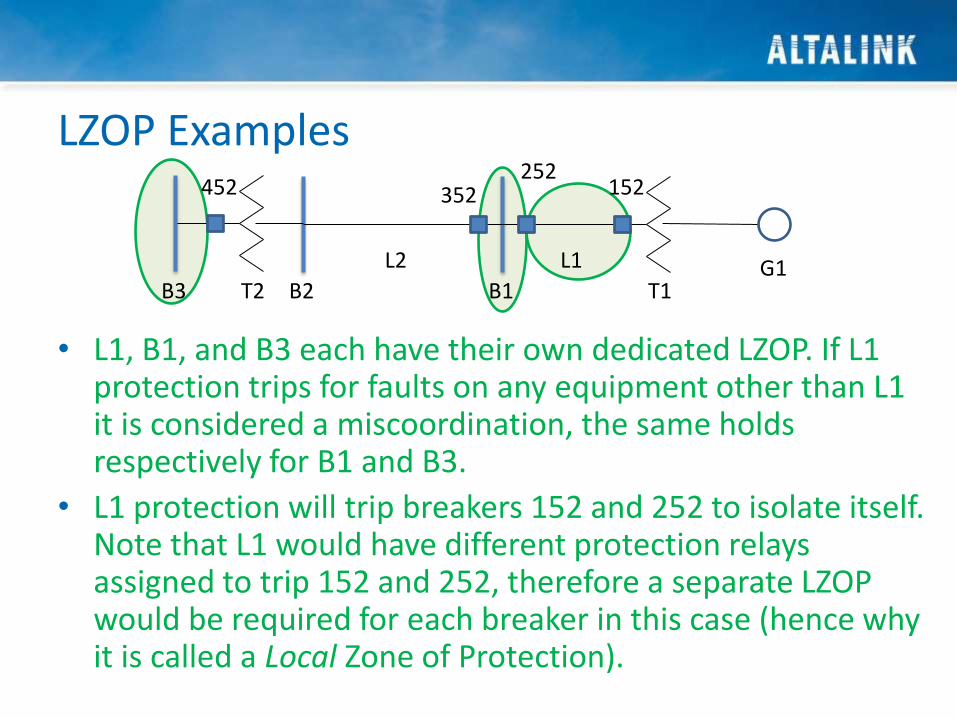
• L1, B1, and B3 each have their own dedicated LZOP. If L1 protection trips for faults on any equipment other than L1 it is considered a miscoordination, the same holds respectively for B1 and B3.
• L1 protection will trip breakers 152 and 252 to isolate itself. Note that L1 would have different protection relays assigned to trip 152 and 252, therefore a separate LZOP would be required for each breaker in this case (hence why it is called a Local Zone of Protection).
T1 G1 L1
B1
L2
B2 T2 B3
152 252
352 452
LZOP Examples
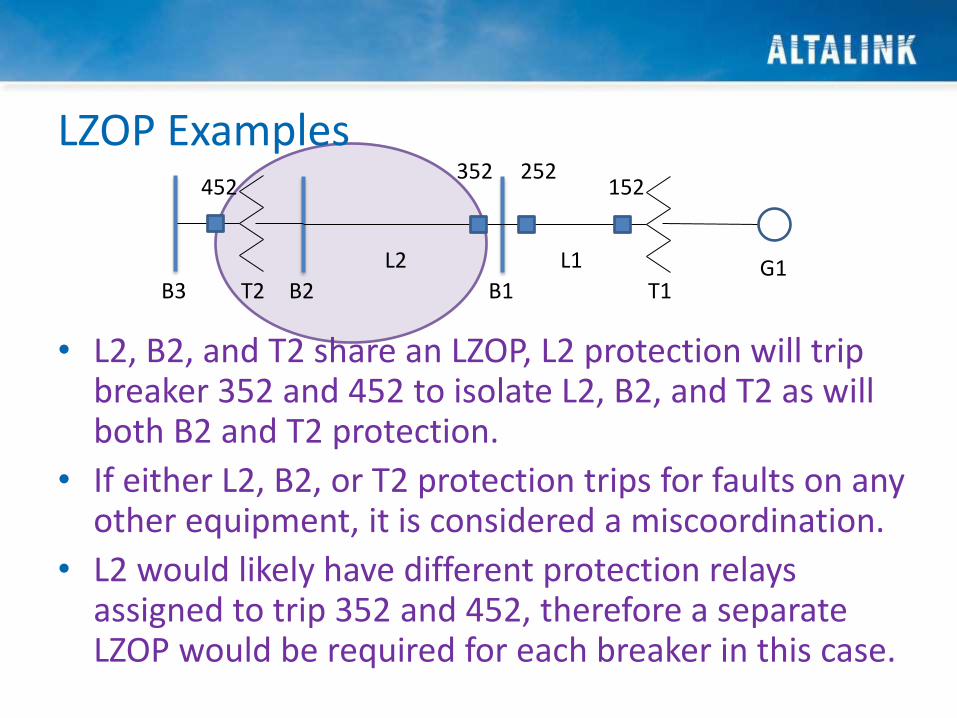
• L2, B2, and T2 share an LZOP, L2 protection will trip breaker 352 and 452 to isolate L2, B2, and T2 as will both B2 and T2 protection.
• If either L2, B2, or T2 protection trips for faults on any other equipment, it is considered a miscoordination.
• L2 would likely have different protection relays assigned to trip 352 and 452, therefore a separate LZOP would be required for each breaker in this case.
T1 G1 L1
B1
L2
B2 T2 B3
152 252 352
452
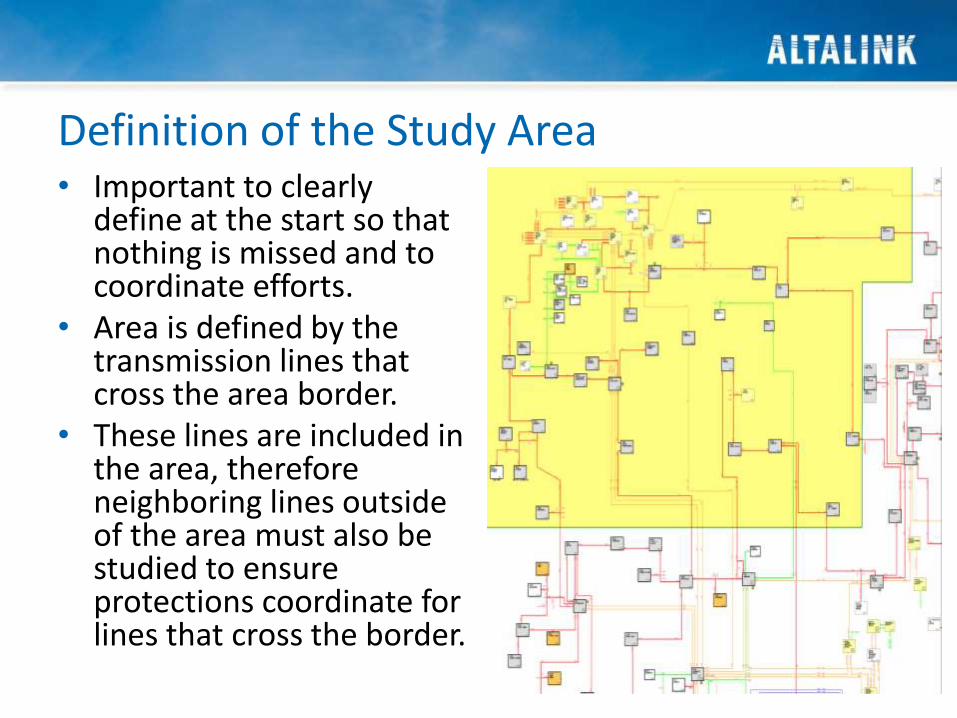
Definition of the Study Area • Important to clearly
define at the start so that nothing is missed and to coordinate efforts.
• Area is defined by the transmission lines that cross the area border.
• These lines are included in the area, therefore neighboring lines outside of the area must also be studied to ensure protections coordinate for lines that cross the border.
Model Updates/Verification • All AltaLink owned network and protection data within the
study area was updated/verified based on internal records. • Interconnected utility/customer network and protection data
was updated/verified based on whatever data that could be obtained from the owners, and the AESO PSSE planning model.
• Can be challenging getting this information from the owners, particularly from smaller IPPs. Often takes months, often incomplete. AESO planning model can be challenging to use as well since it has potential future projects included.
• Network parameters were updated or verified for all equipment within an interconnected utility’s service territory that carried or provided more than 1% of the total bus fault current for faults at the closest interconnected AltaLink owned buses in the study area.
Model Updates/Verification • Protection data for interconnected utilities were updated
or verified for protection that is within shared LZOPs or within the interconnected utility’s LZOPs that neighbor AltaLink’s or shared LZOPs in the study area.
• Some interconnected utility/customer data could not be obtained, these were noted and excluded from the study.
• After all of the study area had been updated/verified, the model was frozen based on the normal system configuration at that time. A few exceptions were made for projects that were expected to be energized shortly after, these exceptions were specifically noted.

Simulation Methodology • All faults were simulated using subtransient generator impedances and a flat
pre-fault voltage of 1.05 p.u. • Mutual coupling, transformer exciting current, fixed transformer taps, and
line charging were included • All generators and capacitor banks were considered to be in service except
those that were taken out of service for N-1 contingency simulations • CAPE System Simulator performs a stepped event analysis, which means that
the fastest protection element to trip for a fault is determined, and then that breaker is opened and the fault is recalculated based on the new network configuration. The process continues this way until the fault is isolated.
• A generic breaker operate time of 3 cycles was used for 240kV and above breakers, and 5 cycles for all breakers below 240kV.
• Teleprotection delays were not considered in the simulations and are considered to be factored into part of the required CTI of 17 cycles.
• Relay models in CAPE are based on actual algorithms used in the relays.

Simulation Methodology • Simulation depth of 1, meaning that coordination is only checked
between the protection for LZOPs of the faulted element and the immediately adjacent LZOPs.
• Transformer and bus ties are skipped over when considering simulation depth, i.e.. for a 138kV line fault where there is a 240kV/138kV transformer at one of the faulted line terminals, coordination will be checked between the faulted 138kV line protection and the 240kV/138kV transformer protection as well as all other 240kV line protections for lines that terminate at the transformer’s 240kV bus.
• A mutual coupling depth of 1 was also used, meaning that coordination is checked between the protection for LZOPs of the faulted line and lines that share mutual coupling with the faulted line.
• CTI of 17 cycles must be met
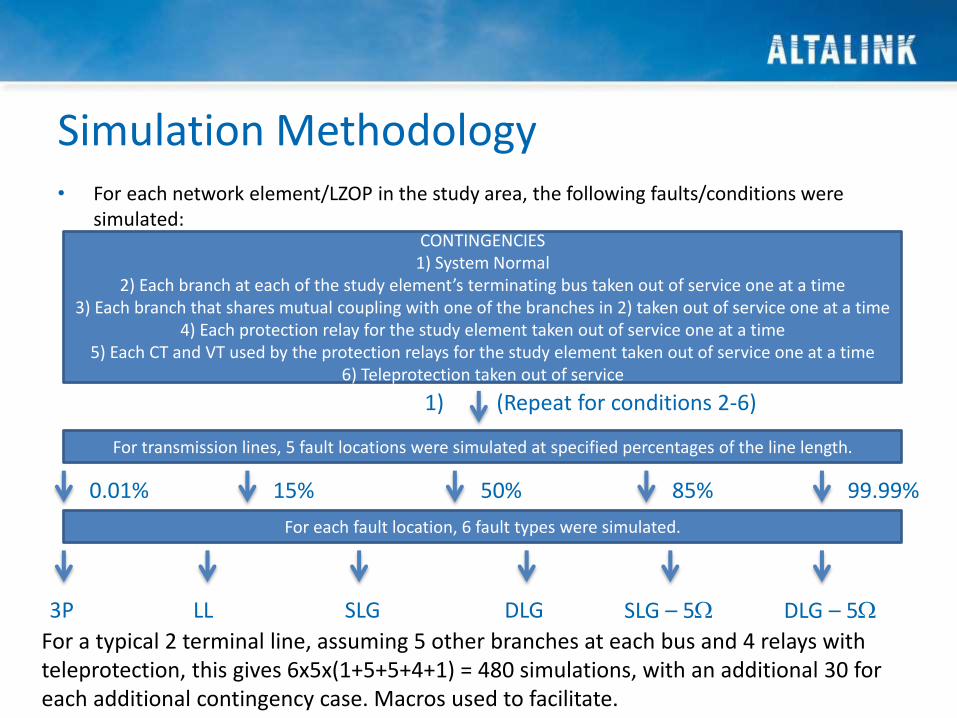
Simulation Methodology • For each network element/LZOP in the study area, the following faults/conditions were
simulated:
CONTINGENCIES 1) System Normal
2) Each branch at each of the study element’s terminating bus taken out of service one at a time 3) Each branch that shares mutual coupling with one of the branches in 2) taken out of service one at a time
4) Each protection relay for the study element taken out of service one at a time 5) Each CT and VT used by the protection relays for the study element taken out of service one at a time
6) Teleprotection taken out of service
(Repeat for conditions 2-6)
For transmission lines, 5 fault locations were simulated at specified percentages of the line length.
1)
0.01% 15% 50% 85% 99.99%
For each fault location, 6 fault types were simulated.
SLG 3P LL DLG SLG – 5W DLG – 5W
For a typical 2 terminal line, assuming 5 other branches at each bus and 4 relays with teleprotection, this gives 6x5x(1+5+5+4+1) = 480 simulations, with an additional 30 for each additional contingency case. Macros used to facilitate.
Analyzing Results • Tens of thousands simulations were run for the area – a lot of data to
sort through. • Some simulations could have multiple coordination problems
reported, problems were recorded based on the relay that misoperated for each LZOP group.
• The fault conditions that resulted in the misoperation were summarized, similar events were grouped based on the ones that gave the worst coordination performance (i.e.. if you fix the worst case then all of the other ones will also be fixed). System normal conditions were still reported separately from worst case contingency conditions as system normal have much higher probability of occurring.
• For line faults, additional simulations were manually carried out to determine the extent of the problem (i.e.. what portion of line?)
• Potential solutions were proposed for each coordination problem

Risk Assessment • Coordination problems are ranked based on risk score R = P*C
(probability times consequence) • Probability determined based on outages statistics from TOSS • For miscoordinations during line faults, the length of the
portion of line that is exposed to the miscoordination for each fault type is determined from simulation
• TOSS statistics give line outages/100km-year for each fault type on each line
• This is used to determine the probability that a fault would occur on a portion of the line that would result in a miscoordination.
• Stats from breakers and transformers are used for P of a substation fault
Risk Assessment • Probability also gives a predicted mean time between failures
which is used to determine how quickly the issue needs to be dealt with
• Consequence determined based on the RCM system • Rating of 1 to 6 for BES impact depending on what portion of
the system is interrupted • Rating of 1 to 5 for customer impact depending on how much
load is interrupted • Safety and environment get ratings of 0 for most
miscoordinations as there is not really any additional impact to either; however, if there is a failure of protection to detect a fault, these ratings are assigned based on the RCM system
• Problems were further grouped based on those that had the same proposed solution and given a total risk score
Typical Findings/Proposed Solutions
• Overcurrent vs. Distance Protection Coordination
• Fault at Tapped Substation Trips Line Protection
• Distance Protection Is Set to Cover Extremely Long Tap and Over Reaches Remote Protection
• New Substation Cut Into Existing Line
• Z1 Overreach for Resistive Line to Line to Ground Faults
• Failure to Clear Fault

Overcurrent vs. Distance Protection Coordination • B2 L1 protection uses overcurrent protection only
for ground faults • B3 L2 protection uses distance protection for
ground faults • Ground fault levels in the area have decreased due
to decommissioning of local generation • Overcurrent protection is very sensitive to changes
in fault levels, while distance protection is not • Decreased sensitivity of B2 L1 protection results in it
taking longer to trip than back-up B3 L2 protection • Coordination study recommended to determine if
sensitivity of B2 L1 protection can be increased, otherwise upgrading B2 L1 protection to also use ground distance protection is recommended
B3
B2
L2
B1
L1
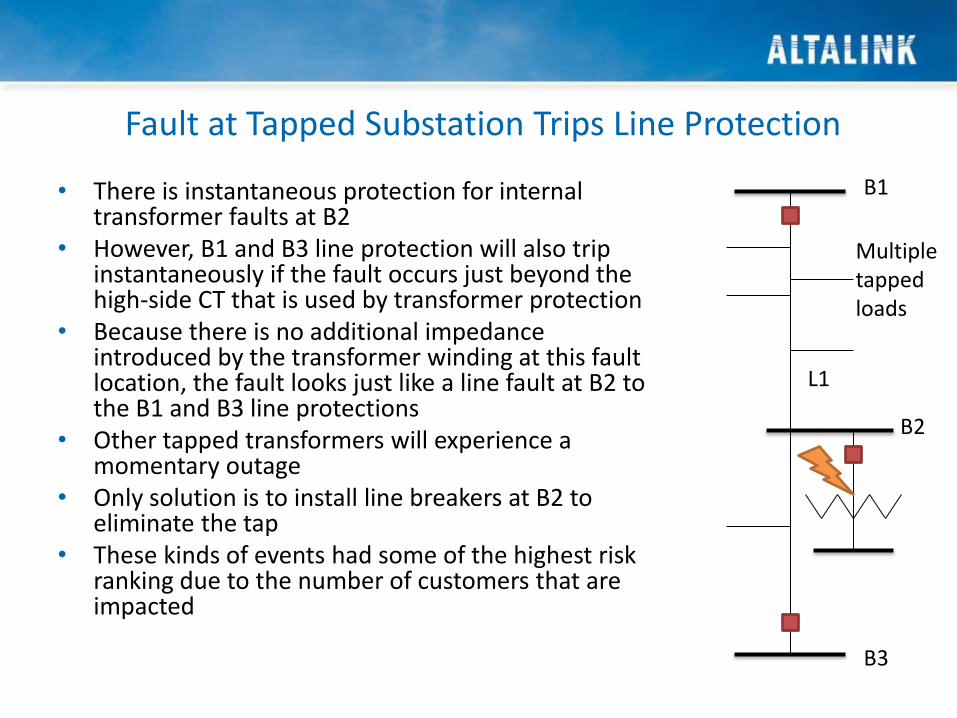
Fault at Tapped Substation Trips Line Protection
• There is instantaneous protection for internal transformer faults at B2
• However, B1 and B3 line protection will also trip instantaneously if the fault occurs just beyond the high-side CT that is used by transformer protection
• Because there is no additional impedance introduced by the transformer winding at this fault location, the fault looks just like a line fault at B2 to the B1 and B3 line protections
• Other tapped transformers will experience a momentary outage
• Only solution is to install line breakers at B2 to eliminate the tap
• These kinds of events had some of the highest risk ranking due to the number of customers that are impacted
B1
B3
L1
Multiple tapped loads
B2

Distance Protection Is Set to Cover Extremely Long Tap and Over Reaches Remote Protection
• B6 L2 zone 1 will not detect balanced faults beyond 85% of the line length from B6 (6 km)
• B1 L1 zone 2 will detect balanced faults right up to B7
• B1 L1 zone 2 likely cannot be pulled back due to very long 3 terminal line (B1-B2= 112 km vs. B1 – B7 = 103 km)
• L1 protection uses a permissive scheme, so recommendation is a study to determine if B1 L1 zone 2 time delay can be increased, otherwise system changes are probably required
B7
B6
B1
L2
B4
L1 B3
B2
To B5
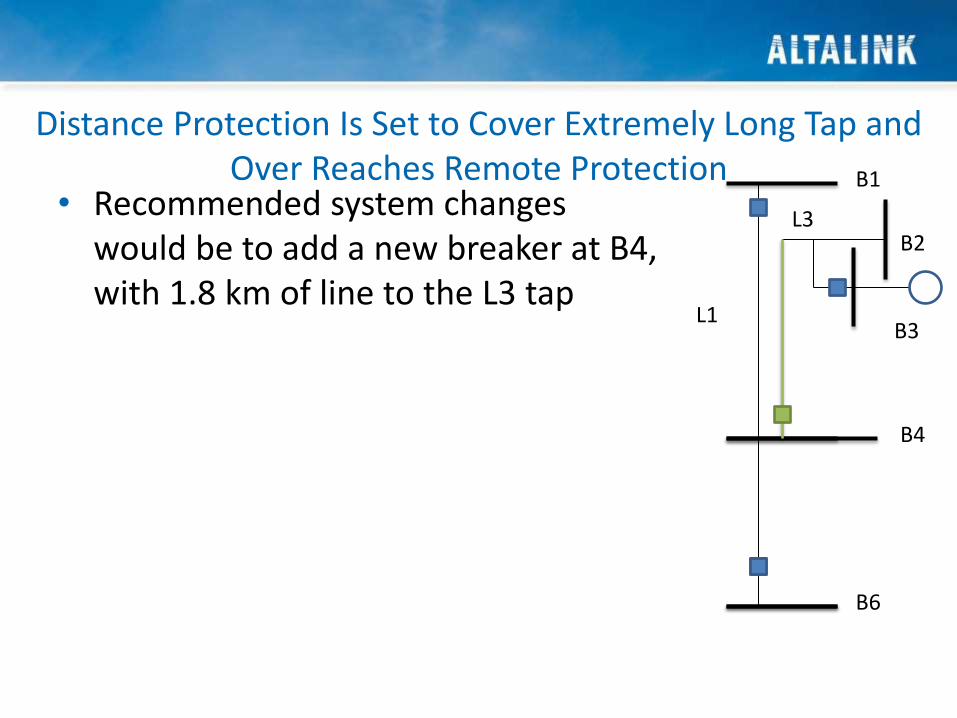
Distance Protection Is Set to Cover Extremely Long Tap and Over Reaches Remote Protection
• Recommended system changes would be to add a new breaker at B4, with 1.8 km of line to the L3 tap
B1
L1 B3
B2 L3
B6
B4

New Substation Cut Into Existing Line • B4 L3 zone 2 reach is set to
ZL3 + 0.5*Z(L1+L2)
• Line breakers were added at B2 but B4 L3 zone 2 reach was not adjusted
• B4 L3 will trip in zone 2 along with B3 L2 for all faults on L2 beyond 84% of the line length from B3, resulting in an outage to B3
• Distance settings review of B4 L3 protection recommended
B4
B3
B2
L3
L2
B1
L1
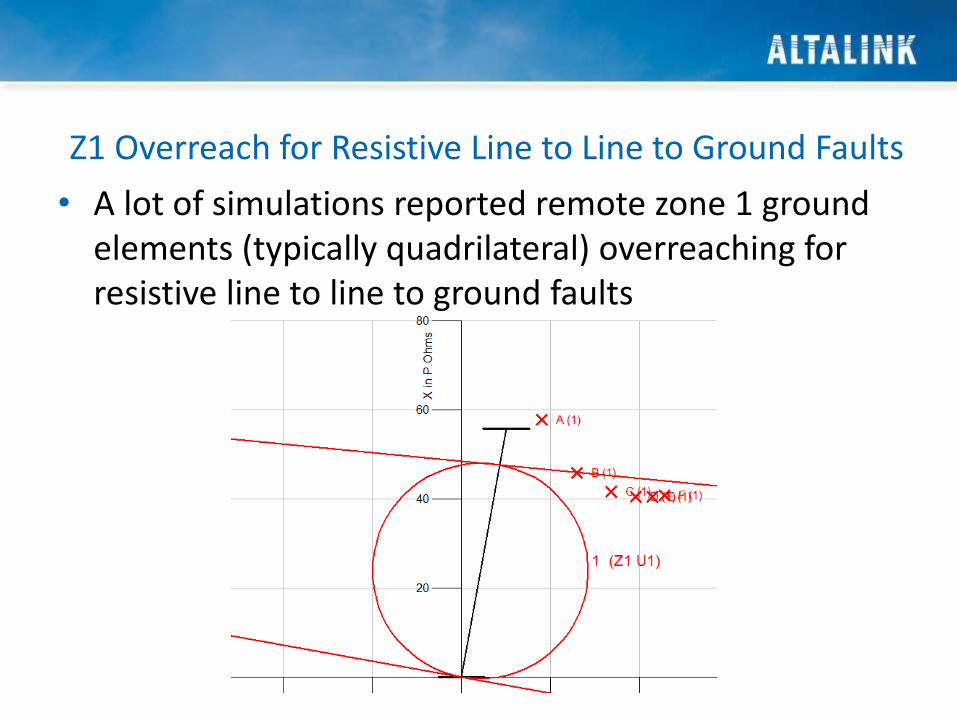
Z1 Overreach for Resistive Line to Line to Ground Faults
• A lot of simulations reported remote zone 1 ground elements (typically quadrilateral) overreaching for resistive line to line to ground faults

Z1 Overreach for Resistive Line to Line to Ground Faults
• Although this fault type is unusual, this was reported to be such a widespread issue that it is probably worth further investigation.
• First step would be confirmation of CAPE results by testing. Inject phasors from short circuit simulation into actual relay and measure the response.
• Discuss results with Electrocon/relay manufacturers.
Failure to Clear Fault
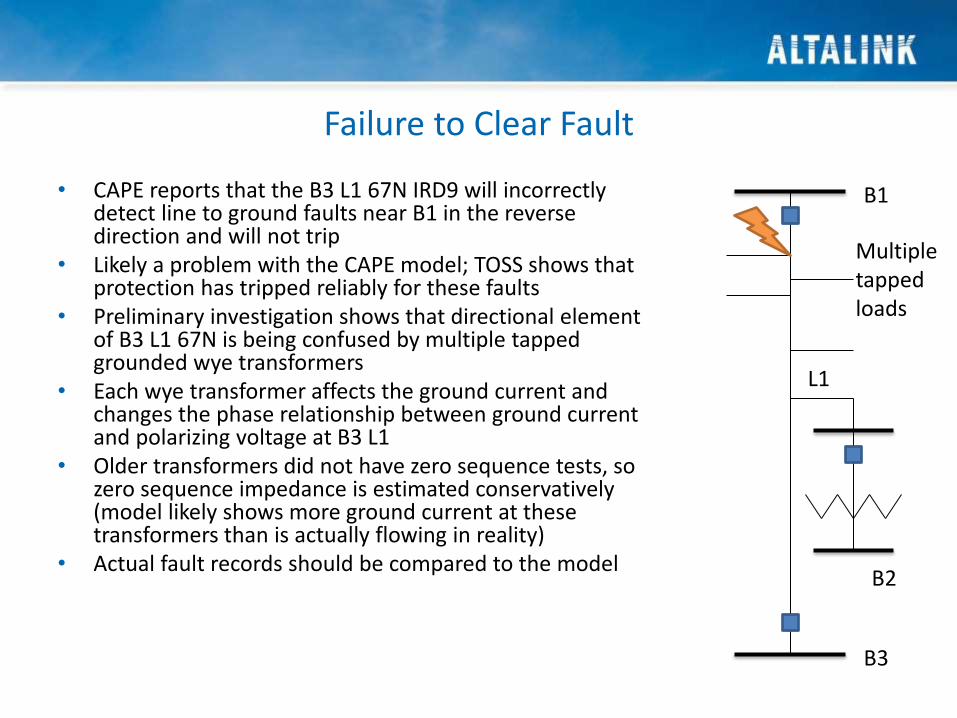
• CAPE reports that the B3 L1 67N IRD9 will incorrectly detect line to ground faults near B1 in the reverse direction and will not trip
• Likely a problem with the CAPE model; TOSS shows that protection has tripped reliably for these faults
• Preliminary investigation shows that directional element of B3 L1 67N is being confused by multiple tapped grounded wye transformers
• Each wye transformer affects the ground current and changes the phase relationship between ground current and polarizing voltage at B3 L1
• Older transformers did not have zero sequence tests, so zero sequence impedance is estimated conservatively (model likely shows more ground current at these transformers than is actually flowing in reality)
• Actual fault records should be compared to the model
B3
B1
L1
Multiple tapped loads
B2
Next Steps
1) Review priorities from risk assessment and ensure that the risk assessment framework makes sense.
2) Work with MAPS and Operational Engineering to incorporate this work into the 2014 SOW plans for any issues that are deemed urgent enough.
3) Work with Lifecycle to build business cases for next GTA for the rest of the work.
4) Complete the rest of the system 5) Improve macros and data consolidation techniques – more
automation 6) Incorporate other elements into the study (i.e.. breaker fail,
sensitivity study, etc.)
Thank You!