
INITIAL BUDGETS AND PERFORMANCE PLANS 2011/12 PCT BOARD 13 TH APRIL 2011 Jonathan Wise, Director of...
84
INITIAL BUDGETS AND PERFORMANCE PLANS 2011/12 PCT BOARD 13 TH APRIL 2011 Jonathan Wise, Director of Finance & Performance
-
Upload
alban-payne -
Category
Documents
-
view
213 -
download
0
Transcript of INITIAL BUDGETS AND PERFORMANCE PLANS 2011/12 PCT BOARD 13 TH APRIL 2011 Jonathan Wise, Director of...

INITIAL BUDGETS AND PERFORMANCE PLANS 2011/12
PCT BOARD 13TH APRIL 2011
Jonathan Wise,
Director of Finance & Performance
2
ContentsIntroduction/Context
– NHS Brent journey– 11/12 planning process
Part 1 - 2011/12 Budgets/Finance Plan (Slides 6 - 53):– Medium Term Financial Strategy– Key Financial Assumptions– Budget Setting Process– Budget summary– Main Budget Changes
• Acute• Non-acute• Primary Care • CSP Investments• Running Costs• Estates
– QIPP Summary and Plan– Budget sign-off and in-year management– Risks and Contingency– Planning for 2012/13 onwards
Part 2 – 2011/12 Performance Plans (Slides 54 - 67) :– Overview – health context– Performance Targets– 11/12 plans
Part 3 – GP Delegation (Slides 68 - 84)
3
National and NW London context
National context •The national Operating Framework for 2011/12 was published in Dec 2010 and sets out the national framework for maintaining and improving quality and outcomes, together with the finance and business rules.
• “The most significant challenge we face in 2011/12 is to maintain a grip on current performance and QIPP delivery, whilst simultaneously preparing and beginning to put in place the future system” (Sir David Nicholson, December 2010)
NW London context
• In December 2010, NW London finalised its four year Strategic Commissioning and QIPP (Quality, Innovation, Productivity and Prevention) Plan to 2014/15, including
– Case for change– Use of benchmarking and case studies to set priorities– Development of models of care aligned to the settings in which they could be
delivered– Review of the impact of the proposals on provider clinical and financial viability– Development of high level implementation plans
• NW London issued its specific Commissioning Intentions for 2011/12 in January 2011

4
Brent context
WCC Assessment
• Strategy – Amber (Green for PCT strategy plan)
• Finance - Green
• Board – Green
GP Commissioning
• GPCE established. Clinical Directors funded as per agreed Business Case
• Pathfinder application approved
Performance
•Some significant improvements in 10/11
• However Brent remains poor on a number of key areas
Health Outcomes
•Brent is ranked 11th in London for male all age all cause mortality rates and 12th for female.
•CVD mortality rates place Brent 18th and cancer mortality rates ranked 14th.

5
11/12 Planning Process
CSPJan 10
10/11 Operating
PlanApr 10
Workshop Reviews with GP commissioners
Jul - Oct 10
Joint development of
11/12 QIPPNov - Mar 11
Budget setting process
Nov– Mar 11
Contract negotiationsNov - Mar 11

6
Part 1 – 2011/12 BUDGETS/ FINANCE PLANS
7
National context
• Spending review settlement in October 2010 covering 11/12 – 14/15 – overall NHS spending to increase by 0.4% in real terms over the course of the Spending Review period
• Allocations to PCTs for 11/12 (not beyond) confirmed in December 2010• Key points:
– Average increase in 11/12 allocations to PCTs = 3%• Brent = 2.6%
– Of this, element is to be transferred to local authorities to support social care via a section 256 agreement
• Net growth after this = Brent 2% (minimum level)– 2% of all PCTs resources will be held by SHAs, with PCTs being required to
submit business cases to access the funding that demonstrate the non-recurrent nature of the proposed expenditure
– PCT debt that has arisen pre 11/12 to be repaid by 2013/14– Any debts/overspends in 11/12-12/13 become the responsibility of GP consortia– Revised weighted capitation formula published – now shows Brent 15% over
target
8
NW London context
• Cluster (NW London) financial strategy agreed by Cluster Board 9 March 2011
• 4% QIPP (excluding running costs) target at sub-Cluster level
• Financial support provided/received in 09/10 to be repaid in 2011/12 – 2012/13 (£5.3m owed by NHS Harrow to NHS Brent)
• 2011/12 NW London Challenged Trust Board contributions/utilisation:– Brent contribution – 1% (provided in 10/11) plus £2.8m in 11/12– Harrow utilisation - £20m support
• Use of 2% non-recurrent resource– Harrow £5.3m assumed in initial plan– Balance to be agreed by NHS London /Sector in-year
• Contribution from PCTs to London fund to support GP Pathfinder– £3.2m contribution from Brent and Harrow– £2 per head to be returned (est. £700k Brent, £450k Harrow)
9
Medium Term Financial Strategy
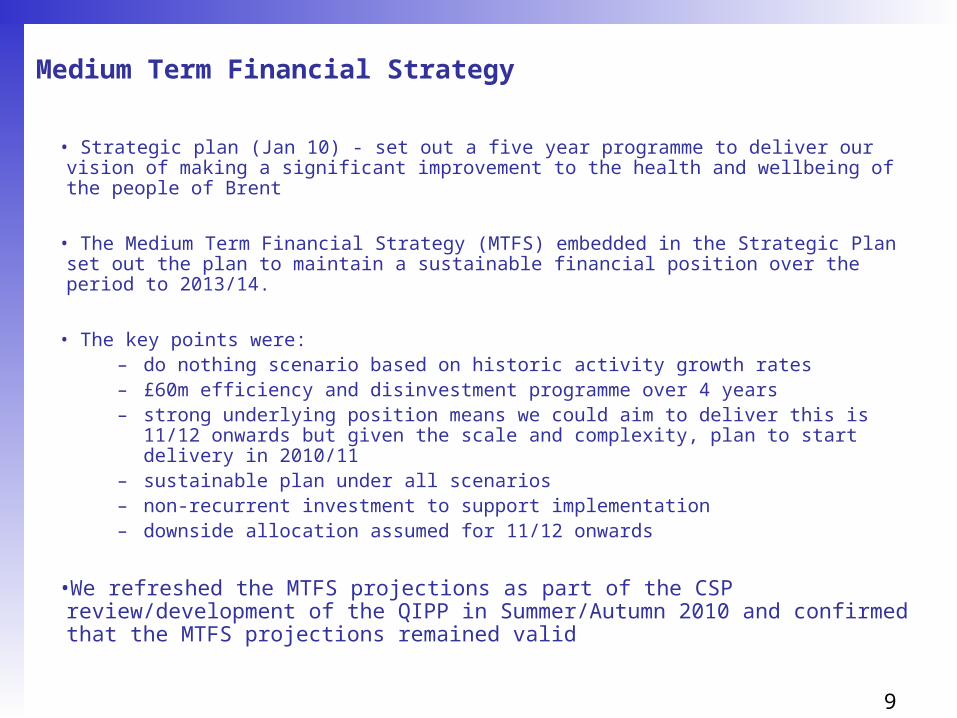
• Strategic plan (Jan 10) - set out a five year programme to deliver our vision of making a significant improvement to the health and wellbeing of the people of Brent
• The Medium Term Financial Strategy (MTFS) embedded in the Strategic Plan set out the plan to maintain a sustainable financial position over the period to 2013/14.
• The key points were:– do nothing scenario based on historic activity growth rates– £60m efficiency and disinvestment programme over 4 years– strong underlying position means we could aim to deliver this is 11/12 onwards
but given the scale and complexity, plan to start delivery in 2010/11– sustainable plan under all scenarios – non-recurrent investment to support implementation– downside allocation assumed for 11/12 onwards
•We refreshed the MTFS projections as part of the CSP review/development of the QIPP in Summer/Autumn 2010 and confirmed that the MTFS projections remained valid
10
Key Financial Assumptions 2011/12
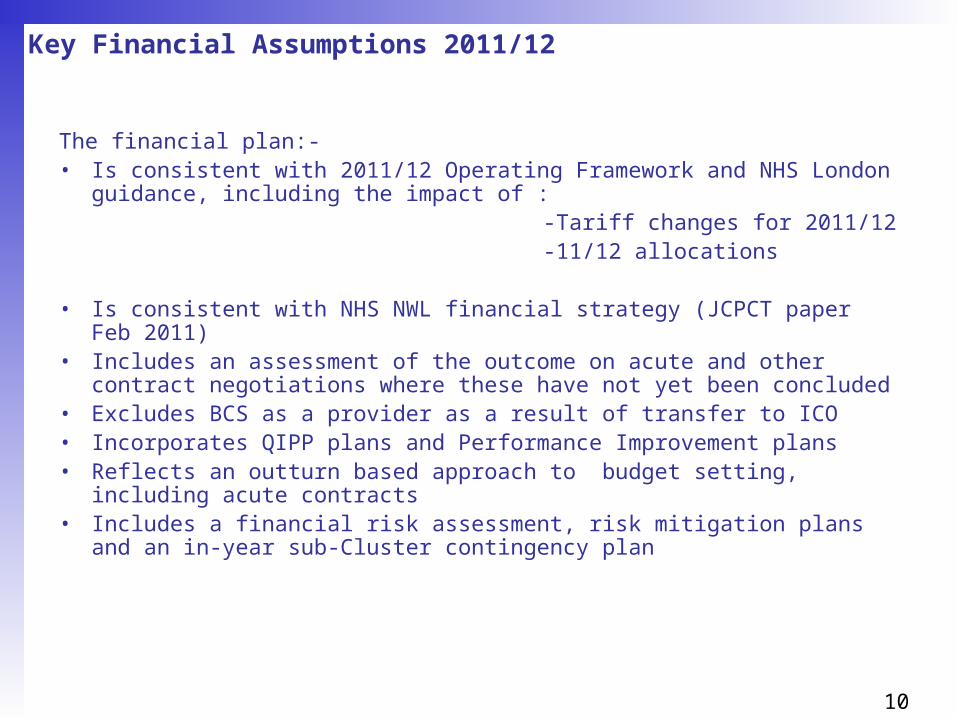
The financial plan:-• Is consistent with 2011/12 Operating Framework and NHS London
guidance, including the impact of : -Tariff changes for 2011/12 -11/12 allocations
• Is consistent with NHS NWL financial strategy (JCPCT paper Feb 2011)• Includes an assessment of the outcome on acute and other contract
negotiations where these have not yet been concluded• Excludes BCS as a provider as a result of transfer to ICO• Incorporates QIPP plans and Performance Improvement plans• Reflects an outturn based approach to budget setting, including acute
contracts• Includes a financial risk assessment, risk mitigation plans and an in-year
sub-Cluster contingency plan

11
2011/12 Budgets Budget Setting Process
•The budget setting process has been conducted in accordance with good practice criteria (generated from a combination of Audit Commission recommendations and local additions):-
–There has been an agreed budget preparation approach and timetable–The impact of prior year over/underspendings has been reflected in 2011/12 budgets
–Operational and financial responsibilities are aligned–Budgets are linked to workforce and activity plans–Budgets are reconciled to the PCT’s cash plan for 2011/12–Budgets are based on realistic assumptions for inflation and other cost pressures
–Budgets include the full year effect of 2010/11 changes –Savings plans have been risk assessed –Investment plans will be subject to Business Case approval as appropriate–Budgets will be appropriately profiled across the financial year–Budgets will be supported by a rigorous sign-off and in-year management regime

12
2011/12 Budgets Overview
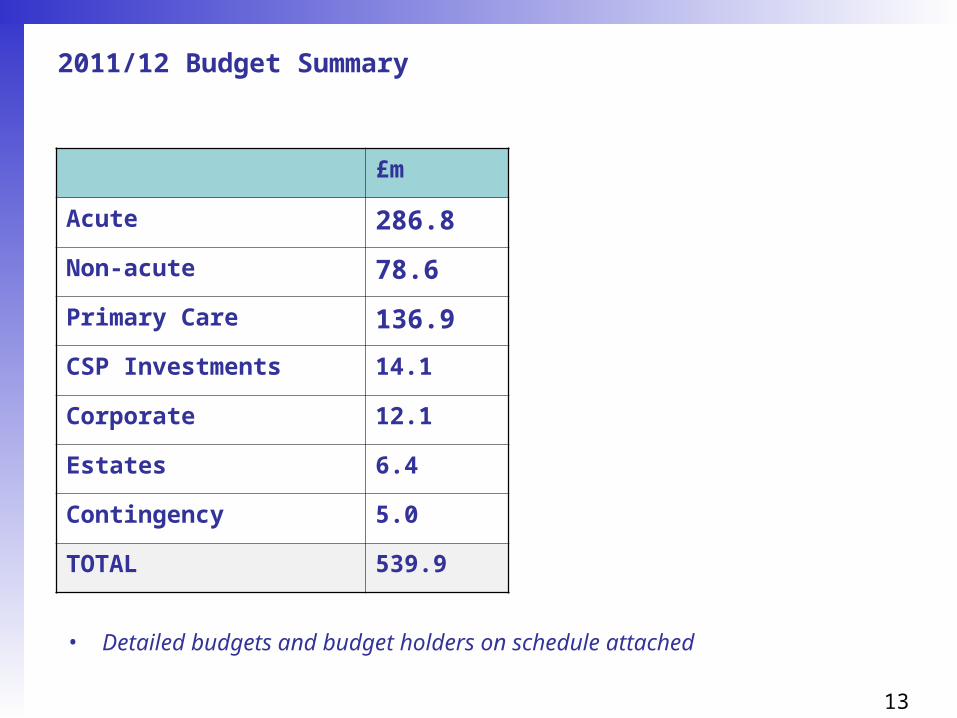
• Initial budgets totalling £539.9m are summarised in the next slide
• 2011/12 forecast allocation is £551.0m resulting in planned surplus of £11.1m (2%).
13
2011/12 Budget Summary
£m
Acute 286.8
Non-acute 78.6
Primary Care 136.9
CSP Investments 14.1
Corporate 12.1
Estates 6.4
Contingency 5.0
TOTAL 539.9
• Detailed budgets and budget holders on schedule attached

14
Main Budget Changes – Acute Contracts (1)
• Baseline based on 2010/11 outturn adjusted for:
– % population growth
– Tariff changes – see slide 15
– Demand Management (Urgent Care Centre, STARRs, End of Life, Case Management) – see slide 16
– Sector Commissioning Intentions – see slide 17
– CQUIN continues at 1.5% – see slide 20
– Out of Sector contracts not finalised (risk assessment included in budget together with in-year risks)

15
Main Budget Changes – Acute Contracts (2)Tariff changes 11/12 – national
• Standard national contracts for acute and mental health now incorporating PCT provider arm services
• Bespoke contract for the care homes sector now available
• National tariff reduction of 1.5% (2.5% inflation less 4% efficiency)
• Emergency readmissions within 30 days of discharge following an elective admission not to be charged. All other readmissions within 30 days subject to locally agreed thresholds
• Some expansion in scope of tariff for 11/12, including changes to specialised services top ups and HRG4 for A&E
• Marginal rate for emergency admissions above baseline maintained
• CQUIN to remain at 1.5% (also extended to care homes)

16
Main Budget Changes – Acute Contracts (3)Demand Management
• Total = £6.4m

17
Main Budget Changes – Acute Contracts (4)Sector Commissioning Intentions
• Planned Procedures with a Threshold (PPwT)– In 2010/11 there has been a process to implement systems to better manage
requests for and the contracting of PPwTs. Following work by the NW London Clinical Reference Group an extended list has been determined for inclusion in 2011/12 contracts.
– The relevant HRGs have been removed from Trust baselines in their entirety. Unless one of the listed procedures has been explicitly approved using the specified process of approval it will not be funded.
• Outpatient ratios – Outpatient first to follow up ratios have been revised and applied consistently to
providers from April 1st 2011 to achieve progressive improvement by all providers
• Day Case/Outpatient ratios – In addition to monitoring day case rates, the Sector is extending this to include
procedures undertaken in outpatients leading to achievement of Best Practice ratios for the proportion of procedures carried out in an outpatient setting as opposed to a day case. This recognises that some procedures do need to be undertaken as a day case and incentivises the provision of care in less acute clinical settings where clinically appropriate.

18
Main Budget Changes – Acute Contracts (5)Sector Commissioning Intentions
• Emergency readmissions– The national guidance on this is clear and is spelt out in a letter from David Flory
of the 18th February 2011 “there is no discretion about the use to which the savings from not paying for some emergency readmission, accruing within PCTs, should be put. SHAs will be asked to monitor the progress of PCTs in identifying and using this money to develop services to support patients in the 30 day period following discharge. This responsibility will pass, along with the funding, to the acute sector from 1 April 2012…”
– Given the need to develop new services to tackle 30 day admissions and the time this will take a phased approach to this issue in NWL has been taken. The precise phasing is subject to agreement but the key impact is the overall in year potential loss of income to acute Trusts. In NWL this is set at 25% of the calculated readmissions value.
– Funds will only be paid to Trusts on the basis that both commissioners and Trusts are developing joint plans to create new services aimed at improving services to support patients in the 30 day period post discharge. In the first quarter 100% of one quarter of the total annual calculated figure will be paid to Trusts subject to agreement by 1st July of the joint plan. Over the full year it is expected that Trusts will receive 75% of the annual calculated funding with 25% invested in out of hospital services. These percentages may be varied in year subject to both parties agreement but have been used in setting contract for 2011/12
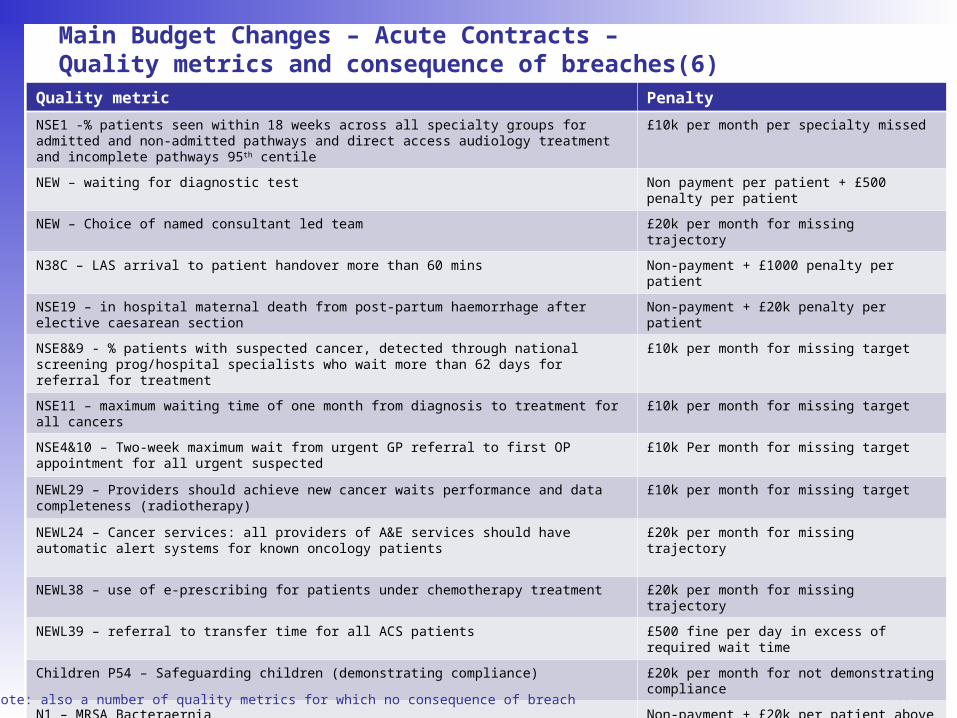
• Quality metrics and consequence of breaches– within NWL the quality metrics included in acute contracts have been reviewed and financial consequences of breached of some metrics established. See next slide
19
Main Budget Changes – Acute Contracts – Quality metrics and consequence of breaches(6)
Quality metric Penalty
NSE1 -% patients seen within 18 weeks across all specialty groups for admitted and non-admitted pathways and direct access audiology treatment and incomplete pathways 95th centile
£10k per month per specialty missed
NEW – waiting for diagnostic test Non payment per patient + £500 penalty per patient
NEW – Choice of named consultant led team £20k per month for missing trajectory
N38C – LAS arrival to patient handover more than 60 mins Non-payment + £1000 penalty per patient
NSE19 – in hospital maternal death from post-partum haemorrhage after elective caesarean section Non-payment + £20k penalty per patient
NSE8&9 - % patients with suspected cancer, detected through national screening prog/hospital specialists who wait more than 62 days for referral for treatment
£10k per month for missing target
NSE11 – maximum waiting time of one month from diagnosis to treatment for all cancers £10k per month for missing target
NSE4&10 – Two-week maximum wait from urgent GP referral to first OP appointment for all urgent suspected
£10k Per month for missing target
NEWL29 – Providers should achieve new cancer waits performance and data completeness (radiotherapy)
£10k per month for missing target
NEWL24 – Cancer services: all providers of A&E services should have automatic alert systems for known oncology patients
£20k per month for missing trajectory
NEWL38 – use of e-prescribing for patients under chemotherapy treatment £20k per month for missing trajectory
NEWL39 – referral to transfer time for all ACS patients £500 fine per day in excess of required wait time
Children P54 – Safeguarding children (demonstrating compliance) £20k per month for not demonstrating compliance
N1 – MRSA Bacteraernia Non-payment + £20k per patient above target
NEVER EVENTS Non-payment + £20k penalty per patient
P52 – Medicines Management – proportion of low cost prescribing for: Statins and ACE inhibitors £20k per month for missing trajectory
NEW – no mixed sex accommodation £500 penalty per patient
•Note: also a number of quality metrics for which no consequence of breach

20
CQUIN – ACUTE CONTRACTS 11/12
• CQUIN payments have been divided into two areas:– National incentive schemes – Regional /Local incentive schemes
• National incentive scheme– These remain unchanged from 2010/11 and are:– VTE risk assessment on admission to hospital – Composite indicator on responsiveness to personal needs
• London/Local incentive scheme for NWLH– Falls: the total number of falls within NWLHT will be reduced by 25% and the number of
those falls resulting in harm to the patient will be reduced by 50% – End of Life Care: the care of end of life patients referred to the specialist palliative care
team will be improved through the local implementation of the Department of Health End Of Life Care Strategy’s quality standards. A locally developed and agreed improvement trajectory will be established.
– COPD Discharge Care Bundle (chronic obstructive pulmonary disease) 75% of patients who are admitted with an acute exacerbation of their COPD will be discharged with a completed discharge care bundle in the required format
– Patients seen by a consultant within 12 hours of admission: 75% of patients admitted in an emergency, ether via A&E or directly from the community will be assessed by a consultant within 12 hours.
21
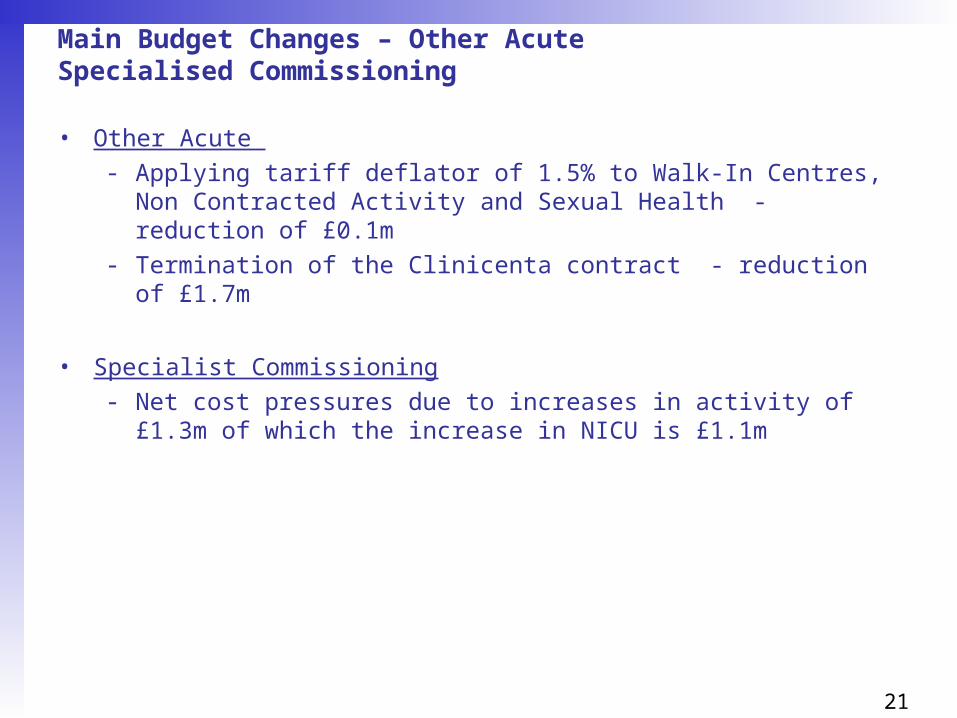
Main Budget Changes – Other Acute Specialised Commissioning
• Other Acute
- Applying tariff deflator of 1.5% to Walk-In Centres, Non Contracted Activity and Sexual Health - reduction of £0.1m
- Termination of the Clinicenta contract - reduction of £1.7m
• Specialist Commissioning
- Net cost pressures due to increases in activity of £1.3m of which the increase in NICU is £1.1m
22
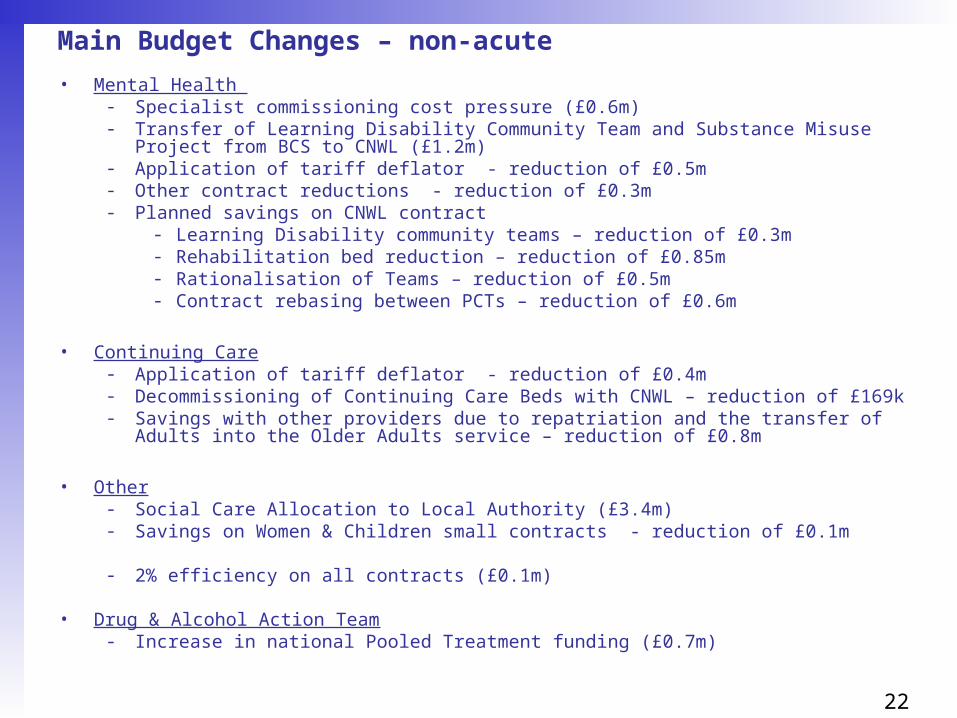
Main Budget Changes – non-acute
• Mental Health - Specialist commissioning cost pressure (£0.6m)- Transfer of Learning Disability Community Team and Substance Misuse Project from BCS to
CNWL (£1.2m)- Application of tariff deflator - reduction of £0.5m- Other contract reductions - reduction of £0.3m- Planned savings on CNWL contract
- Learning Disability community teams – reduction of £0.3m- Rehabilitation bed reduction – reduction of £0.85m- Rationalisation of Teams – reduction of £0.5m- Contract rebasing between PCTs – reduction of £0.6m
• Continuing Care- Application of tariff deflator - reduction of £0.4m- Decommissioning of Continuing Care Beds with CNWL – reduction of £169k- Savings with other providers due to repatriation and the transfer of Adults into the Older
Adults service – reduction of £0.8m
• Other- Social Care Allocation to Local Authority (£3.4m)- Savings on Women & Children small contracts - reduction of £0.1m
- 2% efficiency on all contracts (£0.1m)
• Drug & Alcohol Action Team- Increase in national Pooled Treatment funding (£0.7m)

23
CQUIN - CNWL
Regional: 40% allocation of CQUIN payment
Indicator Description Weighting – 0.6% overall
1a-d To improve physical health and medicines reconciliation for patients with mental health problems
15%
2a-d Understanding and improving patient reported measures of care 15%
3a Promoting recovery based care 10%
Local: 60% allocation of CQUIN payment
Indicator Description Weighting – 0.9% overall
4a-c Increasing the routine use of outcome metrics (HoNOS) at key points in care pathways to include CAMHS patients
20%
5a-b Improve the response for individuals in crisis 20%
6 Locally reported Patient Experience / CQC Survey 20%

24
Main Budget Changes – Primary care
• Medical budget has an uplift of 0.5% (£0.22m)
• Pharmacy contract budget remains the same as 2010/11 with 2% uplift to Pharmacy Global Sum element only (£0.1m)
• Prescribing uplift 5% (£1.9m)• QIPP Savings
– Prescribing (£0.9m)– GMS (£0.8m)
25
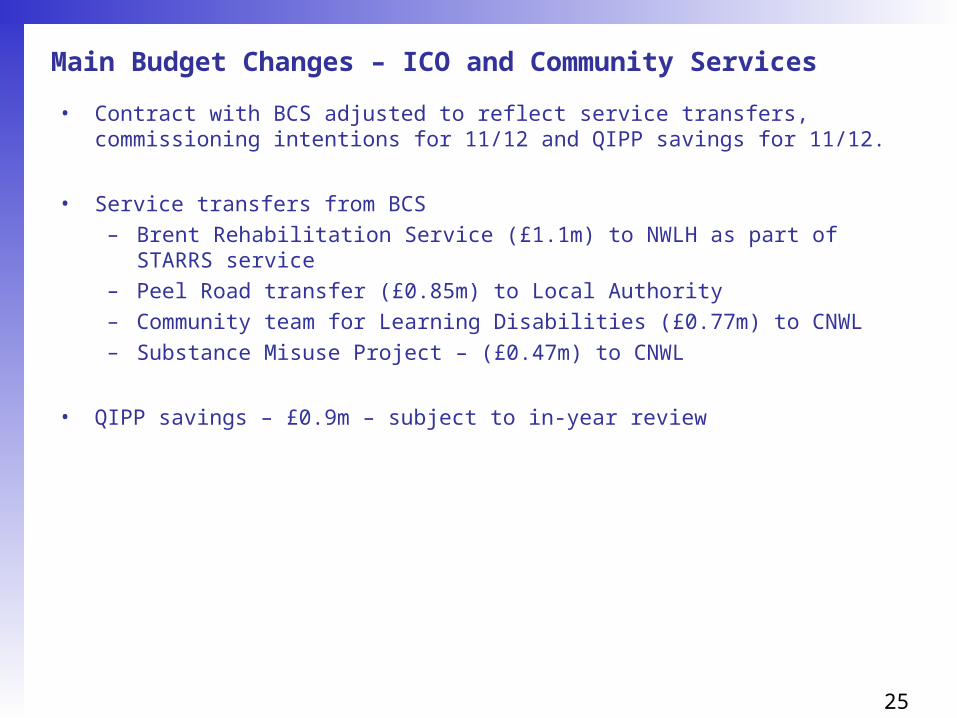
Main Budget Changes – ICO and Community Services
• Contract with BCS adjusted to reflect service transfers, commissioning intentions for 11/12 and QIPP savings for 11/12.
• Service transfers from BCS– Brent Rehabilitation Service (£1.1m) to NWLH as part of STARRS service– Peel Road transfer (£0.85m) to Local Authority– Community team for Learning Disabilities (£0.77m) to CNWL– Substance Misuse Project – (£0.47m) to CNWL
• QIPP savings – £0.9m – subject to in-year review

26
CQUIN – BCS (ICO)
• To follow

27
Main Budget Changes – CSP Investments
Status RecurrentNon-
Recurrent £'000 £'000
Smoking Cessation Agreed 10/11 1,001 Health Checks Subject to BC 520 Immunisation Agreed 10/11 242 Breastfeeding Agreed 10/11 124 STARRS Agreed 10/11 4,031 Case Management Subject to BC 259 Chlamydia Agreed 10/11 477 End of Life Care Subject to BC 254 UCC at CMH Agreed 10/11 1,714Performance investment Subject to BC 1,000increase in performance fund from £2.28 to £3.00 Agreed 10/11 250Kilburn MSK extension for 6 months Subject to BC 150Re-provision for additional QIPP Subject to BC 300cost of staff working notice during April - June Agreed 10/11 175Balance of in-year investments Subject to BC 3,620Total 8,622 5,495

28
Main Budget Changes – Corporate/Running costs (1)
• National Operating Framework 2011/12– Running cost = any cost incurred that is not a direct payment for the provision of
healthcare or healthcare related services– By 2014/15 the overall running costs of the new NHS structure, compared to the
running costs of the current NHS structure, will decrease by one third– Expectation that GP Consortia will spend between £25 - £35 per head on
running costs by 2014/15
• Brent and Harrow staffing structures designed to fit within above indicative envelope – approximately £30/head
• In budgeting for 11/12, assumed split of costs for corporate functions calculated at 62% (Brent) and 38% (Harrow)
• Figures (see next slide) exclude additional non-recurrent support from Sector for QIPP delivery

29
Main Budget Changes – Corporate/Running costs (2)wte Total Split Harrow Brent Director
Chief Executive, Chair & Non-Exec 14.00 1,727,967 Prorata 62/38 656,627 1,071,340 MEChief Executive Office 12.39 503,296 Prorata 62/38 191,252 312,044 MEStrategy and QIPP 2.00 158,037 Prorata 62/38 60,054 97,983 TSFinance & Information 22.50 1,611,776 Prorata 62/38 612,475 999,301 JWICT 11.00 1,081,951 Prorata 62/38 411,141 670,810 MEBrent Borough Directorate 18.00 1,226,324 - 1,226,324 JOHarrow Borough Directorate 9.00 706,751 706,751 - TSContracting Team - Non Acute Contracts 4.00 246,796 Prorata 62/38 93,782 153,014 JOPrescribing Team 12.20 786,150 Prorata 62/38 298,737 487,413 TS/JOContinuing Healthcare 18.00 1,019,545 Prorata 62/38 387,427 632,118 TSFHS 37.50 1,628,272 Prorata 62/38 618,744 1,009,529 MEPublic Health - Brent 31.70 1,987,392 1,987,392 SBPublic Health - Harrow 19.00 1,216,404 1,216,404 AH
Financial Services Non-pay 0 728,064 Prorata 62/38 315,727 412,337 JW
Clinical Commissioning - Brent 651,240 651,240 JOClinical commissioning - Harrow 155,184 155,184 TS
Recharge - Sector 0 2,711,000 Prorata 62/38 1,030,180 1,680,820 MERecharge - London wide 0 1,128,000 Prorata 62/38 434,000 694,000 ME
Total Corporate Budget 211.29 19,274,149 7,188,487 12,085,663
Estates 1,140,000 Prorata 62/38 433,200 706,800
LessFHS (37.50) (1,628,272) Prorata 62/38 (618,744) (1,009,529)Public Health - Brent (31.70) (1,987,392) (1,987,392)Public Health - Harrow (19.00) (1,216,404) (1,216,404)Recharge - Sector (679,000) Prorata 62/38 (258,020) (420,980)
Total Running Cost 123.09 14,903,081 5,528,519 9,374,562
Weighted population (2010/11 HCHS) 505,227 194,780 39% 310,447 61%
£per Weighted population (2010/11 HCHS) 29.50 28.38 30.20
Weighted population (11/12) 486,038 200,605 41% 285,433 59%
£per weighted population(11/12) 30.66 27.56 32.84
Notes:
- The higher £ per weighted population for Brent is partly as a result of the investment in clinical commissioning
- The cost/weighted population is within the £25 -£35 advised as the target for GP consortia.

30
Main Budget Changes – Corporate/Running costs (3)
Corporate costs savings
BRENT HARROW
London inc CSL Sector PCT Total London inc CSL Sector PCT Total£000's £000's £000's £000's £000's £000's £000's £000's
10/11 1,053 1,197 13,556 15,806 706 761 7,631 9,098 Change (359) 483 (3,846) (3,722) (272) 269 (1,907) (1,910) 11/12 694 1,680 9,710 12,084 434 1,030 5,724 7,188 % change (34%) 40% (28%) (24%) (39%) 35% (25%) (21%)
Running costs savings (excludes primary care, FHS and public health, includes estates)
BRENT HARROW
London inc CSL Sector PCT Total London inc CSL Sector PCT Total£000's £000's £000's £000's £000's £000's £000's £000's
10/11 1,053 1,197 11,293 13,543 706 761 6,299 7,766 Change (359) 62 (3,872) (4,169) (272) 11 (1,977) (2,238) 11/12 694 1,259 7,421 9,374 434 772 4,322 5,528 % change (34%) 5% (34%) (31%) (39%) 1% (31%) (29%)
31
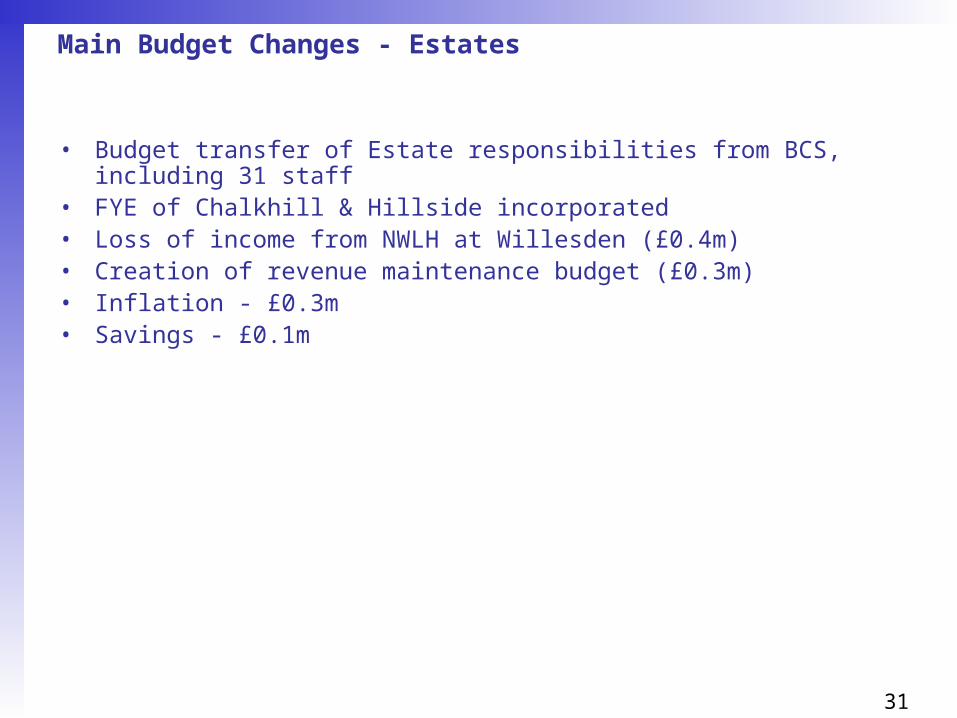
Main Budget Changes - Estates
• Budget transfer of Estate responsibilities from BCS, including 31 staff• FYE of Chalkhill & Hillside incorporated• Loss of income from NWLH at Willesden (£0.4m)• Creation of revenue maintenance budget (£0.3m)• Inflation - £0.3m• Savings - £0.1m

32
QIPP summary
• Detailed QIPP plans set out on next slides • QIPP plan prepared prior to contract finalisation and are therefore subject to initial contract
agreement and then delivery• Summary of Brent and Harrow’s position below:
Brent Harrow
£m % £m %10/11 plan 11.7 2.2 18 5.5
actual 8.3 1.5 12 3.6% delivery 71% - 67% -
11/12 plan 13.9 2.6 12 3.6
Green: 90%
> Detailed plans in place with clearly defined financial savings trajectory > Evidence of implementation or preparatory activity > Low level of risk or barriers to implementation
Amber: 60%
> Scheme defined with evidence of plans and approach to implementation > Little progress achieved or savings > Medium level of risk or barriers to implementation
Red: 30%
> Proposed scheme identified, but little or no evidence of financial target, commencement date or implementation plans
> High risk due to implementation costs or stakeholder buy in
• Note: above excludes additional in-year savings – un-quantified for Brent, £2m for Harrow
• Cluster wide risk assessment applied pre-contract finalisation. Post contract finalisation, QIPP plans have a higher risk profile

33
QIPP Plans (1)
PMORef
Project short title Project descriptionGross Savings
11/12£000s
Reprovision/ spend 11/12
£000s
Net Saving spend/(saving)
2011/12£000s
RAGEstimated delivery 2011/12
Qtr Balance 12/13
BR001 Contracting efficiencies - N2FUP Opportunity in 11/12 regarding sector N2FU ratios. (2,494) (2,494) 60% (1,496) Q1 0
BR002 Contracting efficiencies - Daycase ratio Opportunity in 11/12 regarding sector daycase ratio (555) (555) 60% (333) Q1 0
BR003 Urgent Care Centre - CMHUrgent Care Centre provided at CMH site, NHS Brent savings only.
(2,397) 1,714 (683) 90% (615) Q1 0
BR004 Urgent Care Centre - NWPUrgent Care Centre provided at NWP site, NHS Brent savings only.
(95) 65 (30) 90% (27) Q1 0
BR005 STARRs (A&E component) STARRs service providing alternative to A&E attendances (306) 0 (306) 90% (275) Q1 0
BR006 STARRs (inpatient component)STARRs service reducing unnecessary NEL admissions through providing alternatives in the community (Rapid Response, Set-up beds).
(2,698) 1,612 (1,086) 90% (977) Q1 0
BR007 Enhanced Reablement ServiceCase management of patients in the community to reduce NEL admissions.
(535) 300 (235) 90% (212) Q3 (212)
BR008 End of LifeEnd of life services provided in the community to reduce the need for hospital admission towards end of life resulting in reduced NEL admissions.
(502) 282 (220) 90% (198) Q3 (198)
BR009 Willesden beds efficienciesStaffing efficiencies associated to the step-up and step-down beds in Willesden.
(300) 0 (300) 100% (300) Q1 0
BR010 Willesden Robertson wardReduction in block payment for bed capacity that NHS Brent does not utilise.
(200) 0 (200) 100% (200) Q1 0
BR013 PPwT ImplementationEstablishing standard policy on PPwT and one IFR service across the sector, with follow through by the ACV
(1,742) 0 (1,742) 90% (1,568) Q1 0
BR014 Chlamydia screeningReduced cost of provision through effiencies from working with neighbouring PCTs.
(88) 0 (88) 30% (26) Q1 0
BR015 Termination of pregnancy servicesReduction in unwanted pregnancy through increased effective use of contraception.
(50) 0 (50) 30% (15) Q1 0
BR016 Small contracts (women & childrens) Reduction in budget. (100) 0 (100) 100% (100) Q1 0
BR017 Review Enhanced Services Efficient enhansed services. (159) 0 (159) 100% (159) Q1 0
BR018 List Validation List validation of registered GP population. (512) 0 (512) 90% (461) Q1 0
34
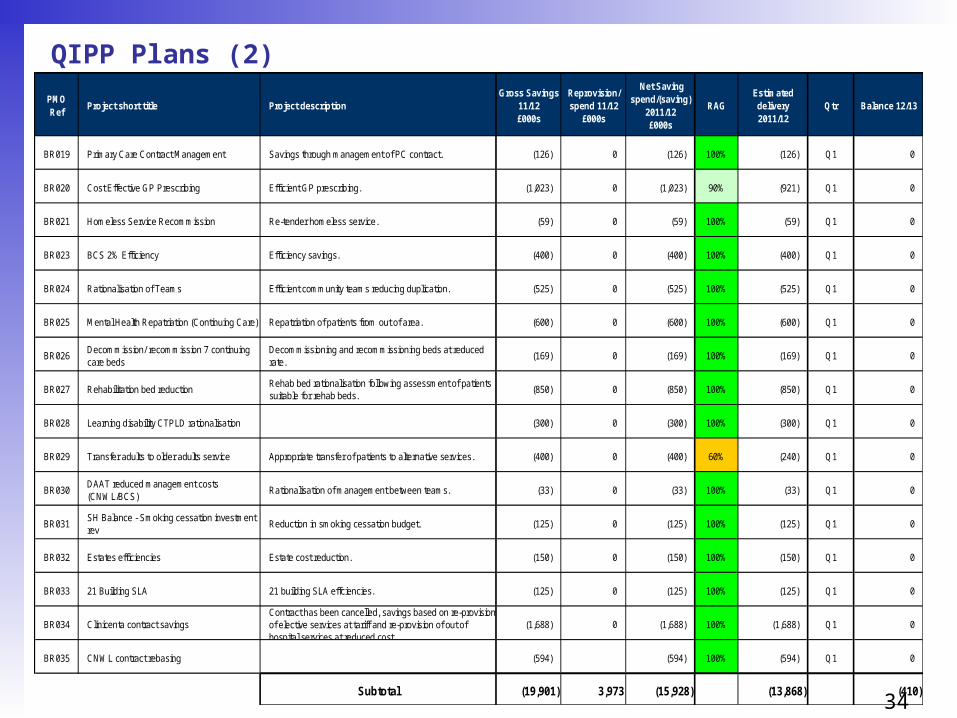
QIPP Plans (2)
PMORef
Project short title Project descriptionGross Savings
11/12£000s
Reprovision/ spend 11/12
£000s
Net Saving spend/(saving)
2011/12£000s
RAGEstimated delivery 2011/12
Qtr Balance 12/13
BR019 Primary Care Contract Management Savings through management of PC contract. (126) 0 (126) 100% (126) Q1 0
BR020 Cost Effective GP Prescribing Efficient GP prescribing. (1,023) 0 (1,023) 90% (921) Q1 0
BR021 Homeless Service Recommission Re-tender homeless service. (59) 0 (59) 100% (59) Q1 0
BR023 BCS 2% Efficiency Efficiency savings. (400) 0 (400) 100% (400) Q1 0
BR024 Rationalisation of Teams Efficient community teams reducing duplication. (525) 0 (525) 100% (525) Q1 0
BR025 Mental Health Repatriation (Continuing Care) Repatriation of patients from out of area. (600) 0 (600) 100% (600) Q1 0
BR026Decommission/ recommission 7 continuing care beds
Decommissioning and recommissioning beds at reduced rate.
(169) 0 (169) 100% (169) Q1 0
BR027 Rehabilitation bed reductionRehab bed rationalisation following assessment of patients suitable for rehab beds.
(850) 0 (850) 100% (850) Q1 0
BR028 Learning disability CTPLD rationalisation (300) 0 (300) 100% (300) Q1 0
BR029 Transfer adults to older adults service Appropriate transfer of patients to alternative services. (400) 0 (400) 60% (240) Q1 0
BR030DAAT reduced management costs (CNWL/BCS)
Rationalisation of management between teams. (33) 0 (33) 100% (33) Q1 0
BR031SH Balance - Smoking cessation investment rev
Reduction in smoking cessation budget. (125) 0 (125) 100% (125) Q1 0
BR032 Estates efficiencies Estate cost reduction. (150) 0 (150) 100% (150) Q1 0
BR033 21 Building SLA 21 building SLA effciencies. (125) 0 (125) 100% (125) Q1 0
BR034 Clinicenta contract savingsContract has been cancelled, savings based on re-provision of elective services at tariff and re-provision of out of hospital services at reduced cost.
(1,688) 0 (1,688) 100% (1,688) Q1 0
BR035 CNWL contract rebasing (594) (594) 100% (594) Q1 0
Subtotal (19,901) 3,973 (15,928) (13,868) (410)
35
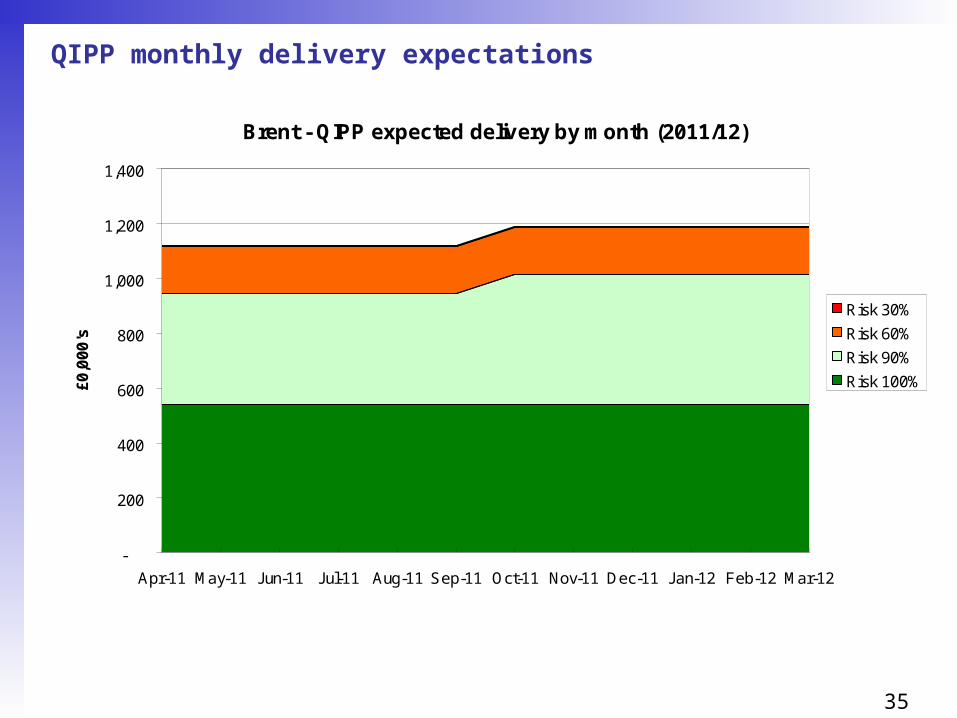
QIPP monthly delivery expectations
Brent - QIPP expected delivery by month (2011/12)
-
200
400
600
800
1,000
1,200
1,400
Apr-11 May-11 Jun-11 Jul-11 Aug-11 Sep-11 Oct-11 Nov-11 Dec-11 Jan-12 Feb-12 Mar-12
£0
,00
0's
Risk 30%
Risk 60%
Risk 90%
Risk 100%

36
QIPP Savings by category and provider
Brent PCT - Savings by QIPP (Risk assessed)
0 1,000 2,000 3,000 4,000 5,000 6,000 7,000
Other
End of Life
Primary Care Contracting
Prescribing
Urgent Care
Mental Heatlh & LD
Planned Care
Acute Community Mental health Primary Other
Provider impacts:• Acute –
£5.8m• Community –
£1.1m• Mental health –
£3.3m• Primary care –
£1.7m• Other -
£2.0m
£13.9m

37
QIPP Savings by category and risk assessment
Brent PCT - Savings by QIPP (Risk assessed)
0 1,000 2,000 3,000 4,000 5,000 6,000 7,000
Other
End of Life
Primary Care Contracting
Prescribing
Urgent Care
Mental Heatlh & LD
Planned Care
30% 60% 90% 100%
Risked:• 100%
£6.5m• 90%
£5.3m• 60%
£2.0m• 30%
£0.1m
£13.9m

38
Capital
• In 2011/12 PCT’s no longer have delegated responsibility for capital projects. All new capital projects must be approved by the SHA;
• Initial capital resource limit (CRL) of £375k has been granted for fire and health and safety works.
39
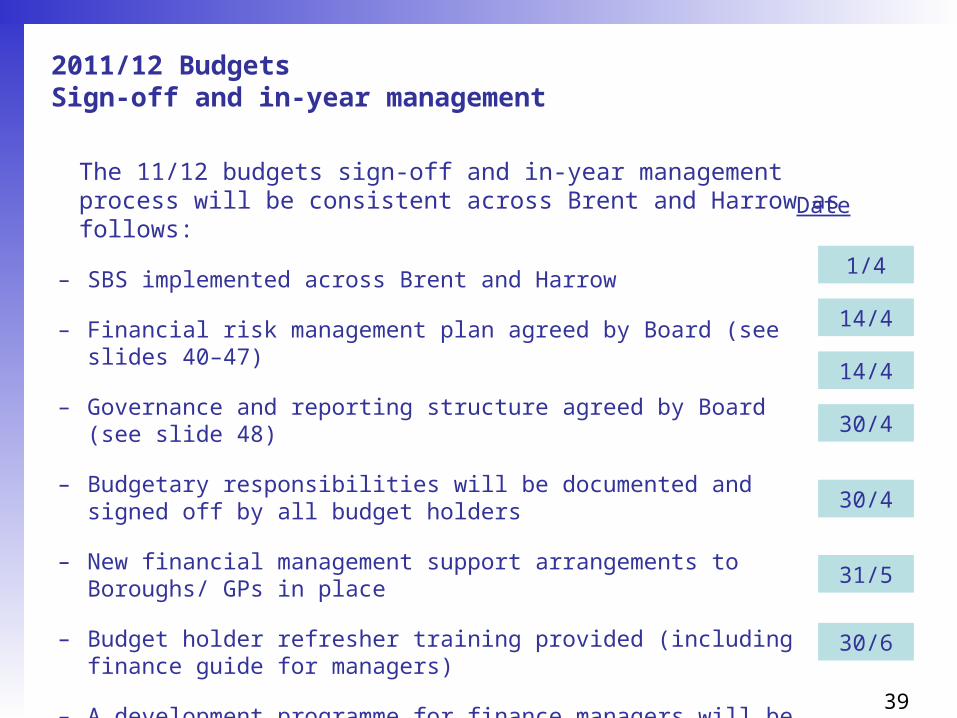
2011/12 Budgets Sign-off and in-year management
– SBS implemented across Brent and Harrow
– Financial risk management plan agreed by Board (see slides 40–47)
– Governance and reporting structure agreed by Board (see slide 48)
– Budgetary responsibilities will be documented and signed off by all budget holders
– New financial management support arrangements to Boroughs/ GPs in place
– Budget holder refresher training provided (including finance guide for managers)
– A development programme for finance managers will be in place
14/4
Date
30/6
31/5
30/4
The 11/12 budgets sign-off and in-year management process will be consistent across Brent and Harrow as follows:
1/4
14/4
30/4

40
In-year Financial Risk assessment
Risk Impact LikelihoodTotal RAG
Mitigations
5 x 5
1. In-year acute over-performance 4 4 16 See slides 47-42
2. Demand management - QIPP 4 4 16 See slides 43-44
3. Other QIPP delivery4 4 16 See slide 45
4. In-year cost pressures4 4 16 See slide 46
5. Further in-year savings4 4 16 See slide 47

41
Risk area: In- year acute over-performance – in SectorRisk Current risk
Rating (5x5)
Actions SRO
1. Planned Procedures with a Threshold - anticipated reductions do not materialise
4x4
•Structured project management•Clinical engagement with local GP work shops and primary/secondary care workshops•Contract monitoring in – year
GS
2. Outpatient ratios – discharge of patients results in clinical risks and/ or additional costs in primary care
4x4
•Detailed dialogue between primary and secondary care clinicians under auspices of Clinical Quality Group •Management of transfers of follow up patients by GP consortia
GS
3. Internal factors such as improved counting and costing and shift of elective work not undertaken in final weeks of 2010/11 drive unplanned over activity
4x5
•Careful monitoring of median elective waits by ACV•Careful monitoring, enquiry and enactment of subsequent activity management plans for any unexplained shift of activity indicating counting and coding changes
GS
4. External factors e.g. winter pressures drive unplanned demand
4x3• Early dialogue with providers on flexibility of
elective planning within eighteen week scope • Secure winter planning processes in place
GS
Controls and assurance sources (e.g. systems in place and how we gain evidence on effectiveness of systems)
ACV contract monitoring and application of contractual levers and claims management combined with active budgetary management by clinical commissioners – claims yield, queries raised and resolved
42
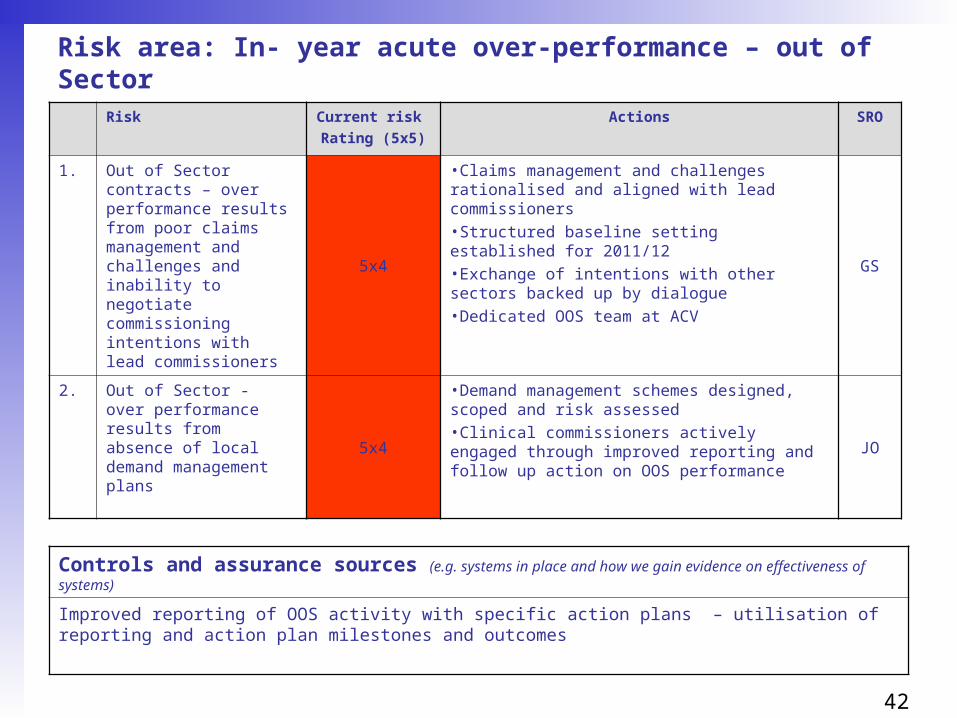
Risk area: In- year acute over-performance – out of Sector
Risk Current risk
Rating (5x5)
Actions SRO
1. Out of Sector contracts – over performance results from poor claims management and challenges and inability to negotiate commissioning intentions with lead commissioners
5x4
•Claims management and challenges rationalised and aligned with lead commissioners•Structured baseline setting established for 2011/12•Exchange of intentions with other sectors backed up by dialogue •Dedicated OOS team at ACV
GS
2. Out of Sector - over performance results from absence of local demand management plans 5x4
•Demand management schemes designed, scoped and risk assessed •Clinical commissioners actively engaged through improved reporting and follow up action on OOS performance
JO
Controls and assurance sources (e.g. systems in place and how we gain evidence on effectiveness of systems)
Improved reporting of OOS activity with specific action plans – utilisation of reporting and action plan milestones and outcomes
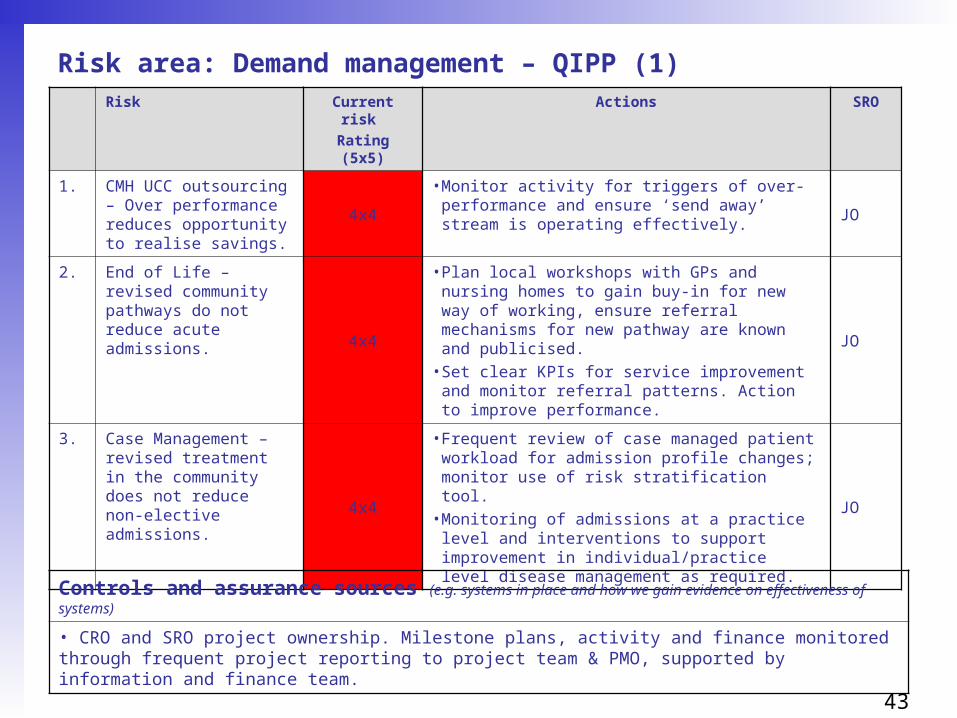
43
Risk area: Demand management – QIPP (1)Risk Current risk
Rating (5x5)
Actions SRO
1. CMH UCC outsourcing – Over performance reduces opportunity to realise savings.
4x4
• Monitor activity for triggers of over-performance and ensure ‘send away’ stream is operating effectively.
JO
2. End of Life – revised community pathways do not reduce acute admissions. 4x4
• Plan local workshops with GPs and nursing homes to gain buy-in for new way of working, ensure referral mechanisms for new pathway are known and publicised.
• Set clear KPIs for service improvement and monitor referral patterns. Action to improve performance.
JO
3. Case Management – revised treatment in the community does not reduce non-elective admissions.
4x4
• Frequent review of case managed patient workload for admission profile changes; monitor use of risk stratification tool.
• Monitoring of admissions at a practice level and interventions to support improvement in individual/practice level disease management as required.
JO
Controls and assurance sources (e.g. systems in place and how we gain evidence on effectiveness of systems)
• CRO and SRO project ownership. Milestone plans, activity and finance monitored through frequent project reporting to project team & PMO, supported by information and finance team.
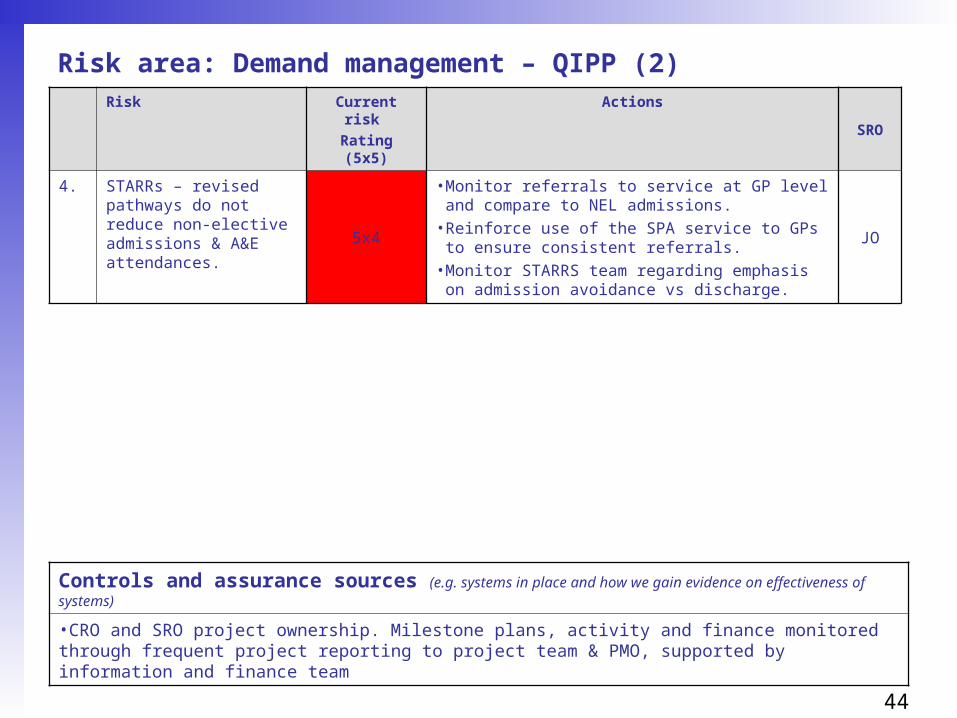
44
Risk area: Demand management – QIPP (2)Risk Current risk
Rating (5x5)
ActionsSRO
4. STARRs – revised pathways do not reduce non-elective admissions & A&E attendances. 5x4
• Monitor referrals to service at GP level and compare to NEL admissions.
• Reinforce use of the SPA service to GPs to ensure consistent referrals.
• Monitor STARRS team regarding emphasis on admission avoidance vs discharge.
JO
Controls and assurance sources (e.g. systems in place and how we gain evidence on effectiveness of systems)
•CRO and SRO project ownership. Milestone plans, activity and finance monitored through frequent project reporting to project team & PMO, supported by information and finance team

45
Risk area: Other QIPP delivery
Risk Current risk
Rating (5x5)
Actions SRO
1. Prescribing – GP prescribing does not operate within budget. 5x4
• Individual budgets allocated by practice (devolved to GP commissioners).
• Monitoring of usage at practice level and early support provided to understand improvement areas.
JO
2. ICO efficiencies not realised to release savings. 4x4
• Willesden beds function and staffing levels evaluated.
• Service reviews undertaken to release savings.JO
3. Mental Health efficiencies not realised.
4x4
• Assess individual patients.• Provide alternative service where appropriate. JO
4. Primary Care list validation – number of ‘ghost’ patients not at expected level.
4x4
• Ensure correct process for evaluating patients has been followed.
JO
Controls and assurance sources (e.g. systems in place and how we gain evidence on effectiveness of systems)
• CRO and SRO project ownership. Milestone plans, activity and finance monitored through frequent project reporting to project team & PMO, supported by information and finance team.

46
Risk area: In-year cost pressures
Risk Current risk
Rating (5x5)
Actions SRO
1. Acute over-performance4x4
• See earlier slidesGS/JO
2. Specialist commissioning4x3
• Review monthly update from LSCGJO
3. Prescribing4x4
• see earlier slidesJO
4. Continuing care4x3
• strong budgetary control processesJO
5. External events e.g. flu, national initiatives 4x3
• awareness of environmental changesJO
Controls and assurance sources (e.g. systems in place and how we gain evidence on effectiveness of systems)
• Strong monthly budgetary control focus
47
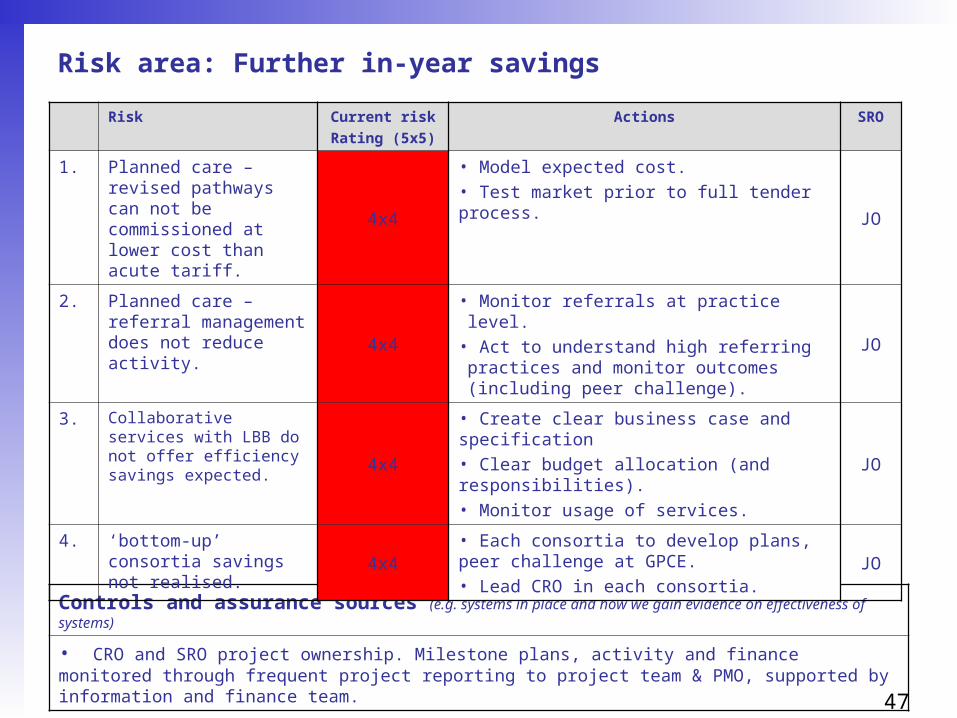
Controls and assurance sources (e.g. systems in place and how we gain evidence on effectiveness of systems)
• CRO and SRO project ownership. Milestone plans, activity and finance monitored through frequent project reporting to project team & PMO, supported by information and finance team.
Risk area: Further in-year savings
Risk Current risk
Rating (5x5)
Actions SRO
1. Planned care – revised pathways can not be commissioned at lower cost than acute tariff.
4x4
• Model expected cost.• Test market prior to full tender process.
JO
2. Planned care – referral management does not reduce activity. 4x4
• Monitor referrals at practice level.• Act to understand high referring practices and monitor outcomes (including peer challenge).
JO
3. Collaborative services with LBB do not offer efficiency savings expected. 4x4
• Create clear business case and specification• Clear budget allocation (and responsibilities).• Monitor usage of services.
JO
4. ‘bottom-up’ consortia savings not realised. 4x4
• Each consortia to develop plans, peer challenge at GPCE.• Lead CRO in each consortia.
JO
48
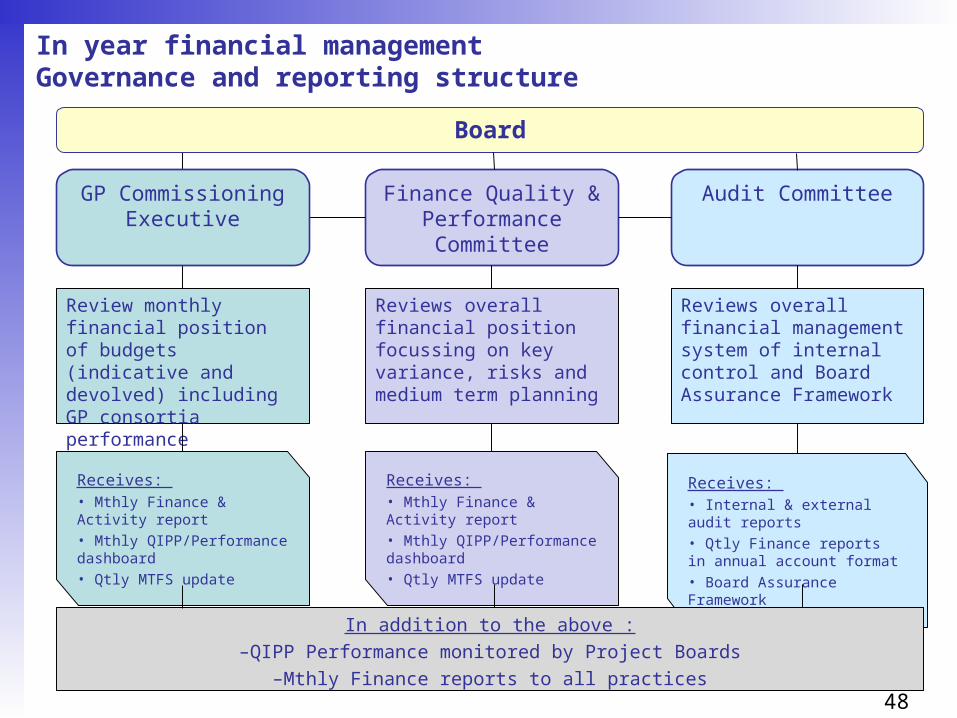
In year financial management Governance and reporting structure
Finance Quality & Performance Committee
Audit Committee
Review monthly financial position of budgets (indicative and devolved) including GP consortia performance
Reviews overall financial position focussing on key variance, risks and medium term planning
Reviews overall financial management system of internal control and Board Assurance Framework
Receives: • Mthly Finance & Activity report• Mthly QIPP/Performance dashboard• Qtly MTFS update
Receives: • Mthly Finance & Activity report• Mthly QIPP/Performance dashboard• Qtly MTFS update
Receives: • Internal & external audit reports• Qtly Finance reports in annual account format• Board Assurance Framework
In addition to the above :–QIPP Performance monitored by Project Boards
–Mthly Finance reports to all practices
Board
GP Commissioning Executive
49
QIPP Monitoring Process
Project boards Project Highlight report
QIPP performance dashboard
Milestone plans
Risk log
Financial tracking
Activity tracking
GP CommissioningExecutive
Clinical RO
Senior RO
Cluster PMO
Summary of actual vs planned
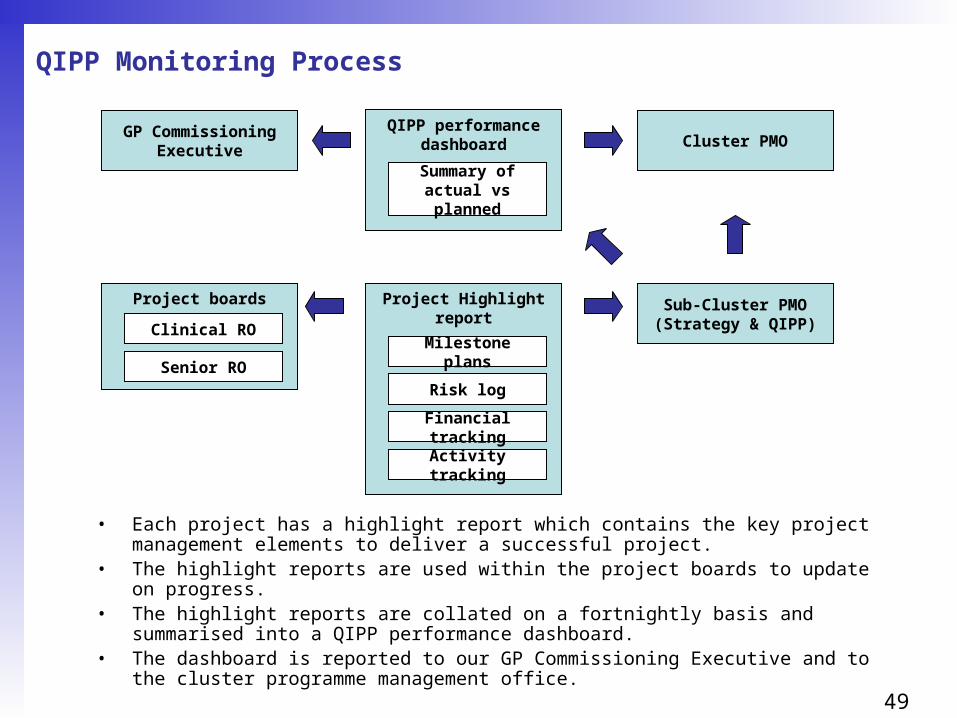
• Each project has a highlight report which contains the key project management elements to deliver a successful project.
• The highlight reports are used within the project boards to update on progress.• The highlight reports are collated on a fortnightly basis and summarised into a QIPP
performance dashboard.• The dashboard is reported to our GP Commissioning Executive and to the cluster
programme management office.
Sub-Cluster PMO(Strategy & QIPP)
50
Contingency plans
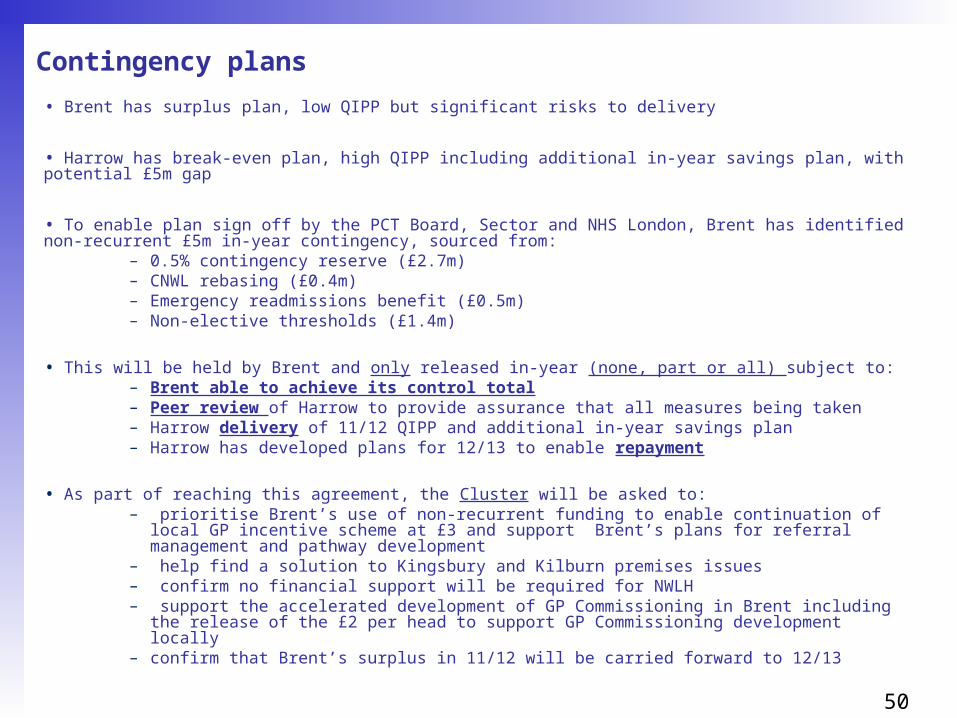
• Brent has surplus plan, low QIPP but significant risks to delivery
• Harrow has break-even plan, high QIPP including additional in-year savings plan, with potential £5m gap
• To enable plan sign off by the PCT Board, Sector and NHS London, Brent has identified non-recurrent £5m in-year contingency, sourced from:
– 0.5% contingency reserve (£2.7m)– CNWL rebasing (£0.4m)– Emergency readmissions benefit (£0.5m)– Non-elective thresholds (£1.4m)
• This will be held by Brent and only released in-year (none, part or all) subject to:– Brent able to achieve its control total– Peer review of Harrow to provide assurance that all measures being taken– Harrow delivery of 11/12 QIPP and additional in-year savings plan– Harrow has developed plans for 12/13 to enable repayment
• As part of reaching this agreement, the Cluster will be asked to: – prioritise Brent’s use of non-recurrent funding to enable continuation of local GP incentive
scheme at £3 and support Brent’s plans for referral management and pathway development– help find a solution to Kingsbury and Kilburn premises issues– confirm no financial support will be required for NWLH– support the accelerated development of GP Commissioning in Brent including the release of
the £2 per head to support GP Commissioning development locally– confirm that Brent’s surplus in 11/12 will be carried forward to 12/13
51
Underlying financial position andFinancial outlook for 12/13 onwards (1)
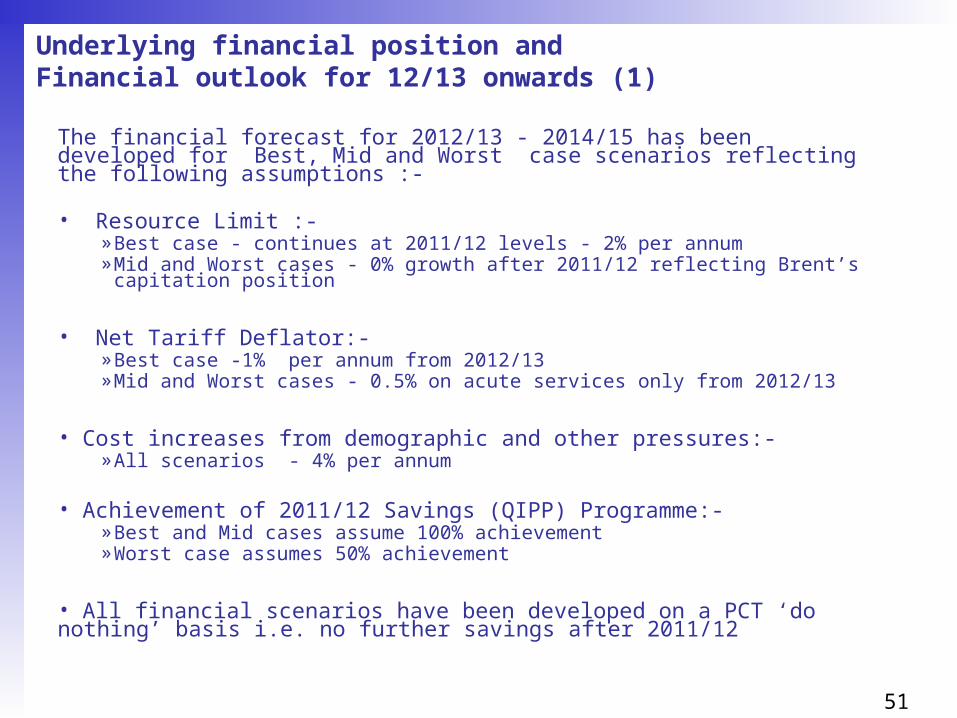
The financial forecast for 2012/13 - 2014/15 has been developed for Best, Mid and Worst case scenarios reflecting the following assumptions :-
• Resource Limit :-»Best case - continues at 2011/12 levels - 2% per annum»Mid and Worst cases - 0% growth after 2011/12 reflecting Brent’s capitation
position
• Net Tariff Deflator:-»Best case -1% per annum from 2012/13»Mid and Worst cases - 0.5% on acute services only from 2012/13
• Cost increases from demographic and other pressures:-»All scenarios - 4% per annum
• Achievement of 2011/12 Savings (QIPP) Programme:-»Best and Mid cases assume 100% achievement»Worst case assumes 50% achievement
• All financial scenarios have been developed on a PCT ‘do nothing’ basis i.e. no further savings after 2011/12

52
Underlying financial position andFinancial outlook for 12/13 onwards (2)
Analysis of Underlying (Surplus)/Deficit
(£19.1m)(£10.3m)
(£1.4m)
£8.3m
£4.6m
£29.1m
£54.7m
£61.8m
£36.0m
£11.2m
(£12.8m)
(30.0)
(20.0)
(10.0)
0.0
10.0
20.0
30.0
40.0
50.0
60.0
70.0
2011/12 2012/13 2013/14 2014/15
(Sur
plus
)/Def
icit
£m
Best Mid Worst

53
Identification of other QIPP opportunitiesand planning for 12/13
GP CommissioningExecutive agree initiative
Size of opportunity scoped & project overview completed
Joint GP commissioner and Borough Manager use information to formulate opportunities
Data of current service use across QIPP buckets
Benchmarked opportunity in key areas
Borough managers evaluation of current services
Continuous review process over next 3 months. Final sign off, end June.

54
Part 2 – Performance plans 2011/12

55
Health Context
• The life expectancy of men living in the least deprived parts of the borough is over 8 years higher than for men living in the most deprived parts. The difference is over two years for women
• Over the past 10 years the rates of deaths from all causes has fallen however the rate of early deaths from stroke and heart disease remains worse than the England average
• The proportion of children living in poverty is worse than the England average• One in four people in Brent smoke causing approximately 290 deaths per year• Almost 20% of Brent’s Adult population are estimated to be obese.• Approximately 2/3rds of Brent's population are estimated as not eating the
recommended amount of fruit and vegetables per week.• Over half of our population is not taking part in any form of physical exercise• High and increasing prevalence of diabetes, HIV and TB
Brent is ranked 11th in London for male all age all cause mortality rates and 12th for female.
CVD mortality rates place Brent 18th and cancer mortality rates ranked 14th.
56
Performance Targets 2010/11 – 2011/12
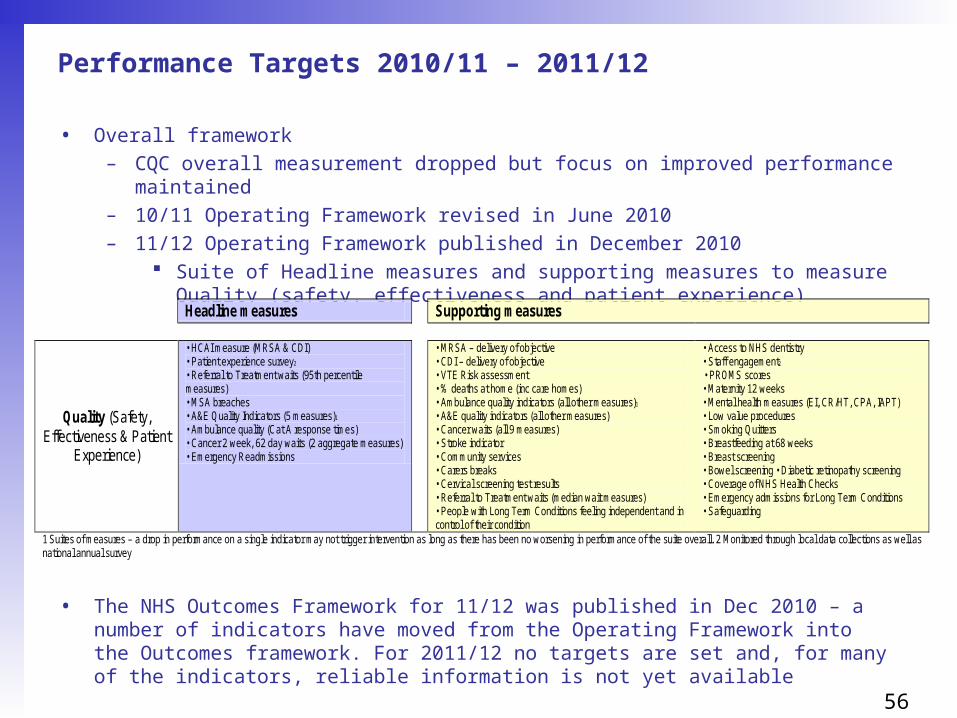
• Overall framework – CQC overall measurement dropped but focus on improved performance maintained– 10/11 Operating Framework revised in June 2010– 11/12 Operating Framework published in December 2010
Suite of Headline measures and supporting measures to measure Quality (safety, effectiveness and patient experience)
• The NHS Outcomes Framework for 11/12 was published in Dec 2010 – a number of indicators have moved from the Operating Framework into the Outcomes framework. For 2011/12 no targets are set and, for many of the indicators, reliable information is not yet available
Headline measures Supporting measures
Quality (Safety, Effectiveness & Patient
Experience)
• HCAI measure (MRSA & CDI) • Patient experience survey2
• Referral to Treatment waits (95th percentile measures) • MSA breaches • A&E Quality Indicators (5 measures)1
• Ambulance quality (Cat A response times) • Cancer 2 week, 62 day waits (2 aggregate measures) • Emergency Readmissions
• MRSA – delivery of objective • CDI – delivery of objective • VTE Risk assessment • % deaths at home (inc care homes) • Ambulance quality indicators (all other measures)1
• A&E quality indicators (all other measures) • Cancer waits (all 9 measures) • Stroke indicator • Community services • Carers breaks • Cervical screening test results • Referral to Treatment waits (median wait measures) • People with Long Term Conditions feeling independent and in control of their condition
• Access to NHS dentistry • Staff engagement2
• PROMS scores • Maternity 12 weeks • Mental health measures (EI, CR/HT, CPA, IAPT) • Low value procedures • Smoking Quitters • Breastfeeding at 68 weeks • Breast screening • Bowel screening • Diabetic retinopathy screening • Coverage of NHS Health Checks • Emergency admissions for Long Term Conditions • Safeguarding
1 Suites of measures – a drop in performance on a single indicator may not trigger intervention as long as there has been no worsening in performance of the suite overall. 2 Monitored through local data collections as well as national annual survey

57
Brent 10/11 Plan – overall approach
• Brent’s performance transformation programme centred around four elements: Top team alignment; Performance culture; Performance transformation building blocks and Releasing the potential of primary care
Top Team Alignment
• Bi-weekly performance EMT meetings to update and identify risks and issues to delivery – regular escalation and analysis by EMT to ensure mitigating actions can be implemented quickly
Performance culture
• Dedicated Performance Delivery team to support leads• Weekly dashboards created• Data utilised to inform decisions
Performance transformation
building blocks
• Focus on development of high quality delivery plans • Extensive programmes to support key targets, supported by NR funding• Robust social marketing plan to support delivery
Releasing the potential of
primary care
• Performance Bond introduced for GP Access and Patient Experience, Immunisations, Smoking and Maternity to support improved performance in Primary Care• Engagement between clinical leads and commissioning leads on performance

58
Brent 10/11 Plan – mid year review
• A mid year review was undertaken to enable the PCT to review progress against the performance management approach taken in 2010/11.
• A stock take of where the PCT was in terms of addressing the issues highlighted, was essential in understanding if/where more needed to be done to support delivery in the 2nd half of 10/11 onwards.
• Overall the responses were very positive in all key areas with Performance Culture and Performance Transformation Building Blocks being the strongest categories with (73%) and (72%) respectively of respondents agreeing these were in place or nearly in place.
• Performance Delivery and Releasing the Potential of Primary Care were the areas identified as needing further work although it was evident that improvements in these areas had also been made.
• A number of actions to take forward were developed and have been encompassed in 11/12 planning
59
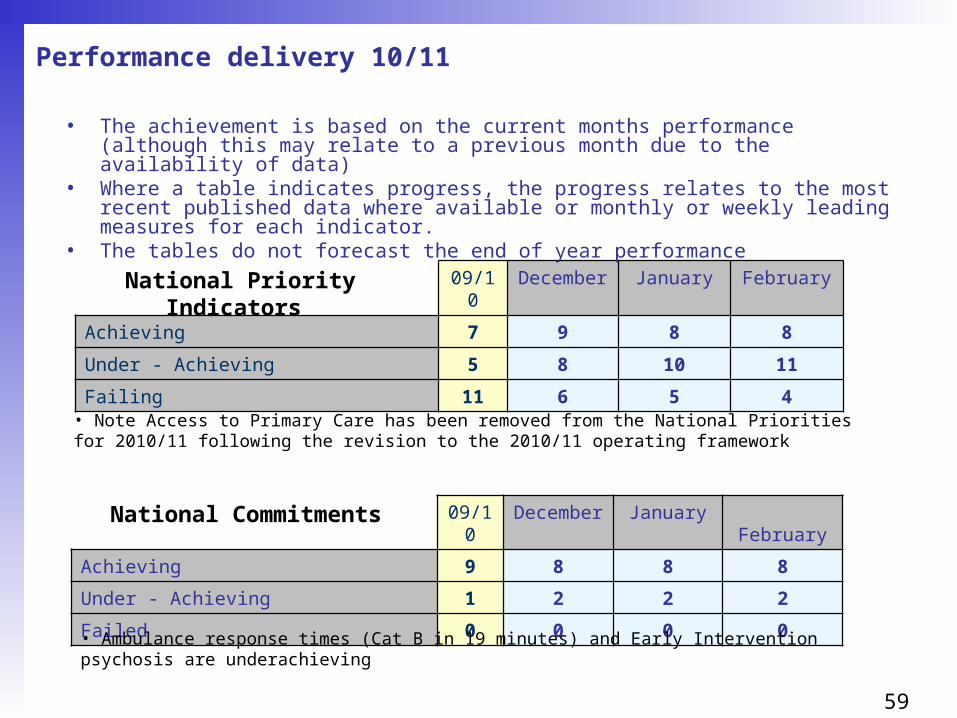
Performance delivery 10/11
09/10 December January February
Achieving 7 9 8 8
Under - Achieving 5 8 10 11
Failing 11 6 5 4
National Priority Indicators
09/10 December January February
Achieving 9 8 8 8
Under - Achieving 1 2 2 2
Failed 0 0 0 0
National Commitments
• Ambulance response times (Cat B in 19 minutes) and Early Intervention psychosis are underachieving
• The achievement is based on the current months performance (although this may relate to a previous month due to the availability of data)
• Where a table indicates progress, the progress relates to the most recent published data where available or monthly or weekly leading measures for each indicator.
• The tables do not forecast the end of year performance
• Note Access to Primary Care has been removed from the National Priorities for 2010/11 following the revision to the 2010/11 operating framework

60
2009/10 & 2010/11National Priorities (excl.3 cancer mortality rates) 09/10 10/11 score as at Feb 11
Movement within band Ranking* +/-
Patient experience fail fail Not available n/a
Immunisation underachieve underachieve 16 +4
Smoking quitters fail achieve 20 +10
Breastfeeding fail underachieve 14 -1
Drugs misuse fail underachieve Not yet available n/a
Maternity fail fail 18 +9
Staff satisfaction underachieve underachieve Not yet available n/a
Dental access underachieve underachieve 29 -1
Chlamydia screening achieve underachieve 7 +11
C. diff. achieve achieve 21 -8
18 weeksachieve underachieve
15 (admitted)17 (non-admitted)
-7+1
Cancer waits - 2 weeks achieve achieve 8 +7
Cancer waits - 62 days achieve achieve 1 +12
Cancer waits - 31 days achieve achieve 2 +5
Stroke care fail achieve 3 +24
Teenage conceptions fail fail 17 -5
Childhood obesity achieve achieve 6 +20
Breast screening fail underachieve 21 +10
CAMHS achieve achieve - -
Cervical screening underachieve underachieve
27 (25-49yrs)17 (50-64yrs)
00
*against 31 London PCTs. Ranking based on latest available data – Q3 where available compared to Q4 09/10
• absolute movement – unable to specify date as not all are 09/10 comparatives
61
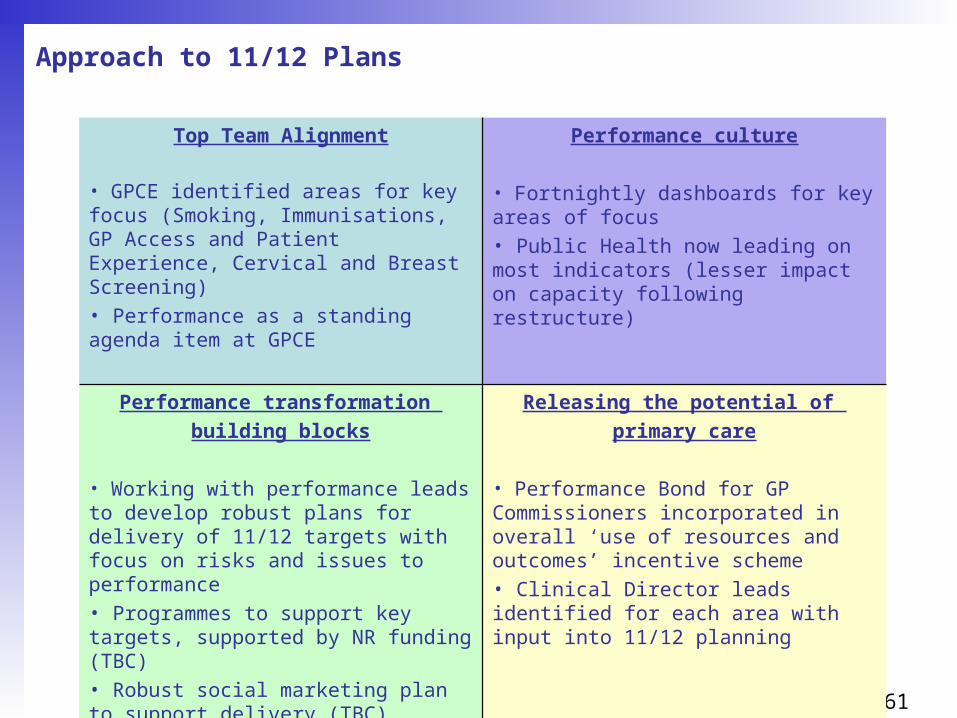
Approach to 11/12 Plans
Top Team Alignment
• GPCE identified areas for key focus (Smoking, Immunisations, GP Access and Patient Experience, Cervical and Breast Screening)• Performance as a standing agenda item at GPCE
Performance culture
• Fortnightly dashboards for key areas of focus• Public Health now leading on most indicators (lesser impact on capacity following restructure)
Performance transformation
building blocks
• Working with performance leads to develop robust plans for delivery of 11/12 targets with focus on risks and issues to performance• Programmes to support key targets, supported by NR funding (TBC)• Robust social marketing plan to support delivery (TBC)
Releasing the potential of
primary care
• Performance Bond for GP Commissioners incorporated in overall ‘use of resources and outcomes’ incentive scheme • Clinical Director leads identified for each area with input into 11/12 planning

62
11/12 PlansSRO Target 11/12
Target
Movement
from FOT
Key Actions/Activities
SB Immunisations - % uptake of immunisations
Age 1
DTaP_IPV_Hib 95%
Age 2
PCVbooster 92%
Hib_MenCbooster 92%
MMR 90%
Age5
DTaP_IPVbooster 85%
MMR 90%
HPV 90%
+ 0.5%
+ 4.7%
+ 4.1%
+3.5%
+8.8%
+20.3%
+10%
• Monitor & support practices to operate effective call/recall process
• Development of practice immunisation action plans
• Explore facilitation of a dedicated Imms team to reach out to DNAs
• Explore implementation of evening and weekend clinics and home visits
SB Cervical Screening - % of women with an expected date of delivery screening test result within 14 days of the test being taken
Coverage 25-49yrs 67%
Coverage 50-64yrs 80%
Results received within 14 days 100%
+5%
+9%
+6%
• Telephone follow up of DNA’s and reinvite previous DNAs• Targeted social marketing for hard to reach groups• Implement Cervical Screening action plan to promote screening and increase access & choice
SB Breast screening – Uptake 50-74yrs & percentage of women aged 47-49 &71-73 invited for screening
Uptake 50-74 yrs 60%
Percentage of women invited (new measure) awaiting target
+6%
n/a
• Targeted telephone follow up of DNAs• Targeted social marketing for hear dot
reach groups• Systematic liaison with GP practices –
training, data management, reminder flags, screening list validation
63
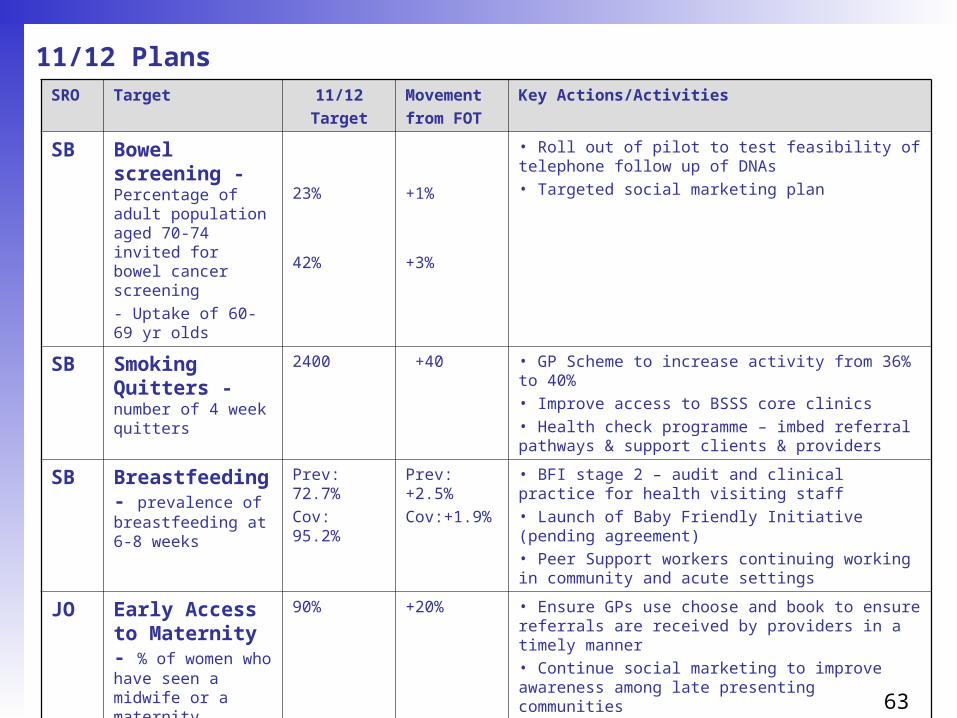
11/12 PlansSRO Target 11/12
Target
Movement
from FOT
Key Actions/Activities
SB Bowel screening - Percentage of adult population aged 70-74 invited for bowel cancer screening
- Uptake of 60-69 yr olds
23%
42%
+1%
+3%
• Roll out of pilot to test feasibility of telephone follow up of DNAs• Targeted social marketing plan
SB Smoking Quitters - number of 4 week quitters
2400 +40 • GP Scheme to increase activity from 36% to 40%• Improve access to BSSS core clinics• Health check programme – imbed referral pathways & support clients & providers
SB Breastfeeding - prevalence of breastfeeding at 6-8 weeks
Prev: 72.7%
Cov: 95.2%
Prev: +2.5%
Cov:+1.9%
• BFI stage 2 – audit and clinical practice for health visiting staff• Launch of Baby Friendly Initiative (pending agreement)• Peer Support workers continuing working in community and acute settings
JO Early Access to Maternity - % of women who have seen a midwife or a maternity healthcare professional, by 12 weeks and 6 days
90% +20% • Ensure GPs use choose and book to ensure referrals are received by providers in a timely manner • Continue social marketing to improve awareness among late presenting communities• Audit of late bookers by NWLH to inform further actions to improve access

64
11/12 Plans
SRO Target 11/12
Target
Movement
from FOT
Key Actions/Activities
JO Dental - Number of patients receiving NHS primary dental services within a 24 month period
174,370 +9942 (tbc) • Publicise dental messages to public• Focus on call/recall levels• Re-attendance rates of contractors to make sure they are not higher than London averages
JO Patient Experience
GP access (linked to appointments)
(Questions and domain groupings not yet confirmed by DH)
• Follow up from ACE programme – focus on practices that have not made changes• Plans in development as part of proposed GP incentive scheme
SB Health Checks - 1) the percentage of people eligible for the NHS Health Check programme who have been offered an NHS Health Check2) the percentage of people eligible for the programme who have received a NHS Health Check
1) Invited: 90% of eligible population
2) Received: 50% of eligible population receive check
(40% uptake achieved in 10 pilot practices in 10/11)
• Roll out health checks across whole Borough• Scheduled programme of GP support visits by PH team• Facilitation of GP cluster delivery plans
65
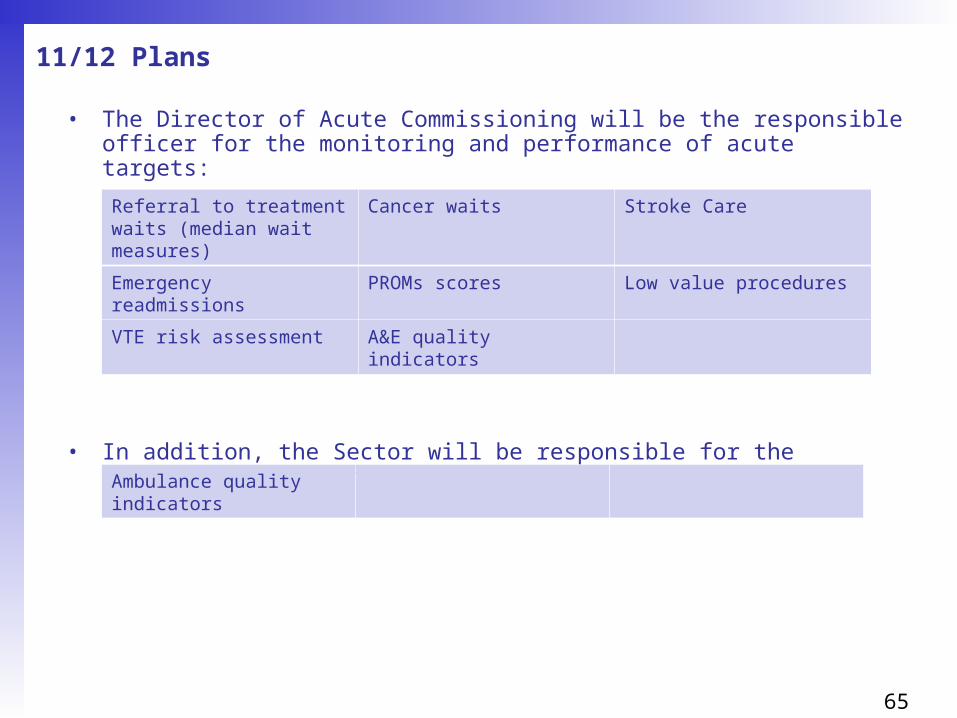
11/12 Plans
• The Director of Acute Commissioning will be the responsible officer for the monitoring and performance of acute targets:
• In addition, the Sector will be responsible for the monitoring and performance of:
Referral to treatment waits (median wait measures)
Cancer waits Stroke Care
Emergency readmissions PROMs scores Low value procedures
VTE risk assessment A&E quality indicators
Ambulance quality indicators

66
11/12 Plans
• The Director of Public Health will also be the responsible officer for the monitoring and performance of health outcomes
• The Borough Director will also be the responsible officer for the monitoring and performance of the following:
HCAI (C.dif and MRSA) Childhood obesity Diabetic retinopathy
% deaths at home LTCs – people feeling independent and in control of their condition
Mental Health – IAPT, Early Intervention in Psychosis, CPA, Crisis Resolution
Safeguarding Carers breaks Community services
LTC – emergency readmissions

67
Risks and mitigations
Risk Impact Likelihood Total RAG
Mitigations
5 x 5
1 Lack of capacity
4 4 16
Majority of targets held by a single SRO however lesser impact on capacity following restructure in Public Health than elsewhere in the PCT
2 Specific and significant challenge in primary care - Majority of red indicators have a link back to the GP workforce
4 4 16
Cervical screening, access, patient satisfaction, smoking cessation, immunisations etc. have a heavy reliance upon GPs for delivery
3 Various sub-issues within targets - Each target/indicator has a number of issues. 4 4 16
List inflation is potentially increasing the actual targets of a number of indicators
Ongoing monitoring and escalation of issues
4 Potential silo’d working - Teams working on similar initiatives rather than combining efforts under one initiative
4 3 12
3 cross-target initiatives identified :• List cleanse• Data collection from GPs• Social/ behavioural marketing
5 Unable to maintain improvements in performance culture/top team alignment 4 4 16
• Monthly dashboards for key areas of focus• Performance a standing agenda item on the CCB

68
Part 4 – GP Delegation
Contents
1. Background – NWL context
2. Budget setting options: Indicative vs. Delegated budgets
3. Fair shares methodology
4. Fair shares pace of change comparison
5. Acute risk pool arrangements
6. Prescribing budget setting
7. Budget allocation 11/12
8. Incentive scheme
9. Reporting

69
Background – NWL context (1)NWL principles
• Consortia will have assumed delegation for all services by 31st March 2012
• Consortia progressively achieve delegation for increasing range of services based on ability to demonstrate performance management capability
• This a learning process for both Consortia and Transition management
• Maintaining a strong grip on performance and finance this year
• Commissioning support funding given to Consortia will supplement existing management resource
• The Cluster ACV and Borough based teams are fixed points
• The Cluster CEO will remain the Accountable Officer and consortia are bound by PCT governance and financial rules

70
Background – NWL context (2)
Complexity of service matrix
ClinicalService vision Financial riskPerformance risk
Bundles
Low – services that GPs can influence directly through
patient consultations
Medium – majority of services
High – services where each individual GP has least
control and in influencing
• Grouped services into 3 bundles

71
Background – NWL context (3)Bundles
Low Prescribing Community health Community mental health
services/IAPT Community Paediatrics Direct access diagnostics Outpatients (GP referrals only) Sexual health
High Critical care Specialist mental health Continuing care Non PbR drugs and devices
(unless there is an SLA cap)
Medium Acute Paediatrics Elective care Urgent Care – A&E / UCC Urgent care – inpatients Maternity End of Life Care Non GP-referred outpatients Intermediate Care Re-ablement Voluntary Sector CAMHS Inpatient mental health Physical disability Pathways spanning multiple
providers eg. care of elderly Services provided by GPs in
primary / community care settings (low risk but high governance requirement to managing conflicts of interest)
Services provided by non NHS providers
71
72
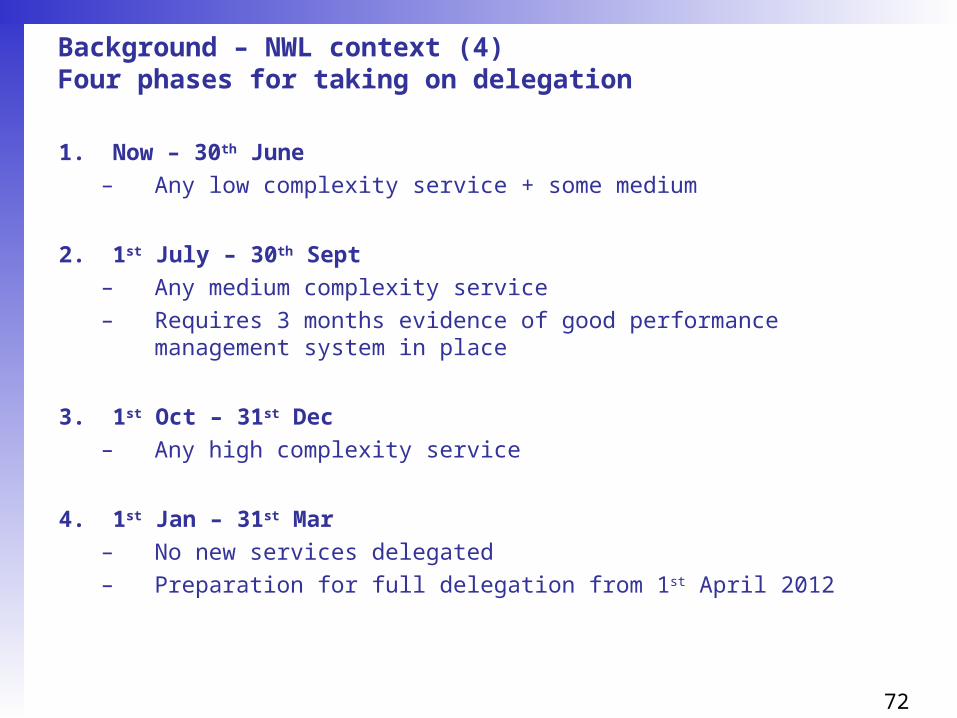
Background – NWL context (4)Four phases for taking on delegation
1. Now – 30th June
– Any low complexity service + some medium
2. 1st July – 30th Sept
– Any medium complexity service
– Requires 3 months evidence of good performance management system in place
3. 1st Oct – 31st Dec
– Any high complexity service
4. 1st Jan – 31st Mar
– No new services delegated
– Preparation for full delegation from 1st April 2012

73
Background – NWL context (5)Assurance process – five steps
1. Description of the basic governance arrangements required for delegation of any commissioned service
2. Completion of a planning and assurance template for the commissioned services consortia wish to take responsibility for
3. A presentation by the consortia and relevant borough/sub cluster team to NHS NW London Cluster Chief Executive
4. Approval of the Cluster decision by NHS London
5. Signing of a Cluster- Pathfinder agreement for the services delegated.
74
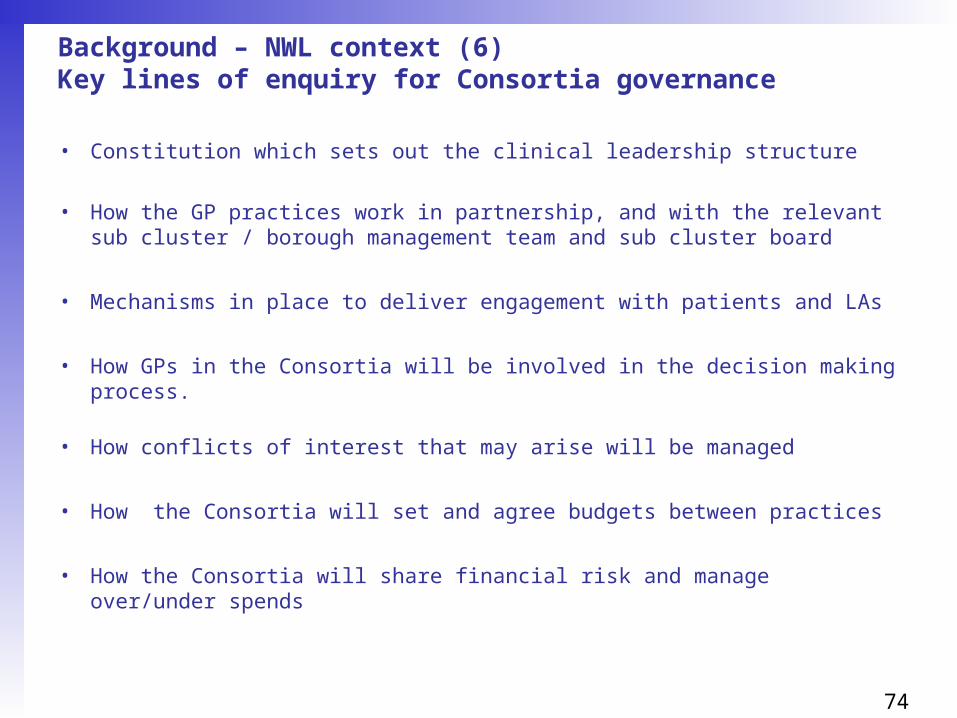
Background – NWL context (6)Key lines of enquiry for Consortia governance
• Constitution which sets out the clinical leadership structure
• How the GP practices work in partnership, and with the relevant sub cluster / borough management team and sub cluster board
• Mechanisms in place to deliver engagement with patients and LAs
• How GPs in the Consortia will be involved in the decision making process.
• How conflicts of interest that may arise will be managed
• How the Consortia will set and agree budgets between practices
• How the Consortia will share financial risk and manage over/under spends

75
Background – NWL context (7)Key lines of enquiry for each delegated services
• Indicative timescale for the delegation
• Value of all the budgets being delegated.
• Vision for each of the services taking delegated responsibility for
• Clinical and financial outcomes are wishing to achieve this financial year
• What elements of the borough QIPP programme are covered by these services and what plans are in place to deliver these QIPP initiatives
• What are the critical clinical, financial and operational risks?
• Performance management approach for the services - what information will you use and where will the Consortia obtain it from?
• What management / commissioning support will you require to manage these delegated services and who will provide it?

76
Budget setting options: Indicative vs. Delegated budgets
Indicative Budgets
• Formal budget holder status remains with PCT – budgetary performance reported to GPCE/GPs
Delegated Budgets
• GPCE (Chair?) to have formal budget holder status, accountable to CEO with responsibilities as per SFI’s.
• Clinical Directors have delegated budget holder status, accountable to (GPCE chair?)
• It is proposed that as much as possible is reported as an indicative budget with delegated budgets to be agreed in line with Sector guidance as stated in the “NWL Delegation of responsibilities to GP Consortia”.

77
Fair shares methodology (1)
• It is recommended by DH that PCTs calculate practice indicative budgets using “fair shares” and that they move towards fair shares;
• The DH have developed a ‘Person Based Resource Allocation formula’ (PBRA) which is embedded in the toolkit published for PCTs for the purpose of allocating budgets to GP practices;
• In developing the model the Nuffield Institute looked at using a number of markers as predictors of health use. They concluded that the use of morbidity markers based on 152 ICD 10 groups gave the most robust predictions, and that QOF based disease practice disease prevalence rates were no substitute for these markers1.
• Fair shares are calculated using DH 2011/12 Test Toolkit, making use of GP list size demographics information (e.g. age/Sex) weighted percentages, the percentages included are:
•1 Developing a person-based resource allocation formula for allocations to general practices in England The Nuffield Trust
Brent Element WeightingAcute Share 57.7%Maternity Share 5.6%MH Share 17.2%Prescribing Share 9.3%Inequalities Share 10.2%Total 100.0%

78
Fair shares methodology (2)
• There are a number of options as to the calculation of the pace of change movement to fair shares target.
» Setting a standard maximum movement +/- to fair shares target applied to all practices e.g. options could be 2% or 3% maximum change or 100% move to capitation;
» Setting a differential pace of change movement depending on the distance from fair shares target and the maximum number of years to move to target e.g. all practices to move to targets by 2013.
• In fair shares calculations we specifically exclude:» The acute risk pool spends from the outturn and fair shares
calculation in order that the calculations are not distorted; » Unallocated budget for activity that cannot be specifically apportioned
to Practices would also be excluded from both the outturn and fair shares calculation to enable practice shares to be accurately calculated;
» GP Access Centre due to the nature of its population growth.
• The fair shares target will be calculated including prescribing.

79
Fair shares pace of change comparison
1) Locality figures are based upon 10/11 Forecast figures and they include Acute PbR and prescribing values.
2) This calculation excludes GP Access Centre, spend unattributable to the practices and spend assigned to risk pool.
3) The PBC management leads recommendation is based on the twin aims of moving all practice budgets to within the fair shares threshold by April 2013 but meant that the budgets are deliverable for those practices who are losing.
4) The recommendation to use the DH fair-shares toolkit for acute PbR and prescribing spend and to move to capitation over 2 years is due to be considered by the GPCE on 13 th April.
Pace of change adjustment at locality level under recommended option
Gain +, Lose ( )
LocalitiesFairshares movement @ 100% capitation
Adjustment to 50% of movement in 11/12
Net movement in 11/12
Combined 10/11 Acute PbR and Prescribing FOT
Change over 10/11 FOT
£'000 £'000 £'000 £'000 %
Harness 8 (4) 4 38,934 0.01%
Kilburn 194 (97) 97 38,089 0.25%
Kingsbury (230) 115 (115) 33,733 (0.34)%
Wembley 46 (23) 23 29,421 0.08%
Willesden (18) 9 (9) 24,025 (0.04)%
Total 0 0 0 164,202

80
Acute risk pool arrangements
• The national guidance suggests that practices contribute 3-5%of their indicative budget to a risk pool;
• The currently agreed criteria for the risk pool, that is used for spells costing more than £10k;
• Any under/overspend on the acute risk pool at the end of the year is allocated to practices pro-rata to initial contributions.

81
Prescribing budget setting (1)
10/11 Prescribing budget 36,739,272
Forecast out-turn @ Jan 11 (1.3% o/s budget allocation) £37,208,421
Add 10/11 Cost pressures @ 5% £1,860,421
Less 11/12 QIPP savings target (1,023,363)
11/12 prescribing budget allocation £38,045,479
% Increase on 10/11 budgets 3.56%

82
Prescribing budget setting (2)
• No validated national/local satisfactory formula to take into account all influences on GP prescribing costs at a practice level;
• National recommendation = prescribing budgets should not be based on or relied upon either on total capitation or total historic budgets, but should be set on a mix of weighted capitation methodology, historic budget patterns and local judgement;
• For 11/12, the management leads recommend that:
– a policy is set for the next two years
– To include prescribing in the DH fair-shares toolkit
– An adjustment is made to reflect the impact of nursing home registration
– that in 11/12, the budget setting policy would be to apply the uplift and savings consistently across all practices
– that from 12/13, a lower uplift / higher savings targets would be applied to those practices that had not kept within the 11/12 prescribing budget
83
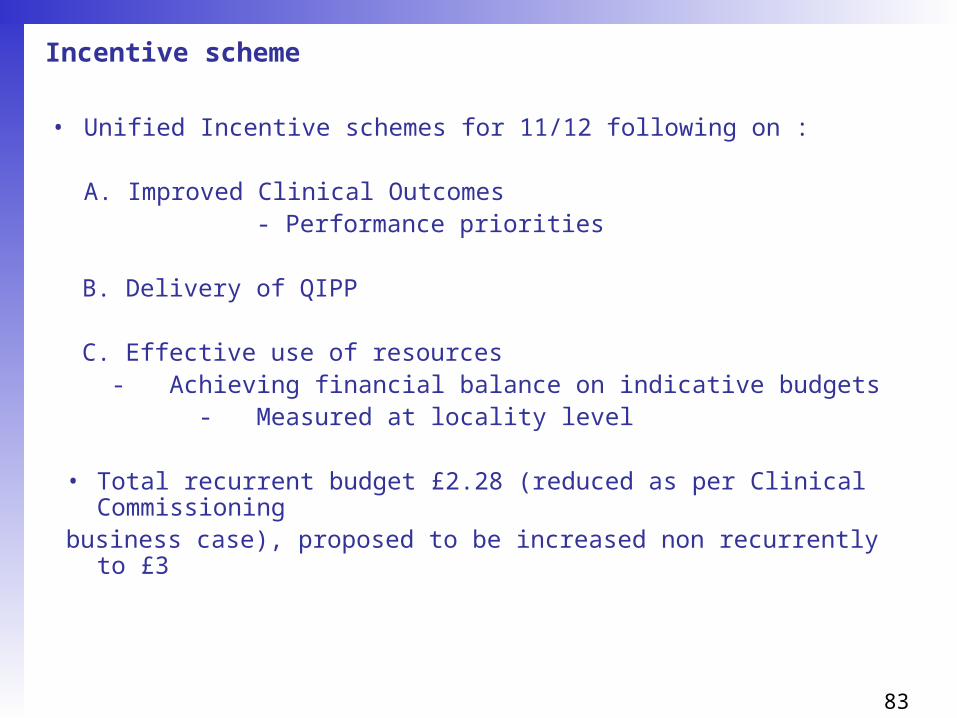
Incentive scheme
• Unified Incentive schemes for 11/12 following on :
A. Improved Clinical Outcomes - Performance priorities
B. Delivery of QIPP
C. Effective use of resources - Achieving financial balance on indicative budgets
- Measured at locality level
• Total recurrent budget £2.28 (reduced as per Clinical Commissioningbusiness case), proposed to be increased non recurrently to £3

84
Reporting
Proposed Reporting framework (in development)
1)Finance slide pack (Monthly)Overview of financial position, covering information and analysis of practice over spends/under spends.
2) Summary Variance report Practice level (Monthly)Covers the cost and activity variances at practice level & by different budget headings.
3) Practice level reports (Monthly)Reports at practice level containing detailed information by provider, point of delivery and specialty.
4) Backing Data (Monthly)We are planning to implement a web based reporting tool that will provide drill down to patient level data. Also, backing data at patient/practice level for these areas will be available to practices:
• In Health• Walk in Centre;• Non Contracted Activity;• Direct Access;• A&E.
5) Benchmarking pack (Quarterly)Activity and financial benchmarks and trends for each practice compared with others