Infrared Dichroism of Isotope-edited α-Helices and β-Sheets
15
Infrared Dichroism of Isotope-edited a-Helices and b-Sheets Derek Marsh Max-Planck-Institut fu ¨r biophysikalische Chemie Abteilung Spektroskopie 37070 Go ¨ttingen, Germany Isotope editing of amide infrared bands not only localises secondary structural elements within the protein but also yields conformational information that is not available from the linear dichroism of aligned samples without isotope editing. The additional information that can be derived on the orientational distribution of a-helices in membranes by the combined use of different amide bands and several positions of label- ling is presented here. Also, the relationship between the azimuthal orien- tation of the transition moment and the protein structure is treated explicitly. A comprehensive analysis of the infrared dichroism for b-sheets and b-barrels is given here, for the first time. The orientation of the indi- vidual transition moments in a b-sheet that is essential for this analysis is derived for the different amide bands. q 2004 Elsevier Ltd. All rights reserved. Keywords: a-helix; b-sheet; secondary structure; infrared; linear dichroism Introduction The linear dichroism of amide infrared (IR) bands from site-specifically isotope-labelled a-heli- cal transmembrane peptides has proved to be invaluable for conformational analysis of mem- brane proteins. 1–4 In addition to the orientational information available from non-isotopically edited dichroism, site-specific labels also yield torsion angles and are able to discriminate local ordering from macroscopic disorder. 5 The analysis for iso- topically labelled a-helices has been well developed, 5 although the relationship of transition moment orientation to the protein structure has not been fully worked out, particularly for the torsion angles. The latter is essential if the results from site-specific dichroism are to be most effectively combined with molecular modelling. 4 Also, the possibility of obtaining detailed information on the distribution of helical tilts, especially in polytopic proteins, remains to be exploited fully. As for non-isotopically edited dichroism, the application of site-specific labelling to b-sheet proteins lags behind that for a-helical proteins. The possibility of investigating lung surfactant protein B on lipid monolayers by IR reflection – absorption spectroscopy, however, seems extremely promising. 6 An analysis of the dichroism for non-isotope-labelled (or uniformly labelled) b-sheets has been given previously. 7 In the latter case, the net IR transition moments are oriented either along or perpendicular to the b-strand axis. For isolated isotopically edited amides, however, the orientation of the individual transition moments and the relation to the structure of the b-pleated sheet should be con- sidered. Use of several amide bands is even more necessary than for the a-helix, because only two labelling positions give non-degenerate dichroic ratios in a b-sheet. Here, we present a comprehensive analysis of the IR dichroism of site-specifically isotope- labelled amides for a-helices, b-sheets and b-barrels. The analysis for a-helices goes beyond the previous treatment 5 in that different amide bands, and the relation between azimuthal orientation of the transition moment and the pro- tein structure (i.e. torsion angles), are considered explicitly. Isotope edited IR dichroism of b-sheet or b-barrel structures, has not been treated before, although a limited amount of experimental data is available. 8 Further, we also consider the possibility of distributions in tilt and azimuthal orientation of the secondary structure by using explicit models. This is likely to be of considerable importance for 0022-2836/$ - see front matter q 2004 Elsevier Ltd. All rights reserved. E-mail address of the corresponding author: [email protected] Abbreviation used: ATR, attenuated total reflection. doi:10.1016/j.jmb.2004.02.061 J. Mol. Biol. (2004) 338, 353–367
-
Upload
derek-marsh -
Category
Documents
-
view
212 -
download
0
Transcript of Infrared Dichroism of Isotope-edited α-Helices and β-Sheets

Infrared Dichroism of Isotope-edited a-Helicesand b-Sheets
Derek Marsh
Max-Planck-Institut furbiophysikalische ChemieAbteilung Spektroskopie37070 Gottingen, Germany
Isotope editing of amide infrared bands not only localises secondarystructural elements within the protein but also yields conformationalinformation that is not available from the linear dichroism of alignedsamples without isotope editing. The additional information that can bederived on the orientational distribution of a-helices in membranes bythe combined use of different amide bands and several positions of label-ling is presented here. Also, the relationship between the azimuthal orien-tation of the transition moment and the protein structure is treatedexplicitly. A comprehensive analysis of the infrared dichroism for b-sheetsand b-barrels is given here, for the first time. The orientation of the indi-vidual transition moments in a b-sheet that is essential for this analysis isderived for the different amide bands.
q 2004 Elsevier Ltd. All rights reserved.
Keywords: a-helix; b-sheet; secondary structure; infrared; linear dichroism
Introduction
The linear dichroism of amide infrared (IR)bands from site-specifically isotope-labelled a-heli-cal transmembrane peptides has proved to beinvaluable for conformational analysis of mem-brane proteins.1 – 4 In addition to the orientationalinformation available from non-isotopically editeddichroism, site-specific labels also yield torsionangles and are able to discriminate local orderingfrom macroscopic disorder.5 The analysis for iso-topically labelled a-helices has been welldeveloped,5 although the relationship of transitionmoment orientation to the protein structure hasnot been fully worked out, particularly for thetorsion angles. The latter is essential if the resultsfrom site-specific dichroism are to be mosteffectively combined with molecular modelling.4
Also, the possibility of obtaining detailedinformation on the distribution of helical tilts,especially in polytopic proteins, remains to beexploited fully.
As for non-isotopically edited dichroism, theapplication of site-specific labelling to b-sheetproteins lags behind that for a-helical proteins.The possibility of investigating lung surfactant
protein B on lipid monolayers by IR reflection–absorption spectroscopy, however, seemsextremely promising.6 An analysis of thedichroism for non-isotope-labelled (or uniformlylabelled) b-sheets has been given previously.7 Inthe latter case, the net IR transition moments areoriented either along or perpendicular to theb-strand axis. For isolated isotopically editedamides, however, the orientation of the individualtransition moments and the relation to thestructure of the b-pleated sheet should be con-sidered. Use of several amide bands is even morenecessary than for the a-helix, because only twolabelling positions give non-degenerate dichroicratios in a b-sheet.
Here, we present a comprehensive analysis ofthe IR dichroism of site-specifically isotope-labelled amides for a-helices, b-sheets andb-barrels. The analysis for a-helices goes beyondthe previous treatment5 in that different amidebands, and the relation between azimuthalorientation of the transition moment and the pro-tein structure (i.e. torsion angles), are consideredexplicitly. Isotope edited IR dichroism of b-sheetor b-barrel structures, has not been treated before,although a limited amount of experimental data isavailable.8 Further, we also consider the possibilityof distributions in tilt and azimuthal orientation ofthe secondary structure by using explicit models.This is likely to be of considerable importance for
0022-2836/$ - see front matter q 2004 Elsevier Ltd. All rights reserved.
E-mail address of the corresponding author:[email protected]
Abbreviation used: ATR, attenuated total reflection.
doi:10.1016/j.jmb.2004.02.061 J. Mol. Biol. (2004) 338, 353–367
single membrane-spanning helices and smallmonomeric b-barrels.
Results and Discussion
Infrared dichroic ratios
We consider specifically aligned membranes,where the proteins are rotationally disorderedabout the membrane normal which is defined asthe z-axis. The dichroic ratio, Rz; of the absorbanceswith radiation linearly polarized parallel with andperpendicular to the plane of incidence is thengiven by:7
Rz ¼E2
x
E2y
þE2
z
E2y
kM2zl
kM2yl
ð1Þ
where E ¼ ðEx;Ey;EzÞ is the radiation electric fieldvector in the sample, the components of which arenormalized to those at incidence. The componentsof E are specific to the particular experimental set-up, e.g. attenuated total reflection (ATR) or trans-mission at non-zero angles of incidence.9 Thex-axis is defined as lying in the plane of incidenceand the y-axis is orthogonal to the plane of inci-dence. Both lie within the plane of the orientingsubstrate. The quantity of structural interest in dis-cussing linear dichroism is the transition momentvector, M ¼ ðMx;My;MzÞ: Specifically, the quan-tities in angular brackets in equation (1) representsummations over the squares of the transitionmoment components for all isotopically labelledamide groups in the sample. Because these appearas a ratio in equation (1), the angular brackets areequivalent to taking average values. The problem,therefore, resolves itself into determining thedependence of kM2
zl=kM2yl on the angular orien-
tation of the isotopically labelled amide. Thisdiffers between various amide bands because ofdifferent orientations of the transition momentrelative to the molecular axes.
Transition moment orientation
It is assumed that the vibrations of the isotopi-cally labelled amide are decoupled from those ofthe other amides in the polypeptide chain. Theorientation of the transition moment then does notcorrespond to one of the symmetry directions, asfor instance in coupled vibrations of b-sheets.10
Further, because we are dealing with an isolatedlabelled residue, there is no possibility of sum-mation over residues yielding axial symmetry, asis the case for long a-helices.11 The orientation of
the individual transition moment, M, relative tothe peptide chain axis, therefore depends on both
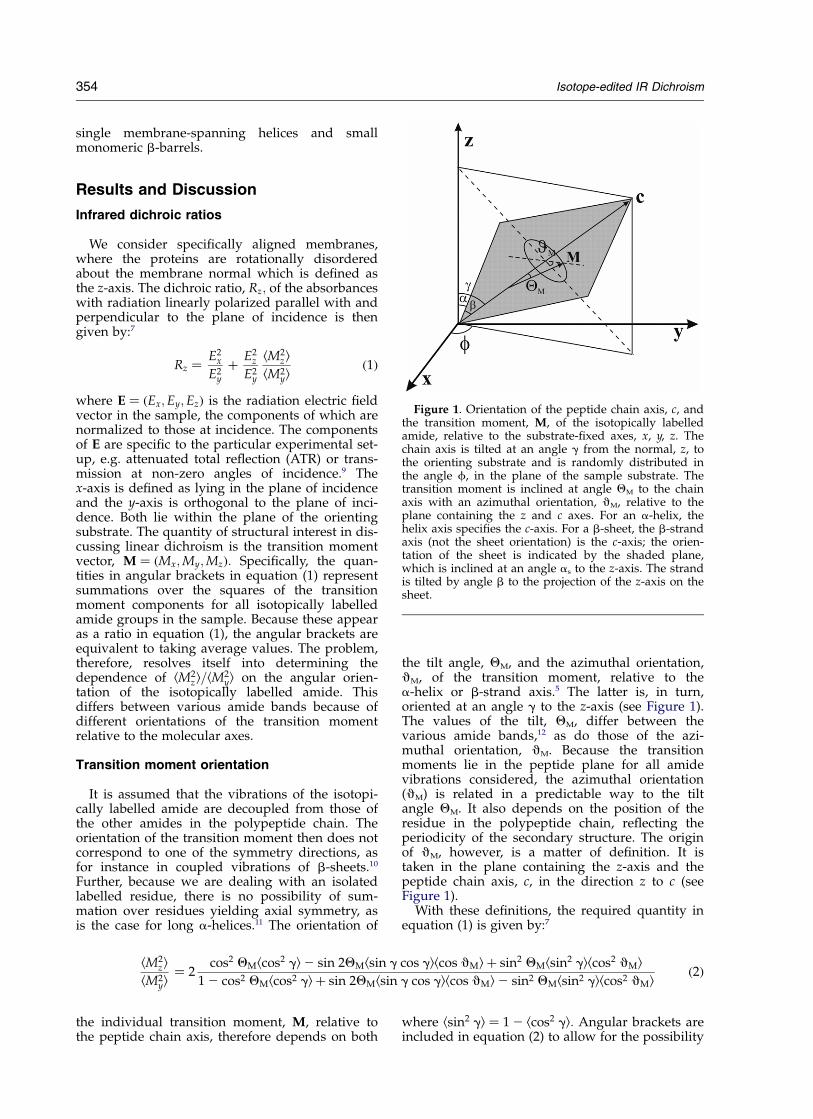
the tilt angle, QM, and the azimuthal orientation,qM, of the transition moment, relative to thea-helix or b-strand axis.5 The latter is, in turn,oriented at an angle g to the z-axis (see Figure 1).The values of the tilt, QM, differ between thevarious amide bands,12 as do those of the azi-muthal orientation, qM. Because the transitionmoments lie in the peptide plane for all amidevibrations considered, the azimuthal orientation(qM) is related in a predictable way to the tiltangle QM. It also depends on the position of theresidue in the polypeptide chain, reflecting theperiodicity of the secondary structure. The originof qM, however, is a matter of definition. It istaken in the plane containing the z-axis and thepeptide chain axis, c, in the direction z to c (seeFigure 1).
With these definitions, the required quantity inequation (1) is given by:7
where ksin2 gl ¼ 1 2 kcos2 gl: Angular brackets areincluded in equation (2) to allow for the possibility
Figure 1. Orientation of the peptide chain axis, c, andthe transition moment, M, of the isotopically labelledamide, relative to the substrate-fixed axes, x, y, z. Thechain axis is tilted at an angle g from the normal, z, tothe orienting substrate and is randomly distributed inthe angle f, in the plane of the sample substrate. Thetransition moment is inclined at angle QM to the chainaxis with an azimuthal orientation, qM, relative to theplane containing the z and c axes. For an a-helix, thehelix axis specifies the c-axis. For a b-sheet, the b-strandaxis (not the sheet orientation) is the c-axis; the orien-tation of the sheet is indicated by the shaded plane,which is inclined at an angle as to the z-axis. The strandis tilted by angle b to the projection of the z-axis on thesheet.
kM2zl
kM2yl
¼ 2cos2 QMkcos2 gl2 sin 2QMksin g cos glkcos qMlþ sin2 QMksin2 glkcos2 qMl
1 2 cos2 QMkcos2 glþ sin 2QMksin g cos glkcos qMl2 sin2 QMksin2 glkcos2 qMlð2Þ
354 Isotope-edited IR Dichroism

of a limited distribution in the values of g and qM.Note that g and qM are independent, and QM isfixed for a given amide band.
In general, for a distribution in the angles g andqM, several different angular averages are requiredto specify the values of kM2
zl=kM2yl fully, as pointed
out for the case of polytopic proteins.11 These arethe four independent values: kcos2 gl; ksin g cos gl;kcos2 qMl and kcos qMl: If g and qM are single-valued, this number is reduced to two. Then twoindependent dichroic ratios are required to deter-mine the amide orientation, similar to the caseconsidered previously for b-sheet proteins.7 Thesecan be provided by measurements on a singleband at two different positions of isotopic label-ling, where g and QM remain fixed and the valuesof qM bear a fixed relation to one another that isdetermined by the geometry of the secondarystructure.5 Alternatively, dichroic ratios fromdifferent bands may be combined for a single siteof labelling. In this latter case, g is fixed, the differ-ent values of QM, e.g. from the amide I and amideII, or amide A bands, are known,12 and the valuesof qM are related to one another in a fixed way viathose of QM (see later). However, resolution of theisotopically edited amide band may not beachieved with the same isotope for differentamide vibrational modes. Labelling of the 13CvOhas been shown to be suitable for the amide Iband;1,2,5 but 15N–H labelling will be required forthe amide II and amide A bands. In principle,there are 18 distinguishable azimuthal orientationsfor a given amide transition moment in an a-helix,but only two in a b-strand. However, it is likelythat maximally seven adjacent amides in ana-helix have azimuthal angles that are sufficientlywidely spaced to be practically useful.2
In addition to the dichroic ratios for the iso-topically labelled amides, further independentmeasurements are provided by the dichroism ofthe non-isotopically labelled amides.5 For a-helices,dichroic ratios of the latter do not depend on theazimuthal orientation, qM. For b-sheets, on theother hand, the orientations of the transitionmoments of the coupled modes are different,being directed either along or perpendicular to theb-strand axis.7
The treatment differs for a-helices and b-sheets,because of their different geometries. The formeris the more straightforward and is consideredfirst. It has been treated by Arkin et al.,5 but isgiven here as introduction to the consideration notonly of b-sheets but also of the relations betweenthe different amide bands of an a-helix, andfurther as an introduction to explicit treatments ofdistributions in orientation of a-helix assemblies.
a-Helices: single orientations
The situation depicted in Figure 1 is relatedstraightforwardly to the geometrical arrangementof single, bitopic transmembrane helices and ofpolytopic helix bundles. The angle g is the tilt of
the helix axis to the z-axis, and qM is the azimuthalor torsion angle of the transition moment of theisotopically labelled amide about the helix axis.The direction of the c-axis is that going from the Nto the C terminus of the (right-handed) a-helix.A right-handed rotation, defined as positive qM,then takes Ca,i to Ca,iþ1. With this definition, thetransition moment makes an acute angle, QM, withthe c-axis (note that this standard definition isdifferent from the convention used by Arkinet al.5). For consecutive positions of labelling in anideal a-helix with 3.6-residue pitch, the values ofthe azimuthal angle qM are related by incrementalrotations of þ1008 about the helix axis. Equation(2) is therefore applicable directly to a-helices.This case has been considered by Arkin et al.,5 forfixed values of g and qM. Equations (1) and (2) arein agreement with the previous treatment, exceptfor an additional angle d that was included but
Figure 2. Dependence of the dichroic ratio, RM, of asite-specifically labelled a-helix on the azimuthal orien-tation, qM, of the isotopically labelled amide for differentinclinations, g, of the helix axis to the membrane normal.Dependences are calculated from equations (1) and (2)and are given for: A, the amide I band (QI ¼ 388); B, theamide II band (QII ¼ 738); and C, the amide A band(QA ¼ 298). The values of g are indicated in the Figure.The ordinate is scaled and shifted by the ratios of thecomponents of the radiation electric field intensities,E2
y=E2z and E2
x=E2z ; respectively, to give values of
kM2zl=kM
2yl (see equation (2)) that are independent of the
particular experimental set-up. Vertical bars indicate therange of a 10% error in dichroic ratio. For a givenlabelled residue, the values of qM, relative to those ofthe amide I band, are displaced by 248 to 268 and þ18to þ38 for the amide II and amide A bands, respectively.
Isotope-edited IR Dichroism 355

put equal to zero by the latter authors. Note thatthe sign of the middle term in the denominatorand numerator of equation (2) is determined by thatof kcos qMl: All other terms in equation (2) arepositive (excluding the signs specified explicitly).
The dependence of kM2zl=kM
2yl on the azimuthal
orientation, qM, of the isotopically labelled amideis given in Figure 2 for various values of the tilt, g,of the helix axis to the membrane director ðzÞ:Dependences are given for the amide I, amide IIand amide A bands, by using the following valuesfor the orientation of the transition moment: QI ¼388; QII ¼ 738 and QA ¼ 298:12 It is clear fromequation (2) that the values of kM2
zl=kM2yl have a
3608 periodicity in qM. They are, however, reflectedabout the qM ¼ 1808 axis. Values corresponding toqM and 3608 2 qM are indistinguishable. There is a1808 periodicity in the tilt angle g, but values ofkM2
zl=kM2yl for 1808 2 g and 1808 2 qM are identical
with those for g and qM. Therefore, with suitablesubstitutions, Figure 2 covers the full range of qM
and g.For zero tilt (i.e. g ¼ 08), the dichroic ratios are
independent of the azimuthal angle qM, becauseof the rotational disorder in the plane of the mem-brane. Then kM2
zl=kM2yl has the constant value:
2cot2 QM: In general, the dichroic ratio is notnecessarily a monotonic function of qM for a fixedvalue of g. However, dichroic ratios above a certainthreshold value in g are unique within the rangeqM ¼ 0– 1808: Only for g ¼ 908 (e.g. a surfacehelix), is the dependence on azimuthal orientationsymmetric about qM ¼ 908: The largest dichroismis obtained with qM ¼ 1808; for a fixed helix tiltangle. Then amongst the different tilt angles, thelargest dichroism is obtained for values in theregion of g , QM: This illustrates one of the advan-tages of using complementary amide bands.Comparing Figure 2A and B, it can be seen thatthe amide II band gives much better discriminationbetween high tilt angles at low values of qM thandoes the amide I band. The vertical bars in Figure2, and subsequent Figures, indicate the range of a10% error in dichroic ratio (at this level, differencesbetween thick and thin film approximations for theevanescent field intensity or between ATR crystalsare relatively unimportant). This gives some indi-cation of the degree of discrimination that can beobtained in practice. For g ¼ QM; and qM ¼ 1808;the dichroic ratio diverges, because (assuming aunique orientation) the transition moment isthen oriented exactly along the z-axis. In contrastto the situation for axial summation over thewhole helix, very high dichroism may beachieved in principle for a single isotopicallylabelled amide.
Azimuthal orientation in an a-helix
In Figure 2, the values of the azimuthal angle,qM, for the different amide bands have, for sim-plicity, been treated as independent. As alreadymentioned, however, they bear a fixed relation to
one another. Whenever dichroic ratios of differentamide bands are combined, the relative values forqM must be included explicitly. Most importantly,such considerations are also essential if theazimuthal orientation of the transition momentis to be related to the geometry of the molec-ular structure (i.e. to the peptide carbonylorientation).
The transition moments of the amide I, amide IIand amide A modes lie in the peptide plane andare tilted relative to the carbonyl group in a direc-tion away from the nitrogen atom.13 The angularrelations of the peptide group and its transitionmoment to the helix axis are given in Figure 3.The peptide plane is inclined at an angle ah to thehelix axis and the peptide carbonyl is tilted by anangle QC0O to the helix axis. From the refined coor-dinates of a-poly-L-alanine: ah ¼ 6:18 and QC0O ¼14:28; and from an energy-refined structure of astandard right-handed a-helix: ah ¼ 3:38 andQC0O ¼ 14:88:12 The azimuthal orientation, q0
M; ofthe transition moment in the peptide axis systemis defined as the angle that the plane containingthe transition moment and helix axis makes withthat containing the helix axis and its orthogonalwithin the peptide plane (see Figure 3). This is
Figure 3. Azimuthal orientations, q0M and q0
C0O, of theamide transition moment (M) and peptide carbonylbond (CvO), respectively, in the peptide axis system.The peptide plane is shown shaded and is inclined atan angle ah to the helix axis. The transition moment andCvO bond are tilted at angles QM and QC0O, respectively,to the helix axis. The view is from outside a right-handeda-helix, where the helix axis is directed from the Nterminus to the C terminus.
356 Isotope-edited IR Dichroism

given by:
sin q0M ¼
tan ah
tan QMð3Þ
and a similar equation relates the azimuthal angle,q0
C0O; of the peptide carbonyl to its orientationQC0O to the helix axis. The azimuthal orientationof the transition moment relative to that of thepeptide carbonyl bond is then given simply byq0
M 2 q0C0O: This angle is negative (with c directed
from the N to the C terminus) because the transitionmoment is tilted to the carbonyl bond in a directionaway from the peptide nitrogen atom (see Figure 3).From equation (3) and its equivalent for the pep-tide CvO bond, the values of q0
M 2 q0C0O for the
amide I, amide II and amide A bands are given inTable 1. The values of QM given above,12 and thoseof the peptide orientation from the a-poly-L-ala-nine (or standard a-helix) coordinates are used toobtain these data. Clearly, the choice of helix-struc-ture coordinates introduces some uncertainty inthe absolute value of the azimuthal orientation.However, the differences between amide bands,viz. 268 (238) and þ38 (þ28) for the amide II andamide A bands, respectively, relative to the amideI band, are specified with better precision.
Finally, the azimuthal orientation, qM, defined inFigure 1 is given by: qM ¼ qC0O þ q0
M 2 q0C0O;
where qC0O is the azimuthal orientation of the pep-tide carbonyl bond relative to the z–c plane. Thelatter is the quantity of direct structural interestand can be obtained from the infrared dichroismmeasurements of qM to within the uncertainty inthe values of q0
M 2 q0C0O mentioned above.
A quantity of ancillary interest is the tilt orien-tation, uC0O; of the peptide carbonyl bond to thez-axis. This has been used in structure refinementby molecular dynamics simulations that arerestrained with uC0O obtained from infrared dichro-ism measurements as the target value.1,2 From thegeometry in Figures 1 and 3, and the relations
given above for the azimuthal orientation of thetransition moment:
cos uC0O ¼ cos g cos QC0O 2 sin g sin QC0O
£ cosðqM 2 q0M þ q0
C0OÞð4Þ
where the argument of the final cosine term is theazimuthal orientation qC0O of the peptide carbonylrelative to the z–c plane. Equation (4) expressesthe desired target angle, uC0O; in terms of thevariables g and qM accessible from experimentand the fixed values QC0O; q
0C0O and q0
M (cf. equation(3)). It differs from the target angle (given by Kukol& Arkin)2 because here the relative orientations ofthe transition moment and peptide carbonyl bondare treated exactly. In unfavourable circumstances,the difference can be quite appreciable.
Combination of a-helix amide bands
As already mentioned, interpretation of the helixdichroism requires at least two independentdichroic ratios, even under the assumption of
Table 1. Tilt, QM, and azimuthal orientation, q0M, of the
transition moments, M, of the amide bands for a-helicesand anti-parallel b-sheets
Banda-Helix b-Sheet
QM (8)a q0M 2 q0
C0O (8)b QM (8)c q0M (8)d
Amide I 38 217 (28) 73 ^ 3 9 ^ 2Amide II 73 223 (212) 29 ^ 3 63 ^ 10Amide A 29 214 (27) ,77–78e ,6–7e
a Experimental values from Marsh et al.12
b Values relative to those of the peptide CvO bond (seeFigure 3) calculated from equation (3). Values are obtainedusing the peptide orientation of a-poly-L-alanine and (in par-entheses) an energy refined right-handed a-helix.12
c Values calculated from equation (22), using data fromAppendices A and B.
d Values likewise calculated from equation (23) and referredto the a-axis joining equivalent Ca atoms of adjacent strands(see Figure 7).
e These values are subject to some uncertainty (seeAppendix B).
Figure 4. Relations between the dichroic ratios of:A. The amide I (RI) and amide II (RII) bands, and B. Theamide A (RA) and amide II (RII) bands, for a single pos-ition of isotopic labelling in an a-helix. The dichroicratios are scaled and shifted by E2
y=E2z and E2
x=E2z ; respec-
tively, to give values of kM2zl=kM
2yl (see equation (2)) that
are independent of the particular experimental set-up.Vertical bars indicate the range of a 10% error in dichroicratio. The values of qM for the amide II band are dis-placed by 258 relative to the amide I band in A, and by278 relative to the amide A band in B, in thesecalculations.
Isotope-edited IR Dichroism 357
fixed values for the angular orientations g and qM.This is illustrated in Figure 4, by combination ofthe dichroic ratios of the different amide bands fora single position of isotopic labelling. The dichroicratio of the amide I or amide A band is plottedagainst that of the amide II band for fixed valuesof the helix tilt, g. These relations cover the wholerange of azimuthal orientations of the helix fromqM ¼ 08 to qM ¼ 1808 (cf. Figure 2) and includethe relative offsets in qM between the differentamide bands that are obtained from Table 1. It isseen that a given combination of dichroic ratiosfrom two amide bands is determined uniquely.This, therefore, specifies the required combinationof orientations g and qM. Note that the relationbetween two dichroic ratios, in general, has twolimbs for a given value of g (in the region x , 1),but this does not give rise to ambiguities. As statedpreviously, resolution of the various isotopicallylabelled amide bands for a single residue mayrequire the use of more than one isotope.
For low tilt angles, g # 308; the amide A dichro-ism is greater than that of the amide I band and
therefore could be combined advantageously withamide II dichroic measurements. As already notedin connection with Figure 2, for large tilt anglesand low values of qM (g . 608 and qM , 508) theamide II dichroism is greater than that of theamide I band. Under the latter circumstances, com-bination of amide I and amide II bands for a singleposition of isotope labelling is likely to performbetter than combination of amide I dichroic ratiosfor two adjacent isotopic labelling positions.Such situations cannot readily be decided a priori,but it is clear from Figure 4 that combination ofdifferent amide bands potentially adds flexibilityto site-directed dichroism studies.
Distribution of helix orientations
In general, the orientation of the transmembranehelix, or helix assembly, may not be single-valued,but rather may have a limited angular distribution.The case of a distribution in the helix tilt, g, isconsidered first. Two situations may be distin-guished: that of a single bitopic transmembrane
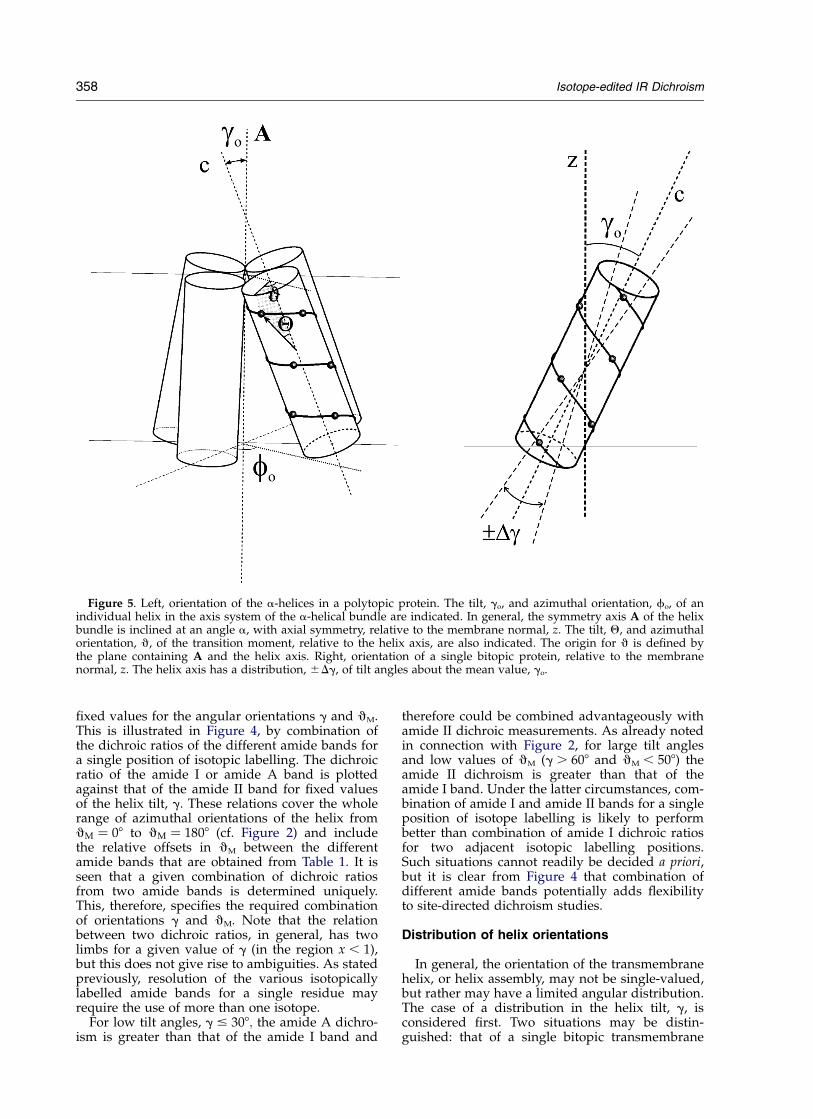
Figure 5. Left, orientation of the a-helices in a polytopic protein. The tilt, go, and azimuthal orientation, fo, of anindividual helix in the axis system of the a-helical bundle are indicated. In general, the symmetry axis A of the helixbundle is inclined at an angle a, with axial symmetry, relative to the membrane normal, z. The tilt, Q, and azimuthalorientation, q, of the transition moment, relative to the helix axis, are also indicated. The origin for q is defined bythe plane containing A and the helix axis. Right, orientation of a single bitopic protein, relative to the membranenormal, z. The helix axis has a distribution, ^Dg, of tilt angles about the mean value, go.
358 Isotope-edited IR Dichroism

helix, and that of a polytopic transmembrane helixbundle.
For a transmembrane helix bundle, the constitu-ent a-helices will individually have a fixed tilt, go;and a fixed azimuthal orientation, fo; relative tothe symmetry axis, A; of the helix assembly (seeFigure 5, left panel). The latter is taken to beoriented at an angle a to the membrane normal, z.The angle, g, that the helix axis makes with thez-axis is then given by:
cos g ¼ cos go cos aþ sin go sin a cosðfo 2 faÞ ð5Þ
where fo and fa are the azimuthal orientations ofthe helix axis and of the z-axis, respectively, aboutthe axis of the helix assembly. Because the latter isaxially distributed about the z-axis, the azimuthalangle fa must be integrated over the full rangefrom 0 to 2p. For cos2 g this gives (independent offo):
kcos2 gl ¼ cos2 go 21
3
� �kP2ðcos aÞlþ
1
3ð6Þ
where kP2ðcos aÞl is the order parameter of thehelix bundle and angular brackets indicate inte-gration over a. Equation (6) is consistent with theaddition theorem for Legendre polynomials,where kP2ðcos aÞl ¼ 1
2 ð3kcos2 al2 1Þ: The simplestmodel is to assume that a has a single fixed value.The next simplest model is one in which thesymmetry axis is randomly distributed within acone of amplitude ao and has an order parametergiven by:
kP2ðcos aÞl ¼1
2cos aoð1 þ cos aoÞ ð7Þ
Both models, therefore, depend on only a singleparameter, either the fixed tilt a, or the angularamplitude ao:
The other angular average over g that is requiredfor equation (2) is that of sin g cos g which is givenby:
ksin g cos gl ¼
ða0
0
ð2p
0
cos gffiffiffiffiffiffiffiffiffiffiffiffiffiffiffiffiffiffiffiffiffiffi1 2 cos2 g
psin a dfa da
2pð1 2 cos aoÞ
ð8Þ
where cos g is given by equation (5). This integralis independent of fo and is most convenientlyevaluated numerically. The dependence on theamplitude ao of the cone in which the symmetryaxis is randomly distributed is given in Figure 6A,for different values of go: For the simpler model inwhich a is fixed, the integral over sin a da inequation (8) can be omitted. The resulting depen-dence of ksin g cos gl on the fixed value of a isgiven in Figure 6B.
A single bitopic transmembrane helix also mayhave a non-zero tilt relative to the membranenormal. This can arise because the hydrophobicspan of the protein may be greater than the hydro-phobic thickness of the lipid membrane. Addition-
ally, the anchoring residues at the ends of thehelix may not be situated at the same level acrossthe diameter of the helix, which again wouldfavour a tilted structure. In this case, it is morelikely that the spread in g will be centred aboutthe local mean tilt go; rather than about the mem-brane normal (see Figure 5, right panel). A possibleway to model this is to consider a random distri-bution within cones of angles go ^ Dg; where Dgpgo: The angular averages in equation (2) then takethe form:
kcos2 gl ¼
ðgoþDg
go2Dg
cos2 g sin g dg
ðgoþDg
go2Dg
sin g dg
ð9Þ
Figure 6. Dependence of the average value ofksin g cos gl on: A, the maximum angular amplitude ao
of the limited random distribution in orientation of thehelix bundle axis; or on B, the fixed tilt a of the helixbundle axis, according to equations (5) and (8). Numeri-cal integrations are given for different values of the indi-vidual helix tilt, go, as indicated. Continuous lines are forgo # 408 and broken lines for go . 408. For go ¼ 908, thevalue is zero independent of ao, or a.
Isotope-edited IR Dichroism 359

for example. On performing the integrations, thefollowing results are obtained:
kcos2 gl ¼ cos2 go cos2 Dgþ1
3sin2 go sin2 Dg ð10Þ
ksin g cos gl ¼ ðsin2 go cos2 Dgþ1
3cos2 go sin2 DgÞ=tan go
ð11Þ
In both cases, for either bitopic or polytopica-helical proteins, two parameters (go; and ao orDg) are required to specify the required averagesover the tilt angle in equation (2). Even for theserelatively simple models, the averages kcos2 gl andksin g cos gl are not uniquely related by a singleparameter. In consequence, at least three indepen-dent dichroic ratios (either from different amidebands or different sites of labelling) are needed inthe case of a distribution in tilt angles.
The situation is slightly simpler for a singlebitopic transmembrane helix that matches thehydrophobic span of the lipid membrane.A reasonable model in this case is that the helixaxis is randomly distributed about the g ¼ 0 orien-tation, within a cone of semi-angle Dg. The angularaverages over the tilt g are then given by:
kcos2 gl ¼1
3ðcos2 Dgþ cos Dgþ 1Þ ð12Þ
and:
ksin g cos gl ¼1
3sin Dgðcos Dgþ 1Þ ð13Þ
These depend upon a single parameter Dg, viz. theamplitude of the distribution.
For a polytopic a-helical membrane protein, theazimuthal orientations of the constituent helicesare fixed by the tertiary structure of the helixbundle. In this case, the azimuthal orientation, qM,is single-valued. For a single, bitopic transmem-brane helix, some limited distribution in azimuthalorientation may be allowed within the membrane.The simplest model is a random distributionwithin the range qM ¼ qo ^ Dq: The angularaverages then take the form, e.g.:
kcos2 qMl ¼
ðqoþDq
qo2Dq
cos2 q dq
ðqoþDq
qo2Dq
dq
ð14Þ
and the values required in equation (2) are:
kcos2 qMl ¼1
21 þ
cos 2qo sin Dq cos Dq
Dq
� �ð15Þ
and:
kcos qMl ¼cos qo sin Dq
Dqð16Þ
Again, two parameters, qo and Dq, are required.The total number of independent dichroic ratiosneeded to specify the system fully, then reaches its
maximum value of four (for a perfectly orderedsample).
Contributions from membrane disorder
A further contribution to the distribution in tiltangle, g, and in azimuthal orientation, qM, comesfrom the possible presence of disordered regionsin the sample. For parts of the sample that arecompletely disordered, the membrane normal(and correspondingly the tilt of the helix axes) israndomly distributed relative to the z-axis, i.e. tothe normal to the orienting substrate. Similarly,the origin of the azimuthal orientation, qM, whichis defined by the plane containing the z- andc-axes, will be randomly distributed relative to theorienting substrate. Thus, for such non-orientedregions kcos2 gl ¼ 1=3; ksin g cos glkcos qMl ¼ 0and ksin2 glkcos2 qMl ¼ 1=3 from equations (6), (8),(15) and (16), and Figure 6. If the fraction of samplethat is (completely) disordered is (1 2 f), the angu-lar averages in equation (2) for the total samplebecome:
kcos2 gl ¼ f kcos2 glo þ ð1 2 f Þ=3 ð17Þ
ksin g cos glkcos qMl ¼ f ksin g cos glokcos qMlo ð18Þ
and:
ksin2 glkcos2 qMl
¼ f ksin2 glokcos2 qMlo þ ð1 2 f Þ=3 ð19Þ
where the subscript o refers to the oriented part ofthe sample.
It follows from equations (17) and (19) that thefractions, f, of oriented sample act as an “orderparameter” that would simply scale those of thehelix axis in the case of axial symmetry.11 For com-pletely axial symmetry, sample disorder cannot,therefore, be separated from the orientation of thehelix axis (see equation (2)). This is not the case,however, for isotopically edited amides. Combi-nation of equations (6), (8) and equations (15), (16)with equations (17)–(19) shows that, in principle,sample disorder can readily be distinguished froman intrinsic limited distribution in the orientationalangles. However, because maximally four inde-pendent angular averages can be obtained fromdichroic ratio measurements (see equation (2)),this would require that one of the two angularparameters g or qM must be fixed. From thediscussion above, it seems most appropriate toassume that qM is single-valued. The case of apartially unoriented sample, in the absence ofangular distributions in both g and qM, has beenconsidered.5
Practical examples
Dichroic measurements of the amide I band havebeen made on 13C-isotopically labelled amides inthe transmembrane segment of glycophorin A.5
360 Isotope-edited IR Dichroism

A sufficient number of isotopic labels (G84, V85and G86) was used such that, together with thenon-isotopically labelled species, there was redun-dance in determination of the helix orientation,even allowing for sample disorder. A similaranalysis of these data, but allowing for the possi-bility of a distribution in helix angles according toequations (1), (2) and (17)–(19), yields values forkcos2 gl and ksin g cos gl; respectively, of 0.62 and0.31, using QI ¼ 388 (see Table 1). The correspond-ing single values obtained for the azimuthalorientation, qM, and degree of alignment, f, aresimilar to those reported in the originalpublication. The values of the two order par-ameters kcos2 gl and ksin g cos gl are not entirelyconsistent with a single unique value for the helixtilt, g. The dichroic ratios are fit somewhat betterby a model of random distribution within a coneof semi-angle Dg < 448 (from equations (12) and(13), together with equations (1), (2) and(17)–(19)), than by a fixed optimum tilt of 298. Forisotopically labelled residues I41, G43 and V44 inthe regular part of the transmembrane helix ofCD3-z from the T-cell receptor,3 the helical tilt issmall and consequently no improvement in fittingthe dichroic ratios is obtained by considering a dis-tribution of tilt angles. From a practical point ofview, a redundancy in positions of labelling, anduse of more than one amide band, will improvethe experimental statistics in deciding betweenfixed orientations and orientational distributions.
b-Sheets and b-barrels
b-Sheet orientation
The situation is less straightforward for trans-
membrane b-sheets than for a-helices, because theangular variables given in equation (2) do notcorrespond so directly with the b-sheet geometry.As pointed out in previous work, the tilt angle gof the b-strand axis (i.e. the c-axis) is given by:7
cos g ¼ cos as cos b ð20Þ
where as is the angle by which the plane of theb-sheet is inclined to the z-axis and b is the tiltangle of the b-strand within the sheet (see Figure1). The origin for b is given by the projection ofthe z-axis on the plane of the sheet.
The azimuthal orientation, q, of the plane of thesheet, relative to the z–c plane is as givenpreviously:7
cos q ¼cos as sin bffiffiffiffiffiffiffiffiffiffiffiffiffiffiffiffiffiffiffiffiffiffiffiffiffiffiffiffiffiffiffiffiffiffiffiffiffiffi
1 2 cos2 as cos2 bp ð21Þ
where use has been made of equation (20). This isthe azimuthal orientation of an axis lying in theplane of the sheet that is orthogonal to the b-strandaxis (i.e. to the c-axis). In the local sheet coordinatesystem, this is defined as the a-axis (see Figure 7).
Transition moment orientation in a b-sheet
The transition moment, M, of an individual iso-topically labelled amide lies in the plane of thepeptide group. The latter does not coincide,however, with the plane of the b-sheet, because ofits pleated structure (see Figure 7). The peptideplane is inclined at an angle w with respect to thestrand axis, c. The individual transition moment istilted at an angle cM to the perpendicular axis, a,that lies within the plane of the sheet. The incli-nation of the transition moment, M, to the strand
Figure 7. Orientation of the transition moments of individual amide groups, i, in a b-pleated sheet. The transitionmoment, M, lies in the peptide plane, which is inclined at an angle w to the b-strand axis, c. The orthogonal a-axislies in the plane of the sheet and is defined by the intersection of the peptide planes. The transition moment makesan angle cM with the a-axis. Consecutive residues, i and i þ 1, have azimuthal orientations, q0
M, of opposite senserelative to the a-axis.
Isotope-edited IR Dichroism 361

axis, c, is therefore given by (see Figure 7):
cos QM ¼ cos w sin cM ð22Þ
The pleating angle of the b-sheet is w ¼ 258– 288;deduced from refined X-ray coordinates of b-poly-L-alanine and b-keratin (see Appendix A). For anti-parallel b-sheets, the orientations of the transitionmoments of the amide I, amide II and amide Abands are in the region of cI ¼ 198^ 38;cII ¼ 778^58 and cA , 148; respectively (see Appendix B).This then yields the values of QM for the orien-tation of the individual amide I, amide II andamide A transition moments in an antiparallelb-sheet that are listed in Table 1. The value for theamide A band is subject to some uncertainty (seeAppendix B), although it must lie reasonably closeto that for the amide I band.
The azimuthal orientation qM is determined bythat of the transition moment relative to the a-axis,i.e. q0
M (see Figure 7) and that of the a-axis, i.e.of the peptide plane, relative to the z-axis, i.e. q(see Figure 1). Within the b-sheet, the azimuthalorientation of the transition moment, relative tothe a-axis is given by (see Figure 7):
cos q0M ¼
cos cM
sin QM¼
cos cMffiffiffiffiffiffiffiffiffiffiffiffiffiffiffiffiffiffiffiffiffiffiffiffiffiffiffiffiffiffiffiffiffiffiffiffiffiffiffi1 2 cos2 w sin2 cM
p ð23Þ
where use has been made of equation (22). Withthe values of w and cM quoted above, this yieldsthe values of q0
M for the amide I, amide II andamide A bands that are listed in Table 1. Again,the values for the amide A band are subject tosome uncertainty.
b-Sheet dichroism
The azimuthal orientation of the transitionmoment, relative to the z–c plane, required inequation (2) is related to that of the b-sheet (i.e. q)by qM ¼ q^ q0
M: The alternation in sign comesfrom the two-residue periodicity in azimuthalorientation about the strand c-axis (see Figure 7)and corresponds to the 1808 relative orientationsof consecutive residues in a b-strand. Fromequation (21), the net azimuthal orientation of thetransition moment is therefore given by:
cos qM ¼cos as sin b cos q0
M 7 sin as sin q0Mffiffiffiffiffiffiffiffiffiffiffiffiffiffiffiffiffiffiffiffiffiffiffiffiffiffiffiffiffiffiffiffiffiffiffiffiffiffi
1 2 cos2 as cos2 bp ð24Þ
where q0M is obtained from equation (23). Substi-
tution from equations (20) and (22)–(24) intoequation (2) then gives the dependence of thedichroic ratio on the inclination as of the b-sheet,relative to the membrane normal, and on the tiltangle b of the b-strands within the b-sheet.
A compact form that gives the dependence ofkM2
zl=kM2yl on the orientational parameters, as and
b, of the b-sheet explicitly is:
Even if as and b are single-valued, two dichroicratios are required to specify the orientation andconformation of the b-sheet. This is already thecase for non-isotopically edited b-sheets7 exceptthat, as already noted, here different isotopes willbe required when isotopically edited data for theamide I and amide II bands are combined. A pos-sibly better alternative, therefore, is to combinedata from the same isotopic label on two consecu-tive residues. If there are non-singular distributionsin the angles as and b, the dichroic ratios of isoto-pically edited b-sheets depend on four parameters:kcos2 asl; kcos2 bl; kcos asl and kcos bl: This is nottrue in the non-isotopically edited case, where thedichroic ratios depend only on kcos2 asl andkcos2 bl: The distributions in as and b can be con-sidered as being independent, however, becausethe tilt of the sheets will not be correlated with thetilt of the strands within the sheets.
It should be pointed out that this treatment forb-sheets applies equally well to isotopically editedamides in b-barrels. Just as for a-helices consideredabove, there is no axial symmetry imposed by theb-barrel when considering only a single iso-topically labelled amide. In equations (20), (21),(24) and (25), the angle b is then the tilt of theb-strands relative to the barrel axis, and the angleas is the inclination of the barrel axis to themembrane normal.
b-Sheets: single orientations
For the amide I, amide II and amide A bands, thedependence of kM2
zl=kM2yl on the strand tilt b
within the sheet is given in Figure 8, for variousvalues of the inclination as of the b-sheet to themembrane normal. Correspondingly, the func-tional dependence of the dichroic ratio on the tilt,as; of the b-sheets is given in Figure 9 for fixedvalues of the strand tilt, b. The values of QM andq0
M given for b-sheets in Table 1 are used in thesecalculations. For as ¼ 908; the dichroic ratios areindependent of the strand tilt b, and kM2
zl=kM2yl
has the constant value: 2 sin2 QM sin2 q0M=
ð1 2 sin2 QM sin2 q0MÞ ¼ 0:046 ^ 0:022; 0.46 ^ 0.21
and ,0.02 2 0.03 for the amide I, amide II andamide A bands, respectively. Otherwise, it is clearfrom Figures 8 and 9 that the dependence of thedichroic ratio on the strand tilt b is very differentfrom that on tilt as of the b-sheet. For each combi-nation of as and b there are two possible values ofdichroic ratio, corresponding to the azimuthalorientations qM and qM þ 1808 of successive resi-dues. Therefore, single isotopic labelling of morethan two adjacent residues is redundant for aperfect b-sheet. Practically, single isotope labels atseveral positions are useful for mapping out theextent of the b-strand regions and for improvingstatistics. In addition, multiple labelling at all-odd
2kM2
ylkM2
zl¼
1
k½ðcos w sin cM cos b2 cos cM sin bÞcos as ^ sin w sin cM sin as�2l
2 1 ð25Þ
362 Isotope-edited IR Dichroism

or all-even residue positions would increase signal-to-noise in the isotope-edited region, provided thatthe labels are sufficiently well spaced in thesequence that there is no coupling between theirmodes. Results with a-helices double-labelled atpositions seven residues apart suggest little coup-ling between modes.2 In the latter case, the resi-dues are not so rigorously equivalent as theywould be in the b-sheet situation. For hydrophobicb-sheet peptides, some coupling has been detectedwith more closely spaced isotope labellingpositions.14
A striking feature of Figure 8 is the very lowsensitivity of the amide I (or amide A) dichroicratio to the lower range of strand tilts, b , 408: Inthis range, measurements of amide II dichroismare practically obligatory. Also, it appears from
Figure 9 that the amide II dichroism has superiorsensitivity at high values of the sheet tilt, as . 708:In the complementary regions of strand and sheettilt, the double entries for the amide I dichroicratios in Figures 8A and 9A indicate that goodsensitivity can be obtained by isotopic labelling attwo adjacent residue positions.
Distribution of b-sheet and b-strandorientations, and membrane disorder
Just as for a-helices, the orientation of theb-sheets or b-barrels, specified by the tilt, as; mayhave a distribution of values. A limited variationin the tilt, b, of the b-strands within the sheet orbarrel may also be possible. Expansion of equation(25) shows that a maximum of six order para-meters is required to allow for a general
Figure 8. Dependence of: A, the amide I dichroic ratio,RI ; B, the amide II dichroic ratio, RII ; and C, the amide Adichroic ratio, RA, of an isotopically edited residue on thetilt b of the b-strands in a b-sheet for various incli-nations, as, of the b-sheets to the membrane normal.The dependences are obtained from equations (1), (2),(20) and (24) with: A, QI ¼ 738, q0
I ¼ 98; B, QII ¼ 298,q0
II ¼ 638; and C, QA ¼ 778, q0A ¼ 68: The values of as are
indicated in the Figure. Each pair of lines with thesame pattern corresponds to a given value of as. In Aand C, the lower line of each pair corresponds to q0
M
and the upper to 2q0M and vice versa in B (cf. equation
(24)). The single continuous line is for as ¼ 08. Theordinate is scaled and shifted by the ratios of theradiation electric field intensities, E2
y=E2z and E2
x=E2z ,
respectively, to give values of kM2zl=kM
2yl (see equation
(2)) that are independent of the particular experimentalset-up. Vertical bars indicate the range of a 10% error indichroic ratio.
Figure 9. Dependence of: A, the amide I dichroic ratio,RI; B, the amide II dichroic ratio, RII; and C, the amide Adichroic ratio, RA, of an isotopically edited residue onthe tilt as of the b-sheet for various values of the strandtilt, b. The dependences are obtained from equations (1),(2), (20) and (24) with: A, QI ¼ 738, q0
I ¼ 98; B, QII ¼ 298,q0
II ¼ 638; and C, QA ¼ 778, q0A ¼ 68: The values of b are
indicated on the Figure. Each pair of lines with thesame pattern corresponds to a given value of b. In Aand C, the lower line of each pair corresponds to q0
M
and the upper to 2q0M, and vice versa in B (cf. equation
(24)). The continuous lines are for b ¼ 908 and also forb ¼ 08: The ordinate is scaled and shifted by the ratiosof the radiation electric field intensities, E2
y=E2z and
E2x=E2
z , respectively, to give values of kM2zl=kM
2yl (see
equation (2)) that are independent of the particularexperimental set-up. Vertical bars indicate the range of a10% error in dichroic ratio.
Isotope-edited IR Dichroism 363

distribution in both as and b. These are the distri-butional averages kcos2 asl; ksin as cos asl; kcos2 bl;ksin b cos bl; kcos bl and ksin bl: Only two inde-pendent dichroic ratios can be determined byisotopic labelling from a single amide band, in ab-sheet. One further independent dichroic ratiocan be determined from the same band for thecoupled mode of the non-isotopically labelledamides.7 Therefore, in the general case, it wouldbe necessary to combine measurements from mini-mally two modes, e.g. amide I, and amide II, bothfrom non-isotopically labelled amides and fromtwo (odd and even) positions of isotopic labelling.If the strand tilt, b, is assumed approximately tohave a single value, then only three parameters,kcos2 asl; ksin as cos asl and b are required todescribe the orientational distribution fully. In thiscase, one amide band with two positions of iso-topic labelling, together with the same band fromthe non-isotopically labelled amide, would be theminimum requirement. Alternatively, one positionof isotopic labelling, e.g. with 13C for the amide Iband, could be combined with dichroic ratiosfrom the amide I and amide II bands of the non-isotopic labelled sample.
Distributions in the sheet or barrel tilts, as, areanalogous to those for the orientation of a-helicalassemblies and can be described by similar models,i.e. the equivalents of equations (6)–(8) or (10) and(11). As for a-helices, however, this does not reducethe number of independent parameters required.The situation for the strand tilt, b, is analogous tothat discussed already for the azimuthal orien-tation, qM, of an a-helix. A similar model may beapplied. The tilt of the strand within the sheet isrestricted to a mean angle bo, with distributionwidth Db. Expressions equivalent to equations(15) and (16) then hold for kcos2 bl and kcos bl;respectively. The remaining order parameters,according to this model are then given by:
ksin b cos bl ¼sin 2bo sin 2 Db
4Dbð26Þ
and:
ksin bl ¼sin bo sin Db
Dbð27Þ
This model reduces the number of parametersrequired to describe the distribution in b-strandtilt from four to two.
If the aligned sample contains disorderedregions, then the measured dichroic ratiosdepend on the additional parameter, f, the frac-tion of sample that is aligned. The situation isexactly equivalent to that considered for a-helices.Combining equations (2), and (17)–(19), leadsto the following version of equation (25) forb-sheets:
Measurement of a further independent dichroicratio is then required, relative to the situationsconsidered above for ideally aligned samples, inorder to eliminate f.
Conclusion
The principal results obtained from this studymay be summarised as follows.
(1) If dichroic ratios are measured for morethan one position of isotopic labelling in ana-helix, together with the non-isotopic labelledamide, information can be obtained on the distri-bution of helix tilts, ah, as well as the azimuthalorientation, qM, of the transition moment. In thecase of sample disorder (characterised by f),more than two positions of isotopic labelling arerequired.
(2) The azimuthal orientation, qC0O, of the pep-tide carbonyl bonds in an a-helix is obtainedfrom the dichroism measurements of qM accord-ing to: qC0O ¼ qM 2 ðq0
M 2 q0C0OÞ: The required
values of ðq0M 2 q0
C0OÞ are given in Table 1. Ifdichroic ratios from different amide bands(using different isotopes) are combined, thevalue of qM must be incremented by the differ-ence in values of ðq0
M 2 q0C0OÞ between the differ-
ent bands. These increments in qM are 258 andþ38 for the amide II and amide A bands, respect-ively, relative to the amide I band.
(3) The tilt, uC0O; of the peptide carbonyl, rela-tive to the helix axis, is given by equation (4).This may be a suitable target function forrestrained molecular dynamics simulations thatincorporate IR dichroic data.
(4) The dichroism of isotopically labelledb-sheets or b-barrels is given by equations (1),(2) and (17)–(19) (or equivalently equations (1)and (28)). To interpret the dichroic ratios interms of molecular orientations, values arerequired for the orientation of the amide tran-sition moment in the b-sheet peptide. Thesevalues of QM and q0
M are given in Table 1(and see Appendix B). The molecularorientation is specified by the tilt, as, of thesheet (or barrel) and the tilt, b, of the strand inthe sheet. The angles as and b are related tothose determined directly from the dichroicratios (viz. g and qM in equation (2)) byequations (20) and (24).
(5) For isotopically labelled amides in b-sheets,the molecular orientation is characterised bymaximally six order parameters that determinethe dichroism: two for as and four for b. Onlytwo (odd and even) positions of isotopic label-ling generate independent dichroic ratios, for a
2kM2yl
kM2zl
¼1
f k½ðcos w sin cm cos b2 cos cm sin bÞcos as ^ sin w sin cm sin as�2lþ ð1 2 f Þ=3
2 1 ð28Þ
364 Isotope-edited IR Dichroism
given amide band, in a b-sheet. These, togetherwith the non-isotopically labelled amide, wouldbe sufficient to determine fixed values of as andb, and the degree of sample alignment, f.
(6) Additionally, combination of dichroic ratiosfrom different amide bands for b-sheets yieldsinformation on the orientational distribution ofthe sheets, and possibly of the strands withinthe sheets. The different orientations, QM andq0
M, of the transition moment that are needed forthis are given for the various amide bands inTable 1.
References
1. Kukol, A., Adams, P. D., Rice, L. M., Brunger, A. T. &Arkin, I. T. (1999). Experimentally based orienta-tional refinement of membrane protein models: astructure for the Influenza A M2 Hþ channel. J. Mol.Biol. 286, 951–962.
2. Kukol, A. & Arkin, I. T. (1999). vpu transmembranepeptide structure obtained by site-specific Fouriertransform infrared dichroism and global moleculardynamics searching. Biophys. J. 77, 1594–1601.
3. Torres, J., Briggs, J. A. G. & Arkin, I. T. (2002).Multiple site-specific infrared dichroism of CD3-z,a transmembrane helix bundle. J. Mol. Biol. 316,365–374.
4. Kukol, A., Torres, J. & Arkin, I. T. (2002). A structurefor the trimeric MHC class II-associated invariantchain transmembrane domain. J. Mol. Biol. 320,1109–1117.
5. Arkin, I. T., MacKenzie, K. R. & Brunger, A. T. (1997).Site-directed dichroism as a method for obtainingrotational and orientational constraints for orientedpolymers. J. Am. Chem. Soc. 119, 8973–8980.
6. Flach, C. R., Cai, P., Dieudonne, D., Brauner, J. W.,Keough, K. M. W., Stewart, J. & Mendelsohn, R.(2003). Location of structural transitions in an iso-topically labeled lung surfactant SP-B peptide byIRRAS. Biophys. J. 85, 340–349.
7. Marsh, D. (1997). Dichroic ratios in polarized Fouriertransform infrared for nonaxial symmetry of b-sheetstructures. Biophys. J. 72, 2710–2718.
8. Anderson, T. S., Hellgeth, J. & Lansbury, P. T. (1996).Isotope-edited infrared linear dichroism–determi-nation of amide orientational relationship. J. Am.Chem. Soc. 118, 6540–6546.
9. Marsh, D. (1999). Spin label ESR spectroscopy andFTIR spectroscopy for structural/dynamic measure-ments on ion channels. Methods Enzymol. 294, 59–92.
10. Miyazawa, T. (1960). Perturbation treatment of thecharacteristic vibrations of polypeptide chains invarious configurations. J. Chem. Phys. 32, 1647–1652.
11. Marsh, D. (1998). Nonaxiality in infrared dichroicratios of polytopic transmembrane proteins. Biophys.J. 75, 354–358.
12. Marsh, D., Muller, M. & Schmitt, F.-J. (2000). Orien-tation of the infrared transition moments for ana-helix. Biophys. J. 78, 2499–2510.
13. Fraser, R. D. B. & MacRae, T. P. (1973). Conformationin Fibrous Proteins and Related Synthetic Peptides,Academic Press, New York.
14. Brauner, J. W., Dugan, C. & Mendelsohn, R. (2000).13C isotope labeling of hydrophobic peptides. Originof the anomalous intensity distribution in the infra-
red amide I spectral region of b-sheet structures.J. Am. Chem. Soc. 122, 677–683.
15. Arnott, S., Dover, S. D. & Elliot, A. (1967). Structureof b-poly-L-alanine: refined atomic co-ordinates foran anti-parallel beta-pleated sheet. J. Mol. Biol. 30,201–208.
16. Fraser, R. D. B., MacRae, T. P., Parry, D. A. D. &Suzuki, E. (1969). The structure of b-keratin. Polymer,10, 810–826.
17. Marsh, R. E., Corey, R. B. & Pauling, L. (1955). Inves-tigation of the structure of silk fibroin. Biochim. Bio-phys. Acta, 16, 1–34.
18. Marsh, R. E., Corey, R. B. & Pauling, L. (1955). Thestructure of tussah silk fibroin. Acta Crystallog. 8,710–715.
19. Buffeteau, T., Le Calvez, E., Castano, S., Desbat, B.,Blaudez, D. & Dufourcq, J. (2000). Anisotropic opti-cal constants of a-helix and b-sheet secondary struc-tures in the infrared. J. Phys. Chem. ser. B, 104,4537–4544.
20. Suzuki, E. (1967). A quantitative study of the amidevibrations in the infra-red spectrum of silk fibroin.Spectrochim. Acta, 23A, 2303–2308.
21. Fraser, R. D. B. & Suzuki, E. (1970). A quantitativestudy of the amide I vibrations in the infra-red spec-trum of b-keratin. Spectrochim. Acta, 26, 423–426.
22. Sandeman, I. (1955). Amide bands in infra-red spec-tra: the direction of the transition moments of bandsin N,N0-diacetylhexamethylenediamine. Proc. Roy.Soc. ser. A, 232, 105–113.
23. Bradbury, E. M. & Elliot, A. (1963). The infra-redspectrum of crystalline N-methylacetamide. Spectro-chim. Acta, 19, 995–1012.
Appendix A: Orientation of the PeptidePlane in an Anti-parallel b-Sheet
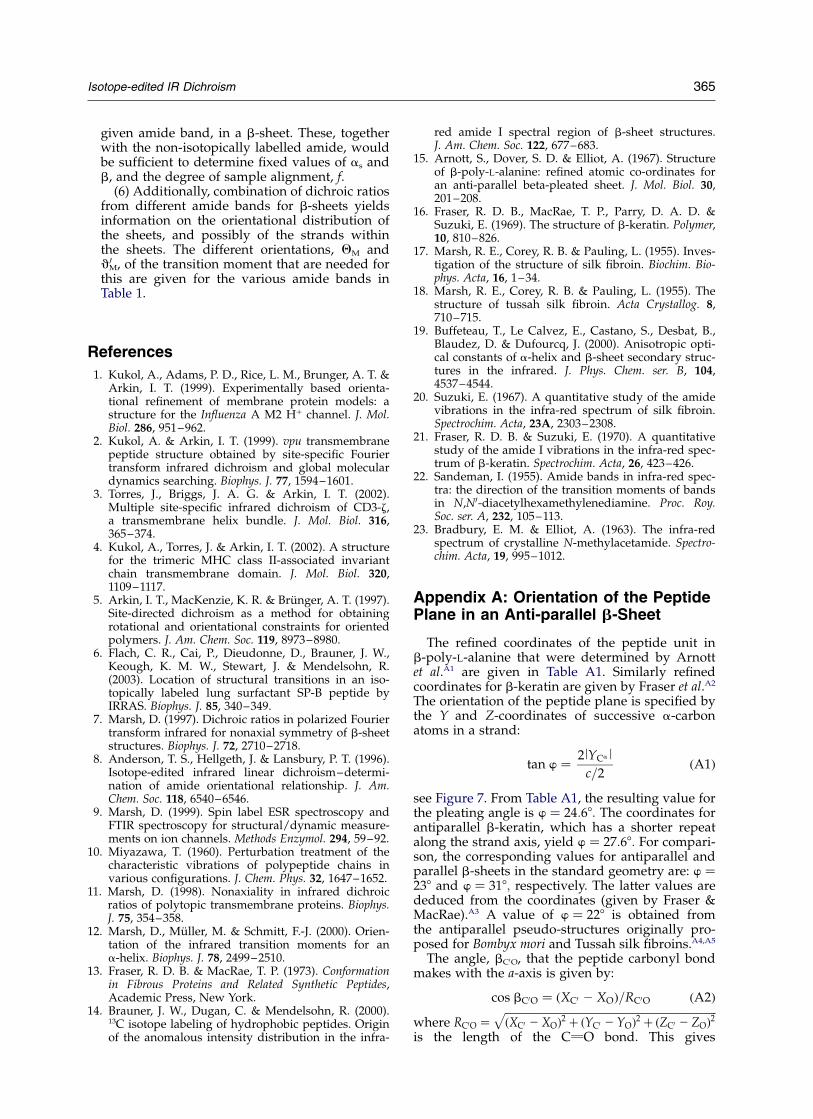
The refined coordinates of the peptide unit inb-poly-L-alanine that were determined by Arnottet al.A1 are given in Table A1. Similarly refinedcoordinates for b-keratin are given by Fraser et al.A2
The orientation of the peptide plane is specified bythe Y and Z-coordinates of successive a-carbonatoms in a strand:
tan w ¼2lYCa l
c=2ðA1Þ
see Figure 7. From Table A1, the resulting value forthe pleating angle is w ¼ 24:68: The coordinates forantiparallel b-keratin, which has a shorter repeatalong the strand axis, yield w ¼ 27:68: For compari-son, the corresponding values for antiparallel andparallel b-sheets in the standard geometry are: w ¼238 and w ¼ 318; respectively. The latter values arededuced from the coordinates (given by Fraser &MacRae).A3 A value of w ¼ 228 is obtained fromthe antiparallel pseudo-structures originally pro-posed for Bombyx mori and Tussah silk fibroins.A4,A5
The angle, bC0O, that the peptide carbonyl bondmakes with the a-axis is given by:
cos bC0O ¼ ðXC0 2 XOÞ=RC0O ðA2Þ
where RC0O ¼ffiffiffiffiffiffiffiffiffiffiffiffiffiffiffiffiffiffiffiffiffiffiffiffiffiffiffiffiffiffiffiffiffiffiffiffiffiffiffiffiffiffiffiffiffiffiffiffiffiffiffiffiffiffiffiffiffiffiffiffiffiffiffiffiffiffiffiffiffiffiffiffiffiffiffiffiffiffiffiffiffiffiffiffiffiðXC0 2 XOÞ
2 þ ðYC0 2 YOÞ2 þ ðZC0 2 ZOÞ
2p
is the length of the CvO bond. This gives
Isotope-edited IR Dichroism 365
inclinations of bC0O ¼ 128 and bC0O ¼ 68 forb-poly-L-alanine and b-keratin, respectively. Note,however, that it is directly the angle cM that thetransition moment makes with the a-axis (and notwith the CvO bond) that is determined from therelative intensities of the n’(p,0) and nk(0,p) amidemodes in antiparallel b-sheets (see Appendix B).
References
A1. Arnott, S., Dover, S. D. & Elliot, A. (1967). Structureof b-poly-L-alanine: refined atomic co-ordinates foran anti-parallel beta-pleated sheet. J. Mol. Biol. 30,201–208.
A2. Fraser, R. D. B., MacRae, T. P., Parry, D. A. D. &Suzuki, E. (1969). The structure of b-keratin. Polymer,10, 810–826.
A3. Fraser, R. D. B. & MacRae, T. P. (1973). Conformationin Fibrous Proteins and Related Synthetic Peptides,Academic Press, New York.
A4. Marsh, R. E., Corey, R. B. & Pauling, L. (1955). Inves-tigation of the structure of silk fibroin. Biochim. Bio-phys. Acta, 16, 1–34.
A5. Marsh, R. E., Corey, R. B. & Pauling, L. (1955). Thestructure of tussah silk fibroin. Acta Crystallog. 8,710–715.
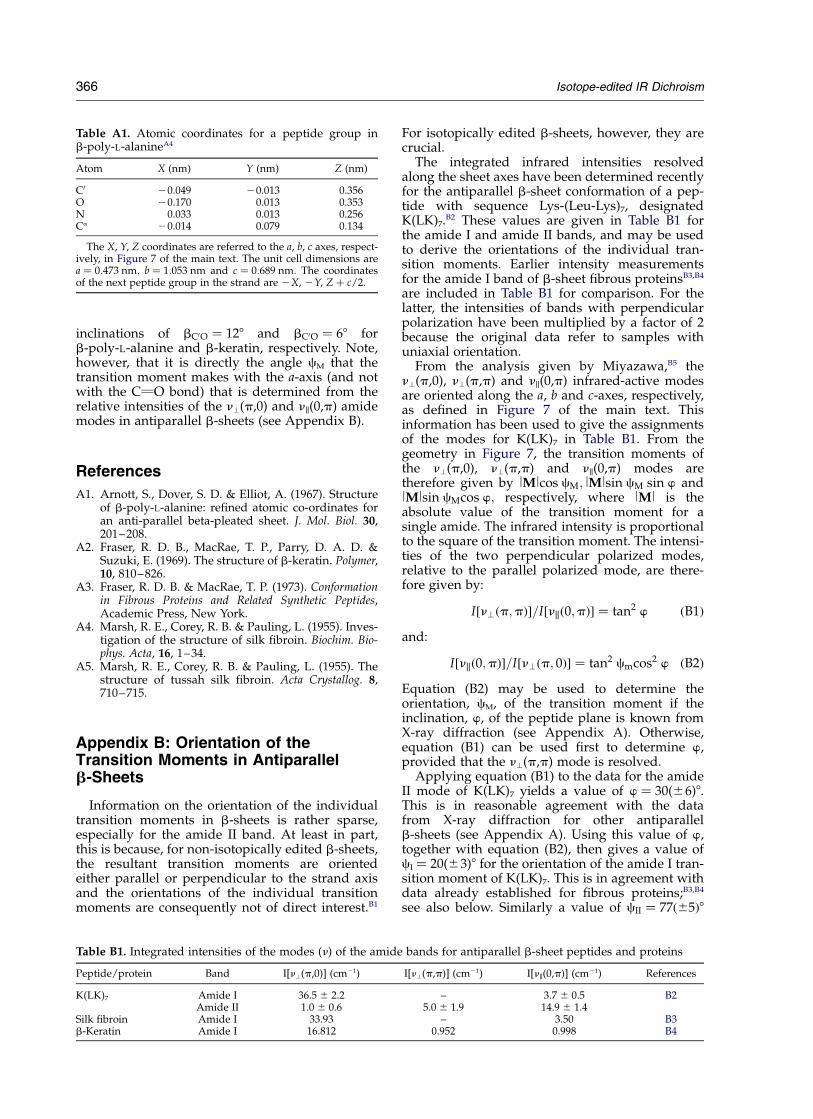
Appendix B: Orientation of theTransition Moments in Antiparallelb-Sheets
Information on the orientation of the individualtransition moments in b-sheets is rather sparse,especially for the amide II band. At least in part,this is because, for non-isotopically edited b-sheets,the resultant transition moments are orientedeither parallel or perpendicular to the strand axisand the orientations of the individual transitionmoments are consequently not of direct interest.B1
For isotopically edited b-sheets, however, they arecrucial.
The integrated infrared intensities resolvedalong the sheet axes have been determined recentlyfor the antiparallel b-sheet conformation of a pep-tide with sequence Lys-(Leu-Lys)7, designatedK(LK)7.
B2 These values are given in Table B1 forthe amide I and amide II bands, and may be usedto derive the orientations of the individual tran-sition moments. Earlier intensity measurementsfor the amide I band of b-sheet fibrous proteinsB3,B4
are included in Table B1 for comparison. For thelatter, the intensities of bands with perpendicularpolarization have been multiplied by a factor of 2because the original data refer to samples withuniaxial orientation.
From the analysis given by Miyazawa,B5 then’(p,0), n’(p,p) and nk(0,p) infrared-active modesare oriented along the a, b and c-axes, respectively,as defined in Figure 7 of the main text. Thisinformation has been used to give the assignmentsof the modes for K(LK)7 in Table B1. From thegeometry in Figure 7, the transition moments ofthe n’(p,0), n’(p,p) and nk(0,p) modes aretherefore given by lMlcos cM; lMlsin cM sin w andlMlsin cMcos w; respectively, where lMl is theabsolute value of the transition moment for asingle amide. The infrared intensity is proportionalto the square of the transition moment. The intensi-ties of the two perpendicular polarized modes,relative to the parallel polarized mode, are there-fore given by:
I½n’ðp;pÞ�=I½nkð0;pÞ� ¼ tan2 w ðB1Þ
and:
I½nkð0;pÞ�=I½n’ðp; 0Þ� ¼ tan2 cmcos2 w ðB2Þ
Equation (B2) may be used to determine theorientation, cM, of the transition moment if theinclination, w, of the peptide plane is known fromX-ray diffraction (see Appendix A). Otherwise,equation (B1) can be used first to determine w,provided that the n’(p,p) mode is resolved.
Applying equation (B1) to the data for the amideII mode of K(LK)7 yields a value of w ¼ 30(^6)8.This is in reasonable agreement with the datafrom X-ray diffraction for other antiparallelb-sheets (see Appendix A). Using this value of w,together with equation (B2), then gives a value ofcI ¼ 20(^3)8 for the orientation of the amide I tran-sition moment of K(LK)7. This is in agreement withdata already established for fibrous proteins;B3,B4
see also below. Similarly a value of cII ¼ 77ð^5Þ8
Table B1. Integrated intensities of the modes (n) of the amide bands for antiparallel b-sheet peptides and proteins
Peptide/protein Band I[n’(p,0)] (cm21) I[n’(p,p)] (cm21) I[nk(0,p)] (cm21) References
K(LK)7 Amide I 36.5 ^ 2.2 – 3.7 ^ 0.5 B2Amide II 1.0 ^ 0.6 5.0 ^ 1.9 14.9 ^ 1.4
Silk fibroin Amide I 33.93 – 3.50 B3b-Keratin Amide I 16.812 0.952 0.998 B4
Table A1. Atomic coordinates for a peptide group inb-poly-L-alanineA4
Atom X (nm) Y (nm) Z (nm)
C0 20.049 20.013 0.356O 20.170 0.013 0.353N 0.033 0.013 0.256Ca 20.014 0.079 0.134
The X, Y, Z coordinates are referred to the a, b, c axes, respect-ively, in Figure 7 of the main text. The unit cell dimensions area ¼ 0:473 nm; b ¼ 1:053 nm and c ¼ 0:689 nm: The coordinatesof the next peptide group in the strand are 2X, 2Y, Z þ c/2.
366 Isotope-edited IR Dichroism

is obtained for the orientation of the amide II tran-sition moment of antiparallel K(LK)7. The lattervalue is reasonably precise, in spite of the relativelylow precision of the n’(p,0) intensity for the amideII band (see Table B1). This is important because ofthe paucity of data on the amide II transitionmoment orientation for b-sheets.
Combining the intensities of the amide I com-ponents for Bombyx mori silk fibroin with thevalue of w ¼ 228 obtained from the original X-raypseudo-structure (see Appendix A), equation (B2)yields a value of cI ¼ 198:B3 Using the value of w ¼24:68 from refined coordinates for the closely simi-lar structure of b-poly-L-alanine (see Appendix A),increases cI only marginally to 19.58. Applyingequation (B1) to the amide I data for b-keratinyields a value of w ¼ 448: This is considerablylarger than the value of w ¼ 27:68 obtained fromthe refined coordinates of b-keratin (see AppendixA). This is possibly because the n’(p,p) mode ofthe amide I band required for the calculation of wis of low intensity and not well resolved. Neverthe-less, taking w ¼ 448 together with equation (B2)yields a value of cI ¼ 198; which agrees with thatoriginally reported.B4 If the value of w ¼ 27:68 fromthe refined structure of b-keratin is used, a lowervalue of cI ¼ 158 is obtained for the orientation ofthe amide I transition moment.
Further information relevant to the orientation ofthe amide transition moments can be obtainedfrom comparison with model compounds.12 Theamide frequencies of N,N0-diacetyl hexamethylenediamineB6 are closest to those of b-sheet structures.For this model compound, the orientation, dM, ofthe transition moment relative to the peptidecarbonyl is dI ¼ 178; dII ¼ 688; 778 and dA ¼ 88 forthe amide I, amide II and amide A bands, respec-tively. Because these transition moments lie in thepeptide plane directed away from the nitrogenatom, the orientation of the transition moment tothe a-axis is given by cM ¼ bC0O þ dM: Here, bC0O
is the inclination of the peptide carbonyl bond tothe a-axis, as given in Appendix A. It is seenimmediately that taking the smaller value ofbC0O ¼ 68 for b-keratin, rather than that for b-poly-L-alanine, gives a better agreement with measuredvalues of cM that are given above. The orientationsof the transition moment predicted in this way arethen: cI ¼ 238; cII ¼ 748; 838 and cA ¼ 148 for theamide I, amide II and amide A bands, respectively.Corresponding predictions taking N-methylacetamide,B7 which also has amide frequenciesclose to those for b-sheets, as model compoundare: cI ¼ 21– 318; cII ¼ 798 and cA ¼ 148: On thewhole, these predictions are reasonably close to
the direct determinations for the amide I andamide II bands that are given above. This is ofsome importance, because predictions from themodel compounds provide the only informationavailable on the orientation of the amide A tran-sition moment in b-sheets.
Unlike the situation with a-helices, 13CvO iso-topic labelling of hydrophobic b-sheet peptidesproduces amide I bands at lower frequency thathave anomalously high intensity, relative to thatexpected for an isolated oscillator.B8 Nevertheless,a semi-empirical model that explains the anoma-lous intensity predicts relative intensities of thoseisotope-shifted bands which correspond to thenk(0,p) and n’(p,0) modes of a homogeneousb-sheet that are similar to the relative intensitiesfor the peptide without isotopic labels.B9 Usingequation B2, the maximum change in effectivevalue of transition moment orientation, cI, pre-dicted for a peptide with alternating labels, is 58.
References
B1. Marsh, D. (1997). Dichroic ratios in polarized Fouriertransform infrared for nonaxial symmetry of b-sheetstructures. Biophys. J. 72, 2710–2718.
B2. Buffeteau, T., Le Calvez, E., Castano, S., Desbat, B.,Blaudez, D. & Dufourcq, J. (2000). Anisotropic opti-cal constants of a-helix and b-sheet secondary struc-tures in the infrared. J. Phys. Chem. ser. B, 104,4537–4544.
B3. Suzuki, E. (1967). A quantitative study of the amidevibrations in the infra-red spectrum of silk fibroin.Spectrochim. Acta, 23A, 2303–2308.
B4. Fraser, R. D. B. & Suzuki, E. (1970). A quantitativestudy of the amide I vibrations in the infra-red spec-trum of b-keratin. Spectrochim. Acta, 26, 423–426.
B5. Miyazawa, T. (1960). Perturbation treatment of thecharacteristic vibrations of polypeptide chains invarious configurations. J. Chem. Phys. 32, 1647–1652.
B6. Sandeman, I. (1955). Amide bands in infra-red spec-tra: the direction of the transition moments of bandsin N,N0-diacetylhexamethylenediamine. Proc. Roy.Soc. ser. A, 232, 105–113.
B7. Bradbury, E. M. & Elliot, A. (1963). The infra-redspectrum of crystalline N-methylacetamide. Spectro-chim. Acta, 19, 995–1012.
B8. Brauner, J. W., Dugan, C. & Mendelsohn, R. (2000).13C isotope labeling of hydrophobic peptides. Originof the anomalous intensity distribution in the infra-red amide I spectral region of b-sheet structures.J. Am. Chem. Soc. 122, 677–683.
B9. Flach, C. R., Cai, P., Dieudonne, D., Brauner, J. W.,Keough, K. M. W., Stewart, J. & Mendelsohn, R.(2003). Location of structural transitions in an iso-topically labeled lung surfactant SP-B peptide byIRRAS. Biophys. J. 85, 340–349.
Edited by G. von Heijne
(Received 23 December 2003; received in revised form 23 February 2004; accepted 24 February 2004)
Isotope-edited IR Dichroism 367