In Pursuit of Reliable Schedules
47
Boston Chapter of AACEi February, 11, 2016 IN PURSUIT OF RELIABLE SCHEDULES INTRODUCTION TO: “Core Traits of a Reliable Schedule” & NetPoint Analytics
-
Upload
pma-consultants -
Category
Technology
-
view
192 -
download
1
Transcript of In Pursuit of Reliable Schedules
Boston Chapter of AACEiFebruary, 11, 2016
IN PURSUIT OF
RELIABLE SCHEDULESINTRODUCTION TO:
“Core Traits of a Reliable Schedule” & NetPoint Analytics
2
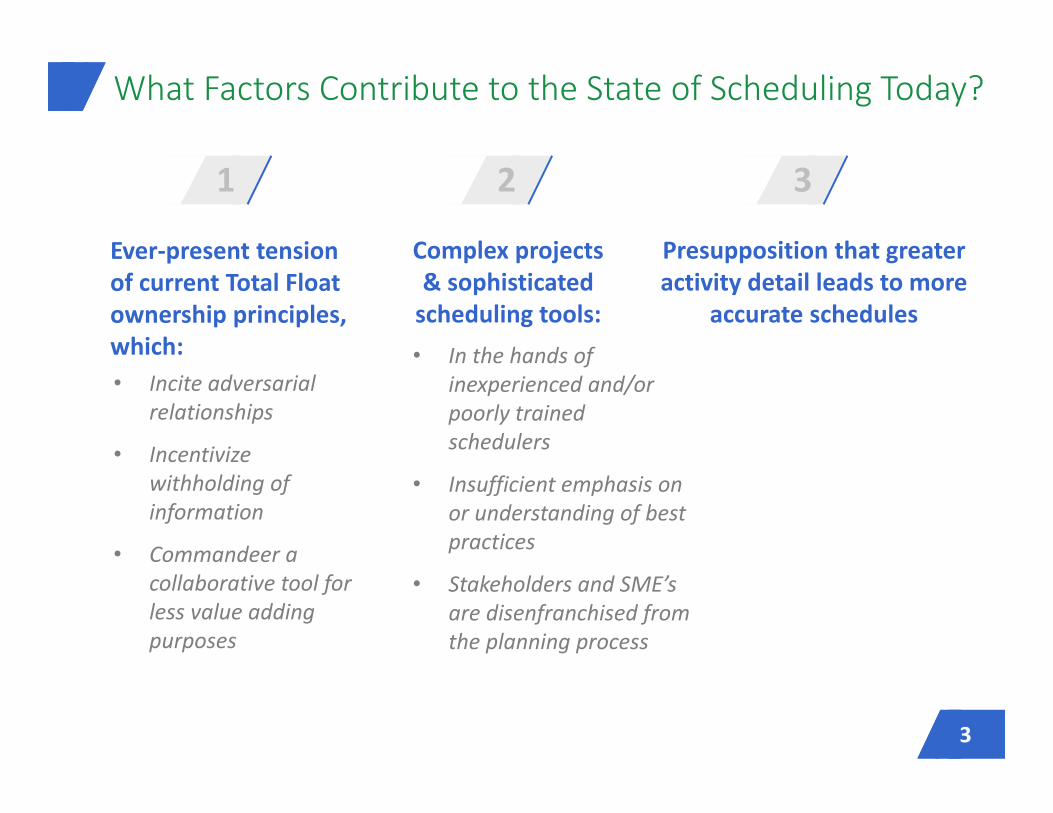
What Factors Contribute to the State of Scheduling Today?
3
• Incite adversarial relationships
• Incentivize withholding of information
• Commandeer a collaborative tool for less value adding purposes
• In the hands of inexperienced and/or poorly trained schedulers
• Insufficient emphasis on or understanding of best practices
• Stakeholders and SME’s are disenfranchised from the planning process
Complex projects & sophisticated scheduling tools:
1
Presupposition that greater activity detail leads to more
accurate schedules
Ever‐present tension of current Total Float ownership principles, which:
2 3

PMA’s Core Traits of a Reliable Schedule and NetPoint Schedule Analytics represent our contributions to date, aimed at improving schedule quality in the AEC industry.
How Will We Improve the State of Scheduling?
4
PM & PLANNER TRAINING
CONTRACTS PLANNING TOOLS
CPM Scheduling SMEsGPM Planning/Scheduling SMEs
February 2014
Core Traits of a Reliable ScheduleGui Ponce de Leon, PhD, PE, PMP, LEED AP
Eric D. Lowther, PMP, LEED APGary H. Jentzen, PE, JD, LEED APDon J. Fredlund, PMPJohn D. Sheridan, LEED APGerald P. KlanacBruce Stephan, PE, JD, PMPRich P. MartoneHerschel Baxi, PMP, LEED APTimothy D. Mather, PMPDax Ponce de Leon, LEED AP BD+C, PMPDennis Lucey
Noel Alvarez, PMP, LEED APKen A. VanderJagt, PE, PMPWayne E. Beauregard, PSPEduardo A. NazarioScott E. Worth, PMP, LEED APDavid J. WeberAngel F. Arvelo, LEED APAngel R. RipepiKaveh Dabiran, LEED APPurvasha V. Patel, PEVivek Puri, PhD
Contributing AuthorsDarrel Field, PE, LEED AP Philip J. Spittler, PMP John Zann, PE, PSP, LEED AP
© 2013, 2014 PMA Consultants, LLC

SCOPE CAVEATS & OVERARCHING PREDICATES
Must Be Aligned With Contract: Use of Core Traits of a Reliable Schedule must be coordinated with provisions of the contract, and requires the application of professional judgment based on adequate experience and knowledge of construction schedules, including the review of schedules.
As written, the 20‐Trait Protocol is geared to design‐bid‐build contracts for major projects and focuses on the period from contract notice to proceed through closeout
» A major project is US $250M‐$1B » construction (through closeout) spanning 27‐40 months
The 20‐Trait Protocol is scalable to both smaller projects and to mega projects (construction value exceeding US$1B)3 and project delivery method
Scope Caveats
7
1. 20 Traits advocates for Level 2 schedules as the “Contract Schedule” supported by Level 3 Schedules
2. The level 2 schedule is traceable to, the level 3 schedule
3. The schedule expressly accounts for normal weather and, when updated, incorporates the impact of actual weather.
4. Because the schedule includes and discloses contingency, realistic early completion schedules are a new normal.
Novel Approach to Scheduling
8
5. Contingency or schedule margin supporting the targeted probability of completion is developed through risk assessment.
6. Critical path float ownership theory that reserves a reasonable level of schedule margin solely for the contractor’s use is endorsed over the rule “the project owns the float.”
7. Relative to a risk‐assessed, revised baseline, the likely impact on the required completion date from a delay on or off the critical path can be determined through an approach that compares the probability of completing on time for the impacted, revised baseline schedule with the probability of completing on time for a but‐for schedule scenario that collapses the delay.
Novel Approach to Scheduling
9

INTRODUCTION10
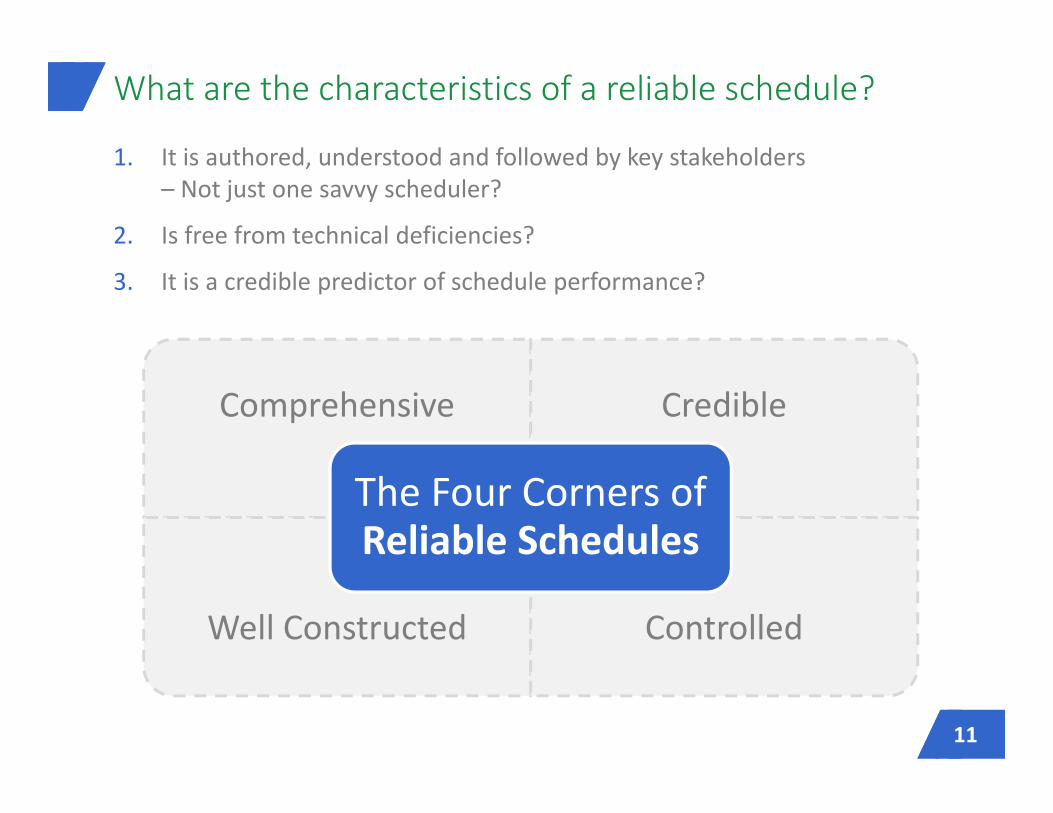
Comprehensive Credible
Well Constructed Controlled
The Four Corners of Reliable Schedules
1. It is authored, understood and followed by key stakeholders – Not just one savvy scheduler?
2. Is free from technical deficiencies?
3. It is a credible predictor of schedule performance?
What are the characteristics of a reliable schedule?
11
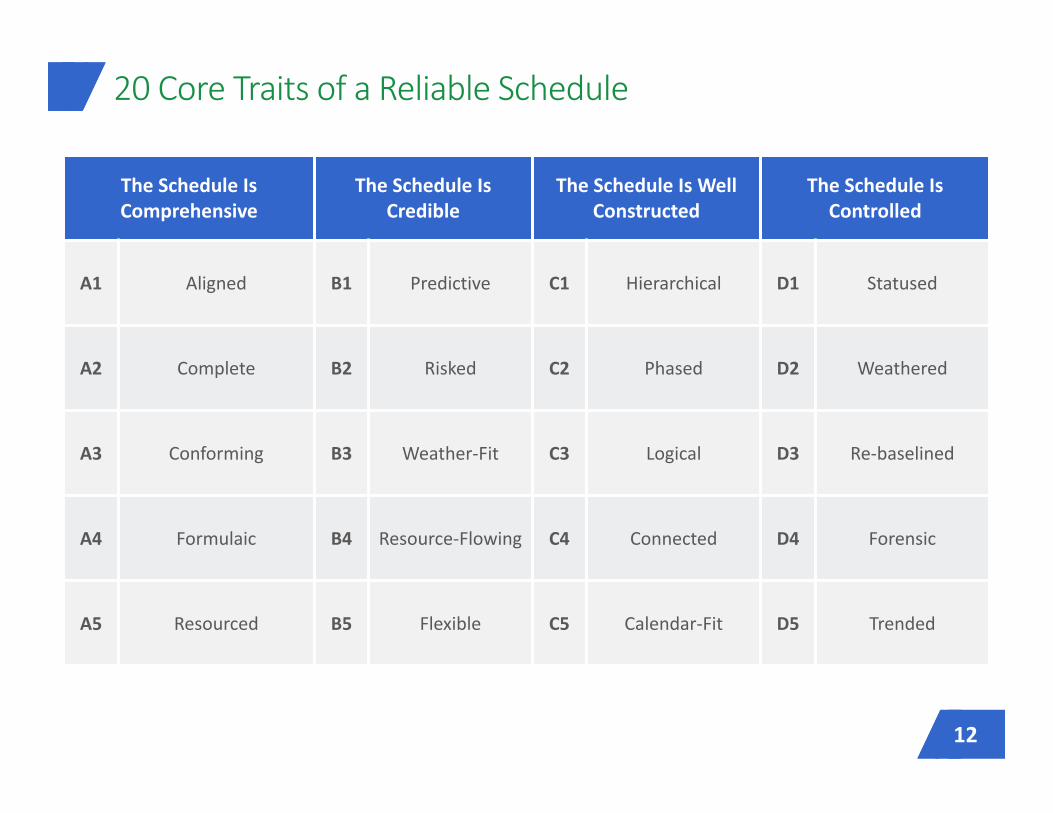
The Schedule Is Comprehensive
The Schedule Is Credible
The Schedule Is Well Constructed
The Schedule Is Controlled
A1 Aligned B1 Predictive C1 Hierarchical D1 Statused
A2 Complete B2 Risked C2 Phased D2 Weathered
A3 Conforming B3 Weather‐Fit C3 Logical D3 Re‐baselined
A4 Formulaic B4 Resource‐Flowing C4 Connected D4 Forensic
A5 Resourced B5 Flexible C5 Calendar‐Fit D5 Trended
20 Core Traits of a Reliable Schedule
© 2013, 2014 PMA Consultants, LLC 12
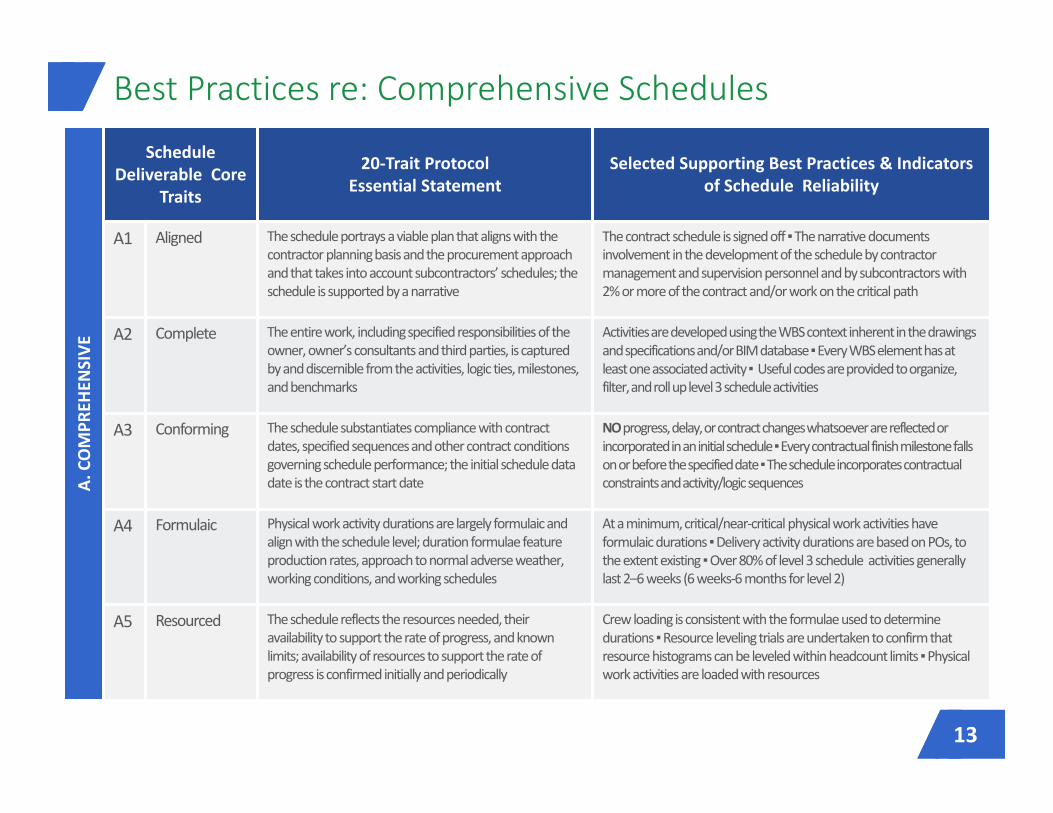
Best Practices re: Comprehensive Schedules
© 2013, 2014 PMA Consultants, LLC 13
A. COMPR
EHEN
SIVE
ScheduleDeliverable Core
Traits
20‐Trait ProtocolEssential Statement
Selected Supporting Best Practices & Indicators of Schedule Reliability
A1 Aligned The schedule portrays a viable plan that aligns with the contractor planning basis and the procurement approach and that takes into account subcontractors’ schedules; the schedule is supported by a narrative
The contract schedule is signed off ▪The narrative documents involvement in the developmentof the schedule by contractor managementand supervision personnel and by subcontractors with2% or more of the contract and/or work on the critical path
A2 Complete The entire work, including specified responsibilities of the owner, owner’s consultants and third parties, is captured by and discernible from the activities, logic ties, milestones, and benchmarks
Activities are developedusing the WBS context inherent in the drawings and specifications and/or BIM database ▪Every WBS element has at least one associated activity▪ Useful codes are provided to organize, filter, and roll up level 3 schedule activities
A3 Conforming The schedule substantiates compliance with contract dates, specified sequences and other contract conditions governing schedule performance; the initial schedule data date is the contract start date
NOprogress,delay, or contract changes whatsoever are reflected or incorporated in an initial schedule ▪Every contractual finish milestonefalls on or beforethespecified date ▪The schedule incorporatescontractual constraints and activity/logic sequences
A4 Formulaic Physical work activity durations are largely formulaicand align with the schedule level; duration formulae feature production rates, approach to normal adverse weather, working conditions, and working schedules
At a minimum, critical/near‐critical physical work activities have formulaic durations ▪Delivery activity durations are based on POs, to the extent existing ▪Over 80% of level 3 schedule activities generally last 2–6 weeks (6weeks‐6 months for level 2)
A5 Resourced The schedule reflects the resources needed, their availability to support the rate of progress, and known limits; availabilityof resources to support the rate of progress is confirmed initially and periodically
Crew loading is consistent with the formulae used to determine durations ▪Resource leveling trials are undertaken to confirm that resource histograms can be leveled within headcount limits ▪Physical work activities are loaded with resources
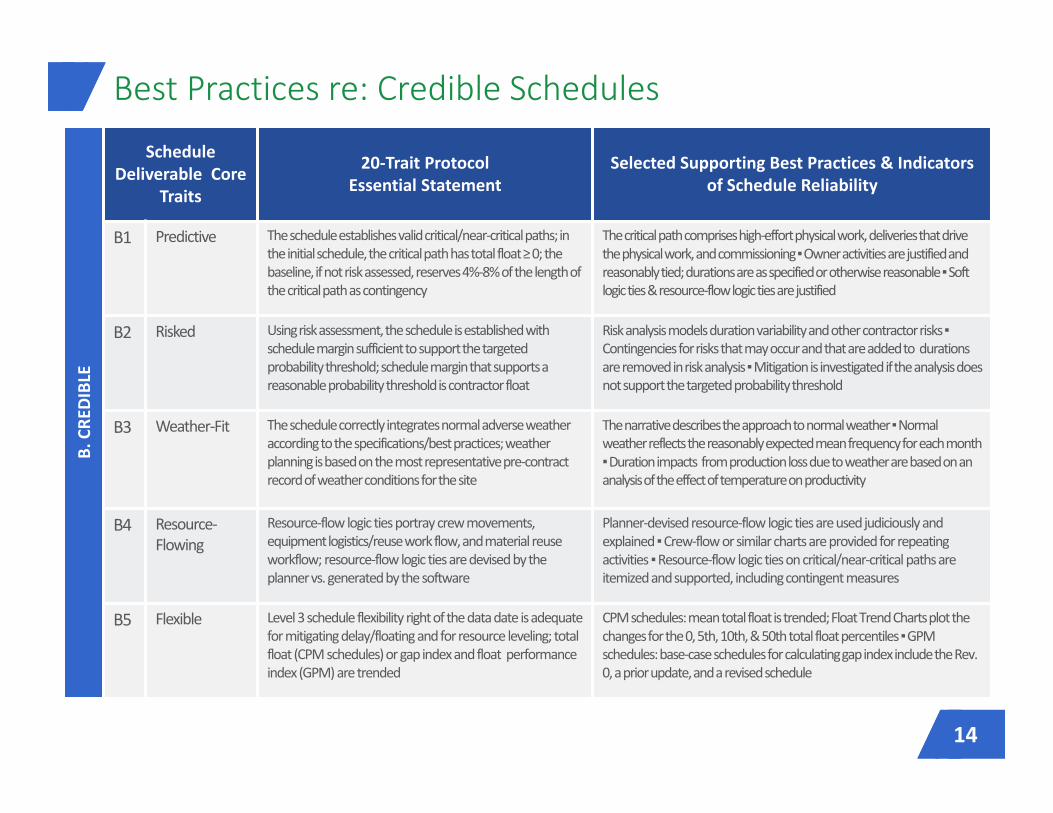
Best Practices re: Credible Schedules
© 2013, 2014 PMA Consultants, LLC 14
B. CRE
DIBLE
ScheduleDeliverable Core
Traits
20‐Trait ProtocolEssential Statement
Selected Supporting Best Practices & Indicators of Schedule Reliability
B1 Predictive The schedule establishesvalid critical/near‐critical paths; in the initial schedule, the critical path has total float ≥ 0; the baseline, if not risk assessed, reserves 4%‐8% of the length of the critical path as contingency
The critical path comprises high‐effort physical work,deliveries that drive the physical work, and commissioning ▪Owner activities are justified and reasonably tied; durations are as specified orotherwise reasonable ▪Soft logic ties & resource‐flow logic ties are justified
B2 Risked Using risk assessment, the schedule is established with schedule margin sufficientto support the targetedprobability threshold; schedule margin that supports a reasonable probability threshold is contractor float
Risk analysis models duration variability and other contractor risks▪Contingencies for risks that may occur and that are added to durations are removed in risk analysis ▪Mitigation is investigated if the analysis does not support the targeted probability threshold
B3 Weather‐Fit The schedule correctly integrates normal adverse weather according to the specifications/best practices; weather planning is based on the most representative pre‐contract record of weather conditions for the site
The narrative describes the approach to normal weather ▪Normal weather reflects the reasonably expected mean frequency for each month ▪Duration impacts from production loss due to weather are based on an analysis of the effect of temperature on productivity
B4 Resource‐Flowing
Resource‐flow logic ties portray crew movements, equipment logistics/reuse work flow, and material reuse workflow; resource‐flow logic ties are devised by the planner vs. generated by the software
Planner‐devised resource‐flow logic ties are used judiciouslyand explained ▪Crew‐flow or similar charts are provided for repeating activities ▪Resource‐flow logic ties on critical/near‐critical paths are itemized and supported, including contingent measures
B5 Flexible Level 3 schedule flexibility right of the data date is adequate for mitigatingdelay/floatingand for resource leveling; total float (CPM schedules) or gap index and float performance index (GPM) are trended
CPM schedules: mean total float is trended;FloatTrend Charts plot the changes for the 0, 5th, 10th, & 50th total floatpercentiles ▪GPM schedules: base‐caseschedulesfor calculating gap indexinclude the Rev. 0, a prior update,and arevised schedule
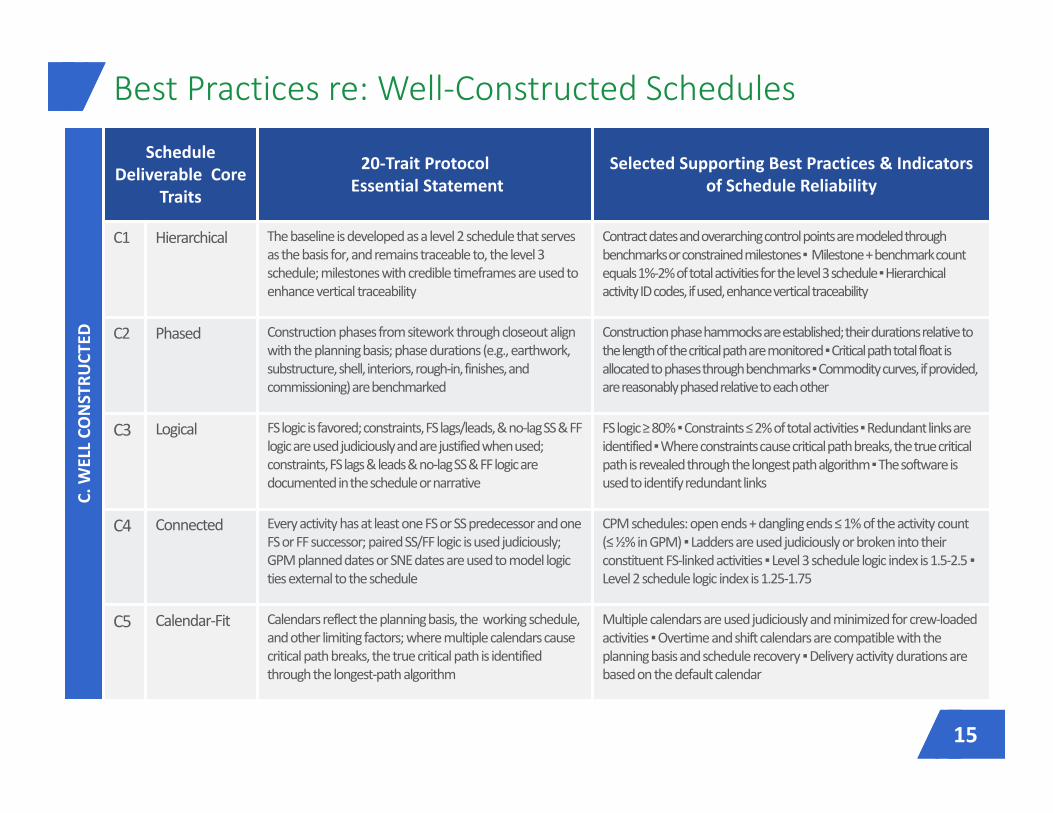
Best Practices re: Well‐Constructed Schedules
© 2013, 2014 PMA Consultants, LLC 15
C. W
ELLCO
NSTRU
CTED
ScheduleDeliverable Core
Traits
20‐Trait ProtocolEssential Statement
Selected Supporting Best Practices & Indicators of Schedule Reliability
C1 Hierarchical The baselineis developed as alevel 2 schedule that serves as the basis for, and remainstraceable to, the level 3 schedule; milestones with credible timeframesare used to enhance vertical traceability
Contract dates and overarching control points are modeled through benchmarks or constrained milestones ▪Milestone + benchmark count equals 1%‐2% of total activities for the level 3 schedule ▪Hierarchical activity ID codes, if used, enhance vertical traceability
C2 Phased Construction phases from sitework through closeout align with the planning basis; phase durations (e.g., earthwork, substructure, shell, interiors, rough‐in, finishes,andcommissioning) are benchmarked
Construction phase hammocks are established; their durations relative to the length of the critical path are monitored ▪Critical path total float is allocated to phases through benchmarks ▪Commodity curves, if provided, are reasonably phased relative to each other
C3 Logical FS logic is favored; constraints, FS lags/leads,& no‐lag SS & FF logic are used judiciously andarejustified when used; constraints, FS lags & leads & no‐lag SS & FF logic are documented in the schedule or narrative
FS logic ≥ 80% ▪Constraints ≤ 2% of total activities ▪Redundant links are identified ▪Where constraints cause critical path breaks, the true critical path is revealed through the longest path algorithm ▪The software is used to identify redundant links
C4 Connected Every activity has at least one FS or SS predecessor and one FS or FF successor; paired SS/FF logic is used judiciously; GPM planned dates or SNE dates are used to model logicties external to the schedule
CPM schedules: open ends + dangling ends ≤ 1% of the activity count (≤ ½% in GPM) ▪Ladders are used judiciously or broken into their constituent FS‐linked activities ▪Level 3 schedule logic index is 1.5‐2.5 ▪Level 2 schedule logic index is 1.25‐1.75
C5 Calendar‐Fit Calendars reflect the planning basis, the working schedule, and other limiting factors; wheremultiple calendars causecritical path breaks, the true critical path is identified through the longest‐path algorithm
Multiple calendars are used judiciously and minimized for crew‐loaded activities ▪Overtime and shift calendars are compatible with the planning basis and schedule recovery ▪Delivery activity durations are based on the defaultcalendar
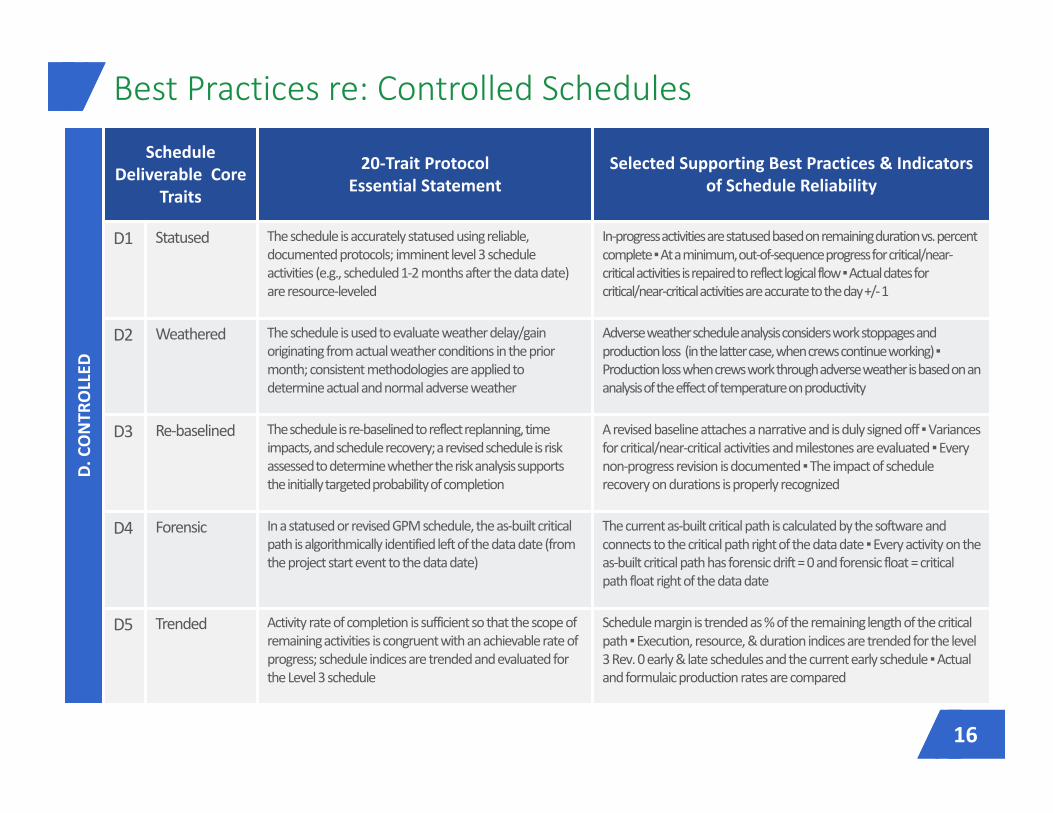
Best Practices re: Controlled Schedules
© 2013, 2014 PMA Consultants, LLC 16
D.CO
NTR
OLLED
ScheduleDeliverable Core
Traits
20‐Trait ProtocolEssential Statement
Selected Supporting Best Practices & Indicators of Schedule Reliability
D1 Statused The schedule is accurately statusedusing reliable, documented protocols; imminent level 3 schedule activities (e.g., scheduled 1‐2 months after the data date) are resource‐leveled
In‐progress activities are statusedbased on remaining duration vs. percent complete ▪At a minimum, out‐of‐sequence progress for critical/near‐critical activities is repaired to reflect logical flow ▪Actual dates for critical/near‐critical activities are accurate to the day +/‐1
D2 Weathered The schedule is used to evaluate weather delay/gain originating from actual weather conditions in the prior month; consistent methodologies are applied to determine actual and normal adverse weather
Adverse weather schedule analysis considers work stoppages and production loss (in the latter case,when crews continue working) ▪Production loss when crews work through adverse weather is based on ananalysisof the effect of temperatureon productivity
D3 Re‐baselined The schedule is re‐baselinedto reflect replanning, time impacts, and schedule recovery; a revised schedule is risk assessed to determine whether the risk analysissupports the initially targeted probability of completion
A revised baseline attaches a narrative and is duly signed off ▪Variances for critical/near‐critical activities and milestones are evaluated ▪Every non‐progress revision is documented ▪The impact of schedule recovery on durations is properly recognized
D4 Forensic In a statusedor revised GPM schedule, the as‐built critical path is algorithmically identified left of the data date (from the project start event to the data date)
The current as‐built critical path is calculated by the software and connects to the critical path right of the data date ▪Every activity on the as‐built critical path has forensic drift = 0 and forensic float = critical path float right of the data date
D5 Trended Activity rate of completion is sufficient so that the scope of remaining activities is congruent with an achievablerate of progress; schedule indices are trended and evaluated for the Level 3 schedule
Schedule margin is trended as % of the remaining length of the critical path ▪Execution, resource, &duration indices are trended for the level 3 Rev. 0 early & late schedules and the current early schedule ▪Actual and formulaic production rates are compared

Boston Chapter of AACEiFebruary, 11, 2016
IN PURSUIT OF
RELIABLE SCHEDULESIntroducing NetPoint Analytics
Presentation Outline
Schedules encompassing thousands of activities contain overwhelming amounts of data. Even in the case of level 2 schedules, the volume of information increases greatly as updates and revised baselines are generated.
New schedule analytics functionality in NetPoint can model and recast attributes and data within a schedule or within two compared schedules. NetPoint schedule analytics provides meaningful schedule metrics and scores schedule reliability through a novel Schedule IQ™ algorithmic application of Core Traits of a Reliable Schedule.
18
Topics Selected for Discussion
A Reliable Schedule Standards
B Metrics Analysis Supports Standards
C NetPoint v5.2 Schedule Analytics
D Schedule IQ™
19
RELIABLE SCHEDULE STANDARDS
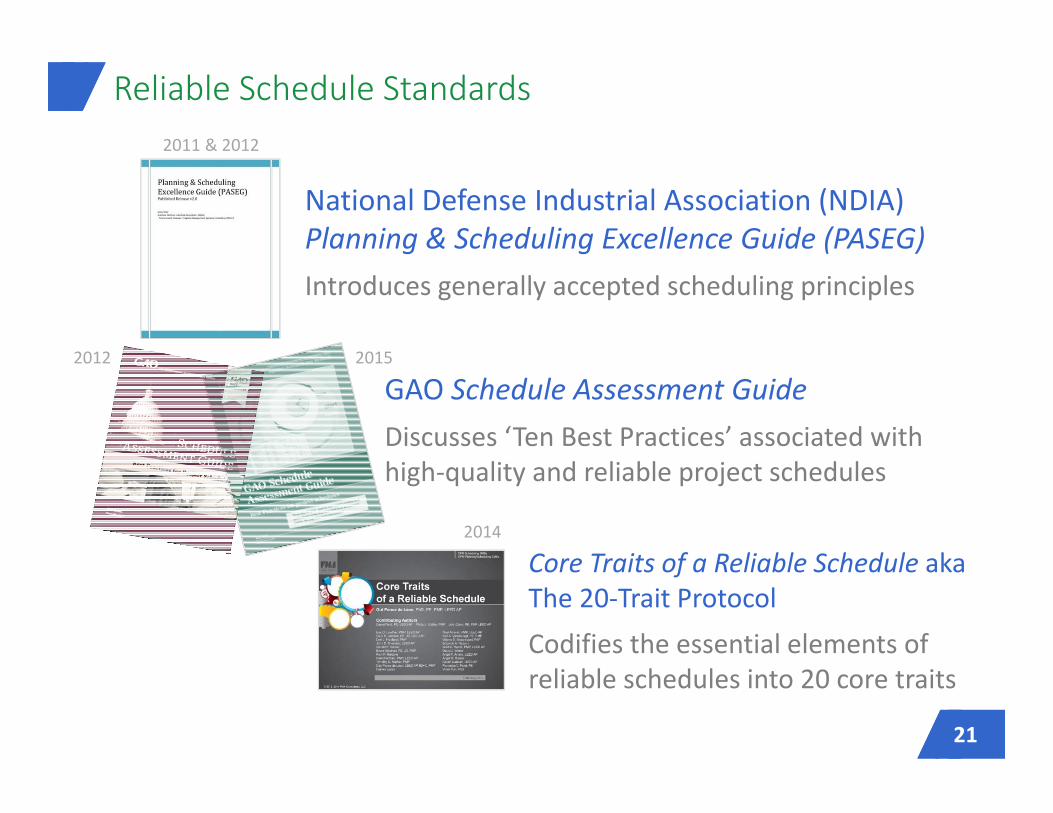
Reliable Schedule Standards
National Defense Industrial Association (NDIA) Planning & Scheduling Excellence Guide (PASEG) Introduces generally accepted scheduling principles
GAO Schedule Assessment GuideDiscusses ‘Ten Best Practices’ associated with high‐quality and reliable project schedules
Core Traits of a Reliable Schedule aka The 20‐Trait Protocol
Codifies the essential elements of reliable schedules into 20 core traits
2011 & 2012
2014
2012 2015
21
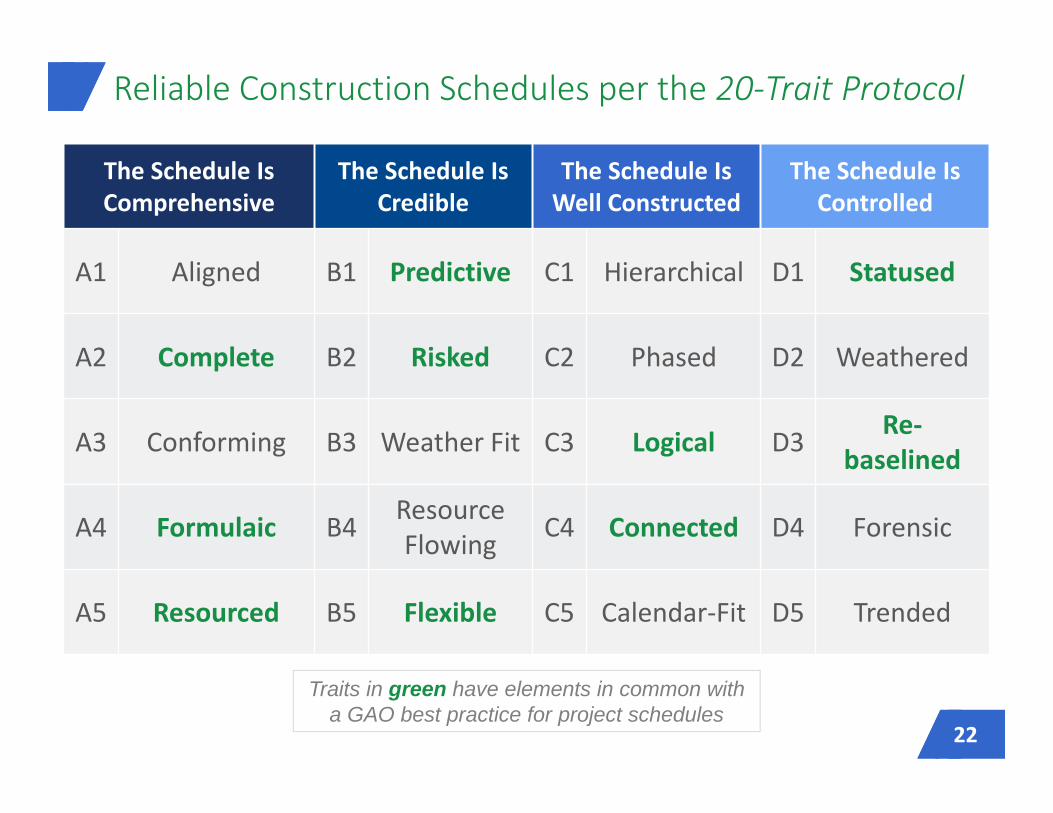
Traits in green have elements in common with a GAO best practice for project schedules
Reliable Construction Schedules per the 20‐Trait Protocol
The Schedule Is Comprehensive
The Schedule Is Credible
The Schedule Is Well Constructed
The Schedule Is Controlled
A1 Aligned B1 Predictive C1 Hierarchical D1 Statused
A2 Complete B2 Risked C2 Phased D2 Weathered
A3 Conforming B3 Weather Fit C3 Logical D3 Re‐baselined
A4 Formulaic B4 ResourceFlowing C4 Connected D4 Forensic
A5 Resourced B5 Flexible C5 Calendar‐Fit D5 Trended
22
METRICS ANALYSIS SUPPORTS STANDARDS
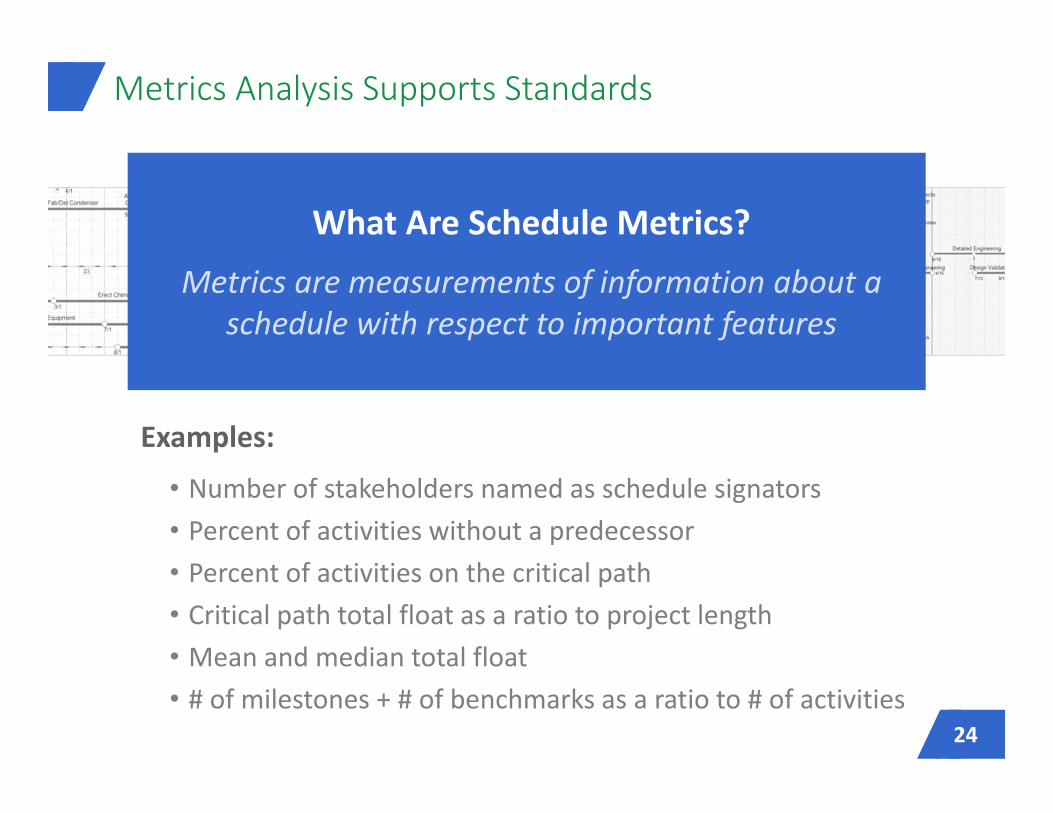
Metrics Analysis Supports Standards
Examples:
• Number of stakeholders named as schedule signators• Percent of activities without a predecessor• Percent of activities on the critical path • Critical path total float as a ratio to project length• Mean and median total float• # of milestones + # of benchmarks as a ratio to # of activities
What Are Schedule Metrics?
Metrics are measurements of information about a schedule with respect to important features
24
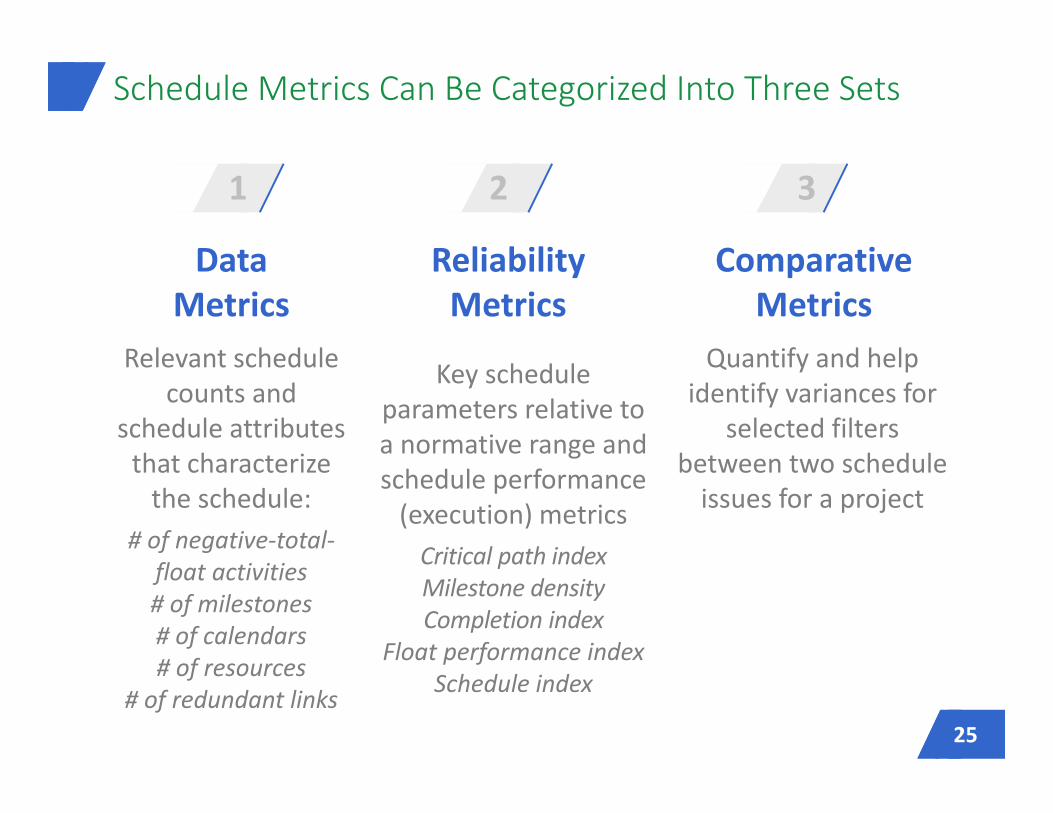
Relevant schedule counts and
schedule attributes that characterize the schedule:
# of negative‐total‐float activities# of milestones# of calendars# of resources
# of redundant links
Schedule Metrics Can Be Categorized Into Three Sets
Key schedule parameters relative to a normative range and schedule performance (execution) metricsCritical path indexMilestone densityCompletion index
Float performance indexSchedule index
Quantify and help identify variances for
selected filters between two schedule issues for a project
Reliability Metrics
1
Comparative Metrics
Data Metrics
2 3
25
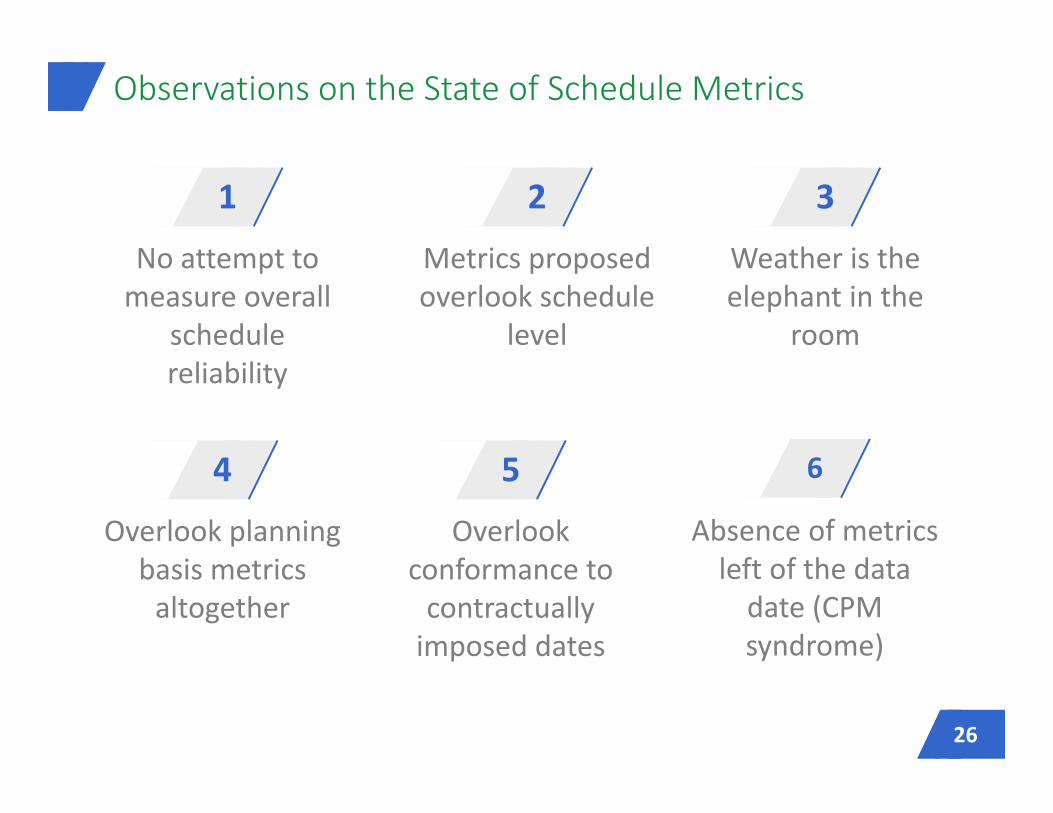
Observations on the State of Schedule Metrics
1
No attempt to measure overall
schedule reliability
2
Metrics proposed overlook schedule
level
3
Weather is the elephant in the
room
4
Overlook planning basis metrics altogether
5
Overlook conformance to contractually imposed dates
26
6
Absence of metrics left of the data date (CPM syndrome)
NETPOINT V5.2 SCHEDULE ANALYTICS
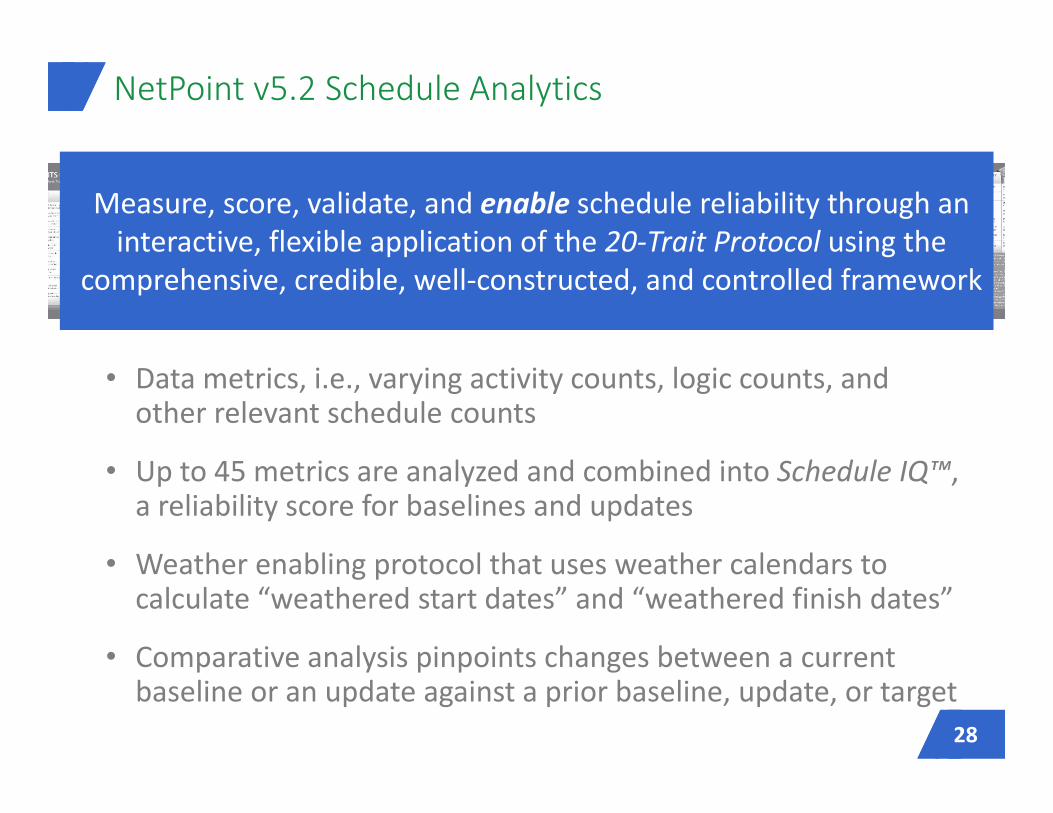
• Data metrics, i.e., varying activity counts, logic counts, and other relevant schedule counts
• Up to 45 metrics are analyzed and combined into Schedule IQ™, a reliability score for baselines and updates
• Weather enabling protocol that uses weather calendars to calculate “weathered start dates” and “weathered finish dates”
• Comparative analysis pinpoints changes between a current baseline or an update against a prior baseline, update, or target
NetPoint v5.2 Schedule Analytics
Measure, score, validate, and enable schedule reliability through an interactive, flexible application of the 20‐Trait Protocol using the
comprehensive, credible, well‐constructed, and controlled framework
28
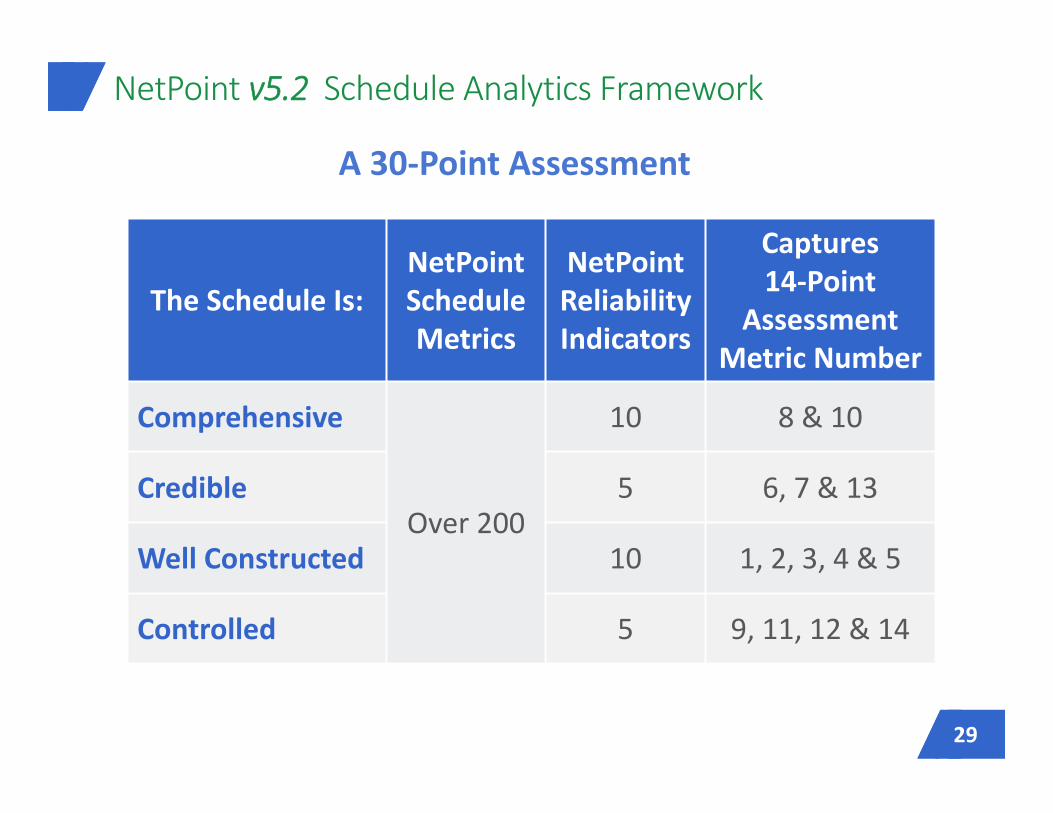
NetPoint v5.2 Schedule Analytics Framework
The Schedule Is:NetPoint Schedule Metrics
NetPointReliability Indicators
Captures 14‐Point
Assessment Metric Number
Comprehensive
Over 200
10 8 & 10
Credible 5 6, 7 & 13
Well Constructed 10 1, 2, 3, 4 & 5
Controlled 5 9, 11, 12 & 14
A 30‐Point Assessment
29
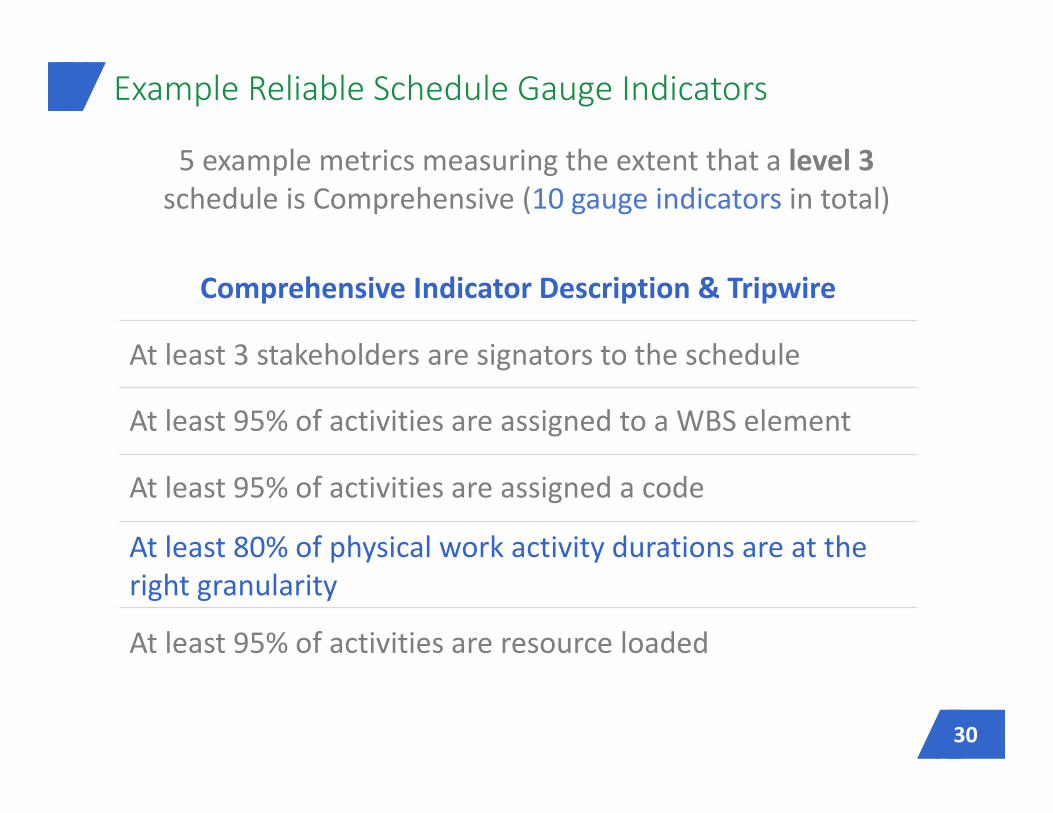
5 example metrics measuring the extent that a level 3 schedule is Comprehensive (10 gauge indicators in total)
Example Reliable Schedule Gauge Indicators
30
Comprehensive Indicator Description & Tripwire
At least 3 stakeholders are signators to the schedule
At least 95% of activities are assigned to a WBS element
At least 95% of activities are assigned a code
At least 80% of physical work activity durations are at the right granularity
At least 95% of activities are resource loaded
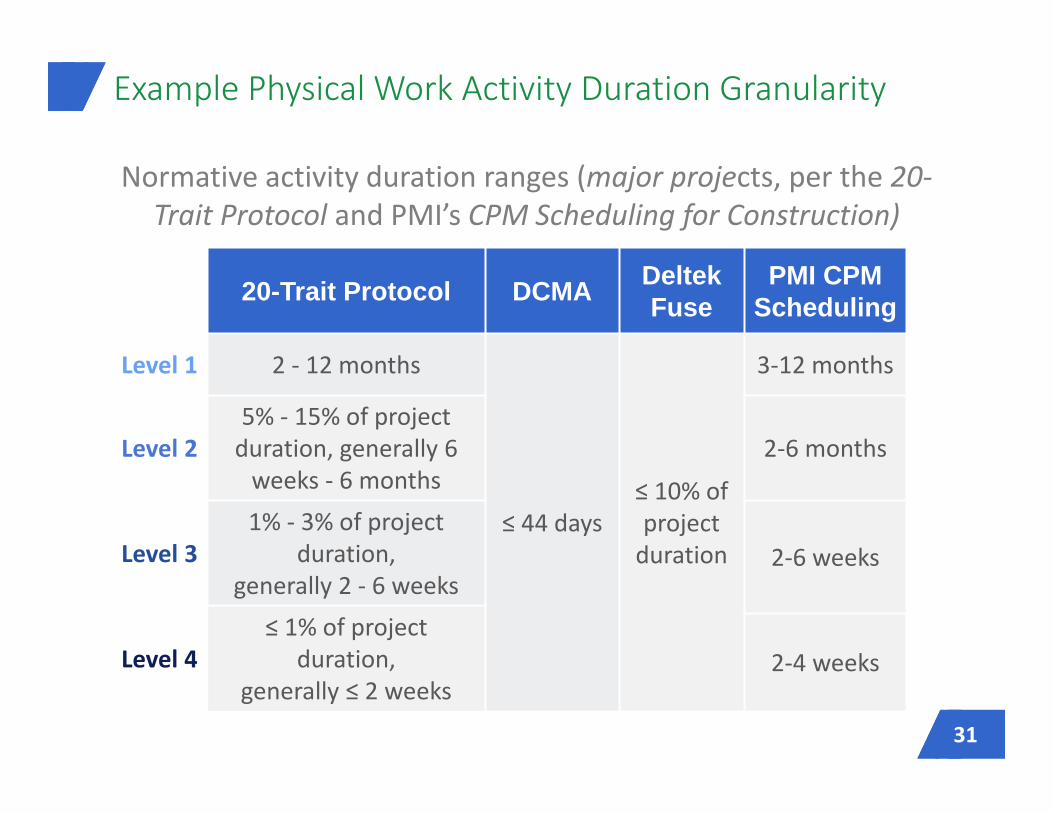
Normative activity duration ranges (major projects, per the 20‐Trait Protocol and PMI’s CPM Scheduling for Construction)
Example Physical Work Activity Duration Granularity
20-Trait Protocol DCMA Deltek Fuse
PMI CPM Scheduling
Level 1 2 ‐ 12 months
≤ 44 days≤ 10% of project duration
3‐12 months
Level 25% ‐ 15% of project duration, generally 6 weeks ‐ 6 months
2‐6 months
Level 31% ‐ 3% of project
duration, generally 2 ‐ 6 weeks
2‐6 weeks
Level 4≤ 1% of project
duration, generally ≤ 2 weeks
2‐4 weeks
31
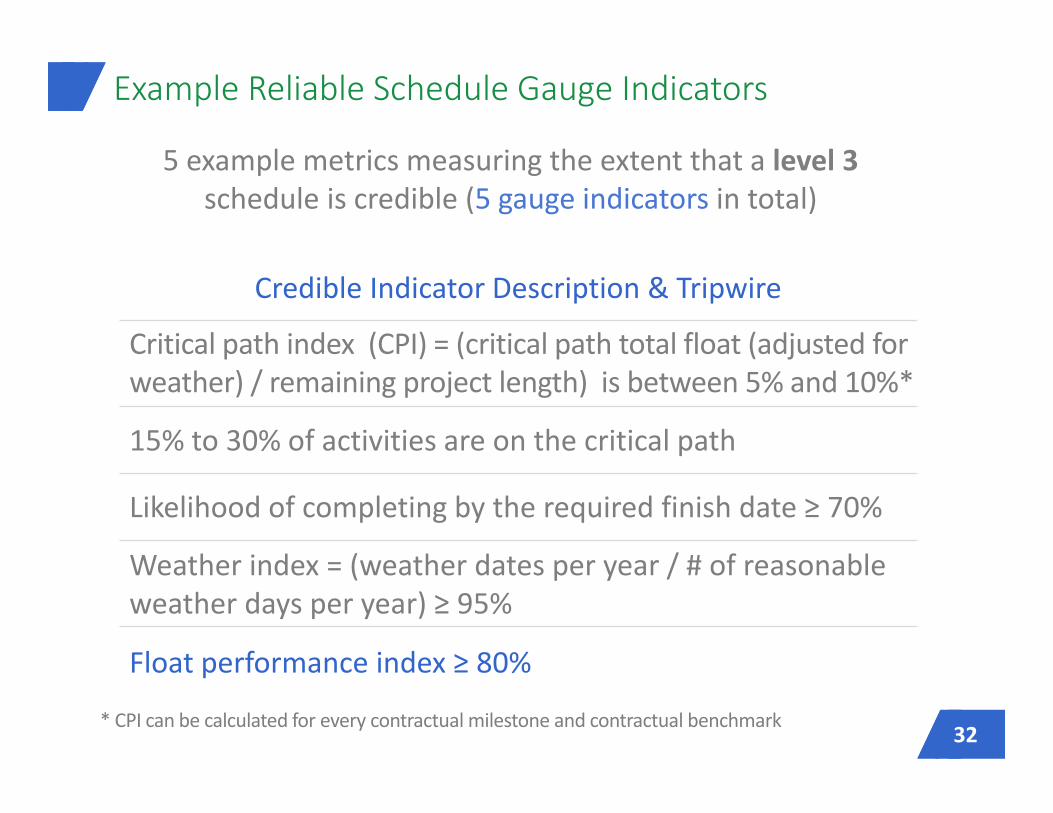
5 example metrics measuring the extent that a level 3 schedule is credible (5 gauge indicators in total)
Example Reliable Schedule Gauge Indicators
32* CPI can be calculated for every contractual milestone and contractual benchmark
Credible Indicator Description & Tripwire
Critical path index (CPI) = (critical path total float (adjusted for weather) / remaining project length) is between 5% and 10%*
15% to 30% of activities are on the critical path
Likelihood of completing by the required finish date ≥ 70%
Weather index = (weather dates per year / # of reasonable weather days per year) ≥ 95%
Float performance index ≥ 80%
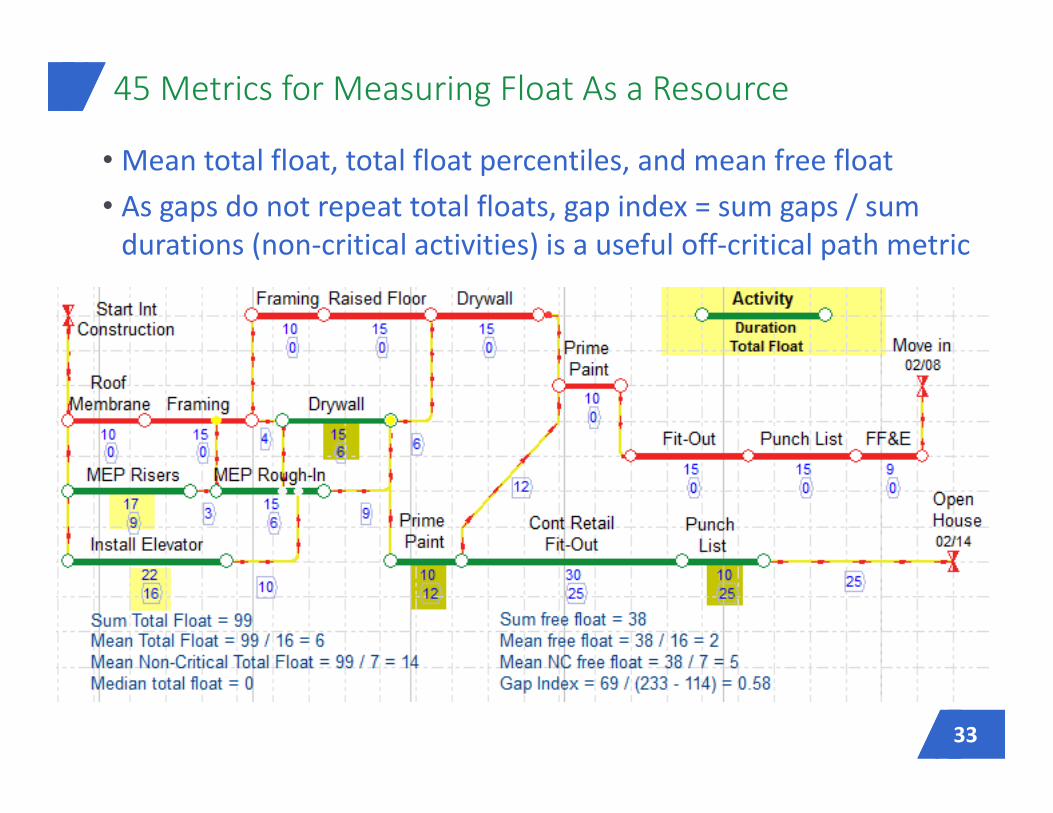
• Mean total float, total float percentiles, and mean free float• As gaps do not repeat total floats, gap index = sum gaps / sum durations (non‐critical activities) is a useful off‐critical path metric
45 Metrics for Measuring Float As a Resource
33
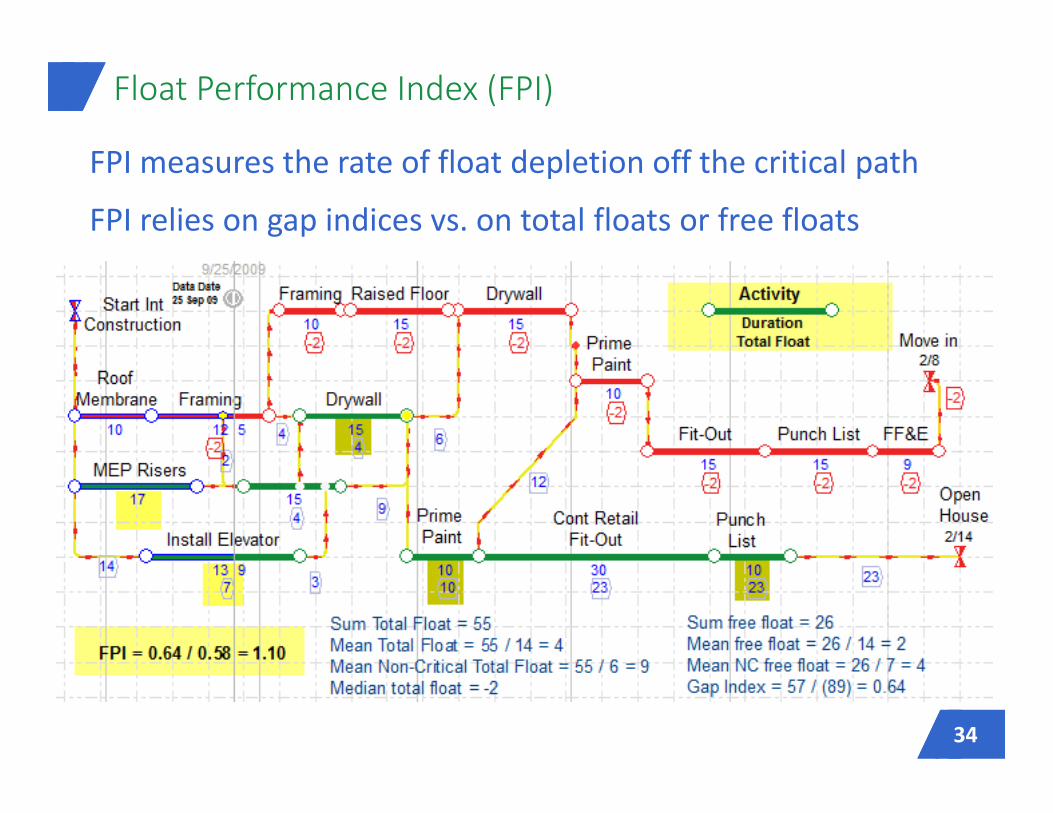
FPI measures the rate of float depletion off the critical path
FPI relies on gap indices vs. on total floats or free floats
Float Performance Index (FPI)
34
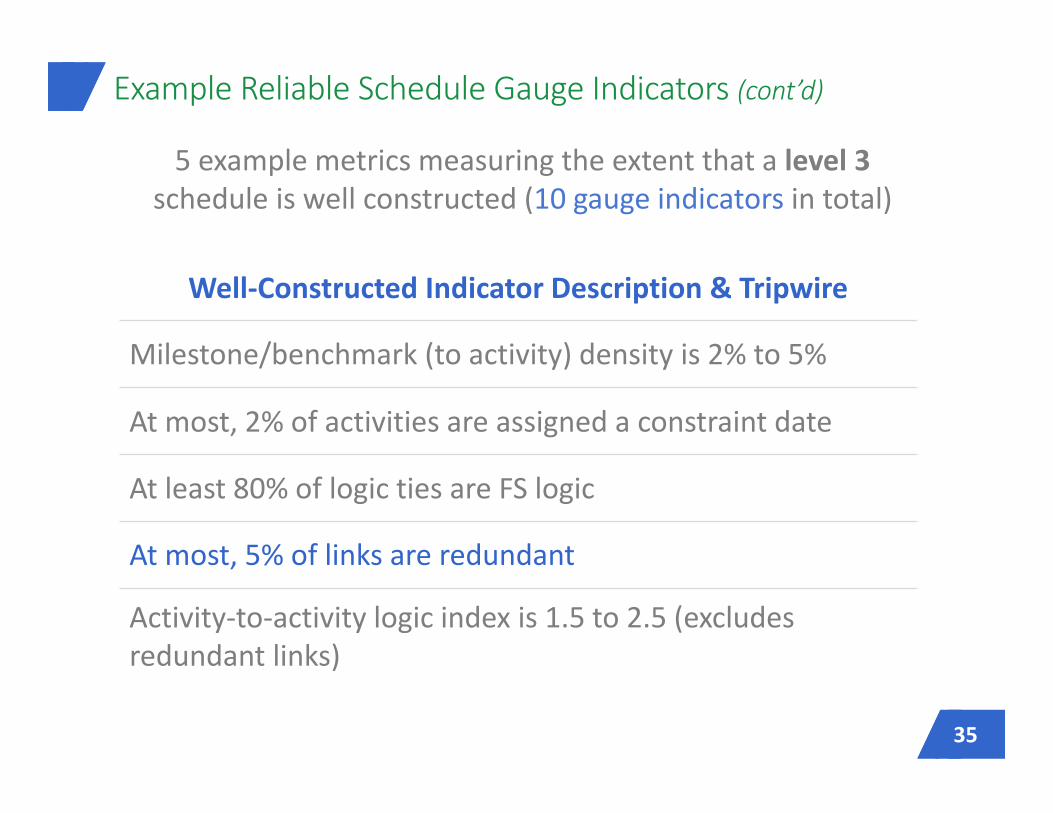
Example Reliable Schedule Gauge Indicators (cont’d)
5 example metrics measuring the extent that a level 3schedule is well constructed (10 gauge indicators in total)
35
Well‐Constructed Indicator Description & Tripwire
Milestone/benchmark (to activity) density is 2% to 5%
At most, 2% of activities are assigned a constraint date
At least 80% of logic ties are FS logic
At most, 5% of links are redundant
Activity‐to‐activity logic index is 1.5 to 2.5 (excludes redundant links)

SCHEDULE IQ™
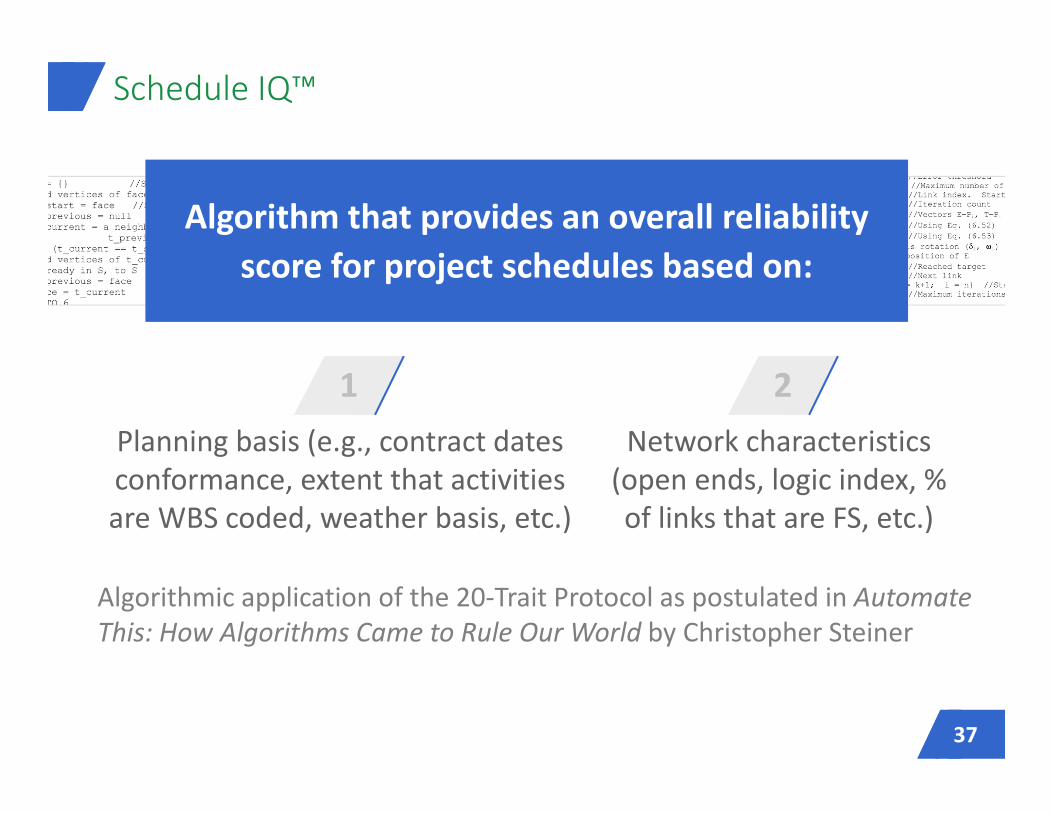
Algorithmic application of the 20‐Trait Protocol as postulated in Automate This: How Algorithms Came to Rule Our World by Christopher Steiner
Schedule IQ™
Planning basis (e.g., contract dates conformance, extent that activities are WBS coded, weather basis, etc.)
Network characteristics (open ends, logic index, % of links that are FS, etc.)
1 2
Algorithm that provides an overall reliability score for project schedules based on:
37
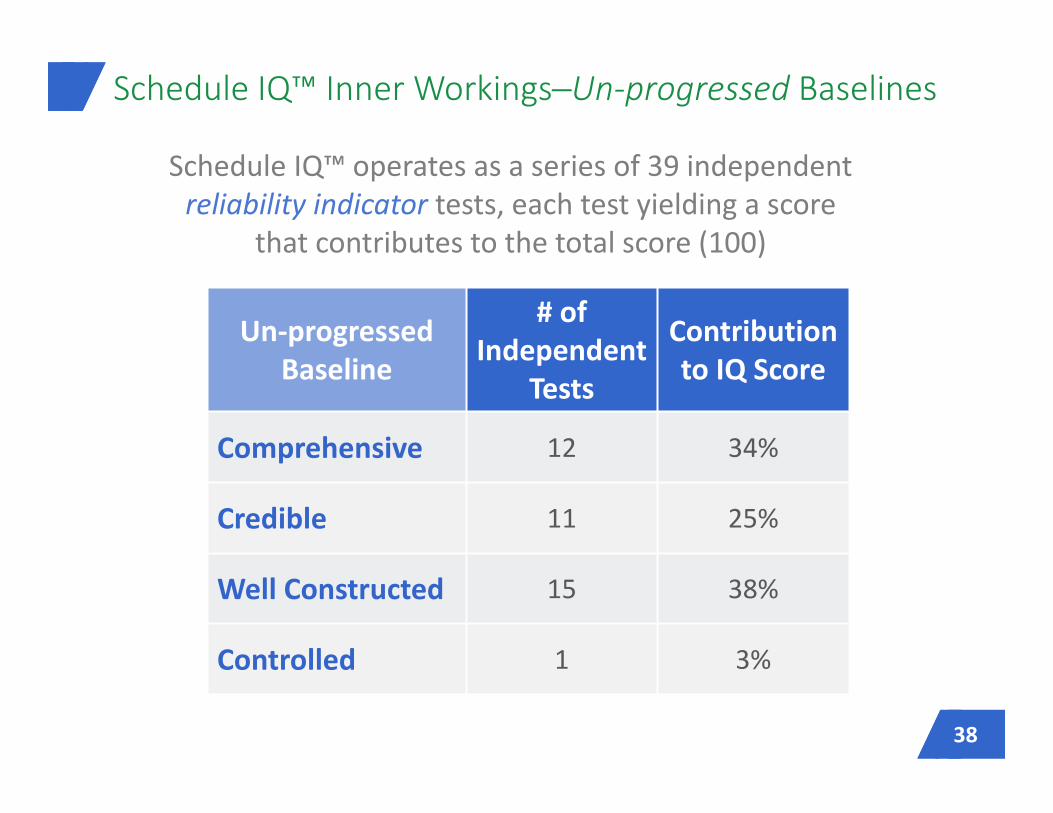
Schedule IQ™ Inner Workings─Un‐progressed Baselines
Schedule IQ™ operates as a series of 39 independent reliability indicator tests, each test yielding a score
that contributes to the total score (100)
Un‐progressed Baseline
# of Independent
Tests
Contribution to IQ Score
Comprehensive 12 34%
Credible 11 25%
Well Constructed 15 38%
Controlled 1 3%
38
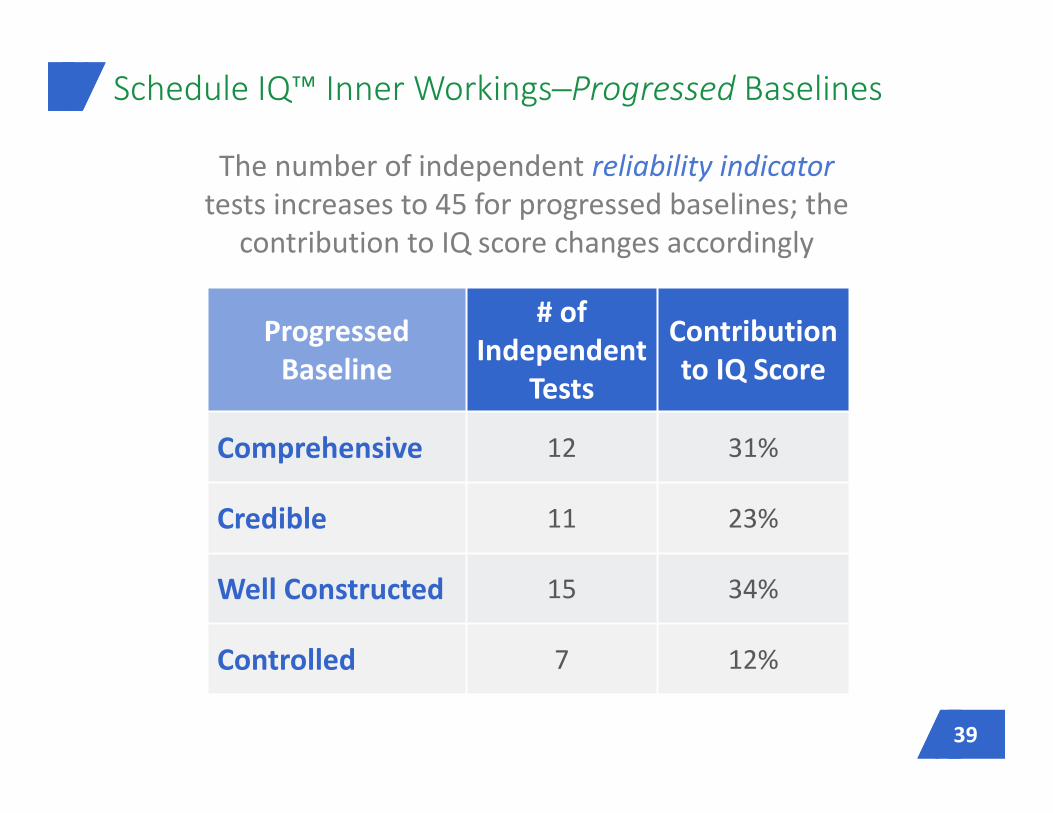
Schedule IQ™ Inner Workings─Progressed Baselines
The number of independent reliability indicatortests increases to 45 for progressed baselines; the
contribution to IQ score changes accordingly
Progressed Baseline
# of Independent
Tests
Contribution to IQ Score
Comprehensive 12 31%
Credible 11 23%
Well Constructed 15 34%
Controlled 7 12%
39
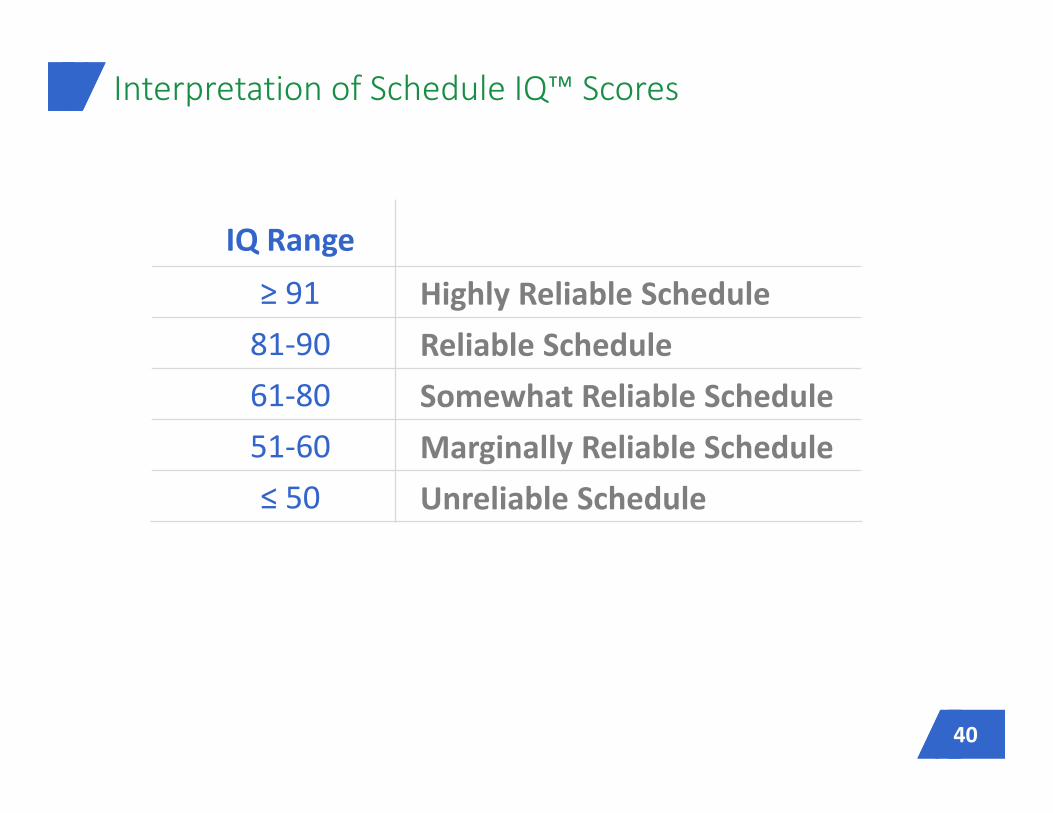
Interpretation of Schedule IQ™ Scores
40
IQ Range
Somewhat Reliable Schedule
Unreliable Schedule
≥ 9181‐9061‐8051‐60≤ 50
Reliable ScheduleHighly Reliable Schedule
Marginally Reliable Schedule
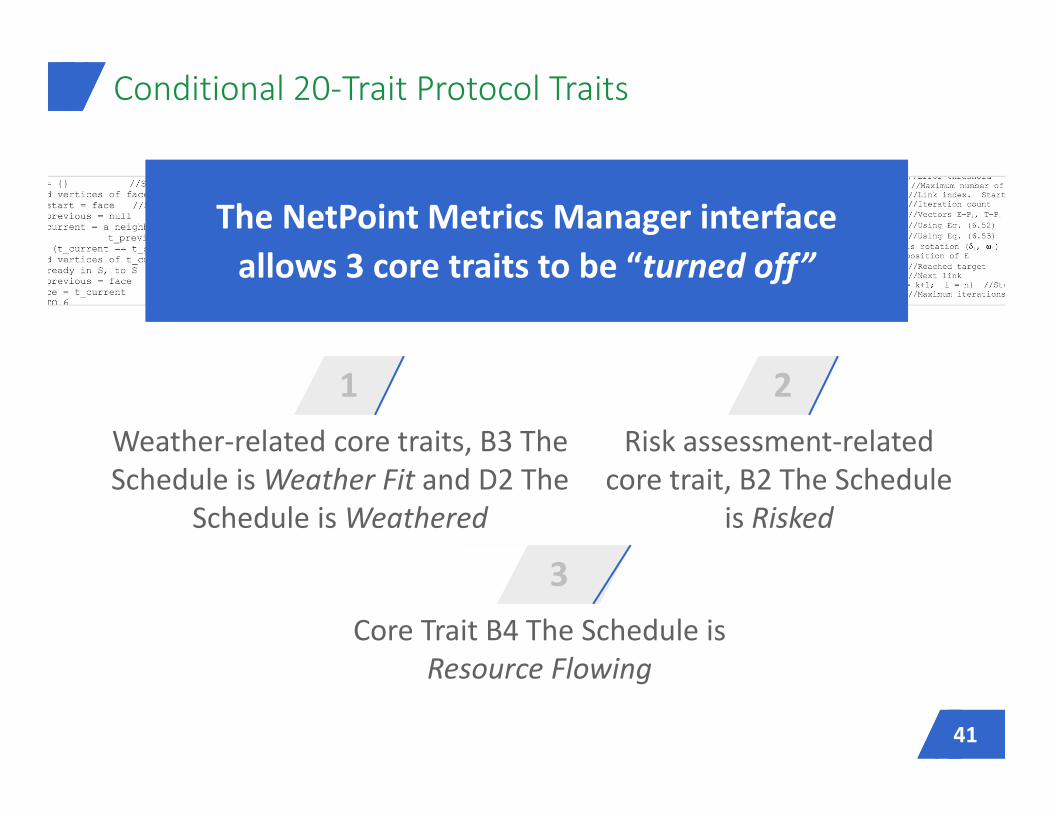
Conditional 20‐Trait Protocol Traits
Weather‐related core traits, B3 The Schedule is Weather Fit and D2 The
Schedule is Weathered
Risk assessment‐related core trait, B2 The Schedule
is Risked
1 2
The NetPoint Metrics Manager interface allows 3 core traits to be “turned off”
Core Trait B4 The Schedule is Resource Flowing
3
41

SUMMARY
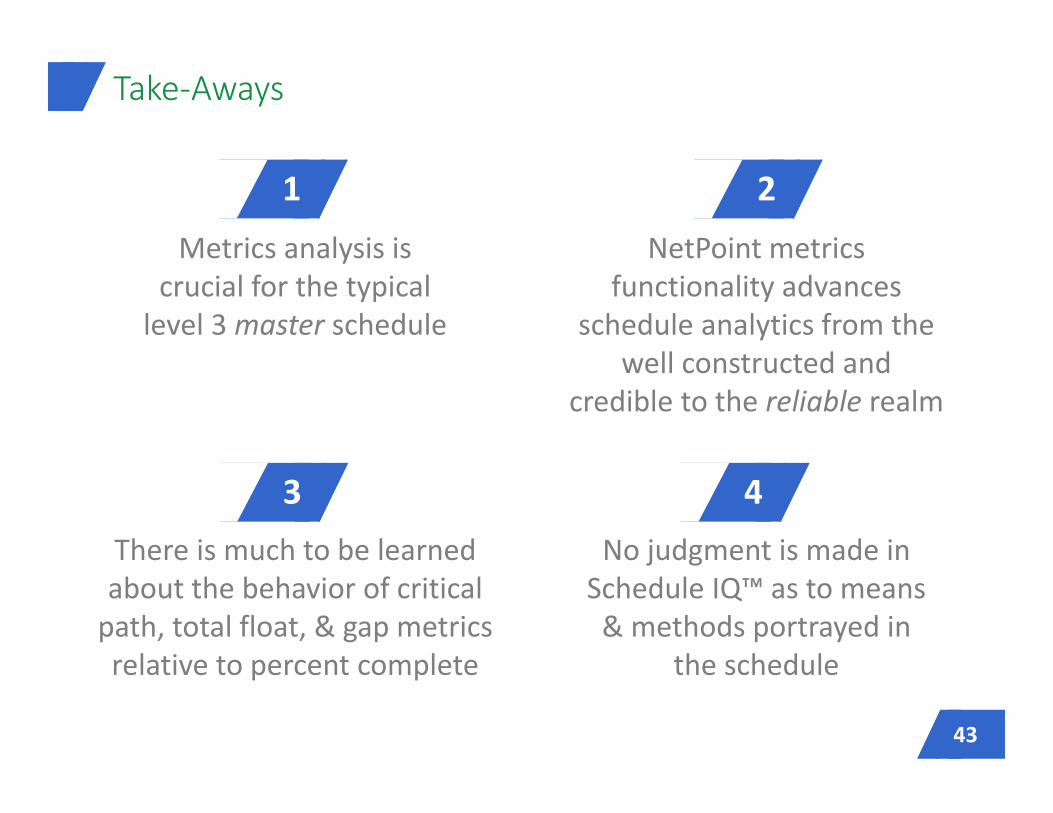
Take‐Aways
Metrics analysis is crucial for the typical level 3 master schedule
NetPoint metrics functionality advances
schedule analytics from the well constructed and
credible to the reliable realm
There is much to be learned about the behavior of critical path, total float, & gap metrics relative to percent complete
No judgment is made in Schedule IQ™ as to means & methods portrayed in
the schedule
1 2
3 4
43
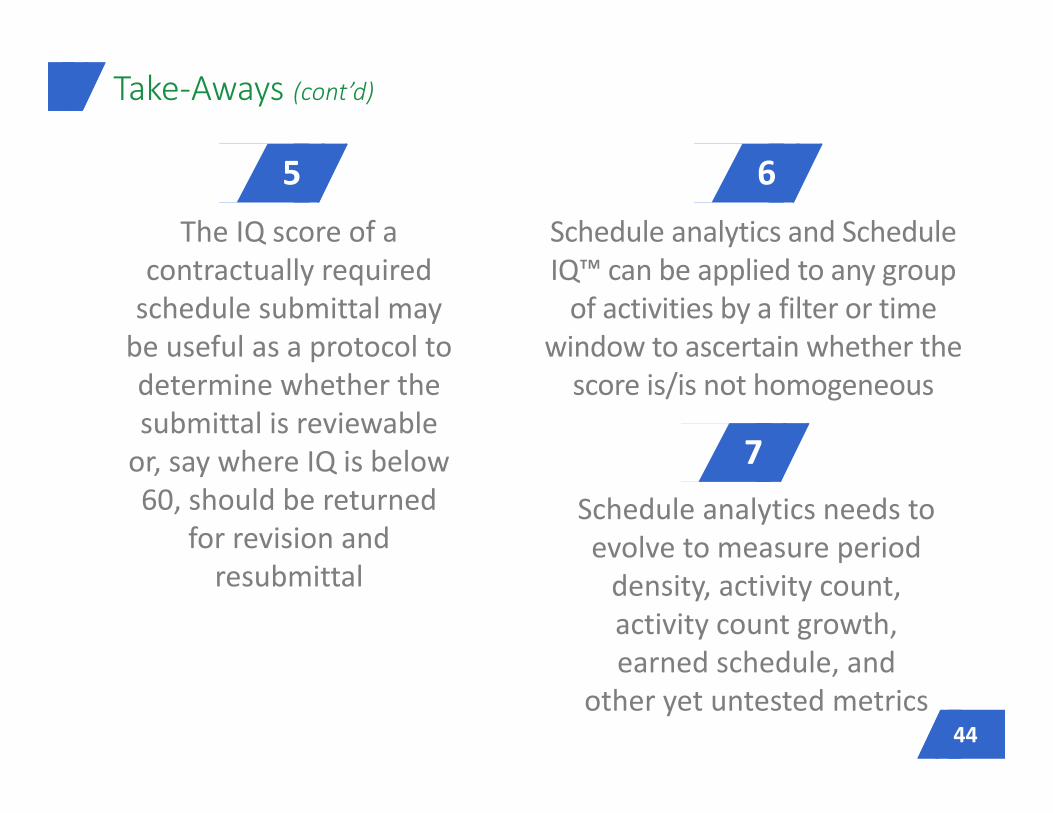
Take‐Aways (cont’d)
The IQ score of a contractually required schedule submittal may be useful as a protocol to determine whether the submittal is reviewable or, say where IQ is below 60, should be returned
for revision and resubmittal
Schedule analytics and Schedule IQ™ can be applied to any group of activities by a filter or time
window to ascertain whether the score is/is not homogeneous
Schedule analytics needs to evolve to measure period density, activity count, activity count growth, earned schedule, and
other yet untested metrics
5 6
7
44
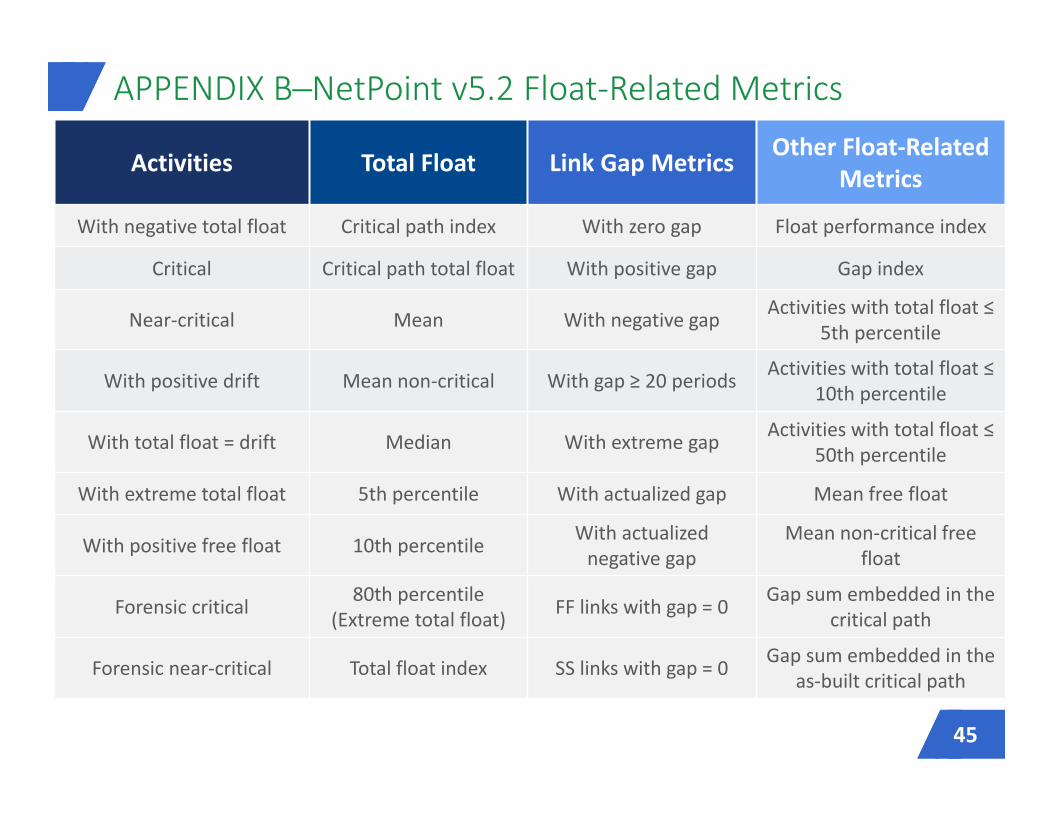
APPENDIX B─NetPoint v5.2 Float‐Related Metrics
Activities Total Float Link Gap Metrics Other Float‐Related Metrics
With negative total float Critical path index With zero gap Float performance index
Critical Critical path total float With positive gap Gap index
Near‐critical Mean With negative gap Activities with total float ≤ 5th percentile
With positive drift Mean non‐critical With gap ≥ 20 periods Activities with total float ≤ 10th percentile
With total float = drift Median With extreme gap Activities with total float ≤ 50th percentile
With extreme total float 5th percentile With actualized gap Mean free float
With positive free float 10th percentile With actualized negative gap
Mean non‐critical free float
Forensic critical 80th percentile (Extreme total float) FF links with gap = 0 Gap sum embedded in the
critical path
Forensic near‐critical Total float index SS links with gap = 0 Gap sum embedded in the as‐built critical path
45


Thank You!Learn more at:
pmaconsultants.com/services/innovation/
Try NetPoint at:
pmatechnologies.com