
JUEGOS POPULARES Y TRADICIONALES ANDALUCES II EN EL CEIP SIMON BOLÍVAR
Upload
dr-haxel-congress-and-event-management-gmbhCategory
view
463download
1
Visual Data Exploration:Having a Conversation With
Complex Data to Understand
What Else it Contains
SDV Nice April 2016
Simon Fitall
CEO Galileo Analytics

“All truths are easy to understand once they are discovered;
the point is to discover them.”
Galileo Galilei, 15 February 1564 – 8 January
1642
Data discovery and the Scientific Process

What Would Galileo Do (WWGD)?
What DID Galileo Do?
• Invention

What Would Galileo Do (WWGD)?
What DID Galileo Do?
• Invention
• Experimentation

What Would Galileo Do (WWGD)?
What DID Galileo Do?
• Invention
• Experimentation
• Observation
What has been the traditional approach to data
analysis of the last 40years?


Edgar F. CoddAugust 23, 1923 – April 18,
2003
"A Relational Model of Data for
Large Shared Data Banks“
1970

Why is a New Approach Necessary?
A revolution in the availability of data
A revolution in the sources of data
A revolution in the creation of data
The observable universe has grown beyond
all recognition – and continues to grow at an
increasing rate

From Experimentation to Exploration
Experimentation
• Predetermined data variables
• Predefined cohorts
• Aggregated data for most studies
• Predefined analytics
• Thousands of separate studies covering population groups – point solutions
Exploration
• N x 102 data variables
• N x 103 data sources
• N x 106 points of service
• N x 109 patients
• N x 1012 data points PER DAY
• Almost infinite granularity at longitudinal patient level – multi-point solutions
Predefined Cohorts
N x 1012 data points
PER DAY

The magnitude of the analytical issue….
Diagnosis to SNP – 1-1 is smaller than a golf ball
1-3 is a sports stadium
1-2 is a basket ball

Clearly we need an alternative• We CANNOT test all the hypotheses and find all
the cohorts
• However, research suggests that we need to look
at the broad scope of dimensions available in the
data
• So we must restrict the dimensions of interest
• Visual data exploration is a possible route for
analysis…….
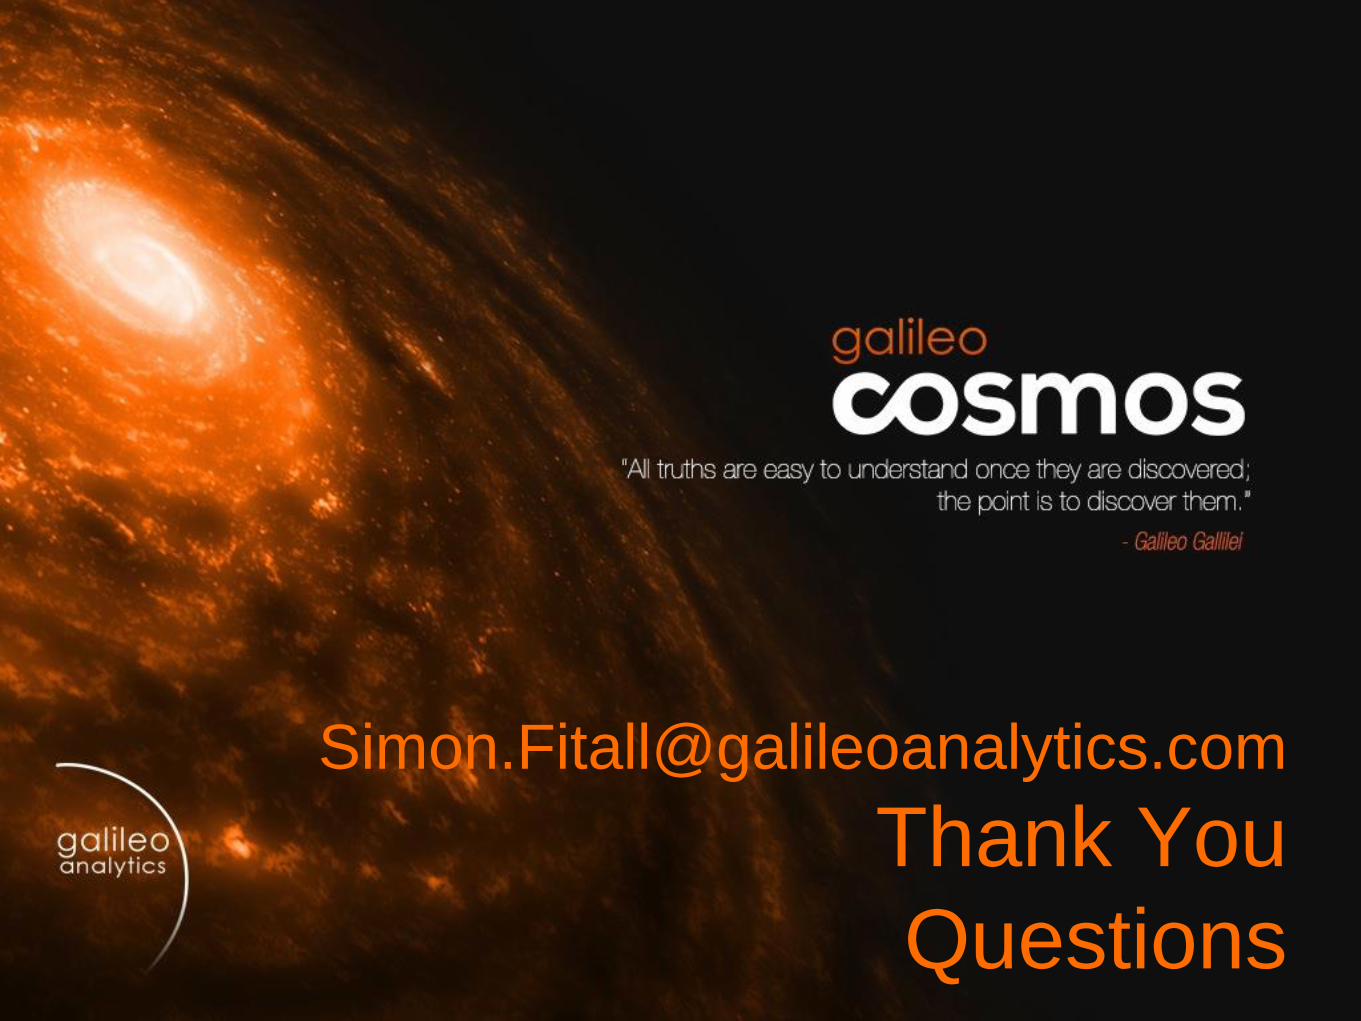
Characteristics of Effective Data
Exploration
WHAT – are we looking for?
WHO – do we want looking for it?
HOW – do we want to look for it?

Insights…....
Point the Hubble telescope at an
apparently empty piece of space
and what do you find?
Thousands of
GALAXIES!
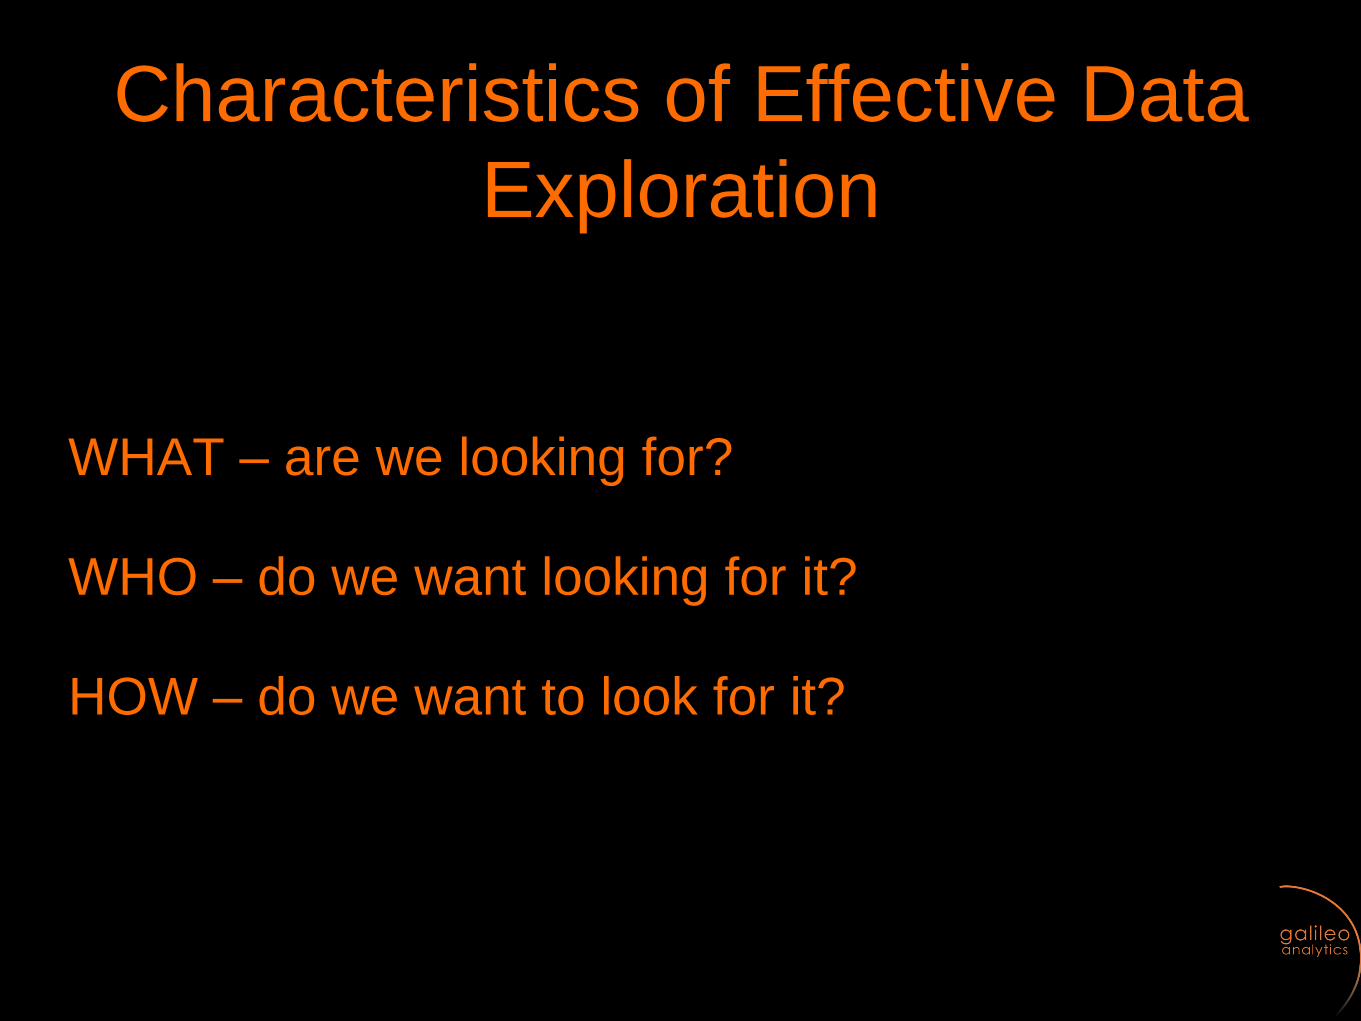
Insights Example: Top Non-Respiratory Co-morbidities
Patients with COPD v’s All Patient Average
0%
10%
20%
30%
40%
50%
60%
ANXIETY ANDDEPRESSION
JOINT PAIN HEART DISEASE CANCER OEDEMA
57%
33%30%
22%20%
31%
26%
20%
15%
9%
Source : Cegedim / Galileo Cosmos
% COPD patients with diagnosis
% All patients with diagnosis

WHO – do we want looking for
Insights?Content matter experts
With intellectual curiosity
• A clinician with an unusual patient cohort
• A researcher needing to recruit to a clinical trial
• A public health specialist wishing to better understand disease patterns

Visual Exploration of Data• Visual analytics
• Organizes data in solar
systems of interrelated
variables (cohorts)
• Easy to use and
understand
• Explore multiple
hypotheses
• Coding free to allow
access to content matter
experts

Visual Exploration of Data
• Dynamic charting (by cohort)
• Characterises the cohort -
especially outliers
• Charting adjusts with
changes in underlying
analysis
• Define and refine cohortss
as you explore the data
• Full descriptive statistics
(direct interface with “R”)

Findings: Cohort with inconsistent lab results
associated with prescribing of different types of drug
Source : Cegedim / Galileo
Cosmos
Prescribing by Product Class
Lab results by class
These values were
unexpected
because they are
inconsistent with
normal usage
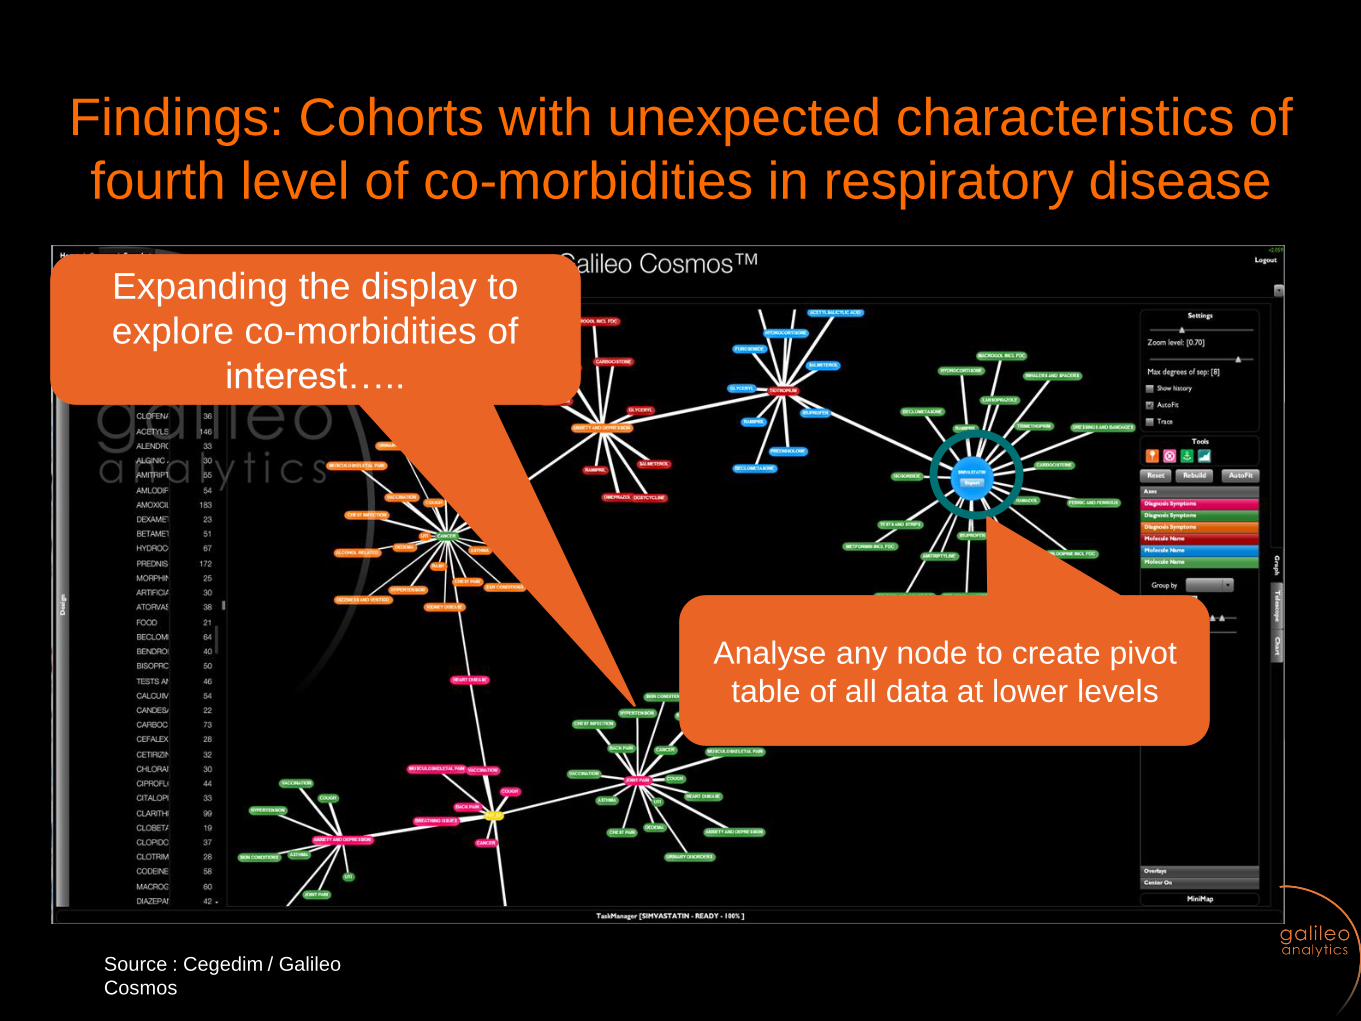
Findings: Cohorts with unexpected characteristics of
fourth level of co-morbidities in respiratory disease
Source : Cegedim / Galileo
Cosmos
Expanding the display to
explore co-morbidities of
interest…..
Analyse any node to create pivot
table of all data at lower levels

Findings: Identified new cohort of men with a
disproportionate presence of co-morbidity
Source : Cegedim / Galileo
Cosmos
COPD + Heart Disease + Cancer
show significantly more men with
Anxiety & Depression

Visual Exploration SummaryVisual
ARRAY OF visual methods for exploring and viewing the data
Combining array based data mapping with browser-based GUI
Fast
Rapid iteration of multiple cohorts, with full characterization
Calculation on demand to reduce overhead costs
Flexible
Any combination of variables explored in multiple ways
Array mapping allows unlimited cross-analysis
“Near Limitless”Parallel processing, sharding, multi-core expansion limited only
by available hardware

Just part of a 17,000 node display
Each node
represents a
unique patient
cohort
Node colors
represent a
different stage
of therapy
• Background calculations can explore multiple
characteristics of all nodes
• Display can select only those nodes that meet
required criteria
• The USER selects what they want to view
• All done across large datasets including clinical
and genomic
• Watch this space…….