How do East African cities deliver sustainable economic ...FILE/EY...deliver sustainable economic...
44
How do East African cities deliver sustainable economic development through infrastructure delivery? September 2014
Transcript of How do East African cities deliver sustainable economic ...FILE/EY...deliver sustainable economic...
How do East African cities
deliver sustainable
economic development
through infrastructure
delivery?
September 2014

CONTENTS
Section 1: East Africa country profiles
Section 2: What are the real problems?
Section 3: A model for economic development
Section 4: Our approach to economic development
5
23
30
34
3
4
Quite rightly, the talk of an “African economic Renaissance” continues to grow. The reality is that a wide range of African countries have now experienced consistent and robust growth for over a decade. In the period since 2002, the size of the overall African economy has more than trebled. What makes this economic performance all the more remarkable is that half of the decade has been marked by a deeply troubled global economy. A diverse group of African economies (including Ethiopia and Tanzania in East Africa)are among the fastest growing in the world, with growth at 7%+ over a sustained period. The signs for Africa and East Africa in particular are good - investor interest is driven by strong economic growth, rising foreign exchange reserves, quality and cost competitiveness and encouraging Government policy-making. These strong levels of economic growth have led to an expansion of industry, commerce and per capita income which in turn has fuelled demand for infrastructure services including energy, transportation, ICT, water supply, growing agriculture and urban infrastructure. East Africa has a history that demonstrates the positive relationship between infrastructure growth and country buoyancy (measured by GDP). In the period between 1995-2005, improvements in communication technologies and Power infrastructure boosted growth by approximately one percentage point per year. Indeed in terms of access to improved sources of water and sanitation and internet density, it is at least comparable with the subcontinent’s leader, Southern Africa. However, even with this investment, East Africa’s infrastructure ranks behind that of its neighbours South and West Africa across a range of other indicators and by contrast, density of fixed-line telephones, power generation capacity, and access to electricity remain extremely low (though utility performance is improving through regional power trades). The road network requires improvement and all forms of surface transport are challenged by border crossings, port delays, slow travel, limited railways, and trade logistics. Air transport benefits from a strong hub-and-spoke structure but has made little progress toward a free and competitive market. Of the seven countries in the region, four are landlocked, two have populations of fewer than 10 million people, and two have an annual gross domestic product of less than $10 billion. The difficult economic geography of East Africa makes a regional approach to infrastructure development necessary to achieve further improvement. We are delighted that this, our first East Africa economic development specific publication, creates an opportunity through our current thought leadership and capabilities, to consider both the unique strengths of each country in the cluster whilst also enabling a genuine discussion on regional infrastructure development, cognizant of a complex set of problem statements. We hope that you are as excited as us at the opportunities for sustainable economic development to galvanize community development and prosperity and set a course for an integrated and connected (East) Africa! We look forward to meeting with you and discussing every matter of interest. Warmest regards,
Joe Cosma
FOREWORD
Joe Cosma
Advisory Sector Leader
Government & Infrastructure
Tel: +27 (0)11 772 5416 Email: [email protected]
Celestine Munda
East Region Advisory Leader
Tel: +27 (0)11 772 3315 Email: [email protected]
5
East Africacountry profiles
6
South Sudan
Tanzania
KenyaUganda
Ethiopia
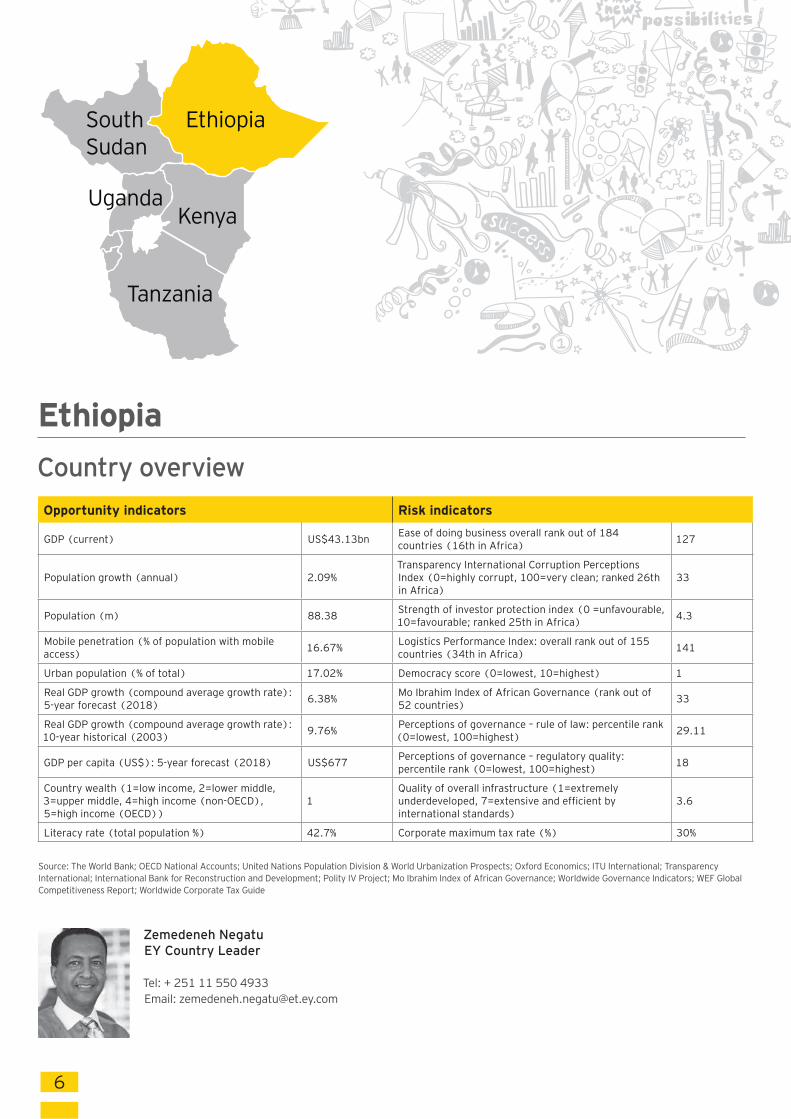
Country overview
Opportunity indicators Risk indicators
GDP (current) US$43.13bn Ease of doing business overall rank out of 184 countries (16th in Africa)
127
Population growth (annual) 2.09%Transparency International Corruption Perceptions Index (0=highly corrupt, 100=very clean; ranked 26th in Africa)
33
Population (m) 88.38Strength of investor protection index (0 =unfavourable, 10=favourable; ranked 25th in Africa) 4.3
Mobile penetration (% of population with mobile access) 16.67% Logistics Performance Index: overall rank out of 155
countries (34th in Africa) 141
Urban population (% of total) 17.02% Democracy score (0=lowest, 10=highest) 1
Real GDP growth (compound average growth rate): 5-year forecast (2018)
6.38%Mo Ibrahim Index of African Governance (rank out of 52 countries)
33
Real GDP growth (compound average growth rate): 10-year historical (2003) 9.76%
Perceptions of governance – rule of law: percentile rank (0=lowest, 100=highest) 29.11
GDP per capita (US$): 5-year forecast (2018) US$677Perceptions of governance – regulatory quality: percentile rank (0=lowest, 100=highest) 18
Country wealth (1=low income, 2=lower middle, 3=upper middle, 4=high income (non-OECD), 5=high income (OECD))
1Quality of overall infrastructure (1=extremely underdeveloped, 7=extensive and efficient by international standards)
3.6
Literacy rate (total population %) 42.7% Corporate maximum tax rate (%) 30%
Source: The World Bank; OECD National Accounts; United Nations Population Division & World Urbanization Prospects; Oxford Economics; ITU International; Transparency International; International Bank for Reconstruction and Development; Polity IV Project; Mo Ibrahim Index of African Governance; Worldwide Governance Indicators; WEF Global Competitiveness Report; Worldwide Corporate Tax Guide
Ethiopia
Zemedeneh Negatu
EY Country Leader
Tel: + 251 11 550 4933 Email: [email protected]
7
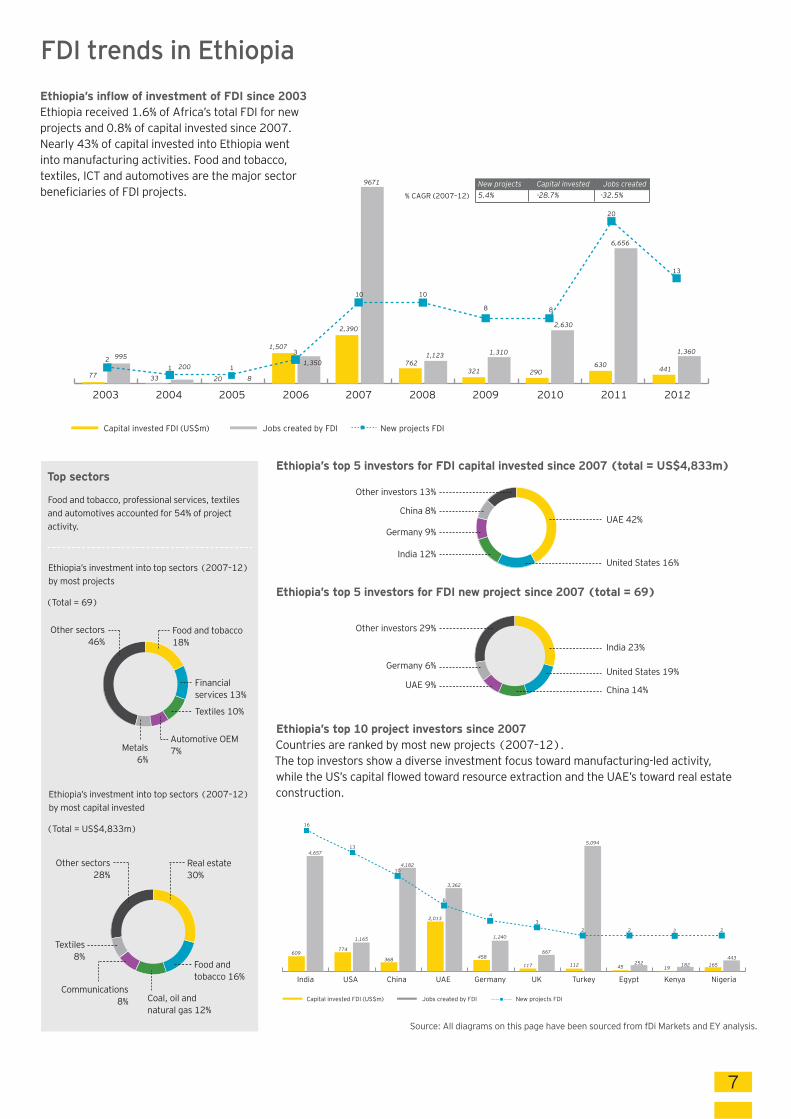
Ethiopia’s top 10 project investors since 2007Countries are ranked by most new projects (2007–12).The top investors show a diverse investment focus toward manufacturing-led activity, while the US’s capital flowed toward resource extraction and the UAE’s toward real estate construction.
Source: All diagrams on this page have been sourced from fDi Markets and EY analysis.
Top sectors
Ethiopia’s investment into top sectors (2007–12) by most projects
(Total = 69)
Food and tobacco, professional services, textiles and automotives accounted for 54% of project activity.
Ethiopia’s investment into top sectors (2007–12) by most capital invested
(Total = US$4,833m)
FDI trends in Ethiopia
Capital invested FDI (US$m) Jobs created by FDI
2003 2004 2005 2006 2008 2009 2010 2011 20122007
77
995
33
200
20
1,350
9671
1,123 1,310
321 290630
2,630
6,656
441
1,3601,507
8
762
2,390
21
3
1
10 10
8 8
20
13
New projects Capital invested Jobs created5.4% -28.7% -32.5%% CAGR (2007–12)
New projects FDI
Ethiopia’s inflow of investment of FDI since 2003Ethiopia received 1.6% of Africa’s total FDI for new projects and 0.8% of capital invested since 2007.Nearly 43% of capital invested into Ethiopia went into manufacturing activities. Food and tobacco, textiles, ICT and automotives are the major sector beneficiaries of FDI projects.
Jobs created by FDICapital invested FDI (US$m)
India USA China UAE UK Turkey Egypt Kenya NigeriaGermany
609
4,657
774
1,165
368
4,182
3,362
1,240
667
5,094
112117 45 19252 182 165
443458
2,013
16
13
10
6
4
2 222
3
New projects FDI
Ethiopia’s top 5 investors for FDI new project since 2007 (total = 69)
India 23%
Other investors 29%
Germany 6%
UAE 9%United States 19%
China 14%
Ethiopia’s top 5 investors for FDI capital invested since 2007 (total = US$4,833m)
India 12%
Germany 9%
China 8%
Other investors 13%
UAE 42%
United States 16%
Real estate30%
Food and tobacco 16%
Coal, oil and natural gas 12%
Communications8%
Textiles8%
Other sectors28%
Food and tobacco18%
Automotive OEM7%Metals
6%
Other sectors 46%
Financial services 13%
Textiles 10%
8
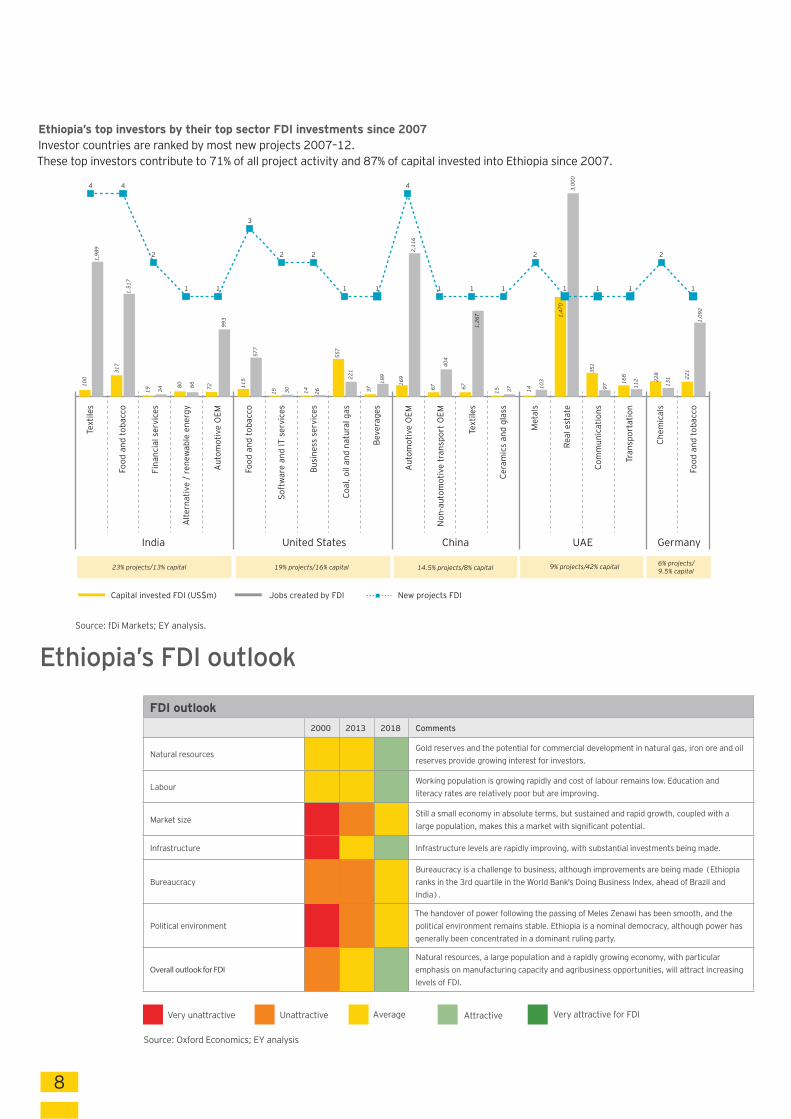
Ethiopia’s top investors by their top sector FDI investments since 2007Investor countries are ranked by most new projects 2007–12.These top investors contribute to 71% of all project activity and 87% of capital invested into Ethiopia since 2007.
Ethiopia’s FDI outlook
FDI outlook
2000 2013 2018 Comments
Natural resourcesGold reserves and the potential for commercial development in natural gas, iron ore and oil
reserves provide growing interest for investors.
LabourWorking population is growing rapidly and cost of labour remains low. Education and literacy rates are relatively poor but are improving.
Market sizeStill a small economy in absolute terms, but sustained and rapid growth, coupled with a large population, makes this a market with significant potential.
Infrastructure Infrastructure levels are rapidly improving, with substantial investments being made.
BureaucracyBureaucracy is a challenge to business, although improvements are being made (Ethiopia ranks in the 3rd quartile in the World Bank's Doing Business Index, ahead of Brazil and
India).
Political environment
The handover of power following the passing of Meles Zenawi has been smooth, and the
political environment remains stable. Ethiopia is a nominal democracy, although power has generally been concentrated in a dominant ruling party.
Overall outlook for FDINatural resources, a large population and a rapidly growing economy, with particular emphasis on manufacturing capacity and agribusiness opportunities, will attract increasing
levels of FDI.
Source: Oxford Economics; EY analysis
Very unattractive Unattractive Average Attractive Very attractive for FDI
Jobs created by FDICapital invested FDI (US$m)
Text
iles
Food
and
toba
cco
Fina
ncia
l ser
vice
s
Alte
rnat
ive
/ re
new
able
ene
rgy
Aut
omot
ive
OEM
Food
and
toba
cco
Soft
war
e an
d IT
ser
vice
s
Busi
ness
ser
vice
s
Coal
, oil
and
natu
ral g
as
Beve
rage
s
Aut
omot
ive
OEM
Non
-aut
omot
ive
tran
spor
t OEM
Text
iles
Cera
mic
s an
d gl
ass
Met
als
Real
est
ate
Com
mun
icat
ions
Tran
spor
tatio
n
Chem
ical
s
1,98
9
317
1,51
7
19 34
80 66 72
993
115
577
15 30 14 26
557
221
37
189
169
2,11
6
67
404
67
1,26
7
15 37 14
103
1,47
0
3,00
0
351
97
168
112 22
8
131 22
1
1,09
2
India China UAE GermanyUnited States
6% projects/ 9.5% capital
Food
and
toba
cco
100
9% projects/42% capital14.5% projects/8% capital19% projects/16% capital23% projects/13% capital
4 4
2
1 1
3
2 2
1 1
4
1 1 1
2
1 1 1
2
1
New projects FDI
Source: fDi Markets; EY analysis.
9
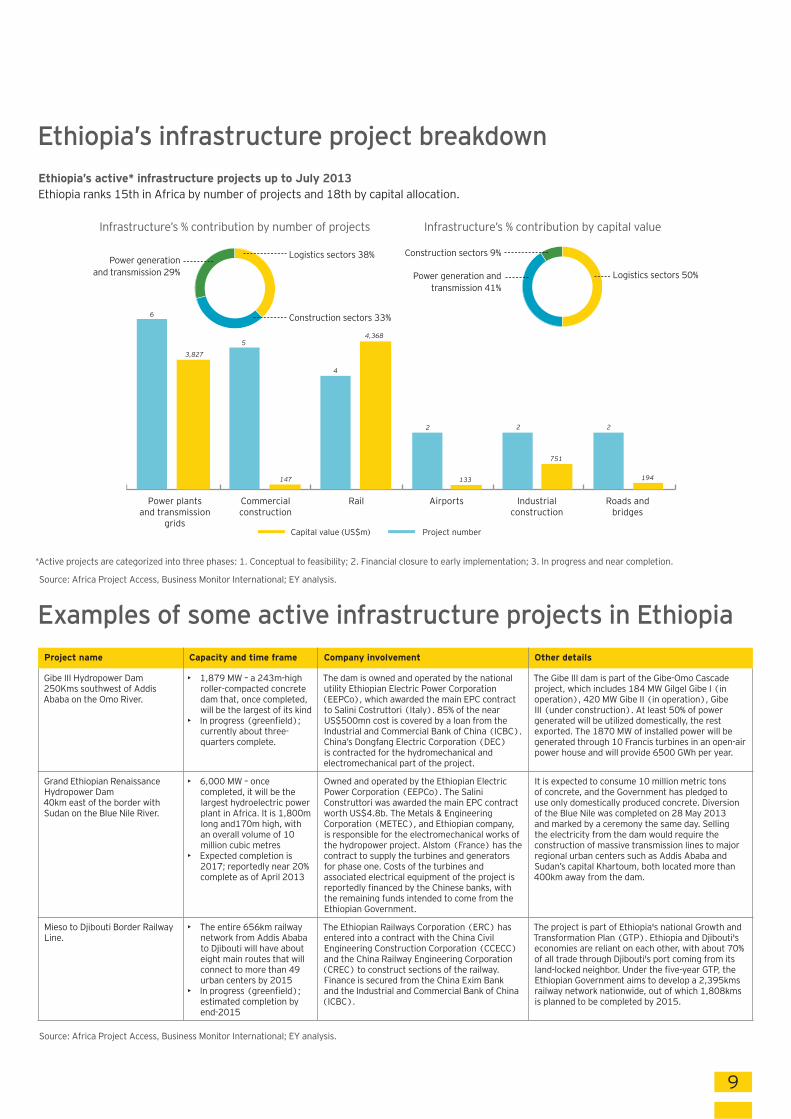
Project numberCapital value (US$m)
1200
2400
3600
4800
Power plantsand transmission
grids
Commercialconstruction
Airports Industrialconstruction
Roads andbridges
Rail
4,368
3,827
5
147
4
6
2
133
2
751
2
194
Ethiopia’s active* infrastructure projects up to July 2013Ethiopia ranks 15th in Africa by number of projects and 18th by capital allocation.
Ethiopia’s infrastructure project breakdown
Examples of some active infrastructure projects in Ethiopia
Project name Capacity and time frame Company involvement Other details
Gibe III Hydropower Dam250Kms southwest of Addis Ababa on the Omo River.
• 1,879 MW – a 243m-high roller-compacted concrete dam that, once completed, will be the largest of its kind
• In progress (greenfield); currently about three-quarters complete.
The dam is owned and operated by the national utility Ethiopian Electric Power Corporation (EEPCo), which awarded the main EPC contract to Salini Costruttori (Italy). 85% of the near US$500mn cost is covered by a loan from the Industrial and Commercial Bank of China (ICBC). China’s Dongfang Electric Corporation (DEC) is contracted for the hydromechanical and electromechanical part of the project.
The Gibe III dam is part of the Gibe-Omo Cascade project, which includes 184 MW Gilgel Gibe I (in operation), 420 MW Gibe II (in operation), Gibe III (under construction). At least 50% of power generated will be utilized domestically, the rest exported. The 1870 MW of installed power will be generated through 10 Francis turbines in an open-air power house and will provide 6500 GWh per year.
Grand Ethiopian Renaissance Hydropower Dam40km east of the border with Sudan on the Blue Nile River.
• 6,000 MW – once completed, it will be the largest hydroelectric power plant in Africa. It is 1,800m long and170m high, with an overall volume of 10 million cubic metres
• Expected completion is 2017; reportedly near 20% complete as of April 2013
Owned and operated by the Ethiopian Electric Power Corporation (EEPCo). The Salini Construttori was awarded the main EPC contract worth US$4.8b. The Metals & Engineering Corporation (METEC), and Ethiopian company, is responsible for the electromechanical works of the hydropower project. Alstom (France) has the contract to supply the turbines and generators for phase one. Costs of the turbines and associated electrical equipment of the project is reportedly financed by the Chinese banks, with the remaining funds intended to come from the Ethiopian Government.
It is expected to consume 10 million metric tons of concrete, and the Government has pledged to use only domestically produced concrete. Diversion of the Blue Nile was completed on 28 May 2013 and marked by a ceremony the same day. Selling the electricity from the dam would require the construction of massive transmission lines to major regional urban centers such as Addis Ababa and Sudan’s capital Khartoum, both located more than 400km away from the dam.
Mieso to Djibouti Border Railway Line.
• The entire 656km railway network from Addis Ababa to Djibouti will have about eight main routes that will connect to more than 49 urban centers by 2015
• In progress (greenfield); estimated completion by end-2015
The Ethiopian Railways Corporation (ERC) has entered into a contract with the China Civil Engineering Construction Corporation (CCECC) and the China Railway Engineering Corporation (CREC) to construct sections of the railway. Finance is secured from the China Exim Bank and the Industrial and Commercial Bank of China (ICBC).
The project is part of Ethiopia's national Growth and Transformation Plan (GTP). Ethiopia and Djibouti's economies are reliant on each other, with about 70% of all trade through Djibouti's port coming from its land-locked neighbor. Under the five-year GTP, the Ethiopian Government aims to develop a 2,395kms railway network nationwide, out of which 1,808kms is planned to be completed by 2015.
Infrastructure’s % contribution by capital value
Construction sectors 9%
Power generation andtransmission 41%
Logistics sectors 50%
Infrastructure’s % contribution by number of projects
Construction sectors 33%
Logistics sectors 38%Power generation
and transmission 29%
*Active projects are categorized into three phases: 1. Conceptual to feasibility; 2. Financial closure to early implementation; 3. In progress and near completion.
Source: Africa Project Access, Business Monitor International; EY analysis.
Source: Africa Project Access, Business Monitor International; EY analysis.
10
South Sudan
Tanzania
KenyaUganda
Ethiopia
Country overview
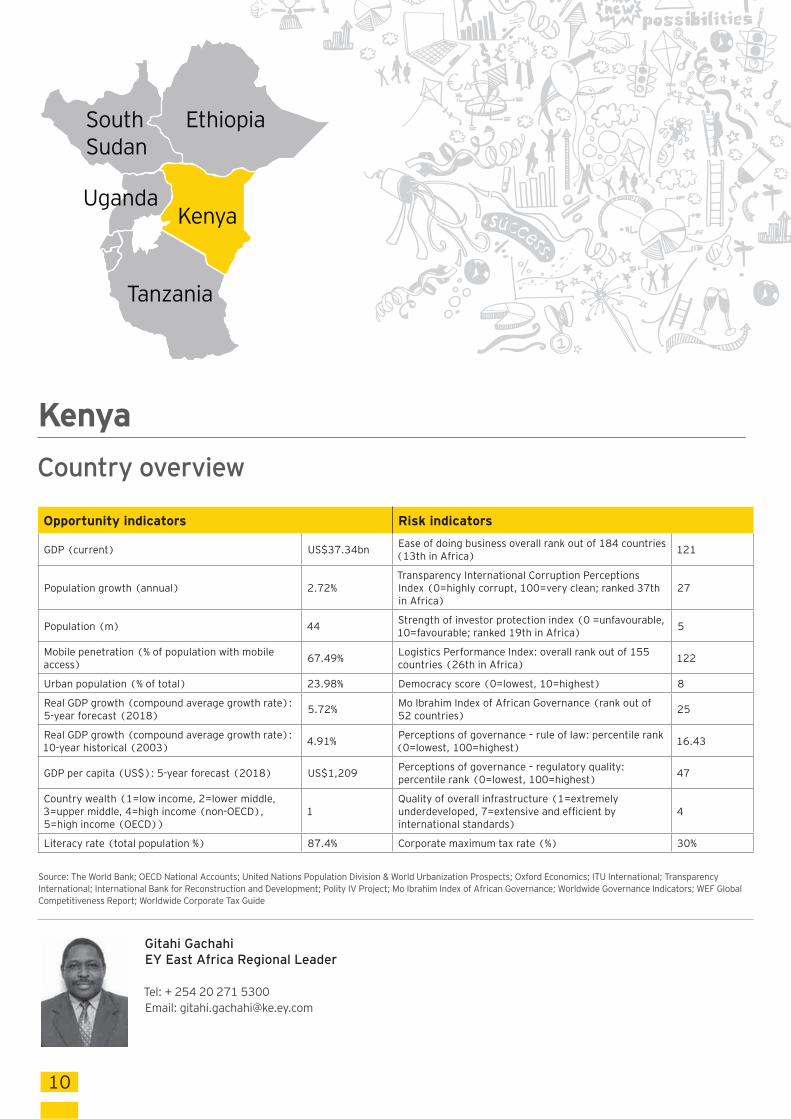
Kenya
Gitahi Gachahi
EY East Africa Regional Leader
Tel: + 254 20 271 5300 Email: [email protected]
Opportunity indicators Risk indicators
GDP (current) US$37.34bn Ease of doing business overall rank out of 184 countries (13th in Africa)
121
Population growth (annual) 2.72%Transparency International Corruption Perceptions Index (0=highly corrupt, 100=very clean; ranked 37th in Africa)
27
Population (m) 44Strength of investor protection index (0 =unfavourable, 10=favourable; ranked 19th in Africa)
5
Mobile penetration (% of population with mobile access) 67.49%
Logistics Performance Index: overall rank out of 155 countries (26th in Africa) 122
Urban population (% of total) 23.98% Democracy score (0=lowest, 10=highest) 8
Real GDP growth (compound average growth rate): 5-year forecast (2018)
5.72% Mo Ibrahim Index of African Governance (rank out of 52 countries)
25
Real GDP growth (compound average growth rate): 10-year historical (2003) 4.91%
Perceptions of governance – rule of law: percentile rank (0=lowest, 100=highest)
16.43
GDP per capita (US$): 5-year forecast (2018) US$1,209Perceptions of governance – regulatory quality: percentile rank (0=lowest, 100=highest) 47
Country wealth (1=low income, 2=lower middle, 3=upper middle, 4=high income (non-OECD), 5=high income (OECD))
1Quality of overall infrastructure (1=extremely underdeveloped, 7=extensive and efficient by international standards)
4
Literacy rate (total population %) 87.4% Corporate maximum tax rate (%) 30%
Source: The World Bank; OECD National Accounts; United Nations Population Division & World Urbanization Prospects; Oxford Economics; ITU International; Transparency International; International Bank for Reconstruction and Development; Polity IV Project; Mo Ibrahim Index of African Governance; Worldwide Governance Indicators; WEF Global Competitiveness Report; Worldwide Corporate Tax Guide
11
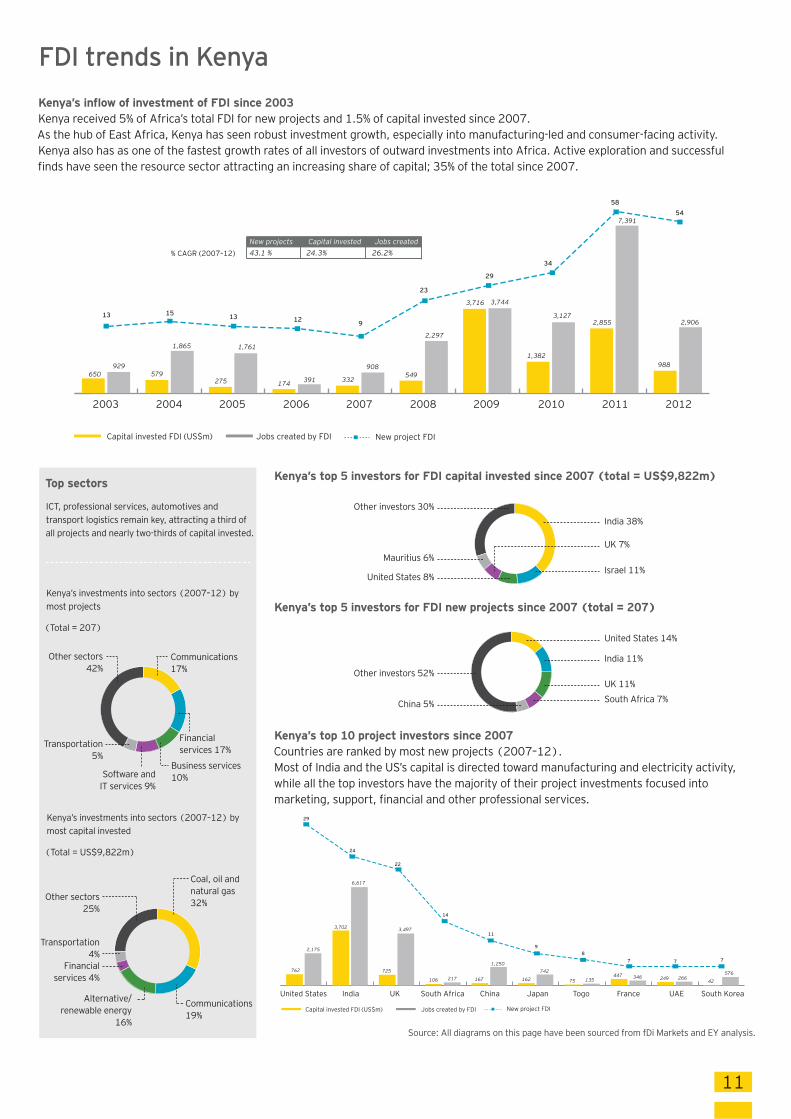
Kenya’s top 10 project investors since 2007Countries are ranked by most new projects (2007–12).Most of India and the US’s capital is directed toward manufacturing and electricity activity, while all the top investors have the majority of their project investments focused into marketing, support, financial and other professional services.
Source: All diagrams on this page have been sourced from fDi Markets and EY analysis.
Kenya’s top 5 investors for FDI new projects since 2007 (total = 207)
Kenya’s top 5 investors for FDI capital invested since 2007 (total = US$9,822m)Top sectors
Kenya’s investments into sectors (2007–12) by most projects
(Total = 207)
ICT, professional services, automotives and transport logistics remain key, attracting a third of all projects and nearly two-thirds of capital invested.
Kenya’s investments into sectors (2007–12) by most capital invested
(Total = US$9,822m)
FDI trends in Kenya
Capital invested FDI (US$m) Jobs created by FDI New project FDI
2003 2004 2005 2006 2008 2009 2010 2011 20122007
650
13 151213
9
23
29
34
5854
929579
275 174 332549
3,716
1,382
2,855
988
1,865 1,761
391
908
2,297
3,744
3,127
7,391
2,906
% CAGR (2007–12)New projects Capital invested Jobs created43.1 % 24.3% 26.2%
Kenya’s inflow of investment of FDI since 2003Kenya received 5% of Africa’s total FDI for new projects and 1.5% of capital invested since 2007.As the hub of East Africa, Kenya has seen robust investment growth, especially into manufacturing-led and consumer-facing activity. Kenya also has as one of the fastest growth rates of all investors of outward investments into Africa. Active exploration and successful finds have seen the resource sector attracting an increasing share of capital; 35% of the total since 2007.
Jobs created by FDICapital invested FDI (US$m) New project FDI
United States India UK South Africa Japan Togo France UAE South KoreaChina
762
29
24
22
14
11
98
7 7 7
2,175
3,702
6,617
725
3,497
106 217 167
1,250
162
742
75 135447 346 249 266
42
576
China 5%
Other investors 52%
India 38%
Other investors 30%
Mauritius 6%
United States 8%Israel 11%
UK 7%
United States 14%
India 11%
UK 11%
South Africa 7%
Coal, oil and natural gas 32%
Communications19%
Alternative/renewable energy
16%
Transportation4%
Financial services 4%
Other sectors25%
Communications17%
Business services10%Software and
IT services 9%
Transportation5%
Other sectors 42%
Financial services 17%
12
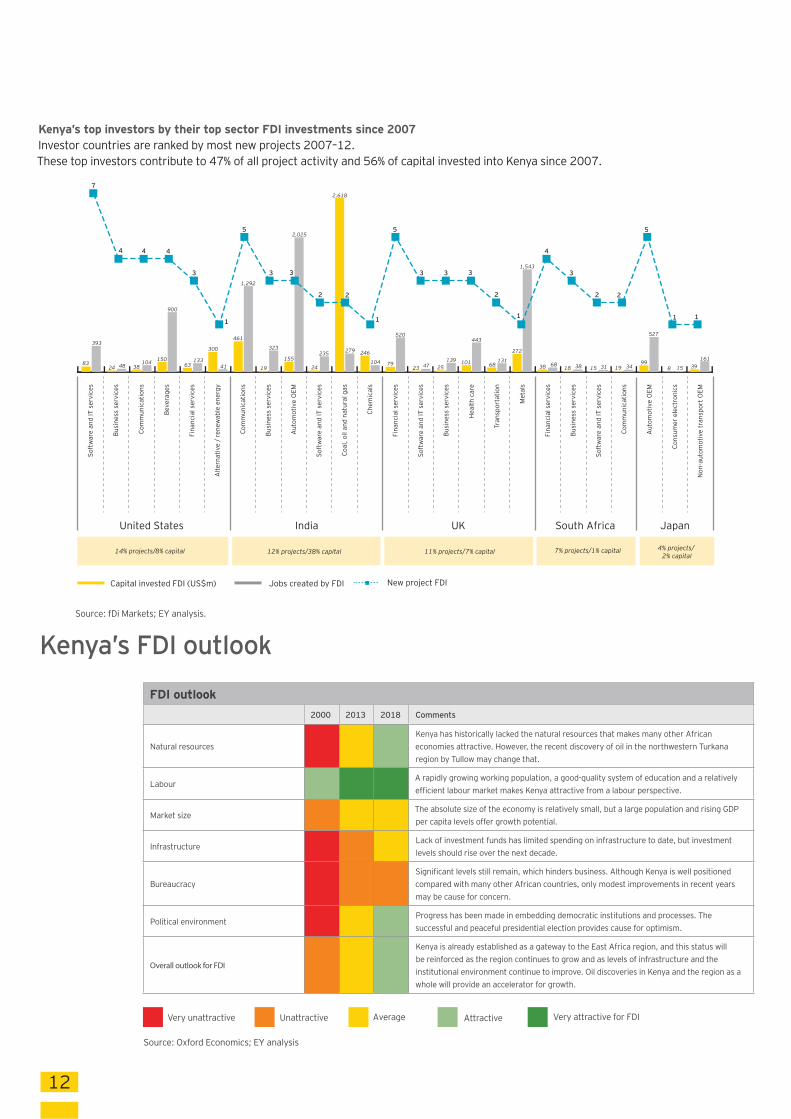
Kenya’s top investors by their top sector FDI investments since 2007Investor countries are ranked by most new projects 2007–12.These top investors contribute to 47% of all project activity and 56% of capital invested into Kenya since 2007.
Kenya’s FDI outlook
FDI outlook
2000 2013 2018 Comments
Natural resourcesKenya has historically lacked the natural resources that makes many other African economies attractive. However, the recent discovery of oil in the northwestern Turkana
region by Tullow may change that.
LabourA rapidly growing working population, a good-quality system of education and a relatively
efficient labour market makes Kenya attractive from a labour perspective.
Market sizeThe absolute size of the economy is relatively small, but a large population and rising GDP
per capita levels offer growth potential.
InfrastructureLack of investment funds has limited spending on infrastructure to date, but investment levels should rise over the next decade.
BureaucracySignificant levels still remain, which hinders business. Although Kenya is well positioned compared with many other African countries, only modest improvements in recent years
may be cause for concern.
Political environmentProgress has been made in embedding democratic institutions and processes. The
successful and peaceful presidential election provides cause for optimism.
Overall outlook for FDI
Kenya is already established as a gateway to the East Africa region, and this status will
be reinforced as the region continues to grow and as levels of infrastructure and the
institutional environment continue to improve. Oil discoveries in Kenya and the region as a whole will provide an accelerator for growth.
Source: Oxford Economics; EY analysis
Very unattractive Unattractive Average Attractive Very attractive for FDI
Jobs created by FDICapital invested FDI (US$m) New project FDI
83
393
24 48 38104 150
900
63133
300
41
461
1,292
19
323
155
24
235 279 246
104 79
520
23 47 25139 101
443
68131
272
1,543
38 6818 38 15 31 19 34
99
527
8 15 39
2,025
2,618
7
4 4 4
3
1
5
3 3
2 2
1
5
3 3 3
2
1
4
3
2 2
5
1 1
Soft
war
e an
d IT
ser
vice
s
Busi
ness
ser
vice
s
Com
mun
icat
ions
Beve
rage
s
Fina
ncia
l ser
vice
s
Alte
rnat
ive
/ re
new
able
ene
rgy
Com
mun
icat
ions
Busi
ness
ser
vice
s
Aut
omot
ive
OEM
Soft
war
e an
d IT
ser
vice
s
Coal
, oil
and
natu
ral g
as
Chem
ical
s
Fina
ncia
l ser
vice
s
Soft
war
e an
d IT
ser
vice
s
Busi
ness
ser
vice
s
Hea
lth c
are
Tran
spor
tatio
n
Met
als
Fina
ncia
l ser
vice
s
Busi
ness
ser
vice
s
Soft
war
e an
d IT
ser
vice
s
Com
mun
icat
ions
Aut
omot
ive
OEM
Cons
umer
ele
ctro
nics
Non
-aut
omot
ive
tran
spor
t OEM
United States South Africa JapanIndia
14% projects/8% capital 12% projects/38% capital 11% projects/7% capital
UK
7% projects/1% capital 4% projects/ 2% capital
161
Source: fDi Markets; EY analysis.
13
Project numberCapital value (US$m)
Power plants and
transmissiongrids
Roads andbridges
WaterRailAirports Health careCommercialconstruction
Industrialconstruction
Ports
5,431
17,590
2,714
4,991
1,303341 440 745
100
31
12
8
6
43
2 21
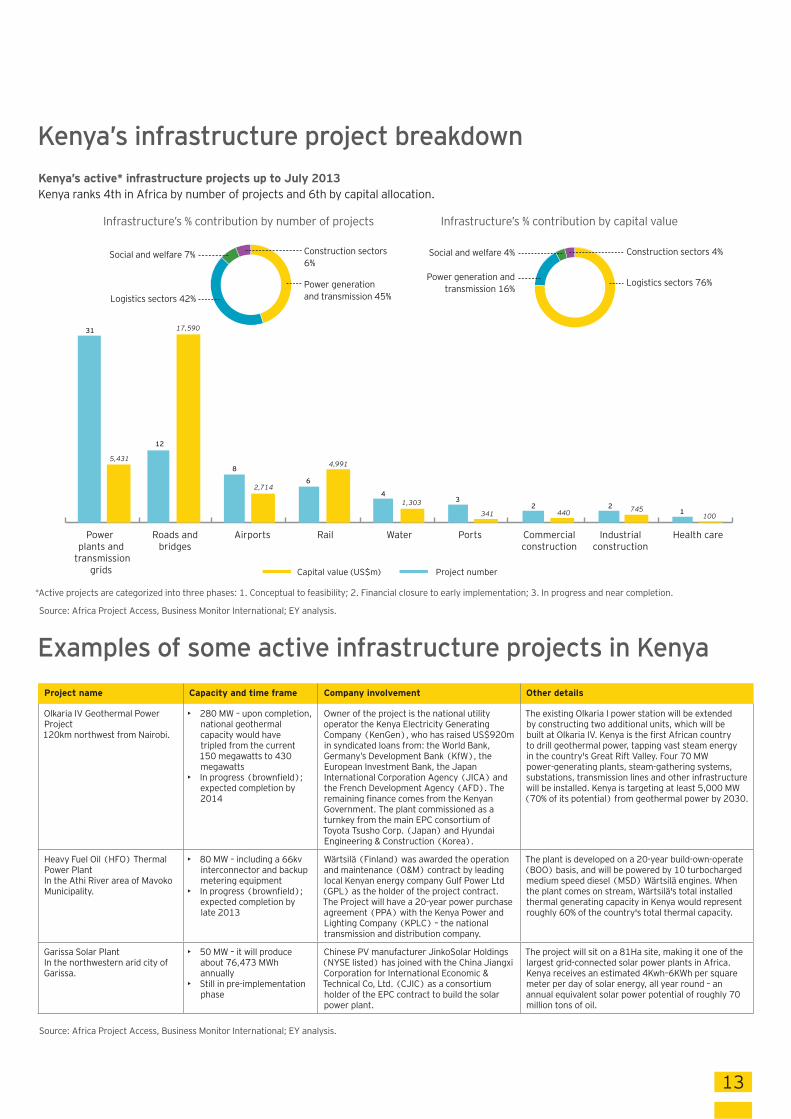
Kenya’s active* infrastructure projects up to July 2013Kenya ranks 4th in Africa by number of projects and 6th by capital allocation.
Kenya’s infrastructure project breakdown
Examples of some active infrastructure projects in Kenya
Project name Capacity and time frame Company involvement Other details
Olkaria IV Geothermal Power Project120km northwest from Nairobi.
• 280 MW – upon completion, national geothermal capacity would have tripled from the current 150 megawatts to 430 megawatts
• In progress (brownfield); expected completion by 2014
Owner of the project is the national utility operator the Kenya Electricity Generating Company (KenGen), who has raised US$920m in syndicated loans from: the World Bank, Germany’s Development Bank (KfW), the European Investment Bank, the Japan International Corporation Agency (JICA) and the French Development Agency (AFD). The remaining finance comes from the Kenyan Government. The plant commissioned as a turnkey from the main EPC consortium of Toyota Tsusho Corp. (Japan) and Hyundai Engineering & Construction (Korea).
The existing Olkaria I power station will be extended by constructing two additional units, which will be built at Olkaria IV. Kenya is the first African country to drill geothermal power, tapping vast steam energy in the country's Great Rift Valley. Four 70 MW power-generating plants, steam-gathering systems, substations, transmission lines and other infrastructure will be installed. Kenya is targeting at least 5,000 MW (70% of its potential) from geothermal power by 2030.
Heavy Fuel Oil (HFO) Thermal Power PlantIn the Athi River area of Mavoko Municipality.
• 80 MW – including a 66kv interconnector and backup metering equipment
• In progress (brownfield); expected completion by late 2013
Wärtsilä (Finland) was awarded the operation and maintenance (O&M) contract by leading local Kenyan energy company Gulf Power Ltd (GPL) as the holder of the project contract. The Project will have a 20-year power purchase agreement (PPA) with the Kenya Power and Lighting Company (KPLC) – the national transmission and distribution company.
The plant is developed on a 20-year build-own-operate (BOO) basis, and will be powered by 10 turbocharged medium speed diesel (MSD) Wärtsilä engines. When the plant comes on stream, Wärtsilä's total installed thermal generating capacity in Kenya would represent roughly 60% of the country's total thermal capacity.
Garissa Solar PlantIn the northwestern arid city of Garissa.
• 50 MW – it will produce about 76,473 MWh annually
• Still in pre-implementation phase
Chinese PV manufacturer JinkoSolar Holdings (NYSE listed) has joined with the China Jiangxi Corporation for International Economic & Technical Co, Ltd. (CJIC) as a consortium holder of the EPC contract to build the solar power plant.
The project will sit on a 81Ha site, making it one of the largest grid-connected solar power plants in Africa. Kenya receives an estimated 4Kwh–6KWh per square meter per day of solar energy, all year round – an annual equivalent solar power potential of roughly 70 million tons of oil.
Infrastructure’s % contribution by capital value
Construction sectors 4%Social and welfare 4%
Power generation andtransmission 16%
Logistics sectors 76%
Infrastructure’s % contribution by number of projects
Power generation and transmission 45%
Construction sectors 6%
Logistics sectors 42%
Social and welfare 7%
*Active projects are categorized into three phases: 1. Conceptual to feasibility; 2. Financial closure to early implementation; 3. In progress and near completion.
Source: Africa Project Access, Business Monitor International; EY analysis.
Source: Africa Project Access, Business Monitor International; EY analysis.

14
South Sudan
Tanzania
KenyaUganda
Ethiopia
Country overview
South Sudan
Key factors1. South Sudan control 75% of daily oil production (Sudan has been the 3rd largest sub-Saharan Africa oil producer)
2. Until January 2012, oil production accounted for 98 percent of the government’s revenues
3. The U.S. government’s long-standing sanctions against the Sudan were officially removed from applicability to South Sudan in December 2011
4. Strong reserves of copper, gold and tin
5. South Sudan has received more than US$4bn foreign aid since 2005 and Government revenues are remain largely dependent on foreign aid. Government is burdened with large levels of debt
6. Insecure property rights and weak price signal given markets are not organised
7. Factors inhibiting investment in South Sudan include limited physical infrastructure, a lack of both skilled and unskilled labour (has fewer than 400 kilometers of paved roads, despite the existence of three power plants, none of which are working at full capacity, the country is almost completely reliant on diesel-run generators for electricity) and Foreign exchange market rules and regulations are highly restrictive
Opportunity indicators NOTE
GDP (current) US$13.8bn
Population growth (annual) 4.1%
Population (m) 11
Mobile penetration (% of population with mobile access) 20%
Urban population (% of total) 33.2%
Real GDP growth (compound average growth rate): forecast 5 year (2018) 2.75%
Real GDP growth (compound average growth rate): historical 10 year (2003) -11.35% A, B
GDP per capita (US$): forecast 5 year (2018) US$4,336
Country wealth (1=low income, 2=lower middle, 3=upper middle, 4=high income (non-OECD), 5=high income (OECD)) n/a
Literacy rate (total population %) 27%
NOTE:A. Independence on 9 July 2011;B. Gross Domestic Product (GDP) in South Sudan contracted by 55.80% in 2012 from the previous year given an oil transit fee conflict
with Sudan
Gitahi Gachahi
EY East Africa Regional Leader
Tel: + 254 20 271 5300 Email: [email protected]
15
South Sudan
Tanzania
KenyaUganda
Ethiopia
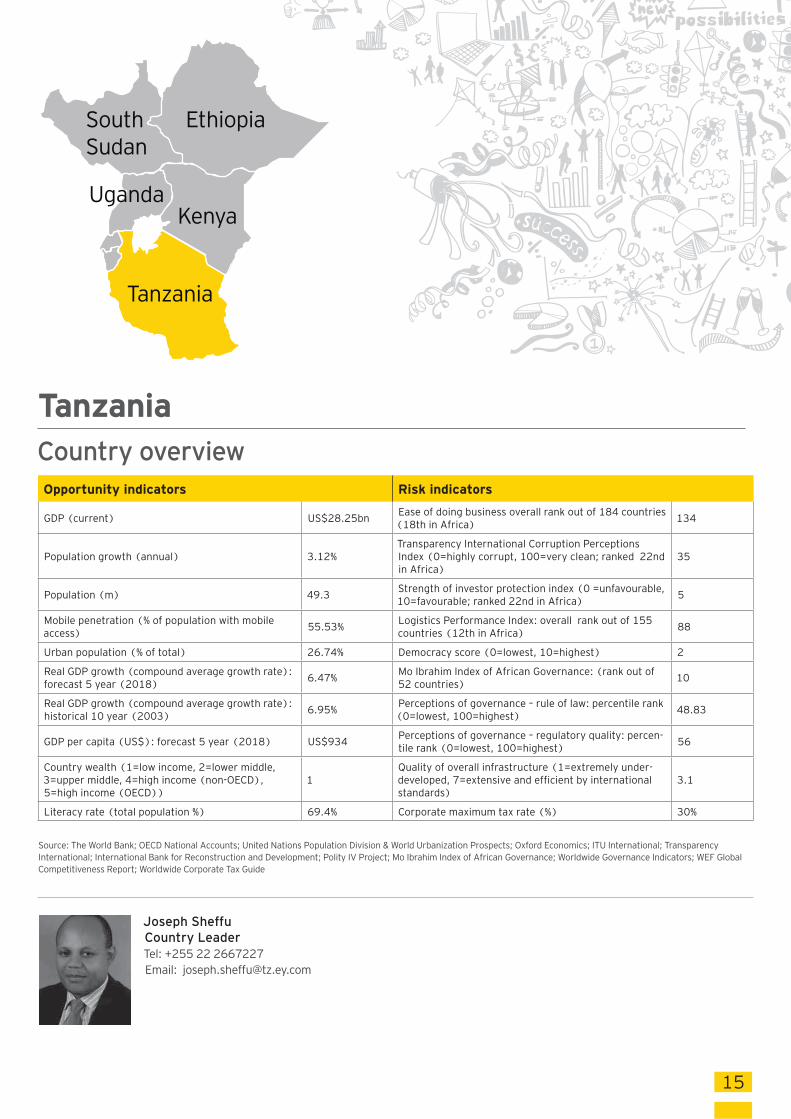
TanzaniaCountry overview
Joseph Sheffu
Country Leader
Tel: +255 22 2667227 Email: [email protected]
Opportunity indicators Risk indicators
GDP (current) US$28.25bnEase of doing business overall rank out of 184 countries (18th in Africa) 134
Population growth (annual) 3.12%Transparency International Corruption Perceptions Index (0=highly corrupt, 100=very clean; ranked 22nd in Africa)
35
Population (m) 49.3 Strength of investor protection index (0 =unfavourable, 10=favourable; ranked 22nd in Africa)
5
Mobile penetration (% of population with mobile access) 55.53%
Logistics Performance Index: overall rank out of 155 countries (12th in Africa) 88
Urban population (% of total) 26.74% Democracy score (0=lowest, 10=highest) 2
Real GDP growth (compound average growth rate): forecast 5 year (2018)
6.47% Mo Ibrahim Index of African Governance: (rank out of 52 countries)
10
Real GDP growth (compound average growth rate): historical 10 year (2003)
6.95% Perceptions of governance – rule of law: percentile rank (0=lowest, 100=highest) 48.83
GDP per capita (US$): forecast 5 year (2018) US$934Perceptions of governance – regulatory quality: percen-tile rank (0=lowest, 100=highest) 56
Country wealth (1=low income, 2=lower middle, 3=upper middle, 4=high income (non-OECD), 5=high income (OECD))
1Quality of overall infrastructure (1=extremely under-developed, 7=extensive and efficient by international standards)
3.1
Literacy rate (total population %) 69.4% Corporate maximum tax rate (%) 30%
Source: The World Bank; OECD National Accounts; United Nations Population Division & World Urbanization Prospects; Oxford Economics; ITU International; Transparency International; International Bank for Reconstruction and Development; Polity IV Project; Mo Ibrahim Index of African Governance; Worldwide Governance Indicators; WEF Global Competitiveness Report; Worldwide Corporate Tax Guide
16
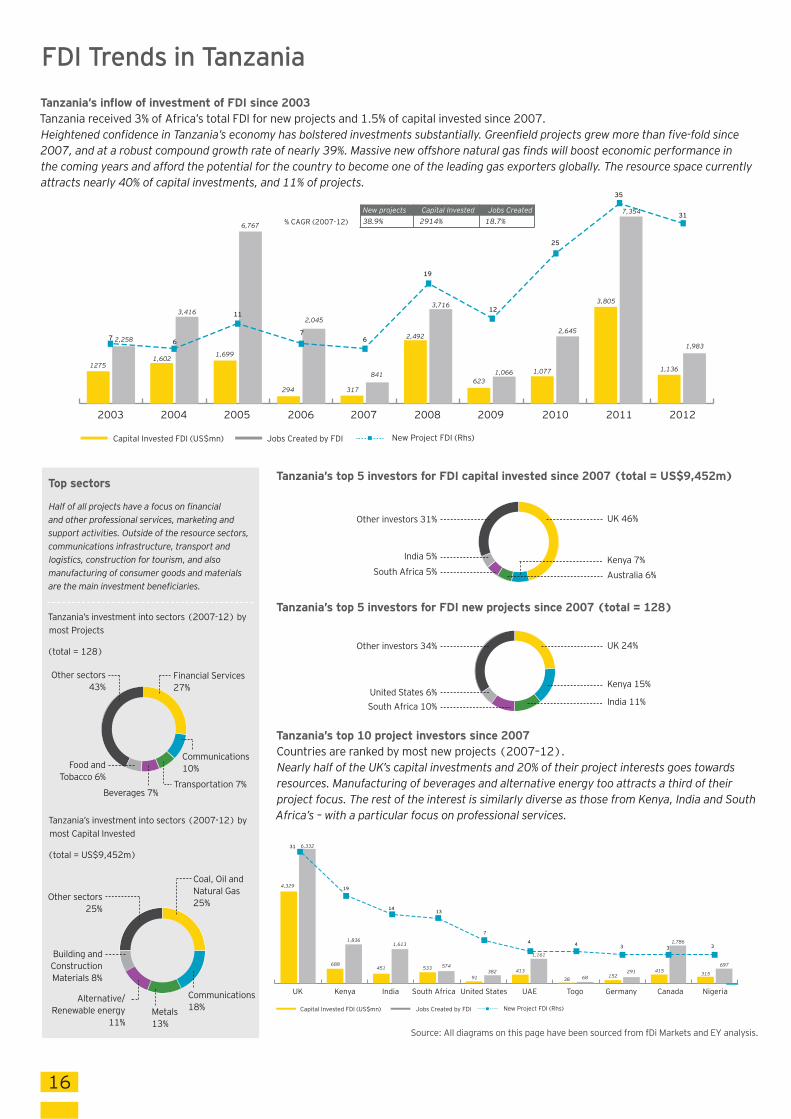
Tanzania’s top 10 project investors since 2007Countries are ranked by most new projects (2007–12).Nearly half of the UK’s capital investments and 20% of their project interests goes towards resources. Manufacturing of beverages and alternative energy too attracts a third of their project focus. The rest of the interest is similarly diverse as those from Kenya, India and South Africa’s – with a particular focus on professional services.
Source: All diagrams on this page have been sourced from fDi Markets and EY analysis.
Tanzania’s top 5 investors for FDI new projects since 2007 (total = 128)
Tanzania’s top 5 investors for FDI capital invested since 2007 (total = US$9,452m)Top sectors
Tanzania’s investment into sectors (2007-12) by most Projects
(total = 128)
Half of all projects have a focus on financial and other professional services, marketing and support activities. Outside of the resource sectors, communications infrastructure, transport and logistics, construction for tourism, and also manufacturing of consumer goods and materials are the main investment beneficiaries.
Tanzania’s investment into sectors (2007-12) by most Capital Invested
(total = US$9,452m)
FDI Trends in Tanzania
Capital Invested FDI (US$mn) Jobs Created by FDI New Project FDI (Rhs)
% CAGR (2007-12)
2003 2004 2005 2006 2008 2009 2010 2011 20122007
1275
7 6
11
76
19
12
25
35
31
2,258
1,602
3,416
1,699
6,767
2,045
841
3,716
1,066623
2,492
1,077
3,805
2,645
7,354
1,136
1,983
317294
New projects Capital Invested Jobs Created38.9% 2914% 18.7%
Tanzania’s inflow of investment of FDI since 2003Tanzania received 3% of Africa’s total FDI for new projects and 1.5% of capital invested since 2007.Heightened confidence in Tanzania’s economy has bolstered investments substantially. Greenfield projects grew more than five-fold since 2007, and at a robust compound growth rate of nearly 39%. Massive new offshore natural gas finds will boost economic performance in the coming years and afford the potential for the country to become one of the leading gas exporters globally. The resource space currently attracts nearly 40% of capital investments, and 11% of projects.
Jobs Created by FDICapital Invested FDI (US$mn) New Project FDI (Rhs)
UK Kenya India South Africa UAE Togo Germany Canada NigeriaUnited States
4,329
31
19
1413
7
4 4 3 3 3
6,332
688
1,836
451
1,613
574382
1,161
6838
413152
415291
1,786
315
697
91
533
South Africa 10%
United States 6%
Other investors 34%
UK 46%Other investors 31%
India 5%
South Africa 5% Australia 6%
Kenya 7%
UK 24%
Kenya 15%
India 11%
Financial Services 27%
Transportation 7%Beverages 7%
Food and Tobacco 6%
Other sectors 43%
Communications10%
Coal, Oil and Natural Gas 25%
Communications18%Metals
13%
Alternative/Renewable energy
11%
Building and Construction Materials 8%
Other sectors25%
17
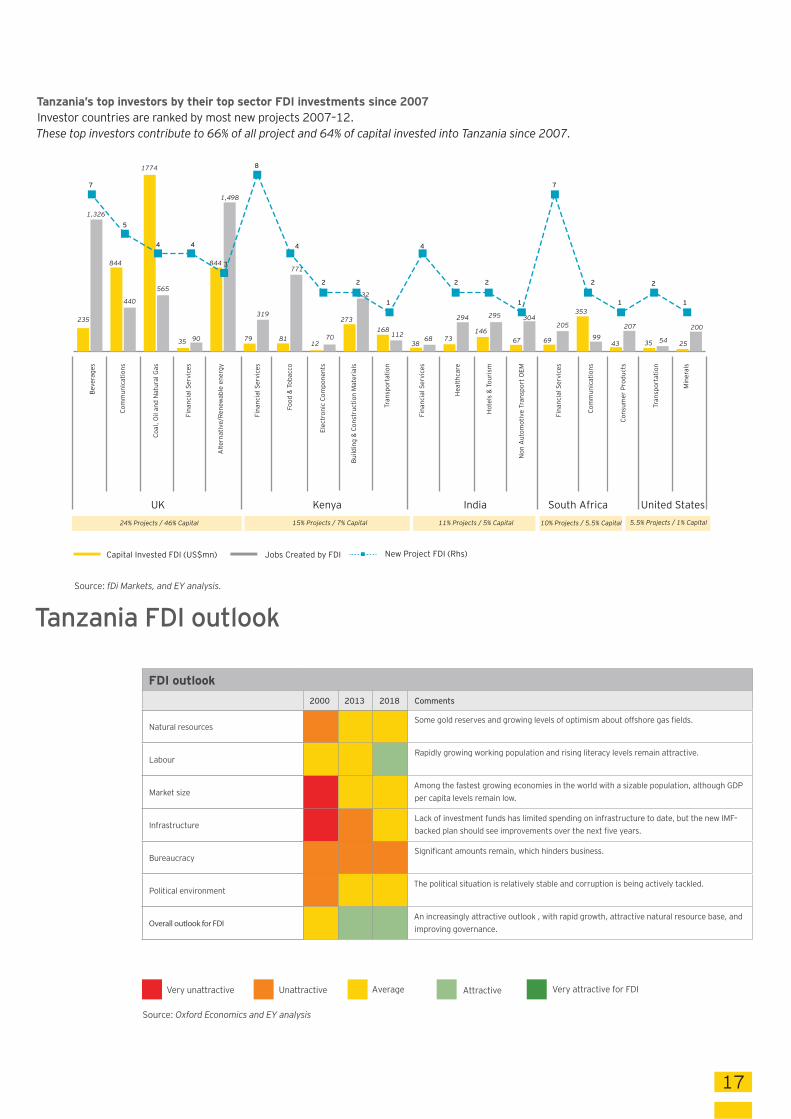
Tanzania’s top investors by their top sector FDI investments since 2007Investor countries are ranked by most new projects 2007–12.These top investors contribute to 66% of all project and 64% of capital invested into Tanzania since 2007.
Tanzania FDI outlook
Source: Oxford Economics and EY analysis
Very unattractive Unattractive Average Attractive Very attractive for FDI
Jobs Created by FDICapital Invested FDI (US$mn) New Project FDI (Rhs)
235
1,326
844 844
440
1774
565
35 90
1,498
79
319
8112
70 67
304
69
205
353
9943
207
35 54 25
200273
532
168112
3868 73
294
146
295
771
7
5
4 4
3
4 4
2 2 2 2 2
11
7
1
2
1
8
Beve
rage
s
Com
mun
icat
ions
Food
& T
obac
co
Coal
, Oil
and
Nat
ural
Gas
Cons
umer
Pro
duct
s
Hot
els
& To
uris
m
Non
Aut
omot
ive
Tran
spor
t OEM
Elec
tron
ic C
ompo
nent
s
Build
ing
& Co
nstr
uctio
n M
ater
ials
Tran
spor
tatio
n
Hea
lthca
re
Fina
ncia
l Ser
vice
s
Fina
ncia
l Ser
vice
s
Fina
ncia
l Ser
vice
s
Fina
ncia
l Ser
vice
s
Alte
rnat
ive/
Rene
wab
le e
nerg
y
Com
mun
icat
ions
Tran
spor
tatio
n
Min
eral
s
UK India South Africa United StatesKenya24% Projects / 46% Capital 15% Projects / 7% Capital 11% Projects / 5% Capital 10% Projects / 5.5% Capital 5.5% Projects / 1% Capital
Source: fDi Markets, and EY analysis.
FDI outlook
2000 2013 2018 Comments
Natural resourcesSome gold reserves and growing levels of optimism about offshore gas fields.
LabourRapidly growing working population and rising literacy levels remain attractive.
Market sizeAmong the fastest growing economies in the world with a sizable population, although GDP per capita levels remain low.
InfrastructureLack of investment funds has limited spending on infrastructure to date, but the new IMF–
backed plan should see improvements over the next five years.
BureaucracySignificant amounts remain, which hinders business.
Political environmentThe political situation is relatively stable and corruption is being actively tackled.
Overall outlook for FDIAn increasingly attractive outlook , with rapid growth, attractive natural resource base, and improving governance.
18
Project numberCapital value (US$mn)
Power plantsand transmission
grids
IndustrialConstruction
PortsOil & Gas Pipelines
Healthcare ResidentialConstruction
AirportsRoads & Bridges
Rail
3,513
6391,100
138
9,200
65
65011 1 11,000
2
6
3 3
12
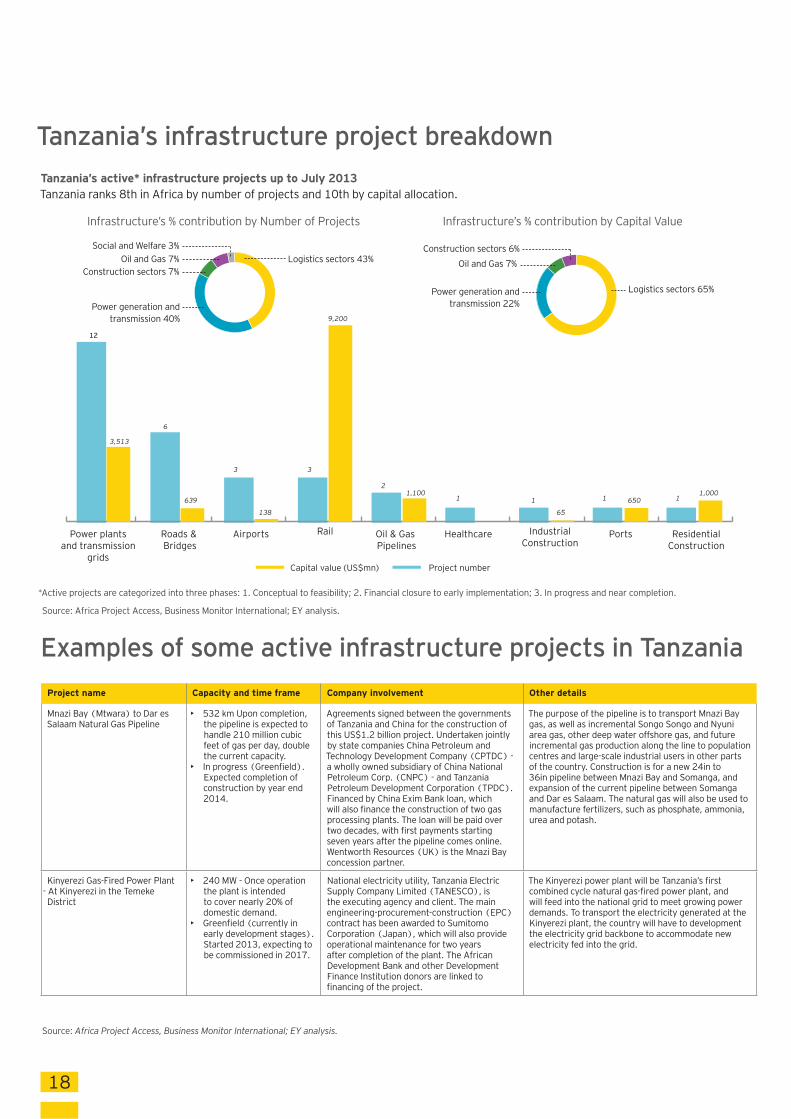
Tanzania’s active* infrastructure projects up to July 2013Tanzania ranks 8th in Africa by number of projects and 10th by capital allocation.
Tanzania’s infrastructure project breakdown
Examples of some active infrastructure projects in Tanzania
Project name Capacity and time frame Company involvement Other details
Mnazi Bay (Mtwara) to Dar es Salaam Natural Gas Pipeline
• 532 km Upon completion, the pipeline is expected to handle 210 million cubic feet of gas per day, double the current capacity.
• In progress (Greenfield). Expected completion of construction by year end 2014.
Agreements signed between the governments of Tanzania and China for the construction of this US$1.2 billion project. Undertaken jointly by state companies China Petroleum and Technology Development Company (CPTDC) - a wholly owned subsidiary of China National Petroleum Corp. (CNPC) - and Tanzania Petroleum Development Corporation (TPDC). Financed by China Exim Bank loan, which will also finance the construction of two gas processing plants. The loan will be paid over two decades, with first payments starting seven years after the pipeline comes online. Wentworth Resources (UK) is the Mnazi Bay concession partner.
The purpose of the pipeline is to transport Mnazi Bay gas, as well as incremental Songo Songo and Nyuni area gas, other deep water offshore gas, and future incremental gas production along the line to population centres and large-scale industrial users in other parts of the country. Construction is for a new 24in to 36in pipeline between Mnazi Bay and Somanga, and expansion of the current pipeline between Somanga and Dar es Salaam. The natural gas will also be used to manufacture fertilizers, such as phosphate, ammonia, urea and potash.
Kinyerezi Gas-Fired Power Plant - At Kinyerezi in the Temeke District
• 240 MW - Once operation the plant is intended to cover nearly 20% of domestic demand.
• Greenfield (currently in early development stages). Started 2013, expecting to be commissioned in 2017.
National electricity utility, Tanzania Electric Supply Company Limited (TANESCO), is the executing agency and client. The main engineering-procurement-construction (EPC) contract has been awarded to Sumitomo Corporation (Japan), which will also provide operational maintenance for two years after completion of the plant. The African Development Bank and other Development Finance Institution donors are linked to financing of the project.
The Kinyerezi power plant will be Tanzania’s first combined cycle natural gas-fired power plant, and will feed into the national grid to meet growing power demands. To transport the electricity generated at the Kinyerezi plant, the country will have to development the electricity grid backbone to accommodate new electricity fed into the grid.
Infrastructure’s % contribution by Number of Projects Infrastructure’s % contribution by Capital Value
Oil and Gas 7%
Logistics sectors 65%
Logistics sectors 43%
Power generation andtransmission 40%
Social and Welfare 3% Construction sectors 6%
Power generation andtransmission 22%
Oil and Gas 7%Construction sectors 7%
*Active projects are categorized into three phases: 1. Conceptual to feasibility; 2. Financial closure to early implementation; 3. In progress and near completion.
Source: Africa Project Access, Business Monitor International; EY analysis.
Source: Africa Project Access, Business Monitor International; EY analysis.
19
South Sudan
Tanzania
KenyaUganda
Ethiopia
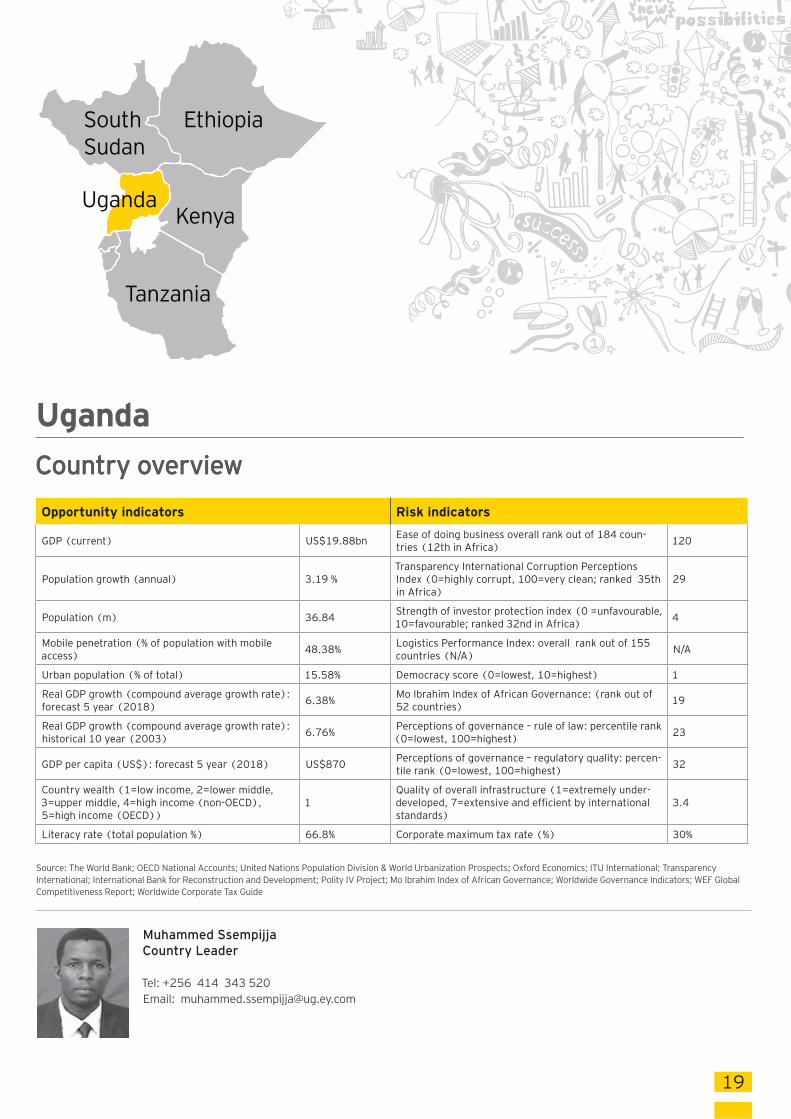
UgandaCountry overviewCountry overview
Muhammed Ssempijja
Country Leader
Tel: +256 414 343 520 Email: [email protected]
Opportunity indicators Risk indicators
GDP (current) US$19.88bnEase of doing business overall rank out of 184 coun-tries (12th in Africa)
120
Population growth (annual) 3.19 %Transparency International Corruption Perceptions Index (0=highly corrupt, 100=very clean; ranked 35th in Africa)
29
Population (m) 36.84Strength of investor protection index (0 =unfavourable, 10=favourable; ranked 32nd in Africa) 4
Mobile penetration (% of population with mobile access)
48.38% Logistics Performance Index: overall rank out of 155 countries (N/A)
N/A
Urban population (% of total) 15.58% Democracy score (0=lowest, 10=highest) 1
Real GDP growth (compound average growth rate): forecast 5 year (2018) 6.38%
Mo Ibrahim Index of African Governance: (rank out of 52 countries) 19
Real GDP growth (compound average growth rate): historical 10 year (2003) 6.76%
Perceptions of governance – rule of law: percentile rank (0=lowest, 100=highest) 23
GDP per capita (US$): forecast 5 year (2018) US$870 Perceptions of governance – regulatory quality: percen-tile rank (0=lowest, 100=highest) 32
Country wealth (1=low income, 2=lower middle, 3=upper middle, 4=high income (non-OECD), 5=high income (OECD))
1Quality of overall infrastructure (1=extremely under-developed, 7=extensive and efficient by international standards)
3.4
Literacy rate (total population %) 66.8% Corporate maximum tax rate (%) 30%
Source: The World Bank; OECD National Accounts; United Nations Population Division & World Urbanization Prospects; Oxford Economics; ITU International; Transparency International; International Bank for Reconstruction and Development; Polity IV Project; Mo Ibrahim Index of African Governance; Worldwide Governance Indicators; WEF Global Competitiveness Report; Worldwide Corporate Tax Guide
20
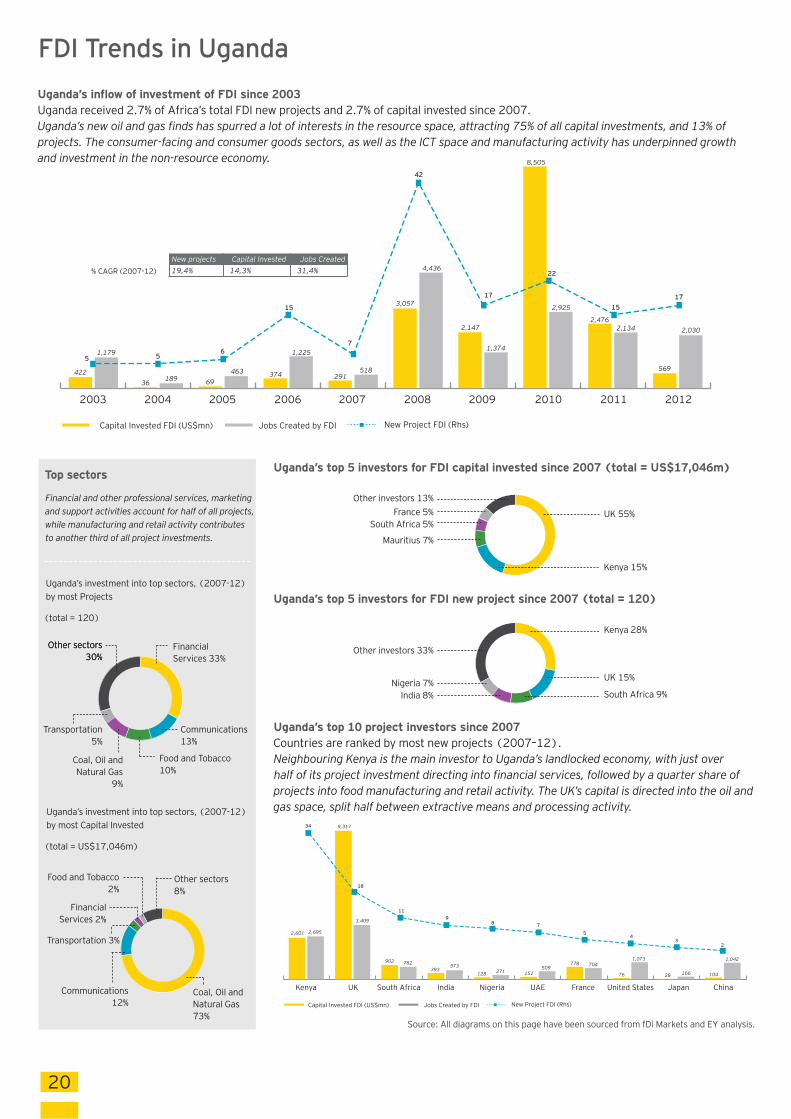
Uganda’s top 10 project investors since 2007Countries are ranked by most new projects (2007–12).Neighbouring Kenya is the main investor to Uganda’s landlocked economy, with just over half of its project investment directing into financial services, followed by a quarter share of projects into food manufacturing and retail activity. The UK’s capital is directed into the oil and gas space, split half between extractive means and processing activity.
Source: All diagrams on this page have been sourced from fDi Markets and EY analysis.
Uganda’s top 5 investors for FDI new project since 2007 (total = 120)
Uganda’s top 5 investors for FDI capital invested since 2007 (total = US$17,046m)Top sectors
Uganda’s investment into top sectors, (2007-12) by most Projects
(total = 120)
Financial and other professional services, marketing and support activities account for half of all projects, while manufacturing and retail activity contributes to another third of all project investments.
Uganda’s investment into top sectors, (2007-12)by most Capital Invested
(total = US$17,046m)
FDI Trends in Uganda
Capital Invested FDI (US$mn) Jobs Created by FDI New Project FDI (Rhs)
% CAGR (2007-12)
2003 2004 2005 2006 2008 2009 2010 2011 20122007
422
5 56
15
7
42
17
22
1517
1,179
36 189 69463
1,225
518
4,436
1,374
2,147
3,057
8,505
2,476
2,925
2,134
569
2,030
291374
New projects Capital Invested Jobs Created19,4% 14,3% 31,4%
Uganda’s inflow of investment of FDI since 2003Uganda received 2.7% of Africa’s total FDI new projects and 2.7% of capital invested since 2007.Uganda’s new oil and gas finds has spurred a lot of interests in the resource space, attracting 75% of all capital investments, and 13% of projects. The consumer-facing and consumer goods sectors, as well as the ICT space and manufacturing activity has underpinned growth and investment in the non-resource economy.
Jobs Created by FDICapital Invested FDI (US$mn) New Project FDI (Rhs)
Kenya UK South Africa India UAE France United States Japan ChinaNigeria
2,601
34
18
119
8 7
54
32
2,695
9,317
3,409
902 782 573271
509704778
151 76 28
1,073
166 104128393
1,042
Nigeria 7%India 8%
Other investors 33%
UK 55%
Other investors 13%
South Africa 5%France 5%
Mauritius 7%
Kenya 15%
Kenya 28%
UK 15%
South Africa 9%
Coal, Oil and Natural Gas
9%
Communications13%
Food and Tobacco10%
Transportation5%
Other sectors 30%
Other sectors 30%
Financial Services 33%
Coal, Oil and Natural Gas 73%
Communications12%
Transportation 3%
Financial Services 2%
Other sectors8%
Food and Tobacco2%
21
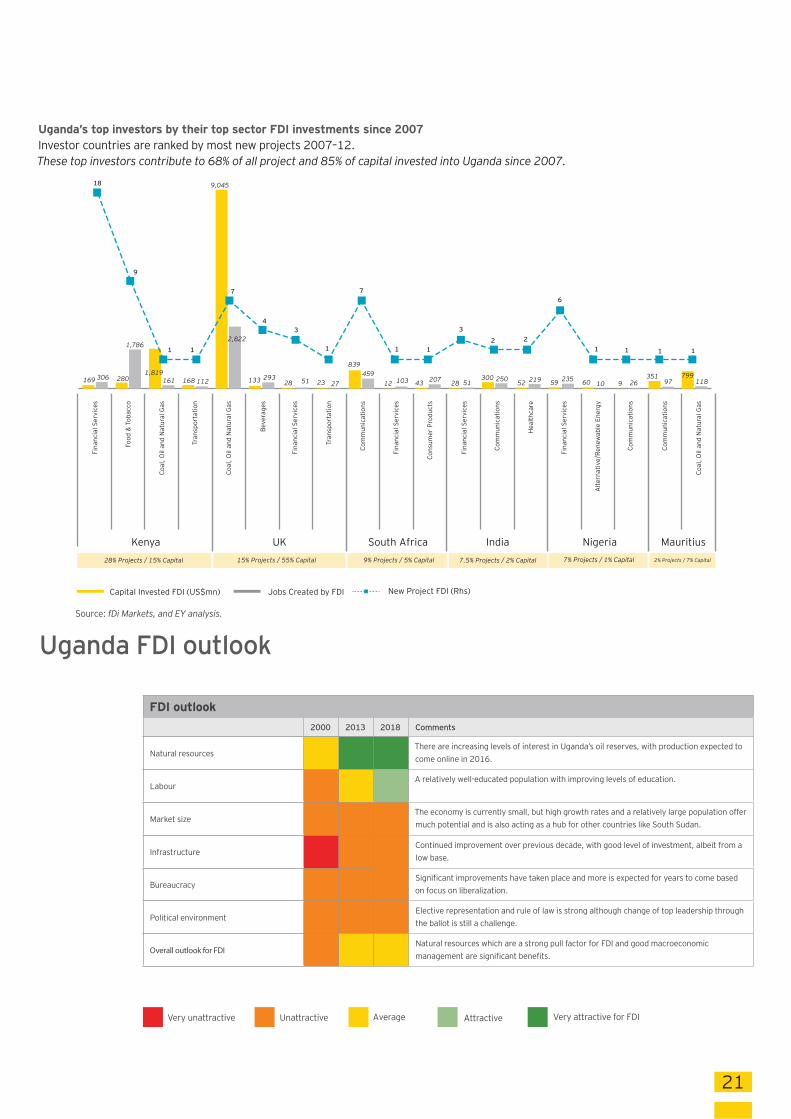
Uganda’s top investors by their top sector FDI investments since 2007Investor countries are ranked by most new projects 2007–12.These top investors contribute to 68% of all project and 85% of capital invested into Uganda since 2007.
Uganda FDI outlook
Very unattractive Unattractive Average Attractive Very attractive for FDI
Jobs Created by FDICapital Invested FDI (US$mn) New Project FDI (Rhs)
169 306 280
1,786
1,819161 168 112
9,045
2,822
133 29327
839
250 52 219 59 235 60 10 9 26351
97799
118459
12 103 43 207 5128300
28 51 23
18
9
11
7
3
1
7
1 1
3
2 2
6
1 1 1 1
4
Fina
ncia
l Ser
vice
s
Fina
ncia
l Ser
vice
s
Fina
ncia
l Ser
vice
s
Fina
ncia
l Ser
vice
s
Alte
rnat
ive/
Rene
wab
le E
nerg
y
Com
mun
icat
ions
Com
mun
icat
ions
Com
mun
icat
ions
Com
mun
icat
ions
Hea
lthca
re
Food
& T
obac
co
Coal
, Oil
and
Nat
ural
Gas
Coal
, Oil
and
Nat
ural
Gas
Coal
, Oil
and
Nat
ural
Gas
Beve
rage
s
Tran
spor
tatio
n
Tran
spor
tatio
n
Fina
ncia
l Ser
vice
s
Cons
umer
Pro
duct
s
Kenya South Africa India Nigeria MauritiusUK28% Projects / 15% Capital 15% Projects / 55% Capital 9% Projects / 5% Capital 7.5% Projects / 2% Capital 2% Projects / 7% Capital7% Projects / 1% Capital
Source: fDi Markets, and EY analysis.
FDI outlook
2000 2013 2018 Comments
Natural resourcesThere are increasing levels of interest in Uganda’s oil reserves, with production expected to come online in 2016.
LabourA relatively well-educated population with improving levels of education.
Market sizeThe economy is currently small, but high growth rates and a relatively large population offer
much potential and is also acting as a hub for other countries like South Sudan.
InfrastructureContinued improvement over previous decade, with good level of investment, albeit from a
low base.
BureaucracySignificant improvements have taken place and more is expected for years to come based
on focus on liberalization.
Political environmentElective representation and rule of law is strong although change of top leadership through the ballot is still a challenge.
Overall outlook for FDINatural resources which are a strong pull factor for FDI and good macroeconomic management are significant benefits.

22
Project numberCapital value (US$mn)
Power plantsand transmission
grids
WaterRoads andBridges
Rail Oil and GasPipelines
IndustrialConstruction
Ports Airports
7,116
2,532
7,246
618
721462
0
32
1
2,000
4
21
7
29
Uganda’s active* infrastructure projects up to July 2013Uganda ranks 5th in Africa by number of projects and 11th by capital allocation.
Uganda’s infrastructure project breakdown
Examples of some active infrastructure projects in Uganda
Infrastructure’s % contribution by Number of Projects Infrastructure’s % contribution by Capital Value
Oil and Gas pipelines 1%Social and Welfare 3%Construction sectors 10%
Power generation andtransmission 36%
Logistics sectors 50%Logistics sectors 44%
Construction sectors 1%
Power generation andtransmission 42%
Social and Welfare 10%Oil and Gas pipelines 3%
*Active projects are categorized into three phases: 1. Conceptual to feasibility; 2. Financial closure to early implementation; 3. In progress and near completion.
Source: Africa Project Access, Business Monitor International; EY analysis.
Source: Africa Project Access, Business Monitor International; EY analysis.
Project name Capacity and time frame Company involvement Other details
Bujagali Hydropower (Public-Private Partnership) Project
- Ugandan shores of the Victoria Nile (Dumbell Island) near Jinja.
• 250 MW - Full generating capacity achieved in 2012. It aims to produce 50% of the total national electric power demands.
• Financial close achieved in late 2007, and commissioned in 2012.
Bujagali Energy Limited (BEL) is a project-specific privately owned and managed company, which consists of the consortium of Sithe Global Power LLC (US) and Aga Khan for Economic Development (AKFED). The consortium provided US$190 million in funding. A syndicated group of donors provided the balance of US$610 million project finance. The client is the national electricity utility, the Uganda Electricity Transmission Company Limited (UETCL). The main engineering-procurement-construction (EPC) contract was awarded to Salini Costruttori (Italy).
Uganda’s Ministry of Energy and Mineral Development has been nominated for the World Finance Public Private Partnership Awards 2013 because of work on the Bujagali project, for excellence and innovation in the pre-delivery phases. In addition to mobilising private capital, the project promotes private sector ownership and management of the power sector. The project was developed as a turnkey on a build-own-operate-transfer (BOOT) basis with BEL, which included the construction of 100 km of transmission lines.
Tororo-Pakwach Rail Line Rehabilitation - Linking eastern to northern Uganda
• 500 km railway that has been out of operation for the last 18 years. Being fixed in tranches, the first addresses basic clearing and restoring the washed out areas due to flooding, installing new culverts, and re-railing of the track. The next tranche of overhaul work will then commences, which involves new rolling stock.
• Reopened in August 2013.
Rift Valley Railway (RVR), the current operators and concession holder of the Kenyan and Ugandan rail networks. Kato Contractors, a Ugandan engineering company is doing the initial clearing. Overhaul of wagons and locomotives is being funded by the DFI’s, led by the German Development Bank (KfW).
Under the recently launched National Transport Master Plan, the Government is to improve railway infrastructure with a standard gauge railway line. The project is crucial in linking trade routes strategically between Uganda and South Sudan. As political relations are mended between South Sudan and Khartoum, this rail route is expected to boost more trade as far up as Egypt. Upon completion, a 10-wagon train shall operate the route, which should come as a big boost to farmers, whose produce is not selling cheap because of middlemen and poor transport.
23
What are thereal problems?
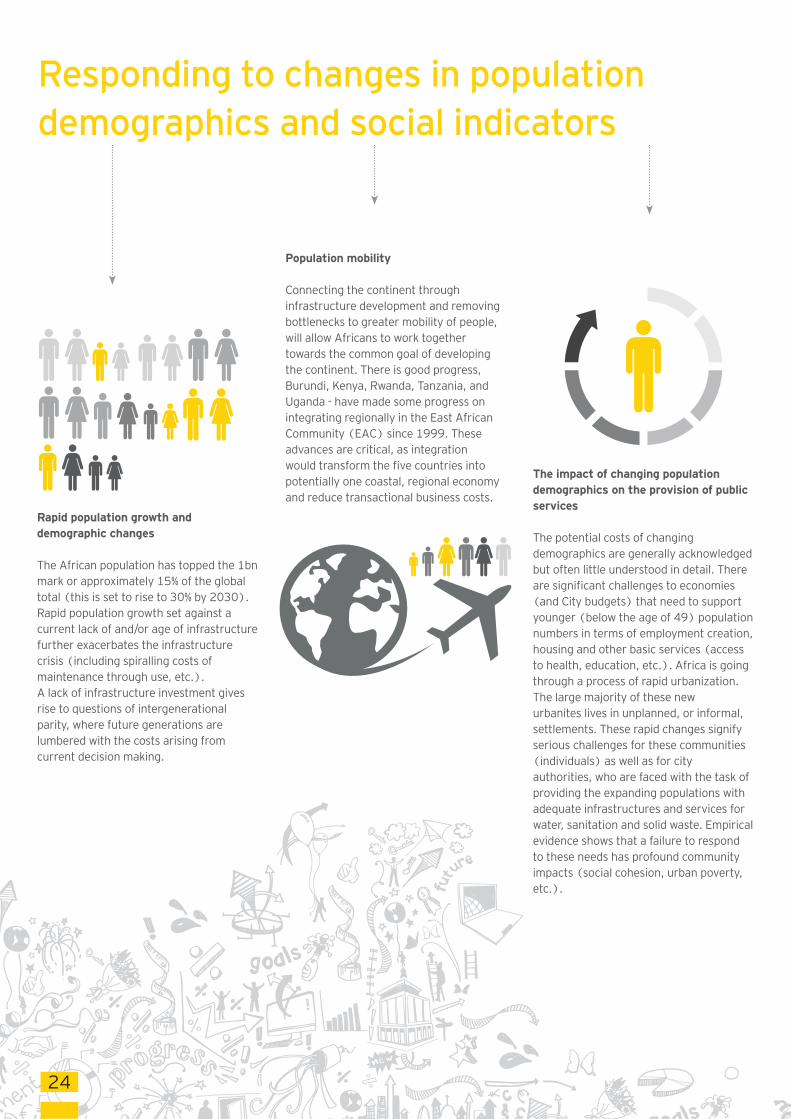
Rapid population growth and demographic changes The African population has topped the 1bn mark or approximately 15% of the global total (this is set to rise to 30% by 2030). Rapid population growth set against a current lack of and/or age of infrastructure further exacerbates the infrastructure crisis (including spiralling costs of maintenance through use, etc.). A lack of infrastructure investment gives rise to questions of intergenerational parity, where future generations are lumbered with the costs arising from current decision making.
Population mobility Connecting the continent through infrastructure development and removing bottlenecks to greater mobility of people, will allow Africans to work together towards the common goal of developing the continent. There is good progress, Burundi, Kenya, Rwanda, Tanzania, and Uganda - have made some progress on integrating regionally in the East African Community (EAC) since 1999. These advances are critical, as integration would transform the five countries into potentially one coastal, regional economy and reduce transactional business costs.
The impact of changing population demographics on the provision of public services The potential costs of changing demographics are generally acknowledged but often little understood in detail. There are significant challenges to economies (and City budgets) that need to support younger (below the age of 49) population numbers in terms of employment creation, housing and other basic services (access to health, education, etc.). Africa is going through a process of rapid urbanization. The large majority of these new urbanites lives in unplanned, or informal, settlements. These rapid changes signify serious challenges for these communities (individuals) as well as for city authorities, who are faced with the task of providing the expanding populations with adequate infrastructures and services for water, sanitation and solid waste. Empirical evidence shows that a failure to respond to these needs has profound community impacts (social cohesion, urban poverty, etc.).
Responding to changes in population
demographics and social indicators
24
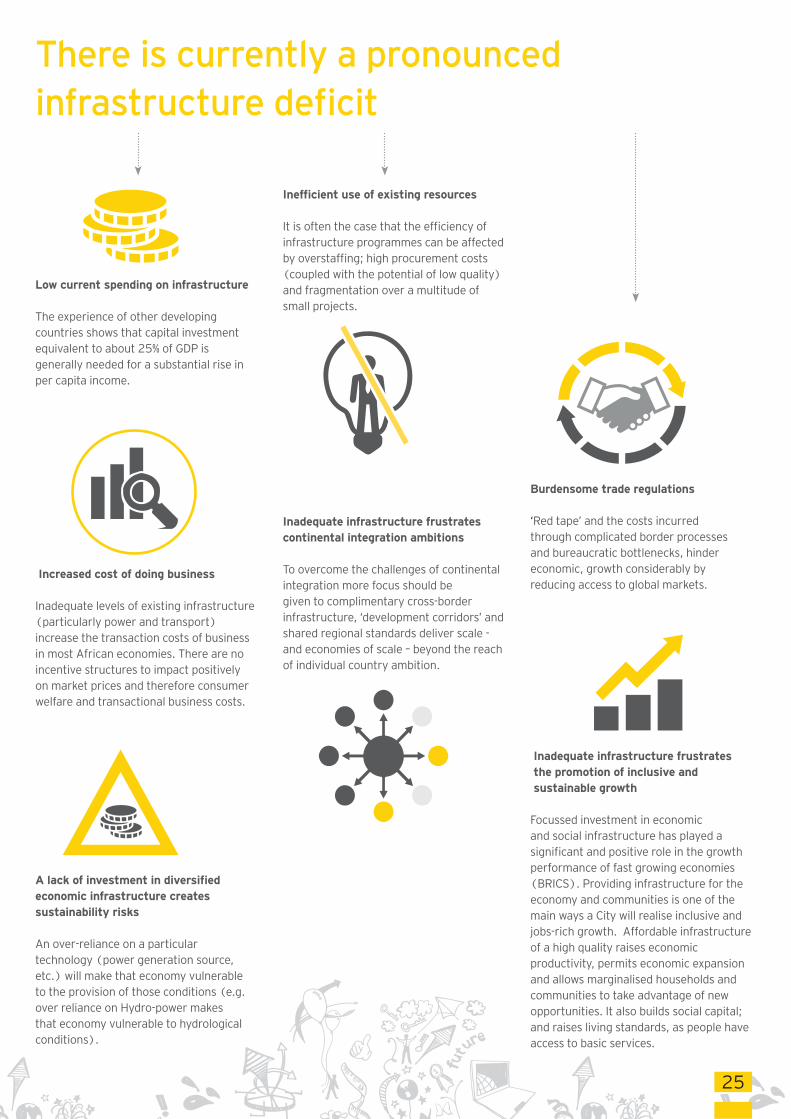
A lack of investment in diversified economic infrastructure creates sustainability risks
An over-reliance on a particular technology (power generation source, etc.) will make that economy vulnerable to the provision of those conditions (e.g. over reliance on Hydro-power makes that economy vulnerable to hydrological conditions).
Low current spending on infrastructure The experience of other developing countries shows that capital investment equivalent to about 25% of GDP is generally needed for a substantial rise in per capita income.
Increased cost of doing business Inadequate levels of existing infrastructure (particularly power and transport) increase the transaction costs of business in most African economies. There are no incentive structures to impact positively on market prices and therefore consumer welfare and transactional business costs.
Inefficient use of existing resources It is often the case that the efficiency of infrastructure programmes can be affected by overstaffing; high procurement costs (coupled with the potential of low quality) and fragmentation over a multitude of small projects.
Inadequate infrastructure frustrates continental integration ambitions To overcome the challenges of continental integration more focus should be given to complimentary cross-border infrastructure, ‘development corridors’ and shared regional standards deliver scale - and economies of scale – beyond the reach of individual country ambition.
Burdensome trade regulations ‘Red tape’ and the costs incurred through complicated border processes and bureaucratic bottlenecks, hinder economic, growth considerably by reducing access to global markets.
Inadequate infrastructure frustrates the promotion of inclusive and sustainable growth
Focussed investment in economic and social infrastructure has played a significant and positive role in the growth performance of fast growing economies (BRICS). Providing infrastructure for the economy and communities is one of the main ways a City will realise inclusive and jobs-rich growth. Affordable infrastructure of a high quality raises economic productivity, permits economic expansion and allows marginalised households and communities to take advantage of new opportunities. It also builds social capital; and raises living standards, as people have access to basic services.
There is currently a pronounced
infrastructure deficit
25
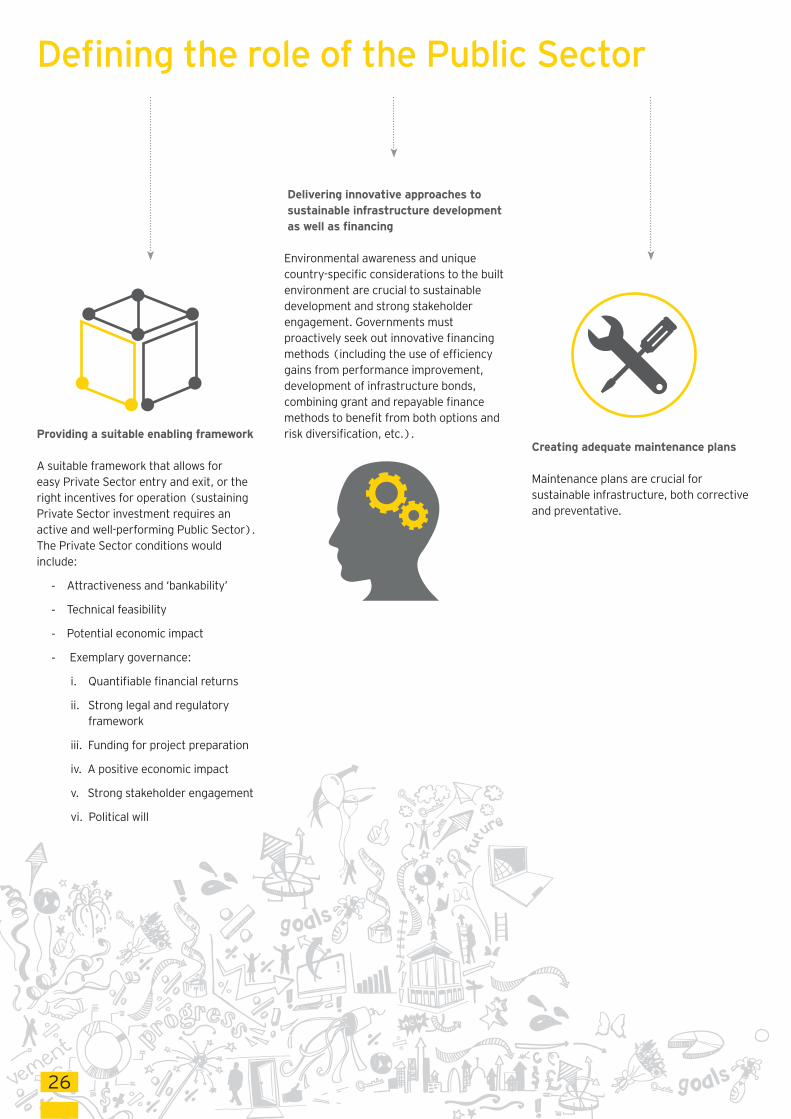
Providing a suitable enabling framework A suitable framework that allows for easy Private Sector entry and exit, or the right incentives for operation (sustaining Private Sector investment requires an active and well-performing Public Sector). The Private Sector conditions would include:
- Attractiveness and ‘bankability’
- Technical feasibility
- Potential economic impact
- Exemplary governance:
i. Quantifiable financial returns
ii. Strong legal and regulatory framework
iii. Funding for project preparation
iv. A positive economic impact
v. Strong stakeholder engagement
vi. Political will
Defining the role of the Public Sector
Delivering innovative approaches to sustainable infrastructure development as well as financing
Environmental awareness and unique country-specific considerations to the built environment are crucial to sustainable development and strong stakeholder engagement. Governments must proactively seek out innovative financing methods (including the use of efficiency gains from performance improvement, development of infrastructure bonds, combining grant and repayable finance methods to benefit from both options and risk diversification, etc.).
Creating adequate maintenance plans
Maintenance plans are crucial for sustainable infrastructure, both corrective and preventative.
26
27
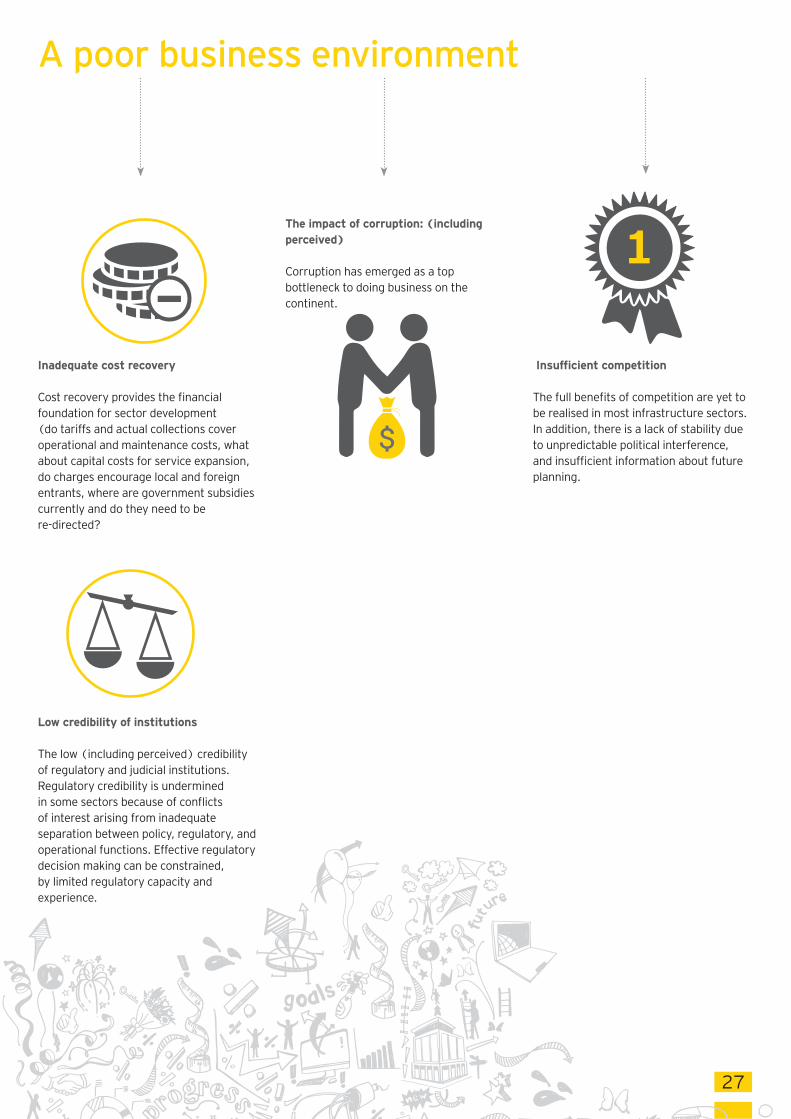
A poor business environment
Inadequate cost recovery
Cost recovery provides the financial foundation for sector development (do tariffs and actual collections cover operational and maintenance costs, what about capital costs for service expansion, do charges encourage local and foreign entrants, where are government subsidies currently and do they need to be re-directed?
The impact of corruption: (including perceived)
Corruption has emerged as a top bottleneck to doing business on the continent.
Insufficient competition
The full benefits of competition are yet to be realised in most infrastructure sectors. In addition, there is a lack of stability due to unpredictable political interference, and insufficient information about future planning.
Low credibility of institutions
The low (including perceived) credibility of regulatory and judicial institutions. Regulatory credibility is undermined in some sectors because of conflicts of interest arising from inadequate separation between policy, regulatory, and operational functions. Effective regulatory decision making can be constrained, by limited regulatory capacity and experience.
1
28
Access to financing and the ability to fund
investment over time
Baseline country and East Africa spending needs
The continent’s infrastructure spending needs are enormously significant, recent studies demonstrate that about 40% of total spending needs are associated with power. Using their meager fiscal resources, African governments simply cannot keep up with spending requirements. A baseline study that determines priority infrastructure needs (responding to local conditions and potential for wider integration) associated to market attractiveness (revenue returning vs. revenue hungry) and its potential economic impact (job creation, economic diversification, regional integration, enhancing innovation, etc.) is crucial.
Understanding the impact of efficient use of current infrastructure to reduce the funding gap
A more efficient use of existing infrastructure can reduce the overall funding gap. In order to achieve this goal, policymakers must focus on reducing inefficiencies through measures such as rehabilitating existing infrastructure, targeting better subsidies and improving budget execution (and health) and physical infrastructure (transportation, power, and information and communication technologies). However, given the potential role of deeper financial markets and more developed capital markets in helping find the necessary resources for such investments, policymakers should also consider improving the infrastructure of the financial system, starting with the payments system.
Identify opportunities to finance and fund the remaining gap and other infrastructure opportunities
In setting up policies to finance the remaining infrastructure gap and other infrastructure opportunities, two areas need consideration:
• Engage, coordinate and leverage different sources of financing and funding - The long-term maturity of infrastructure projects and their large scale require different types of financiers, including Private Sector, bilateral and multilateral partners. Policymakers therefore need to engage and coordinate with many partners. One challenge will be to find ways to leverage aid flows so as to attract the private investment necessary.
• Financial Innovation - African policymakers will also need to create appropriate innovative financing solutions. So far, Private Sector investment has focused on areas such as mobile telephones, power plants and container terminals. In other areas, such as power, water and railways, the Private Sector has preferred the use of concessions and other types of contracts. Innovative financing can play a role in attracting Private Sector funds to these areas. Financing infrastructure projects is challenging because of the large size, long tenures and complexity of projects. In Africa, local banks, which dominate the financial sector, are not able to provide sufficient long-term finance. Untapped sources of funding are also relevant. The use of diaspora bonds (like those issued by Ethiopia) as well as the placement of infrastructure bonds to the diaspora (like those in Kenya). In project finance, solutions to mitigate credit risk could involve multilateral partners. It critical to consider investments in financial infrastructure. Generally, efforts are dedicated to investments in social infrastructure (water supply, sanitation, sewage disposal, education and health) and physical infrastructure (transportation, power, and information and communication technologies). However, given the potential role of deeper financial markets and more developed capital markets in helping find the necessary resources for such investments, policymakers should also consider improving the infrastructure of the financial system, starting with the payments system.
???
Financing is selecting the immediate source of cash that will physically develop the assets, with the repayment of this investment over the life of the asset. Governments have a wide range of financing solutions, both public and private, available to develop infrastructure. Private investors have demonstrated a willingness to participate in a wide range of financing solutions in respect of government infrastructure including.
The difference between funding and financing of infrastructure
Funding is the revenue stream that repays the financing. The funding of infrastructure can be considered as the allocation of ultimate cash flows that support the construction and operation of infrastructure.
Financing
Funding

The adverse impacts of climate change These changes are a major challenge to socio-economic development globally. The African continent, including the East African region, is particularly vulnerable to impacts of climate change affecting key economic drivers such as water resources, agriculture, energy, transport, health, forestry, wildlife, land and infrastructure. The impacts include; water stress and scarcity, food insecurity, diminished hydropower generation potential, loss of biodiversity and ecosystem degradation, increased incidence of disease burden, the crumbling of infrastructure, high costs of disaster management as a result of increased frequency and intensity of droughts, floods and landslides.
Infrastructure design and development Governments across Africa must consider the impact of infrastructure design and development on:
• The ecology
• The production of increased levels of greenhouse gases and other emissions to air
• Water resources and the overall water environment
• Materials used in the infrastructure build itself
• Land use (current and future)
The environmental impact of service delivery The global requirements, driven through regulation, are becoming more stringent and costly. These indicators are motivated and managed through policies and programmes and should be fundamental to any, and all, infrastructure footprint considerations. A change in population (service users, through urbanisation, etc.) can create an inadequate provision of solid and waste water disposal, increased air pollution, due to transport volumes and emission from processing factories, etc.
Responding to environmental factors
29
30
A model foreconomic development
31
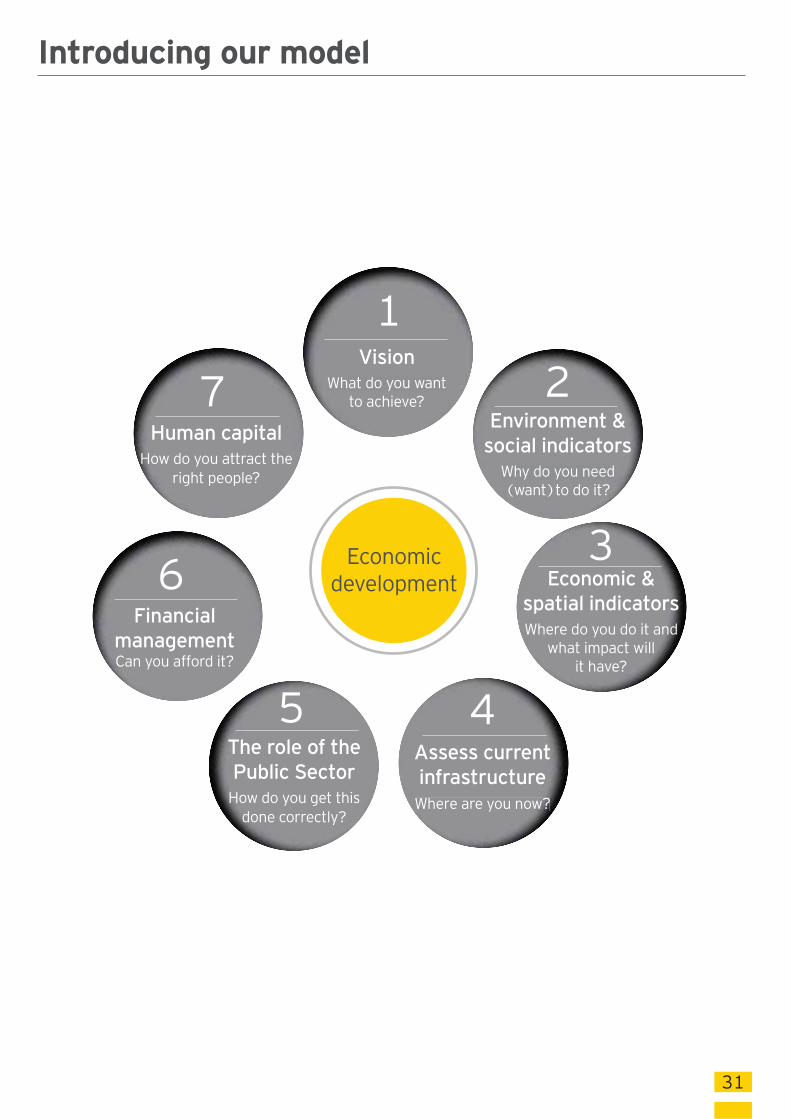
Introducing our model
Economic development
Financial
managementCan you afford it?
6
Human capital
How do you attract the right people?
7Vision
What do you want to achieve?
1
Environment &
social indicators
Why do you need (want)to do it?
2
3Economic &
spatial indicators
Where do you do it and what impact will
it have?
Assess current
infrastructure
Where are you now?
4The role of the
Public Sector
How do you get this done correctly?
5
32
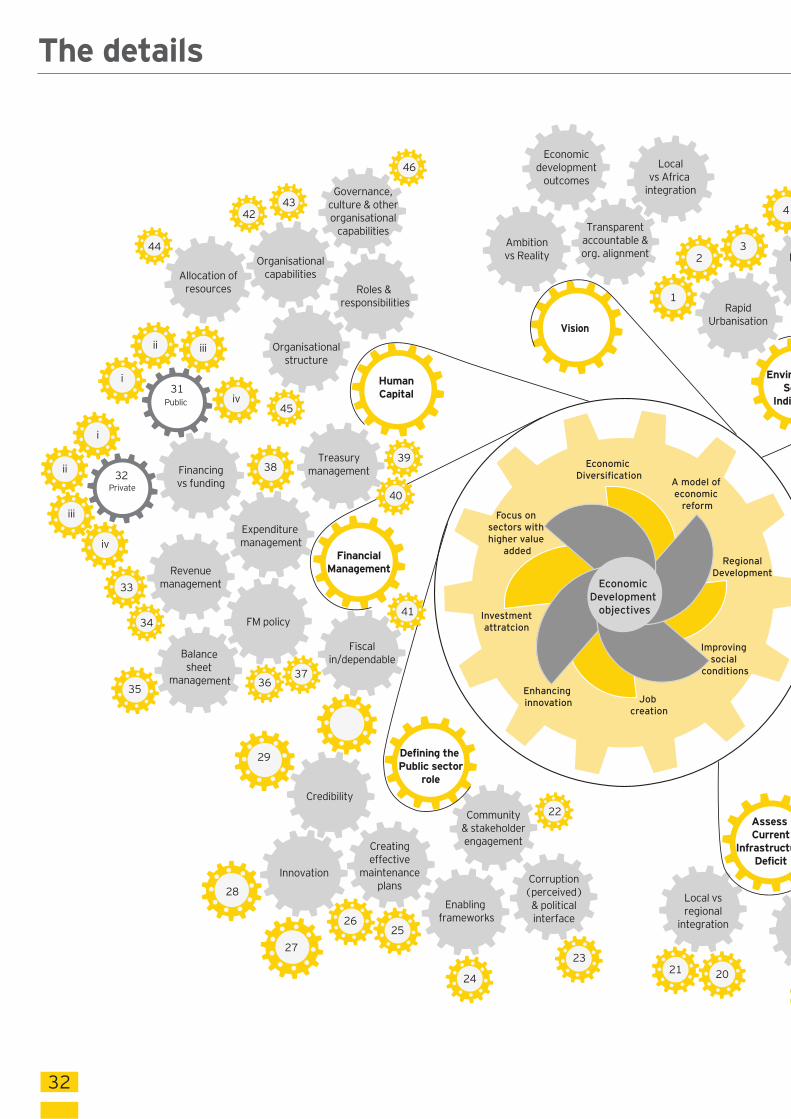
The details
Economic
Development
objectives
Economic
Diversification
Regional
Development
Improving
social
conditions
Job
creation
Enhancing
innovation
Investment
attratcion
Focus on
sectors with
higher value
added
Vision
A model of
economic
reform
EnvirSo
Indic
Ambitionvs Reality
Economicdevelopment
outcomes
Transparentaccountable &org. alignment
Localvs Africa
integration
Assess Current
InfrastructuDeficit
FinancialManagement
HumanCapital
Defining the Public sector
role
RapidUrbanisation
1
3
4
2 I
Local vsregional
integration
Community& stakeholderengagementCreating
effectivemaintenance
plans
Credibility
Innovation
Enabling frameworks
Private
Public
Corruption(perceived)
& politicalinterface
Fiscalin/dependable
FM policy
Treasurymanagement
Roles & responsibilities
Governance,culture & otherorganisational
capabilities
Organisationalcapabilities
Organisationalstructure
Allocation ofresources
Revenuemanagement
Balance sheet
management
Expenditure management
Financingvs funding
21 2024
23
3637
41
22
26
27
28
29
25
35
34
33
iv
iii
ii
i
i
ii iii
iv
3839
40
45
46
42
44
43
31
32
33
ronmentocialcators
Economic& Spatial Modelling
ure
5
6
7
8
9
10
11
mpacts ofclimate changes
Appropriate regulatoryframework
Socialcohesion
Socio-economic& spatial
assessment
Spatialtransportation
Need vs current
practice
Incentivestructures
Existingbarriers
Measuringthe benefits
of publicspending
12
13
14
15
16 17
18
19
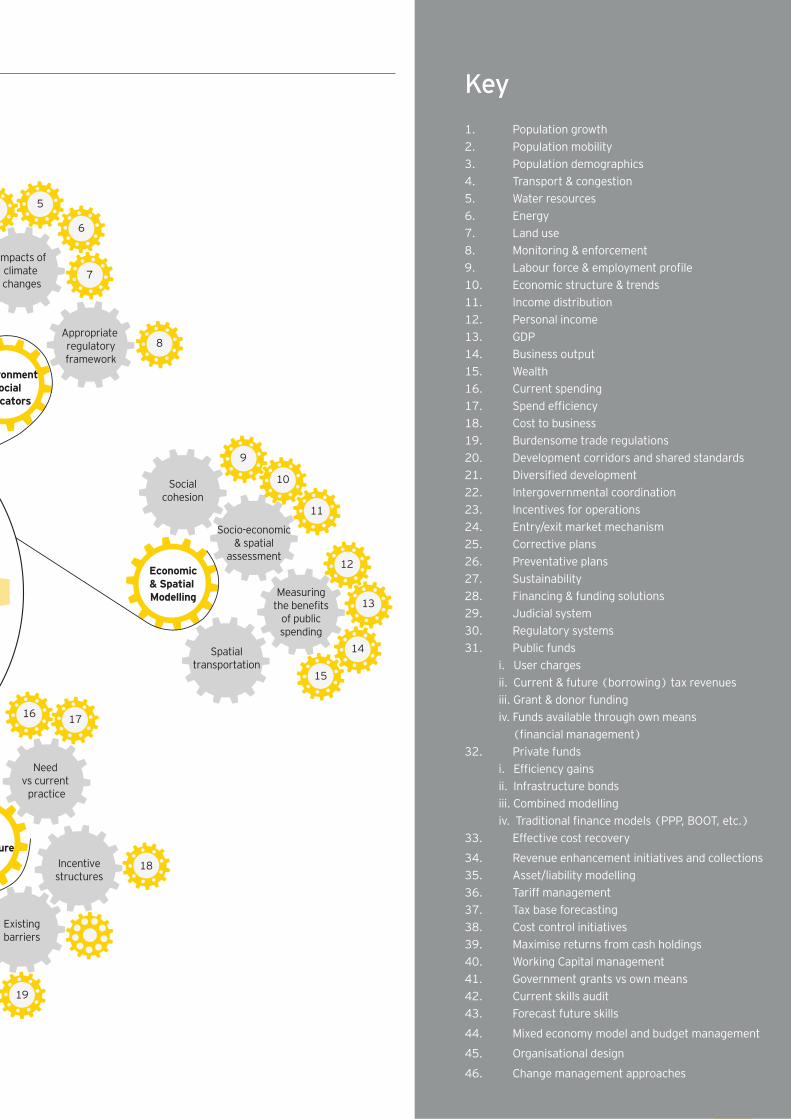
1. Population growth2. Population mobility3. Population demographics4. Transport & congestion5. Water resources6. Energy7. Land use8. Monitoring & enforcement9. Labour force & employment profile10. Economic structure & trends11. Income distribution12. Personal income13. GDP14. Business output15. Wealth16. Current spending17. Spend efficiency18. Cost to business19. Burdensome trade regulations20. Development corridors and shared standards21. Diversified development22. Intergovernmental coordination23. Incentives for operations24. Entry/exit market mechanism25. Corrective plans26. Preventative plans27. Sustainability28. Financing & funding solutions29. Judicial system30. Regulatory systems31. Public funds
i. User chargesii. Current & future (borrowing) tax revenuesiii. Grant & donor fundingiv. Funds available through own means
(financial management)32. Private funds
i. Efficiency gainsii. Infrastructure bondsiii. Combined modellingiv. Traditional finance models (PPP, BOOT, etc.)
33. Effective cost recovery
34. Revenue enhancement initiatives and collections35. Asset/liability modelling36. Tariff management37. Tax base forecasting38. Cost control initiatives39. Maximise returns from cash holdings40. Working Capital management41. Government grants vs own means42. Current skills audit43. Forecast future skills
44. Mixed economy model and budget management
45. Organisational design
46. Change management approaches
Key
34
Our approachto economic development
35
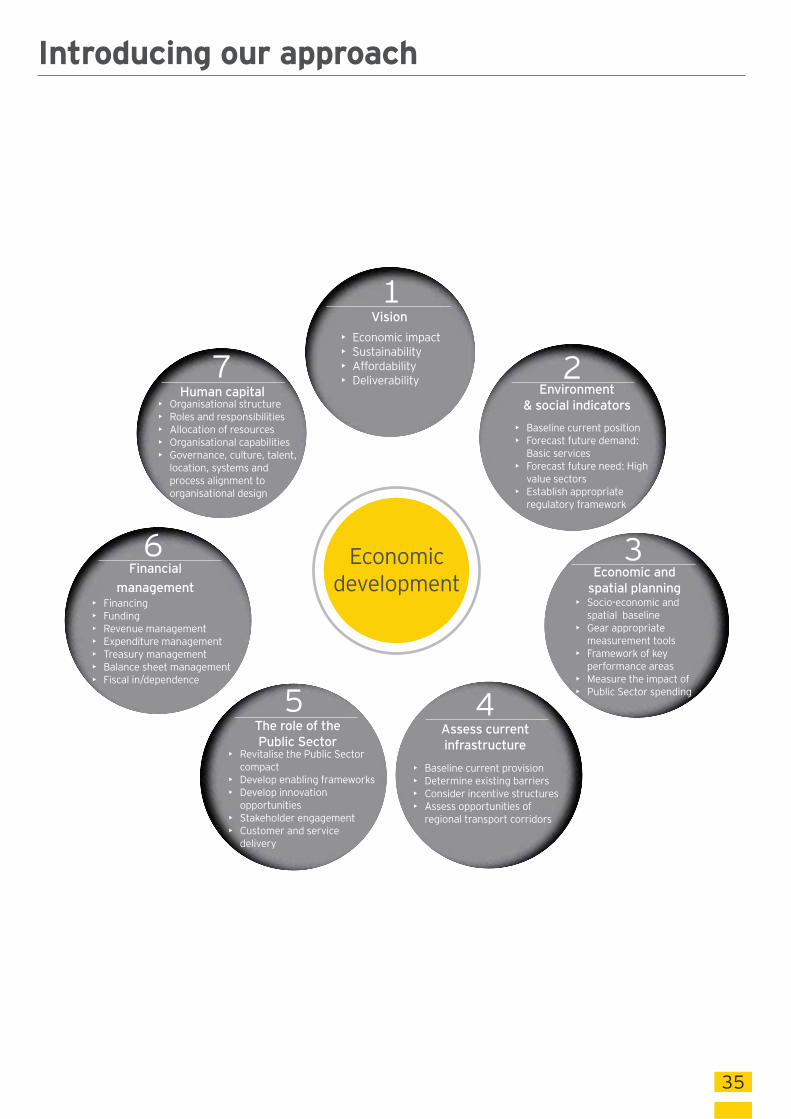
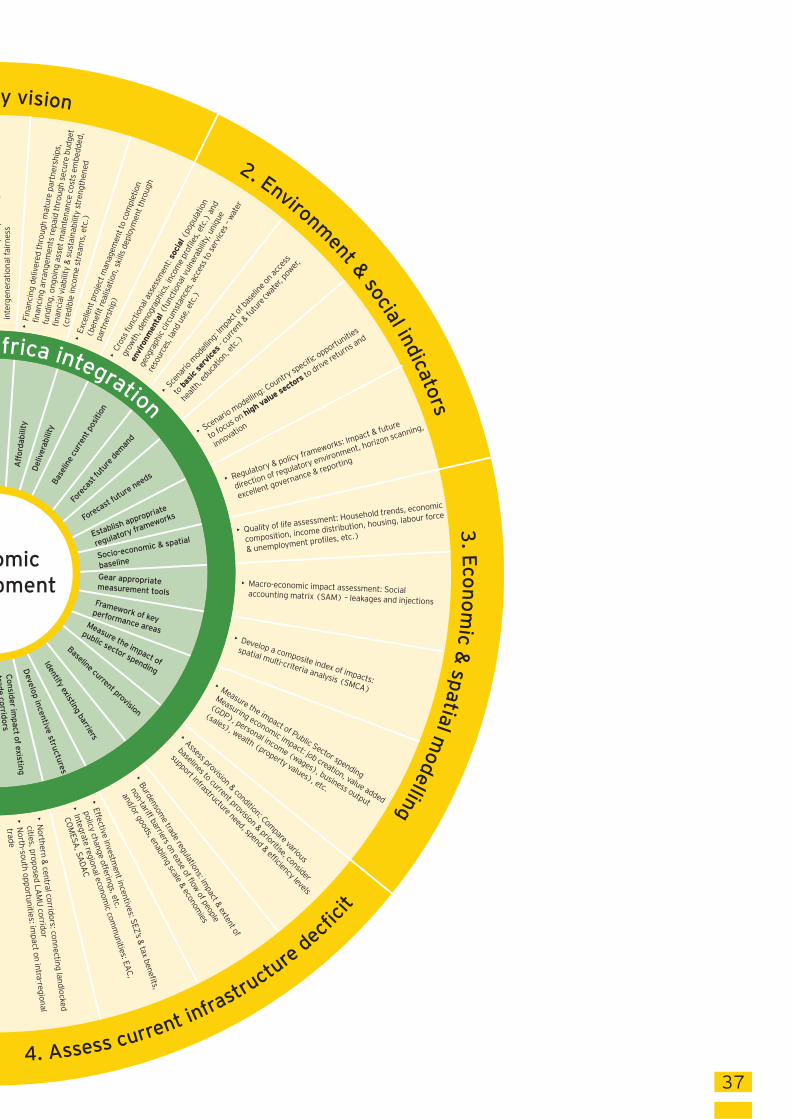
Introducing our approach
Economic development
Financial
management
6
Human capital
7
Vision
1
Environment
& social indicators
2
3Economic and
spatial planning
Assess current
infrastructure
4The role of the
Public Sector
5
• Economic impact• Sustainability• Affordability• Deliverability
• Baseline current position• Forecast future demand:
Basic services• Forecast future need: High
value sectors• Establish appropriate
regulatory framework
• Socio-economic and spatial baseline
• Gear appropriate measurement tools
• Framework of key performance areas
• Measure the impact of • Public Sector spending
• Baseline current provision• Determine existing barriers• Consider incentive structures• Assess opportunities of
regional transport corridors
• Revitalise the Public Sector compact
• Develop enabling frameworks• Develop innovation
opportunities • Stakeholder engagement• Customer and service
delivery
• Financing• Funding• Revenue management• Expenditure management• Treasury management • Balance sheet management• Fiscal in/dependence
• Organisational structure • Roles and responsibilities• Allocation of resources• Organisational capabilities• Governance, culture, talent,
location, systems and process alignment to organisational design
36
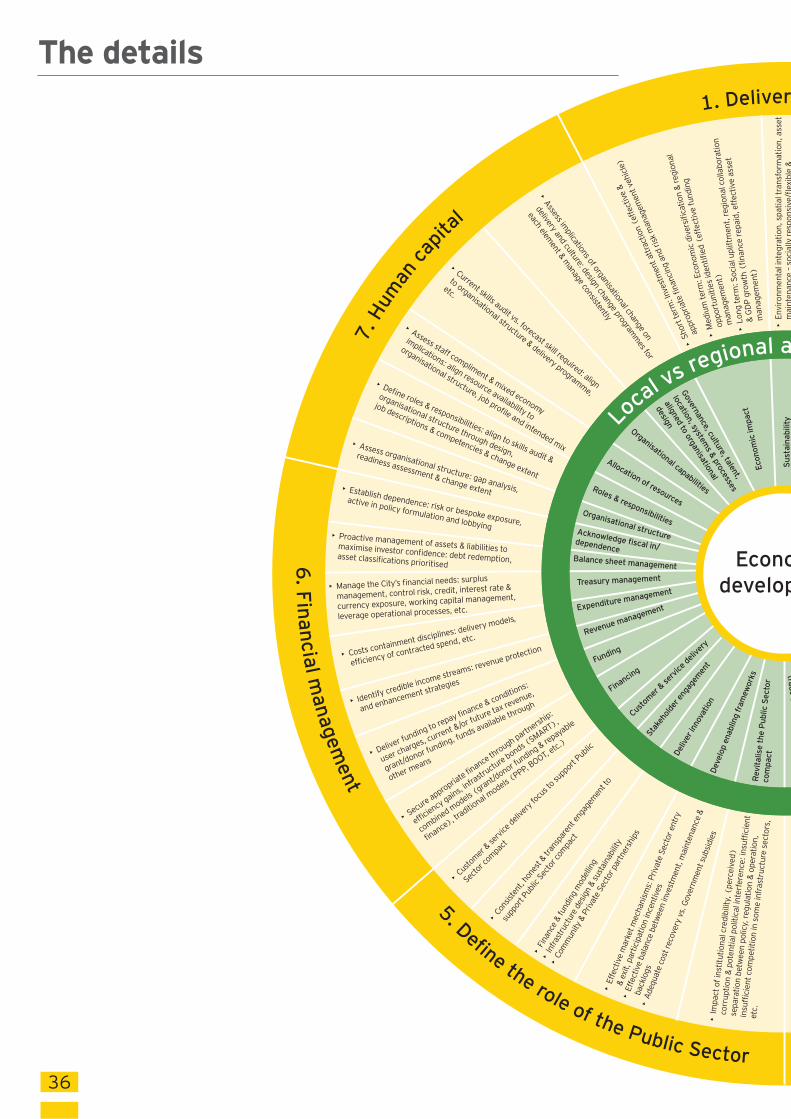
The details
v
(eff
fi
)
er
(eff
t)
Lo
(fire
f
t)
ree/fl
of
teerfer
fitw
fi
fror
et
Eff
es
Eff
twv
reov
vsov
s
frC
s
C
te
to
fo
to
S
re
fi
effi
fr
SMAR
/
re
fi
e
OT
to refi
rev
t/
o
rerev
ot
t s
Ceffi
of
fiter te
ver
oof
tov
Est
Are
exte
fi
re
to
or
exte
A
to
or
ofi
C
vsfore
toet
A
fo
e
te
5. D
efi ne the role of the Public Sector
6. F
ina
ncia
l man
agem
ent
7. H
um
an c
apit
al
1. Deliver
Econom
ic im
pact
Su
sta
inab
ilit
y
trad
e c
o
Revit
alise t
he P
ub
lic S
ecto
r co
mp
act
Develo
p e
nabling f
ram
ew
ork
s
Deliv
er
innova
tion
Sta
keho
lder
eng
agem
ent
Cus
tom
er &
ser
vice
del
iver
y
Financin
g Funding
Revenue managementExpenditure managementTreasury management
Acknowledge fi scal in/dependence
Balance sheet management
Organisational structure
Roles & responsibilities
Allocation of resources
Organisational capabilities
Gove
rnance, cu
lture, ta
lent,
loca
tion, syste
ms &
pro
cesse
s
alig
ned to
org
anisa
tional
desig
nLoca
l vs re
gional a
Econo
develop
37
/ter
erfi
re
refir
reEx
to
fire )
Cr
soci
al
o
ofi
envi
ronm
enta
l
te
r
toba
sic se
rvice
s
e(te
owe
tofo
high value sectorsto
v
R
w
ofov
offo
ofi
(S
v
ofSMCA)
of
e
(
s
(w
(s
weA
oto
o
fr
fi
v
exte
of flowof
s
Effv
fits
off
COMES
SAC
tr
2. Environm
ent & so
cial in
dic
ato
rs
3. E
co
no
mic
& s
patia
l modellin
g
4. Assess current infra
structu
re d
ecfi c
it
y vision
Aff
ord
ab
ilit
y
Delivera
bilit
yB
ase
line c
urr
ent posi
tion
Fore
cast
futu
re d
eman
d
Fore
cast fu
ture
needs
Gear appropriate measurement tools
Framework of key performance areas
Measure the impact of
public sector spending
Baseline current provision
Identify
existing b
arrie
rs
Develo
p in
centiv
e s
tructu
res
Co
nsid
er im
pact o
f exis
ting
trad
eco
rrido
rs
Socio-economic & spatial
baseline
Establish appropriate
regulatory frameworks
frica integration
omic
pment
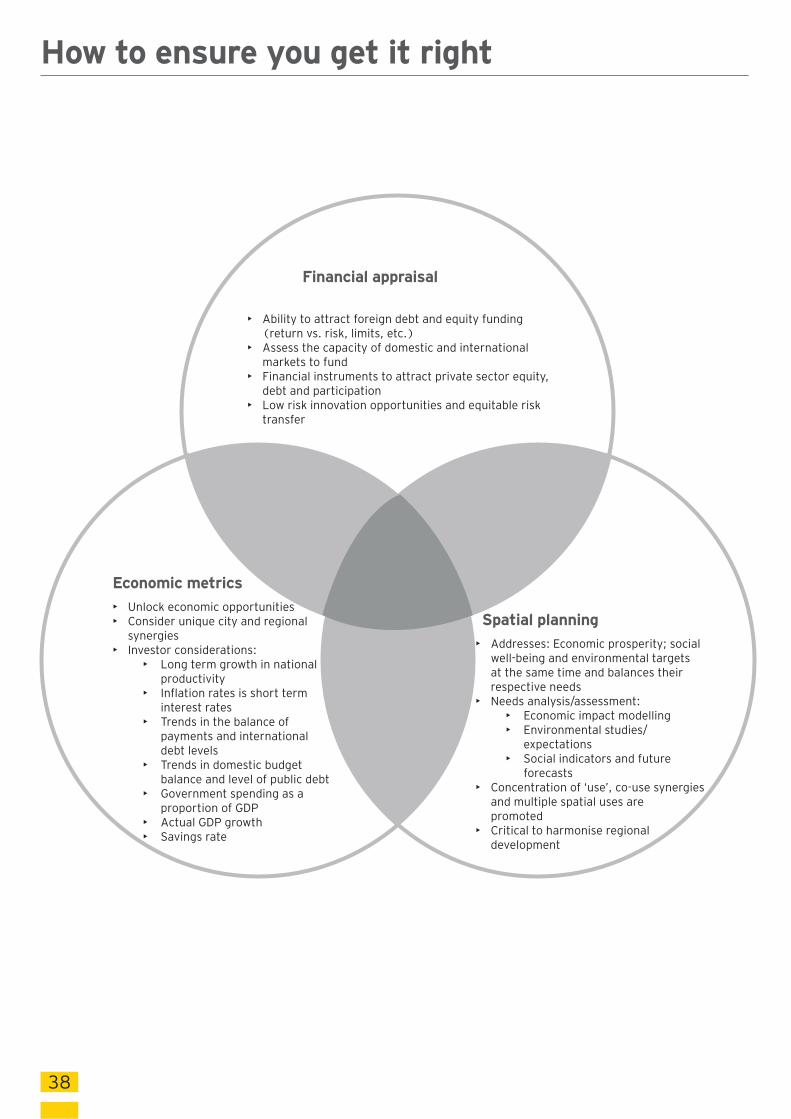
38
How to ensure you get it right
• Ability to attract foreign debt and equity funding (return vs. risk, limits, etc.)
• Assess the capacity of domestic and international markets to fund
• Financial instruments to attract private sector equity, debt and participation
• Low risk innovation opportunities and equitable risk transfer
• Unlock economic opportunities• Consider unique city and regional
synergies• Investor considerations:
• Long term growth in national productivity
• Inflation rates is short term interest rates
• Trends in the balance of payments and international debt levels
• Trends in domestic budget balance and level of public debt
• Government spending as a proportion of GDP
• Actual GDP growth• Savings rate
• Addresses: Economic prosperity; social well-being and environmental targets at the same time and balances their respective needs
• Needs analysis/assessment: • Economic impact modelling• Environmental studies/
expectations• Social indicators and future
forecasts• Concentration of ‘use’, co-use synergies
and multiple spatial uses are promoted
• Critical to harmonise regional development
•
Financial appraisal
Economic metrics
Spatial planning

39
City management
• Clear political mandate• Democratic, accountable
link• Contextual and reality
based direction• Strategic and operational
plans are aligned and resourced
• Revenue management• Expenditure management• Balance sheet
management • Proactive treasury
management • Cash reserves • Fiscal in/dependence• Impact of financing
decisions/instruments
• Fiduciary structures;• Constitutional
arrangements; • Decision making
capabilities• Organisational
improvement tracking
Environment (local, regional/international):• Technology constraints or opportunities• Environmental issues• Legislative change
Environment (local, regional/international):• Macro-political• Economic landscape• Social indicators
Customers, Partners & Resources
• Services performed• Needs vs. ambition• Enabling structures &
technologies
• Economic growth & regeneration
Leaders
hip
am
bition Functional resp
onsib
ility
and resp
onsib
ilit
y
Financial a
utonom
yR
egula
tory responsibility
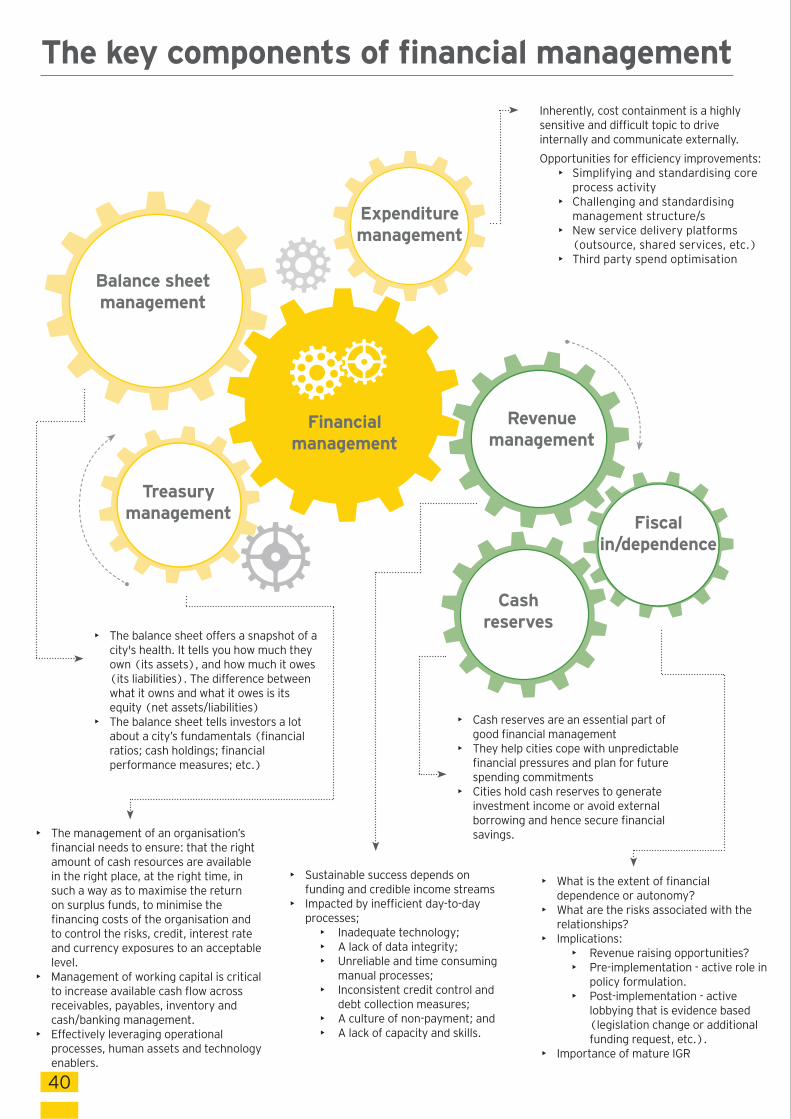
40
The key components of financial management
Balance sheet management
Revenue management
Expenditure management
Treasury management
Cash reserves
Fiscal in/dependence
• The balance sheet offers a snapshot of a city's health. It tells you how much they own (its assets), and how much it owes (its liabilities). The difference between what it owns and what it owes is its equity (net assets/liabilities)
• The balance sheet tells investors a lot about a city’s fundamentals (financial ratios; cash holdings; financial performance measures; etc.)
• Sustainable success depends on funding and credible income streams
• Impacted by inefficient day-to-day processes;
• Inadequate technology; • A lack of data integrity;• Unreliable and time consuming
manual processes; • Inconsistent credit control and
debt collection measures; • A culture of non-payment; and • A lack of capacity and skills.
• What is the extent of financial dependence or autonomy?
• What are the risks associated with the relationships?
• Implications:• Revenue raising opportunities?• Pre-implementation - active role in
policy formulation.• Post-implementation - active
lobbying that is evidence based (legislation change or additional funding request, etc.).
• Importance of mature IGR
• Cash reserves are an essential part of good financial management
• They help cities cope with unpredictable financial pressures and plan for future spending commitments
• Cities hold cash reserves to generate investment income or avoid external borrowing and hence secure financial savings.• The management of an organisation’s
financial needs to ensure: that the right amount of cash resources are available in the right place, at the right time, in such a way as to maximise the return on surplus funds, to minimise the financing costs of the organisation and to control the risks, credit, interest rate and currency exposures to an acceptable level.
• Management of working capital is critical to increase available cash flow across receivables, payables, inventory and cash/banking management.
• Effectively leveraging operational processes, human assets and technology enablers.
Inherently, cost containment is a highly sensitive and difficult topic to drive internally and communicate externally.
Opportunities for efficiency improvements:• Simplifying and standardising core
process activity• Challenging and standardising
management structure/s• New service delivery platforms
(outsource, shared services, etc.)• Third party spend optimisation
Financial management
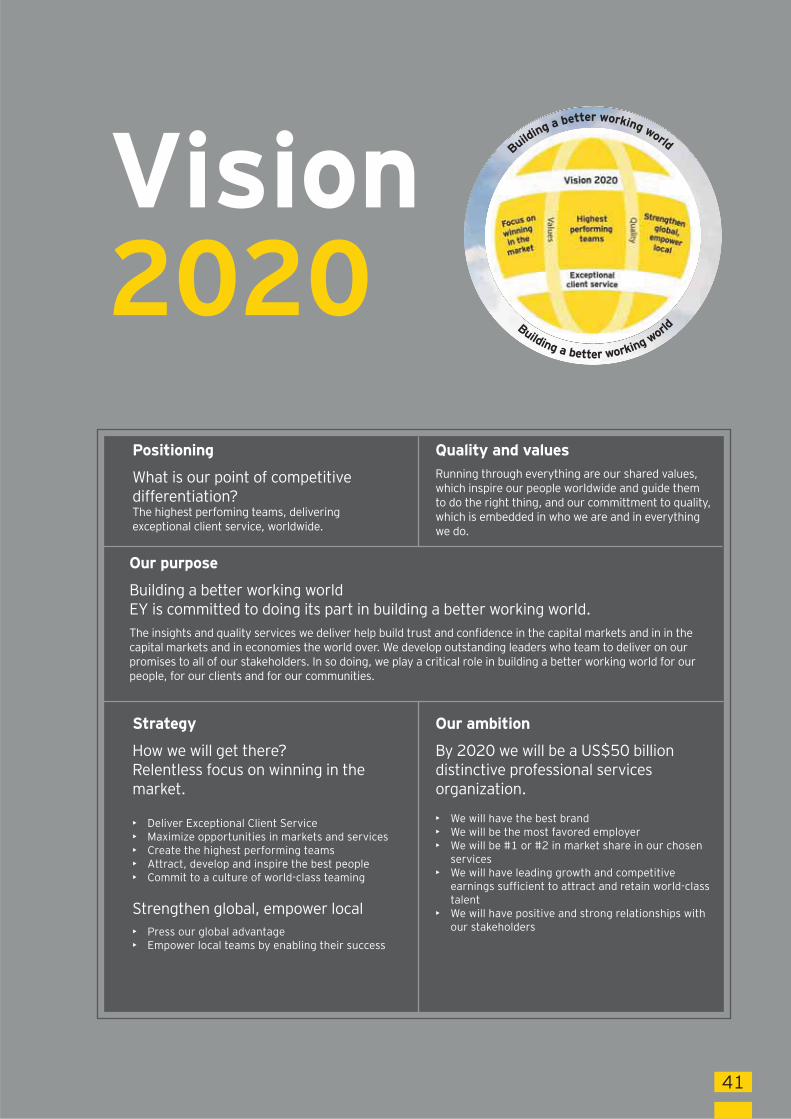
Vision 2020
Building a better working world
Building a better working world
Positioning
What is our point of competitive differentiation?The highest perfoming teams, delivering exceptional client service, worldwide.
Strategy
How we will get there?Relentless focus on winning in the market. • Deliver Exceptional Client Service• Maximize opportunities in markets and services• Create the highest performing teams • Attract, develop and inspire the best people• Commit to a culture of world-class teaming
Strengthen global, empower local• Press our global advantage• Empower local teams by enabling their success
Our purpose
Building a better working worldEY is committed to doing its part in building a better working world.The insights and quality services we deliver help build trust and confidence in the capital markets and in in the capital markets and in economies the world over. We develop outstanding leaders who team to deliver on our promises to all of our stakeholders. In so doing, we play a critical role in building a better working world for our people, for our clients and for our communities.
Quality and valuesRunning through everything are our shared values, which inspire our people worldwide and guide them to do the right thing, and our committment to quality, which is embedded in who we are and in everything we do.
Our ambition
By 2020 we will be a US$50 billion distinctive professional services organization.
• We will have the best brand • We will be the most favored employer• We will be #1 or #2 in market share in our chosen
services• We will have leading growth and competitive
earnings sufficient to attract and retain world-class talent
• We will have positive and strong relationships with our stakeholders
41


EY | Assurance | Tax | Transactions | Advisory
About EY
EY is a global leader in assurance, tax, transaction and advisory services. The insights and quality services we deliver help build trust and confidence in the capital markets and in economies the world over. We develop outstanding leaders who team to deliver on our promises to all of our stakeholders. In so doing, we play a critical role in building a better working world for our people, for our clients and for our communities. EY refers to the global organization, and may refer to one or more, of the member firms of Ernst & Young Global Limited, each of which is a separate legal entity. Ernst & Young Global Limited, a UK company limited by guarantee, does not provide services to clients. For more information about our organization, please visit ey.com. © 2014 EYGM Limited. All Rights Reserved
Creative Services ref. 140902 Artwork by Khumalo.
ED no. None This material has been prepared for general informational purposes only and is not intended to be relied upon as accounting, tax, or other professional advice. Please refer to your advisors for specific advice.
ey.com