Degrees of Freedom for Interference Networks aided by Relays Bounds and achievable schemes

Advancing by Degrees
AP
RIL
2
01
0H
IG
HE
R
ED
UC
AT
IO
N
A Framework for Increasing College Completion
AdvbyDegrees.indd c1 12/6/2010 1:32:26 PM
2 IHELP | THE EDUCATION TRUST | ADVANCING BY DEGREES | APRIL 2010
Higher education leaders need to understand
what really drives student success. Tracking
six-year graduation and annual retention
rates isn’t enough. By monitoring a set
of milestones and on-track indicators—
measurable educational achievements
and academic and enrollment patterns—
institutional leaders can learn which groups of
students are making progress and which are
not—and why. Data college offi cials gather in
this process can inform changes in policies or
practices and help struggling students get the
help they need.
© Copyright 2010 Institute for Higher Education Leadership & Policy and The Education Trust. All rights reserved.
AdvbyDegrees.indd c2 12/6/2010 1:32:32 PM
IHELP | THE EDUCATION TRUST | ADVANCING BY DEGREES | APRIL 2010 1
The United States is becoming less globally
competitive as other nations move aggressively
to educate their populations. To lead the world
once again in educational attainment—President
Obama’s goal by 2020—more Americans will need to enter
college. But our biggest challenge isn’t college going; it is
college completion.
Low-income students and students of color—a large
and growing population—complete college at especially
low rates. At many institutions, though, graduation rates
are not high for any group of students.
Around the country, higher education leaders who want
to help increase the number of graduates in their com-
munities and states are all asking the same questions: To
improve student success, where should we focus? And how
will we know if what we do is working?
• At one major state university system, leaders are
concerned that black and Latino students are earn-
ing bachelor’s degrees at far lower rates than white
and Asian students. They fi nd the extensive research
literature about student success more overwhelming
than helpful. Moreover, their budget has just been
cut, and they have to be sure that the steps they take
address the root of the problem. Where should they
start?
• At a large community college system, leaders know
that most students never advance to the point of
passing a college-level mathematics course and thus
never earn a college degree. System leaders have
observed how certain “boutique” programs have
helped students succeed in math, but they cannot
afford to offer these programs to all students. What
changes in institutional practice or policy would help
eliminate barriers to success and give students the
best chance of passing college-level math?
Experience has taught us that the answers to these ques-
tions often lie buried in the reams of data that most col-
leges routinely produce but rarely analyze. Drawing on our
analyses of data from two large postsecondary systems, this
report aims to help system and campus leaders use their
data to (1) deepen their understanding of what really aids
student success and (2) produce a set of timely, “on track”
indicators that can rapidly gauge the impact of efforts to
produce change.
Timely indicators are hugely important if institutional
leaders are to know whether things are on track or off
track —before it’s too late. Monitoring six-year graduation
rates, in other words, doesn’t come close to being good
enough. Neither does simply monitoring annual retention
rates because there is so much more that can help leaders
understand what’s going right or wrong on the road to col-
lege success.
We’ve provided some examples of how to analyze insti-
tutional data and create more useful indicators by drawing
on data sets from one public university system and one
large community college system. The answers you get may
vary somewhat from these, for some things may be more
(or less) important in certain types of institutions or for
certain types of students.
Regardless of the circumstances, however, there are
two things institutional leaders should never do as they
learn more about the students who don’t succeed. They
shouldn’t lower standards, and they shouldn’t excuse low
graduation rates for some groups of students because
“students like these” supposedly cannot be expected to
graduate at higher rates.
Advancing by DegreesA Framework for Increasing College Completion
B Y J E R E M Y O F F E N S T E I N , C O L L E E N M O O R E , A N D N A N C Y S H U L O C K
Jeremy Offenstein is a research analyst, Colleen Moore is a research specialist, and Nancy Shulock is director of the Institute for Higher Education Leadership & Policy in Sacramento, Calif.
AdvbyDegrees.indd 1 12/6/2010 1:32:32 PM
2 IHELP | THE EDUCATION TRUST | ADVANCING BY DEGREES | APRIL 2010
WHAT THE RESEARCH SHOWS Although students surely must be held accountable for
doing their part to prepare for and succeed in college,
most institutional leaders know that their colleges could
work a lot better for today’s students. Fortunately, the
research literature is encouraging in this regard. Much is
known about factors that lead to student academic prog-
ress and degree completion. And much of this is within
the power of institutions to affect.
Available research tells us a lot about what matters in
efforts to improve student success. Although each study
approaches the issue a little differently, most point in the
same general direction. And the fi ndings about what mat-
ters hold up across different groups of students entering at
very different levels of preparation.
RemediationMany students enroll in college academically unprepared
for college-level work. This makes the need for remedia-
tion a major barrier for students and suggests the success-
ful completion of remediation as a possible indicator of
momentum. Some students who need extra help do not
enroll in the appropriate remedial courses, which com-
plicates efforts to evaluate the effectiveness of specifi c
remedial programs. Some research has found that students
who successfully complete remedial coursework have
persistence and success rates similar to those who start
directly in college-level courses, while other studies fi nd
little evidence that remediation improves rates of success.
A number of researchers have found that students who
enroll in remedial coursework immediately upon entering
college have better outcomes than those who delay needed
remediation.
Gateway CoursesResearch in both two-year and four-year colleges points
to the importance of enrolling in and completing college-
level math early in a student’s college career. Some studies
also suggest that early completion of science courses can
serve as an indicator of likely success. The importance of
college-level English courses as an indicator is not as clear:
Some studies fi nd a positive relationship between com-
pleting college-level English early and degree completion;
other studies show no effect.
Credit Accumulation and Academic BehaviorsResearch points to the importance of early accumula-
tion of credits as a means of creating momentum toward
degree completion. Research on students in both two-year
and four-year institutions indicates that earning fewer than
a particular number of college-level credits in the fi rst year
(typically, 20 to 30) is negatively related to completion.
Accumulating additional credits during summer terms
is associated with increasing the likelihood of degree
completion. This may refl ect an impact of summer school
attendance per se or the fact that summer provides an
opportunity for students to make up for low credits in
an earlier term or to retake failed courses. There are also
patterns of enrollment that make it diffi cult to accumulate
credits, most notably part-time attendance and stopping
out, both of which are consistently found to reduce the
likelihood of retention and degree completion.
Studies also have found that students who withdraw
from a substantial share of courses (with common mea-
sures being 10 percent or 20 percent) reduce their chances
of degree completion. This holds true for students in
two-year and four-year institutions alike. And in commu-
nity colleges, research on the impact of registering late for
classes has generally concluded that late registrants have
higher course-withdrawal rates, lower grade-point averages
(GPA), and lower retention rates.
Academic performance in college, usually measured as
GPA, provides another important indicator of progress.
Indeed, studies fi nd substantial increases in the chance
of retention and degree completion with every one-grade
increase in college GPA, after controlling for high school
preparation and other factors. Other research has empha-
sized the importance of the trend in a student’s GPA.
Students with rising GPAs over some number of terms are
more likely to earn a degree than students with GPAs that
either remain constant or decline over time.
A FRAMEWORK FOR IMPROVING AND MONITORING STUDENT SUCCESSInstitutional leaders who want to do more than monitor
year-to-year retention rates and six-year graduation rates
may fi nd it helpful to think about things this way:
• Milestones are measurable educational achieve-
ments that students reach along the path to degree
completion.
• On-track indicators are measurable academic and
enrollment patterns that, if followed, give students a
AdvbyDegrees.indd 2 12/6/2010 1:32:32 PM
IHELP | THE EDUCATION TRUST | ADVANCING BY DEGREES | APRIL 2010 3
good chance of reaching key milestones and earning
a degree.
By monitoring on-track indicators, institutional leaders
can better understand not only which milestones students
are failing to reach but why they are not reaching them.
This knowledge can help leaders design interventions or
policy changes to increase student success. Continued
monitoring of on-track indicators relative to milestones
can help leaders gauge the impact of interventions.
The framework is intended to help leaders understand
the problem of insuffi cient graduation rates, diagnose the
reasons behind the problem, and target their responses
accordingly. The indicators can form the foundation for an
early warning system that can help identify students who
are struggling and get them the advice and help they need.
Our purposes here, however, are different: to help leaders
within an institution look beyond individual students to
see general patterns among large groups of students and to
use those data to refl ect on policies or practices that need
attention. These data, in turn, can become a means for
measuring the impact of changes in policy and practice.
As we show in the subsequent analyses of data from
two large postsecondary systems, the framework can be
applied as follows:
• Obtain institutional data with student-level tran-
script data.
• Analyze student achievement of various milestones
by subgroup to identify places where progress stalls.
• Investigate these stall-spots by using on-track indica-
tors to learn which students are not following suc-
cessful enrollment patterns, where they are stalling,
and what they are doing instead.
• Explore the relationships between current insti-
tutional policies and practices and the patterns
revealed in the analysis.
• Decide on interventions—that is, changes in policy
and/or practice—and agree on the most critical on-
track indicators to measure in order to monitor the
impact of any changes implemented.
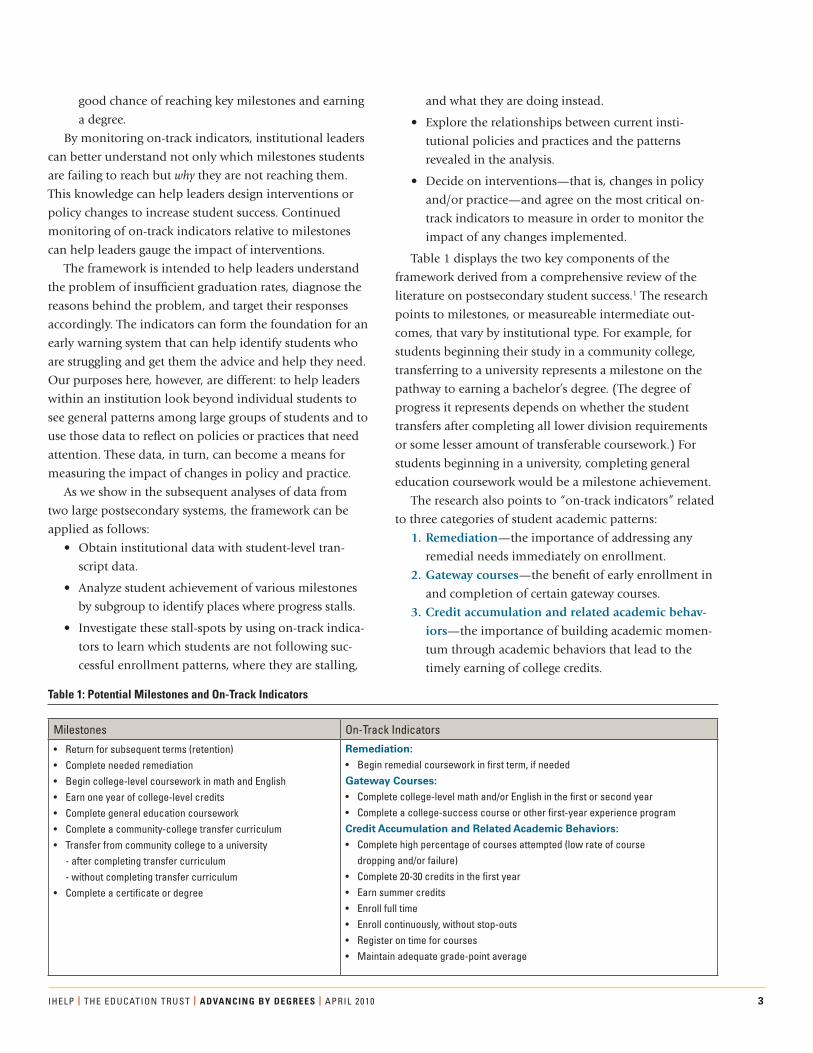
Table 1 displays the two key components of the
framework derived from a comprehensive review of the
literature on postsecondary student success.1 The research
points to milestones, or measureable intermediate out-
comes, that vary by institutional type. For example, for
students beginning their study in a community college,
transferring to a university represents a milestone on the
pathway to earning a bachelor’s degree. (The degree of
progress it represents depends on whether the student
transfers after completing all lower division requirements
or some lesser amount of transferable coursework.) For
students beginning in a university, completing general
education coursework would be a milestone achievement.
The research also points to “on-track indicators” related
to three categories of student academic patterns:
1. Remediation—the importance of addressing any
remedial needs immediately on enrollment.
2. Gateway courses—the benefi t of early enrollment in
and completion of certain gateway courses.
3. Credit accumulation and related academic behav-
iors—the importance of building academic momen-
tum through academic behaviors that lead to the
timely earning of college credits.
Milestones On-Track Indicators
• Return for subsequent terms (retention)• Complete needed remediation• Begin college-level coursework in math and English• Earn one year of college-level credits• Complete general education coursework• Complete a community-college transfer curriculum• Transfer from community college to a university - after completing transfer curriculum - without completing transfer curriculum• Complete a certifi cate or degree
Remediation:
• Begin remedial coursework in fi rst term, if neededGateway Courses:
• Complete college-level math and/or English in the fi rst or second year• Complete a college-success course or other fi rst-year experience programCredit Accumulation and Related Academic Behaviors:
• Complete high percentage of courses attempted (low rate of course dropping and/or failure)
• Complete 20-30 credits in the fi rst year• Earn summer credits• Enroll full time• Enroll continuously, without stop-outs• Register on time for courses• Maintain adequate grade-point average
Table 1: Potential Milestones and On-Track Indicators
AdvbyDegrees.indd 3 12/6/2010 1:32:33 PM
4 IHELP | THE EDUCATION TRUST | ADVANCING BY DEGREES | APRIL 2010
The remainder of this report describes our use of data
from two large higher education systems to confi rm the
patterns of student progress and success noted in the
research literature and to demonstrate the value of using
milestones and on-track indicators to identify points
where students are falling “off track.” By doing so, college
leaders will be able to use that information to change
policies and practices to better support student success.
TOO FEW STUDENTS REACH MILESTONES ON THE ROAD TO DEGREE COMPLETIONTo examine patterns of student progress in different types
of institutions with different levels of admissions selec-
tivity, we obtained data from both a community college
system and a university system.
The largest system of its kind in the country, the Califor-
nia Community College system (CCC) has 112 open-ad-
missions campuses. The State University System of Florida
(SUSF) is fairly selective in its admissions relative to other
public four-year systems. Both CCC and SUSF maintain
student-level tracking data at the system offi ces, and both
are large enough to allow for disaggregating data for sub-
groups of students. Each system provided data to track a
cohort of new students over time (see “Data and Methods”
on page 7 for more details). Although little remediation
occurs in the SUSF, and the CCC did not have good data
on remedial placements, their data systems had virtually
all of the other elements necessary to track progress.
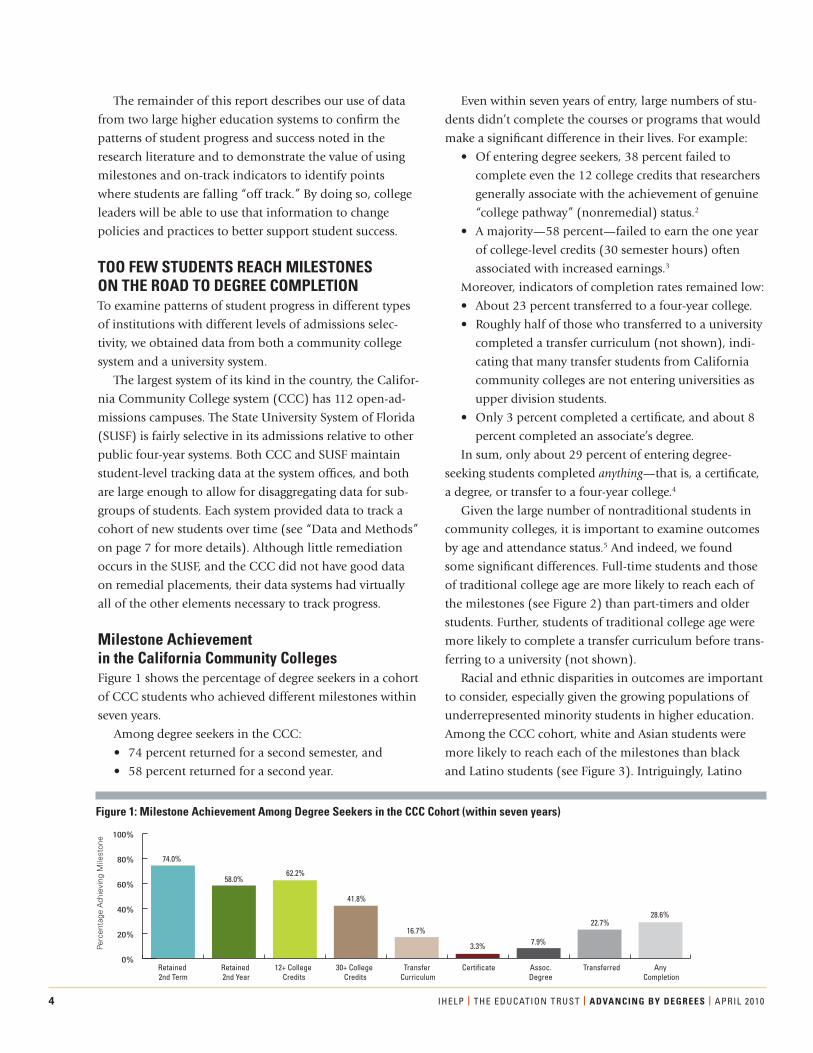
Milestone Achievement in the California Community CollegesFigure 1 shows the percentage of degree seekers in a cohort
of CCC students who achieved different milestones within
seven years.
Among degree seekers in the CCC:
• 74 percent returned for a second semester, and
• 58 percent returned for a second year.
Even within seven years of entry, large numbers of stu-
dents didn’t complete the courses or programs that would
make a signifi cant difference in their lives. For example:
• Of entering degree seekers, 38 percent failed to
complete even the 12 college credits that researchers
generally associate with the achievement of genuine
“college pathway” (nonremedial) status.2
• A majority—58 percent—failed to earn the one year
of college-level credits (30 semester hours) often
associated with increased earnings.3
Moreover, indicators of completion rates remained low:
• About 23 percent transferred to a four-year college.
• Roughly half of those who transferred to a university
completed a transfer curriculum (not shown), indi-
cating that many transfer students from California
community colleges are not entering universities as
upper division students.
• Only 3 percent completed a certifi cate, and about 8
percent completed an associate’s degree.
In sum, only about 29 percent of entering degree-
seeking students completed anything—that is, a certifi cate,
a degree, or transfer to a four-year college.4
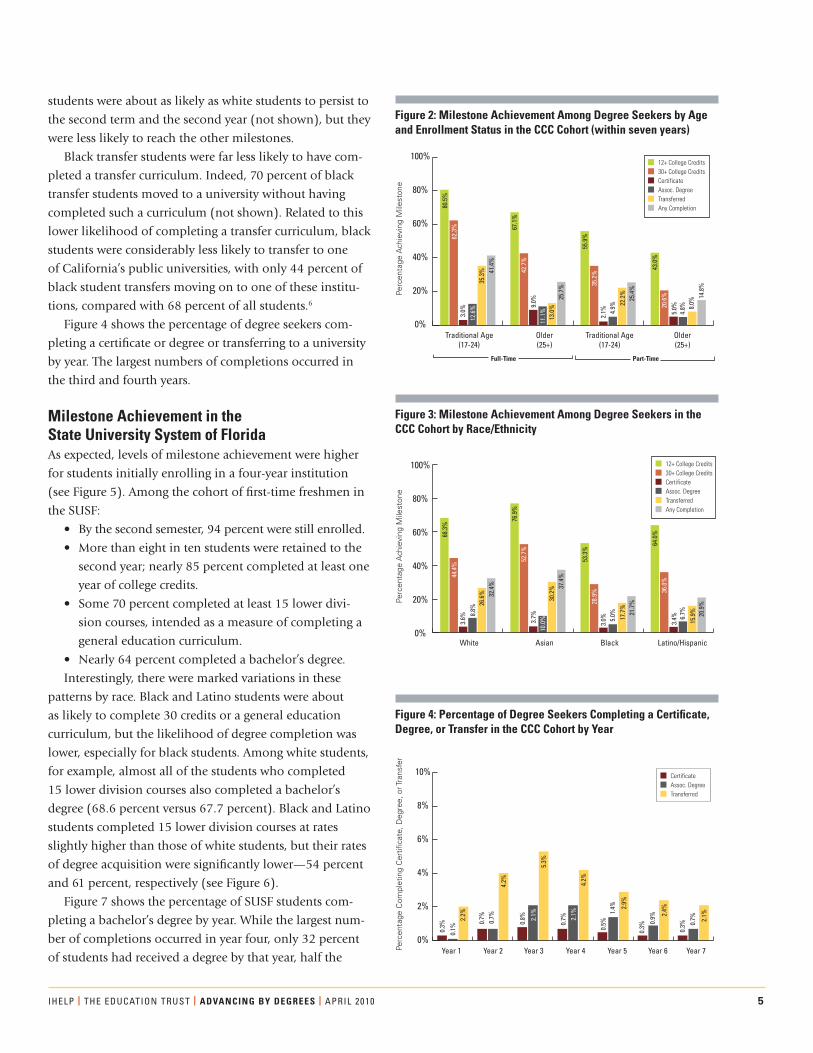
Given the large number of nontraditional students in
community colleges, it is important to examine outcomes
by age and attendance status.5 And indeed, we found
some signifi cant differences. Full-time students and those
of traditional college age are more likely to reach each of
the milestones (see Figure 2) than part-timers and older
students. Further, students of traditional college age were
more likely to complete a transfer curriculum before trans-
ferring to a university (not shown).
Racial and ethnic disparities in outcomes are important
to consider, especially given the growing populations of
underrepresented minority students in higher education.
Among the CCC cohort, white and Asian students were
more likely to reach each of the milestones than black
and Latino students (see Figure 3). Intriguingly, Latino
Figure 1: Milestone Achievement Among Degree Seekers in the CCC Cohort (within seven years)
0%
20%
40%
60%
80%
100%
Retained 2nd Term
Retained 2nd Year
12+ College Credits
30+ College Credits
Transfer Curriculum
Certificate Assoc.Degree
Transferred Any Completion
74.0%
58.0%62.2%
41.8%
16.7%
3.3% 7.9%
22.7%28.6%
Perc
enta
ge A
chie
ving
Mile
ston
e
AdvbyDegrees.indd 4 12/6/2010 1:32:33 PM
IHELP | THE EDUCATION TRUST | ADVANCING BY DEGREES | APRIL 2010 5
students were about as likely as white students to persist to
the second term and the second year (not shown), but they
were less likely to reach the other milestones.
Black transfer students were far less likely to have com-
pleted a transfer curriculum. Indeed, 70 percent of black
transfer students moved to a university without having
completed such a curriculum (not shown). Related to this
lower likelihood of completing a transfer curriculum, black
students were considerably less likely to transfer to one
of California’s public universities, with only 44 percent of
black student transfers moving on to one of these institu-
tions, compared with 68 percent of all students.6
Figure 4 shows the percentage of degree seekers com-
pleting a certifi cate or degree or transferring to a university
by year. The largest numbers of completions occurred in
the third and fourth years.
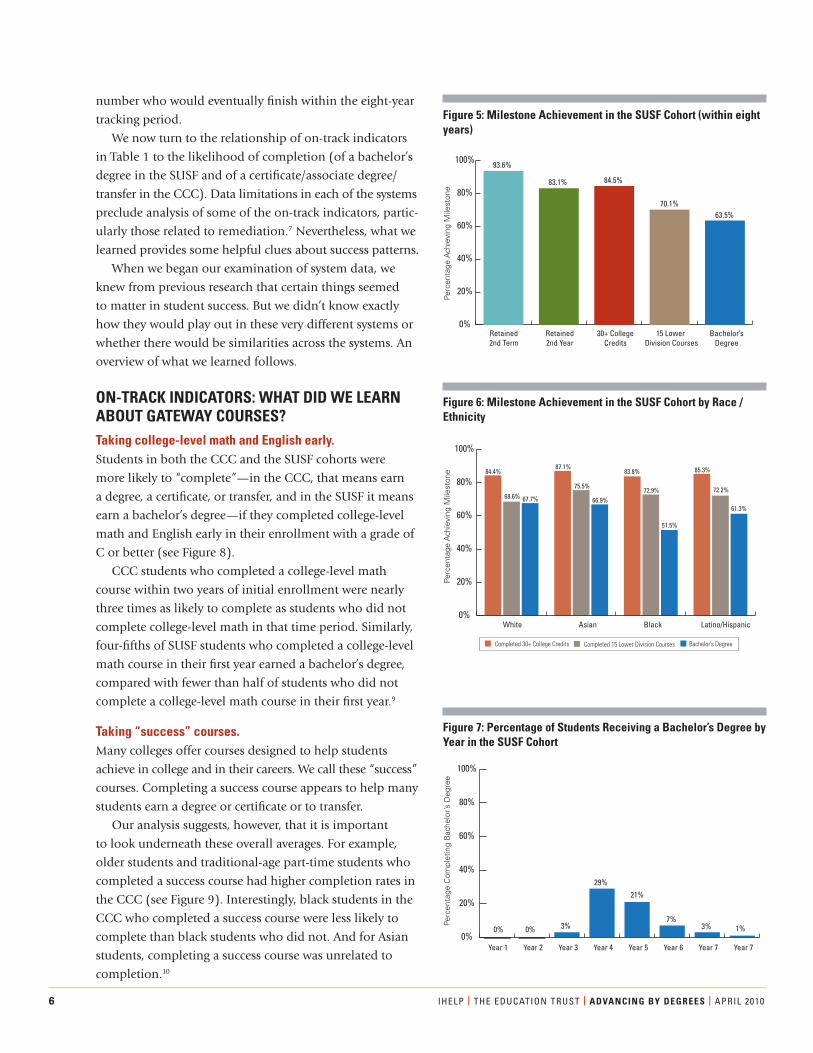
Milestone Achievement in the State University System of FloridaAs expected, levels of milestone achievement were higher
for students initially enrolling in a four-year institution
(see Figure 5). Among the cohort of fi rst-time freshmen in
the SUSF:
• By the second semester, 94 percent were still enrolled.
• More than eight in ten students were retained to the
second year; nearly 85 percent completed at least one
year of college credits.
• Some 70 percent completed at least 15 lower divi-
sion courses, intended as a measure of completing a
general education curriculum.
• Nearly 64 percent completed a bachelor’s degree.
Interestingly, there were marked variations in these
patterns by race. Black and Latino students were about
as likely to complete 30 credits or a general education
curriculum, but the likelihood of degree completion was
lower, especially for black students. Among white students,
for example, almost all of the students who completed
15 lower division courses also completed a bachelor’s
degree (68.6 percent versus 67.7 percent). Black and Latino
students completed 15 lower division courses at rates
slightly higher than those of white students, but their rates
of degree acquisition were signifi cantly lower—54 percent
and 61 percent, respectively (see Figure 6).
Figure 7 shows the percentage of SUSF students com-
pleting a bachelor’s degree by year. While the largest num-
ber of completions occurred in year four, only 32 percent
of students had received a degree by that year, half the
Figure 2: Milestone Achievement Among Degree Seekers by Age and Enrollment Status in the CCC Cohort (within seven years)
Figure 3: Milestone Achievement Among Degree Seekers in the CCC Cohort by Race/Ethnicity
Figure 4: Percentage of Degree Seekers Completing a Certifi cate, Degree, or Transfer in the CCC Cohort by Year
Traditional Age(17-24)
Older(25+)
Traditional Age(17-24)
Older(25+)
Perc
enta
ge A
chie
ving
Mile
ston
e
0%
20%
40%
60%
80%
100%
80.5
%
67.1
%
55.9
%
43.0
%
62.3
%3.
0%12
.6%
35.3
% 41.4
%
42.7
%9.
0%11
.1%
13.0
%25
.7%
2.1% 4.
9% 22.2
%25
.4%
5.0%
4.8% 8.
0%14
.8%35
.2%
20.6
%
Full-Time Part-Time
12+ College Credits30+ College CreditsCertificateAssoc. DegreeTransferredAny Completion
White Asian Black Latino/Hispanic
Perc
enta
ge A
chie
ving
Mile
ston
e
0%
20%
40%
60%
80%
100%
68.3
%
76.9
%
53.3
%
64.0
%
44.4
%3.
6% 8.8%
26.6
% 32.4
%
52.7
%3.
7%10
.0%
30.2
% 37.4
%
3.0% 5.
0% 17.7
%21
.7%
3.4% 6.
7%
15.9
% 20.9
%28.9
% 36.0
%
12+ College Credits30+ College CreditsCertificateAssoc. DegreeTransferredAny Completion
Year 1 Year 2 Year 3 Year 4 Year 5 Year 6 Year 7Perc
enta
ge C
ompl
etin
g C
ertif
icat
e, D
egre
e, o
r Tra
nsfe
r
0%
2%
4%
6%
8%
10%
0.3%
76.9
%
53.3
%
43.0
%
0.1%
2.2%
4.2%
0.7% 0.7%
0.8% 2.
1%5.
3%
4.2%
0.7% 2.
1%
0.5%
1.4%
0.3%
0.9%
2.9%
0.3% 0.
7% 2.1%2.
4%
CertificateAssoc. DegreeTransferred
AdvbyDegrees.indd 5 12/6/2010 1:32:33 PM
6 IHELP | THE EDUCATION TRUST | ADVANCING BY DEGREES | APRIL 2010
number who would eventually fi nish within the eight-year
tracking period.
We now turn to the relationship of on-track indicators
in Table 1 to the likelihood of completion (of a bachelor’s
degree in the SUSF and of a certifi cate/associate degree/
transfer in the CCC). Data limitations in each of the systems
preclude analysis of some of the on-track indicators, partic-
ularly those related to remediation.7 Nevertheless, what we
learned provides some helpful clues about success patterns.
When we began our examination of system data, we
knew from previous research that certain things seemed
to matter in student success. But we didn’t know exactly
how they would play out in these very different systems or
whether there would be similarities across the systems. An
overview of what we learned follows.
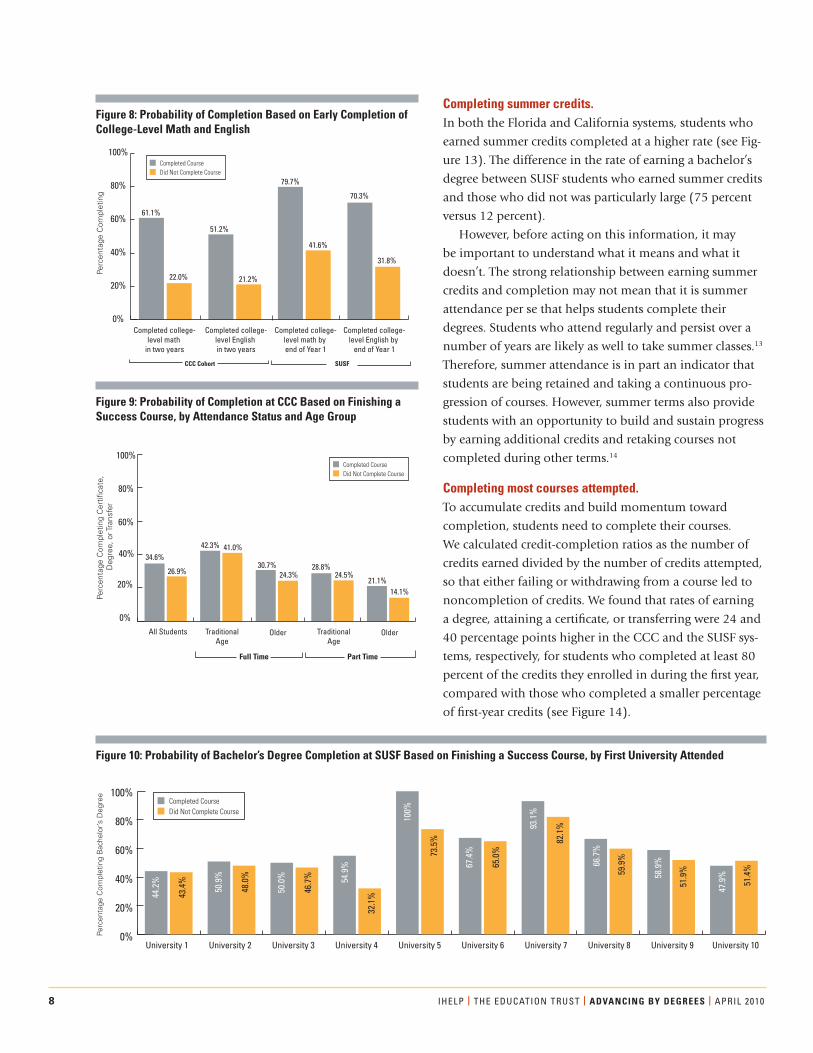
ON-TRACK INDICATORS: WHAT DID WE LEARN ABOUT GATEWAY COURSES?Taking college-level math and English early. Students in both the CCC and the SUSF cohorts were
more likely to “complete”—in the CCC, that means earn
a degree, a certifi cate, or transfer, and in the SUSF it means
earn a bachelor’s degree—if they completed college-level
math and English early in their enrollment with a grade of
C or better (see Figure 8).
CCC students who completed a college-level math
course within two years of initial enrollment were nearly
three times as likely to complete as students who did not
complete college-level math in that time period. Similarly,
four-fi fths of SUSF students who completed a college-level
math course in their fi rst year earned a bachelor’s degree,
compared with fewer than half of students who did not
complete a college-level math course in their fi rst year.9
Taking “success” courses. Many colleges offer courses designed to help students
achieve in college and in their careers. We call these “success”
courses. Completing a success course appears to help many
students earn a degree or certifi cate or to transfer.
Our analysis suggests, however, that it is important
to look underneath these overall averages. For example,
older students and traditional-age part-time students who
completed a success course had higher completion rates in
the CCC (see Figure 9). Interestingly, black students in the
CCC who completed a success course were less likely to
complete than black students who did not. And for Asian
students, completing a success course was unrelated to
completion.10
Figure 5: Milestone Achievement in the SUSF Cohort (within eight years)
Figure 6: Milestone Achievement in the SUSF Cohort by Race /Ethnicity
Figure 7: Percentage of Students Receiving a Bachelor’s Degree by Year in the SUSF Cohort
Retained2nd Term
Retained2nd Year
30+ CollegeCredits
15 Lower Division Courses
Bachelor’sDegree
Perc
enta
ge A
chie
ving
Mile
ston
e
93.6%
83.1% 84.5%
70.1%63.5%
0%
20%
40%
60%
80%
100%
White Asian Black Latino/Hispanic
Perc
enta
ge A
chie
ving
Mile
ston
e
87.1%84.4% 83.8% 85.3%
72.2%
61.3%
68.6% 67.7%
75.5%
66.9%72.9%
51.5%
Completed 30+ College Credits Bachelor’s DegreeCompleted 15 Lower Division Courses
0%
20%
40%
60%
80%
100%
Year 1 Year 2 Year 3 Year 4 Year 5 Year 6 Year 7 Year 7
Perc
enta
ge C
ompl
etin
g B
ache
lor’s
Deg
ree
0%
20%
0% 0% 3%
29%
21%
7%3% 1%
40%
60%
80%
100%
76.9
%
43.0
%
AdvbyDegrees.indd 6 12/6/2010 1:32:34 PM
IHELP | THE EDUCATION TRUST | ADVANCING BY DEGREES | APRIL 2010 7
DATA AND METHODSData Source 1: California Community Colleges Chancellor’s Offi ce
The student-unit records (SUR) data include demographic information, courses taken, degrees/certifi cates earned, and transfers to four-year universities, based on matches to the state’s public universities and to the National Student Clearing-house. We analyzed data for the entering cohort of fi rst-time California Community College students who enrolled in one or more credit-bearing courses during the 2000-01 academic year. Noncredit students and high school students concurrently enrolled in community college were excluded. We tracked the students over a seven-year period, through 2006-07. Data limitations include lack of information on the following: student income or other measures of socioeconomic status and assessment-test scores, placement recommendations, or other indicators of academic preparation for college-level study.
The analyses focus on a subset of students identifi ed as “degree seekers” (a term that includes both degrees and certifi cates) based on their having enrolled in more than six units during the fi rst year. This defi nition is based on a recent suggestion by Clifford Adelman as part of national discussions about revising the federal methodology for calculating gradu-ation rates.8 Using Adelman’s suggested criterion, 63 percent of students in the cohort were identifi ed as degree seekers (N=247,493). These students were somewhat younger, with an average age of 24, compared with 26 for the entire cohort of students. Fifty-three percent of degree seekers were younger
than 20, and 10 percent were age 40 or older, compared with 45 percent and 17 percent, respectively, for the entire cohort. The gender and racial/ethnic distributions were about the same.
Data Source 2: Florida Board of GovernorsThe SUR data include demographic information, course-taking records, and records of degrees earned. We analyzed data for the entering cohort of all fi rst-time freshmen in all ten universities in the State University System of Florida in the 1999-2000 academic year. We tracked the students over eight years through 2006-07. Limitations of the data include a lack of information on student income and on credits earned through Advanced Placement exams, concurrent enrollment, or high admission-test scores. All students in the cohort were included in the analyses, as it was assumed that all students enrolled intending to pursue a bachelor’s degree (N=30,497).
MethodsWe calculated the percentage of students who reached milestones and the rates of milestone achievement for different groups of students. To gauge the probability of degree comple-tion, we examined whether students met the on-track indica-tors. We used regression analysis to test whether the on-track indicators predicted completion after controlling for other factors and whether the relationships held across all groups of students (such as racial/ethnic groups, age groups, and students who received need-based aid). More details about the statistical analyses are described in the appendix.
In Florida, differences surfaced among campuses. In
nine of the ten universities fi rst attended by SUSF students,
students who completed a success course were more likely
to earn a bachelor’s degree than students who did not
complete a success course. (see Figure 10).11
ON-TRACK INDICATORS: WHAT DID WE LEARN ABOUT CREDIT ACCUMULATION?
Accumulating first-year and second-year credits. Choosing on-track indicators for credits earned involves
several considerations:
• whether to track only college-level credits or to track
all credits (including developmental/remedial),
• whether to track only fi rst-year credits or to track
credits in subsequent years,
• whether to track credits for all students or sepa-
rately for full-time and part-time students (note that
students often change their attendance status across
terms), and
• the appropriate threshold of accumulated credits.
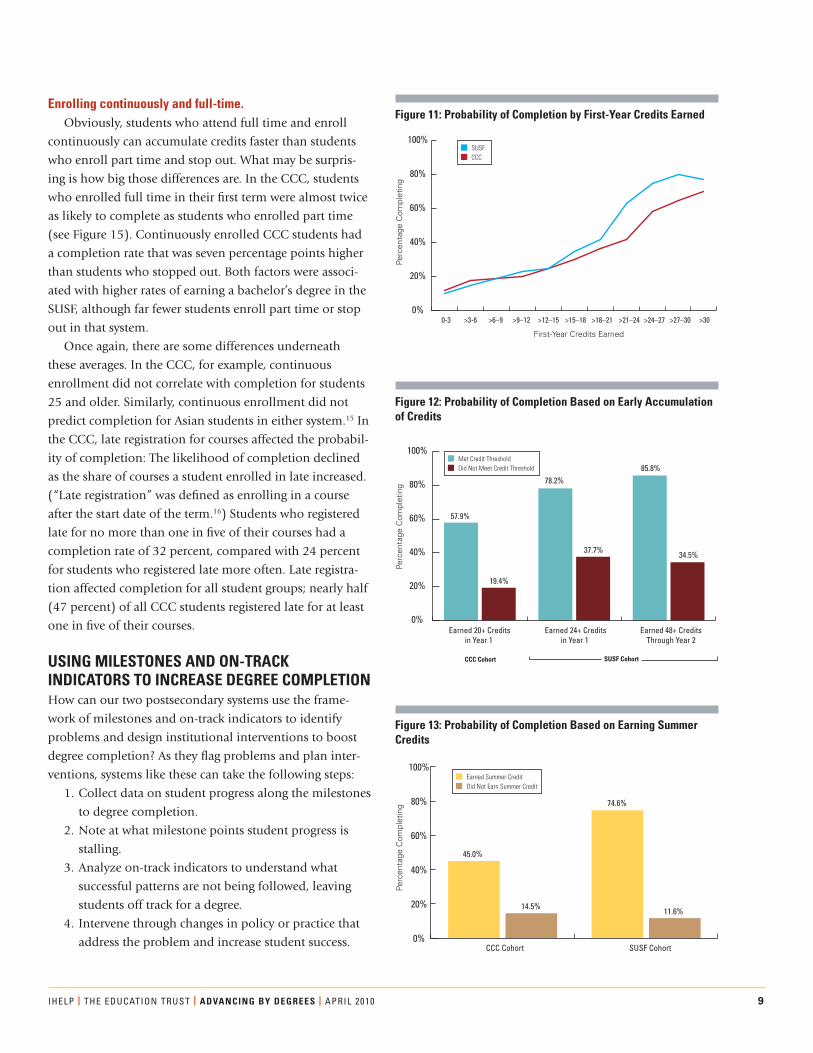
Our research did not fi nd a threshold number that was
associated with a substantial jump in the completion rate.
Rather, in both the CCC and the SUSF cohorts, we found
a fairly linear relationship between the number of credits
a student earned and the probability of completion: The
more credits earned in the fi rst year, the higher the chance
of completing (see Figure 11).
That said, the impact of early credit accumulation was
clear in both systems. We set the threshold at 20 credits (of
any kind) in the fi rst year for the CCC cohort and 24 cred-
its in the fi rst year and 48 credits through the second year
for the SUSF cohort.12 Fifty-eight percent of CCC students
who earned at least 20 credits in the fi rst year completed—
three times as many as those who did not earn 20 credits
in the fi rst year (see Figure 12). We found a similar pattern
for SUSF students. Three-quarters of students who com-
pleted at least 24 credits in the fi rst year earned a bachelor’s
degree, compared with 38 percent of students who did not
meet that threshold.
AdvbyDegrees.indd 7 12/6/2010 1:32:34 PM
8 IHELP | THE EDUCATION TRUST | ADVANCING BY DEGREES | APRIL 2010
Figure 8: Probability of Completion Based on Early Completion of College-Level Math and English
Figure 9: Probability of Completion at CCC Based on Finishing a Success Course, by Attendance Status and Age Group
Figure 10: Probability of Bachelor’s Degree Completion at SUSF Based on Finishing a Success Course, by First University Attended
Completing summer credits. In both the Florida and California systems, students who
earned summer credits completed at a higher rate (see Fig-
ure 13). The difference in the rate of earning a bachelor’s
degree between SUSF students who earned summer credits
and those who did not was particularly large (75 percent
versus 12 percent).
However, before acting on this information, it may
be important to understand what it means and what it
doesn’t. The strong relationship between earning summer
credits and completion may not mean that it is summer
attendance per se that helps students complete their
degrees. Students who attend regularly and persist over a
number of years are likely as well to take summer classes.13
Therefore, summer attendance is in part an indicator that
students are being retained and taking a continuous pro-
gression of courses. However, summer terms also provide
students with an opportunity to build and sustain progress
by earning additional credits and retaking courses not
completed during other terms.14
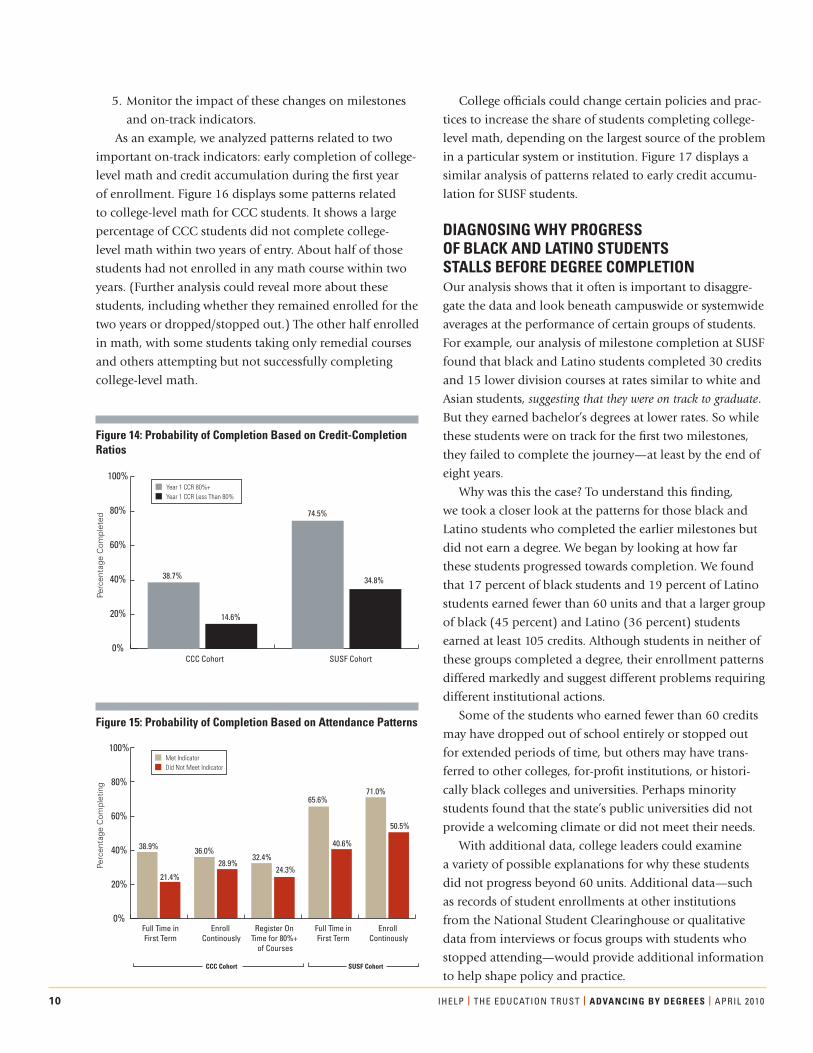
Completing most courses attempted. To accumulate credits and build momentum toward
completion, students need to complete their courses.
We calculated credit-completion ratios as the number of
credits earned divided by the number of credits attempted,
so that either failing or withdrawing from a course led to
noncompletion of credits. We found that rates of earning
a degree, attaining a certifi cate, or transferring were 24 and
40 percentage points higher in the CCC and the SUSF sys-
tems, respectively, for students who completed at least 80
percent of the credits they enrolled in during the fi rst year,
compared with those who completed a smaller percentage
of fi rst-year credits (see Figure 14).
Completed college-level math
in two years
Completed college-level English in two years
Completed college-level math by end of Year 1
Completed college-level English by
end of Year 1
Perc
enta
ge C
ompl
etin
g
0%
20%
40%
61.1%
22.0%
51.2%
21.2%
79.7%
41.6%
70.3%
31.8%
60%
80%
100%Completed CourseDid Not Complete Course
CCC Cohort SUSF
All Students TraditionalAge
Older TraditionalAge
Older
Perc
enta
ge C
ompl
etin
g C
ertif
icat
e,
Deg
ree,
or T
rans
fer
0%
20%
40% 34.6%
26.9%
42.3% 41.0%
30.7%24.3%
28.8%24.5%
21.1%14.1%
60%
80%
100%Completed CourseDid Not Complete Course
Full Time Part Time
University 1 University 2 University 3 University 4 University 5 University 6 University 7 University 8 University 9 University 10
44.2
%
43.4
%
50.9
%
48.0
%
50.0
%
46.7
%
67.4
%
65.0
%
66.7
%
59.9
%
58.9
%
51.9
%
47.9
%
51.4
%
93.1
%
82.1
%
54.9
%
32.1
%
100%
73.5
%
Perc
enta
ge C
ompl
etin
g B
ache
lor’s
Deg
ree
Completed CourseDid Not Complete Course
0%
20%
40%
60%
80%
100%
AdvbyDegrees.indd 8 12/6/2010 1:32:35 PM
IHELP | THE EDUCATION TRUST | ADVANCING BY DEGREES | APRIL 2010 9
Figure 11: Probability of Completion by First-Year Credits Earned
Figure 12: Probability of Completion Based on Early Accumulation of Credits
Figure 13: Probability of Completion Based on Earning Summer Credits
Enrolling continuously and full-time. Obviously, students who attend full time and enroll
continuously can accumulate credits faster than students
who enroll part time and stop out. What may be surpris-
ing is how big those differences are. In the CCC, students
who enrolled full time in their fi rst term were almost twice
as likely to complete as students who enrolled part time
(see Figure 15). Continuously enrolled CCC students had
a completion rate that was seven percentage points higher
than students who stopped out. Both factors were associ-
ated with higher rates of earning a bachelor’s degree in the
SUSF, although far fewer students enroll part time or stop
out in that system.
Once again, there are some differences underneath
these averages. In the CCC, for example, continuous
enrollment did not correlate with completion for students
25 and older. Similarly, continuous enrollment did not
predict completion for Asian students in either system.15 In
the CCC, late registration for courses affected the probabil-
ity of completion: The likelihood of completion declined
as the share of courses a student enrolled in late increased.
(“Late registration” was defi ned as enrolling in a course
after the start date of the term.16) Students who registered
late for no more than one in fi ve of their courses had a
completion rate of 32 percent, compared with 24 percent
for students who registered late more often. Late registra-
tion affected completion for all student groups; nearly half
(47 percent) of all CCC students registered late for at least
one in fi ve of their courses.
USING MILESTONES AND ON-TRACK INDICATORS TO INCREASE DEGREE COMPLETIONHow can our two postsecondary systems use the frame-
work of milestones and on-track indicators to identify
problems and design institutional interventions to boost
degree completion? As they fl ag problems and plan inter-
ventions, systems like these can take the following steps:
1. Collect data on student progress along the milestones
to degree completion.
2. Note at what milestone points student progress is
stalling.
3. Analyze on-track indicators to understand what
successful patterns are not being followed, leaving
students off track for a degree.
4. Intervene through changes in policy or practice that
address the problem and increase student success.
0-3 >3-6 >6–9 >9–12 >12–15 >15–18 >18–21 >21–24 >24–27 >27–30 >30
Perc
enta
ge C
ompl
etin
g
First-Year Credits Earned
SUSFCCC
0%
20%
40%
60%
80%
100%
Earned 20+ Creditsin Year 1
Earned 24+ Creditsin Year 1
Earned 48+ CreditsThrough Year 2
Perc
enta
ge C
ompl
etin
g
57.9%
19.4%
78.2%
37.7%
85.8%
34.5%
Met Credit ThresholdDid Not Meet Credit Threshold
CCC Cohort SUSF Cohort
0%
20%
40%
60%
80%
100%
CCC Cohort SUSF Cohort
Perc
enta
ge C
ompl
etin
g
45.0%
14.5%
74.6%
11.6%
Earned Summer CreditDid Not Earn Summer Credit
0%
20%
40%
60%
80%
100%
AdvbyDegrees.indd 9 12/6/2010 1:32:35 PM
10 IHELP | THE EDUCATION TRUST | ADVANCING BY DEGREES | APRIL 2010
Full Time inFirst Term
Enroll Continously
Register On Time for 80%+
of Courses
Full Time inFirst Term
Enroll Continously
Perc
enta
ge C
ompl
etin
g
38.9%
21.4%
36.0%28.9%
32.4%
65.6%
40.6%
71.0%
50.5%
24.3%
Met IndicatorDid Not Meet Indicator
0%
20%
40%
60%
80%
100%
CCC Cohort SUSF Cohort
5. Monitor the impact of these changes on milestones
and on-track indicators.
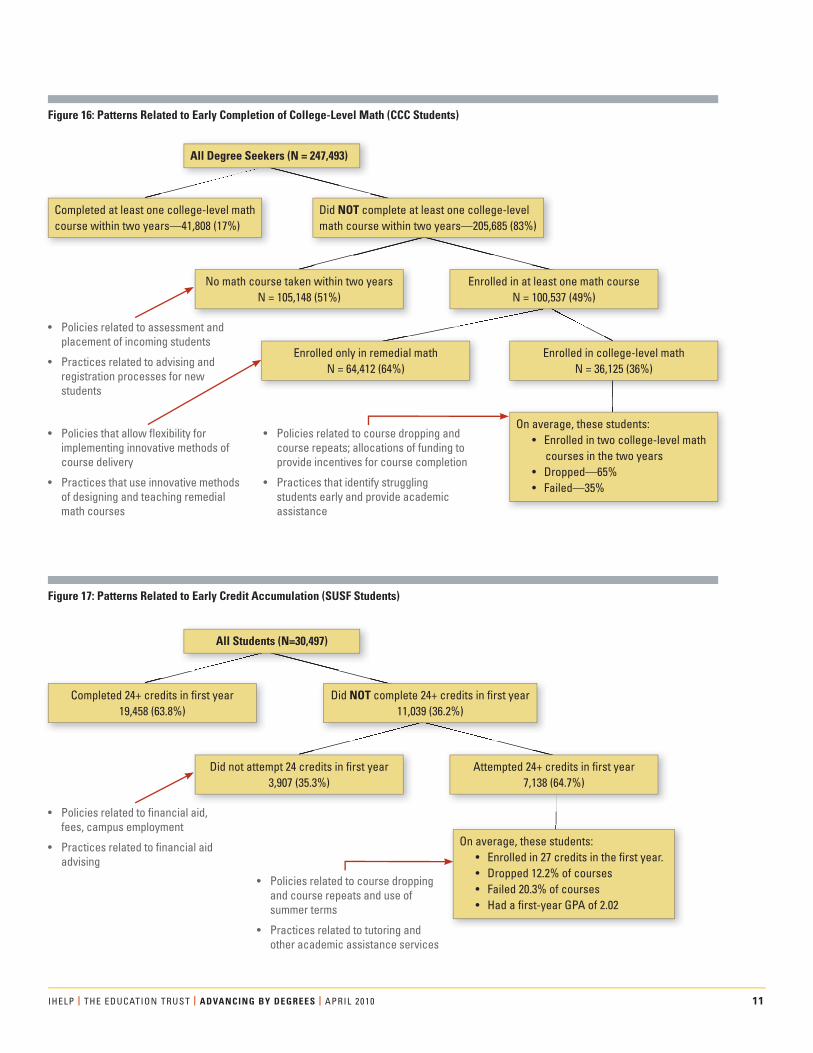
As an example, we analyzed patterns related to two
important on-track indicators: early completion of college-
level math and credit accumulation during the fi rst year
of enrollment. Figure 16 displays some patterns related
to college-level math for CCC students. It shows a large
percentage of CCC students did not complete college-
level math within two years of entry. About half of those
students had not enrolled in any math course within two
years. (Further analysis could reveal more about these
students, including whether they remained enrolled for the
two years or dropped/stopped out.) The other half enrolled
in math, with some students taking only remedial courses
and others attempting but not successfully completing
college-level math.
Figure 14: Probability of Completion Based on Credit-Completion Ratios
Figure 15: Probability of Completion Based on Attendance Patterns
College offi cials could change certain policies and prac-
tices to increase the share of students completing college-
level math, depending on the largest source of the problem
in a particular system or institution. Figure 17 displays a
similar analysis of patterns related to early credit accumu-
lation for SUSF students.
DIAGNOSING WHY PROGRESS OF BLACK AND LATINO STUDENTS STALLS BEFORE DEGREE COMPLETIONOur analysis shows that it often is important to disaggre-
gate the data and look beneath campuswide or systemwide
averages at the performance of certain groups of students.
For example, our analysis of milestone completion at SUSF
found that black and Latino students completed 30 credits
and 15 lower division courses at rates similar to white and
Asian students, suggesting that they were on track to graduate.
But they earned bachelor’s degrees at lower rates. So while
these students were on track for the fi rst two milestones,
they failed to complete the journey—at least by the end of
eight years.
Why was this the case? To understand this fi nding,
we took a closer look at the patterns for those black and
Latino students who completed the earlier milestones but
did not earn a degree. We began by looking at how far
these students progressed towards completion. We found
that 17 percent of black students and 19 percent of Latino
students earned fewer than 60 units and that a larger group
of black (45 percent) and Latino (36 percent) students
earned at least 105 credits. Although students in neither of
these groups completed a degree, their enrollment patterns
differed markedly and suggest different problems requiring
different institutional actions.
Some of the students who earned fewer than 60 credits
may have dropped out of school entirely or stopped out
for extended periods of time, but others may have trans-
ferred to other colleges, for-profi t institutions, or histori-
cally black colleges and universities. Perhaps minority
students found that the state’s public universities did not
provide a welcoming climate or did not meet their needs.
With additional data, college leaders could examine
a variety of possible explanations for why these students
did not progress beyond 60 units. Additional data —such
as records of student enrollments at other institutions
from the National Student Clearinghouse or qualitative
data from interviews or focus groups with students who
stopped attending—would provide additional information
to help shape policy and practice.
CCC Cohort SUSF Cohort
Perc
enta
ge C
ompl
eted
38.7%
14.6%
74.5%
34.8%
Year 1 CCR 80%+Year 1 CCR Less Than 80%
0%
20%
40%
60%
80%
100%
AdvbyDegrees.indd 10 12/6/2010 1:32:36 PM
IHELP | THE EDUCATION TRUST | ADVANCING BY DEGREES | APRIL 2010 11
Figure 16: Patterns Related to Early Completion of College-Level Math (CCC Students)
All Degree Seekers (N = 247,493)
Completed at least one college-level math course within two years—41,808 (17%)
Did NOT complete at least one college-level math course within two years —205,685 (83%)
No math course taken within two yearsN = 105,148 (51%)
Enrolled in at least one math courseN = 100,537 (49%)
Enrolled only in remedial mathN = 64,412 (64%)
Enrolled in college-level mathN = 36,125 (36%)
On average, these students: • Enrolled in two college-level math
courses in the two years• Dropped—65%• Failed—35%
• Policies related to assessment and placement of incoming students
• Practices related to advising and registration processes for new students
• Policies that allow fl exibility forimplementing innovative methods ofcourse delivery
• Practices that use innovative methods of designing and teaching remedial math courses
• Policies related to course dropping andcourse repeats; allocations of funding to provide incentives for course completion
• Practices that identify struggling students early and provide academic assistance
Figure 17: Patterns Related to Early Credit Accumulation (SUSF Students)
All Students (N=30,497)
Completed 24+ credits in fi rst year19,458 (63.8%)
Did NOT complete 24+ credits in fi rst year11,039 (36.2%)
Did not attempt 24 credits in fi rst year3,907 (35.3%)
Attempted 24+ credits in fi rst year7,138 (64.7%)
On average, these students: • Enrolled in 27 credits in the fi rst year.• Dropped 12.2% of courses• Failed 20.3% of courses• Had a fi rst-year GPA of 2.02
• Policies related to fi nancial aid,fees, campus employment
• Practices related to fi nancial aidadvising
• Policies related to course droppingand course repeats and use ofsummer terms
• Practices related to tutoring andother academic assistance services
AdvbyDegrees.indd 11 12/6/2010 1:32:36 PM
12 IHELP | THE EDUCATION TRUST | ADVANCING BY DEGREES | APRIL 2010
In contrast, students who earned 105 credits were well
on their way to completion, and additional years of data
might reveal that some eventually completed a degree. But
experience elsewhere suggests that many may well have
simply disengaged. Fortunately, many institutions are fi nd-
ing these students easy to attract back to campus—when
they are invited back and their reenrollment is expedited
with attentive service. Again, institutions would be wise to
supplement quantitative fi ndings of this sort with inter-
views and other information to learn what they might do
to speed the progress of these students.
However, even without additional data, we can use
the on-track indicators in our framework to help diag-
nose why these students failed to move beyond the initial
milestones. To illustrate, we compared black and Latino
students who did not earn a bachelor’s degree with black
and Latino students who did earn a bachelor’s degree on
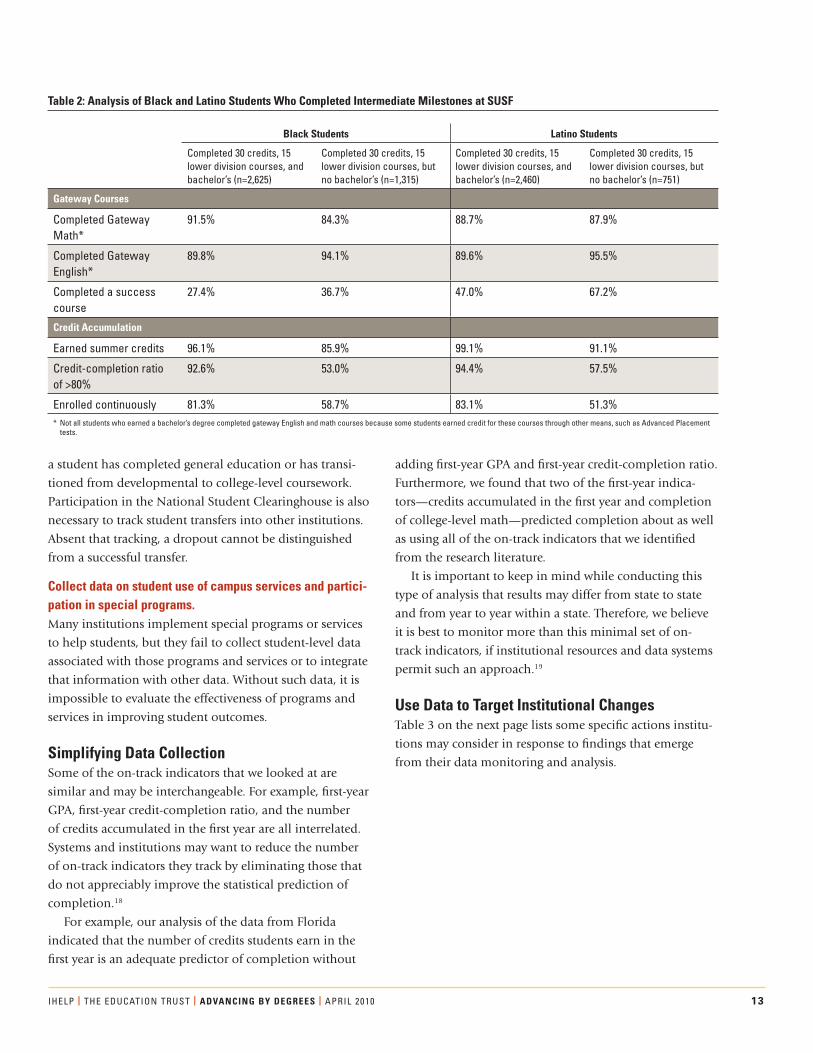
the on-track indicators. As Table 2 shows, the primary
factors that distinguish students who earned a bachelor’s
degree from those who did not were related to credit accu-
mulation, particularly completing courses and enrolling
continuously.
Interestingly, a higher percentage of students who did
not complete a degree took a success course than those
who did complete. One likely explanation of this fi nding
is that students are either directed towards success courses
or choose to enroll in success courses if they are at higher
risk for not completing, so the fi ndings refl ect enrollment
in the course more than the impact of the course. We also
found that completion of gateway courses—college-level
math and English—did not appear to explain why these
students did not earn a bachelor’s degree.17 A large major-
ity of students who did not earn a bachelor’s degree did
complete these courses. Consequently, this analysis sug-
gests that the appropriate institutional response would be
to help students complete a higher percentage of courses
and enroll continuously. Interventions might include inte-
grating supplemental instruction into courses with high
failure rates, instituting “early alert” systems to identify
students having trouble in particular courses, limiting the
number of course withdrawals, and examining the ade-
quacy of fi nancial aid policies.
RECOMMENDATIONSThe purpose of this report is to give institutional leaders
a new set of tools for diagnosing institutional barriers to
degree completion and targeting institutional changes to
remove those barriers. This section summarizes the data-
collection capacity that institutions need to use these tools
and offers a guide for using fi ndings from analyzing the
data to improve degree completion.
Data System RequirementsStates and institutions must be able to collect basic data
to track student progress across milestones and link that
progress to the academic patterns that indicate success or
lack thereof.
Collect data on students’ course enrollments. Course-enrollment data are necessary to analyze the
milestones and on-track indicators discussed in this report.
Some higher education systems may only be collecting
information on whether particular students enrolled in
a specifi ed term, how many units they completed, their
grade-point average, or other aggregated information
about their experiences. Such data are not suffi cient for
monitoring the progress and behaviors that our framework
comprises. Term-by-term information on individual course
enrollments adds a level of detail about students’ patterns
of enrollment that is very useful for diagnosing where
students are falling off track, which in turn points to ways
to target changes to policies and practices.
Collect data to analyze important subgroups of students. To ensure that all students are making progress towards
completion, states and institutions should be able to
disaggregate data as follows:
• Age
• Race/ethnicity
• Gender
• Income
• Academic preparation
(entrance test scores, placement exam scores)
Develop data elements to match milestones and on-track indicators.Table 1 on page 3 shows a good set of milestones and
on-track indicators that institutions should be able to
monitor. Tracking some of the elements might require
some adjustments, such as adding an element to fl ag when
AdvbyDegrees.indd 12 12/6/2010 1:32:40 PM
IHELP | THE EDUCATION TRUST | ADVANCING BY DEGREES | APRIL 2010 13
Table 2: Analysis of Black and Latino Students Who Completed Intermediate Milestones at SUSF
Black Students Latino Students
Completed 30 credits, 15 lower division courses, and bachelor’s (n=2,625)
Completed 30 credits, 15 lower division courses, but no bachelor’s (n=1,315)
Completed 30 credits, 15 lower division courses, and bachelor’s (n=2,460)
Completed 30 credits, 15 lower division courses, but no bachelor’s (n=751)
Gateway Courses
Completed Gateway Math*
91.5% 84.3% 88.7% 87.9%
Completed Gateway English*
89.8% 94.1% 89.6% 95.5%
Completed a success course
27.4% 36.7% 47.0% 67.2%
Credit Accumulation
Earned summer credits 96.1% 85.9% 99.1% 91.1%
Credit-completion ratio of >80%
92.6% 53.0% 94.4% 57.5%
Enrolled continuously 81.3% 58.7% 83.1% 51.3%* Not all students who earned a bachelor’s degree completed gateway English and math courses because some students earned credit for these courses through other means, such as Advanced Placement
tests.
a student has completed general education or has transi-
tioned from developmental to college-level coursework.
Participation in the National Student Clearinghouse is also
necessary to track student transfers into other institutions.
Absent that tracking, a dropout cannot be distinguished
from a successful transfer.
Collect data on student use of campus services and partici-pation in special programs.Many institutions implement special programs or services
to help students, but they fail to collect student-level data
associated with those programs and services or to integrate
that information with other data. Without such data, it is
impossible to evaluate the effectiveness of programs and
services in improving student outcomes.
Simplifying Data CollectionSome of the on-track indicators that we looked at are
similar and may be interchangeable. For example, fi rst-year
GPA, fi rst-year credit-completion ratio, and the number
of credits accumulated in the fi rst year are all interrelated.
Systems and institutions may want to reduce the number
of on-track indicators they track by eliminating those that
do not appreciably improve the statistical prediction of
completion.18
For example, our analysis of the data from Florida
indicated that the number of credits students earn in the
fi rst year is an adequate predictor of completion without
adding fi rst-year GPA and fi rst-year credit-completion ratio.
Furthermore, we found that two of the fi rst-year indica-
tors—credits accumulated in the fi rst year and completion
of college-level math—predicted completion about as well
as using all of the on-track indicators that we identifi ed
from the research literature.
It is important to keep in mind while conducting this
type of analysis that results may differ from state to state
and from year to year within a state. Therefore, we believe
it is best to monitor more than this minimal set of on-
track indicators, if institutional resources and data systems
permit such an approach.19
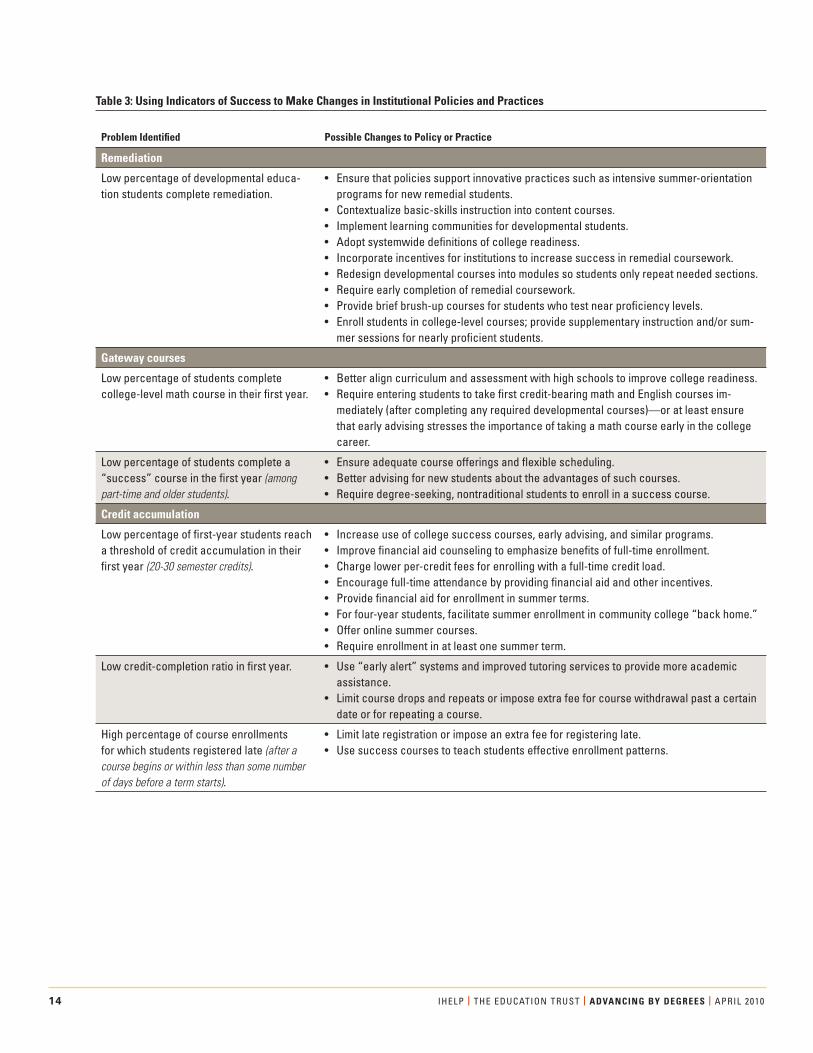
Use Data to Target Institutional ChangesTable 3 on the next page lists some specifi c actions institu-
tions may consider in response to fi ndings that emerge
from their data monitoring and analysis.
AdvbyDegrees.indd 13 12/6/2010 1:32:40 PM
14 IHELP | THE EDUCATION TRUST | ADVANCING BY DEGREES | APRIL 2010
Table 3: Using Indicators of Success to Make Changes in Institutional Policies and Practices
Problem Identifi ed Possible Changes to Policy or Practice
Remediation
Low percentage of developmental educa-tion students complete remediation.
• Ensure that policies support innovative practices such as intensive summer-orientation programs for new remedial students.
• Contextualize basic-skills instruction into content courses.• Implement learning communities for developmental students.• Adopt systemwide defi nitions of college readiness.• Incorporate incentives for institutions to increase success in remedial coursework.• Redesign developmental courses into modules so students only repeat needed sections.• Require early completion of remedial coursework.• Provide brief brush-up courses for students who test near profi ciency levels.• Enroll students in college-level courses; provide supplementary instruction and/or sum-
mer sessions for nearly profi cient students.
Gateway courses
Low percentage of students complete college-level math course in their fi rst year.
• Better align curriculum and assessment with high schools to improve college readiness.• Require entering students to take fi rst credit-bearing math and English courses im-
mediately (after completing any required developmental courses)—or at least ensure that early advising stresses the importance of taking a math course early in the college career.
Low percentage of students complete a “success” course in the fi rst year (among part-time and older students).
• Ensure adequate course offerings and fl exible scheduling.• Better advising for new students about the advantages of such courses.• Require degree-seeking, nontraditional students to enroll in a success course.
Credit accumulation
Low percentage of fi rst-year students reach a threshold of credit accumulation in their fi rst year (20-30 semester credits).
• Increase use of college success courses, early advising, and similar programs.• Improve fi nancial aid counseling to emphasize benefi ts of full-time enrollment.• Charge lower per-credit fees for enrolling with a full-time credit load.• Encourage full-time attendance by providing fi nancial aid and other incentives.• Provide fi nancial aid for enrollment in summer terms.• For four-year students, facilitate summer enrollment in community college “back home.”• Offer online summer courses.• Require enrollment in at least one summer term.
Low credit-completion ratio in fi rst year. • Use “early alert” systems and improved tutoring services to provide more academic assistance.
• Limit course drops and repeats or impose extra fee for course withdrawal past a certain date or for repeating a course.
High percentage of course enrollmentsfor which students registered late (after a course begins or within less than some number of days before a term starts).
• Limit late registration or impose an extra fee for registering late.• Use success courses to teach students effective enrollment patterns.
AdvbyDegrees.indd 14 12/6/2010 1:32:41 PM
IHELP | THE EDUCATION TRUST | ADVANCING BY DEGREES | APRIL 2010 15
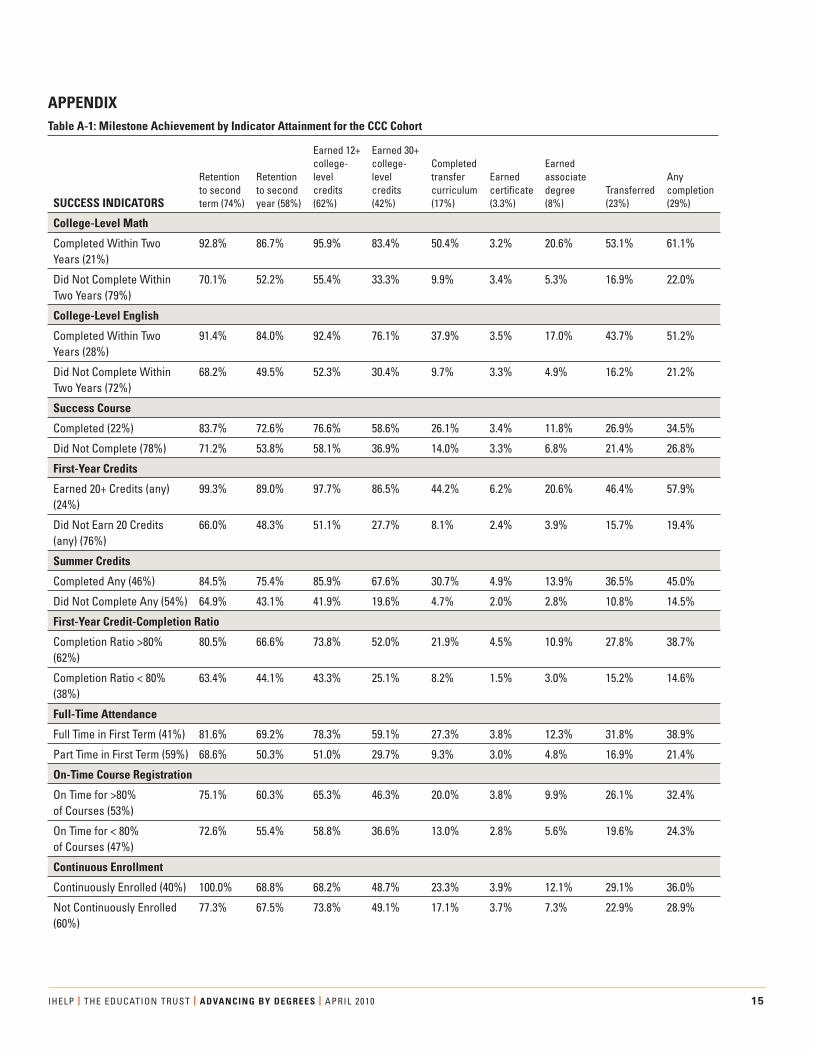
APPENDIXTable A-1: Milestone Achievement by Indicator Attainment for the CCC Cohort
SUCCESS INDICATORS
Retention to second term (74%)
Retention to second year (58%)
Earned 12+ college-level credits (62%)
Earned 30+ college-level credits (42%)
Completed transfer curriculum (17%)
Earned certifi cate (3.3%)
Earned associate degree (8%)
Transferred (23%)
Any completion (29%)
College-Level Math
Completed Within Two Years (21%)
92.8% 86.7% 95.9% 83.4% 50.4% 3.2% 20.6% 53.1% 61.1%
Did Not Complete Within Two Years (79%)
70.1% 52.2% 55.4% 33.3% 9.9% 3.4% 5.3% 16.9% 22.0%
College-Level English
Completed Within Two Years (28%)
91.4% 84.0% 92.4% 76.1% 37.9% 3.5% 17.0% 43.7% 51.2%
Did Not Complete Within Two Years (72%)
68.2% 49.5% 52.3% 30.4% 9.7% 3.3% 4.9% 16.2% 21.2%
Success Course
Completed (22%) 83.7% 72.6% 76.6% 58.6% 26.1% 3.4% 11.8% 26.9% 34.5%
Did Not Complete (78%) 71.2% 53.8% 58.1% 36.9% 14.0% 3.3% 6.8% 21.4% 26.8%
First-Year Credits
Earned 20+ Credits (any) (24%)
99.3% 89.0% 97.7% 86.5% 44.2% 6.2% 20.6% 46.4% 57.9%
Did Not Earn 20 Credits (any) (76%)
66.0% 48.3% 51.1% 27.7% 8.1% 2.4% 3.9% 15.7% 19.4%
Summer Credits
Completed Any (46%) 84.5% 75.4% 85.9% 67.6% 30.7% 4.9% 13.9% 36.5% 45.0%
Did Not Complete Any (54%) 64.9% 43.1% 41.9% 19.6% 4.7% 2.0% 2.8% 10.8% 14.5%
First-Year Credit-Completion Ratio
Completion Ratio >80% (62%)
80.5% 66.6% 73.8% 52.0% 21.9% 4.5% 10.9% 27.8% 38.7%
Completion Ratio < 80% (38%)
63.4% 44.1% 43.3% 25.1% 8.2% 1.5% 3.0% 15.2% 14.6%
Full-Time Attendance
Full Time in First Term (41%) 81.6% 69.2% 78.3% 59.1% 27.3% 3.8% 12.3% 31.8% 38.9%
Part Time in First Term (59%) 68.6% 50.3% 51.0% 29.7% 9.3% 3.0% 4.8% 16.9% 21.4%
On-Time Course Registration
On Time for >80% of Courses (53%)
75.1% 60.3% 65.3% 46.3% 20.0% 3.8% 9.9% 26.1% 32.4%
On Time for < 80% of Courses (47%)
72.6% 55.4% 58.8% 36.6% 13.0% 2.8% 5.6% 19.6% 24.3%
Continuous Enrollment
Continuously Enrolled (40%) 100.0% 68.8% 68.2% 48.7% 23.3% 3.9% 12.1% 29.1% 36.0%
Not Continuously Enrolled (60%)
77.3% 67.5% 73.8% 49.1% 17.1% 3.7% 7.3% 22.9% 28.9%
AdvbyDegrees.indd 15 12/6/2010 1:32:41 PM
16 IHELP | THE EDUCATION TRUST | ADVANCING BY DEGREES | APRIL 2010
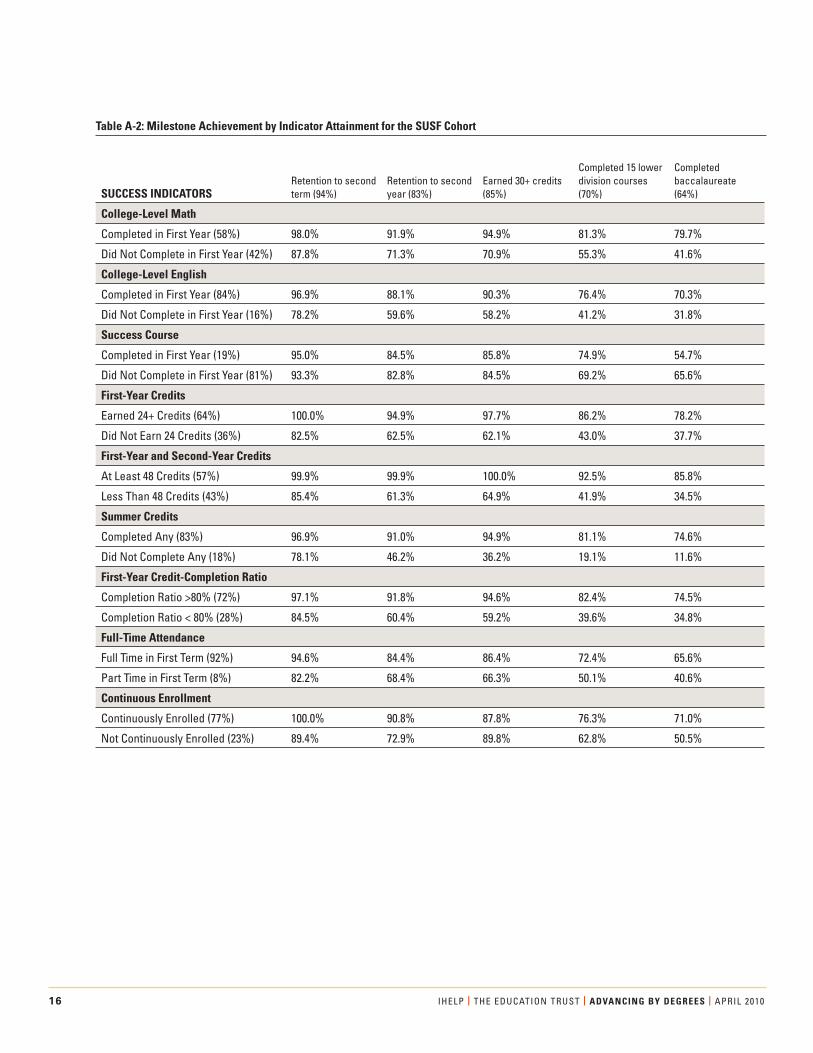
Table A-2: Milestone Achievement by Indicator Attainment for the SUSF Cohort
SUCCESS INDICATORS Retention to second term (94%)
Retention to second year (83%)
Earned 30+ credits (85%)
Completed 15 lower division courses (70%)
Completed baccalaureate (64%)
College-Level Math
Completed in First Year (58%) 98.0% 91.9% 94.9% 81.3% 79.7%
Did Not Complete in First Year (42%) 87.8% 71.3% 70.9% 55.3% 41.6%
College-Level English
Completed in First Year (84%) 96.9% 88.1% 90.3% 76.4% 70.3%
Did Not Complete in First Year (16%) 78.2% 59.6% 58.2% 41.2% 31.8%
Success Course
Completed in First Year (19%) 95.0% 84.5% 85.8% 74.9% 54.7%
Did Not Complete in First Year (81%) 93.3% 82.8% 84.5% 69.2% 65.6%
First-Year Credits
Earned 24+ Credits (64%) 100.0% 94.9% 97.7% 86.2% 78.2%
Did Not Earn 24 Credits (36%) 82.5% 62.5% 62.1% 43.0% 37.7%
First-Year and Second-Year Credits
At Least 48 Credits (57%) 99.9% 99.9% 100.0% 92.5% 85.8%
Less Than 48 Credits (43%) 85.4% 61.3% 64.9% 41.9% 34.5%
Summer Credits
Completed Any (83%) 96.9% 91.0% 94.9% 81.1% 74.6%
Did Not Complete Any (18%) 78.1% 46.2% 36.2% 19.1% 11.6%
First-Year Credit-Completion Ratio
Completion Ratio >80% (72%) 97.1% 91.8% 94.6% 82.4% 74.5%
Completion Ratio < 80% (28%) 84.5% 60.4% 59.2% 39.6% 34.8%
Full-Time Attendance
Full Time in First Term (92%) 94.6% 84.4% 86.4% 72.4% 65.6%
Part Time in First Term (8%) 82.2% 68.4% 66.3% 50.1% 40.6%
Continuous Enrollment
Continuously Enrolled (77%) 100.0% 90.8% 87.8% 76.3% 71.0%
Not Continuously Enrolled (23%) 89.4% 72.9% 89.8% 62.8% 50.5%
AdvbyDegrees.indd 16 12/6/2010 1:32:41 PM
IHELP | THE EDUCATION TRUST | ADVANCING BY DEGREES | APRIL 2010 17
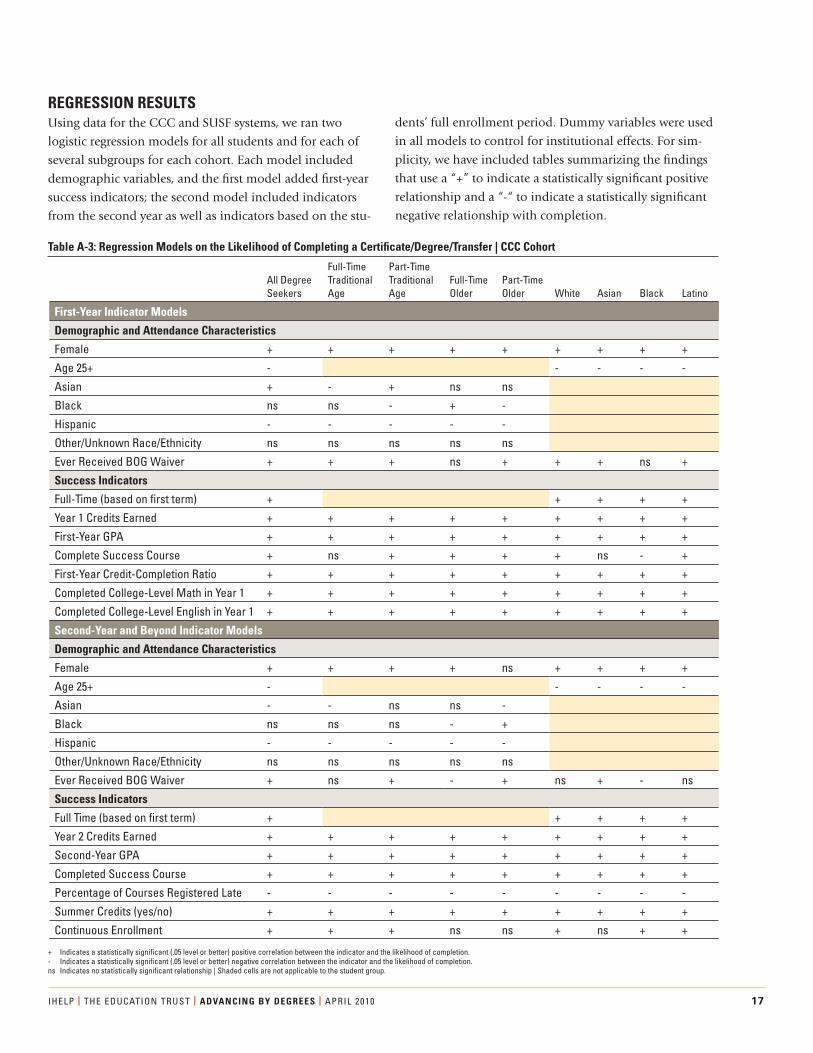
REGRESSION RESULTSUsing data for the CCC and SUSF systems, we ran two
logistic regression models for all students and for each of
several subgroups for each cohort. Each model included
demographic variables, and the fi rst model added fi rst-year
success indicators; the second model included indicators
from the second year as well as indicators based on the stu-
dents’ full enrollment period. Dummy variables were used
in all models to control for institutional effects. For sim-
plicity, we have included tables summarizing the fi ndings
that use a “+” to indicate a statistically signifi cant positive
relationship and a “-“ to indicate a statistically signifi cant
negative relationship with completion.
Table A-3: Regression Models on the Likelihood of Completing a Certifi cate/Degree/Transfer | CCC Cohort
All Degree Seekers
Full-Time Traditional Age
Part-Time Traditional Age
Full-Time Older
Part-Time Older White Asian Black Latino
First-Year Indicator Models
Demographic and Attendance Characteristics
Female + + + + + + + + +
Age 25+ - - - - -
Asian + - + ns ns
Black ns ns - + -
Hispanic - - - - -
Other/Unknown Race/Ethnicity ns ns ns ns ns
Ever Received BOG Waiver + + + ns + + + ns +
Success Indicators
Full-Time (based on fi rst term) + + + + +
Year 1 Credits Earned + + + + + + + + +
First-Year GPA + + + + + + + + +
Complete Success Course + ns + + + + ns - +
First-Year Credit-Completion Ratio + + + + + + + + +
Completed College-Level Math in Year 1 + + + + + + + + +
Completed College-Level English in Year 1 + + + + + + + + +
Second-Year and Beyond Indicator Models
Demographic and Attendance Characteristics
Female + + + + ns + + + +
Age 25+ - - - - -
Asian - - ns ns -
Black ns ns ns - +
Hispanic - - - - -
Other/Unknown Race/Ethnicity ns ns ns ns ns
Ever Received BOG Waiver + ns + - + ns + - ns
Success Indicators
Full Time (based on fi rst term) + + + + +
Year 2 Credits Earned + + + + + + + + +
Second-Year GPA + + + + + + + + +
Completed Success Course + + + + + + + + +
Percentage of Courses Registered Late - - - - - - - - -
Summer Credits (yes/no) + + + + + + + + +
Continuous Enrollment + + + ns ns + ns + +
+ Indicates a statistically signifi cant (.05 level or better) positive correlation between the indicator and the likelihood of completion.- Indicates a statistically signifi cant (.05 level or better) negative correlation between the indicator and the likelihood of completion.ns Indicates no statistically signifi cant relationship | Shaded cells are not applicable to the student group.
AdvbyDegrees.indd 17 12/6/2010 1:32:41 PM
18 IHELP | THE EDUCATION TRUST | ADVANCING BY DEGREES | APRIL 2010
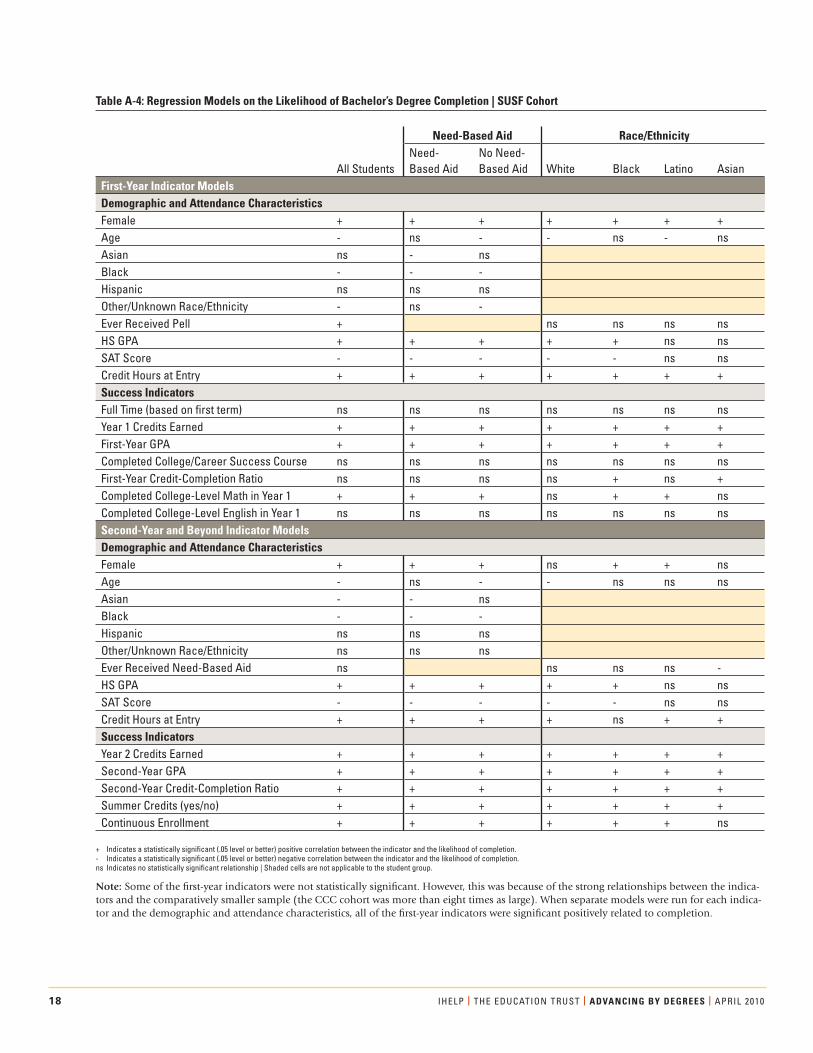
Table A-4: Regression Models on the Likelihood of Bachelor’s Degree Completion | SUSF Cohort
Need-Based Aid Race/Ethnicity
All Students Need- Based Aid
No Need- Based Aid White Black Latino Asian
First-Year Indicator ModelsDemographic and Attendance Characteristics Female + + + + + + + Age - ns - - ns - ns Asian ns - ns Black - - -Hispanic ns ns ns Other/Unknown Race/Ethnicity - ns -Ever Received Pell + ns ns ns ns HS GPA + + + + + ns ns SAT Score - - - - - ns ns Credit Hours at Entry + + + + + + + Success Indicators Full Time (based on fi rst term) ns ns ns ns ns ns ns Year 1 Credits Earned + + + + + + + First-Year GPA + + + + + + + Completed College/Career Success Course ns ns ns ns ns ns ns First-Year Credit-Completion Ratio ns ns ns ns + ns + Completed College-Level Math in Year 1 + + + ns + + ns Completed College-Level English in Year 1 ns ns ns ns ns ns ns Second-Year and Beyond Indicator ModelsDemographic and Attendance Characteristics Female + + + ns + + ns Age - ns - - ns ns ns Asian - - ns Black - - -Hispanic ns ns ns Other/Unknown Race/Ethnicity ns ns ns Ever Received Need-Based Aid ns ns ns ns -HS GPA + + + + + ns ns SAT Score - - - - - ns ns Credit Hours at Entry + + + + ns + + Success Indicators Year 2 Credits Earned + + + + + + + Second-Year GPA + + + + + + + Second-Year Credit-Completion Ratio + + + + + + + Summer Credits (yes/no) + + + + + + + Continuous Enrollment + + + + + + ns
+ Indicates a statistically signifi cant (.05 level or better) positive correlation between the indicator and the likelihood of completion.- Indicates a statistically signifi cant (.05 level or better) negative correlation between the indicator and the likelihood of completion.ns Indicates no statistically signifi cant relationship | Shaded cells are not applicable to the student group.
Note: Some of the fi rst-year indicators were not statistically signifi cant. However, this was because of the strong relationships between the indica-tors and the comparatively smaller sample (the CCC cohort was more than eight times as large). When separate models were run for each indica-tor and the demographic and attendance characteristics, all of the fi rst-year indicators were signifi cant positively related to completion.
AdvbyDegrees.indd 18 12/6/2010 1:32:42 PM
IHELP | THE EDUCATION TRUST | ADVANCING BY DEGREES | APRIL 2010 19
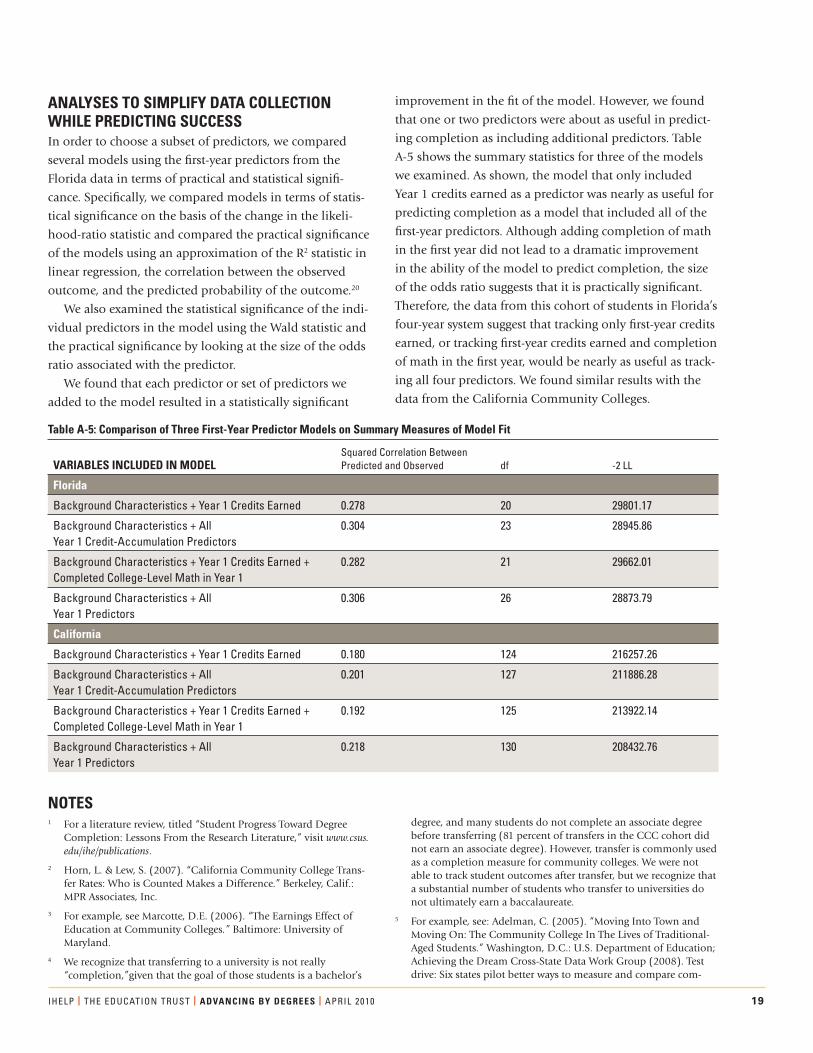
Table A-5: Comparison of Three First-Year Predictor Models on Summary Measures of Model Fit
ANALYSES TO SIMPLIFY DATA COLLECTION WHILE PREDICTING SUCCESSIn order to choose a subset of predictors, we compared
several models using the fi rst-year predictors from the
Florida data in terms of practical and statistical signifi -
cance. Specifi cally, we compared models in terms of statis-
tical signifi cance on the basis of the change in the likeli-
hood-ratio statistic and compared the practical signifi cance
of the models using an approximation of the R2 statistic in
linear regression, the correlation between the observed
outcome, and the predicted probability of the outcome.20
We also examined the statistical signifi cance of the indi-
vidual predictors in the model using the Wald statistic and
the practical signifi cance by looking at the size of the odds
ratio associated with the predictor.
We found that each predictor or set of predictors we
added to the model resulted in a statistically signifi cant
improvement in the fi t of the model. However, we found
that one or two predictors were about as useful in predict-
ing completion as including additional predictors. Table
A-5 shows the summary statistics for three of the models
we examined. As shown, the model that only included
Year 1 credits earned as a predictor was nearly as useful for
predicting completion as a model that included all of the
fi rst-year predictors. Although adding completion of math
in the fi rst year did not lead to a dramatic improvement
in the ability of the model to predict completion, the size
of the odds ratio suggests that it is practically signifi cant.
Therefore, the data from this cohort of students in Florida’s
four-year system suggest that tracking only fi rst-year credits
earned, or tracking fi rst-year credits earned and completion
of math in the fi rst year, would be nearly as useful as track-
ing all four predictors. We found similar results with the
data from the California Community Colleges.
VARIABLES INCLUDED IN MODEL Squared Correlation Between Predicted and Observed df -2 LL
Florida
Background Characteristics + Year 1 Credits Earned 0.278 20 29801.17
Background Characteristics + All Year 1 Credit-Accumulation Predictors
0.304 23 28945.86
Background Characteristics + Year 1 Credits Earned + Completed College-Level Math in Year 1
0.282 21 29662.01
Background Characteristics + All Year 1 Predictors
0.306 26 28873.79
California
Background Characteristics + Year 1 Credits Earned 0.180 124 216257.26
Background Characteristics + All Year 1 Credit-Accumulation Predictors
0.201 127 211886.28
Background Characteristics + Year 1 Credits Earned + Completed College-Level Math in Year 1
0.192 125 213922.14
Background Characteristics + All Year 1 Predictors
0.218 130 208432.76
NOTES1 For a literature review, titled “Student Progress Toward Degree
Completion: Lessons From the Research Literature,” visit www.csus.edu/ihe/publications.
2 Horn, L. & Lew, S. (2007). “California Community College Trans-fer Rates: Who is Counted Makes a Difference.” Berkeley, Calif.: MPR Associates, Inc.
3 For example, see Marcotte, D.E. (2006). “The Earnings Effect of Education at Community Colleges.” Baltimore: University of Maryland.
4 We recognize that transferring to a university is not really “completion,”given that the goal of those students is a bachelor’s
degree, and many students do not complete an associate degree before transferring (81 percent of transfers in the CCC cohort did not earn an associate degree). However, transfer is commonly used as a completion measure for community colleges. We were not able to track student outcomes after transfer, but we recognize that a substantial number of students who transfer to universities do not ultimately earn a baccalaureate.
5 For example, see: Adelman, C. (2005). “Moving Into Town and Moving On: The Community College In The Lives of Traditional-Aged Students.” Washington, D.C.: U.S. Department of Education; Achieving the Dream Cross-State Data Work Group (2008). Test drive: Six states pilot better ways to measure and compare com-
AdvbyDegrees.indd 19 12/6/2010 1:32:42 PM
20 IHELP | THE EDUCATION TRUST | ADVANCING BY DEGREES | APRIL 2010
munity college performance. Boston: Jobs for the Future.
6 The University of California (UC ) and California State University (CSU) generally require students to fi nish all transfer require-ments at the CCC before moving on to one of their campuses. Some lower division transfers are accepted at UC /CSU campuses that have enrollment space available, but lower division transfer students must have completed the 15-course college-preparatory curriculum required for freshman admission (known as A-G) while in high school or must have made up the defi ciencies while attending a CCC. Some campuses impose other requirements on lower division transfers, and some take no lower division transfers at all.
7 There is little remediation done in the SUSF. Florida students who require developmental courses are generally referred to commu-nity colleges for those courses, and no records of course enroll-ments or outcomes are included in the SUSF data. The CCC data do not include any information on assessment tests or placement recommendations in order to identify students who need remedia-tion. The CCC data do include information on remedial course enrollments, but course enrollment does not serve as a valid proxy for “need” for remediation. Many students who need remediation fail to enroll in developmental courses and are therefore misclassi-fi ed as college ready. The result is an overestimate of the success of “remedial” students and an underestimate of the success of “col-lege ready” students. This problem has also been noted by other researchers using data from other state community college systems (Achieving the Dream Cross-State Data Work Group, 2008).
8 Adelman, C., “Proposed Amendment for the Student Right-To-Know and Campus Security Act of 1990” (P.L. 101-542) to produce a full and honest account of college completion rates. Obtained through personal communication on June 2, 2008.
9 Students in Florida’s public universities must earn college-level credits in English and math in order to earn a bachelor’s degree, but they can earn those credits while in high school (for example, Advanced Placement exams). In this cohort, there were several thousand students who earned a bachelor's degree but never enrolled in college-level math or English at the university. If we counted those students as “not completing college-level math/English by Year 1,” it would seriously understate the importance of that indicator in predicting degree completion, since these students did earn college-level credits. Instead, we have counted those students in the “yes” group (completing CL math/English by end of Year 1). Unfortunately, we cannot identify those students who entered with those prior college credits but who did not graduate. Such students are unavoidably counted as not having completed college-level English/math by Year 1 because we have no way to identify them and move them to the “yes” column. Since the overall Florida graduation rate is 64 percent, we believe it is safe to assume that the rate is far higher for students who enter the university having completed college-level English and/or math. Therefore, the number of students miscategorized as “no” should be relatively small (since it is limited to those who came in with college credit but did not graduate in eight years). This unavoid-able error does overstate the positive impact of taking math/Eng-lish by the fi rst year on graduation rates, but we are convinced that it is an important indicator of success since before making this adjustment, completion of college-level math and college-level English were statistically signifi cant predictors of completion.
10 It could be the case that success courses in the CCC are aimed at students with more risk factors, complicating the relationship of taking a success course and completion. Also, the CCC does not have a code to identify success courses, so we relied on a combina-tion of Taxonomy of Program (TOP ) code and course title. We could have misclassifi ed some courses, affecting the results. Better
data are needed to accurately identify these courses.
11 We broke these results down by university because, for this indica-tor, aggregating across universities misrepresented the relationship.Specifi cally, aggregating the data across institutions resulted in a higher rate of degree completion for students who did not take a success course than for students who did take a success course. This reversal of the relationship occurred because very few students completed a success course at two of the largest universities, and these universities had relatively high graduation rates. The effect of this was to infl ate the overall number of students who did not take a success course and graduated. Furthermore, the small number of students at some universities can lead to some unlikely fi ndings such as the 100 percent completion rate for students tak-ing a success course in University 5. The perfect completion rate occurred because only two students who fi rst attended University 5 completed a success course in their fi rst year, and both happened to complete.
12 The different credit thresholds refl ect the different students served by these types of institutions (that is, community colleges have a larger percentage of part-time students than is typically found in four-year institutions, and more students who are not college-ready and require remediation).
13 On average, SUSF students who did not earn any summer credits were enrolled for less than four terms (fall/spring), while students who did earn summer credits were enrolled for an average of more than eight terms.
14 Adelman, C. (2006). “The Toolbox Revisited: Paths To Degree Completion From High School Through College.” Washington, D.C.: National Center for Education Statistics.
15 A smaller sample size for Asians (5 percent of the sample was Asian) limited the ability to detect the relationship and could explain the lack of relationship between continuous enrollment and completion for Asian students.
16 Some courses in the CCC are offered on a compressed schedule and may start sometime after the beginning of the term. Unfor-tunately, there is no indication in the data for “late start” courses. With input from internal CCC researchers, rules were developed for identifying circumstances where registrations that occurred more than a certain number of days into the term were probably an indication of “late start” courses. These were excluded from the analyses. Data were not available to measure late course regis-tration for the SUSF cohort. Other research has found that late registrants have higher course-withdrawal rates, which would affect credit accumulation (Freer-Weiss, D. [2004]. “Community College Freshmen: Last In, First Out? Journal of College Student Retention,” 6[2], 137-154).
17 We modifi ed the gateway-course completion indicators to cover the entire period of enrollment, instead of just the fi rst year. We were interested in fi nding out whether failure to complete these courses at any time during their college careers was preventing students from earning a bachelor’s degree.
18 This can be done by examining measures of practical and statisti-cal signifi cance of individual predictors and the overall model. See the appendix for details on this analysis.
19 An additional concern is that fi tting multiple regression models to the data in order to reduce the number of predictors of success runs the risk of choosing a subset of predictors based on some random aspect of the sample cohort.
20 See Hosmer, D. W., and Lemeshow, S. (2000). “Applied Logis-tic Regression.” 2nd ed. New York: John Wiley & Sons, Inc. for a discussion of summary measures that approximate variance explained.
AdvbyDegrees.indd 20 12/6/2010 1:32:42 PM

AdvbyDegrees.indd 22 12/6/2010 1:32:42 PM
1250 H STREET, NW, SUITE 700 , WASHINGTON, D .C . 20005
T 202/293-1217 F 202/293-2605 WWW.EDTRUST. ORG
6000 J STREET, SACRAMENTO, CALIF. 95819
T 916/278-3888 F 916/278-3907 WWW.CSUS.EDU/IHELP
ABOUT THE INSTITUTE FOR HIGHER EDUCATION LEADERSHIP & POLICY
The Institute for Higher Education Leadership & Policy seeks to enhance
leadership and policy for higher education in California and the nation by
producing research and services for policymakers, practitioners, and educators.
ABOUT THE EDUCATION TRUST
The Education Trust promotes high academic achievement for all students
at all levels—pre-kindergarten through college. We work alongside parents,
educators, and community and business leaders across the country in
transforming schools and colleges into institutions that serve all students
well. Lessons learned in these efforts, together with unfl inching data analyses,
shape our state and national policy agendas. Our goal is to close the gaps
in opportunity and achievement that consign far too many young people—
especially those who are black, Latino, American Indian, or from low-income
families—to lives on the margins of the American mainstream.
IHELP and The Education Trust are grateful to the Bill & Melinda Gates
Foundation and Lumina Foundation for Education for their generous
support. The views expressed in this report do not necessarily represent
those of either organization, its offi cers, or its employees.
AdvbyDegrees.indd c4 12/6/2010 1:32:02 PM