High Penetration PV Initiative -...
39
High Penetration Solar Forum March 2011 High Penetration PV Initiative Elaine Sison-Lebrilla, SMUD Emma Stewart, BEW Engineering James Bing, NEO Virtus Engineering
Transcript of High Penetration PV Initiative -...
High Penetration Solar ForumMarch 2011
High Penetration PV Initiative
Elaine Sison-Lebrilla, SMUDEmma Stewart, BEW Engineering
James Bing, NEO Virtus Engineering
2
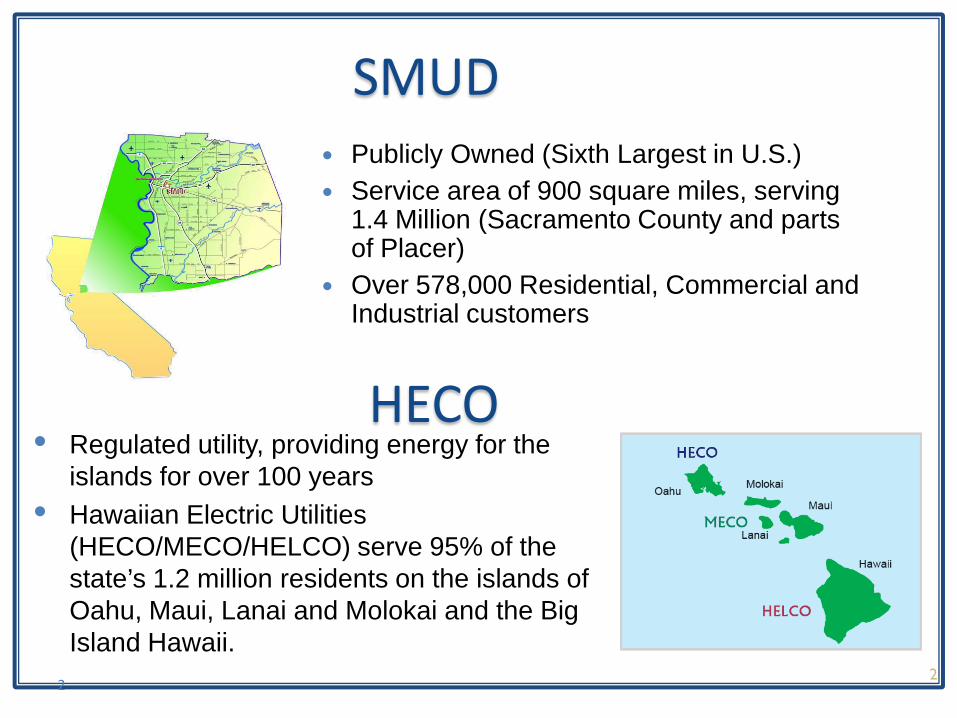
SMUD Publicly Owned (Sixth Largest in U.S.) Service area of 900 square miles, serving
1.4 Million (Sacramento County and parts of Placer)
Over 578,000 Residential, Commercial and Industrial customers
2
• Regulated utility, providing energy for the islands for over 100 years
• Hawaiian Electric Utilities (HECO/MECO/HELCO) serve 95% of the state’s 1.2 million residents on the islands of Oahu, Maui, Lanai and Molokai and the Big Island Hawaii.
HECO
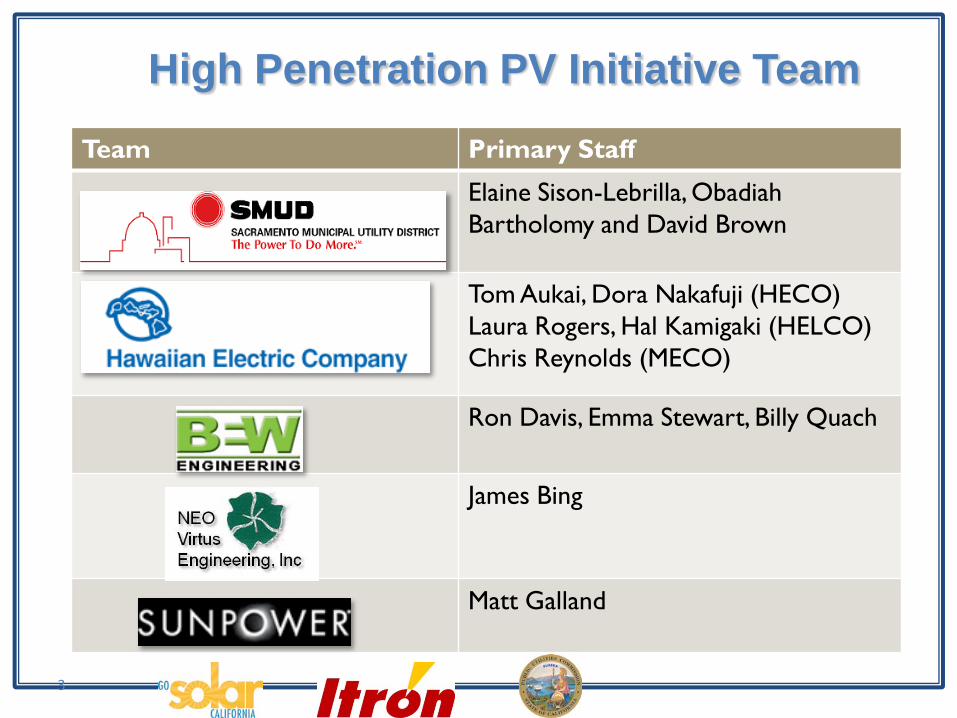
High Penetration PV Initiative Team
Team Primary Staff
Elaine Sison-Lebrilla, Obadiah Bartholomy and David Brown
Tom Aukai, Dora Nakafuji (HECO)Laura Rogers, Hal Kamigaki (HELCO)Chris Reynolds (MECO)
Ron Davis, Emma Stewart, Billy Quach
James Bing
Matt Galland
3
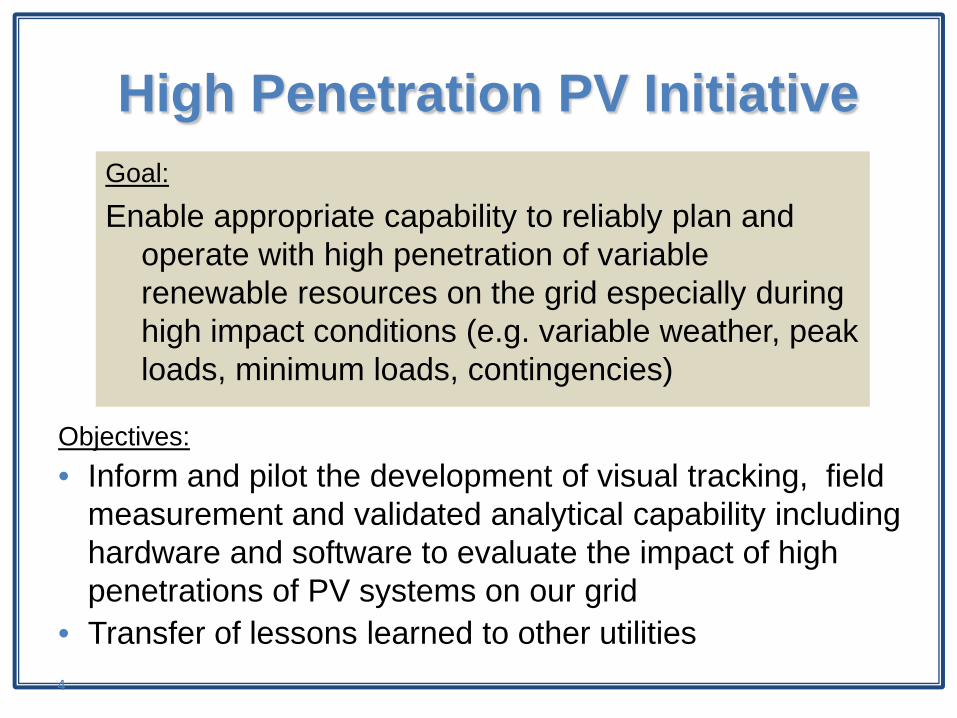
High Penetration PV Initiative
4
Goal:
Enable appropriate capability to reliably plan and operate with high penetration of variable renewable resources on the grid especially during high impact conditions (e.g. variable weather, peak loads, minimum loads, contingencies)
Objectives:• Inform and pilot the development of visual tracking, field
measurement and validated analytical capability including hardware and software to evaluate the impact of high penetrations of PV systems on our grid
• Transfer of lessons learned to other utilities
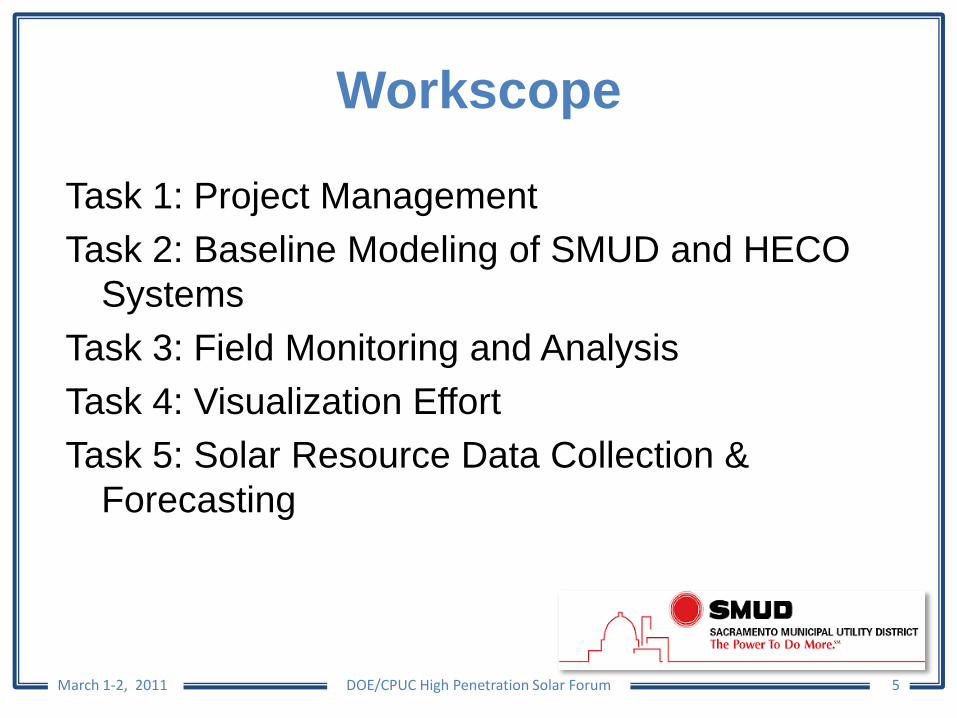
Workscope
Task 1: Project ManagementTask 2: Baseline Modeling of SMUD and HECO
SystemsTask 3: Field Monitoring and AnalysisTask 4: Visualization EffortTask 5: Solar Resource Data Collection &
Forecasting
March 1-2, 2011 DOE/CPUC High Penetration Solar Forum 5
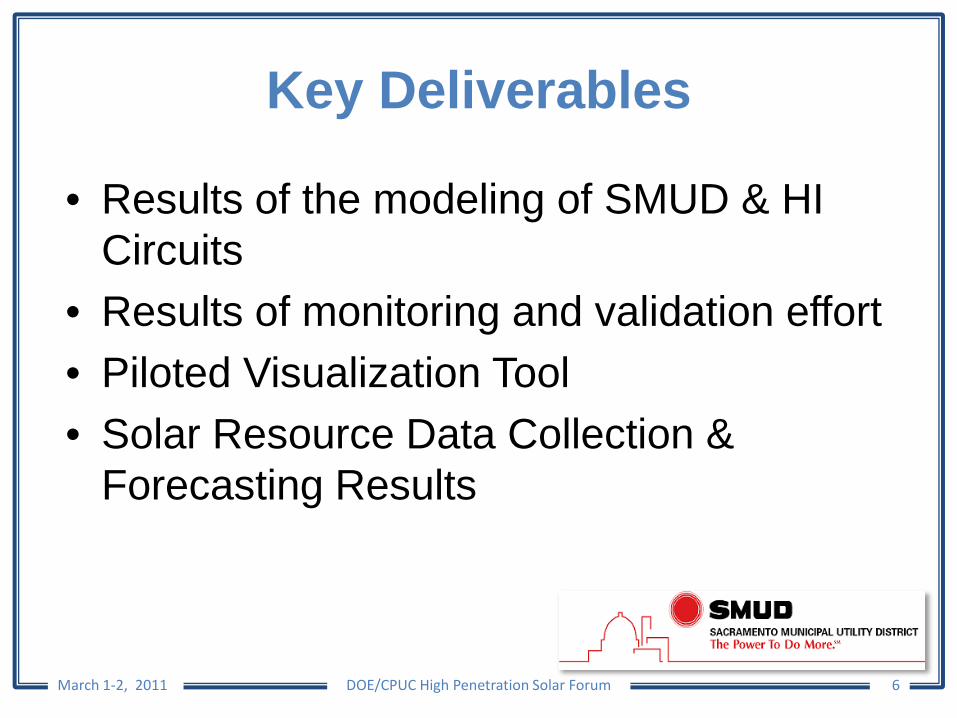
Key Deliverables
• Results of the modeling of SMUD & HI Circuits
• Results of monitoring and validation effort• Piloted Visualization Tool• Solar Resource Data Collection &
Forecasting Results
March 1-2, 2011 DOE/CPUC High Penetration Solar Forum 6
High Penetration Solar ForumMarch 2011
Task 2: Modeling
Emma StewartBEW Engineering

Baseline Modeling of SMUD and HECO Systems
• Identification of Cases (i.e. high penetration circuits with interesting characteristics)
• High Penetration Circuits Data Collection (Voltage, Loads, Production, Faults)
• Distribution Systems Modeling/Visualization
• SynerGEE modeling integrated with Powerworld
• Identify high value locations for PV
• Identify problem areas
8 DOE/CPUC High Penetration Solar ForumMarch 1-2, 2011
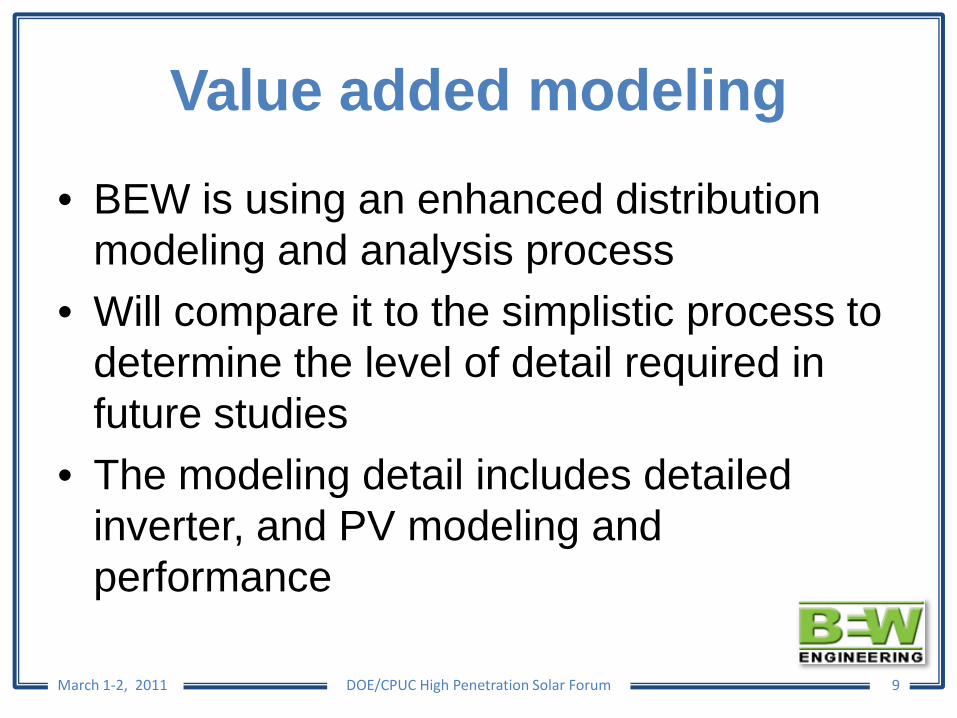
Value added modeling
• BEW is using an enhanced distribution modeling and analysis process
• Will compare it to the simplistic process to determine the level of detail required in future studies
• The modeling detail includes detailed inverter, and PV modeling and performance
March 1-2, 2011 DOE/CPUC High Penetration Solar Forum 9
Methodology Year 1• The following steps are taken to develop the feeder dataset for
analysis:1. Extract (GIS) or build (when GIS not available) SynerGEE model
2. Collect and apply detailed equipment information
3. Collect PV data for area of interest if available
• Transformers, switches, fuses distributed loading, capacitors, inverters, PV panels etc.
4. Collect full system sub-transmission/transmission model, and dynamic data
5. Model inverters
• Future detailed SynerGEE model, or existing equivalent impedance model, and PSLF dynamic inverter model
March 1-2, 2011 DOE/CPUC High Penetration Solar Forum 10
Methodology Cont. Year 1• Once the data-set is complete, the following steps are performed in the
analysis:1. Perform base case load flow analysis with and without existing PV
• Single point in time, minimum load day, and maximum load day
• Perform basic fault current analysis with/without existing PV
2. Repeat load flow and fault current analysis for potential and predicted PV cases
3. Verify feeder performance with measured data (load flows, voltage levels etc)
4. Repeat analysis after verification of data
5. Conversion of data for transient analysis
6. Conduct advanced post-validation studies including:
• Protection coordination, Harmonic studies, Islanding study (voltage and frequency limits), Transient study
March 1-2, 2011 DOE/CPUC High Penetration Solar Forum 11
Determine time periods of interest for all utilities
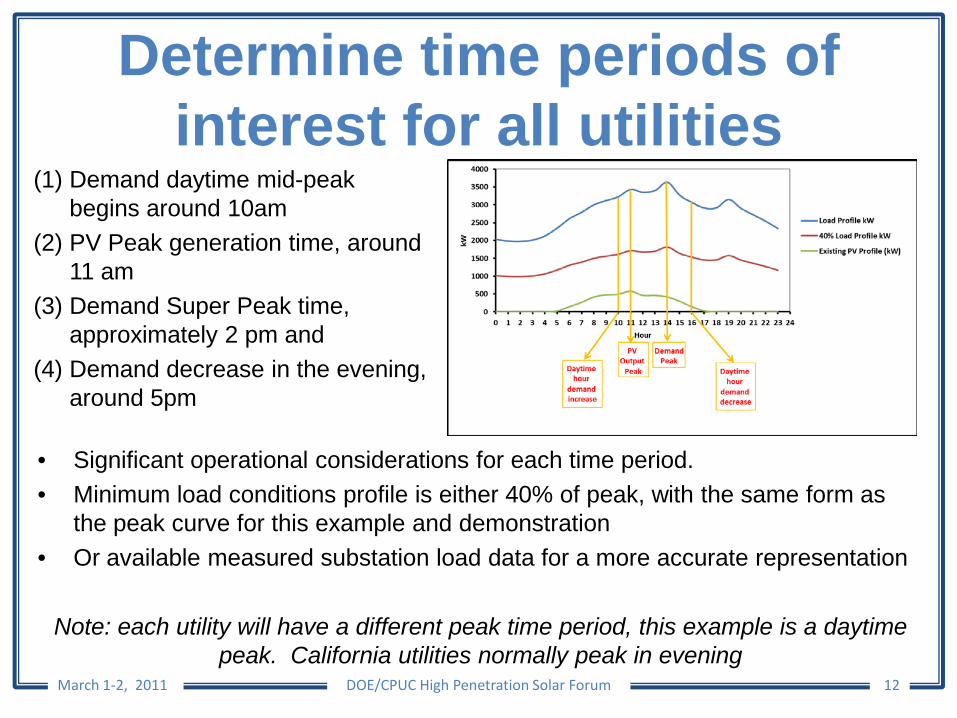
(1) Demand daytime mid-peak begins around 10am
(2) PV Peak generation time, around 11 am
(3) Demand Super Peak time, approximately 2 pm and
(4) Demand decrease in the evening, around 5pm
March 1-2, 2011 DOE/CPUC High Penetration Solar Forum 12
• Significant operational considerations for each time period. • Minimum load conditions profile is either 40% of peak, with the same form as
the peak curve for this example and demonstration• Or available measured substation load data for a more accurate representation
Note: each utility will have a different peak time period, this example is a daytime peak. California utilities normally peak in evening
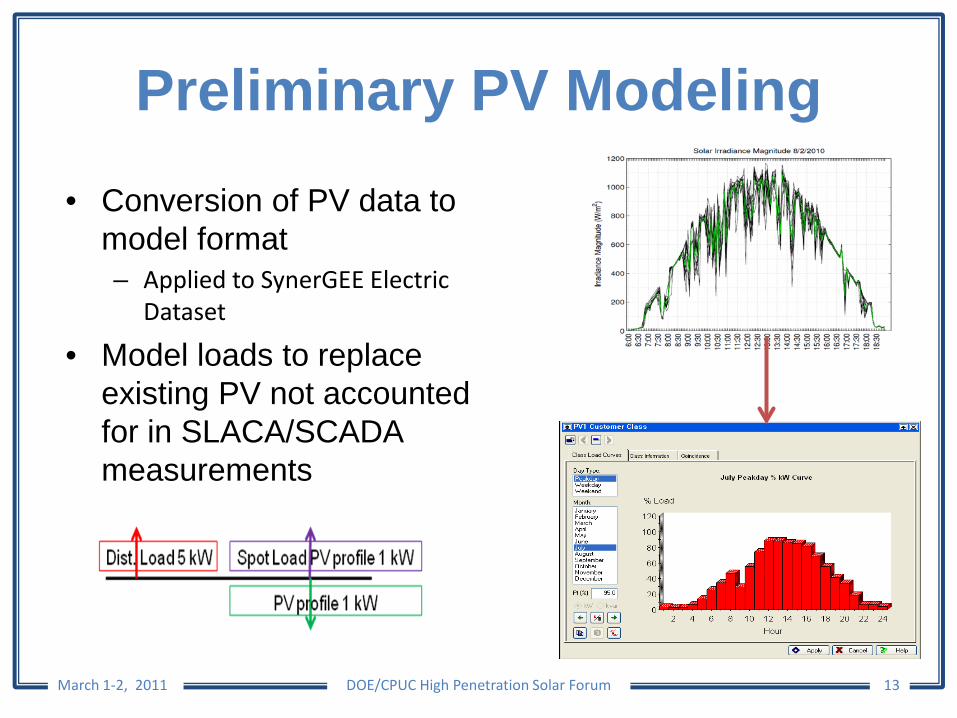
Preliminary PV Modeling• Conversion of PV data to
model format– Applied to SynerGEE Electric
Dataset
• Model loads to replace existing PV not accounted for in SLACA/SCADA measurements
March 1-2, 2011 DOE/CPUC High Penetration Solar Forum 13
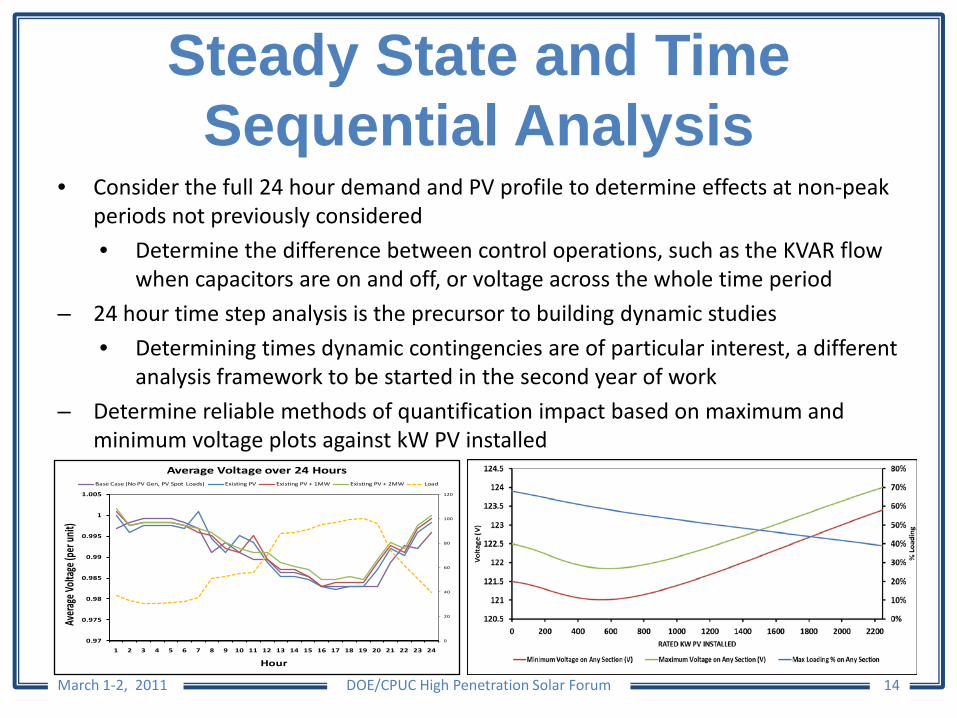
Steady State and Time Sequential Analysis
• Consider the full 24 hour demand and PV profile to determine effects at non-peak periods not previously considered
• Determine the difference between control operations, such as the KVAR flow when capacitors are on and off, or voltage across the whole time period
– 24 hour time step analysis is the precursor to building dynamic studies
• Determining times dynamic contingencies are of particular interest, a different analysis framework to be started in the second year of work
– Determine reliable methods of quantification impact based on maximum and minimum voltage plots against kW PV installed
March 1-2, 2011 DOE/CPUC High Penetration Solar Forum 14
0
20
40
60
80
100
120
0.97
0.975
0.98
0.985
0.99
0.995
1
1.005
1 2 3 4 5 6 7 8 9 10 11 12 13 14 15 16 17 18 19 20 21 22 23 24
Aver
age V
olta
ge (p
er u
nit)
Hour
Average Voltage over 24 HoursBase Case (No PV Gen, PV Spot Loads) Existing PV Existing PV + 1MW Existing PV + 2MW Load
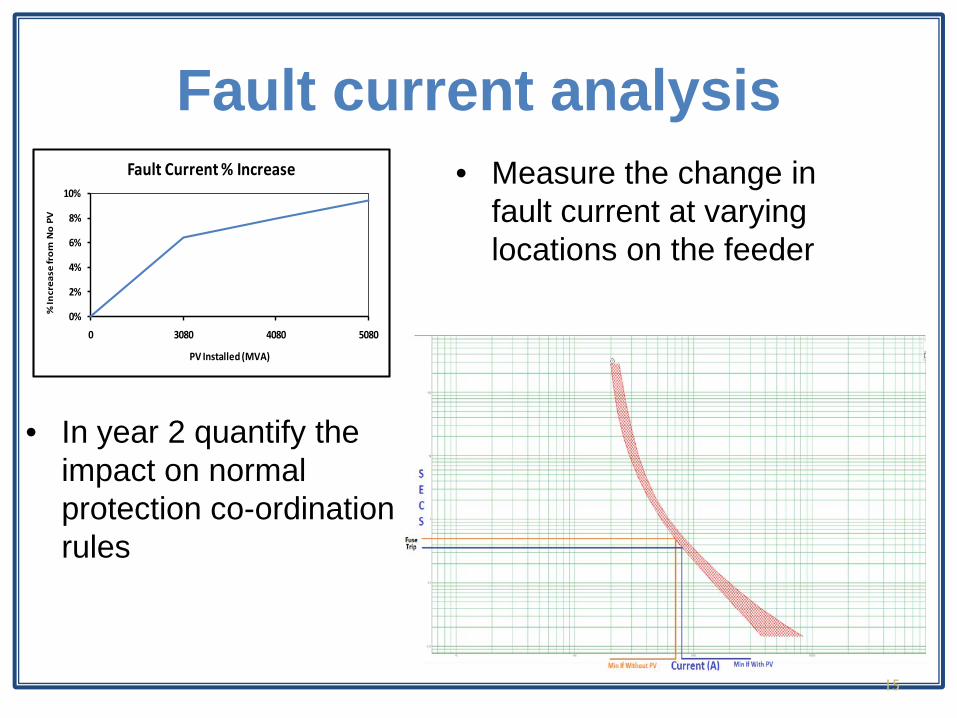
Fault current analysis
• In year 2 quantify the impact on normal protection co-ordination rules
• Measure the change in fault current at varying locations on the feeder
15
0%
2%
4%
6%
8%
10%
0 3080 4080 5080
% In
crea
se fr
om
No
PV
PV Installed (MVA)
Fault Current % Increase
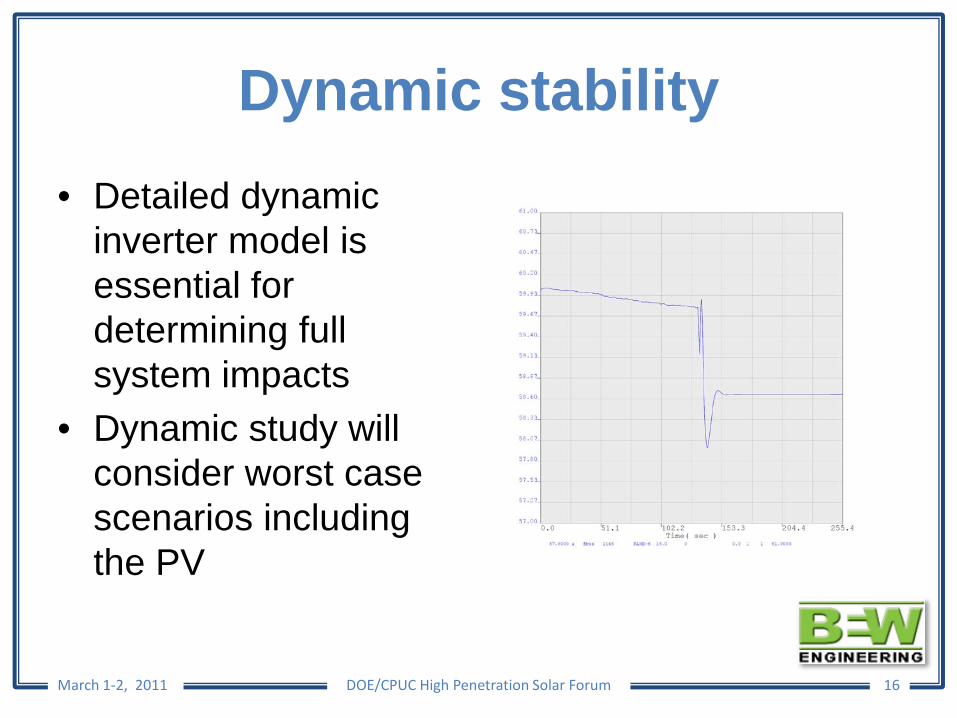
Dynamic stability• Detailed dynamic
inverter model is essential for determining full system impacts
• Dynamic study will consider worst case scenarios including the PV
March 1-2, 2011 DOE/CPUC High Penetration Solar Forum 16
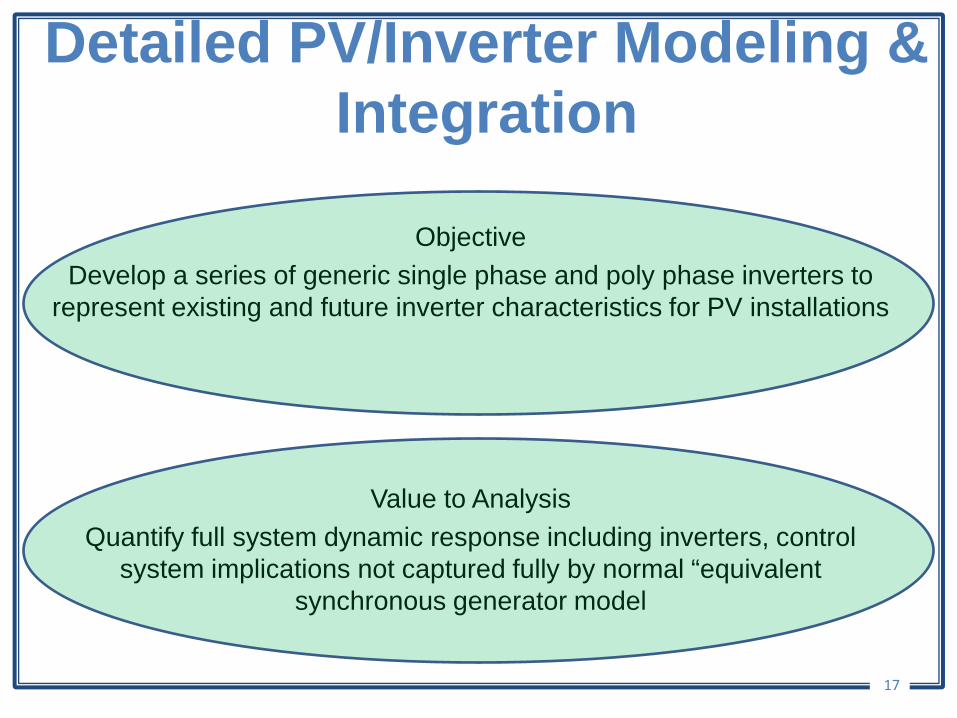
Detailed PV/Inverter Modeling & Integration
ObjectiveDevelop a series of generic single phase and poly phase inverters to
represent existing and future inverter characteristics for PV installations
Value to AnalysisQuantify full system dynamic response including inverters, control
system implications not captured fully by normal “equivalent synchronous generator model
17
Dynamic Inverter Model Construction
• 3 PSLF models are required to accurately model a PV unit– gewtg (standard PSLF
model)
– ewtgfc (standard PSLF model)
– epcmod (user-defined PSLF model)
• All three models are written for each PV unit modeled onto the system
March 1-2, 2011 DOE/CPUC High Penetration Solar Forum 18
• Example:• Generator at bus 99999 is a 1.5
MW PV unit model in the system.• Inverter has under/over frequency
protection with variable inputs/controls, and an time step irradiance input function
• This procedure and dynamics invocation is repeated for each PV unit on the system.
Preliminary generalized feeder findings
• Fault current rise is significant in high-penetration scenarios going above 40% PV– Protection co-ordination studies will be necessary and possibly result in large
scale changes
• Detailed PV data is essential to quantify short time scale effects like flicker• Voltage rise can occur regularly on light load, high penetration feeders
– Customer impacts (flicker, loss of service, damage to sensitive equipment)
– Mitigation strategy (regulators, control schemes for cap banks, inverter control strategy)
– Voltage rise could be due to many things – capacitor banks control system, or fixed on-off settings, line impedances,
• Interaction between capacitor banks/inverters/tap changers could significantly impact reliability
March 1-2, 2011 DOE/CPUC High Penetration Solar Forum 19
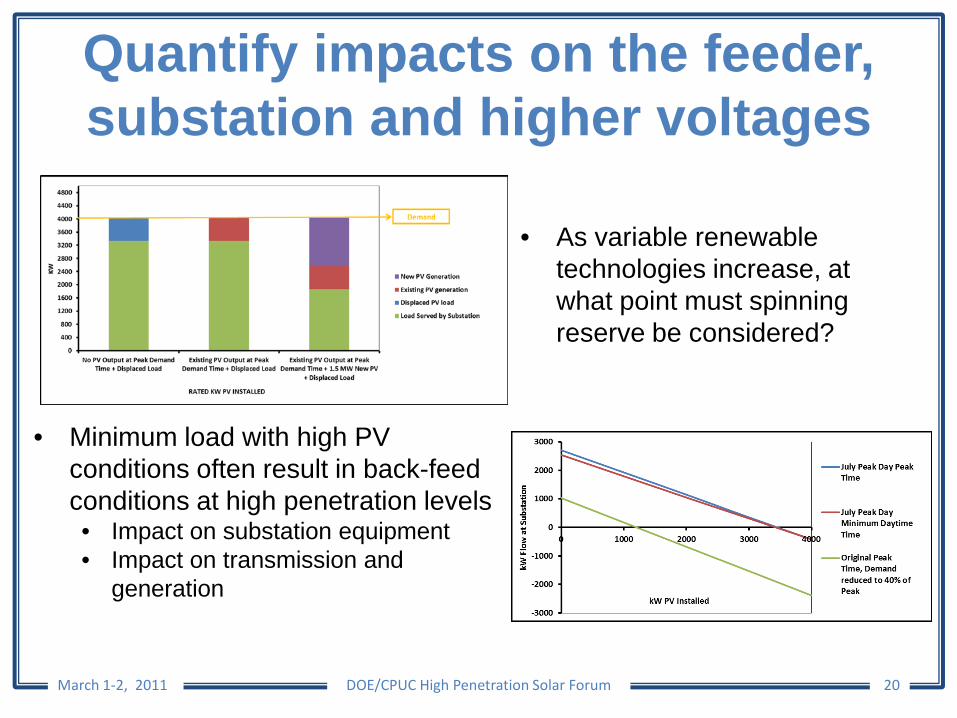
Quantify impacts on the feeder, substation and higher voltages
March 1-2, 2011 DOE/CPUC High Penetration Solar Forum 20
• Minimum load with high PV conditions often result in back-feed conditions at high penetration levels• Impact on substation equipment• Impact on transmission and
generation
• As variable renewable technologies increase, at what point must spinning reserve be considered?
Future work & Deliverables
• Complete the detailed feeder studies• Develop mapping functions to highlight
potential problems areas and ideal locations for higher renewable penetrations
• Prepare report with recommendations on future advancements in computer modeling functions and inverter operations functions
March 1-2, 2011 DOE/CPUC High Penetration Solar Forum 21
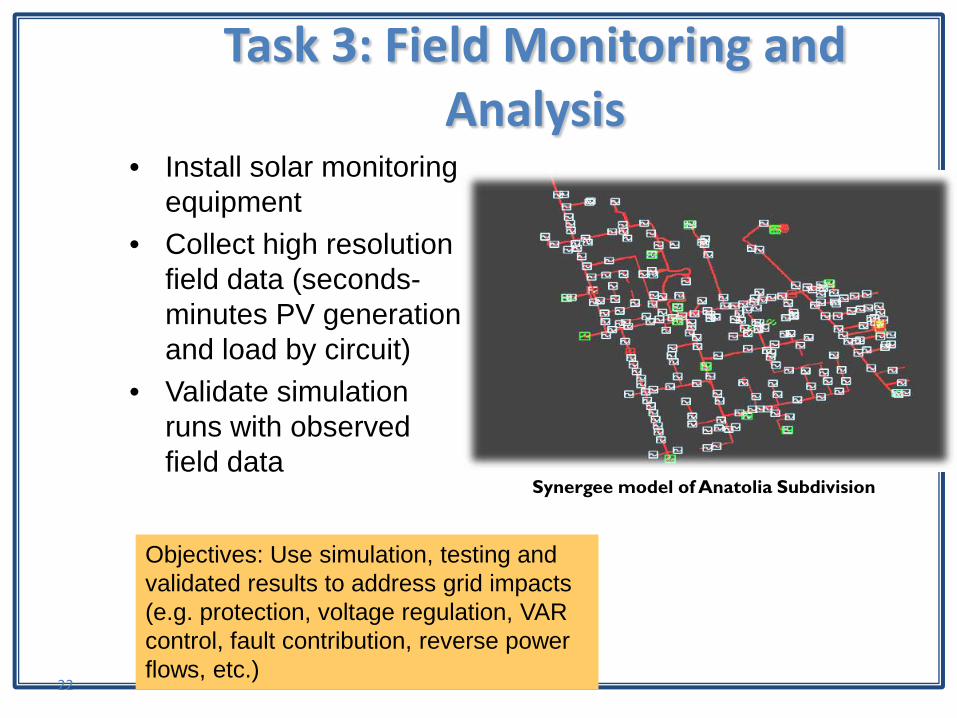
Task 3: Field Monitoring and Analysis
• Install solar monitoring equipment
• Collect high resolution field data (seconds-minutes PV generation and load by circuit)
• Validate simulation runs with observed field data
22
Synergee model of Anatolia Subdivision
Objectives: Use simulation, testing and validated results to address grid impacts (e.g. protection, voltage regulation, VAR control, fault contribution, reverse power flows, etc.)
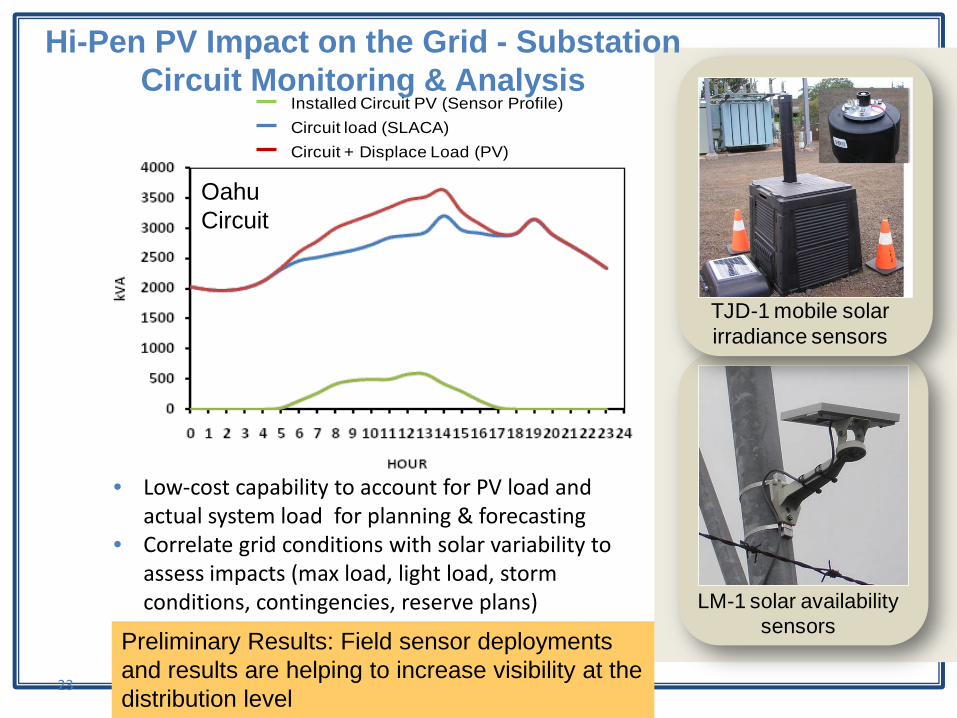
Hi-Pen PV Impact on the Grid - Substation Circuit Monitoring & Analysis
23
Circuit load (SLACA)Installed Circuit PV (Sensor Profile)
Circuit + Displace Load (PV)
Oahu Circuit
LM-1 solar availability sensors
TJD-1 mobile solar irradiance sensors
Preliminary Results: Field sensor deployments and results are helping to increase visibility at the distribution level
• Low-cost capability to account for PV load and actual system load for planning & forecasting
• Correlate grid conditions with solar variability to assess impacts (max load, light load, storm conditions, contingencies, reserve plans)
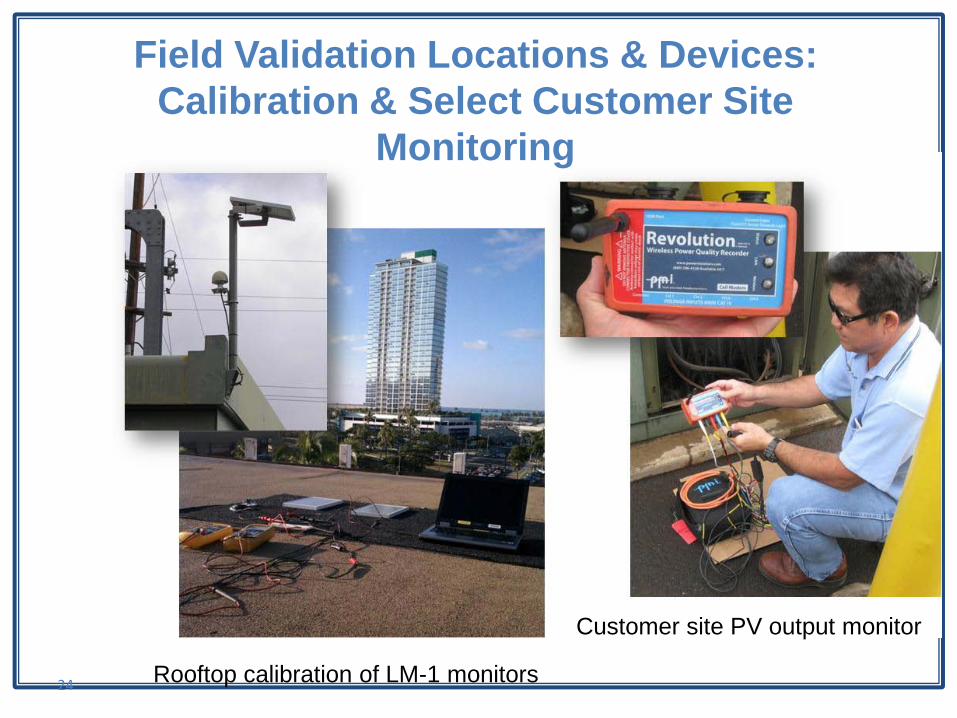
Field Validation Locations & Devices: Calibration & Select Customer Site
Monitoring
24 Rooftop calibration of LM-1 monitors
Customer site PV output monitor
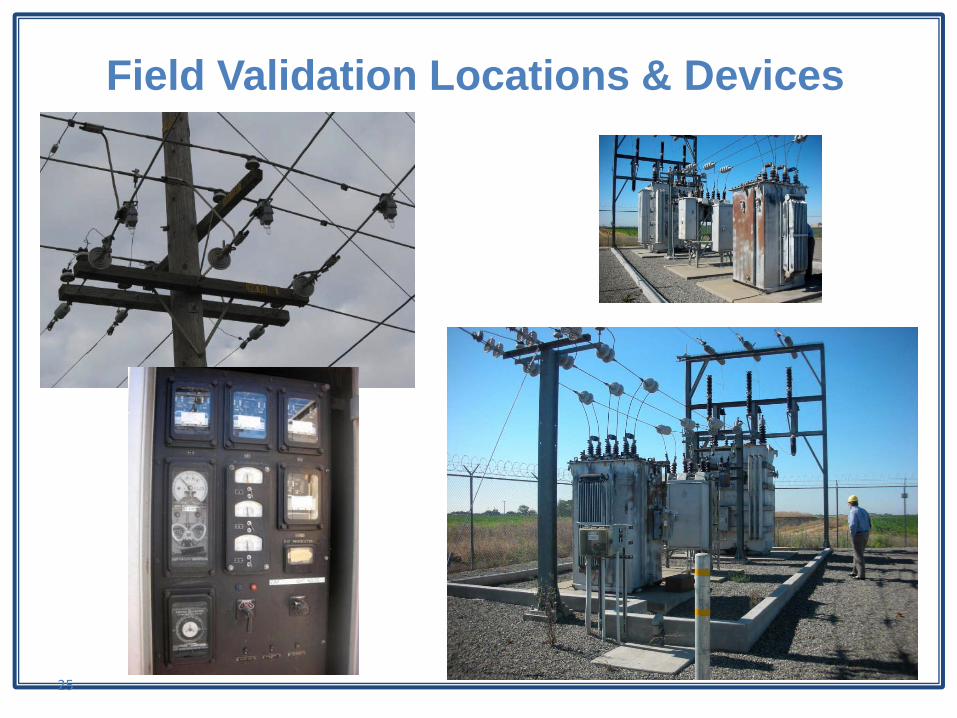
Field Validation Locations & Devices
25
26
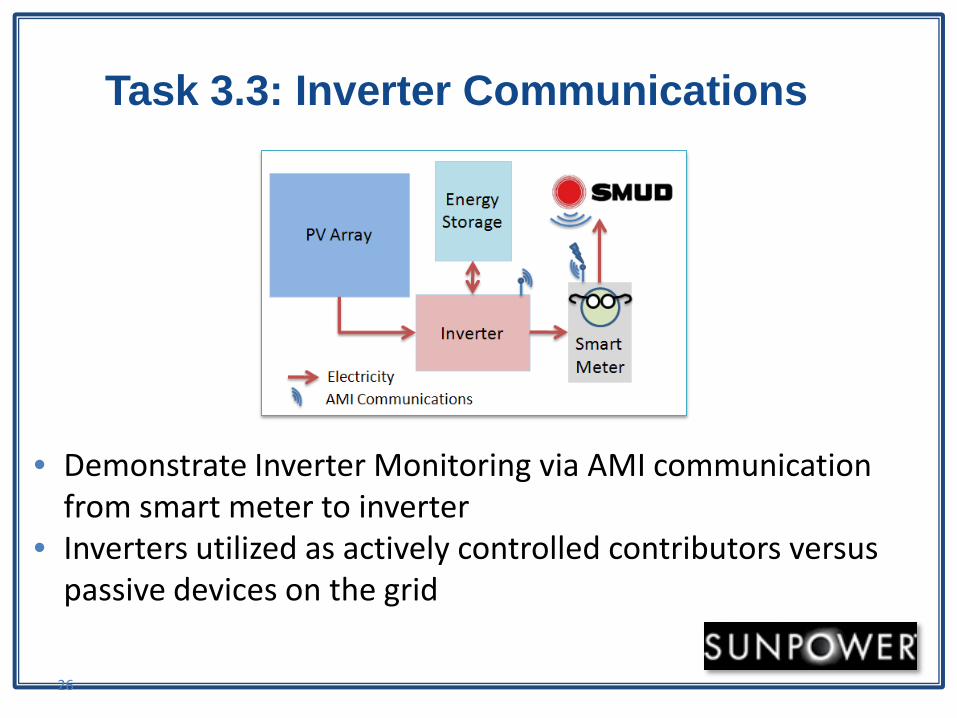
Task 3.3: Inverter Communications
• Demonstrate Inverter Monitoring via AMI communication from smart meter to inverter
• Inverters utilized as actively controlled contributors versus passive devices on the grid
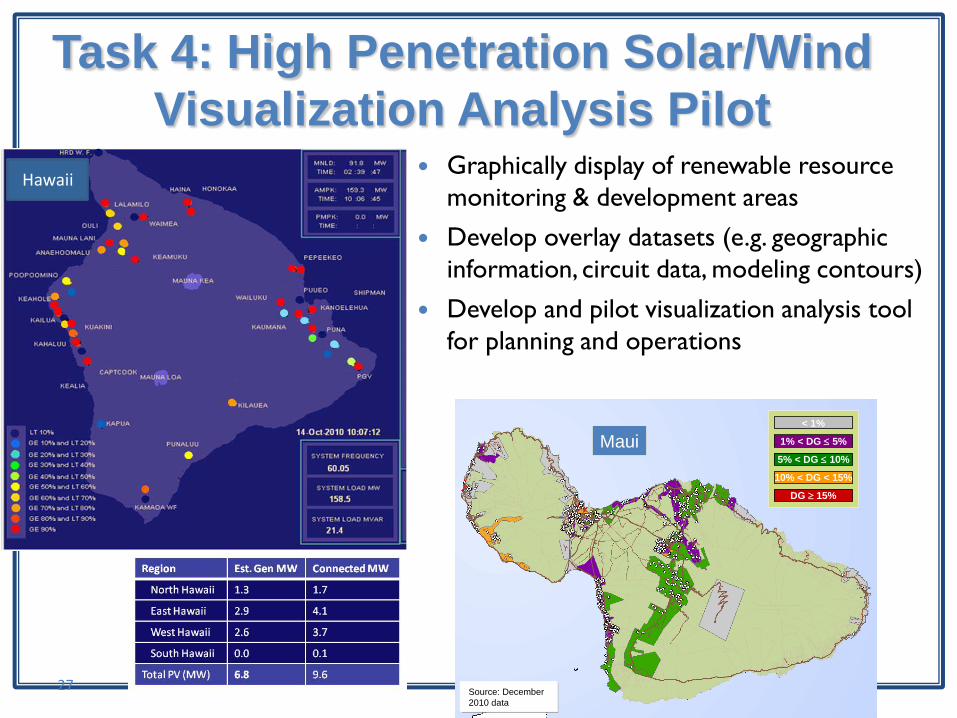
Task 4: High Penetration Solar/Wind Visualization Analysis Pilot
27
Graphically display of renewable resource monitoring & development areas
Develop overlay datasets (e.g. geographic information, circuit data, modeling contours)
Develop and pilot visualization analysis tool for planning and operations
Maui
Source: December 2010 data
< 1%
1% < DG ≤ 5%
5% < DG ≤ 10%
10% < DG < 15%
DG ≥ 15%
Maui
Source: December 2010 data
Maui
Source: December 2010 data
< 1%
1% < DG ≤ 5%
5% < DG ≤ 10%
10% < DG < 15%
DG ≥ 15%
Hawaii
High Penetration Solar ForumMarch 2011
Task 5: PV Production Forecasting
James M. BingNEO Virtus Engineering, Inc.
Littleton, MA
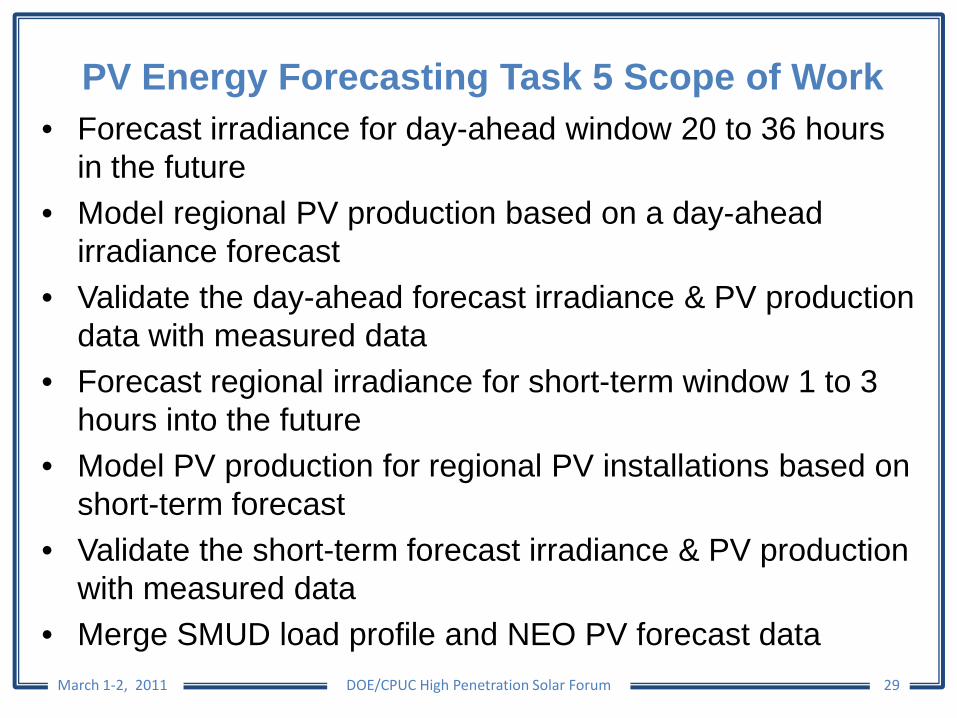
PV Energy Forecasting Task 5 Scope of Work• Forecast irradiance for day-ahead window 20 to 36 hours
in the future• Model regional PV production based on a day-ahead
irradiance forecast• Validate the day-ahead forecast irradiance & PV production
data with measured data• Forecast regional irradiance for short-term window 1 to 3
hours into the future• Model PV production for regional PV installations based on
short-term forecast• Validate the short-term forecast irradiance & PV production
with measured data• Merge SMUD load profile and NEO PV forecast data
March 1-2, 2011 DOE/CPUC High Penetration Solar Forum 29
Task 5 Team & Responsibilities• SMUD
– Deploy primary & secondary monitoring stations
• NEO Virtus Engineering, Inc– Design, procure, build, program secondary stations– Develop MySQL database
• NDFD forecast data retrieval • Primary & secondary station automated data retrieval• Integration of CRM algorithm (NDFD-CRM-Tilt/Azimuth/Shade-Sandia PV Array Model)• Integration of PV system geometry & shading obstruction algorithm• Integration of PV system parameters in Sacramento test area
– Design measured vs. forecast validation program– Consider appropriate metrics for PV forecast accuracy
and utility grid forecast requirementsMarch 1-2, 2011 DOE/CPUC High Penetration Solar Forum 30
Task 5 Team & Responsibilities• NEO Sub-Consultants
– Solar Consulting Services, Inc.; Dr. Christian Gueymard.
• Select clear-sky radiation model for Sacramento area for DH, DN, GH
• Derive a raw cloud cover function for clear-sky model for Sacramento area
• Develop operational forecast tool for tilted surface
• Develop an algorithm to calculate the obstruction shading algorithm
– Irradiance Inc.; Dr. Edward Kern• Short term forecast model (15 minute & 1 to 3 hour ahead)
• Error analysis metrics & quantify error forecast vs. measured irradiance
• Supply primary monitoring station: Rotating Shadowband Radiometers
– Augustine & Company; Jim Augustine• Instrumentation array calibration
– Software Consultants; Patel, McCardle, Mehta • Data retrieval & database design & management
March 1-2, 2011 DOE/CPUC High Penetration Solar Forum 31
Monitoring & Data Retrieval• Irradiance Monitoring Network
– 5 primary monitoring stations• GH, DH, DN• Ambient temperature• 1 minute averages
– 66 secondary monitoring stations• GH• Ambient temperature• 1 minute averages
– 5km grid Sacramento • NDFD Lambert conformal projection• Installed on SMUD utility poles
• Automated system data retrieval– Cellular modem network w/daily retrieval
March 1-2, 2011 DOE/CPUC High Penetration Solar Forum 32
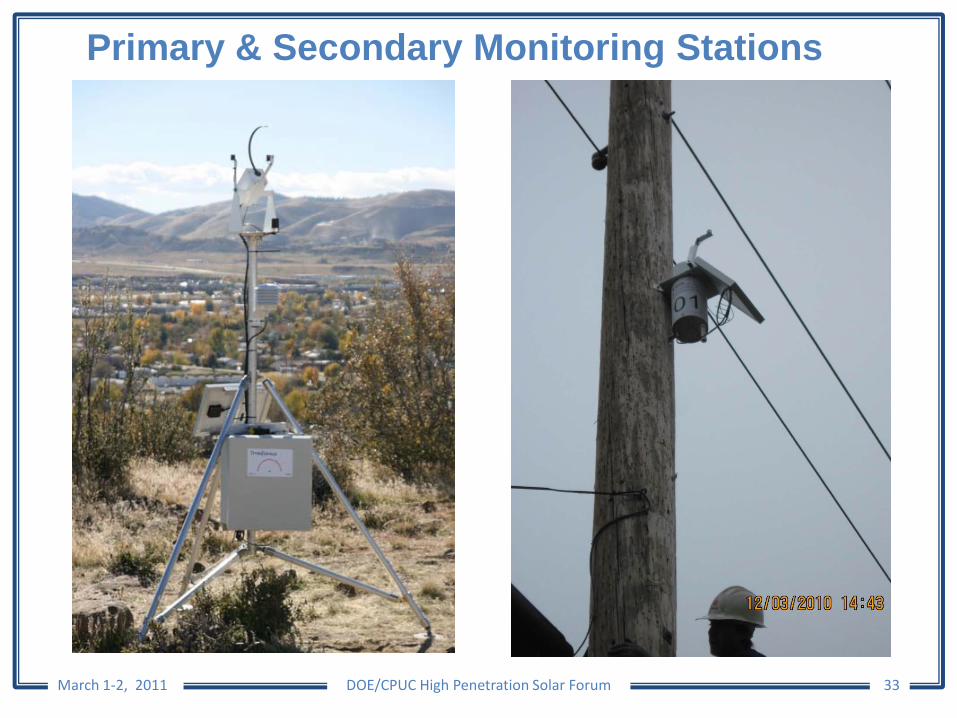
Primary & Secondary Monitoring Stations
March 1-2, 2011 DOE/CPUC High Penetration Solar Forum 33
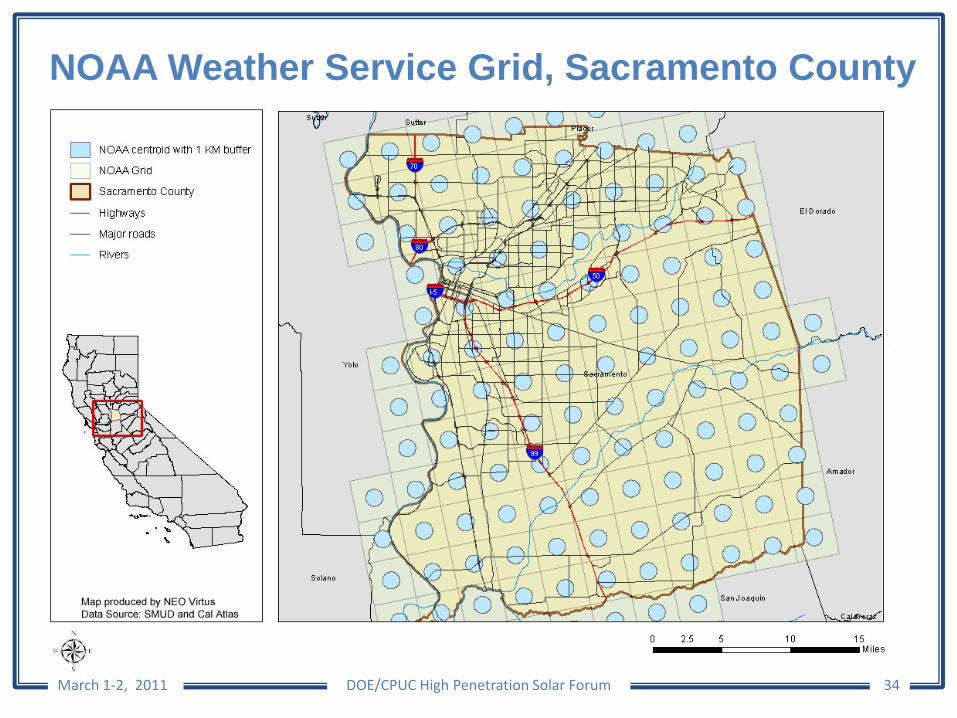
NOAA Weather Service Grid, Sacramento County
March 1-2, 2011 DOE/CPUC High Penetration Solar Forum 34
Develop 20-36 Hour Feed-Forward PV Forecasting Model
• Cloud-cover Radiation Model (CRM)• PV Surface Irradiance Model• Photovoltaic Generation Model Integration• 20-36 Hour Feed-Forward PV Forecasting
Model Integration• Load Data Collection (w/SMUD)
March 1-2, 2011 DOE/CPUC High Penetration Solar Forum 35
Develop 1-3 Hour Feed-Forward PV Forecasting Program
• Develop 1-3 hour forecasting algorithm• 1-3 hour feed-forward PV forecasting
model integration from measured data
March 1-2, 2011 DOE/CPUC High Penetration Solar Forum 36
Validate Irradiance/PV Production/Load Forecast Models• Validate Irradiance 20-36 Hour
Forecast Model• Validate Irradiance 1-3 Hour Forecast
Model• Validate Modified Load Forecast
Model
March 1-2, 2011 DOE/CPUC High Penetration Solar Forum 37
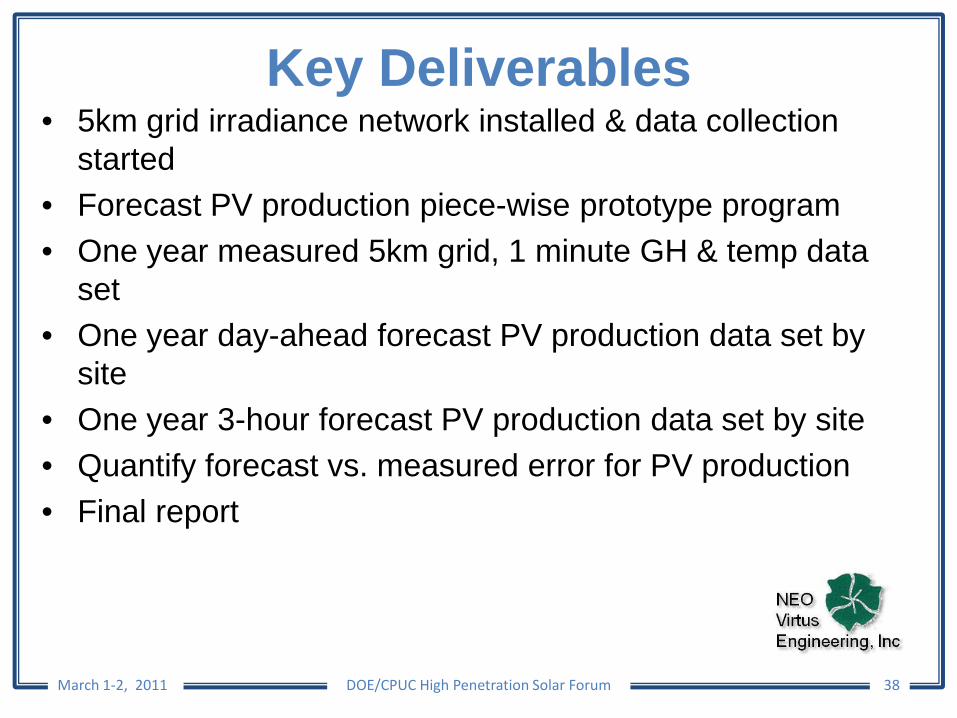
Key Deliverables• 5km grid irradiance network installed & data collection
started• Forecast PV production piece-wise prototype program• One year measured 5km grid, 1 minute GH & temp data
set• One year day-ahead forecast PV production data set by
site• One year 3-hour forecast PV production data set by site• Quantify forecast vs. measured error for PV production• Final report
March 1-2, 2011 DOE/CPUC High Penetration Solar Forum 38
Q & A
39
For more information please contact:
Elaine Sison-Lebrilla, [email protected]
Emma Stewart, [email protected]
James Bing, [email protected]
Dora Nakafuji, [email protected]