Herring: Expectations for a New Millennium
98
Herring: Expectations for a New Millennium 199 Alaska Sea Grant College Program • AK-SG-01-04, 2001 Spawning Bed Selection by Pacific Herring ( Clupea pallasii ) at Atsuta, Hokkaido, Japan Hiroshi Hoshikawa Hokkaido Central Fisheries Experimental Station, Hokkaido, Japan Ken-ichiro Tajima Hokkaido Institute of Mariculture, Hokkaido, Japan Tadashi Kawai Hokkaido Nuclear Energy Environmental Research Center, Hokkaido, Japan Tomohiro Ohtsuki Wakkanai Fisheries Experimental Station, Hokkaido, Japan Abstract Spawning bed selection by a local population of Pacific herring (Clupea pallasii ) was studied at Atsuta, Ishikari Bay on the west coast of Hokkaido, in northern Japan, using scuba diving. We surveyed the vegetation, macrobenthos, and character of the bottom in 1996 and 1997. Occurrence of herring eggs was studied from 1997 to 1999. The spawning bed charac- teristics such as water temperature and topography of spawning beds were measured during spawning season in 1998 and 1999. Rich vegetation covered most of the shore and shallow sublittoral, but spawning beds were limited to the southern part of study area. In one of these restricted areas herring spawned in exactly the same beds in 1998 and 1999, and eggs were found repeatedly during the same spawn- ing period. Most of the eggs were attached to seagrass, Phyllospadix iwatensis, which was a dominant species along with Laminaria spp. and Cystoseira hakodatensis. Egg densities varied both spatially and temporally from sev- eral hundred to a maximum of 1.6 million per square meter. Egg density was also high along the narrow grooves running perpendicular to the flat, platform-like rocky shore.
-
Upload
nguyencong -
Category
Documents
-
view
219 -
download
0
Transcript of Herring: Expectations for a New Millennium
Herring: Expectations for a New Millennium 199Alaska Sea Grant College Program • AK-SG-01-04, 2001
Spawning Bed Selection by PacificHerring (Clupea pallasii ) atAtsuta, Hokkaido, JapanHiroshi HoshikawaHokkaido Central Fisheries Experimental Station, Hokkaido, Japan
Ken-ichiro TajimaHokkaido Institute of Mariculture, Hokkaido, Japan
Tadashi KawaiHokkaido Nuclear Energy Environmental Research Center, Hokkaido, Japan
Tomohiro OhtsukiWakkanai Fisheries Experimental Station, Hokkaido, Japan
AbstractSpawning bed selection by a local population of Pacific herring (Clupeapallasii ) was studied at Atsuta, Ishikari Bay on the west coast of Hokkaido,in northern Japan, using scuba diving. We surveyed the vegetation,macrobenthos, and character of the bottom in 1996 and 1997. Occurrenceof herring eggs was studied from 1997 to 1999. The spawning bed charac-teristics such as water temperature and topography of spawning bedswere measured during spawning season in 1998 and 1999.
Rich vegetation covered most of the shore and shallow sublittoral,but spawning beds were limited to the southern part of study area. In oneof these restricted areas herring spawned in exactly the same beds in1998 and 1999, and eggs were found repeatedly during the same spawn-ing period.
Most of the eggs were attached to seagrass, Phyllospadix iwatensis,which was a dominant species along with Laminaria spp. and Cystoseirahakodatensis. Egg densities varied both spatially and temporally from sev-eral hundred to a maximum of 1.6 million per square meter. Egg densitywas also high along the narrow grooves running perpendicular to the flat,platform-like rocky shore.
200 Hoshikawa et al. — Spawning Bed Selection
The main spawning period in 1998 was in late March, while in 1999,two main spawning periods occurred in early March and early April. Thespatial distribution of eggs laid in the second spawning didn’t overlapwith that of the first spawning in 1999. The spawning bed selection atAtsuta is discussed in relation to the vegetation, topography of the rockyshore, and wave conditions during the spawning season.
IntroductionHerring generally spawn on vegetation in the Pacific, the Atlantic, the Bal-tic Sea, the Okhotsk Sea, and the Sea of Japan (Tamura and Okubo 1953a;Tamura et al. 1954; Galkina 1959, 1960; Aneer et al. 1983; Haegele andSchweigert 1985; Kääriä et al. 1988; Rajasilta et al. 1993). According toStacey and Hourston (1982) and Obata et al. (1997), herring select thesubstratum for spawning with their pelvic and pectoral fins. Thus thecharacter of the bottom is one of the important factors for spawning bedselection (Kääriä 1999).
In Pacific and Atlantic herring, spawning beds were not exactly pre-dictable from year to year (Tyurnin 1973, Hourston and Rosenthal 1976,Messieh 1987, Hay and McCarter 1997). However, herring spawned at al-most the same beds in the Baltic Sea each year (Oulasvirta et al. 1985,Rajasilta et al. 1993, Kääriä 1999).
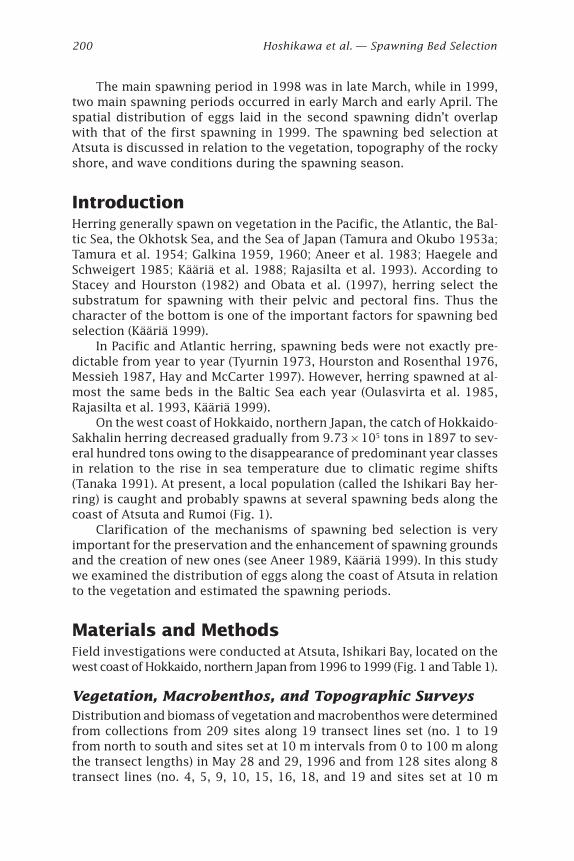
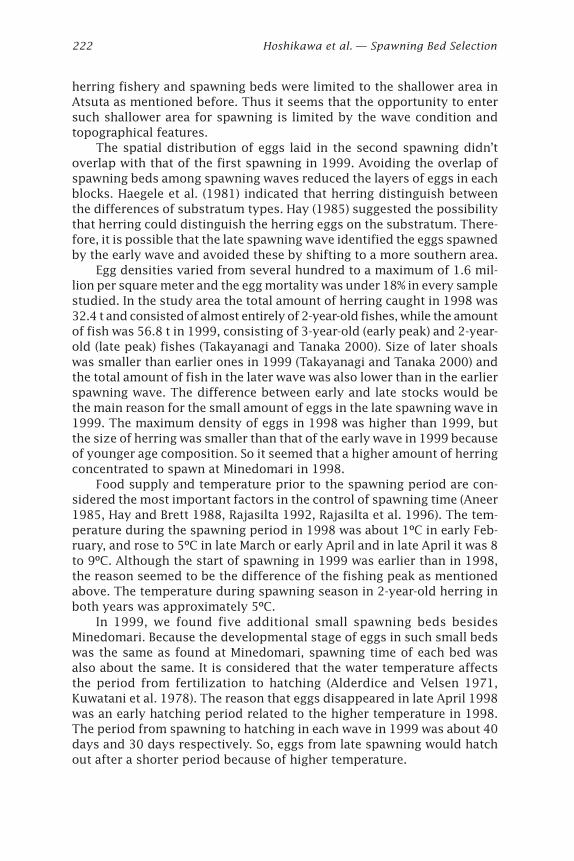
On the west coast of Hokkaido, northern Japan, the catch of Hokkaido-Sakhalin herring decreased gradually from 9.73 ¥ 105 tons in 1897 to sev-eral hundred tons owing to the disappearance of predominant year classesin relation to the rise in sea temperature due to climatic regime shifts(Tanaka 1991). At present, a local population (called the Ishikari Bay her-ring) is caught and probably spawns at several spawning beds along thecoast of Atsuta and Rumoi (Fig. 1).
Clarification of the mechanisms of spawning bed selection is veryimportant for the preservation and the enhancement of spawning groundsand the creation of new ones (see Aneer 1989, Kääriä 1999). In this studywe examined the distribution of eggs along the coast of Atsuta in relationto the vegetation and estimated the spawning periods.
Materials and MethodsField investigations were conducted at Atsuta, Ishikari Bay, located on thewest coast of Hokkaido, northern Japan from 1996 to 1999 (Fig. 1 and Table 1).
Vegetation, Macrobenthos, and Topographic SurveysDistribution and biomass of vegetation and macrobenthos were determinedfrom collections from 209 sites along 19 transect lines set (no. 1 to 19from north to south and sites set at 10 m intervals from 0 to 100 m alongthe transect lengths) in May 28 and 29, 1996 and from 128 sites along 8transect lines (no. 4, 5, 9, 10, 15, 16, 18, and 19 and sites set at 10 m
Herring: Expectations for a New Millennium 201
E140
N4
E144
Hokkaido
The Seaof Japan
Pacific Ocean
0 5km
N
Ishikari
River
Ishari Bay
New Port
Yoichi
Ishikari Bay
Yasosuke
Atsuta
Kotan
Minedomari
Mourai
20m
15m 10m
5m
Rumoi
1
1019
2
3
4
5
67 8
910
111213
14
161718
15
1
2
34
8
6
5
7
9
Figure 1. Study area. Black dots with numbers = the location of veg-etation, macrobenthos, and herring egg surveys in 1996and 1997 by scuba. Circles with numbers = the location ofherring egg surveys by scuba in 1998.
202 Hoshikawa et al. — Spawning Bed Selection
intervals from 0 to 100 m and 20 m intervals from 120 to 200 m) on June12, 1997. These transects were selected in order to cover the whole studyarea. The first basis of selection was the mouth area of small rivers and,second, the amount of herring catch (by professional fishermen) in the areastudied. These studies were conducted in late spring (after the spawningseason) when the biomass of algae shows the maximum value in all sea-sons in this area. Scuba divers sampled and recorded vegetation in 0.25m2 and benthos in 1 m2 plots and the sediment type and depth at each site.
The number of individuals and total wet weight of each species oflarge algae, seagrass, and macrobenthos were recorded. Total wet weightwas recorded for each species of small algae.
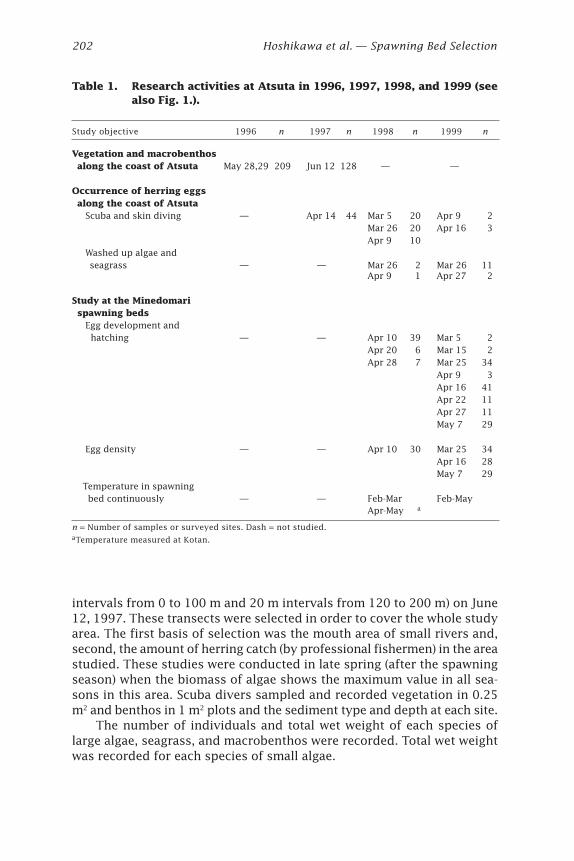
Table 1. Research activities at Atsuta in 1996, 1997, 1998, and 1999 (seealso Fig. 1.).
n = Number of samples or surveyed sites. Dash = not studied.aTemperature measured at Kotan.
Study objective 1996 n 1997 n 1998 n 1999 n
Vegetation and macrobenthos along the coast of Atsuta May 28,29 209 Jun 12 128 — —
Occurrence of herring eggs along the coast of Atsuta Scuba and skin diving — Apr 14 44 Mar 5 20 Apr 9 2
Mar 26 20 Apr 16 3Apr 9 10
Washed up algae and seagrass — — Mar 26 2 Mar 26 11
Apr 9 1 Apr 27 2
Study at the Minedomari spawning beds Egg development and hatching — — Apr 10 39 Mar 5 2
Apr 20 6 Mar 15 2Apr 28 7 Mar 25 34
Apr 9 3Apr 16 41Apr 22 11Apr 27 11May 7 29
Egg density — — Apr 10 30 Mar 25 34Apr 16 28May 7 29
Temperature in spawning bed continuously — — Feb-Mar Feb-May
Apr-May a
Herring: Expectations for a New Millennium 203
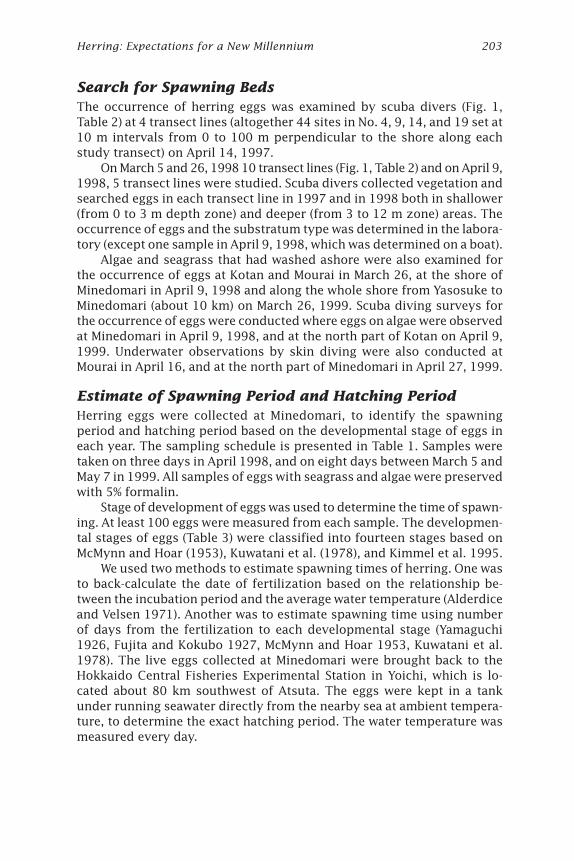
Search for Spawning BedsThe occurrence of herring eggs was examined by scuba divers (Fig. 1,Table 2) at 4 transect lines (altogether 44 sites in No. 4, 9, 14, and 19 set at10 m intervals from 0 to 100 m perpendicular to the shore along eachstudy transect) on April 14, 1997.
On March 5 and 26, 1998 10 transect lines (Fig. 1, Table 2) and on April 9,1998, 5 transect lines were studied. Scuba divers collected vegetation andsearched eggs in each transect line in 1997 and in 1998 both in shallower(from 0 to 3 m depth zone) and deeper (from 3 to 12 m zone) areas. Theoccurrence of eggs and the substratum type was determined in the labora-tory (except one sample in April 9, 1998, which was determined on a boat).
Algae and seagrass that had washed ashore were also examined forthe occurrence of eggs at Kotan and Mourai in March 26, at the shore ofMinedomari in April 9, 1998 and along the whole shore from Yasosuke toMinedomari (about 10 km) on March 26, 1999. Scuba diving surveys forthe occurrence of eggs were conducted where eggs on algae were observedat Minedomari in April 9, 1998, and at the north part of Kotan on April 9,1999. Underwater observations by skin diving were also conducted atMourai in April 16, and at the north part of Minedomari in April 27, 1999.
Estimate of Spawning Period and Hatching PeriodHerring eggs were collected at Minedomari, to identify the spawningperiod and hatching period based on the developmental stage of eggs ineach year. The sampling schedule is presented in Table 1. Samples weretaken on three days in April 1998, and on eight days between March 5 andMay 7 in 1999. All samples of eggs with seagrass and algae were preservedwith 5% formalin.
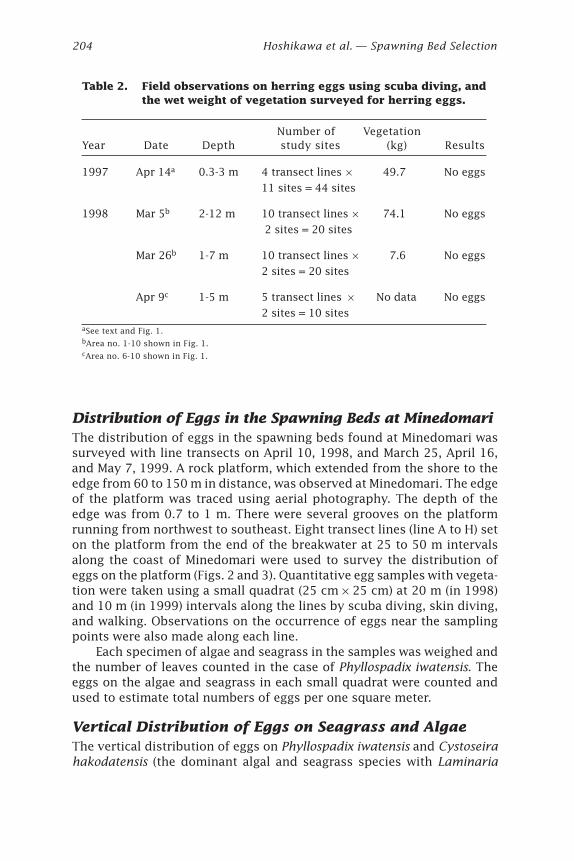
Stage of development of eggs was used to determine the time of spawn-ing. At least 100 eggs were measured from each sample. The developmen-tal stages of eggs (Table 3) were classified into fourteen stages based onMcMynn and Hoar (1953), Kuwatani et al. (1978), and Kimmel et al. 1995.
We used two methods to estimate spawning times of herring. One wasto back-calculate the date of fertilization based on the relationship be-tween the incubation period and the average water temperature (Alderdiceand Velsen 1971). Another was to estimate spawning time using numberof days from the fertilization to each developmental stage (Yamaguchi1926, Fujita and Kokubo 1927, McMynn and Hoar 1953, Kuwatani et al.1978). The live eggs collected at Minedomari were brought back to theHokkaido Central Fisheries Experimental Station in Yoichi, which is lo-cated about 80 km southwest of Atsuta. The eggs were kept in a tankunder running seawater directly from the nearby sea at ambient tempera-ture, to determine the exact hatching period. The water temperature wasmeasured every day.
204 Hoshikawa et al. — Spawning Bed Selection
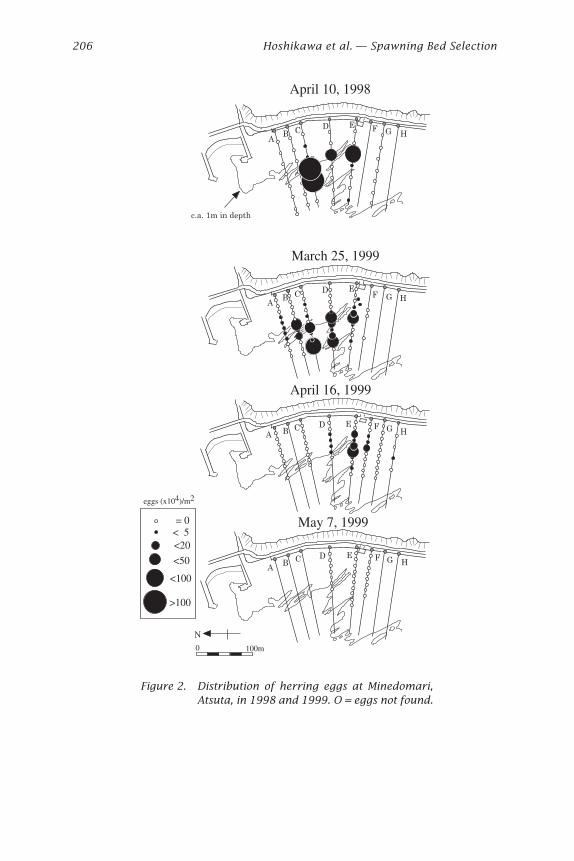
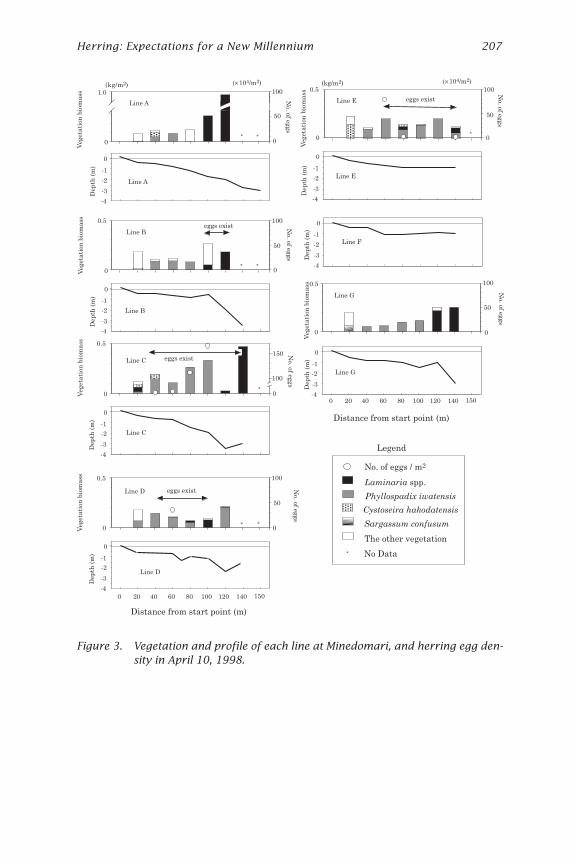
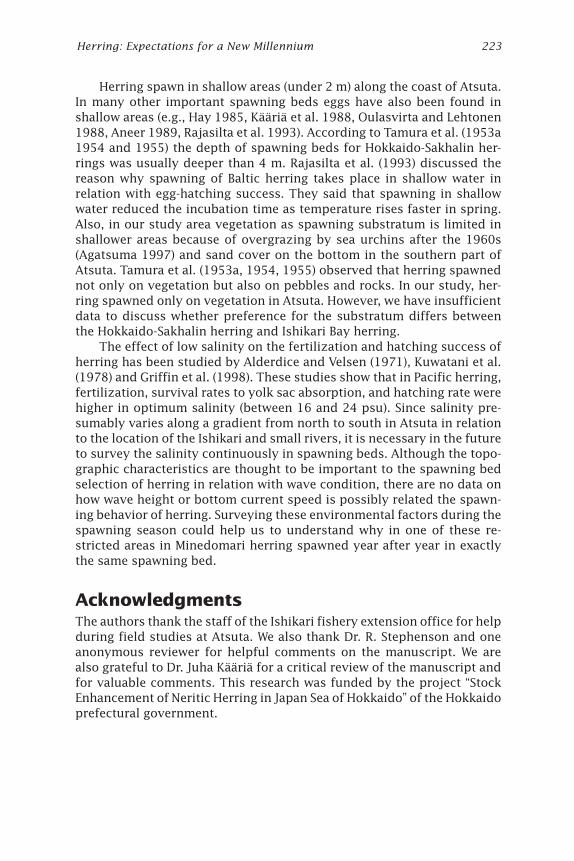
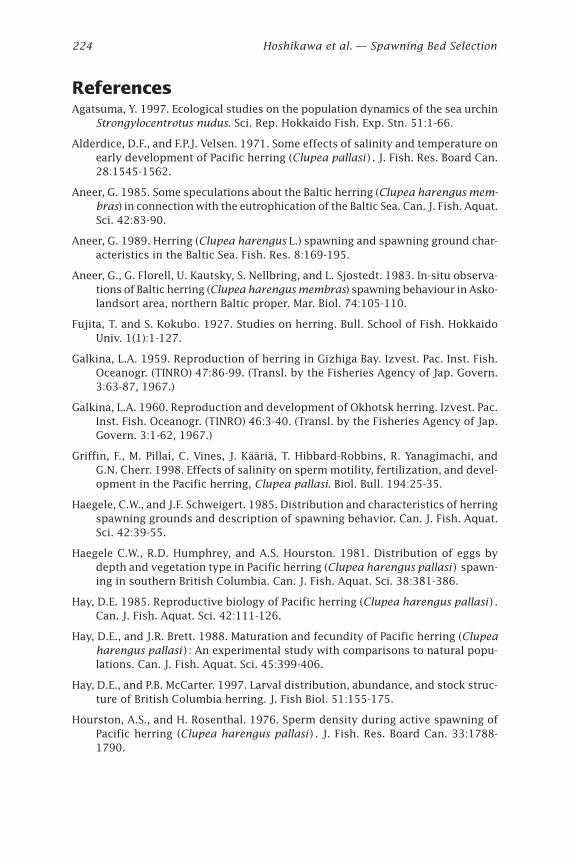
Distribution of Eggs in the Spawning Beds at MinedomariThe distribution of eggs in the spawning beds found at Minedomari wassurveyed with line transects on April 10, 1998, and March 25, April 16,and May 7, 1999. A rock platform, which extended from the shore to theedge from 60 to 150 m in distance, was observed at Minedomari. The edgeof the platform was traced using aerial photography. The depth of theedge was from 0.7 to 1 m. There were several grooves on the platformrunning from northwest to southeast. Eight transect lines (line A to H) seton the platform from the end of the breakwater at 25 to 50 m intervalsalong the coast of Minedomari were used to survey the distribution ofeggs on the platform (Figs. 2 and 3). Quantitative egg samples with vegeta-tion were taken using a small quadrat (25 cm ¥ 25 cm) at 20 m (in 1998)and 10 m (in 1999) intervals along the lines by scuba diving, skin diving,and walking. Observations on the occurrence of eggs near the samplingpoints were also made along each line.
Each specimen of algae and seagrass in the samples was weighed andthe number of leaves counted in the case of Phyllospadix iwatensis. Theeggs on the algae and seagrass in each small quadrat were counted andused to estimate total numbers of eggs per one square meter.
Vertical Distribution of Eggs on Seagrass and AlgaeThe vertical distribution of eggs on Phyllospadix iwatensis and Cystoseirahakodatensis (the dominant algal and seagrass species with Laminaria
Table 2. Field observations on herring eggs using scuba diving, andthe wet weight of vegetation surveyed for herring eggs.
Number of VegetationYear Date Depth study sites (kg) Results
1997 Apr 14a 0.3-3 m 4 transect lines ¥ 49.7 No eggs
11 sites = 44 sites
1998 Mar 5b 2-12 m 10 transect lines ¥ 74.1 No eggs
2 sites = 20 sites
Mar 26b 1-7 m 10 transect lines ¥ 7.6 No eggs
2 sites = 20 sites
Apr 9c 1-5 m 5 transect lines ¥ No data No eggs
2 sites = 10 sitesaSee text and Fig. 1.bArea no. 1-10 shown in Fig. 1.cArea no. 6-10 shown in Fig. 1.
Herring: Expectations for a New Millennium 205
spp. (L. religiosa, L. ochotensis, and L. cichorioides) at Atsuta) was exam-ined to determine how herring use them as a spawning substratum. Thelength of the algae and seagrass were measured from the bottom to thetop, and cut into 5 or 10 cm strips. The algae and seagrass were weighedand the eggs were counted in each of the height layers. In the case of P.iwatensis, the number of leaves was also counted in each layer.
Water TemperatureWater temperature at Minedomari was measured continuously using a tem-perature data recorder (Optic Stow Away Temp logger) set on the bottomfrom February to March in 1998, but after March 1998 temperature wasrecorded only at Kotan (Figs. 1 and 4) at 1 m depth. In 1999 temperaturewas measured continuously from February to May at Minedomari.
ResultsVegetation, Macrobenthos, and Topographic Featuresalong the Atsuta CoastA total of 42 species of algae and seagrass were found and among themmany annual species of small algae were abundant (Table 4). The biomassof vegetation was dominated by Laminaria spp., (57.6% in 1996 and 74.5%
Table 3. Developmental stage of herrings eggs.
No. Developmental stage
1 2 cells
4 cells
8 cells
2 Morula
3 Blastula
4 Gastrula
5 Embryonic shield expanded
6 Formation of Kupfer’s vesicle
7 Kupfer’s vesicle clear
8 Lenses develop in eyes
9 Differentiation of tail
10 Body rounds 1.2 times around yolk
11 Body rounds 1.5 times around yolk
12 Eye color dark, body rounds 2 times around yolk
13 Eye color black, pigmentation on body
14 Starts hatching
206 Hoshikawa et al. — Spawning Bed Selection
0 100m
N
A B C D E F G H
April 16, 1999
AB
C D E F G H
May 7, 1999= 0< 5<20
<50
<100
eggs (x104)/m2
>100
AB C
D EF G H
March 25, 1999
AB C
D E F G H
April 10, 1998
c.a. 1m in depth
Figure 2. Distribution of herring eggs at Minedomari,Atsuta, in 1998 and 1999. O = eggs not found.
Herring: Expectations for a New Millennium 207
100
50
0
Line D eggs exist
* *
0
0.5 100
50
0
Line Beggs exist
* *
100
150
0
Line C eggs exist
*
-4
-3
-2
-1
0
Line G
Line F
Line ELine A
Line B
Line C
No. o
f eggs
0
0.5 100
50
0
Line G
No. o
f eggs
0
1.0 100
50
0
Line A
* *
No. o
f eggs
No. o
f eggs
No. o
f eggs
0
0.5
*
Line E eggs exist
100
50
0
(kg/m2) (kg/m2)
-4
-3
-2
-1
0
-4
-3
-2
-1
0
0 20 40 60 80 100 120 140 150
Vegeta
tion
bio
ma
ssD
ep
th (
m)
-4
-3
-2
-1
0
Dep
th (
m)
-4
-3
-2
-1
0
Dep
th (
m)
0
0.5
-4
-3
-2
-1
0
Dep
th (
m)
0
0.5
Dep
th (
m)
Vegeta
tion
bio
ma
ssD
ep
th (
m)
Dep
th (
m)
Distance from start point (m)
Distance from start point (m)
No. of eggs / m2
Laminaria spp.
Phyllospadix iwatensis
Cystoseira hakodatensis
Sargassum confusum
The other vegetation
Legend
* No Data
(¥ 104/m2) (¥ 104/m2)
-4
-3
-2
-1
0
0 20 40 60 80 100 120 140 150
Line D
Vegeta
tion
bio
ma
ssV
egeta
tion
bio
ma
ssV
egeta
tion
bio
ma
ssV
egeta
tion
bio
ma
ssN
o. o
f eggs
Figure 3. Vegetation and profile of each line at Minedomari, and herring egg den-sity in April 10, 1998.
208 Hoshikawa et al. — Spawning Bed Selection
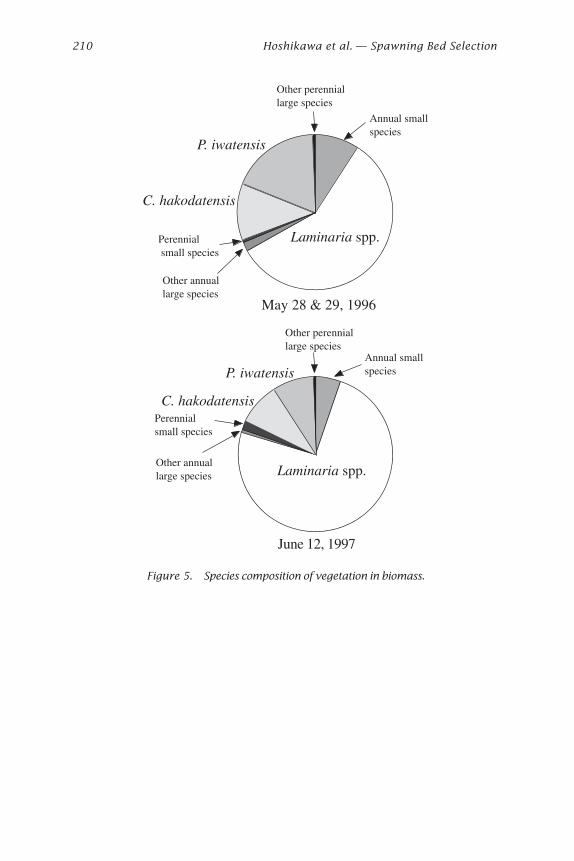
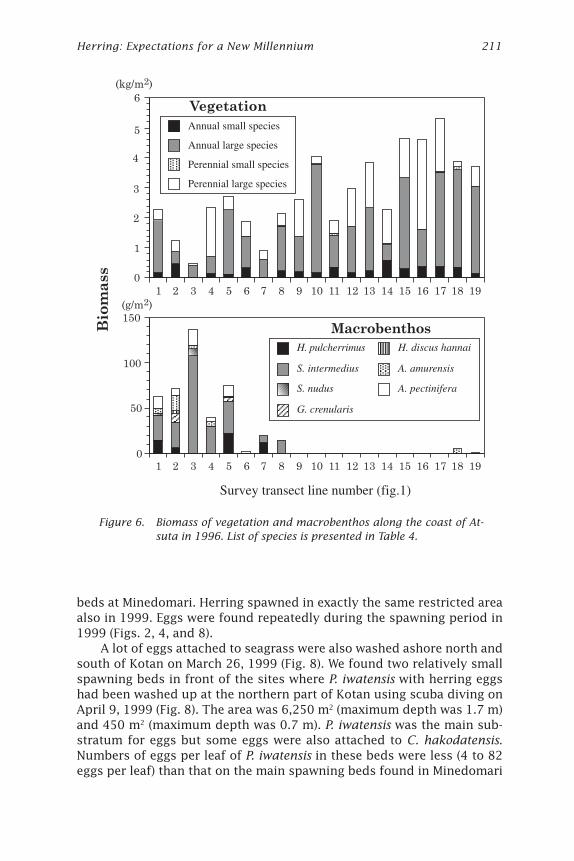
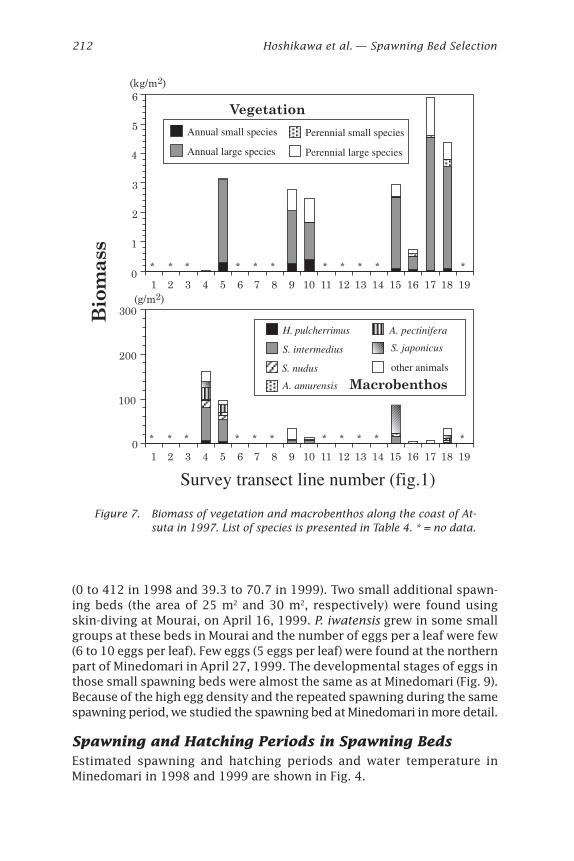
in 1997; Fig. 5) followed by Cystoseira hakodatensis and Phyllospadixiwatensis. These three accounted for 87.8% (1996) and 91.8% (1997) of thebiomass. Laminaria spp. was distributed in the exposed zone (e.g., theedge of platform), C. hakodatensis was found in the sheltered zone (likethe base of platform), and P. iwatensis was found in areas of intermediateexposure. The macrobenthos collected included sea urchins, abalone, star-fishes, crabs, snails, limpets and sea cucumbers (Table 4). The biomass ofvegetation was low (under 2.5 kg per m2) in the northern part and high (maxover 5 kg per m2) in the southern part along the coast of Atsuta in 1996 and1997 (Figs. 6 and 7). The reverse tendency was observed in the macrobenthos.The amount of macrobenthos was lower in the southern transects.
The topographic features of each line also changed. In the northernpart boulders covered the bottom, the slope was steeper, and the depthwas 3-5 m at 100 m and respectively 5-7 m at 200 m from shoreline. In thesouthern part of the study area a rock platform was well developed andthe slope was gentler with a depth less than 2 m at 100 m and 3.4-6.4 m at200 m from shore (Figs. 1, 2, and 3). Most macrobenthos inhabited depthsgreater than 2 m on the northern coast of Atsuta. However, there was asmall amount of macrobenthos at the same depth along the southern coast.
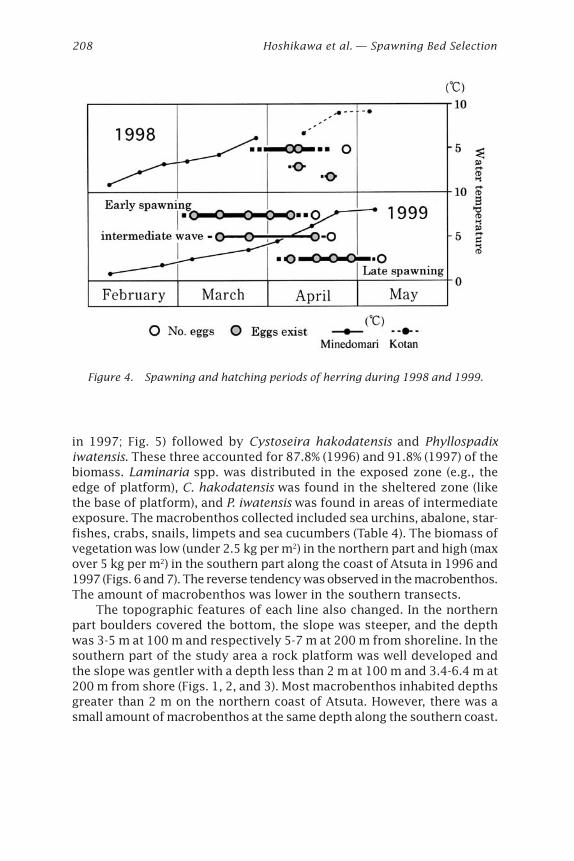
Figure 4. Spawning and hatching periods of herring during 1998 and 1999.
Herring: Expectations for a New Millennium 209
Distribution of Spawning BedsNo eggs were observed during field investigation in 1997 and 1998 instudy sites chosen in advance (Table 2). On April 14, 1997, Laminaria spp.was dominant in the samples (79.7% of wet weight) and P. iwatensis wasthe second dominant species (15.6%). On March 5, 1998 Laminaria spp.was also dominant (60.9% and the second dominant species was P. iwatensis(13.8%). In March 26, a lot of suspended matter was present in the waterand divers could not observe the bottom. Only 7.6 kg of seagrasses werecollected and P. iwatensis was the dominant species (70% in wet weight).
Some herring eggs attached to P. iwatensis were found washed up onthe shore at Kotan and Mourai in March 26, 1998, but no eggs were foundby skin divers in bottom areas nearby. A lot of eggs were found on P.iwatensis washed up on the shore of the south side of Minedomari, a dis-tance of about 70 m along the coast on April 9, 1998. Based on the skindiving observation near the shore, we found the high-density spawning
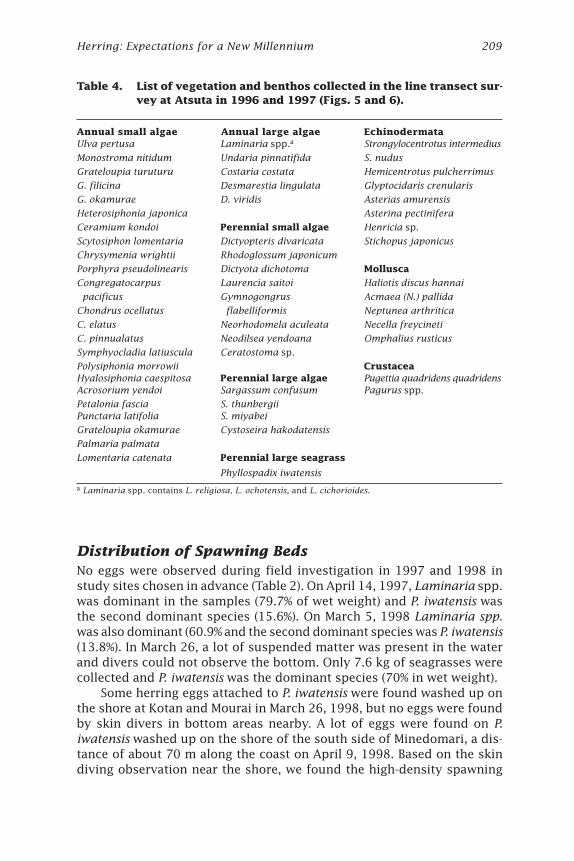
Table 4. List of vegetation and benthos collected in the line transect sur-vey at Atsuta in 1996 and 1997 (Figs. 5 and 6).
Annual small algae Annual large algae EchinodermataUlva pertusa Laminaria spp.a Strongylocentrotus intermedius
Monostroma nitidum Undaria pinnatifida S. nudus
Grateloupia turuturu Costaria costata Hemicentrotus pulcherrimus
G. filicina Desmarestia lingulata Glyptocidaris crenularis
G. okamurae D. viridis Asterias amurensis
Heterosiphonia japonica Asterina pectinifera
Ceramium kondoi Perennial small algae Henricia sp.
Scytosiphon lomentaria Dictyopteris divaricata Stichopus japonicus
Chrysymenia wrightii Rhodoglossum japonicum
Porphyra pseudolinearis Dictyota dichotoma Mollusca
Congregatocarpus Laurencia saitoi Haliotis discus hannai
pacificus Gymnogongrus Acmaea (N.) pallida
Chondrus ocellatus flabelliformis Neptunea arthritica
C. elatus Neorhodomela aculeata Necella freycineti
C. pinnualatus Neodilsea yendoana Omphalius rusticus
Symphyocladia latiuscula Ceratostoma sp.
Polysiphonia morrowii CrustaceaHyalosiphonia caespitosa Perennial large algae Pugettia quadridens quadridensAcrosorium yendoi Sargassum confusum Pagurus spp.
Petalonia fascia S. thunbergiiPunctaria latifolia S. miyabei
Grateloupia okamurae Cystoseira hakodatensis
Palmaria palmata
Lomentaria catenata Perennial large seagrass
Phyllospadix iwatensis
a Laminaria spp. contains L. religiosa, L. ochotensis, and L. cichorioides.
210 Hoshikawa et al. — Spawning Bed Selection
Laminaria spp.
Annual smallspecies
Other annuallarge species
Perennial small species
C. hakodatensis
P. iwatensis
Other perenniallarge species
Laminaria spp.
Annual smallspecies
Other annuallarge species
Perennialsmall species
C. hakodatensis
P. iwatensis
Other perenniallarge species
June 12, 1997
May 28 & 29, 1996
Figure 5. Species composition of vegetation in biomass.
Herring: Expectations for a New Millennium 211
beds at Minedomari. Herring spawned in exactly the same restricted areaalso in 1999. Eggs were found repeatedly during the spawning period in1999 (Figs. 2, 4, and 8).
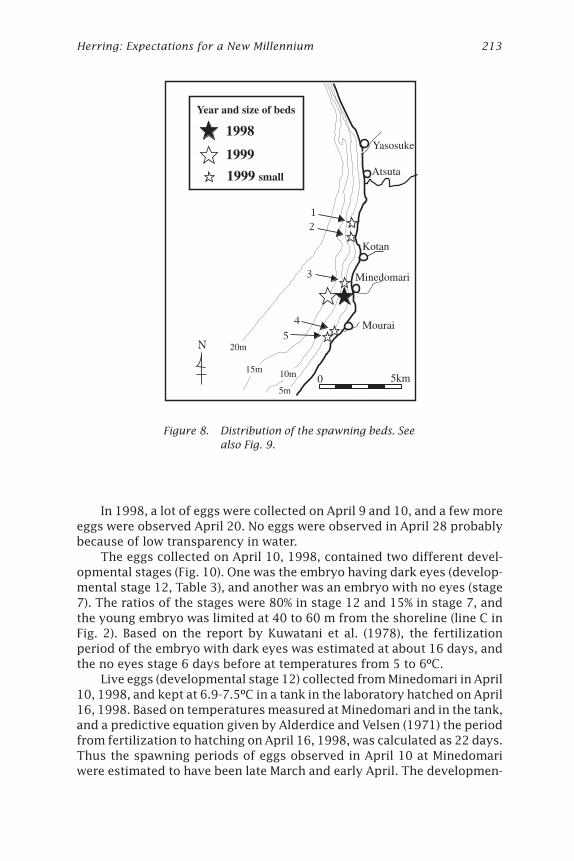
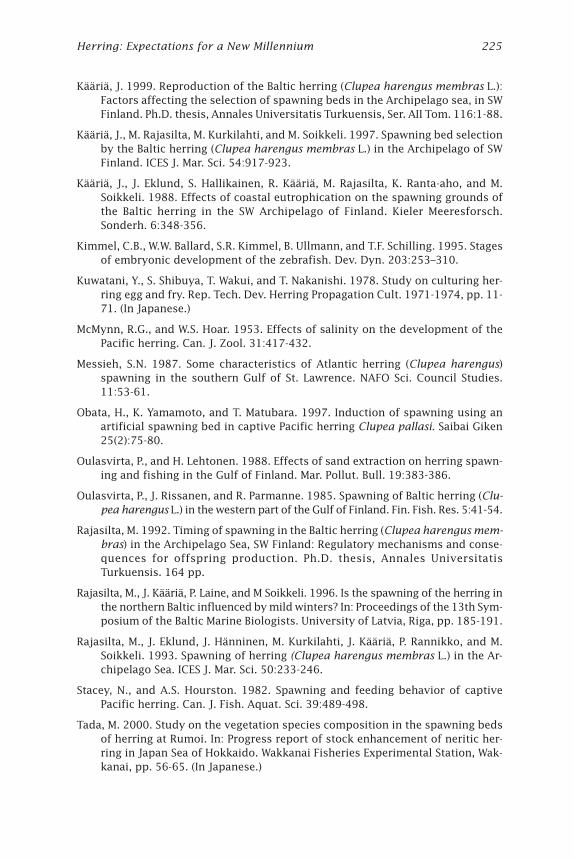
A lot of eggs attached to seagrass were also washed ashore north andsouth of Kotan on March 26, 1999 (Fig. 8). We found two relatively smallspawning beds in front of the sites where P. iwatensis with herring eggshad been washed up at the northern part of Kotan using scuba diving onApril 9, 1999 (Fig. 8). The area was 6,250 m2 (maximum depth was 1.7 m)and 450 m2 (maximum depth was 0.7 m). P. iwatensis was the main sub-stratum for eggs but some eggs were also attached to C. hakodatensis.Numbers of eggs per leaf of P. iwatensis in these beds were less (4 to 82eggs per leaf) than that on the main spawning beds found in Minedomari
1 2 3 4 5 6 7 8 9 10 11 12 13 14 15 16 17 18 19
Annual small species
Annual large species
Perennial small species
Perennial large species
1 2 3 4 5 6 7 8 9 10 11 12 13 14 15 16 17 18 19
H. pulcherrimus
S. intermedius
S. nudus
G. crenularis
H. discus hannai
A. amurensis
A. pectinifera
6
5
4
3
2
1
0
150
100
50
0
(kg/m2)
(g/m2)
Macrobenthos
VegetationBiomass
Survey transect line number (fig.1)
Figure 6. Biomass of vegetation and macrobenthos along the coast of At-suta in 1996. List of species is presented in Table 4.
212 Hoshikawa et al. — Spawning Bed Selection
(0 to 412 in 1998 and 39.3 to 70.7 in 1999). Two small additional spawn-ing beds (the area of 25 m2 and 30 m2, respectively) were found usingskin-diving at Mourai, on April 16, 1999. P. iwatensis grew in some smallgroups at these beds in Mourai and the number of eggs per a leaf were few(6 to 10 eggs per leaf). Few eggs (5 eggs per leaf) were found at the northernpart of Minedomari in April 27, 1999. The developmental stages of eggs inthose small spawning beds were almost the same as at Minedomari (Fig. 9).Because of the high egg density and the repeated spawning during the samespawning period, we studied the spawning bed at Minedomari in more detail.
Spawning and Hatching Periods in Spawning BedsEstimated spawning and hatching periods and water temperature inMinedomari in 1998 and 1999 are shown in Fig. 4.
1 2 3 4 5 6 7 8 9 10 11 12 13 14 15 16 17 18 19
1 2 3 4 5 6 7 8 9 10 11 12 13 14 15 16 17 18 19
* * * * * * * * * * *
* * * * * * * * * * *
300
200
100
0
6
5
4
3
2
1
0
Annual small species
Annual large species
Perennial small species
Perennial large species
S. japonicus
other animals
H. pulcherrimus
S. intermedius
S. nudus
A. amurensis
A. pectinifera
Survey transect line number (fig.1)
(kg/m2)
(g/m2)
Macrobenthos
VegetationBiomass
Figure 7. Biomass of vegetation and macrobenthos along the coast of At-suta in 1997. List of species is presented in Table 4. * = no data.
Herring: Expectations for a New Millennium 213
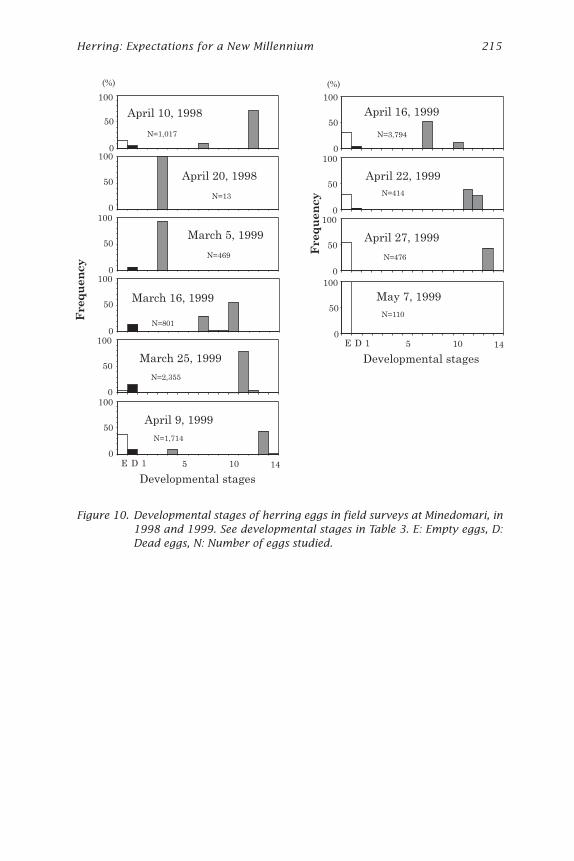
In 1998, a lot of eggs were collected on April 9 and 10, and a few moreeggs were observed April 20. No eggs were observed in April 28 probablybecause of low transparency in water.
The eggs collected on April 10, 1998, contained two different devel-opmental stages (Fig. 10). One was the embryo having dark eyes (develop-mental stage 12, Table 3), and another was an embryo with no eyes (stage7). The ratios of the stages were 80% in stage 12 and 15% in stage 7, andthe young embryo was limited at 40 to 60 m from the shoreline (line C inFig. 2). Based on the report by Kuwatani et al. (1978), the fertilizationperiod of the embryo with dark eyes was estimated at about 16 days, andthe no eyes stage 6 days before at temperatures from 5 to 6ºC.
Live eggs (developmental stage 12) collected from Minedomari in April10, 1998, and kept at 6.9-7.5ºC in a tank in the laboratory hatched on April16, 1998. Based on temperatures measured at Minedomari and in the tank,and a predictive equation given by Alderdice and Velsen (1971) the periodfrom fertilization to hatching on April 16, 1998, was calculated as 22 days.Thus the spawning periods of eggs observed in April 10 at Minedomariwere estimated to have been late March and early April. The developmen-
0 5km
N
Yasosuke
Atsuta
Kotan
Minedomari
Mourai
20m
15m 10m
5m
1998
1999
1999 small
Year and size of beds
1
2
3
4
5
Figure 8. Distribution of the spawning beds. Seealso Fig. 9.
214 Hoshikawa et al. — Spawning Bed Selection
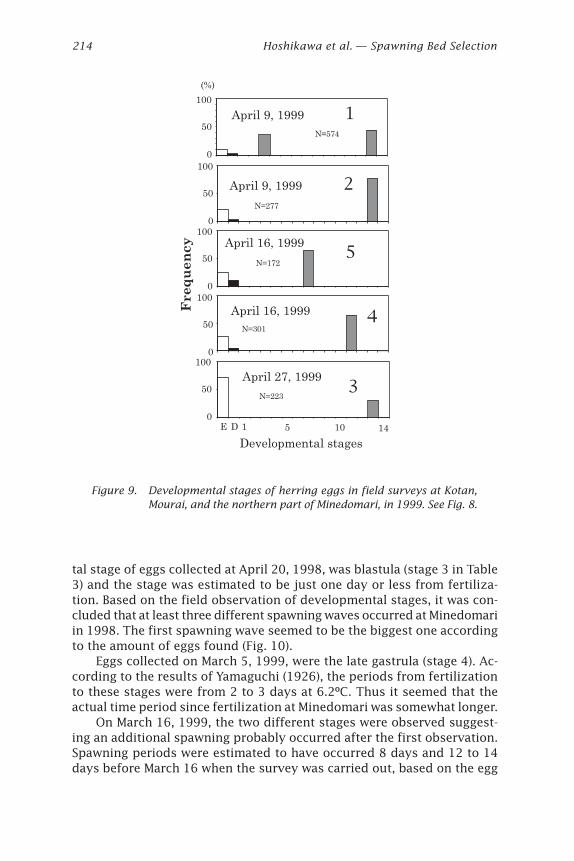
tal stage of eggs collected at April 20, 1998, was blastula (stage 3 in Table3) and the stage was estimated to be just one day or less from fertiliza-tion. Based on the field observation of developmental stages, it was con-cluded that at least three different spawning waves occurred at Minedomariin 1998. The first spawning wave seemed to be the biggest one accordingto the amount of eggs found (Fig. 10).
Eggs collected on March 5, 1999, were the late gastrula (stage 4). Ac-cording to the results of Yamaguchi (1926), the periods from fertilizationto these stages were from 2 to 3 days at 6.2ºC. Thus it seemed that theactual time period since fertilization at Minedomari was somewhat longer.
On March 16, 1999, the two different stages were observed suggest-ing an additional spawning probably occurred after the first observation.Spawning periods were estimated to have occurred 8 days and 12 to 14days before March 16 when the survey was carried out, based on the egg
Developmental stages
E D 5 10 141
100
0
50April 9, 1999
N=574
1
100
0
50April 9, 1999
N=277
2
100
0
50
April 16, 1999
N=3014
100
0
50N=172
April 16, 19995
100
0
50
April 27, 1999
N=2233
(%)
Frequency
Figure 9. Developmental stages of herring eggs in field surveys at Kotan,Mourai, and the northern part of Minedomari, in 1999. See Fig. 8.
Herring: Expectations for a New Millennium 215
100
0
50
100
0
50
100
0
50
100
0
50
100
0
50
100
0
50
April 10, 1998
April 20, 1998
March 5, 1999
N=1,017
N=469
March 16, 1999
N=801
March 25, 1999
N=2,355
April 9, 1999
N=1,714
100
0
50
100
0
50
100
0
50
100
0
50
Developmental stages
April 16, 1999
N=3,794
N=414
April 22, 1999
April 27, 1999
N=476
May 7, 1999
N=110
E D 5 10 141
(%)
Developmental stages
E D 5 10 141
Frequency
(%)Frequency
N=13
Figure 10. Developmental stages of herring eggs in field surveys at Minedomari, in1998 and 1999. See developmental stages in Table 3. E: Empty eggs, D:Dead eggs, N: Number of eggs studied.
216 Hoshikawa et al. — Spawning Bed Selection
development rate data of Kuwatani et al. (1978). Most of the embryosobserved on March 25 had eyes but no pigmentation or tails. The develop-mental stage was almost the same in that survey, compared to two differ-ent groups observed on March 16. It should be noted that samples werenot taken exactly in the same spots in the spawning bed.
On April 9, the larvae hatched with slight stimulation to the P. iwatensison which the eggs were attached. A lot of late gastrula stage eggs alsowere observed on the same day representing repeated spawning. Accord-ing to Yamaguchi (1926) and Fujita and Kokubo (1927), the time periodrequired to reach late gastrula stage was 2 to 3 days. The temperatureduring their experiments was higher than it was at Minedomari, and theactual period of egg development may have been somewhat longer.
Two different developmental stages were observed also on April 16,1999. A more developed group was spawned in early April, and a latergroup was spawned just after April 9. On April 22, there were also twodifferent groups corresponding to those groups observed on April 16. OnApril 27, empty eggs appeared and juveniles just hatching out were alsoobserved, and on May 7 no more living eggs were found. From these fieldobservations, we concluded that Pacific herring at Minedomari in 1999spawned primarily in early March and early April. Field observationsshowed that some spawning also occurred during mid-March and mid-April, but only a small numbers of eggs were produced. Hatching periodsof early spawning and late spawning groups were estimated as just afterApril 9 and 27, respectively.
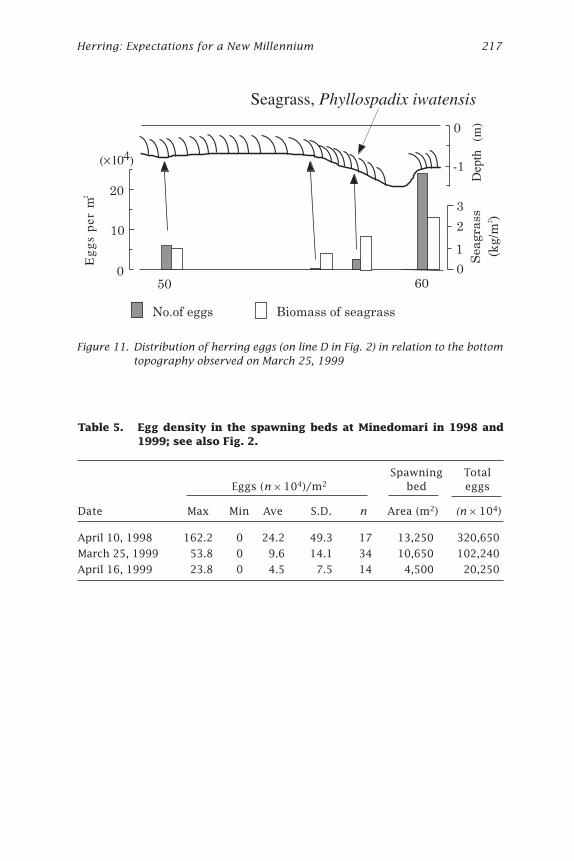
Egg Distribution in Spawning BedsThe distributions of eggs in the spawning bed at Minedomari on April 10,1998, and on March 25, April 16, and May 7, 1999, are shown in Figs. 2, 3,and 11.
On April 10, 1998, the area where eggs were observed was about 12,500m2 (Fig. 2). Eggs were more abundant in the middle of the bed at the edgeof the rocky platform or in the grooves on lines C, D, and E (Fig. 2). Eggswere found at depths from 0.5 to 3.0 m and seemed to be more abundantat sites shallower than 2 m (Fig. 3). Egg density ranged from 0 to 1,622,000per m2, with the average value of 242,000 per m2 (Table 5).
Laminaria spp. was dominant at Minedomari, but no eggs were foundon Laminaria spp. Eggs were attached mainly on P. iwatensis, which wasalso abundant in spawning beds, but they were also on C. hakodatensis. Asmall amount of eggs were also observed on small algae (Palmaria palmataand Mazzaella japonica).
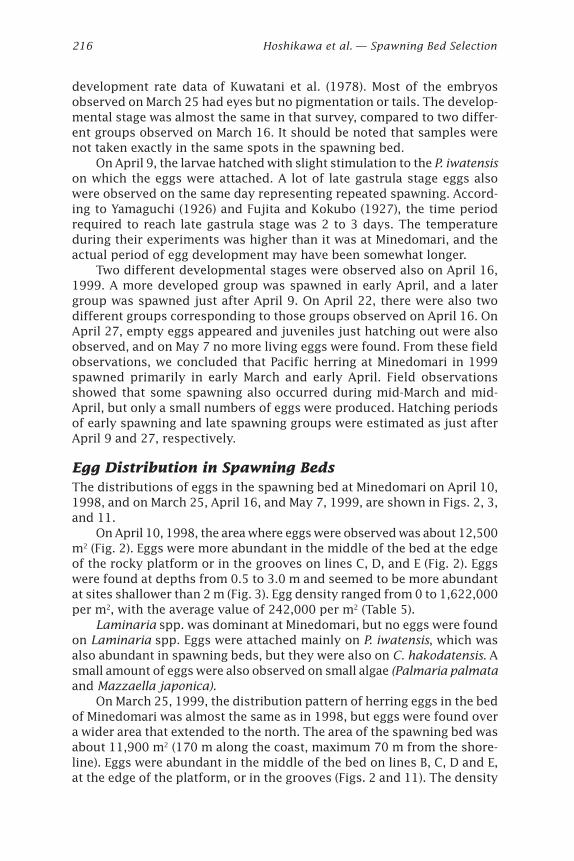
On March 25, 1999, the distribution pattern of herring eggs in the bedof Minedomari was almost the same as in 1998, but eggs were found overa wider area that extended to the north. The area of the spawning bed wasabout 11,900 m2 (170 m along the coast, maximum 70 m from the shore-line). Eggs were abundant in the middle of the bed on lines B, C, D and E,at the edge of the platform, or in the grooves (Figs. 2 and 11). The density
Herring: Expectations for a New Millennium 217
Figure 11. Distribution of herring eggs (on line D in Fig. 2) in relation to the bottomtopography observed on March 25, 1999
Table 5. Egg density in the spawning beds at Minedomari in 1998 and1999; see also Fig. 2.
Spawning Total Eggs (n ¥ 104)/m2 bed eggs
Date Max Min Ave S.D. n Area (m2) (n ¥ 104)
April 10, 1998 162.2 0 24.2 49.3 17 13,250 320,650
March 25, 1999 53.8 0 9.6 14.1 34 10,650 102,240
April 16, 1999 23.8 0 4.5 7.5 14 4,500 20,250
20
10
050 60
0
-1
Seagrass, Phyllospadix iwatensis
Dep
th(m
)
(¥ 104)
3
2
1
0
Seagra
ss
(kg/m
2 )
No.of eggs Biomass of seagrass
Eg
gs
per
m2
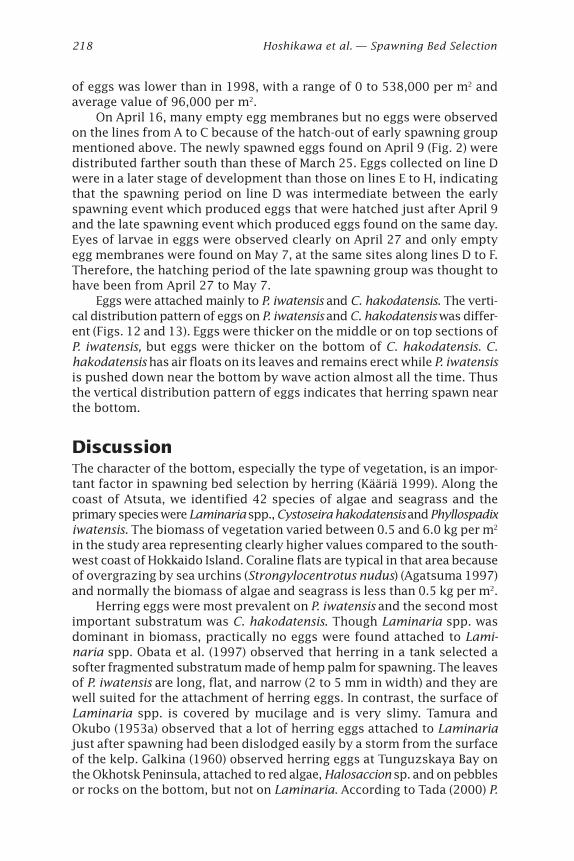
218 Hoshikawa et al. — Spawning Bed Selection
of eggs was lower than in 1998, with a range of 0 to 538,000 per m2 andaverage value of 96,000 per m2.
On April 16, many empty egg membranes but no eggs were observedon the lines from A to C because of the hatch-out of early spawning groupmentioned above. The newly spawned eggs found on April 9 (Fig. 2) weredistributed farther south than these of March 25. Eggs collected on line Dwere in a later stage of development than those on lines E to H, indicatingthat the spawning period on line D was intermediate between the earlyspawning event which produced eggs that were hatched just after April 9and the late spawning event which produced eggs found on the same day.Eyes of larvae in eggs were observed clearly on April 27 and only emptyegg membranes were found on May 7, at the same sites along lines D to F.Therefore, the hatching period of the late spawning group was thought tohave been from April 27 to May 7.
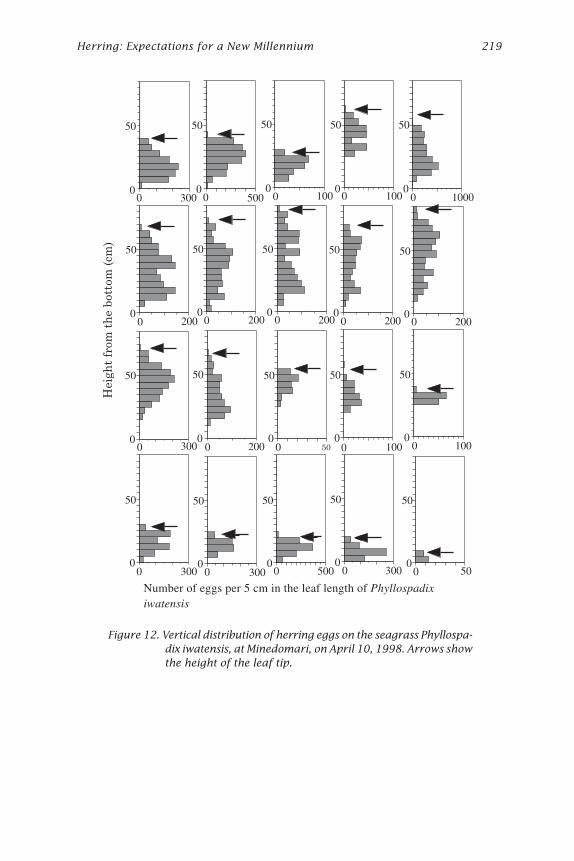
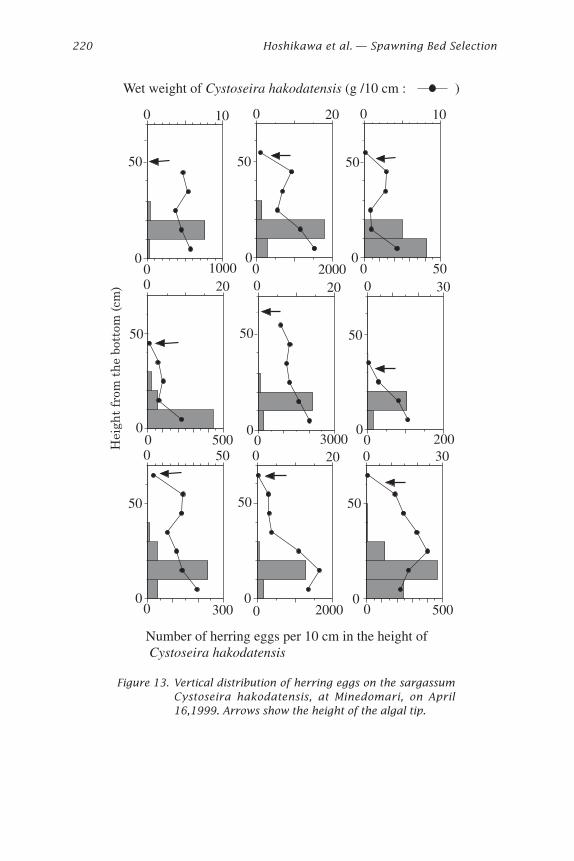
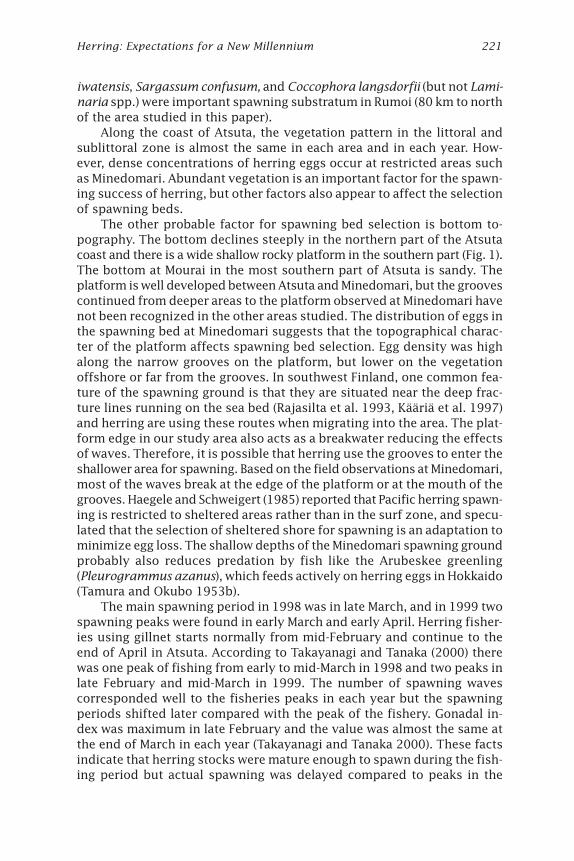
Eggs were attached mainly to P. iwatensis and C. hakodatensis. The verti-cal distribution pattern of eggs on P. iwatensis and C. hakodatensis was differ-ent (Figs. 12 and 13). Eggs were thicker on the middle or on top sections ofP. iwatensis, but eggs were thicker on the bottom of C. hakodatensis. C.hakodatensis has air floats on its leaves and remains erect while P. iwatensisis pushed down near the bottom by wave action almost all the time. Thusthe vertical distribution pattern of eggs indicates that herring spawn nearthe bottom.
DiscussionThe character of the bottom, especially the type of vegetation, is an impor-tant factor in spawning bed selection by herring (Kääriä 1999). Along thecoast of Atsuta, we identified 42 species of algae and seagrass and theprimary species were Laminaria spp., Cystoseira hakodatensis and Phyllospadixiwatensis. The biomass of vegetation varied between 0.5 and 6.0 kg per m2
in the study area representing clearly higher values compared to the south-west coast of Hokkaido Island. Coraline flats are typical in that area becauseof overgrazing by sea urchins (Strongylocentrotus nudus) (Agatsuma 1997)and normally the biomass of algae and seagrass is less than 0.5 kg per m2.
Herring eggs were most prevalent on P. iwatensis and the second mostimportant substratum was C. hakodatensis. Though Laminaria spp. wasdominant in biomass, practically no eggs were found attached to Lami-naria spp. Obata et al. (1997) observed that herring in a tank selected asofter fragmented substratum made of hemp palm for spawning. The leavesof P. iwatensis are long, flat, and narrow (2 to 5 mm in width) and they arewell suited for the attachment of herring eggs. In contrast, the surface ofLaminaria spp. is covered by mucilage and is very slimy. Tamura andOkubo (1953a) observed that a lot of herring eggs attached to Laminariajust after spawning had been dislodged easily by a storm from the surfaceof the kelp. Galkina (1960) observed herring eggs at Tunguzskaya Bay onthe Okhotsk Peninsula, attached to red algae, Halosaccion sp. and on pebblesor rocks on the bottom, but not on Laminaria. According to Tada (2000) P.
Herring: Expectations for a New Millennium 219
Number of eggs per 5 cm in the leaf length of Phyllospadixiwatensis
0
50
0 2000 3000
50
0
50
0 1000
50
0 1000
50
0 5000
50
0 3000
50
0 1000
0
50
0 2000
50
0 2000
50
0 2000
50
0 2000
50
0 200
0
50
0 500
50
0 1000
50
0 100
0
50
0 3000
50
0 3000
50
0 5000
50
0 3000
50
0 50
Heig
ht
from
th
e b
ott
om
(cm
)
Figure 12. Vertical distribution of herring eggs on the seagrass Phyllospa-dix iwatensis, at Minedomari, on April 10, 1998. Arrows showthe height of the leaf tip.
220 Hoshikawa et al. — Spawning Bed Selection
50
00 500
0 20
50
0
0 50
0 300
50
0
300
0 500
0 20
50
00 2000
0 30
0 200
50
0
0 20
0 3000
50
0
0 10
0 50
50
0
50
00 2000
0 20
50
0
0 10
0 1000
Wet weight of Cystoseira hakodatensis (g /10 cm : )
Number of herring eggs per 10 cm in the height of Cystoseira hakodatensis
Heig
ht
from
th
e b
ott
om
(cm
)
Figure 13. Vertical distribution of herring eggs on the sargassumCystoseira hakodatensis, at Minedomari, on April16,1999. Arrows show the height of the algal tip.
Herring: Expectations for a New Millennium 221
iwatensis, Sargassum confusum, and Coccophora langsdorfii (but not Lami-naria spp.) were important spawning substratum in Rumoi (80 km to northof the area studied in this paper).
Along the coast of Atsuta, the vegetation pattern in the littoral andsublittoral zone is almost the same in each area and in each year. How-ever, dense concentrations of herring eggs occur at restricted areas suchas Minedomari. Abundant vegetation is an important factor for the spawn-ing success of herring, but other factors also appear to affect the selectionof spawning beds.
The other probable factor for spawning bed selection is bottom to-pography. The bottom declines steeply in the northern part of the Atsutacoast and there is a wide shallow rocky platform in the southern part (Fig. 1).The bottom at Mourai in the most southern part of Atsuta is sandy. Theplatform is well developed between Atsuta and Minedomari, but the groovescontinued from deeper areas to the platform observed at Minedomari havenot been recognized in the other areas studied. The distribution of eggs inthe spawning bed at Minedomari suggests that the topographical charac-ter of the platform affects spawning bed selection. Egg density was highalong the narrow grooves on the platform, but lower on the vegetationoffshore or far from the grooves. In southwest Finland, one common fea-ture of the spawning ground is that they are situated near the deep frac-ture lines running on the sea bed (Rajasilta et al. 1993, Kääriä et al. 1997)and herring are using these routes when migrating into the area. The plat-form edge in our study area also acts as a breakwater reducing the effectsof waves. Therefore, it is possible that herring use the grooves to enter theshallower area for spawning. Based on the field observations at Minedomari,most of the waves break at the edge of the platform or at the mouth of thegrooves. Haegele and Schweigert (1985) reported that Pacific herring spawn-ing is restricted to sheltered areas rather than in the surf zone, and specu-lated that the selection of sheltered shore for spawning is an adaptation tominimize egg loss. The shallow depths of the Minedomari spawning groundprobably also reduces predation by fish like the Arubeskee greenling(Pleurogrammus azanus), which feeds actively on herring eggs in Hokkaido(Tamura and Okubo 1953b).
The main spawning period in 1998 was in late March, and in 1999 twospawning peaks were found in early March and early April. Herring fisher-ies using gillnet starts normally from mid-February and continue to theend of April in Atsuta. According to Takayanagi and Tanaka (2000) therewas one peak of fishing from early to mid-March in 1998 and two peaks inlate February and mid-March in 1999. The number of spawning wavescorresponded well to the fisheries peaks in each year but the spawningperiods shifted later compared with the peak of the fishery. Gonadal in-dex was maximum in late February and the value was almost the same atthe end of March in each year (Takayanagi and Tanaka 2000). These factsindicate that herring stocks were mature enough to spawn during the fish-ing period but actual spawning was delayed compared to peaks in the
222 Hoshikawa et al. — Spawning Bed Selection
herring fishery and spawning beds were limited to the shallower area inAtsuta as mentioned before. Thus it seems that the opportunity to entersuch shallower area for spawning is limited by the wave condition andtopographical features.
The spatial distribution of eggs laid in the second spawning didn’toverlap with that of the first spawning in 1999. Avoiding the overlap ofspawning beds among spawning waves reduced the layers of eggs in eachblocks. Haegele et al. (1981) indicated that herring distinguish betweenthe differences of substratum types. Hay (1985) suggested the possibilitythat herring could distinguish the herring eggs on the substratum. There-fore, it is possible that the late spawning wave identified the eggs spawnedby the early wave and avoided these by shifting to a more southern area.
Egg densities varied from several hundred to a maximum of 1.6 mil-lion per square meter and the egg mortality was under 18% in every samplestudied. In the study area the total amount of herring caught in 1998 was32.4 t and consisted of almost entirely of 2-year-old fishes, while the amountof fish was 56.8 t in 1999, consisting of 3-year-old (early peak) and 2-year-old (late peak) fishes (Takayanagi and Tanaka 2000). Size of later shoalswas smaller than earlier ones in 1999 (Takayanagi and Tanaka 2000) andthe total amount of fish in the later wave was also lower than in the earlierspawning wave. The difference between early and late stocks would bethe main reason for the small amount of eggs in the late spawning wave in1999. The maximum density of eggs in 1998 was higher than 1999, butthe size of herring was smaller than that of the early wave in 1999 becauseof younger age composition. So it seemed that a higher amount of herringconcentrated to spawn at Minedomari in 1998.
Food supply and temperature prior to the spawning period are con-sidered the most important factors in the control of spawning time (Aneer1985, Hay and Brett 1988, Rajasilta 1992, Rajasilta et al. 1996). The tem-perature during the spawning period in 1998 was about 1ºC in early Feb-ruary, and rose to 5ºC in late March or early April and in late April it was 8to 9ºC. Although the start of spawning in 1999 was earlier than in 1998,the reason seemed to be the difference of the fishing peak as mentionedabove. The temperature during spawning season in 2-year-old herring inboth years was approximately 5ºC.
In 1999, we found five additional small spawning beds besidesMinedomari. Because the developmental stage of eggs in such small bedswas the same as found at Minedomari, spawning time of each bed wasalso about the same. It is considered that the water temperature affectsthe period from fertilization to hatching (Alderdice and Velsen 1971,Kuwatani et al. 1978). The reason that eggs disappeared in late April 1998was an early hatching period related to the higher temperature in 1998.The period from spawning to hatching in each wave in 1999 was about 40days and 30 days respectively. So, eggs from late spawning would hatchout after a shorter period because of higher temperature.
Herring: Expectations for a New Millennium 223
Herring spawn in shallow areas (under 2 m) along the coast of Atsuta.In many other important spawning beds eggs have also been found inshallow areas (e.g., Hay 1985, Kääriä et al. 1988, Oulasvirta and Lehtonen1988, Aneer 1989, Rajasilta et al. 1993). According to Tamura et al. (1953a1954 and 1955) the depth of spawning beds for Hokkaido-Sakhalin her-rings was usually deeper than 4 m. Rajasilta et al. (1993) discussed thereason why spawning of Baltic herring takes place in shallow water inrelation with egg-hatching success. They said that spawning in shallowwater reduced the incubation time as temperature rises faster in spring.Also, in our study area vegetation as spawning substratum is limited inshallower areas because of overgrazing by sea urchins after the 1960s(Agatsuma 1997) and sand cover on the bottom in the southern part ofAtsuta. Tamura et al. (1953a, 1954, 1955) observed that herring spawnednot only on vegetation but also on pebbles and rocks. In our study, her-ring spawned only on vegetation in Atsuta. However, we have insufficientdata to discuss whether preference for the substratum differs betweenthe Hokkaido-Sakhalin herring and Ishikari Bay herring.
The effect of low salinity on the fertilization and hatching success ofherring has been studied by Alderdice and Velsen (1971), Kuwatani et al.(1978) and Griffin et al. (1998). These studies show that in Pacific herring,fertilization, survival rates to yolk sac absorption, and hatching rate werehigher in optimum salinity (between 16 and 24 psu). Since salinity pre-sumably varies along a gradient from north to south in Atsuta in relationto the location of the Ishikari and small rivers, it is necessary in the futureto survey the salinity continuously in spawning beds. Although the topo-graphic characteristics are thought to be important to the spawning bedselection of herring in relation with wave condition, there are no data onhow wave height or bottom current speed is possibly related the spawn-ing behavior of herring. Surveying these environmental factors during thespawning season could help us to understand why in one of these re-stricted areas in Minedomari herring spawned year after year in exactlythe same spawning bed.
AcknowledgmentsThe authors thank the staff of the Ishikari fishery extension office for helpduring field studies at Atsuta. We also thank Dr. R. Stephenson and oneanonymous reviewer for helpful comments on the manuscript. We arealso grateful to Dr. Juha Kääriä for a critical review of the manuscript andfor valuable comments. This research was funded by the project “StockEnhancement of Neritic Herring in Japan Sea of Hokkaido” of the Hokkaidoprefectural government.
224 Hoshikawa et al. — Spawning Bed Selection
ReferencesAgatsuma, Y. 1997. Ecological studies on the population dynamics of the sea urchin
Strongylocentrotus nudus. Sci. Rep. Hokkaido Fish. Exp. Stn. 51:1-66.
Alderdice, D.F., and F.P.J. Velsen. 1971. Some effects of salinity and temperature onearly development of Pacific herring (Clupea pallasi ) . J. Fish. Res. Board Can.28:1545-1562.
Aneer, G. 1985. Some speculations about the Baltic herring (Clupea harengus mem-bras) in connection with the eutrophication of the Baltic Sea. Can. J. Fish. Aquat.Sci. 42:83-90.
Aneer, G. 1989. Herring (Clupea harengus L.) spawning and spawning ground char-acteristics in the Baltic Sea. Fish. Res. 8:169-195.
Aneer, G., G. Florell, U. Kautsky, S. Nellbring, and L. Sjostedt. 1983. In-situ observa-tions of Baltic herring (Clupea harengus membras) spawning behaviour in Asko-landsort area, northern Baltic proper. Mar. Biol. 74:105-110.
Fujita, T. and S. Kokubo. 1927. Studies on herring. Bull. School of Fish. HokkaidoUniv. 1(1):1-127.
Galkina, L.A. 1959. Reproduction of herring in Gizhiga Bay. Izvest. Pac. Inst. Fish.Oceanogr. (TINRO) 47:86-99. (Transl. by the Fisheries Agency of Jap. Govern.3:63-87, 1967.)
Galkina, L.A. 1960. Reproduction and development of Okhotsk herring. Izvest. Pac.Inst. Fish. Oceanogr. (TINRO) 46:3-40. (Transl. by the Fisheries Agency of Jap.Govern. 3:1-62, 1967.)
Griffin, F., M. Pillai, C. Vines, J. Kääriä, T. Hibbard-Robbins, R. Yanagimachi, andG.N. Cherr. 1998. Effects of salinity on sperm motility, fertilization, and devel-opment in the Pacific herring, Clupea pallasi. Biol. Bull. 194:25-35.
Haegele, C.W., and J.F. Schweigert. 1985. Distribution and characteristics of herringspawning grounds and description of spawning behavior. Can. J. Fish. Aquat.Sci. 42:39-55.
Haegele C.W., R.D. Humphrey, and A.S. Hourston. 1981. Distribution of eggs bydepth and vegetation type in Pacific herring (Clupea harengus pallasi ) spawn-ing in southern British Columbia. Can. J. Fish. Aquat. Sci. 38:381-386.
Hay, D.E. 1985. Reproductive biology of Pacific herring (Clupea harengus pallasi ) .Can. J. Fish. Aquat. Sci. 42:111-126.
Hay, D.E., and J.R. Brett. 1988. Maturation and fecundity of Pacific herring (Clupeaharengus pallasi ) : An experimental study with comparisons to natural popu-lations. Can. J. Fish. Aquat. Sci. 45:399-406.
Hay, D.E., and P.B. McCarter. 1997. Larval distribution, abundance, and stock struc-ture of British Columbia herring. J. Fish Biol. 51:155-175.
Hourston, A.S., and H. Rosenthal. 1976. Sperm density during active spawning ofPacific herring (Clupea harengus pallasi ) . J. Fish. Res. Board Can. 33:1788-1790.
Herring: Expectations for a New Millennium 225
Kääriä, J. 1999. Reproduction of the Baltic herring (Clupea harengus membras L.):Factors affecting the selection of spawning beds in the Archipelago sea, in SWFinland. Ph.D. thesis, Annales Universitatis Turkuensis, Ser. AII Tom. 116:1-88.
Kääriä, J., M. Rajasilta, M. Kurkilahti, and M. Soikkeli. 1997. Spawning bed selectionby the Baltic herring (Clupea harengus membras L.) in the Archipelago of SWFinland. ICES J. Mar. Sci. 54:917-923.
Kääriä, J., J. Eklund, S. Hallikainen, R. Kääriä, M. Rajasilta, K. Ranta-aho, and M.Soikkeli. 1988. Effects of coastal eutrophication on the spawning grounds ofthe Baltic herring in the SW Archipelago of Finland. Kieler Meeresforsch.Sonderh. 6:348-356.
Kimmel, C.B., W.W. Ballard, S.R. Kimmel, B. Ullmann, and T.F. Schilling. 1995. Stagesof embryonic development of the zebrafish. Dev. Dyn. 203:253–310.
Kuwatani, Y., S. Shibuya, T. Wakui, and T. Nakanishi. 1978. Study on culturing her-ring egg and fry. Rep. Tech. Dev. Herring Propagation Cult. 1971-1974, pp. 11-71. (In Japanese.)
McMynn, R.G., and W.S. Hoar. 1953. Effects of salinity on the development of thePacific herring. Can. J. Zool. 31:417-432.
Messieh, S.N. 1987. Some characteristics of Atlantic herring (Clupea harengus)spawning in the southern Gulf of St. Lawrence. NAFO Sci. Council Studies.11:53-61.
Obata, H., K. Yamamoto, and T. Matubara. 1997. Induction of spawning using anartificial spawning bed in captive Pacific herring Clupea pallasi. Saibai Giken25(2):75-80.
Oulasvirta, P., and H. Lehtonen. 1988. Effects of sand extraction on herring spawn-ing and fishing in the Gulf of Finland. Mar. Pollut. Bull. 19:383-386.
Oulasvirta, P., J. Rissanen, and R. Parmanne. 1985. Spawning of Baltic herring (Clu-pea harengus L.) in the western part of the Gulf of Finland. Fin. Fish. Res. 5:41-54.
Rajasilta, M. 1992. Timing of spawning in the Baltic herring (Clupea harengus mem-bras) in the Archipelago Sea, SW Finland: Regulatory mechanisms and conse-quences for offspring production. Ph.D. thesis, Annales UniversitatisTurkuensis. 164 pp.
Rajasilta, M., J. Kääriä, P. Laine, and M Soikkeli. 1996. Is the spawning of the herring inthe northern Baltic influenced by mild winters? In: Proceedings of the 13th Sym-posium of the Baltic Marine Biologists. University of Latvia, Riga, pp. 185-191.
Rajasilta, M., J. Eklund, J. Hänninen, M. Kurkilahti, J. Kääriä, P. Rannikko, and M.Soikkeli. 1993. Spawning of herring (Clupea harengus membras L.) in the Ar-chipelago Sea. ICES J. Mar. Sci. 50:233-246.
Stacey, N., and A.S. Hourston. 1982. Spawning and feeding behavior of captivePacific herring. Can. J. Fish. Aquat. Sci. 39:489-498.
Tada, M. 2000. Study on the vegetation species composition in the spawning bedsof herring at Rumoi. In: Progress report of stock enhancement of neritic her-ring in Japan Sea of Hokkaido. Wakkanai Fisheries Experimental Station, Wak-kanai, pp. 56-65. (In Japanese.)
226 Hoshikawa et al. — Spawning Bed Selection
Takayanagi, S., and N. Tanaka. 2000. Basic study on the resource management. In:Progress report of stock enhancement of neritic herring in Japan Sea of Hok-kaido. Wakkanai Fisheries Experimental Station, Wakkanai, pp. 106-158. (InJapanese.)
Tamura, T., and S. Okubo. 1953a. Some observations on the natural spawning ofthe spring herring in the western coast of Hokkaido. Sci. Rep. Hokkaido FishHatchery 8:21-32.
Tamura, T., and T. Okubo. 1953b. Study on the food of Atkafish (Pleurogrammusazonus Jordan & Mets) caught on the breeding ground of herring in Hokkaido.Sci. Rep. Hokkaido Fish Hatchery 7:93-103.
Tamura, T., S. Ohigashi, and T. Hirobe. 1955. Some observations on the naturalspawning of the spring herring in the western coast of Hokkaido, III. Fishingcondition of spring herring in 1955 and underwater observations on the natu-ral spawning ground of the herring at Tomamai. Sci. Rep. Hokkaido Fish Hatch-ery 10:115-131.
Tamura, T., S. Okubo, T. Fujita, and T. Hirobe. 1954. Some observations on thenatural spawning of the spring herring in the western coast of Hokkaido, II.Observations made by diving into water on the natural spawning ground ofthe herrings. Sci. Rep. Hokkaido Fish Hatchery 9:95-112.
Tanaka, I. 1991. Long-term changes of coastal sea temperature on the west coast ofHokkaido, Japan, with respect to herring resources. In: T. Kawasaki, S. Tanaka,Y. Toba, and A. Taniguchi (eds.), Long-term variability of pelagic fish popula-tions and their environment. Pergamon Press, Oxford, pp. 395-396.
Tyurnin, B.V. 1973. The spawning range of Okhotsk herring. Proc. Pacific Inst. Fish.Oceanogr. 86:12-21. (Translated by the Transl. Bur., Dept. of the Secretary ofState, Canada.)
Yamaguchi, M. 1926. Study on the habit of herring. Fisheries Research Report 17.280 pp. (In Japanese.)
Herring: Expectations for a New Millennium 227Alaska Sea Grant College Program • AK-SG-01-04, 2001
Relationship between Dateof Hatching and Growth ofHerring Larvae and Juvenilesin Ishikari BayRyotaro Ishida, Masayoshi Sasaki,Shiro Takayanagi, and Hideo YoshidaHokkaido Central Fisheries Experimental Station, Hokkaido, Japan
AbstractAs the first step to investigate the causes of fluctuation in the Ishikari Bayherring stock, the growth of larvae and juveniles was examined by otolithanalysis. Herring larvae and juveniles of the Ishikari Bay population werecollected from the west coast of Hokkaido, Japan, from May through Julyin 1998 and 1999. Daily increment formation was verified in the labora-tory by comparing the number of increments between alizarin complex-ion (ALC) marking on the 19th and 33rd day after hatching. A linearrelationship (Y = 0.935X – 8.14) fitted between the actual age and the num-ber of increments indicated that the first increment was formed on day 8after hatching. This is similar to a previous report on the Pacific herring(Moksness and Wespestad 1989).
Peaks in the estimated day of hatching of wild herring larvae and ju-veniles have shown good agreement with results of direct research byscuba diving for in situ observations of herring eggs at Atsuta (Hoshikawaet al. 2001). This indicates that larvae and juveniles originated from theeggs spawned around Atsuta.
The relationship between the days after hatching and the standardlength showed that growth of the late-hatched group was faster than theearly-hatched group. The larvae and juveniles that experienced highertemperatures grew faster.
228 Ishida et al. — Hatching Date and Herring Growth
IntroductionThe herring in Ishikari Bay are considered to be oceanic herring whichspawn in Ishikari Bay and have a small migration area (Kobayashi et al.1990, Kobayashi 1993).
In the coastal waters of Ishikari Bay, the annual landing of maturedherring between 1985 and 1996 ranged from 1 to 4 t, but in 1997 mark-edly increased to 24.8 t and thereafter gradually increased (41.1 and 87.6 tin 1998 and 1999, respectively). Takayanagi et al. (1998) suggested thatthe marked increase of Ishikari Bay herring in landings since 1997 mightbe due to the occurrence of strong year class.
This herring grows faster than other populations in the Japan Sea andreaches sexual maturity in 2 years after hatching (Ishida et al. 1997). It islikely that the year-class strength is determined within a short period afterhatching. However, very little is known of the early life history of the IshikariBay herring stock. A recent study on the distribution of the Ishikari Bay her-ring larvae and juveniles made it possible to study the growth of larvaeand juveniles.
For the first step to investigate the causes of the Ishikari Bay herringstock fluctuation, the growth of larvae and juveniles was examined by otolithanalysis. Moksness and Wespestad (1989) reported that otolith incrementsof the Pacific herring were formed on a daily basis from the end of theyolk-sac stage (age 8 days). The daily otolith increments, however, may beinfluenced by water temperature, genetic differences, and conditions ofthe otolith observations such as the magnification and investigator(Campana and Moksness 1991). We also investigated the relationship be-tween the number of increments and the actual ages of Ishikari Bay her-ring larvae in a laboratory experiment.
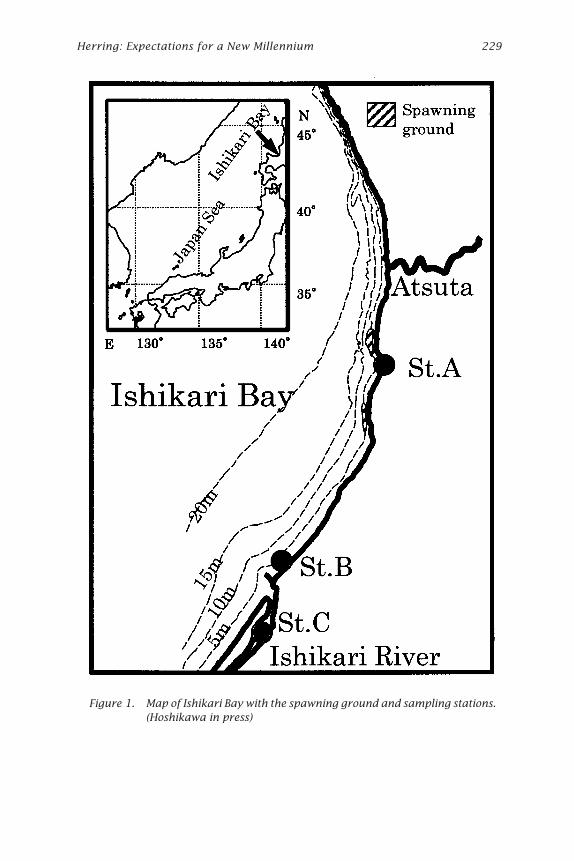
Materials and MethodsValidation of Otolith Daily IncrementSpawning herring were collected in Atsuta, Hokkaido, Japan on 25 February1997 (Fig. 1). Herring eggs were artificially fertilized at the Ishikari FisheriesExtension Office. They were transported to the Hokkaido Central FisheriesExperimental Station in Yoichi, Japan and incubated in an indoor tank witha running filtered seawater supply at temperatures between 5.4º and 5.8ºC.Larvae hatched on 25 March 1997. They were divided into two 100-liter open-system tanks and fed a continuous supply of rotifers and Artemia en-riched with omega-3 highly unsaturated fatty acid (HUFA) and beta-carotene.
Water temperature was maintained at 5-12ºC to be much the same asthe temperature of coastal Yoichi, which approximates the temperature ofthe spawning ground in Atsuta.
On 13 and 27 April, 19 and 33 days after hatching, respectively, larvae inone of the two tanks were immersed in 200 mg per liter ALC solution for 24hours. After ALC treatment, 10 larvae were sampled and ALC marking on the
Herring: Expectations for a New Millennium 229
Figure 1. Map of Ishikari Bay with the spawning ground and sampling stations.(Hoshikawa in press)
230 Ishida et al. — Hatching Date and Herring Growth
edge of the sagittae was confirmed. Fifty larvae were sacrificed on days 6,7, 17, 19, 33, and 36 after hatching and immediately preserved in 70%ethanol. Larvae sampled on days 19 and 33 after hatching were used forthe otolith analysis.
Wild Herring Larvae and JuvenilesThe Ishikari Bay herring larvae and juveniles were collected from IshikariBay on the west coast of Hokkaido during April to July of 1998 and 1999(Fig.1) and were preserved in 70% ethanol immediately after capture.
Sampling information on the larvae and juveniles used on this study isshown in Table 1. At Station A, samples were collected with a fish-attractinglight and hand net at nighttime. Samples at stations B and C were obtainedfrom Sasaki et al. (2001). Although the study of Sasaki et al. (2001) covered alarge area and was conducted over a long period, only samples that caughtover 31 individuals in a day were used for this study. Methods for collec-tion of samples at stations B and C are reported by Sasaki et al. (2001).
Preparation for Otolith AnalysisMore than 6 weeks after capture, the body length (standard length, SL) ofeach larva were measured to the nearest 0.01 mm and the largest otoliths(the sagittae) from each larva were removed and mounted with the convexside up in clear nail varnish on a glass slide. Otoliths of herring over 22mm SL were polished with aluminum oxide lapping films (60-0.3 mm gritsize) to expose increments on a Ziess compound microscope at ¥1,600magnification. ALC markings in otoliths were observed under an ultravio-let light. Increments were counted using a video system. Aging of field-caught juveniles over 60 mm SL became difficult to determine.
Artificially inseminated herring juveniles (to approximately 62 mmSL) reared using ALC solution on day 0 or 10 after hatching have beenreleased from Atsuta since 1996 for restocking and investigation of themigration of herring larvae and juveniles. Numbers of herring juveniles(¥10,000) and release dates were: 16.1 on 14 June 1996; 24.8 during 16-24June 1997; 74.3 during 16-17 June 1998; and 116.8 during 27 May-14 June1999. We could distinguish between wild and artificially inseminated fishesby observation of the ALC markings on the otoliths.
Water Temperature of Coastal Ishikari BayWater temperature of coastal Ishikari Bay at the spawning ground is givenin Hoshikawa et al. (2001).
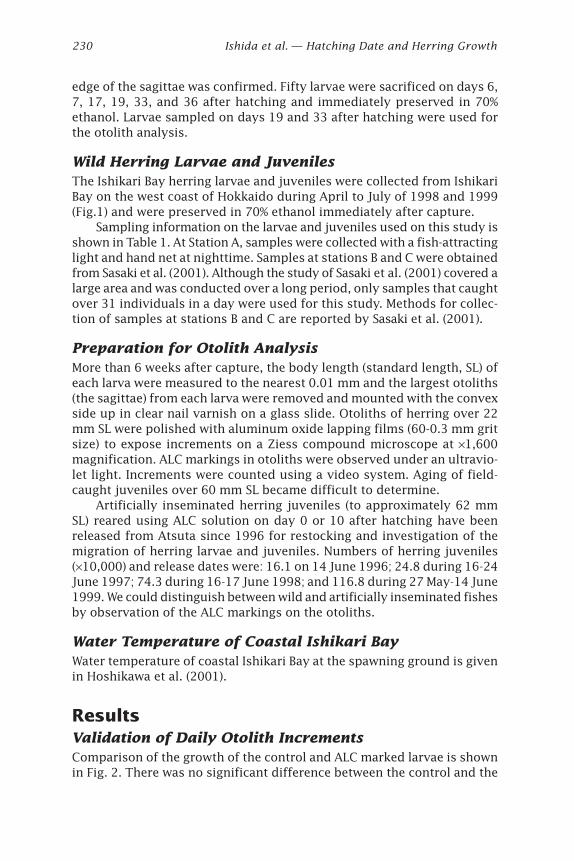
ResultsValidation of Daily Otolith IncrementsComparison of the growth of the control and ALC marked larvae is shownin Fig. 2. There was no significant difference between the control and the
Herring: Expectations for a New Millennium 231
Table 1. Sampling gear, average standard length (SL), and number of wildherring caught at Atsuta, Hokkaido, Japan.
Average SL Number ofStation Gear Sampling date (mm) S.D. (mm) fish caught
A Fish-attracting 26 May 1998 22.5 3.1 28
light
B Beach seine 25 Jun 1998 39.6 2.6 1,999
C Set net 26 Jun 1998 52.3 4.6 68
C Set net 4 Jul 1998 55.5 4.5 31
C Set net 7 Jul 1998 60.7 4.7 173
A Fish-attracting 11 Jun 1999 29.4 4.2 128
light
B Beach seine 24 Jun 1999 39.2 2.6 123
B Beach seine 2 Jul 1999 41.0 2.7 1,665
B Beach seine 8 Jul 1999 45.4 2.2 2,777
C Set net 3 Jul 1999 55.5 3.5 1,244
C Set net 13 Jul 1999 60.9 4.3 67
ALC marked larvae (t-test, t = 0.77, d.f. = 248), indicating that there was noeffect of the ALC treatment on growth.
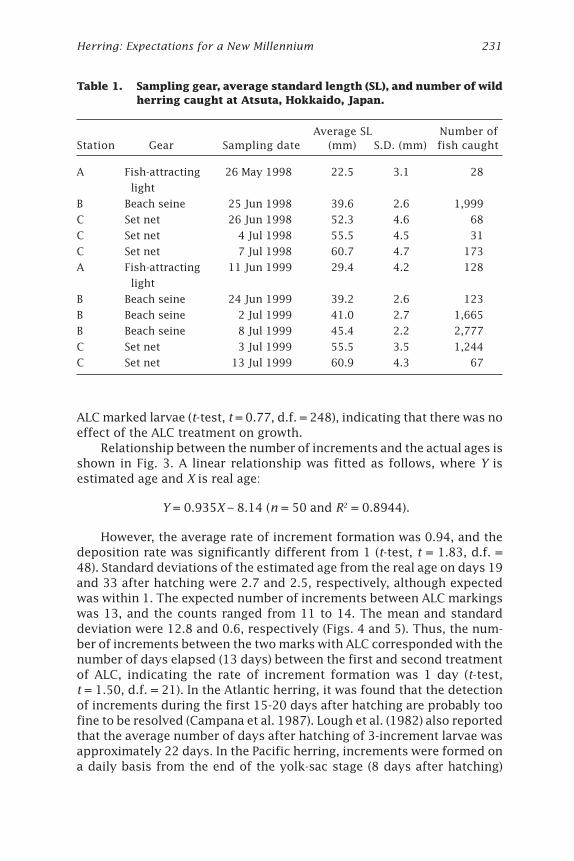
Relationship between the number of increments and the actual ages isshown in Fig. 3. A linear relationship was fitted as follows, where Y isestimated age and X is real age:
Y = 0.935X – 8.14 (n = 50 and R2 = 0.8944).
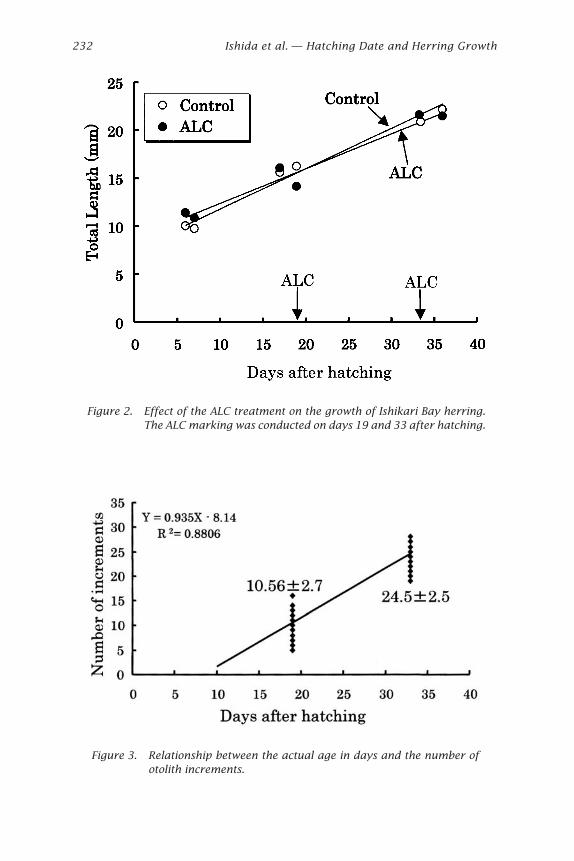
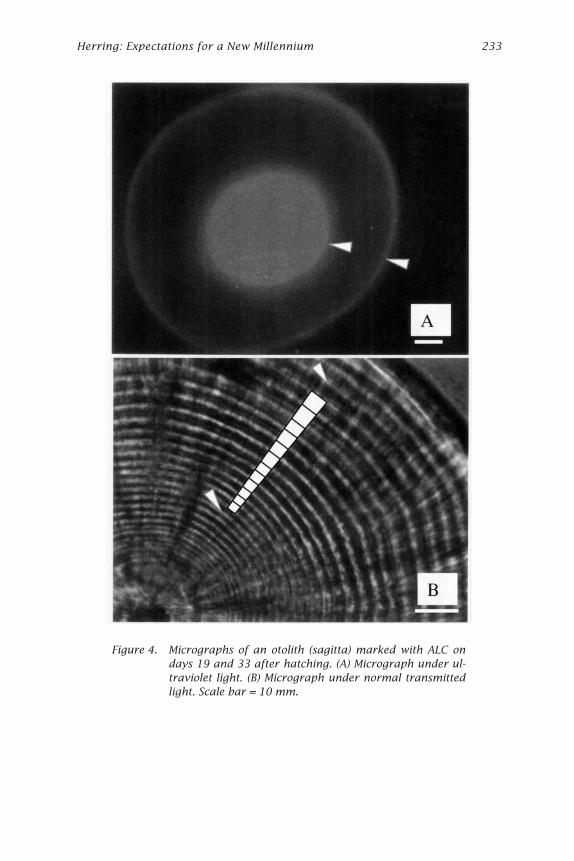
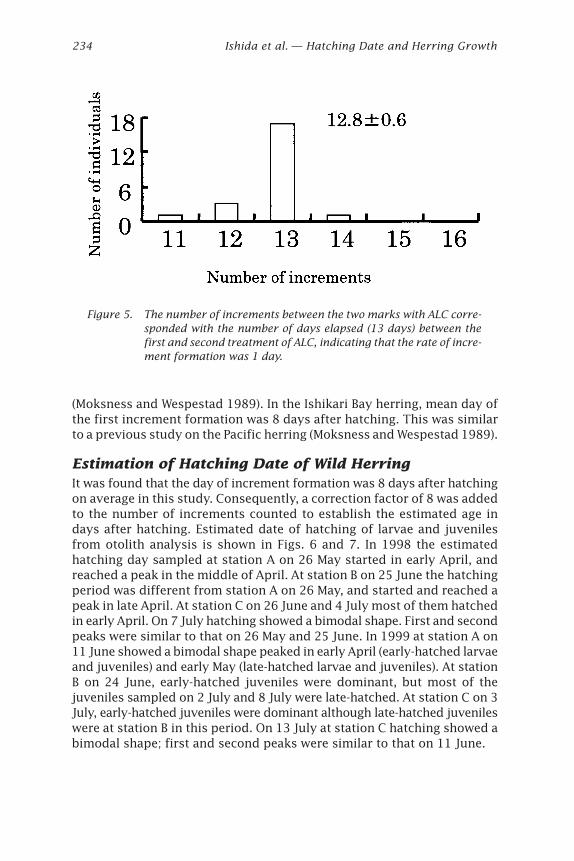
However, the average rate of increment formation was 0.94, and thedeposition rate was significantly different from 1 (t-test, t = 1.83, d.f. =48). Standard deviations of the estimated age from the real age on days 19and 33 after hatching were 2.7 and 2.5, respectively, although expectedwas within 1. The expected number of increments between ALC markingswas 13, and the counts ranged from 11 to 14. The mean and standarddeviation were 12.8 and 0.6, respectively (Figs. 4 and 5). Thus, the num-ber of increments between the two marks with ALC corresponded with thenumber of days elapsed (13 days) between the first and second treatmentof ALC, indicating the rate of increment formation was 1 day (t-test,t = 1.50, d.f. = 21). In the Atlantic herring, it was found that the detectionof increments during the first 15-20 days after hatching are probably toofine to be resolved (Campana et al. 1987). Lough et al. (1982) also reportedthat the average number of days after hatching of 3-increment larvae wasapproximately 22 days. In the Pacific herring, increments were formed ona daily basis from the end of the yolk-sac stage (8 days after hatching)
232 Ishida et al. — Hatching Date and Herring Growth
Figure 2. Effect of the ALC treatment on the growth of Ishikari Bay herring.The ALC marking was conducted on days 19 and 33 after hatching.
Figure 3. Relationship between the actual age in days and the number ofotolith increments.
Herring: Expectations for a New Millennium 233
Figure 4. Micrographs of an otolith (sagitta) marked with ALC ondays 19 and 33 after hatching. (A) Micrograph under ul-traviolet light. (B) Micrograph under normal transmittedlight. Scale bar = 10 mm.
234 Ishida et al. — Hatching Date and Herring Growth
(Moksness and Wespestad 1989). In the Ishikari Bay herring, mean day ofthe first increment formation was 8 days after hatching. This was similarto a previous study on the Pacific herring (Moksness and Wespestad 1989).
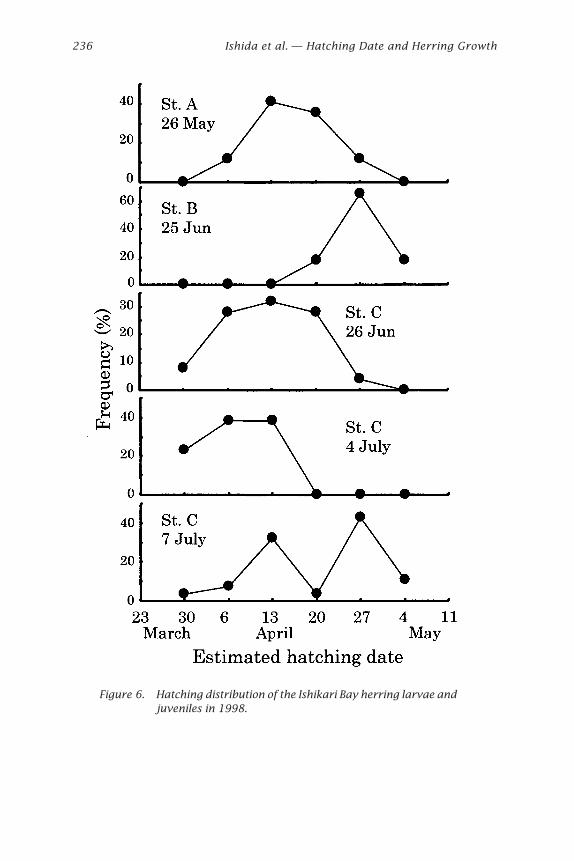
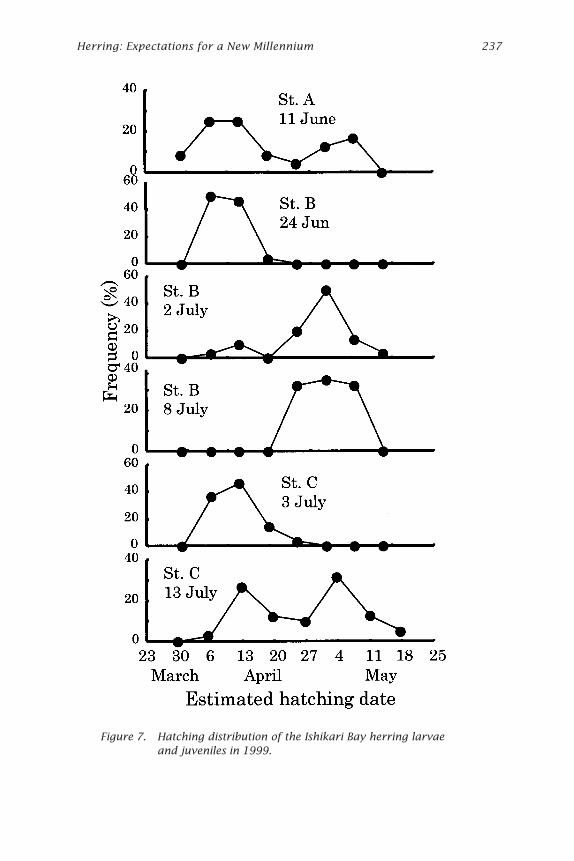
Estimation of Hatching Date of Wild HerringIt was found that the day of increment formation was 8 days after hatchingon average in this study. Consequently, a correction factor of 8 was addedto the number of increments counted to establish the estimated age indays after hatching. Estimated date of hatching of larvae and juvenilesfrom otolith analysis is shown in Figs. 6 and 7. In 1998 the estimatedhatching day sampled at station A on 26 May started in early April, andreached a peak in the middle of April. At station B on 25 June the hatchingperiod was different from station A on 26 May, and started and reached apeak in late April. At station C on 26 June and 4 July most of them hatchedin early April. On 7 July hatching showed a bimodal shape. First and secondpeaks were similar to that on 26 May and 25 June. In 1999 at station A on11 June showed a bimodal shape peaked in early April (early-hatched larvaeand juveniles) and early May (late-hatched larvae and juveniles). At stationB on 24 June, early-hatched juveniles were dominant, but most of thejuveniles sampled on 2 July and 8 July were late-hatched. At station C on 3July, early-hatched juveniles were dominant although late-hatched juvenileswere at station B in this period. On 13 July at station C hatching showed abimodal shape; first and second peaks were similar to that on 11 June.
Figure 5. The number of increments between the two marks with ALC corre-sponded with the number of days elapsed (13 days) between thefirst and second treatment of ALC, indicating that the rate of incre-ment formation was 1 day.
Herring: Expectations for a New Millennium 235
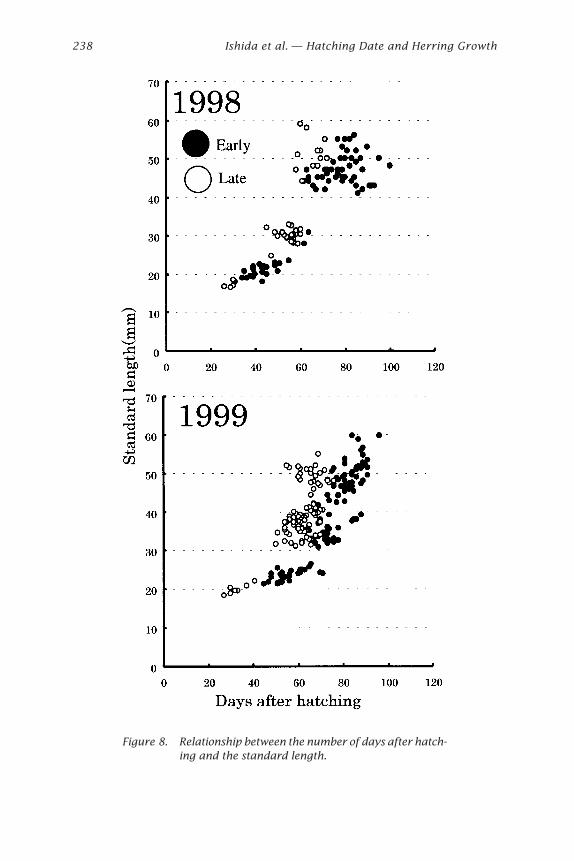
Growth of Wild Herring Larvae and JuvenilesA lot of ALC marked artificial juveniles released from Atsuta, over 15 kmdistance from the estuary, were recaptured in the Ishikari River estuary(Sasaki et al. 2001). Wild juveniles over 41 mm SL were distributed in theestuary and juveniles under 41 mm were in the surf area, around station B(Sasaki et al. 2001). These results indicated that the estuary is a suitablearea for sampling because juveniles approximately over 41 mm immi-grate into the estuary. The hatching day distributions of the estuary (sta-tion C) in the present study showed a bimodal shape in both years (Figs. 6and 7). Growth curves were examined separately before and after on 22April and 25 April on 1998 and 1999, respectively. The late-hatched in-dividuals obviously grew faster than early hatched ones in both years (Fig. 8)
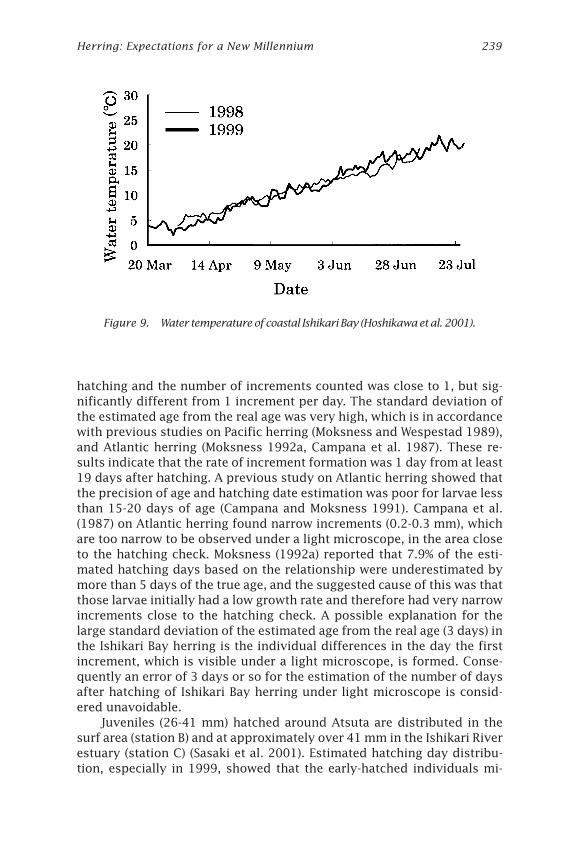
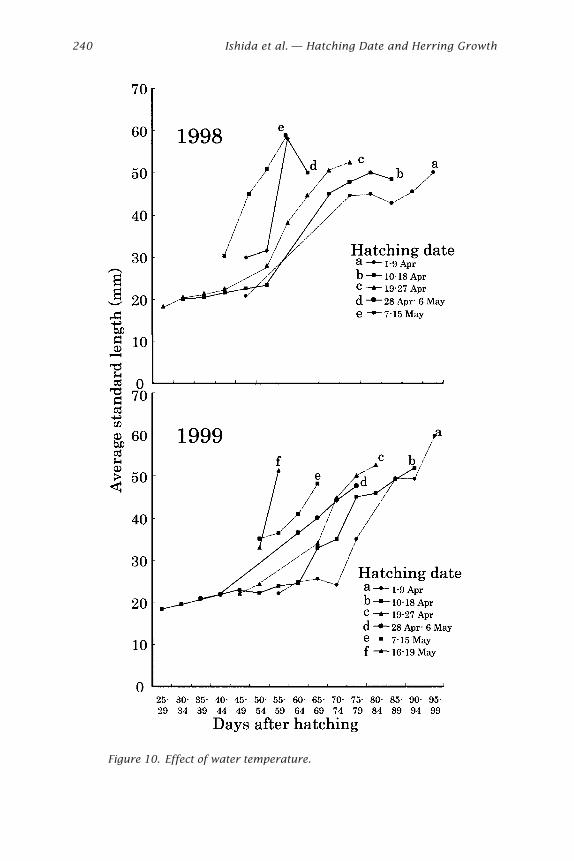
Relationship between Growth and Water TemperatureA continuous increase in water temperature of coastal Ishikari Bay in 1998and 1999 was observed from hatching to the juvenile period in both years(Fig. 9), indicating that late-hatched individuals certainly experienced highertemperatures than early-hatched ones. To investigate an effect of tempera-ture on growth of Ishikari Bay herring larvae and juveniles, relationshipsbetween the hatching days, used to indicate the temperature range thatcertain larvae and juveniles experienced, and the average standard lengthswere compared (Fig. 10). This result showed that the late-hatched indi-viduals grow faster than the early ones, indicating that water temperatureaffected the apparent growth of Ishikari Bay herring larvae and juveniles.
DiscussionMoksness and Wespestad (1989) and Wespestad and Moksness (1990)showed that daily growth increments in Pacific herring were true daily in-crements at a similar growth rate observed in nature and that mesocosmexperiments were an appropriate environment for studying herring be-cause they produce a similar growth rate as in nature. In the present study,in the laboratory-reared experiment, larvae 33 days after hatching reached22 mm. Even though small tanks were used, this result is in good agreementwith the growth of wild larvae and juveniles, although Moksness andWespestad (1989) and Geffan (1982) suggested that larvae reared in smalltanks were smaller than in the wild, supposing that otolith increment forma-tion in the present study was similar to nature. Here, the cause of the simi-lar growth to nature in small tanks may be due to the enrichment of the diet.
The number of increments between two marks with ALC correspondedwith the number of days elapsed between the first and the second ALCtreatments with a small standard deviation. In the Pacific herring this isthe first time the chemical marking method confirmed that the depositionrate is one with a low standard deviation. However, the deposition rateestimated from the relationship between the actual number of days after
236 Ishida et al. — Hatching Date and Herring Growth
Figure 6. Hatching distribution of the Ishikari Bay herring larvae andjuveniles in 1998.
Herring: Expectations for a New Millennium 237
Figure 7. Hatching distribution of the Ishikari Bay herring larvaeand juveniles in 1999.
238 Ishida et al. — Hatching Date and Herring Growth
Figure 8. Relationship between the number of days after hatch-ing and the standard length.
Herring: Expectations for a New Millennium 239
hatching and the number of increments counted was close to 1, but sig-nificantly different from 1 increment per day. The standard deviation ofthe estimated age from the real age was very high, which is in accordancewith previous studies on Pacific herring (Moksness and Wespestad 1989),and Atlantic herring (Moksness 1992a, Campana et al. 1987). These re-sults indicate that the rate of increment formation was 1 day from at least19 days after hatching. A previous study on Atlantic herring showed thatthe precision of age and hatching date estimation was poor for larvae lessthan 15-20 days of age (Campana and Moksness 1991). Campana et al.(1987) on Atlantic herring found narrow increments (0.2-0.3 mm), whichare too narrow to be observed under a light microscope, in the area closeto the hatching check. Moksness (1992a) reported that 7.9% of the esti-mated hatching days based on the relationship were underestimated bymore than 5 days of the true age, and the suggested cause of this was thatthose larvae initially had a low growth rate and therefore had very narrowincrements close to the hatching check. A possible explanation for thelarge standard deviation of the estimated age from the real age (3 days) inthe Ishikari Bay herring is the individual differences in the day the firstincrement, which is visible under a light microscope, is formed. Conse-quently an error of 3 days or so for the estimation of the number of daysafter hatching of Ishikari Bay herring under light microscope is consid-ered unavoidable.
Juveniles (26-41 mm) hatched around Atsuta are distributed in thesurf area (station B) and at approximately over 41 mm in the Ishikari Riverestuary (station C) (Sasaki et al. 2001). Estimated hatching day distribu-tion, especially in 1999, showed that the early-hatched individuals mi-
Figure 9. Water temperature of coastal Ishikari Bay (Hoshikawa et al. 2001).
240 Ishida et al. — Hatching Date and Herring Growth
Figure 10. Effect of water temperature.
Herring: Expectations for a New Millennium 241
grated earlier to the surf area (station B) and the estuary than the late-hatched ones in both years. In 1998, there were no catches of early-hatchedat station B on 25 June. The cause of this is that either the research wasconducted with less frequency in 1998 than 1999 or the juveniles stayedfor a shorter period around station B. Migration of adult herring for spawn-ing to the coastal Atsuta peaked twice, in early February and late February,in 1999 (Takayanagi et al. 1999). Results of direct observation on herringegg distributions by scuba diving showed that hatching peaked on 9-10April and 5-6 May in 1999 (Hoshikawa et al. 2001). These results indicatethat sampling in this study took place at suitable points, and larvae andjuveniles used in this study originated from the eggs spawned around Atsuta.
The present study shows that the larvae and juveniles that experi-enced higher temperature grew faster. Jones (1985) also reported within-season difference in growth of Atlantic herring larvae. The estimated dateof hatching of Atlantic herring larvae sampled in the Sheepscot River estu-ary showed that there were at least two age groups, and larvae distributedin the estuary appeared at about 4 weeks old (Townsend and Graham 1981).These results indicate that growth of larvae and juveniles, even if in thesame cohort, do not have the same growth patterns and it is necessary toestimate the hatching day to investigate the growth of Ishikari Bay herringlarvae and juveniles.
We cannot, however, conclusively specify the reason for the differencesin the within-season growth (apparent growth) shown in this study, becausewe have no data to describe it. Two possible explanations are (1) watertemperature and (2) size-selective mortality. McGurk (1984) reported ahigher growth rate for batches of Pacific herring larvae developing at highertemperatures. Moksness and Fossum (1992) suggested that higher growthrate in Atlantic herring was caused by higher temperature. On the otherhand, size-selective mortality of Atlantic herring larvae in mesocosms wasfound from the result of continuous sampling and from observations onthe distance from the nucleus to the hatch check (Folkvord et al. 1997).Campana and Moksness (1991) on Atlantic herring and Moksness andWespestad (1989) on Pacific herring concluded that the use of otolith mi-crostructure (e.g., otolith radius and total length) to estimate the back-calculated growth rate gives very accurate and precise estimates. To confirmwhether mortality is size-selective or not, it will be necessary to compareapparent growth and estimated individual growth trajectory based on in-crement width.
In either case, it is obvious that apparent growth of larvae and juve-niles is influenced by water temperature. Moksness and Fossum (1991)separated spring- and autumn-spawned herring larvae by measuring thedistance from the nucleus to the hatch check and the increment widths inthe otolith microstructure. Stenevik et al. (1996) and Moksness and Fossum(1991) on Norwegian spring-spawned herring larvae and Moksness (1992b)on North Sea herring larvae reported that larvae spawned in differentgrounds were identified from the difference in otolith microstructure.
242 Ishida et al. — Hatching Date and Herring Growth
Results of these studies indicate that otolith microstructure analysis dur-ing the larval and juvenile period is a good way to identify components oflarvae that have experienced different environmental conditions.
Furthermore, Zhang and Moksness (1993) have shown that otoliths ofspawning Atlantic herring can be treated to expose the increment widthpattern in the larval period. We also find that the otolith of the adult IshikariBay herring can be treated to expose the increments under a scanningelectron microscope (Ryotaro Ishida, Hokkaido Fisheries Experimental Sta-tion, pers. comm., Sep. 1997). In the next study, we will analyze the otolithmicrostructure, the back-calculated growth, of the spawning herring andof the juveniles used in this study to distinguish between the progeny ofearly- and late-hatched herrings as juveniles and adults.
AcknowledgmentsWe would like to thank Dr. A.J. Paul and two anonymous reviewers fortheir helpful comments and correction of the English text in previous ver-sions of the manuscript, and Dr. Tokimasa Kobayashi at the Hokkaido Na-tional Fisheries Research Institute Fisheries Agency of Japan and MitsuhiroSano at the Hokkaido Central Fisheries Experimental Station for giving usan opportunity to attend this symposium. We also thank staff at the IshikariFisheries Extension Office for assistance in obtaining spawning herring.
ReferencesCampana, S.E., and E. Moksness. 1991. Accuracy and precision of age and hatch date
estimates from otolith microstructure examination. ICES J. Mar. Sci. 48:303-316.
Campana, S.E., J.A. Gagn, and J. Munro. 1987. Otolith microstructure of larval her-ring (Clupea harengus): Image or reality? Can. J. Fish. Aquat. Sci. 44:1922-1929.
Folkvold, A., K. Rukan, A. Johannessen, and E. Moksness. 1997. Early life history ofherring larvae in contrasting feeding environments determined by otolith mi-crostructure analysis. J. Fish. Biol. 51(Suppl. A):250-263.
Geffan, A.J. 1982. Otolith ring deposition in relation to growth rate in herring (Clu-pea harengus) and turbot (Scophthalmus maximus) larvae. Mar. Biol. (Berl.)71:317-326.
Hoshikawa, H., K. Tajima, T. Kawa, and T. Ohtsuki. 2001. Spawning bed selection byPacific Herring (Clupea pallasii ) at Atsuta, Hokkaido, Japan. In: F. Funk, J. Black-burn, D. Hay, A.J. Paul, R. Stephenson, R. Toresen, and D. Witherell (eds.), Her-ring: Expectations for a new millennium. University of Alaska Sea Grant,AK-SG-01-04, Fairbanks. (This volume.)
Ishida, R., S. Takayanagi, and M. Sasaki. 1997. Growth and maturity of Ishikari Bayherring. Abstracts for the meeting of the Japanese Society of Fisheries Science,September 27-30, 1997:13. (In Japanese.)
Jones, C. 1985. Within-season difference in growth of larval Atlantic herring, Clu-pea harengus harengus. Fish. Bull., U.S. 83:289-298.
Herring: Expectations for a New Millennium 243
Kobayashi, T. 1993. Biochemical analyses of genetic variability and divergence ofpopulations in Pacific herring. Bull. Natl. Res. Inst. Far Seas Fish. 30:1-77.
Kobayashi, T., M. Iwata, and K. Numachi. 1990. Genetic divergence among localspawning population of Pacific herring in the vicinity of northern Japan. Nip-pon Suisan Gakkaishi 56:1045-1052.
Lough, R.G., M. Pennington, G.R. Bolz, and A.A. Rosenberg. 1982. Age and growthof larval Atlantic herring Clupea harengus L., in the Gulf of Maine-GeorgesBank region based on otolith growth increments. Fish. Bull., U.S. 80:187-199.
McGurk, M.D. 1984. Effect of delayed feeding and temperature on the age of irre-versible starvation and on the rates of growth and mortality of Pacific herringlarvae. Mar. Biol. (Berl.) 84:13-26.
Moksness, E. 1992a. Validation of daily increments in otolith microstructure of Norwe-gian spring-spawning herring (Clupea harengus L.). ICES J. Mar. Sci. 49:231-235.
Moksness, E. 1992b. Difference in otolith microstructure and body growth rate ofNorth Sea herring (Clupea harengus L.) larvae in the period 1987-1989. ICES J.Mar. Sci. 49:223-230.
Moksness, E., and P. Fossum. 1991. Distinguishing spring- and autumn-spawnedherring larvae (Clupea harengus L.) by otolith microstructure. ICES J. Mar. Sci.48:61-66.
Moksness, E., and P. Fossum. 1992. Daily growth rate and hatching-date distribu-tion of Norwegian spring-spawning herring (Clupea harengus L.). ICES J. Mar.Sci.49:217-221.
Moksness, E., and V. Wespestad. 1989. Aging and back calculating growth of Pacificherring, Clupea pallasi, larvae by reading daily otolith increments. Fish. Bull.,U.S. 87:509-513.
Sasaki, M., R. Ishida, and S. Takayanagi. 2001. Distribution and feeding of jvenile her-ring (Clupea pallasii ) in Northern Japan. In: F. Funk, J. Blackburn, D. Hay, A.J. Paul,R. Stephenson, R. Toresen, and D. Witherell (eds.), Herring: Expectations for anew millennium. University of Alaska Sea Grant, AK-SG-01-04, Fairbanks. (Thisvolume.)
Stenevik, E.K., P. Fossum, A. Johannessen, and A. Folkvord. 1996 Identification ofNorwegian spring herring (Clupea harengus L.) larvae from spring grounds offwestern Norway applying otolith microstructure analysis. Sarsia 80:285-292.
Takayanagi, S., M. Sasaki, and R. Ishida. 1998. Characteristic of spawning migrationof Ishikari Bay herring (Clupea pallasi ) . Abstracts for the meeting of the Japa-nese Society of Fisheries Science, September 26-29, 1999:42. (In Japanese.)
Townsend, D.W, and J.J. Graham. 1981. Growth and age structure of larval Atlanticherring, Clupea harengus harengus, in the Sheepscot River estuary, Maine, asdetermined by daily growth in otolith. Fish. Bull., U.S. 79:123-130.
Wespestad, V.W., and E. Moksness. 1990. Observations of growth and survival dur-ing the early life history of Pacific herring Clupea pallasi from Bristol Bay,Alaska, in a marine mesocosm. Fish. Bull., U.S. 88:191-200.
Zhang, Z., and E. Moksness. 1993. A chemical way of thinning otoliths of adultAtlantic herring (Clupea harengus) to expose the microstructure in the nucle-us region. ICES J. Mar. Sci. 50:213-217.

Herring: Expectations for a New Millennium 245Alaska Sea Grant College Program • AK-SG-01-04, 2001
Decline of the Sakhalin-HokkaidoHerring Spawning Grounds nearthe Sakhalin CoastElsa R. IvshinaSakhalin Research Institute of Fisheries and Oceanography (SakhNIRO),Yuzhno-Sakhalinsk, Russia
AbstractThe Sakhalin-Hokkaido herring population was historically the most abun-dant herring population in the Far East seas. At present, the population isin long and deep depression. Climatic conditions and the fishery contrib-uted to the stock decrease.
This paper presents the results of a study of the Sakhalin-Hokkaidoherring spawning grounds at the southwestern Sakhalin coast (Sea of Japan,Tatar Strait) from 1948 to 1998. It shows the considerable reduction ofstock biomass, catch, and spawning areas.
During the period of high abundance, Sakhalin-Hokkaido herringspawned throughout a vast area: near the coasts of southwestern, southern,and southeastern Sakhalin, western and northeastern Hokkaido, and thesouthern Kuril Islands. The reduction of spawning grounds appeared inthe 1910-1920s, beginning from the southern part of the spawning area.In the 1940-1950s, herring spawned widely despite the fact that a decreasein the Sakhalin-Hokkaido herring stock was evident. Then, in the 1980s-1990sherring eggs occurred only in places that had previously been consideredsecondary spawning grounds. The main spawning grounds were empty,and egg density on substratum had decreased. No great variations wereobserved in the algae community and there was no decrease in the stateof potential spawning substratum for herring. Rather, the reduction ofspawning area was a consequence of the decrease in herring abundance.
IntroductionThe Sakhalin-Hokkaido herring was the most abundant stock among all FarEastern herring populations. It was unique in its commercial catch, whichreached almost 1 million tons in 1897. No other Far Eastern herring popula-
246 Ivshina — Decline of Sakhalin-Hokkaido Herring Spawning Grounds
tion gave such high annual catches. But none of the other populations exhib-ited such a deep depression as the Sakhalin-Hokkaido stock did. The mainreasons for the depression were likely the change of oceanographic conditions(mainly, sea warming), and influence of the fishery (Svetovidov 1952; Probatov1958; Kondo 1963; Motoda and Hirano 1963; Pushnikova 1996, 1997).
At present, the depression of the Sakhalin-Hokkaido herring is not onlycontinuing, but is even expanding. The spawning and feeding areas havebeen reduced greatly. The immature Sakhalin-Hokkaido herring is distrib-uted in limited areas only in Aniva and Terpeniya bays, and the northeast-ern coast of Japan. Mature herring concentrate for feeding mainly in theBay of De Langle, whereas in the period of high abundance they were widelyrecorded from Moneron Island to the northern part of Tatar Strait in theSea of Japan (Druzhinin 1964). The reduction of spawning areas is one ofthe most evident consequence of the catastrophic decrease in abundance.
During the period of high abundance the Sakhalin-Hokkaido herringspawned in a vast area of the Sea of Japan and the Sea of Okhotsk. Herringmigrated to spawn from the northwestern Sakhalin coast to Honshu Island inthe Sea of Japan, and in some years, down to the southern part of thisisland. In the Okhotsk Sea, herring spawned in Aniva Bay, along the north-eastern Hokkaido coast, and near Kunashir Island (southern Kurils). Suchlarge spawning areas remained until the end of he 19th century. Then herringabundance decreased and there was considerable reduction of spawninggrounds near Honshu Island, and near southern and eastern Hokkaido Island.The displacement of the main spawning stocks northward was likely causedby oceanographic factors. In the middle 1930s, an abrupt reduction in totalabundance of Sakhalin-Hokkaido herring took place, and this was immedi-ately reflected by the weakening of the spawning run to the Hokkaido coast.
Despite the decrease in herring spawning near Hokkaido Island in the1930s, it increased near the Sakhalin coast, in the northern part of thespawning area. Furthermore, the abundance of spawning herring remainedrelatively stable at the end of the 1930s near the Sakhalin coast. It de-creased much more after the mid-1950s compared to the level of the pre-vious years (Piskunov 1952, Probatov 1954, Probatov and Darda 1957,Probatov 1958, Rumyantsev 1958, Kondo 1963, Motoda and Hirano 1963).Based on the analysis of spawning runs, fishery statistics, and biologicalparameters of Sakhalin-Hokkaido herring, A.N. Probatov supposed in 1959that in future it would be possible to expect a further decrease of abundanceas well as short-term and more local runs along the western coast. (Probatov1959). Unfortunately, this forecast has been realized completely. The pur-pose of this work was to determine the scales and rates of reduction of theSakhalin-Hokkaido herring spawning grounds near the Sakhalin coast.
Materials and MethodsThe data from monitoring of the Sakhalin-Hokkaido herring spawninggrounds near the southwestern Sakhalin coast during April-May 1948-1998
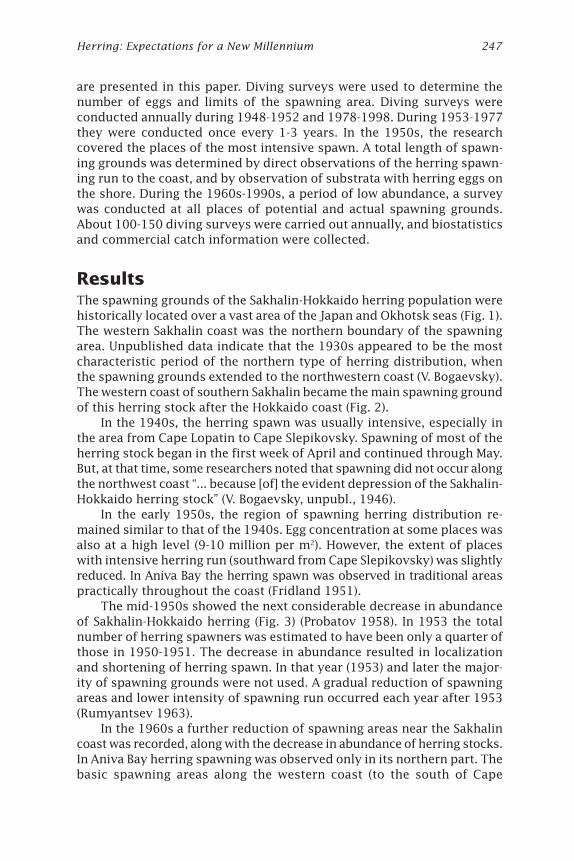
Herring: Expectations for a New Millennium 247
are presented in this paper. Diving surveys were used to determine thenumber of eggs and limits of the spawning area. Diving surveys wereconducted annually during 1948-1952 and 1978-1998. During 1953-1977they were conducted once every 1-3 years. In the 1950s, the researchcovered the places of the most intensive spawn. A total length of spawn-ing grounds was determined by direct observations of the herring spawn-ing run to the coast, and by observation of substrata with herring eggs onthe shore. During the 1960s-1990s, a period of low abundance, a surveywas conducted at all places of potential and actual spawning grounds.About 100-150 diving surveys were carried out annually, and biostatisticsand commercial catch information were collected.
ResultsThe spawning grounds of the Sakhalin-Hokkaido herring population werehistorically located over a vast area of the Japan and Okhotsk seas (Fig. 1).The western Sakhalin coast was the northern boundary of the spawningarea. Unpublished data indicate that the 1930s appeared to be the mostcharacteristic period of the northern type of herring distribution, whenthe spawning grounds extended to the northwestern coast (V. Bogaevsky).The western coast of southern Sakhalin became the main spawning groundof this herring stock after the Hokkaido coast (Fig. 2).
In the 1940s, the herring spawn was usually intensive, especially inthe area from Cape Lopatin to Cape Slepikovsky. Spawning of most of theherring stock began in the first week of April and continued through May.But, at that time, some researchers noted that spawning did not occur alongthe northwest coast “... because [of] the evident depression of the Sakhalin-Hokkaido herring stock” (V. Bogaevsky, unpubl., 1946).
In the early 1950s, the region of spawning herring distribution re-mained similar to that of the 1940s. Egg concentration at some places wasalso at a high level (9-10 million per m2). However, the extent of placeswith intensive herring run (southward from Cape Slepikovsky) was slightlyreduced. In Aniva Bay the herring spawn was observed in traditional areaspractically throughout the coast (Fridland 1951).
The mid-1950s showed the next considerable decrease in abundanceof Sakhalin-Hokkaido herring (Fig. 3) (Probatov 1958). In 1953 the totalnumber of herring spawners was estimated to have been only a quarter ofthose in 1950-1951. The decrease in abundance resulted in localizationand shortening of herring spawn. In that year (1953) and later the major-ity of spawning grounds were not used. A gradual reduction of spawningareas and lower intensity of spawning run occurred each year after 1953(Rumyantsev 1963).
In the 1960s a further reduction of spawning areas near the Sakhalincoast was recorded, along with the decrease in abundance of herring stocks.In Aniva Bay herring spawning was observed only in its northern part. Thebasic spawning areas along the western coast (to the south of Cape
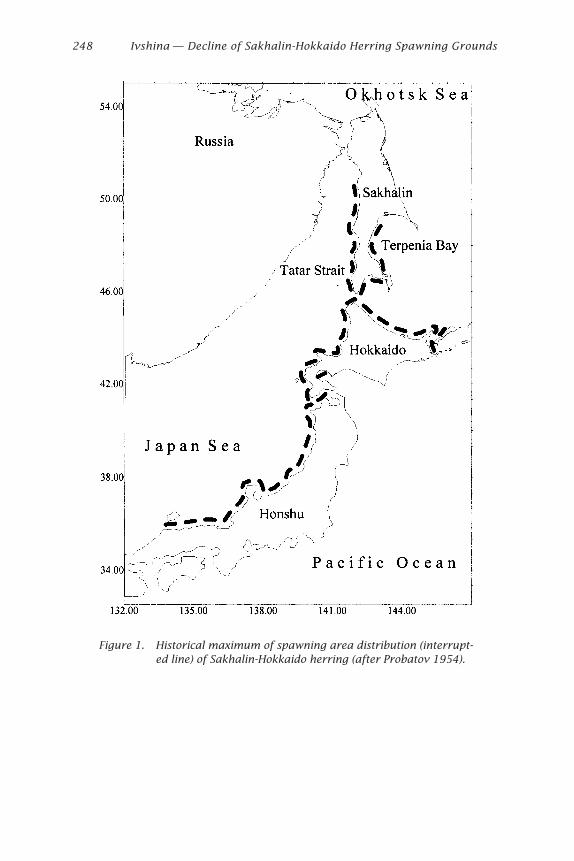
248 Ivshina — Decline of Sakhalin-Hokkaido Herring Spawning Grounds
Figure 1. Historical maximum of spawning area distribution (interrupt-ed line) of Sakhalin-Hokkaido herring (after Probatov 1954).
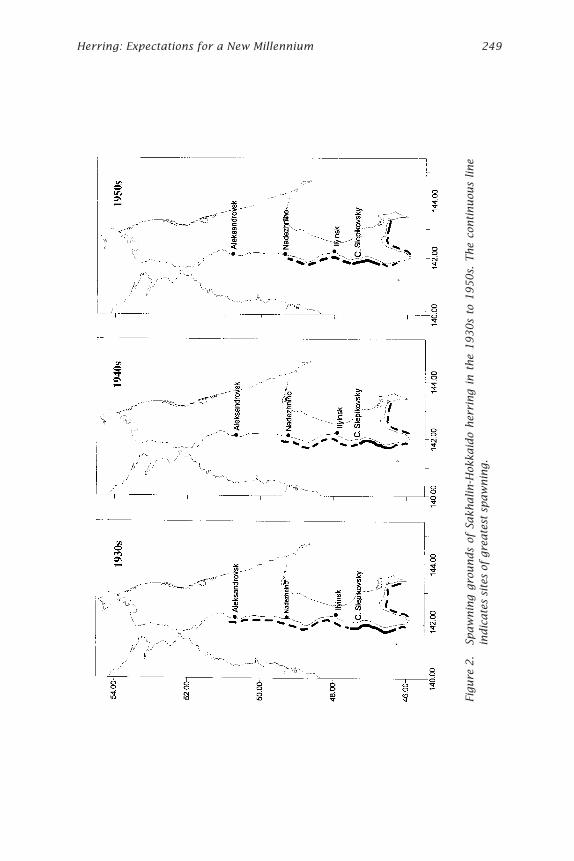
Herring: Expectations for a New Millennium 249
Figu
re 2
.Sp
aw
nin
g g
rou
nds
of S
akh
alin
-Hok
kaid
o h
erri
ng i
n t
he
1930s
to 1
950s.
Th
e co
nti
nu
ous
lin
ein
dic
ate
s si
tes
of g
reate
st s
paw
nin
g.
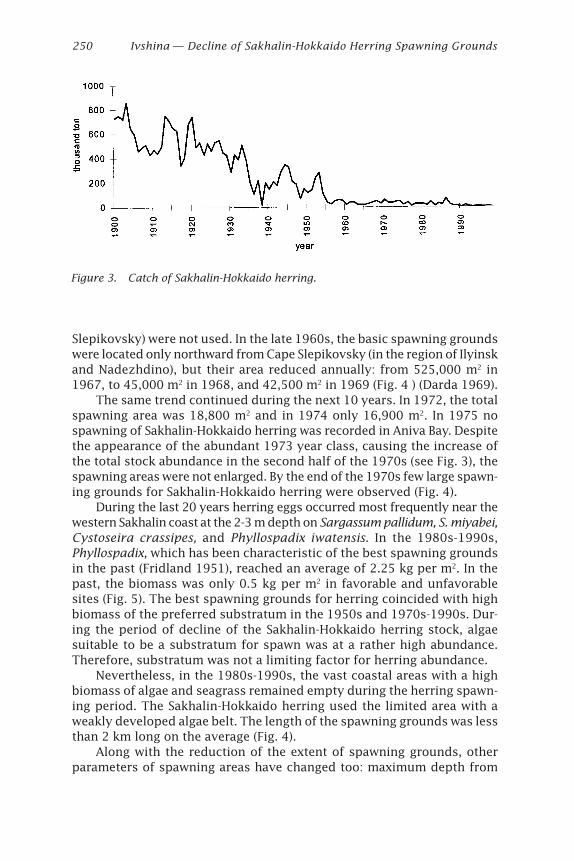
250 Ivshina — Decline of Sakhalin-Hokkaido Herring Spawning Grounds
Slepikovsky) were not used. In the late 1960s, the basic spawning groundswere located only northward from Cape Slepikovsky (in the region of Ilyinskand Nadezhdino), but their area reduced annually: from 525,000 m2 in1967, to 45,000 m2 in 1968, and 42,500 m2 in 1969 (Fig. 4 ) (Darda 1969).
The same trend continued during the next 10 years. In 1972, the totalspawning area was 18,800 m2 and in 1974 only 16,900 m2. In 1975 nospawning of Sakhalin-Hokkaido herring was recorded in Aniva Bay. Despitethe appearance of the abundant 1973 year class, causing the increase ofthe total stock abundance in the second half of the 1970s (see Fig. 3), thespawning areas were not enlarged. By the end of the 1970s few large spawn-ing grounds for Sakhalin-Hokkaido herring were observed (Fig. 4).
During the last 20 years herring eggs occurred most frequently near thewestern Sakhalin coast at the 2-3 m depth on Sargassum pallidum, S. miyabei,Cystoseira crassipes, and Phyllospadix iwatensis. In the 1980s-1990s,Phyllospadix, which has been characteristic of the best spawning groundsin the past (Fridland 1951), reached an average of 2.25 kg per m2. In thepast, the biomass was only 0.5 kg per m2 in favorable and unfavorablesites (Fig. 5). The best spawning grounds for herring coincided with highbiomass of the preferred substratum in the 1950s and 1970s-1990s. Dur-ing the period of decline of the Sakhalin-Hokkaido herring stock, algaesuitable to be a substratum for spawn was at a rather high abundance.Therefore, substratum was not a limiting factor for herring abundance.
Nevertheless, in the 1980s-1990s, the vast coastal areas with a highbiomass of algae and seagrass remained empty during the herring spawn-ing period. The Sakhalin-Hokkaido herring used the limited area with aweakly developed algae belt. The length of the spawning grounds was lessthan 2 km long on the average (Fig. 4).
Along with the reduction of the extent of spawning grounds, otherparameters of spawning areas have changed too: maximum depth from
Figure 3. Catch of Sakhalin-Hokkaido herring.
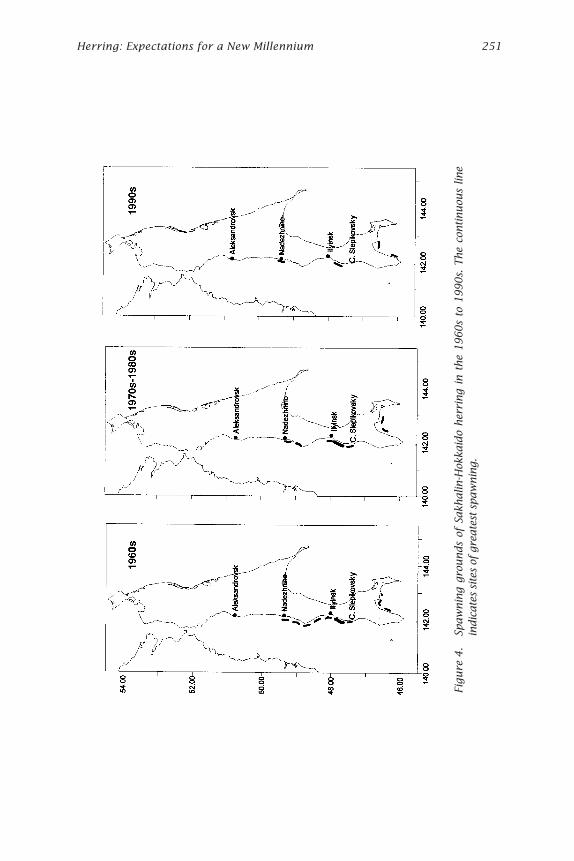
Herring: Expectations for a New Millennium 251
Figu
re 4
.Sp
aw
nin
g gr
ounds
of S
akh
alin
-Hok
kaid
o her
ring
in t
he
1960s
to 1
990s.
The
continuou
s lin
ein
dic
ate
s si
tes
of g
reate
st s
paw
nin
g.
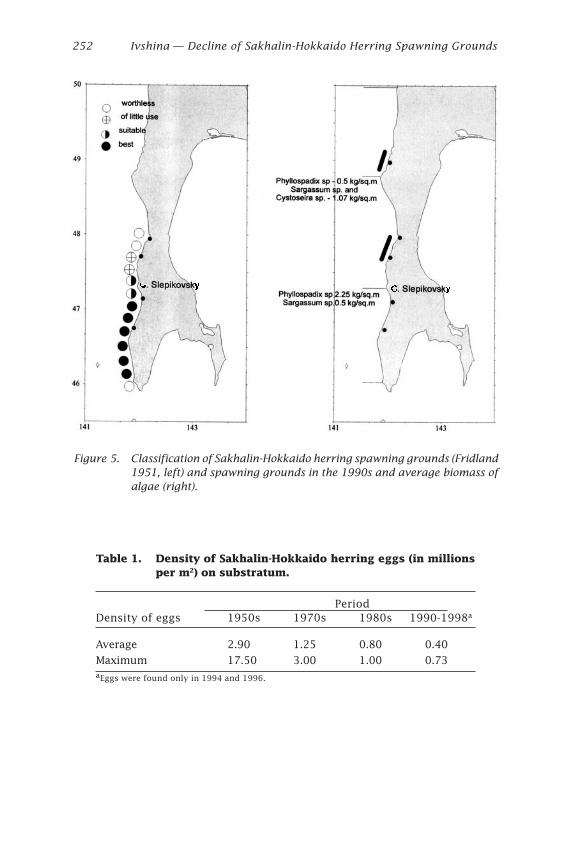
252 Ivshina — Decline of Sakhalin-Hokkaido Herring Spawning Grounds
Table 1. Density of Sakhalin-Hokkaido herring eggs (in millionsper m2) on substratum.
PeriodDensity of eggs 1950s 1970s 1980s 1990-1998a
Average 2.90 1.25 0.80 0.40
Maximum 17.50 3.00 1.00 0.73aEggs were found only in 1994 and 1996.
Figure 5. Classification of Sakhalin-Hokkaido herring spawning grounds (Fridland1951, left) and spawning grounds in the 1990s and average biomass ofalgae (right).
Herring: Expectations for a New Millennium 253
18 m to 10 m, width from 500-700 m to 10-50 m, and to 2-3 m some years.Egg density varied from 10 eggs to 1 million eggs per m2 (average 0.4million eggs per m2), unlike the 1950s, when the number of eggs variedfrom 1 to 2 million eggs per m2 to 17.5 million eggs per m2 (average 2.9million eggs per m2 ) (Table 1).
The number of layers in herring egg masses also decreased, from 40-51to 1-3. In the last 10 years, it has been irrelevant to assess this index,because the number of eggs on the substratum has been very small. Acatastrophic reduction of spawning areas has occurred in the most recent10 years (since 1990). Only in 1994 and 1996, in May, were herring eggsobserved. These were at the secondary spawning grounds only, and theirabundance was tens and hundreds times less than in the 1950s. In the1990s the Sakhalin-Hokkaido herring stock was at an extremely low level.Vast areas potentially good for spawning remained vacant. In the areasouthward from Cape Slepikovsky, which earlier had been the best forspawning in April-May, no run of spawners has been recorded for almost30 years. The numerous features of population depression exist, and thereis no evidence to suggest abundance will increase in the future.
ConclusionDue to the catastrophic decline in numbers of Sakhalin-Hokkaido herring,the spawning grounds were reduced not only near the shores of Japan,but also near Sakhalin, where since the 1930s the main spawning groundsfor Sakhalin-Hokkaido herring occurred. At one time spawning extendedalong the whole west coast. In the 1940s-1950s, the absence of spawninggrounds was recorded near the northwestern coast and a reduction nearthe southwestern Sakhalin coast. In the 1960s, redistribution of spawninggrounds took place. By this time, the spawning herring run had not beenobserved near the southwestern Sakhalin coast. During the following yearsthose spawning grounds were reduced. By the end of the 20th century,herring spawning did not occur annually. Spawning at traditional placestypical for the period of high abundance was completely absent on thewhole. The large-scale spawning area reduction is the consequence of thedecrease in abundance of Sakhalin-Hokkaido herring and it reflects theextremely depressed state of the population.
AcknowledgmentI would like to thank many SAKHNIRO pesonnel who contributed towardthe collection and processing of herring data used in this analysis. In par-ticular we would like to thank Sergey D. Bukin for his helpful comments.
254 Ivshina — Decline of Sakhalin-Hokkaido Herring Spawning Grounds
ReferencesDarda, M.A. 1969. Abundance and distribution of Sakhalin-Hokkaido herring in
Sakhalin waters in 1969. Report SakhNIRO. Sci. Archives No. 1943. 66 pp. (InRussian.)
Druzhinin, A.D. 1964. Materials on biology of feeding herring (Clupea harenguspallasi Val.) in Sakhalin waters. Izv. TINRO 55:3-37. (In Russian.)
Fridland, I.G. 1951. Herring reproduction near southwestern Sakhalin coast. Izv.TINRO 35:105-145. (In Russian.)
Kondo, H. 1963. On the condition of herring (Clupea pallasi ) in waters aroundHokkaido and Sakhalin during recent years. Hokkaido Fisheries ExperimentalStation 3:1-18. (In Japanese.)
Motoda, S., and Y. Hirano. 1963. Review of Japanese herring investigations. Ext. duRapp. et Proc. Verbaux 154:249-261.
Piskunov, I.A. 1952. Spring herring from the western coast of southern Sakhalin.Izv. TINRO 37:3-67. (In Russian.)
Probatov, A.N. 1954. Distribution of the Japan Sea herring. Izv. TINRO 39:21-57. (InRussian.)
Probatov, A.N. 1958. Fluctuations of Sakhalin-Hokkaido herring abundance due tooceanological conditions. Proceedings of Oceanographic Commission 3:124-124. (In Russian.)
Probatov, A.N. 1959. Runs of herring spawners to the western coast of southernSakhalin. Rybn. Khoz. 2:2-29. (In Russian.)
Probatov, A.N., and M.A. Darda. 1957. Spawning herring of Kunashir Island. Izv.TINRO 44:3-11. (In Russian.)
Pushnikova, G.M. 1996. Fishery and stock condition of the Sakhalin waters herring.Scientific Proceedings of Far Eastern State Technical Fishery University 8:34-43. (In Russian.)
Pushnikova, G. 1997. Will the population of the Sakhalin-Hokkaido herring disap-pear from the industrial supply? Rus. Convers. News 3:14-17.
Rumyantsev A.I. 1958. Recourse condition of abundant Sakhalin-Hokkaido herringstock. Rybn. Khoz. 4:3-9. (In Russian.)
Rumyantsev A.I. 1963. Material by conditions herring stock at the Sakhalin-Hok-kaido region. Report SakhNIRO. Sci. Archives No. 1326. 48 pp. (In Russian.)
Svetovidov, A.N. 1952. Fluctuations of the southern Sakhalin herring catches andtheir reasons. Zool. Zh. 31:831-842. (In Russian.)
Herring: Expectations for a New Millennium 255Alaska Sea Grant College Program • AK-SG-01-04, 2001
Factors Influencing Locationand Time of Spawning inNorwegian Spring-SpawningHerring: An Evaluation ofDifferent HypothesesAril SlotteInstitute of Marine Research, Bergen, Norway
AbstractIn January Norwegian spring-spawning herring (Clupea harengus L.) mi-grate from wintering grounds in fjords of northern Norway (68ºN) towardspawning grounds distributed along approximately 1,500 km of the coast(58-70ºN). Environmental factors may differ between spawning grounds,and the migrating herring may vary in abundance and be composed ofseveral age and length groups in different physiological condition from avariety of hatching, retention, and nursery areas. The present paper evalu-ates different theoretical hypotheses describing the influence of such fac-tors on spawning ground selection and spawning time. Regarding spawningground selection, three hypotheses are evaluated: First, herring home totheir natal spawning grounds. Second, independently of their origin her-ring repeatedly return to spawn at specific grounds through migrationand homing patterns learned from random adult groups they joined theyear preceding first spawning. Third, herring tend to select spawninggrounds based on individual state (length, condition), the cost of migra-tion, and prospects of larval survival. Regarding spawning time two hy-potheses are evaluated: First, herring spawn in a decreasing order of bodylength due to a size-dependent maturation rate, which in turn may resultin multiple spawning waves reflected by the number of age modes in thestock. Second, there will be only two major spawning waves regardless ofage distribution, the repeat spawners first followed by the recruit spawn-ers that have a delayed onset of maturation. According to this evaluationthe observed spawning migration can best be explained by the third hy-pothesis regarding spawning ground selection and the second hypothesisregarding spawning time.
256 Slotte — Influences on Spring-Spawning Herring
IntroductionWithin herring populations the environmental preferences favoring thesurvival of eggs and larvae may be specific, leading to spawning at spe-cific locations and times (Haegele and Schweigert 1985). In the case ofNorwegian spring-spawning herring (Clupea harengus L.) (NSS herring)banks and shelf areas with stony or rocky bottom and depths less than250 m are utilized for spawning (Runnstrøm 1941, Dragesund 1970). Suchareas are distributed along approximately 1,500 km along the Norwegiancoast between 58ºN and 70ºN. Traditionally the most important spawninggrounds are found from north to south at Lofoten, Træna, Sklinnabanken,Haltenbanken, Frøyabanken, and along the districts of Møre, Sogn, andRogaland (Fig. 1). In recent years the NSS herring stock has recovered froma state of severe depletion in the late 1960s. Simultaneously the stock haschanged its feeding and wintering areas and hence the migration routes tothe spawning grounds. Prior to the stock decline the herring spent thesummer feeding season in the Norwegian Sea, and the wintering occurredto the east of Iceland. The herring had to cross the open waters of theNorwegian Sea before entering the Norwegian west coast to find the spawn-ing grounds. After the stock decline oceanic feeding and wintering areaswere abandoned, and instead the herring spent the entire year in Norwe-gian coastal waters and fjords (Dragesund et al. 1980, Hamre 1990,Røttingen 1990). When the large 1983 year class recruited in 1988, winter-ing commenced in Vestfjorden, Tysfjorden, and Ofotfjorden (Vestfjordensystem), northern Norway. Furthermore, after the recruitment of the large1991 and 1992 year classes the feeding area was once again extendedwestward into the Norwegian Sea (Dragesund et al. 1997, Misund et al.1998). At present NSS herring (Clupea harengus L.) spend the feeding sea-son, April-August, covering large areas of the Norwegian Sea, but in Sep-tember they gather as a rather homogeneous mass in the Vestfjordensystem. When the spawning migration begins in mid-January they split upagain heading for spawning grounds located with different migration dis-tances, from Lofoten in the north to Lista in the south.
It is this scenario that forms the basis of the present review (Fig. 1).The environmental factors may differ between spawning grounds. In ad-dition, the population may vary in abundance and be composed of severalage and length groups in different physiological condition from a varietyof hatching, retention, and nursery areas. The question is whether thesefactors have any influence on spawning ground selection and spawningtime, and the main objective of the paper is to evaluate different theoreti-cal hypotheses already put forward to describe such influences. The presentevaluation is divided into two main analyses—one regarding spawningground selection and another regarding spawning time. Each analysis givesan overview of claimed models, their predictions, and the related obser-vations and data, and ends with a conclusion.
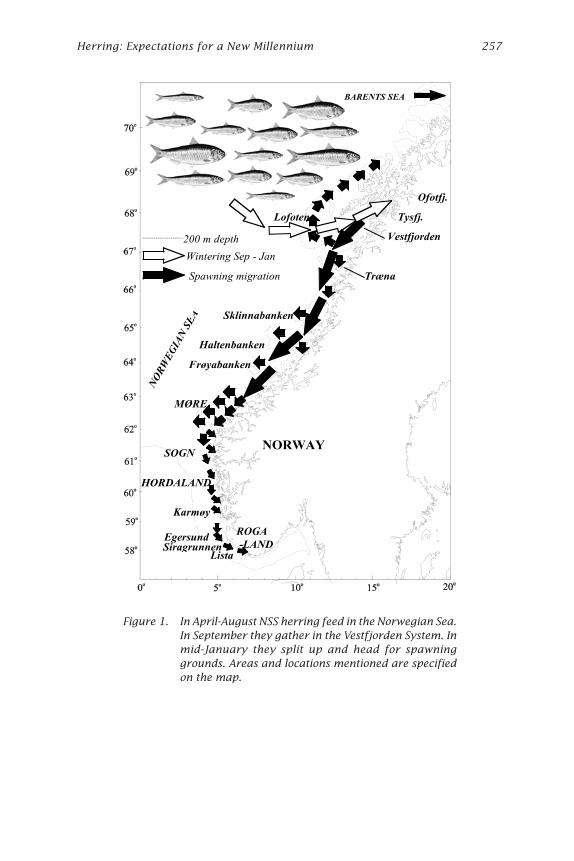
Herring: Expectations for a New Millennium 257
Figure 1. In April-August NSS herring feed in the Norwegian Sea.In September they gather in the Vestfjorden System. Inmid-January they split up and head for spawninggrounds. Areas and locations mentioned are specifiedon the map.
N
OR
WE
GIA
N S
EA
Spawning migration
Wintering Sep - Jan
200 m depth
Ofotfj.
Tysfj.
Vestfjorden
Træna
Sklinnabanken
Haltenbanken
Frøyabanken
MØRE
SOGN
HORDALAND
ROGA
-LAND
Lofoten
BARENTS SEA
Karmøy
Egersund
Siragrunnen
Lista
NORWAY
258 Slotte — Influences on Spring-Spawning Herring
Spawning Ground SelectionModels of Spawning Ground SelectionNatal HomingThe first hypothesis claims that the selection of spawning grounds in her-ring is clearly related to their hatching, retention, and nursery areas; i.e.,herring home to their natal spawning grounds. It claims that herring atdifferent spawning grounds are discrete population units with indepen-dent life histories (Iles and Sinclair 1982, Sinclair 1988). This model ofspawning ground selection is supported by the idea that each spawningground is associated with a specific larval retention area, which due tohydrographical features provide a mechanism for imprinting and mainte-nance of reproductive isolation by natal homing. Sinclair (1988) proposedthat larval retention would result in a number of survivors (members)within a population that will exceed the number of losses (vagrants), themember/vagrant hypothesis. From an evolutionary sense of view this modelimplies that straying herring will not successfully pass on their genes.Thus, in a sense they are evolutionary “losers.”
Return SpawningThe second hypothesis also claims that herring repeatedly return to spawnat specific grounds, but this behavior is supposed to be independent ofhatching, retention, and nursery areas. In this model the principal charac-teristics responsible for the structure, persistence, and integrity of a popu-lation are of behavioral rather than genetic nature; i.e., it is learning ofspatial structures and not imprinting that is important with respect tohoming (McQuinn 1997). Here local herring populations, which are formedthrough straying from existing populations (colonization), are perpetuatedin geographic space through the social transmission of migration and hom-ing patterns from adults to the recruiting juveniles in the year precedingfirst spawning. The recruiting herring, which could derive from variousspawning grounds, must learn from older, more experienced repeat spawn-ers how to find the respective feeding, wintering, and spawning groundsof the population, which they will keep on visiting in subsequent years.
State-Dependent MigrationThe third hypothesis is, unlike the two other hypotheses, based on lifehistory theories suggesting that animal behavior in general is influencedby the state of the animal, i.e., animals have state-dependent life historystrategies (McNamara and Houston 1996). In addition it is specially di-rected toward NSS herring and the present migration pattern with spawn-ing grounds located with different migration distances and in differentenvironments. The hypothesis claims that natal homing or simply returnspawning is neither a crucial nor a successful strategy on the long term,and that selection of spawning grounds in herring to a large degree isinfluenced by individual state (length, condition), the cost of migration
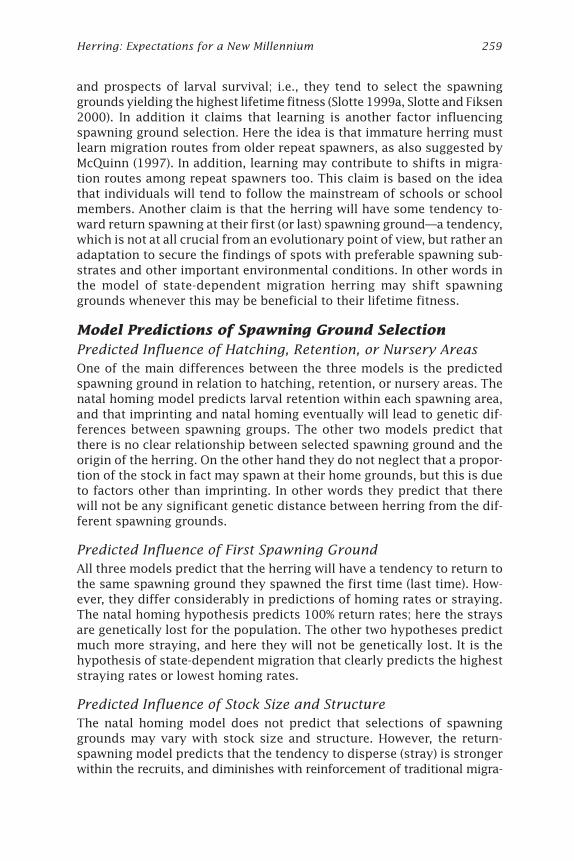
Herring: Expectations for a New Millennium 259
and prospects of larval survival; i.e., they tend to select the spawninggrounds yielding the highest lifetime fitness (Slotte 1999a, Slotte and Fiksen2000). In addition it claims that learning is another factor influencingspawning ground selection. Here the idea is that immature herring mustlearn migration routes from older repeat spawners, as also suggested byMcQuinn (1997). In addition, learning may contribute to shifts in migra-tion routes among repeat spawners too. This claim is based on the ideathat individuals will tend to follow the mainstream of schools or schoolmembers. Another claim is that the herring will have some tendency to-ward return spawning at their first (or last) spawning ground—a tendency,which is not at all crucial from an evolutionary point of view, but rather anadaptation to secure the findings of spots with preferable spawning sub-strates and other important environmental conditions. In other words inthe model of state-dependent migration herring may shift spawninggrounds whenever this may be beneficial to their lifetime fitness.
Model Predictions of Spawning Ground SelectionPredicted Influence of Hatching, Retention, or Nursery AreasOne of the main differences between the three models is the predictedspawning ground in relation to hatching, retention, or nursery areas. Thenatal homing model predicts larval retention within each spawning area,and that imprinting and natal homing eventually will lead to genetic dif-ferences between spawning groups. The other two models predict thatthere is no clear relationship between selected spawning ground and theorigin of the herring. On the other hand they do not neglect that a propor-tion of the stock in fact may spawn at their home grounds, but this is dueto factors other than imprinting. In other words they predict that therewill not be any significant genetic distance between herring from the dif-ferent spawning grounds.
Predicted Influence of First Spawning GroundAll three models predict that the herring will have a tendency to return tothe same spawning ground they spawned the first time (last time). How-ever, they differ considerably in predictions of homing rates or straying.The natal homing hypothesis predicts 100% return rates; here the straysare genetically lost for the population. The other two hypotheses predictmuch more straying, and here they will not be genetically lost. It is thehypothesis of state-dependent migration that clearly predicts the higheststraying rates or lowest homing rates.
Predicted Influence of Stock Size and StructureThe natal homing model does not predict that selections of spawninggrounds may vary with stock size and structure. However, the return-spawning model predicts that the tendency to disperse (stray) is strongerwithin the recruits, and diminishes with reinforcement of traditional migra-
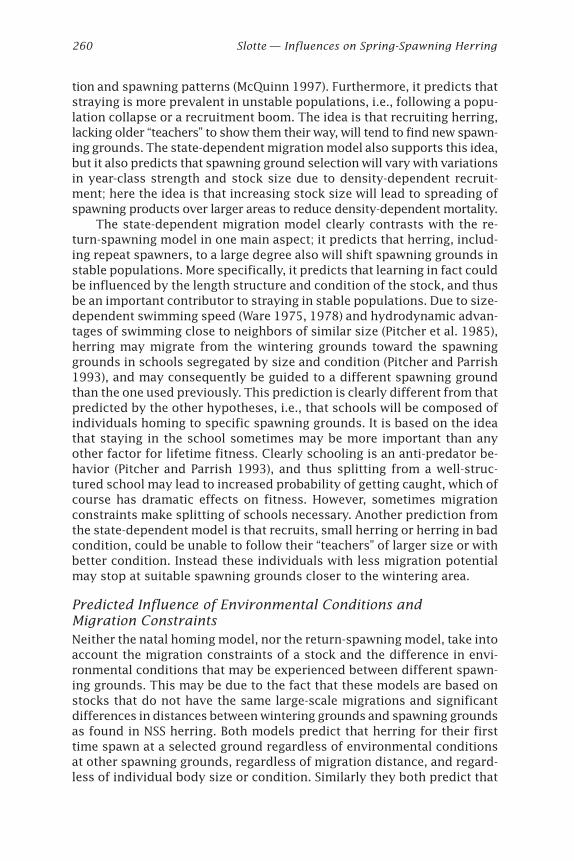
260 Slotte — Influences on Spring-Spawning Herring
tion and spawning patterns (McQuinn 1997). Furthermore, it predicts thatstraying is more prevalent in unstable populations, i.e., following a popu-lation collapse or a recruitment boom. The idea is that recruiting herring,lacking older “teachers” to show them their way, will tend to find new spawn-ing grounds. The state-dependent migration model also supports this idea,but it also predicts that spawning ground selection will vary with variationsin year-class strength and stock size due to density-dependent recruit-ment; here the idea is that increasing stock size will lead to spreading ofspawning products over larger areas to reduce density-dependent mortality.
The state-dependent migration model clearly contrasts with the re-turn-spawning model in one main aspect; it predicts that herring, includ-ing repeat spawners, to a large degree also will shift spawning grounds instable populations. More specifically, it predicts that learning in fact couldbe influenced by the length structure and condition of the stock, and thusbe an important contributor to straying in stable populations. Due to size-dependent swimming speed (Ware 1975, 1978) and hydrodynamic advan-tages of swimming close to neighbors of similar size (Pitcher et al. 1985),herring may migrate from the wintering grounds toward the spawninggrounds in schools segregated by size and condition (Pitcher and Parrish1993), and may consequently be guided to a different spawning groundthan the one used previously. This prediction is clearly different from thatpredicted by the other hypotheses, i.e., that schools will be composed ofindividuals homing to specific spawning grounds. It is based on the ideathat staying in the school sometimes may be more important than anyother factor for lifetime fitness. Clearly schooling is an anti-predator be-havior (Pitcher and Parrish 1993), and thus splitting from a well-struc-tured school may lead to increased probability of getting caught, which ofcourse has dramatic effects on fitness. However, sometimes migrationconstraints make splitting of schools necessary. Another prediction fromthe state-dependent model is that recruits, small herring or herring in badcondition, could be unable to follow their “teachers” of larger size or withbetter condition. Instead these individuals with less migration potentialmay stop at suitable spawning grounds closer to the wintering area.
Predicted Influence of Environmental Conditions andMigration ConstraintsNeither the natal homing model, nor the return-spawning model, take intoaccount the migration constraints of a stock and the difference in envi-ronmental conditions that may be experienced between different spawn-ing grounds. This may be due to the fact that these models are based onstocks that do not have the same large-scale migrations and significantdifferences in distances between wintering grounds and spawning groundsas found in NSS herring. Both models predict that herring for their firsttime spawn at a selected ground regardless of environmental conditionsat other spawning grounds, regardless of migration distance, and regard-less of individual body size or condition. Similarly they both predict that
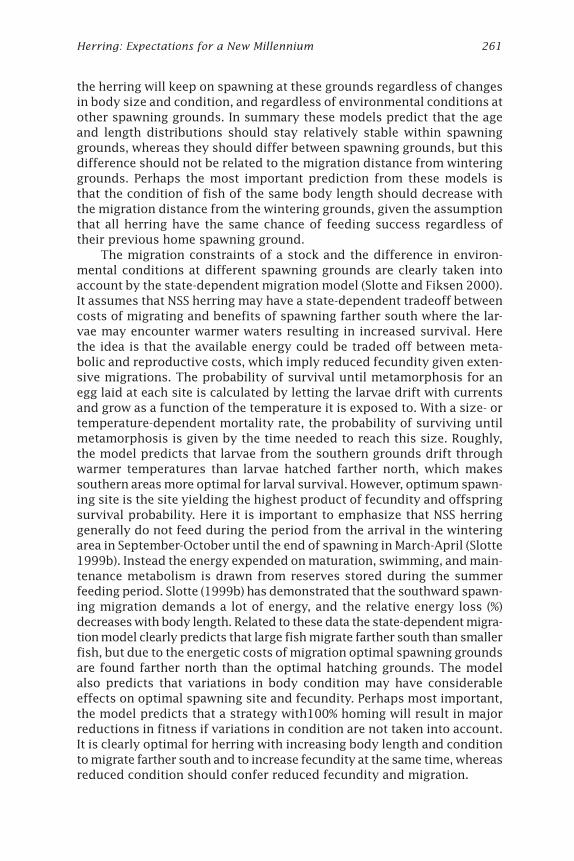
Herring: Expectations for a New Millennium 261
the herring will keep on spawning at these grounds regardless of changesin body size and condition, and regardless of environmental conditions atother spawning grounds. In summary these models predict that the ageand length distributions should stay relatively stable within spawninggrounds, whereas they should differ between spawning grounds, but thisdifference should not be related to the migration distance from winteringgrounds. Perhaps the most important prediction from these models isthat the condition of fish of the same body length should decrease withthe migration distance from the wintering grounds, given the assumptionthat all herring have the same chance of feeding success regardless oftheir previous home spawning ground.
The migration constraints of a stock and the difference in environ-mental conditions at different spawning grounds are clearly taken intoaccount by the state-dependent migration model (Slotte and Fiksen 2000).It assumes that NSS herring may have a state-dependent tradeoff betweencosts of migrating and benefits of spawning farther south where the lar-vae may encounter warmer waters resulting in increased survival. Herethe idea is that the available energy could be traded off between meta-bolic and reproductive costs, which imply reduced fecundity given exten-sive migrations. The probability of survival until metamorphosis for anegg laid at each site is calculated by letting the larvae drift with currentsand grow as a function of the temperature it is exposed to. With a size- ortemperature-dependent mortality rate, the probability of surviving untilmetamorphosis is given by the time needed to reach this size. Roughly,the model predicts that larvae from the southern grounds drift throughwarmer temperatures than larvae hatched farther north, which makessouthern areas more optimal for larval survival. However, optimum spawn-ing site is the site yielding the highest product of fecundity and offspringsurvival probability. Here it is important to emphasize that NSS herringgenerally do not feed during the period from the arrival in the winteringarea in September-October until the end of spawning in March-April (Slotte1999b). Instead the energy expended on maturation, swimming, and main-tenance metabolism is drawn from reserves stored during the summerfeeding period. Slotte (1999b) has demonstrated that the southward spawn-ing migration demands a lot of energy, and the relative energy loss (%)decreases with body length. Related to these data the state-dependent migra-tion model clearly predicts that large fish migrate farther south than smallerfish, but due to the energetic costs of migration optimal spawning groundsare found farther north than the optimal hatching grounds. The modelalso predicts that variations in body condition may have considerableeffects on optimal spawning site and fecundity. Perhaps most important,the model predicts that a strategy with100% homing will result in majorreductions in fitness if variations in condition are not taken into account.It is clearly optimal for herring with increasing body length and conditionto migrate farther south and to increase fecundity at the same time, whereasreduced condition should confer reduced fecundity and migration.
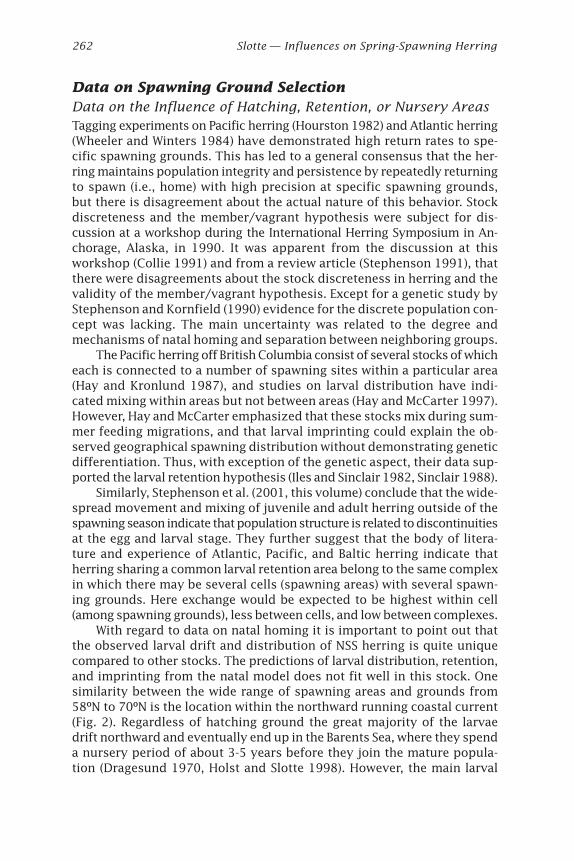
262 Slotte — Influences on Spring-Spawning Herring
Data on Spawning Ground SelectionData on the Influence of Hatching, Retention, or Nursery AreasTagging experiments on Pacific herring (Hourston 1982) and Atlantic herring(Wheeler and Winters 1984) have demonstrated high return rates to spe-cific spawning grounds. This has led to a general consensus that the her-ring maintains population integrity and persistence by repeatedly returningto spawn (i.e., home) with high precision at specific spawning grounds,but there is disagreement about the actual nature of this behavior. Stockdiscreteness and the member/vagrant hypothesis were subject for dis-cussion at a workshop during the International Herring Symposium in An-chorage, Alaska, in 1990. It was apparent from the discussion at thisworkshop (Collie 1991) and from a review article (Stephenson 1991), thatthere were disagreements about the stock discreteness in herring and thevalidity of the member/vagrant hypothesis. Except for a genetic study byStephenson and Kornfield (1990) evidence for the discrete population con-cept was lacking. The main uncertainty was related to the degree andmechanisms of natal homing and separation between neighboring groups.
The Pacific herring off British Columbia consist of several stocks of whicheach is connected to a number of spawning sites within a particular area(Hay and Kronlund 1987), and studies on larval distribution have indi-cated mixing within areas but not between areas (Hay and McCarter 1997).However, Hay and McCarter emphasized that these stocks mix during sum-mer feeding migrations, and that larval imprinting could explain the ob-served geographical spawning distribution without demonstrating geneticdifferentiation. Thus, with exception of the genetic aspect, their data sup-ported the larval retention hypothesis (Iles and Sinclair 1982, Sinclair 1988).
Similarly, Stephenson et al. (2001, this volume) conclude that the wide-spread movement and mixing of juvenile and adult herring outside of thespawning season indicate that population structure is related to discontinuitiesat the egg and larval stage. They further suggest that the body of litera-ture and experience of Atlantic, Pacific, and Baltic herring indicate thatherring sharing a common larval retention area belong to the same complexin which there may be several cells (spawning areas) with several spawn-ing grounds. Here exchange would be expected to be highest within cell(among spawning grounds), less between cells, and low between complexes.
With regard to data on natal homing it is important to point out thatthe observed larval drift and distribution of NSS herring is quite uniquecompared to other stocks. The predictions of larval distribution, retention,and imprinting from the natal model does not fit well in this stock. Onesimilarity between the wide range of spawning areas and grounds from58ºN to 70ºN is the location within the northward running coastal current(Fig. 2). Regardless of hatching ground the great majority of the larvaedrift northward and eventually end up in the Barents Sea, where they spenda nursery period of about 3-5 years before they join the mature popula-tion (Dragesund 1970, Holst and Slotte 1998). However, the main larval
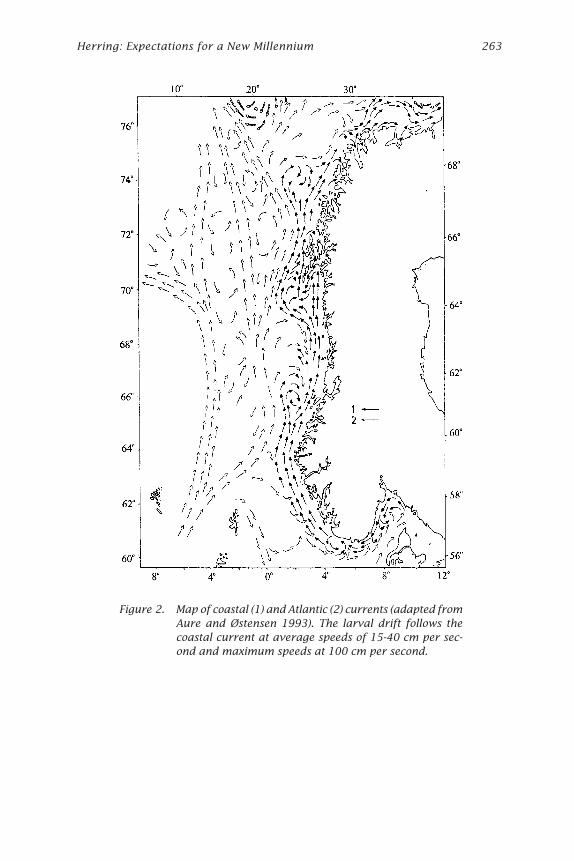
Herring: Expectations for a New Millennium 263
Figure 2. Map of coastal (1) and Atlantic (2) currents (adapted fromAure and Østensen 1993). The larval drift follows thecoastal current at average speeds of 15-40 cm per sec-ond and maximum speeds at 100 cm per second.
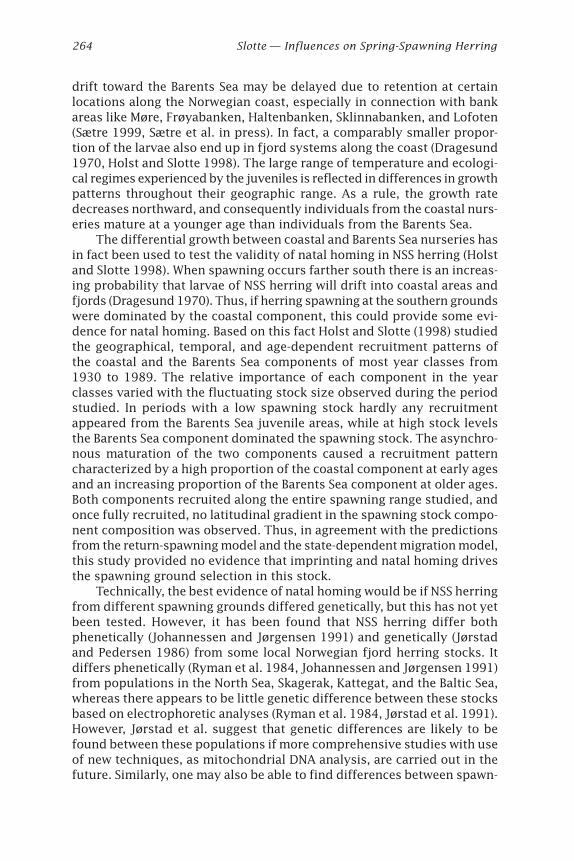
264 Slotte — Influences on Spring-Spawning Herring
drift toward the Barents Sea may be delayed due to retention at certainlocations along the Norwegian coast, especially in connection with bankareas like Møre, Frøyabanken, Haltenbanken, Sklinnabanken, and Lofoten(Sætre 1999, Sætre et al. in press). In fact, a comparably smaller propor-tion of the larvae also end up in fjord systems along the coast (Dragesund1970, Holst and Slotte 1998). The large range of temperature and ecologi-cal regimes experienced by the juveniles is reflected in differences in growthpatterns throughout their geographic range. As a rule, the growth ratedecreases northward, and consequently individuals from the coastal nurs-eries mature at a younger age than individuals from the Barents Sea.
The differential growth between coastal and Barents Sea nurseries hasin fact been used to test the validity of natal homing in NSS herring (Holstand Slotte 1998). When spawning occurs farther south there is an increas-ing probability that larvae of NSS herring will drift into coastal areas andfjords (Dragesund 1970). Thus, if herring spawning at the southern groundswere dominated by the coastal component, this could provide some evi-dence for natal homing. Based on this fact Holst and Slotte (1998) studiedthe geographical, temporal, and age-dependent recruitment patterns ofthe coastal and the Barents Sea components of most year classes from1930 to 1989. The relative importance of each component in the yearclasses varied with the fluctuating stock size observed during the periodstudied. In periods with a low spawning stock hardly any recruitmentappeared from the Barents Sea juvenile areas, while at high stock levelsthe Barents Sea component dominated the spawning stock. The asynchro-nous maturation of the two components caused a recruitment patterncharacterized by a high proportion of the coastal component at early agesand an increasing proportion of the Barents Sea component at older ages.Both components recruited along the entire spawning range studied, andonce fully recruited, no latitudinal gradient in the spawning stock compo-nent composition was observed. Thus, in agreement with the predictionsfrom the return-spawning model and the state-dependent migration model,this study provided no evidence that imprinting and natal homing drivesthe spawning ground selection in this stock.
Technically, the best evidence of natal homing would be if NSS herringfrom different spawning grounds differed genetically, but this has not yetbeen tested. However, it has been found that NSS herring differ bothphenetically (Johannessen and Jørgensen 1991) and genetically (Jørstadand Pedersen 1986) from some local Norwegian fjord herring stocks. Itdiffers phenetically (Ryman et al. 1984, Johannessen and Jørgensen 1991)from populations in the North Sea, Skagerak, Kattegat, and the Baltic Sea,whereas there appears to be little genetic difference between these stocksbased on electrophoretic analyses (Ryman et al. 1984, Jørstad et al. 1991).However, Jørstad et al. suggest that genetic differences are likely to befound between these populations if more comprehensive studies with useof new techniques, as mitochondrial DNA analysis, are carried out in thefuture. Similarly, one may also be able to find differences between spawn-
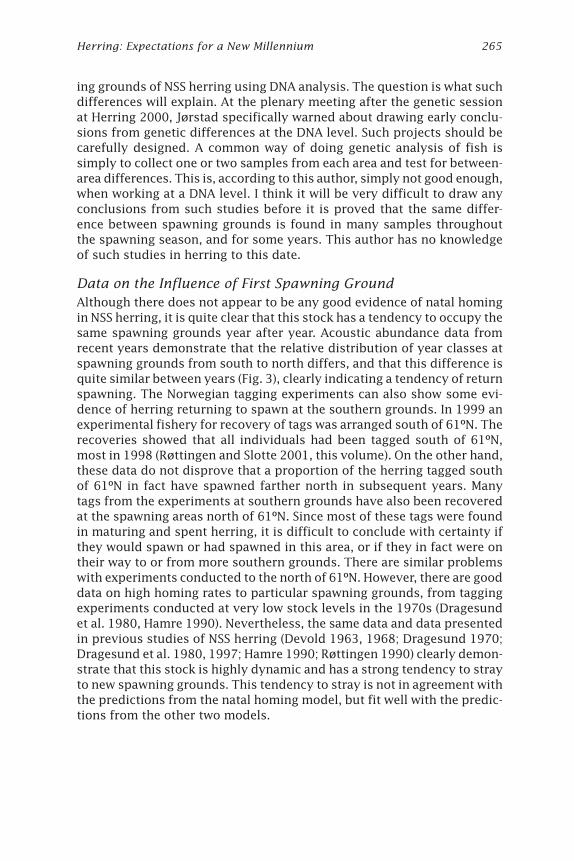
Herring: Expectations for a New Millennium 265
ing grounds of NSS herring using DNA analysis. The question is what suchdifferences will explain. At the plenary meeting after the genetic sessionat Herring 2000, Jørstad specifically warned about drawing early conclu-sions from genetic differences at the DNA level. Such projects should becarefully designed. A common way of doing genetic analysis of fish issimply to collect one or two samples from each area and test for between-area differences. This is, according to this author, simply not good enough,when working at a DNA level. I think it will be very difficult to draw anyconclusions from such studies before it is proved that the same differ-ence between spawning grounds is found in many samples throughoutthe spawning season, and for some years. This author has no knowledgeof such studies in herring to this date.
Data on the Influence of First Spawning GroundAlthough there does not appear to be any good evidence of natal homingin NSS herring, it is quite clear that this stock has a tendency to occupy thesame spawning grounds year after year. Acoustic abundance data fromrecent years demonstrate that the relative distribution of year classes atspawning grounds from south to north differs, and that this difference isquite similar between years (Fig. 3), clearly indicating a tendency of returnspawning. The Norwegian tagging experiments can also show some evi-dence of herring returning to spawn at the southern grounds. In 1999 anexperimental fishery for recovery of tags was arranged south of 61ºN. Therecoveries showed that all individuals had been tagged south of 61ºN,most in 1998 (Røttingen and Slotte 2001, this volume). On the other hand,these data do not disprove that a proportion of the herring tagged southof 61ºN in fact have spawned farther north in subsequent years. Manytags from the experiments at southern grounds have also been recoveredat the spawning areas north of 61ºN. Since most of these tags were foundin maturing and spent herring, it is difficult to conclude with certainty ifthey would spawn or had spawned in this area, or if they in fact were ontheir way to or from more southern grounds. There are similar problemswith experiments conducted to the north of 61ºN. However, there are gooddata on high homing rates to particular spawning grounds, from taggingexperiments conducted at very low stock levels in the 1970s (Dragesundet al. 1980, Hamre 1990). Nevertheless, the same data and data presentedin previous studies of NSS herring (Devold 1963, 1968; Dragesund 1970;Dragesund et al. 1980, 1997; Hamre 1990; Røttingen 1990) clearly demon-strate that this stock is highly dynamic and has a strong tendency to strayto new spawning grounds. This tendency to stray is not in agreement withthe predictions from the natal homing model, but fit well with the predic-tions from the other two models.
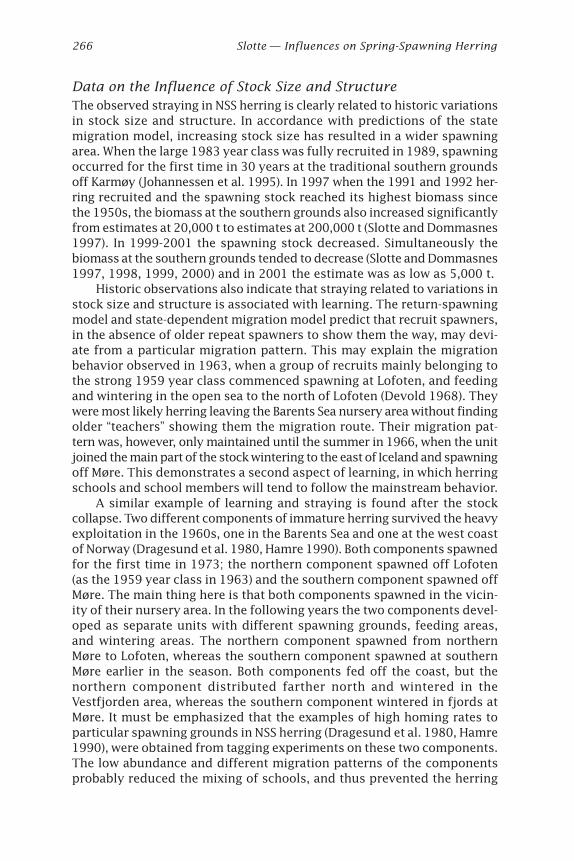
266 Slotte — Influences on Spring-Spawning Herring
Data on the Influence of Stock Size and StructureThe observed straying in NSS herring is clearly related to historic variationsin stock size and structure. In accordance with predictions of the statemigration model, increasing stock size has resulted in a wider spawningarea. When the large 1983 year class was fully recruited in 1989, spawningoccurred for the first time in 30 years at the traditional southern groundsoff Karmøy (Johannessen et al. 1995). In 1997 when the 1991 and 1992 her-ring recruited and the spawning stock reached its highest biomass sincethe 1950s, the biomass at the southern grounds also increased significantlyfrom estimates at 20,000 t to estimates at 200,000 t (Slotte and Dommasnes1997). In 1999-2001 the spawning stock decreased. Simultaneously thebiomass at the southern grounds tended to decrease (Slotte and Dommasnes1997, 1998, 1999, 2000) and in 2001 the estimate was as low as 5,000 t.
Historic observations also indicate that straying related to variations instock size and structure is associated with learning. The return-spawningmodel and state-dependent migration model predict that recruit spawners,in the absence of older repeat spawners to show them the way, may devi-ate from a particular migration pattern. This may explain the migrationbehavior observed in 1963, when a group of recruits mainly belonging tothe strong 1959 year class commenced spawning at Lofoten, and feedingand wintering in the open sea to the north of Lofoten (Devold 1968). Theywere most likely herring leaving the Barents Sea nursery area without findingolder “teachers” showing them the migration route. Their migration pat-tern was, however, only maintained until the summer in 1966, when the unitjoined the main part of the stock wintering to the east of Iceland and spawningoff Møre. This demonstrates a second aspect of learning, in which herringschools and school members will tend to follow the mainstream behavior.
A similar example of learning and straying is found after the stockcollapse. Two different components of immature herring survived the heavyexploitation in the 1960s, one in the Barents Sea and one at the west coastof Norway (Dragesund et al. 1980, Hamre 1990). Both components spawnedfor the first time in 1973; the northern component spawned off Lofoten(as the 1959 year class in 1963) and the southern component spawned offMøre. The main thing here is that both components spawned in the vicin-ity of their nursery area. In the following years the two components devel-oped as separate units with different spawning grounds, feeding areas,and wintering areas. The northern component spawned from northernMøre to Lofoten, whereas the southern component spawned at southernMøre earlier in the season. Both components fed off the coast, but thenorthern component distributed farther north and wintered in theVestfjorden area, whereas the southern component wintered in fjords atMøre. It must be emphasized that the examples of high homing rates toparticular spawning grounds in NSS herring (Dragesund et al. 1980, Hamre1990), were obtained from tagging experiments on these two components.The low abundance and different migration patterns of the componentsprobably reduced the mixing of schools, and thus prevented the herring
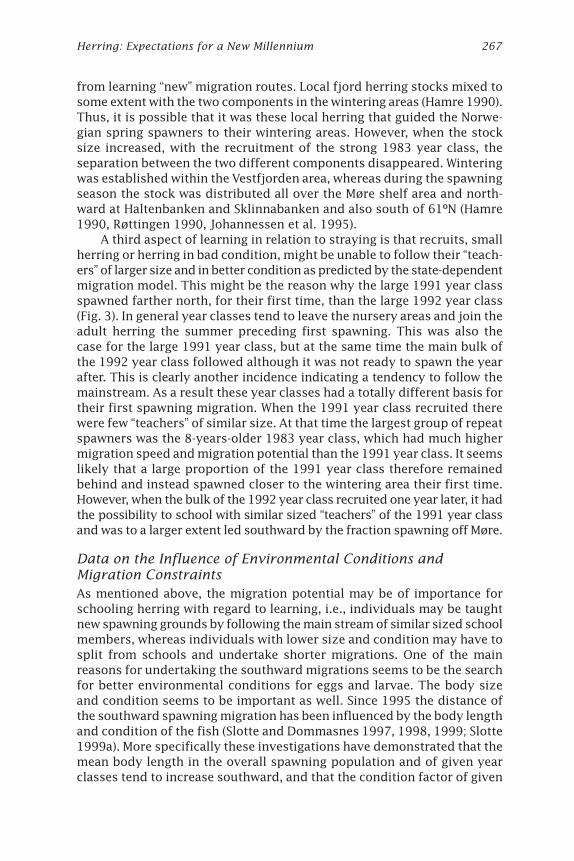
Herring: Expectations for a New Millennium 267
from learning “new” migration routes. Local fjord herring stocks mixed tosome extent with the two components in the wintering areas (Hamre 1990).Thus, it is possible that it was these local herring that guided the Norwe-gian spring spawners to their wintering areas. However, when the stocksize increased, with the recruitment of the strong 1983 year class, theseparation between the two different components disappeared. Winteringwas established within the Vestfjorden area, whereas during the spawningseason the stock was distributed all over the Møre shelf area and north-ward at Haltenbanken and Sklinnabanken and also south of 61ºN (Hamre1990, Røttingen 1990, Johannessen et al. 1995).
A third aspect of learning in relation to straying is that recruits, smallherring or herring in bad condition, might be unable to follow their “teach-ers” of larger size and in better condition as predicted by the state-dependentmigration model. This might be the reason why the large 1991 year classspawned farther north, for their first time, than the large 1992 year class(Fig. 3). In general year classes tend to leave the nursery areas and join theadult herring the summer preceding first spawning. This was also thecase for the large 1991 year class, but at the same time the main bulk ofthe 1992 year class followed although it was not ready to spawn the yearafter. This is clearly another incidence indicating a tendency to follow themainstream. As a result these year classes had a totally different basis fortheir first spawning migration. When the 1991 year class recruited therewere few “teachers” of similar size. At that time the largest group of repeatspawners was the 8-years-older 1983 year class, which had much highermigration speed and migration potential than the 1991 year class. It seemslikely that a large proportion of the 1991 year class therefore remainedbehind and instead spawned closer to the wintering area their first time.However, when the bulk of the 1992 year class recruited one year later, it hadthe possibility to school with similar sized “teachers” of the 1991 year classand was to a larger extent led southward by the fraction spawning off Møre.
Data on the Influence of Environmental Conditions andMigration ConstraintsAs mentioned above, the migration potential may be of importance forschooling herring with regard to learning, i.e., individuals may be taughtnew spawning grounds by following the main stream of similar sized schoolmembers, whereas individuals with lower size and condition may have tosplit from schools and undertake shorter migrations. One of the mainreasons for undertaking the southward migrations seems to be the searchfor better environmental conditions for eggs and larvae. The body sizeand condition seems to be important as well. Since 1995 the distance ofthe southward spawning migration has been influenced by the body lengthand condition of the fish (Slotte and Dommasnes 1997, 1998, 1999; Slotte1999a). More specifically these investigations have demonstrated that themean body length in the overall spawning population and of given yearclasses tend to increase southward, and that the condition factor of given
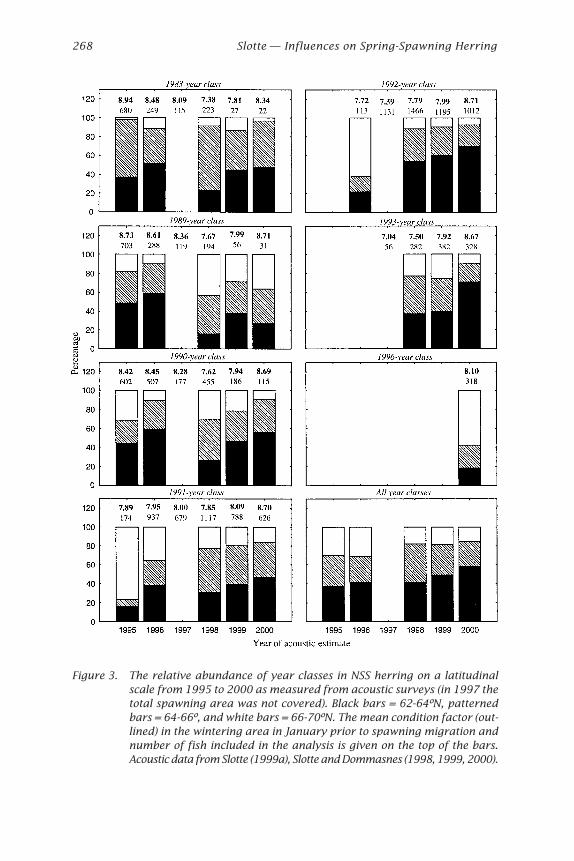
268 Slotte — Influences on Spring-Spawning Herring
Figure 3. The relative abundance of year classes in NSS herring on a latitudinalscale from 1995 to 2000 as measured from acoustic surveys (in 1997 thetotal spawning area was not covered). Black bars = 62-64ºN, patternedbars = 64-66º, and white bars = 66-70ºN. The mean condition factor (out-lined) in the wintering area in January prior to spawning migration andnumber of fish included in the analysis is given on the top of the bars.Acoustic data from Slotte (1999a), Slotte and Dommasnes (1998, 1999, 2000).
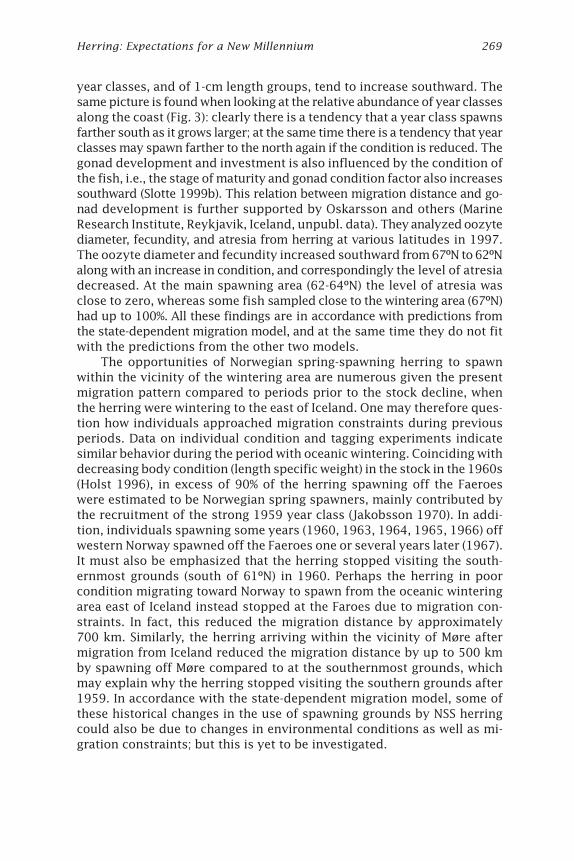
Herring: Expectations for a New Millennium 269
year classes, and of 1-cm length groups, tend to increase southward. Thesame picture is found when looking at the relative abundance of year classesalong the coast (Fig. 3): clearly there is a tendency that a year class spawnsfarther south as it grows larger; at the same time there is a tendency that yearclasses may spawn farther to the north again if the condition is reduced. Thegonad development and investment is also influenced by the condition ofthe fish, i.e., the stage of maturity and gonad condition factor also increasessouthward (Slotte 1999b). This relation between migration distance and go-nad development is further supported by Oskarsson and others (MarineResearch Institute, Reykjavik, Iceland, unpubl. data). They analyzed oozytediameter, fecundity, and atresia from herring at various latitudes in 1997.The oozyte diameter and fecundity increased southward from 67ºN to 62ºNalong with an increase in condition, and correspondingly the level of atresiadecreased. At the main spawning area (62-64ºN) the level of atresia wasclose to zero, whereas some fish sampled close to the wintering area (67ºN)had up to 100%. All these findings are in accordance with predictions fromthe state-dependent migration model, and at the same time they do not fitwith the predictions from the other two models.
The opportunities of Norwegian spring-spawning herring to spawnwithin the vicinity of the wintering area are numerous given the presentmigration pattern compared to periods prior to the stock decline, whenthe herring were wintering to the east of Iceland. One may therefore ques-tion how individuals approached migration constraints during previousperiods. Data on individual condition and tagging experiments indicatesimilar behavior during the period with oceanic wintering. Coinciding withdecreasing body condition (length specific weight) in the stock in the 1960s(Holst 1996), in excess of 90% of the herring spawning off the Faeroeswere estimated to be Norwegian spring spawners, mainly contributed bythe recruitment of the strong 1959 year class (Jakobsson 1970). In addi-tion, individuals spawning some years (1960, 1963, 1964, 1965, 1966) offwestern Norway spawned off the Faeroes one or several years later (1967).It must also be emphasized that the herring stopped visiting the south-ernmost grounds (south of 61ºN) in 1960. Perhaps the herring in poorcondition migrating toward Norway to spawn from the oceanic winteringarea east of Iceland instead stopped at the Faroes due to migration con-straints. In fact, this reduced the migration distance by approximately700 km. Similarly, the herring arriving within the vicinity of Møre aftermigration from Iceland reduced the migration distance by up to 500 kmby spawning off Møre compared to at the southernmost grounds, whichmay explain why the herring stopped visiting the southern grounds after1959. In accordance with the state-dependent migration model, some ofthese historical changes in the use of spawning grounds by NSS herringcould also be due to changes in environmental conditions as well as mi-gration constraints; but this is yet to be investigated.
270 Slotte — Influences on Spring-Spawning Herring
Which Model Fits Best with the Observed SpawningGround Selection?The observed data on NSS herring larva distribution and spawning groundselection does not fit well with the predictions from the natal homingmodel. Such a model would only fit the Stephenson et al. (2001) model ofcomplexes, cells, and spawning grounds, if one concluded that NSS herringis a large complex, with one single 1,500 km wide egg distribution area.Many of the predictions from the return-spawning migration model aboutstraying with variations in stock size and structure fits quite well with thedata. Nevertheless, this model fails to take into account the variations inenvironmental conditions between spawning grounds and the costs ofreaching them. It fails to predict the observed selection of spawning groundsin relation to body length and condition. If homing, whether it is natal orsimply return spawning, was of crucial importance in this stock, then oneshould expect that individuals would select spawning grounds along thecoast independently of body length or condition, but they do not. In addi-tion, due to the high costs of migration, one should expect decreasingcondition southward, but the opposite relationship is observed. It seemsthat larger individuals and/or individuals in better condition choose bothto migrate a longer distance southward and invest more energy into gonads.Individuals in very weak condition may spawn close to the wintering areawith reduced fecundity or even skip a season through total absorption ofthe eggs (atresia). Thus, the predictions from the state-dependent migra-tion model fit the data very well in every aspect. There appears to be noother plausible models that would yield the same fit between predictionsand data, and therefore this hypothesis is found to be the true one (Table 1).
It seems likely that a state-dependent migration behavior could havebeen adapted in this highly migratory stock, since this behavior appar-ently is advantageous for individual fitness. However, although the state-dependent migration model fits well within the NSS herring dynamics, itmight not fit in other stocks. The natal homing model and the return-spawning model has been developed from observations on less migratorystocks, and they may very well be true in many other stocks. Neverthe-less, one weakness of these models is the missing link to evolutionaryaspects like fitness. It seems that Darwin’s words that evolution has devel-oped by “survival of the fittest” have less meaning in these models com-pared to the state-dependent migration model.
Spawning TimeObservations at herring spawning grounds have indicated that they arriveand spawn in waves, and that this is related to the age and length struc-ture of the population. However, there is disagreement about how spawn-ing time is related to length or age and how many spawning waves theremight be. The next analysis will evaluate two different hypotheses on thisaspect in NSS herring.
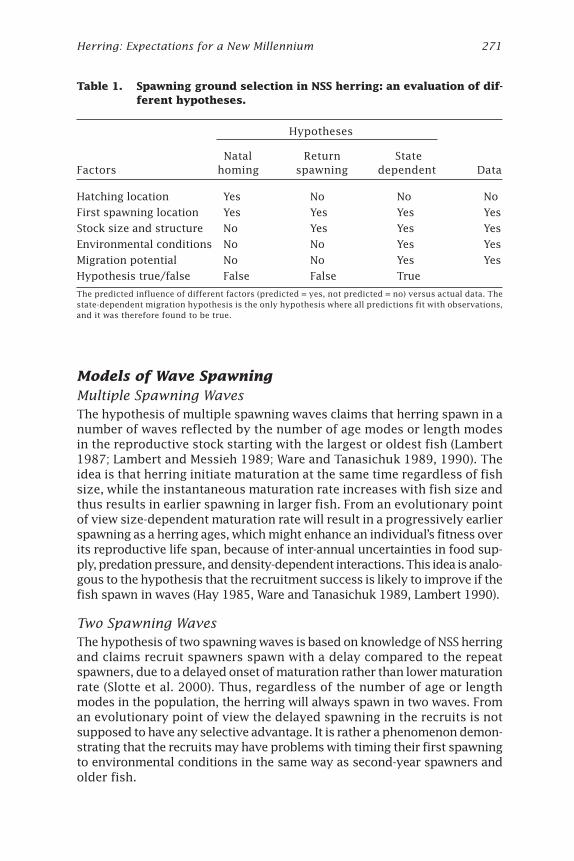
Herring: Expectations for a New Millennium 271
Models of Wave SpawningMultiple Spawning WavesThe hypothesis of multiple spawning waves claims that herring spawn in anumber of waves reflected by the number of age modes or length modesin the reproductive stock starting with the largest or oldest fish (Lambert1987; Lambert and Messieh 1989; Ware and Tanasichuk 1989, 1990). Theidea is that herring initiate maturation at the same time regardless of fishsize, while the instantaneous maturation rate increases with fish size andthus results in earlier spawning in larger fish. From an evolutionary pointof view size-dependent maturation rate will result in a progressively earlierspawning as a herring ages, which might enhance an individual’s fitness overits reproductive life span, because of inter-annual uncertainties in food sup-ply, predation pressure, and density-dependent interactions. This idea is analo-gous to the hypothesis that the recruitment success is likely to improve if thefish spawn in waves (Hay 1985, Ware and Tanasichuk 1989, Lambert 1990).
Two Spawning WavesThe hypothesis of two spawning waves is based on knowledge of NSS herringand claims recruit spawners spawn with a delay compared to the repeatspawners, due to a delayed onset of maturation rather than lower maturationrate (Slotte et al. 2000). Thus, regardless of the number of age or lengthmodes in the population, the herring will always spawn in two waves. Froman evolutionary point of view the delayed spawning in the recruits is notsupposed to have any selective advantage. It is rather a phenomenon demon-strating that the recruits may have problems with timing their first spawningto environmental conditions in the same way as second-year spawners andolder fish.
Table 1. Spawning ground selection in NSS herring: an evaluation of dif-ferent hypotheses.
Hypotheses
Natal Return StateFactors homing spawning dependent Data
Hatching location Yes No No No
First spawning location Yes Yes Yes Yes
Stock size and structure No Yes Yes Yes
Environmental conditions No No Yes Yes
Migration potential No No Yes Yes
Hypothesis true/false False False True
The predicted influence of different factors (predicted = yes, not predicted = no) versus actual data. Thestate-dependent migration hypothesis is the only hypothesis where all predictions fit with observations,and it was therefore found to be true.
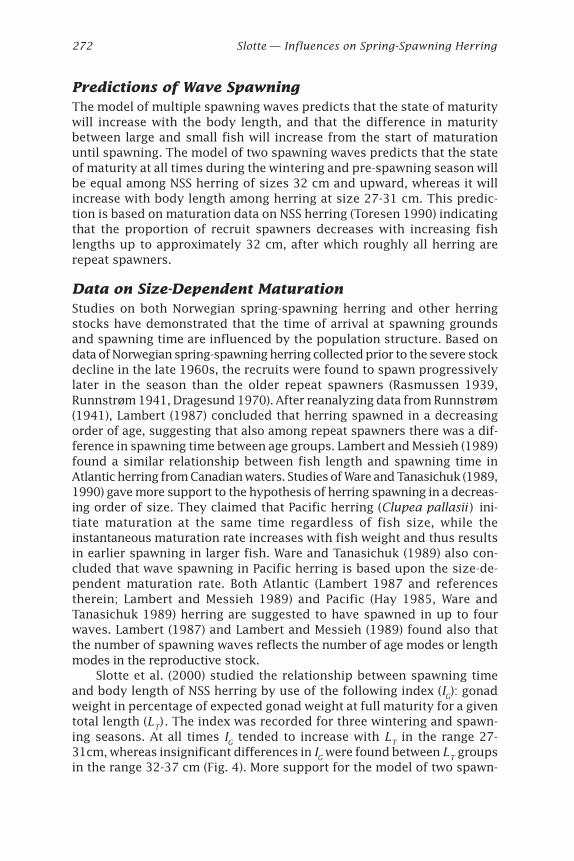
272 Slotte — Influences on Spring-Spawning Herring
Predictions of Wave SpawningThe model of multiple spawning waves predicts that the state of maturitywill increase with the body length, and that the difference in maturitybetween large and small fish will increase from the start of maturationuntil spawning. The model of two spawning waves predicts that the stateof maturity at all times during the wintering and pre-spawning season willbe equal among NSS herring of sizes 32 cm and upward, whereas it willincrease with body length among herring at size 27-31 cm. This predic-tion is based on maturation data on NSS herring (Toresen 1990) indicatingthat the proportion of recruit spawners decreases with increasing fishlengths up to approximately 32 cm, after which roughly all herring arerepeat spawners.
Data on Size-Dependent MaturationStudies on both Norwegian spring-spawning herring and other herringstocks have demonstrated that the time of arrival at spawning groundsand spawning time are influenced by the population structure. Based ondata of Norwegian spring-spawning herring collected prior to the severe stockdecline in the late 1960s, the recruits were found to spawn progressivelylater in the season than the older repeat spawners (Rasmussen 1939,Runnstrøm 1941, Dragesund 1970). After reanalyzing data from Runnstrøm(1941), Lambert (1987) concluded that herring spawned in a decreasingorder of age, suggesting that also among repeat spawners there was a dif-ference in spawning time between age groups. Lambert and Messieh (1989)found a similar relationship between fish length and spawning time inAtlantic herring from Canadian waters. Studies of Ware and Tanasichuk (1989,1990) gave more support to the hypothesis of herring spawning in a decreas-ing order of size. They claimed that Pacific herring (Clupea pallasii ) ini-tiate maturation at the same time regardless of fish size, while theinstantaneous maturation rate increases with fish weight and thus resultsin earlier spawning in larger fish. Ware and Tanasichuk (1989) also con-cluded that wave spawning in Pacific herring is based upon the size-de-pendent maturation rate. Both Atlantic (Lambert 1987 and referencestherein; Lambert and Messieh 1989) and Pacific (Hay 1985, Ware andTanasichuk 1989) herring are suggested to have spawned in up to fourwaves. Lambert (1987) and Lambert and Messieh (1989) found also thatthe number of spawning waves reflects the number of age modes or lengthmodes in the reproductive stock.
Slotte et al. (2000) studied the relationship between spawning timeand body length of NSS herring by use of the following index (IG): gonadweight in percentage of expected gonad weight at full maturity for a giventotal length (LT). The index was recorded for three wintering and spawn-ing seasons. At all times IG tended to increase with LT in the range 27-31cm, whereas insignificant differences in IG were found between LT groupsin the range 32-37 cm (Fig. 4). More support for the model of two spawn-
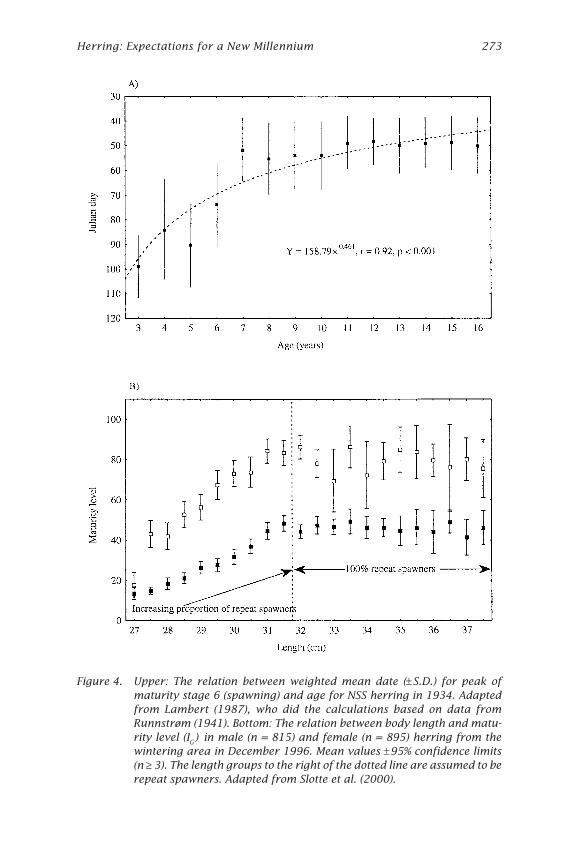
Herring: Expectations for a New Millennium 273
Figure 4. Upper: The relation between weighted mean date (±S.D.) for peak ofmaturity stage 6 (spawning) and age for NSS herring in 1934. Adaptedfrom Lambert (1987), who did the calculations based on data fromRunnstrøm (1941). Bottom: The relation between body length and matu-rity level (IG) in male (n = 815) and female (n = 895) herring from thewintering area in December 1996. Mean values ±95% confidence limits(n ≥ 3). The length groups to the right of the dotted line are assumed to berepeat spawners. Adapted from Slotte et al. (2000).
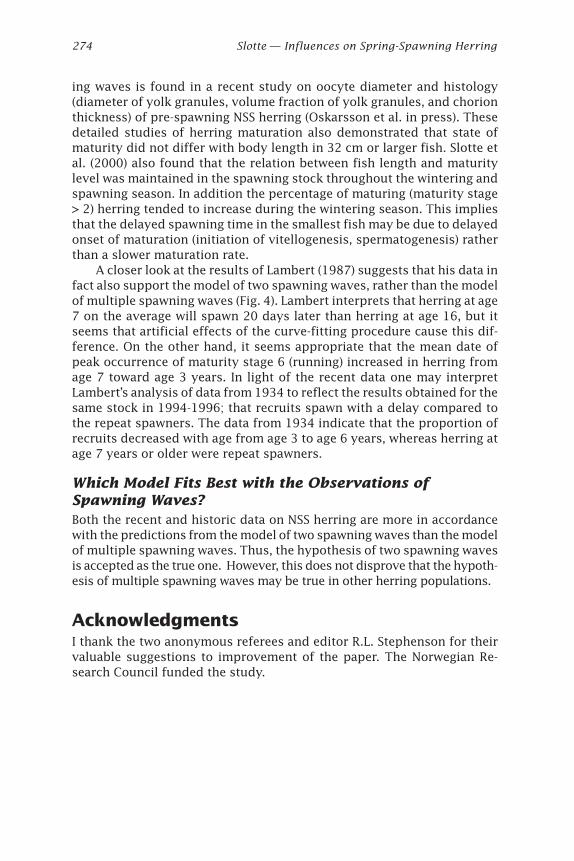
274 Slotte — Influences on Spring-Spawning Herring
ing waves is found in a recent study on oocyte diameter and histology(diameter of yolk granules, volume fraction of yolk granules, and chorionthickness) of pre-spawning NSS herring (Oskarsson et al. in press). Thesedetailed studies of herring maturation also demonstrated that state ofmaturity did not differ with body length in 32 cm or larger fish. Slotte etal. (2000) also found that the relation between fish length and maturitylevel was maintained in the spawning stock throughout the wintering andspawning season. In addition the percentage of maturing (maturity stage> 2) herring tended to increase during the wintering season. This impliesthat the delayed spawning time in the smallest fish may be due to delayedonset of maturation (initiation of vitellogenesis, spermatogenesis) ratherthan a slower maturation rate.
A closer look at the results of Lambert (1987) suggests that his data infact also support the model of two spawning waves, rather than the modelof multiple spawning waves (Fig. 4). Lambert interprets that herring at age7 on the average will spawn 20 days later than herring at age 16, but itseems that artificial effects of the curve-fitting procedure cause this dif-ference. On the other hand, it seems appropriate that the mean date ofpeak occurrence of maturity stage 6 (running) increased in herring fromage 7 toward age 3 years. In light of the recent data one may interpretLambert’s analysis of data from 1934 to reflect the results obtained for thesame stock in 1994-1996; that recruits spawn with a delay compared tothe repeat spawners. The data from 1934 indicate that the proportion ofrecruits decreased with age from age 3 to age 6 years, whereas herring atage 7 years or older were repeat spawners.
Which Model Fits Best with the Observations ofSpawning Waves?Both the recent and historic data on NSS herring are more in accordancewith the predictions from the model of two spawning waves than the modelof multiple spawning waves. Thus, the hypothesis of two spawning wavesis accepted as the true one. However, this does not disprove that the hypoth-esis of multiple spawning waves may be true in other herring populations.
AcknowledgmentsI thank the two anonymous referees and editor R.L. Stephenson for theirvaluable suggestions to improvement of the paper. The Norwegian Re-search Council funded the study.
Herring: Expectations for a New Millennium 275
ReferencesAure, J., and Ø. Østensen. 1993. Hydrographic normals and long-term variations in
Norwegian coastal waters. Fisken og Havet 6. (In Norwegian.)
Collie, J. (moderator). 1991. Workshop on member/vagrant hypothesis and stockdiscreteness. In: Proceedings of the International Herring Symposium 1990.University of Alaska Sea Grant, AK-SG-91-01, Fairbanks, pp. 641-657.
Devold, F. 1963. The life history of the Atlanto-Scandian herring. Rapp. P.V. Reun.Cons. Int. Explor. Mer 154:98-108.
Devold, F. 1968. The formation and the disappearance of a stock unit of Norwegianherring. Fiskeridir. Skr. Ser. Havunders. 15:1-15.
Dragesund, O. 1970. Factors influencing year-class strength of Norwegian springspawning herring (Clupea harengus L.). Fiskeridir. Skr. Ser. Havunders. 15:381-450.
Dragesund, O., J. Hamre, and Ø. Ulltang. 1980. Biology and population dynamics ofthe Norwegian spring spawning herring. Rapp. P.V. Reun. Cons. Int. Explor. Mer177:43-71.
Dragesund, O., A. Johannessen, and Ø. Ulltang. 1997. Variation in migration andabundance of Norwegian spring spawning herring (Clupea harengus L.). Sarsia82:97-105.
Haegele, C.W., and J.F. Schweigert. 1985. Distribution and characteristics of herringspawning behavior. Can. J. Fish. Aquat. Sci. 42(Suppl. 1):39-55.
Hamre, J. 1990. Life history and exploitation of the Norwegian spring-spawningherring. In: T. Monstad (ed.), Proceedings of the 4th Soviet-Norwegian Sympo-sium, 12-16 June 1989. Institute of Marine Research, Bergen, Norway, pp. 5-39
Hay, D.E. 1985. Reproductive biology of Pacific herring (Clupea harengus pallasi ).Can. J. Fish. Aquat. Sci. 42(Suppl. 1):111-126.
Hay, D.E., and A.R. Kronlund. 1987. Factors affecting the distribution, abundanceand measurements of Pacific herring (Clupea harengus pallasi ) spawn. Can. J.Fish. Aquat. Sci. 44:1181-1194.
Hay, D.E., and P.B. McCarter. 1997. Larval distribution, abundance, and stock struc-ture of British Colombia herring. J. Fish. Biol. 51(Suppl. A):155-175.
Holst, J.C. 1996. Long term trends in the growth and recruitment pattern of theNorwegian spring-spawning herring (Clupea harengus Linnaeus 1758). Ph. D.thesis, University of Bergen, Bergen, Norway. ISBN 82-77444-032-4.
Holst, J.C., and A. Slotte. 1998. Effects of juvenile nursery on geographic spawningdistribution in Norwegian spring spawning herring (Clupea harengus L.). ICESJ. Mar. Sci. 55:987-996.
Hourston, A.S. 1982. Homing by Canada’s west coast herring to management unitsand divisions as indicated by tag recoveries. Can. J. Fish. Aquat. Sci. 39:1414-1422.
Iles, T.D., and M. Sinclair. 1982. Atlantic herring: Stock discreteness and abundance.Science 215:627-633.
276 Slotte — Influences on Spring-Spawning Herring
Jakobsson, J. 1970. The biological position of the ‘Faeroese Bank’ herring withinthe Atlanto-Scandian herring stocks. ICES C.M. 1970/H:12.
Johannessen, A., and T. Jørgensen. 1991. Stock structure and classification of her-ring (Clupea harengus L.) in the North Sea, Skagerrak/Kattegat and WesternBaltic based on multivariate analysis of morphometric and meristic charac-ters. In: Proceedings of the International Herring Symposium. University ofAlaska Sea Grant, AK-SG-91-01, Fairbanks, pp. 223-244.
Johannessen, A., A. Slotte, O.A. Bergstad, O. Dragesund, and I. Røttingen. 1995.Reappearance of Norwegian spring spawning herring (Clupea harengus L.) atspawning grounds off south-western Norway. In: H.R. Skjoldal, C. Hopkins,K.E. Erikstad, and H.P. Leinaas (eds.), Ecology of fjords and coastal waters.Elsevier Science, pp. 347-363.
Jørstad, K.E., and S.A. Pedersen. 1986. Discrimination of herring populations in anorthern Norwegian fjord: Genetic and biological aspects. ICES C.M. 1986/M:63.
Jørstad, K.E., D.P.F. King, and G. Nævdal. 1991. Population structure of Atlanticherring Clupea harengus L. J. Fish. Biol. 39(Suppl. A):43-52.
Lambert, T.C. 1987. Duration and intensity of spawning in herring (Clupea haren-gus) as related to the age structure of the mature population. Mar. Ecol. Prog.Ser. 39:209-220.
Lambert, T.C. 1990. The effect of population structure on recruitment in herring. J.Cons. Int. Explor. Mer 47:249-255.
Lambert, T.C., and S.N. Messieh. 1989. Spawning dynamics of Gulf of St. Lawrenceherring (Clupea harengus). Can. J. Fish. Aquat. Sci. 46:2085-2094.
McNamara, J.M., and I. Houston. 1996. State-dependent life histories. Nature 380:215-221.
McQuinn, I.H. 1997. Metapopulations and the Atlantic herring. Rev. Fish Biol. Fish.7:297-329.
Misund, O.A., H. Vilhjalmsson, S.H.I. Jakupsstovu, I. Røttingen, S. Belikov, O. Asthors-son, J. Blindheim, J. Jonsson, A. Krysov, S.A. Malmberg, and S. Sveinbjornsson.1998. Distribution, migration and abundance of Norwegian spring spawningherring in relation to the temperature and zooplankton biomass in the Norwe-gian Sea as recorded by coordinated surveys in spring and summer 1996.Sarsia 83:117-127.
Pitcher, T.J., and J.K. Parrish. 1993. Functions of shoaling behaviour in teleosts. In:T.J. Pitcher (ed.), The behaviour of teleost fishes, 2nd edn. Croom Helm, Lon-don, pp. 364-439
Pitcher, T.J., A.E. Magurran, and J.I. Edvards. 1985. Schooling mackerel and herringchoose neighbours of similar size. Mar. Biol. 86:319-322.
Rasmussen, T.H. 1939. Fluktuasjoner i vintersildens utvikling og gyting. Rep. Nor-weg. Fish. Invest. 6(1):70-73. (In Norwegian.)
Herring: Expectations for a New Millennium 277
Røttingen, I. 1990. The 1983 year class of Norwegian spring spawning herring asjuveniles and recruit spawners. In: T. Monstad (ed.), Proceedings of the 4thSoviet-Norwegian Symposium. Institute of Marine Research, Bergen, Norway,pp. 165-203.
Røttingen, I., and A. Slotte. 2001. The relevance of a former important spawningarea in the present life history and management of Norwegian spring spawn-ing herring. In: F. Funk, J. Blackburn, D. Hay, A.J. Paul, R. Stephenson, R. Tore-sen, and D. Witherell (eds.), Herring: Expectations for a new millennium.University of Alaska Sea Grant, AK-SG-01-04, Fairbanks. (This volume.)
Runnstrøm, S. 1941. Quantitative investigations on herring spawning and its year-ly fluctuations at the west coast of Norway. Fiskeridir. Skr. Ser. Havunders.6(8):5-71.
Ryman, N.U., L. Lagercrantz, R. Andersson, R. Chakraborky, and R. Rosenberg. 1984.Lack of correspondence between genetic and morphologic variability patternsin Atlantic herring. Heredity 53:687-704.
Sætre, R. 1999. Features of the central Norwegian shelf circulation. Cont. Shelf.Res. 19(14):1809-1831.
Sætre, R., R. Toresen, H. Søiland, and P. Fossum. 2002. The Norwegian spring spawn-ing herring: Spawning, larval drift, and retention. Sarsia 87. In press.
Sinclair, M. 1988. Marine populations: An essay on population regulation and spe-ciation. Washington Sea Grant Program/ University of Washington Press, Seat-tle. 252 pp.
Slotte, A. 1999a. Effects of fish length and condition on spawning migration inNorwegian spring spawning herring (Clupea harengus L.). Sarsia 84:111-127.
Slotte, A. 1999b. Differential utilisation of energy during wintering and spawningmigration in Norwegian spring spawning herring (Clupea harengus L.). J. Fish.Biol. 54:338-355.
Slotte, A., and A. Dommasnes, A. 1997. Abundance estimation of Norwegian springspawning herring at spawning grounds 20 February-18 March 1997. Instituteof Marine Research Internal Report No. 4, Bergen, Norway. 10 pp.
Slotte, A., and A. Dommasnes. 1998. Distribution and abundance of Norwegianspring spawning herring during the spawning season in 1998. Fisken og Havet5. 10 pp.
Slotte, A., and A. Dommasnes. 1999. Distribution and abundance of Norwegianspring spawning herring during the spawning season in 1999. Fisken og Havet12. 27 pp.
Slotte, A., and A. Dommasnes. 2000. Distribution and abundance of Norwegianspring spawning herring during the spawning season in 2000. Fisken og Havet10. 18 pp.
Slotte, A., and Ø. Fiksen. 2000. State-dependent spawning migration in Norwegianspring spawning herring (Clupea harengus L.). J. Fish. Biol. 56:138-162.
Slotte, A., A. Johannessen, and O. Kjesbu. 2000. Effects of fish size on spawningtime in Norwegian spring spawning herring. J. Fish. Biol. 56:295-310.
278 Slotte — Influences on Spring-Spawning Herring
Stephenson, R.L. 1991. Stock discreteness in Atlantic herring: A review of argu-ments for and against. In: Proceedings of the International Herring Sympo-sium. University of Alaska Sea Grant, AK-SG-91-01, Fairbanks, pp. 659-666.
Stephenson, R.L., and I. Kornfield. 1990. Reappearance of spawning Atlantic her-ring (Clupea harengus harengus) on Georges Bank: Population resurgence notrecolonization. Can. J. Fish. Aquat. Sci. 47:1060-1064.
Stephenson, R.L., K.J. Clark, M.J. Power, F.J. Fife, and G.D. Melvin. 2001. Herringstock structure, stock discreteness, and biodiversity. In: F. Funk, J. Blackburn,D. Hay, A.J. Paul, R. Stephenson, R. Toresen, and D. Witherell (eds.), Herring:Expectations for a new millennium. University of Alaska Sea Grant, AK-SG-01-04, Fairbanks. (This volume.)
Toresen, R. 1990. Long term changes in growth and maturation in Norwegian spring-spawning herring. In: T. Monstad ed.), Proceedings of the 4th Soviet-Norwe-gian Symposium. Institute of Marine Research, Bergen, Norway, pp. 89-106.
Ware, D.M. 1975. Growth, metabolism, and optimal swimming speed of a pelagicfish. J. Fish. Res. Board Can. 32:33-41.
Ware, D.M. 1978. Bioenergetics of pelagic fish: Theoretical change in swimmingspeed and ration with body size. J. Fish. Res. Board Can. 35(2):220-228.
Ware, D.M., and R.W. Tanasichuk. 1989. Biological basis of maturation and spawn-ing waves in Pacific herring (Clupea harengus pallasi ). Can. J. Fish. Aquat. Sci.46:1776-1784.
Ware, D.M., and R.W. Tanasichuk. 1990. A method for forecasting the timing ofripeness in Pacific herring (Clupea harengus pallasi ) females. Can. J. Fish.Aquat. Sci. 47:2375-2379.
Wheeler, J.P., and G.H. Winters. 1984. Homing of Atlantic herring (Clupea harengusharengus) in Newfoundland waters as indicated by tagging data. Can. J. Fish.Aquat. Sci. 41:108-117.
Herring: Expectations for a New Millennium 279Alaska Sea Grant College Program • AK-SG-01-04, 2001
Norwegian Spring-SpawningHerring (Clupea harengus)and Climate throughoutthe Twentieth CenturyReidar Toresen and Ole Johan ØstvedtInstitute of Marine Research, Bergen, Norway
AbstractA long-term virtual population analysis, VPA, (1907-1997) was made forNorwegian spring-spawning herring (NSSH). It shows that this herring stockhas had large fluctuations during the last century. The spawning stock bio-mass (SSB) increased from a rather low level in the early years of the twen-tieth century and reached around 14 million metric tons by 1930. The SSBdecreased to a level of around 10 million t by 1940, but increased again toa record high level of 16 million t by 1945. The stock then decreased overthe next 20-year period, and fell to a level of less than 50,000 t by the late1960s. Through the 1970s and 1980s the stock slowly recovered and afterthe recruitment of strong year classes in 1983, and in 1990, 1991, and1992 the stock recovered to a spawning stock biomass about 10 million t.
We found that the long-term changes in spawning stock abundanceare highly correlated with the long-term variations in the mean annualtemperature of the inflowing Atlantic water masses (through the Kola sec-tion) into the northeast Atlantic region. The recruitment is positively cor-related with the average temperature in the Kola section in the wintermonths, January-April, which indicates that environmental factors governthe large scale fluctuations in production for this herring stock.
This contribution is a summary of Toresen, R. and Østvedt, O.J. 2000. Variation in abundance of Norwe-gian spring-spawning herring (Clupea harengus, Clupeidae) throughout the 20th century and the influ-ence of climatic fluctuations. Blackwell Science Ltd, Fish and Fisheries, 2000, 1(3):231-256.
280 Toresen and Østvedt — Spring-Spawning Herring and Climate
IntroductionMarine fish populations vary in abundance. This was known long before itbecame a science to study fish abundances in the early years of this century,and has long caused challenges for both scientists and for fishery manag-ers throughout the world. The Norwegian spring-spawning herring (NSSH)is a stock which has undergone large fluctuations (Devold 1963, Dragesundand Ulltang 1978). One of the first scientists to take note of the variationsin fish abundance was Johan Hjort (1914) who described the variation inabundance of NSSH and a few other important fish stocks in the northeastAtlantic. Since then, it has been an everlasting challenge for scientists tofind the answer to what governs the great changes in abundance. Bits andpieces of the answer fall into place now and then for different stocks, butthe relation between physical oceanographic factors and biological pa-rameters has been shown for only a few stocks (Myers 1998, Ottersen etal. 1998; Michalsen et al. 1998).
An analytical assessment of a fish stock requires reliable fishery statis-tics and representative sampling of biological data from the fisheries (in-cluding age determination). Both these elements were fulfilled for the NSSHfrom the very start of sampling in the early 1900s, and it is therefore possibleto carry out a long-term analytical assessment of this stock. The paper onwhich this summary is based (Toresen and Østvedt 2000) contains detailson a long-term VPA ranging from 1907 to 1998 and an evaluation of the stockfluctuations in relation to the long-term changes in ocean climate in thenortheast Atlantic.
Material and MethodsThe VPAThe data and the method used for the long-term virtual population analy-sis (VPA) are presented in Toresen and Østvedt (2000).
For the period 1950 until 1998, the assessment data as presented byICES (1999) were used. Age distributions in the landings each year wereused to convert annual landings to catch in numbers at age for the period1907-1949. These numbers were used in a VPA-based back-calculationapplying Pope’s approximation (Pope 1972).
Stock Size and Recruitment in Relation to ClimateThe water temperature in the Kola section is a long data series with quarterlytemperature measurements from 1900 to present. Since 1921, the dataseries is of monthly measurements. The temperatures along the sectiongive an indication of the temperature regime in the water masses where theherring larvae live the first months of life. The annual average for 0-200 mfrom 1900 to 1997 (Bochkov 1982) and the average values for the monthsJanuary-April for the years 1921-1994 were used for the comparison with
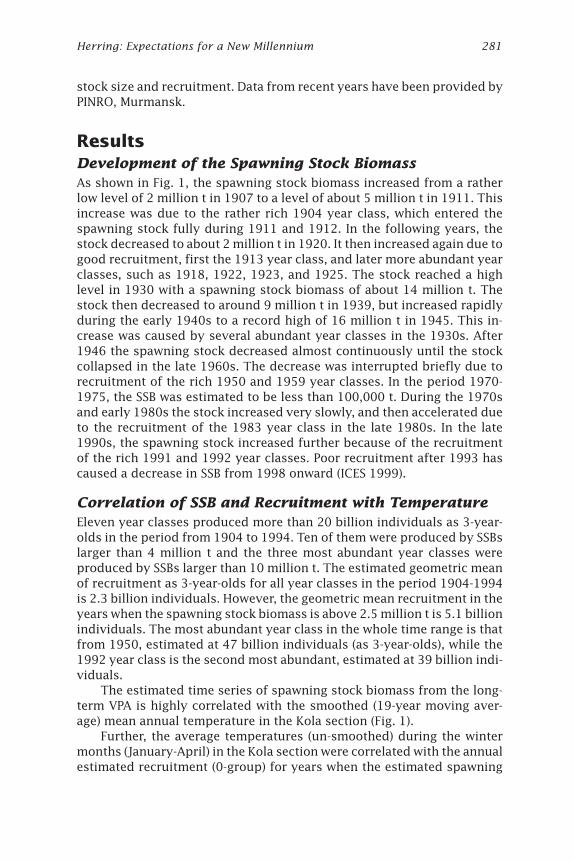
Herring: Expectations for a New Millennium 281
stock size and recruitment. Data from recent years have been provided byPINRO, Murmansk.
ResultsDevelopment of the Spawning Stock BiomassAs shown in Fig. 1, the spawning stock biomass increased from a ratherlow level of 2 million t in 1907 to a level of about 5 million t in 1911. Thisincrease was due to the rather rich 1904 year class, which entered thespawning stock fully during 1911 and 1912. In the following years, thestock decreased to about 2 million t in 1920. It then increased again due togood recruitment, first the 1913 year class, and later more abundant yearclasses, such as 1918, 1922, 1923, and 1925. The stock reached a highlevel in 1930 with a spawning stock biomass of about 14 million t. Thestock then decreased to around 9 million t in 1939, but increased rapidlyduring the early 1940s to a record high of 16 million t in 1945. This in-crease was caused by several abundant year classes in the 1930s. After1946 the spawning stock decreased almost continuously until the stockcollapsed in the late 1960s. The decrease was interrupted briefly due torecruitment of the rich 1950 and 1959 year classes. In the period 1970-1975, the SSB was estimated to be less than 100,000 t. During the 1970sand early 1980s the stock increased very slowly, and then accelerated dueto the recruitment of the 1983 year class in the late 1980s. In the late1990s, the spawning stock increased further because of the recruitmentof the rich 1991 and 1992 year classes. Poor recruitment after 1993 hascaused a decrease in SSB from 1998 onward (ICES 1999).
Correlation of SSB and Recruitment with TemperatureEleven year classes produced more than 20 billion individuals as 3-year-olds in the period from 1904 to 1994. Ten of them were produced by SSBslarger than 4 million t and the three most abundant year classes wereproduced by SSBs larger than 10 million t. The estimated geometric meanof recruitment as 3-year-olds for all year classes in the period 1904-1994is 2.3 billion individuals. However, the geometric mean recruitment in theyears when the spawning stock biomass is above 2.5 million t is 5.1 billionindividuals. The most abundant year class in the whole time range is thatfrom 1950, estimated at 47 billion individuals (as 3-year-olds), while the1992 year class is the second most abundant, estimated at 39 billion indi-viduals.
The estimated time series of spawning stock biomass from the long-term VPA is highly correlated with the smoothed (19-year moving aver-age) mean annual temperature in the Kola section (Fig. 1).
Further, the average temperatures (un-smoothed) during the wintermonths (January-April) in the Kola section were correlated with the annualestimated recruitment (0-group) for years when the estimated spawning
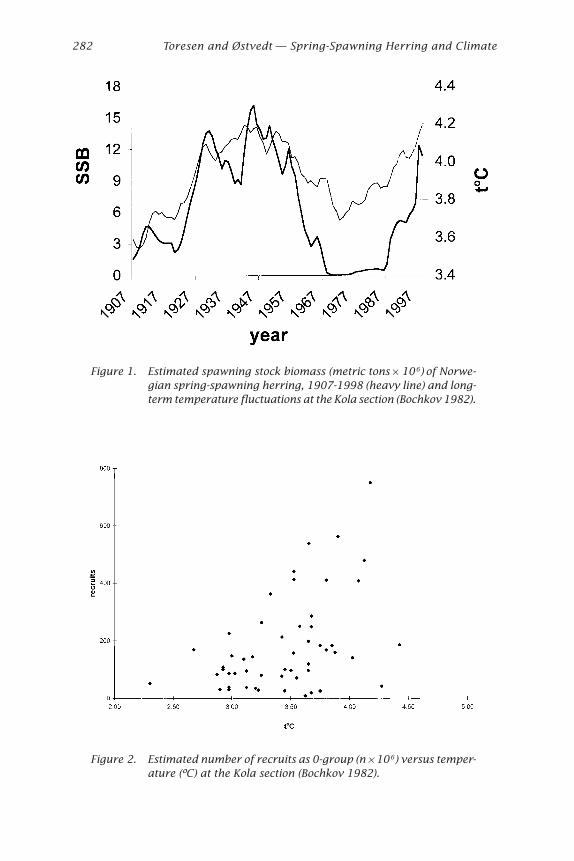
282 Toresen and Østvedt — Spring-Spawning Herring and Climate
Figure 1. Estimated spawning stock biomass (metric tons ¥ 106) of Norwe-gian spring-spawning herring, 1907-1998 (heavy line) and long-term temperature fluctuations at the Kola section (Bochkov 1982).
Figure 2. Estimated number of recruits as 0-group (n ¥ 106) versus temper-ature (ºC) at the Kola section (Bochkov 1982).
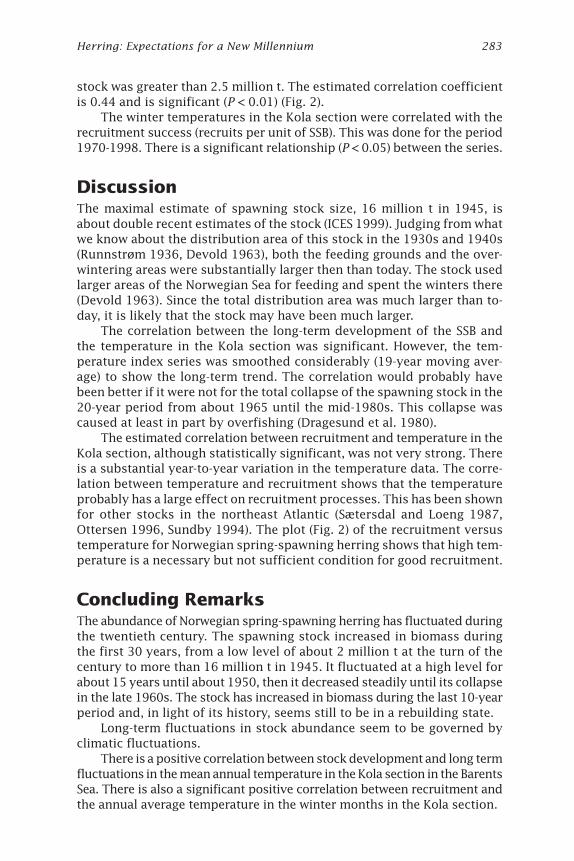
Herring: Expectations for a New Millennium 283
stock was greater than 2.5 million t. The estimated correlation coefficientis 0.44 and is significant (P < 0.01) (Fig. 2).
The winter temperatures in the Kola section were correlated with therecruitment success (recruits per unit of SSB). This was done for the period1970-1998. There is a significant relationship (P < 0.05) between the series.
DiscussionThe maximal estimate of spawning stock size, 16 million t in 1945, isabout double recent estimates of the stock (ICES 1999). Judging from whatwe know about the distribution area of this stock in the 1930s and 1940s(Runnstrøm 1936, Devold 1963), both the feeding grounds and the over-wintering areas were substantially larger then than today. The stock usedlarger areas of the Norwegian Sea for feeding and spent the winters there(Devold 1963). Since the total distribution area was much larger than to-day, it is likely that the stock may have been much larger.
The correlation between the long-term development of the SSB andthe temperature in the Kola section was significant. However, the tem-perature index series was smoothed considerably (19-year moving aver-age) to show the long-term trend. The correlation would probably havebeen better if it were not for the total collapse of the spawning stock in the20-year period from about 1965 until the mid-1980s. This collapse wascaused at least in part by overfishing (Dragesund et al. 1980).
The estimated correlation between recruitment and temperature in theKola section, although statistically significant, was not very strong. Thereis a substantial year-to-year variation in the temperature data. The corre-lation between temperature and recruitment shows that the temperatureprobably has a large effect on recruitment processes. This has been shownfor other stocks in the northeast Atlantic (Sætersdal and Loeng 1987,Ottersen 1996, Sundby 1994). The plot (Fig. 2) of the recruitment versustemperature for Norwegian spring-spawning herring shows that high tem-perature is a necessary but not sufficient condition for good recruitment.
Concluding RemarksThe abundance of Norwegian spring-spawning herring has fluctuated duringthe twentieth century. The spawning stock increased in biomass duringthe first 30 years, from a low level of about 2 million t at the turn of thecentury to more than 16 million t in 1945. It fluctuated at a high level forabout 15 years until about 1950, then it decreased steadily until its collapsein the late 1960s. The stock has increased in biomass during the last 10-yearperiod and, in light of its history, seems still to be in a rebuilding state.
Long-term fluctuations in stock abundance seem to be governed byclimatic fluctuations.
There is a positive correlation between stock development and long termfluctuations in the mean annual temperature in the Kola section in the BarentsSea. There is also a significant positive correlation between recruitment andthe annual average temperature in the winter months in the Kola section.
284 Toresen and Østvedt — Spring-Spawning Herring and Climate
ReferencesBochkov, Y.A. 1982. Water temperature in the 0-200 m layer in the Kola-Meridian in
the Barents Sea, 1900-1981. Sb. Nauchn. Trud. PINRO Murmansk 46:113-122.(In Russian.)
Devold, F. 1963. The life history of the Atlanto-Scandian herring. Rapp. P.V. Reun.Cons. Int. Explor. Mer 154:98-108.
Dragesund, O., and Ø. Ulltang. 1978. Stock size fluctuations and rate of exploita-tion of the Norwegian spring spawning herring, 1950-1974. Fiskeridir. Skr. Ser.Havunders. 16(10):315-337.
Dragesund, O., J. Hamre, and Ø. Ulltang. 1980. Biology and population dynamics ofthe Norwegian spring-spawning herring. Rapp. P.V. Reun. Cons. Perm. Int.Explor. Mer 177:43-71.
Hjort, J. 1914. Fluctuations in the great fisheries of Northern Europe viewed in thelight of biological research. Rapp. P.V. Reun. Cons. Int. Explor. Mer 20:1-228.
ICES. 1999. Report of the Northern Pelagic and Blue Whiting Fisheries WorkingGroup. ICES Headquarters, Copenhagen, Denmark, 27 April-5 May 1999. ICESC.M. 1999/ACFM:18.
Michalsen, K., G. Ottersen, and O. Nakken. 1998. Growth of north-east Arctic cod(Gadus morhua L.) in relation to ambient temperature. ICES J. Mar. Sci. 55:863-877.
Myers, R.A. 1998. When do environment-recruitment correlations work? Rev. FishBiol. Fish. 8:285-305.
Ottersen, G. 1996. Environmental impact on variability in recruitment, larval growthand distribution of Arcto-Norwegian cod. Dr. Scient. thesis, University of Ber-gen, Norway.
Ottersen, G., K. Michalsen, and O. Nakken. 1998. Ambient temperature and distri-bution of north-east Arctic cod. ICES J. Mar. Sci. 55:67-85.
Pope, J.G. 1972. An investigation of the accuracy of virtual population analysisusing cohort analysis. Int. Comm. Northwest Atl. Fish. Res. Bull. 9:65-74.
Runnstrøm, S. 1936. A study on the life history and migrations of the Norwegianspring-herring based on the analysis of the winter rings and summer zones ofthe scale. Fiskeridir. Skr. Ser. Havunders. 5(2):5-102.
Sætersdal, G., and L. Loeng. 1987. Ecological adaptation of reproduction in north-east arctic cod. Fish. Res. 5:253-270.
Sundby, S. 1994. The influence of bio-physical processes on fish recruitment in anarctic-boreal ecosystem. Ph.D. thesis, University of Bergen, Norway. 190 pp.
Toresen, R., and O.J. Østvedt. 2000. Variation in abundance of Norwegian spring-spawning herring (Clupea harengus, Clupeidae) throughout the 20th centuryand the influence of climatic fluctuations. Fish and Fisheries 2000, 1(3):231-256.
Herring: Expectations for a New Millennium 285Alaska Sea Grant College Program • AK-SG-01-04, 2001
Oocyte Degeneration in FemaleRecruits of Norwegian Spring-Spawning Herring (Clupeaharengus)G.P. Mazhirina and E.I. SeliverstovaKnipovich Polar Research Institute of Marine Fisheries and Oceanography(PINRO), Murmansk, Russia
AbstractIntensive trophoplasmatic growth of vitellogenic oocytes and simultaneousspawning are typical of Norwegian herring. Spawning occurs on spawninggrounds along the coast of Norway in February-March. In 1996-1997,samples of herring were collected for histological analysis on the spawn-ing grounds along the coast of Norway (62º30¢-65º30¢N) from late Febru-ary to mid-March. Catches consisted of herring at age 3-14 years of 26-39 cmtotal lengths. Specimens from the 1991 and 1992 abundant year classesmade up the bulk of spawning aggregations. In 1996, the recruits com-prised 36% of the samples and they were dominated by the Barents Seamigrants (88%). In 1997, the recruits comprised 50% of which the BarentsSea component dominated with 92%.
Resorption of oocytes was mainly noted in the Barents Sea recruits. In1996, those were the specimens from the 1991 year class. They consti-tuted 20% of the total amount of the recruits and 20.5% of the Barents Seacomponent. In 1997, atresia of oocytes was noted in herring from the1992 year class. This fish made up 31% of the total amount of the recruitsand 33% of the Barents Sea component. According to visual estimation theovaries in such specimens were at maturity stages III and IV. Resorption ofoocytes of all the stages of trophoplasmatic growth, from vacuolization toa termination of vitellogenesis, was histologically established to occur inovaries of the Barents Sea recruits. Fairly high percentage of such speci-mens from the 1991-1992 year classes indicates a possible unfavorableecological situation in the area of their occurrence.
286 Mazhirina and Seliverstova — Oocyte Degeneration in Herring
IntroductionBreach in the process of reproduction, in particular, of normal develop-ment of gonads and gametes, is observed both in freshwater and saltwa-ter fish. Degeneration of the oocytes results in a considerable reduction infecundity, disturbances in periodicity of spawning, and extension of timeof maturation. Degeneration of maturing reproductive products in saltwaterfish is, in most cases, considered to be a usual phenomenon observedunder the circumstances being unfavorable for spawning and which re-sult in delay of spawning and overmaturity of reproductive products. Insuch cases, the degeneration of gametes mainly occurs in preovulatoryand ovulatory periods (Galkina 1959, Koshelev 1984, Sacun and Svirsky1992). The investigations carried out during recent years (Kurita et al.2000) have shown that the resorption of oocytes was noted in repeatedspawners of Norwegian spring-spawning herring mainly during winteringin October-November. In connection with the above, the degeneration ofvitellogenic oocytes observed in spawning areas in recruits of Norwegianspring-spawning herring, which grew in the Barents Sea until the begin-ning of maturation (the Barents Sea component) and with the develop-ment of gonads migrated to the Norwegian Sea, is of undoubted interest.
Materials and MethodsOvaries of Norwegian spring-spawning herring were collected in the spawn-ing areas on banks from late February to mid-March 1996 (62º30¢-65º30¢N)and during the first half of March in the same area in 1997 (Table 1).
Herring specimens were aged by otoliths and scales. Specimens grownin the different areas: southern, northern, and Barents Sea, were distin-guished by scale structure (Ottestad 1934; Runnstrøm 1936; Seliverstova1968, 1970, 1977, 1990). A 7-point scale of gonad maturity was used.
In total, gonads from 191 females were fixed in Bouin’s fluid. Histo-logical treatment of gonads was done according to standard methods; i.e.,setting into alcohol of increasing concentration, paraffin-xylol, and thenputting in paraffin. Sections of 6-7 mm were stained with iron haematoxylinaccording to Heidenhein (Roskin and Levinson 1957).
ResultsThe histological samples gathered on the spawning grounds along thecoast of Norway during 1996-1997 (Table 1) comprised herring at age 3-14years (Table 2) of 26-39 cm total lengths. Specimens from the 1991 and1992 abundant year classes constituted the bulk of the spawning aggrega-tions. Age composition of herring from the histological samples agreedwith an age structure of its prespawning and spawning aggregations dur-ing those years.
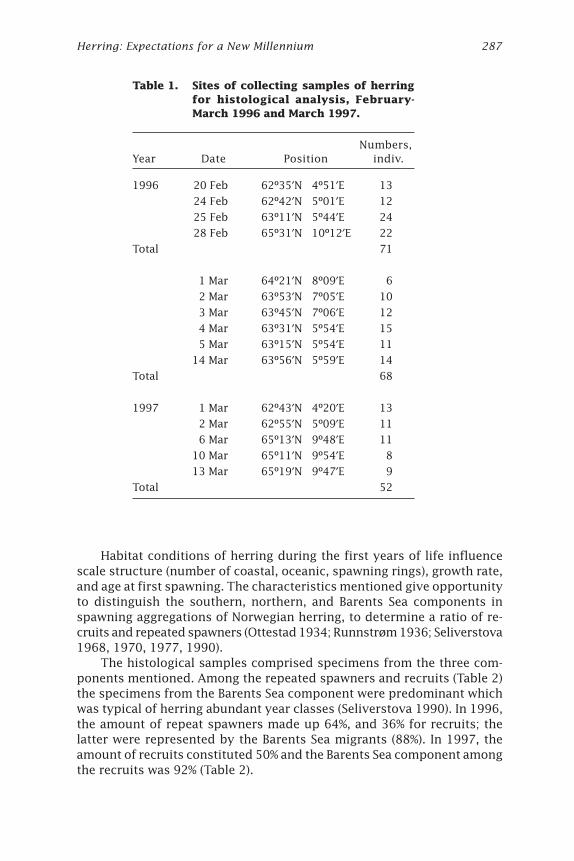
Herring: Expectations for a New Millennium 287
Habitat conditions of herring during the first years of life influencescale structure (number of coastal, oceanic, spawning rings), growth rate,and age at first spawning. The characteristics mentioned give opportunityto distinguish the southern, northern, and Barents Sea components inspawning aggregations of Norwegian herring, to determine a ratio of re-cruits and repeated spawners (Ottestad 1934; Runnstrøm 1936; Seliverstova1968, 1970, 1977, 1990).
The histological samples comprised specimens from the three com-ponents mentioned. Among the repeated spawners and recruits (Table 2)the specimens from the Barents Sea component were predominant whichwas typical of herring abundant year classes (Seliverstova 1990). In 1996,the amount of repeat spawners made up 64%, and 36% for recruits; thelatter were represented by the Barents Sea migrants (88%). In 1997, theamount of recruits constituted 50% and the Barents Sea component amongthe recruits was 92% (Table 2).
Table 1. Sites of collecting samples of herringfor histological analysis, February-March 1996 and March 1997.
Numbers,Year Date Position indiv.
1996 20 Feb 62º35¢N 4º51¢E 13
24 Feb 62º42¢N 5º01¢E 12
25 Feb 63º11¢N 5º44¢E 24
28 Feb 65º31¢N 10º12¢E 22
Total 71
1 Mar 64º21¢N 8º09¢E 6
2 Mar 63º53¢N 7º05¢E 10
3 Mar 63º45¢N 7º06¢E 12
4 Mar 63º31¢N 5º54¢E 15
5 Mar 63º15¢N 5º54¢E 11
14 Mar 63º56¢N 5º59¢E 14
Total 68
1997 1 Mar 62º43¢N 4º20¢E 13
2 Mar 62º55¢N 5º09¢E 11
6 Mar 65º13¢N 9º48¢E 11
10 Mar 65º11¢N 9º54¢E 8
13 Mar 65º19¢N 9º47¢E 9
Total 52
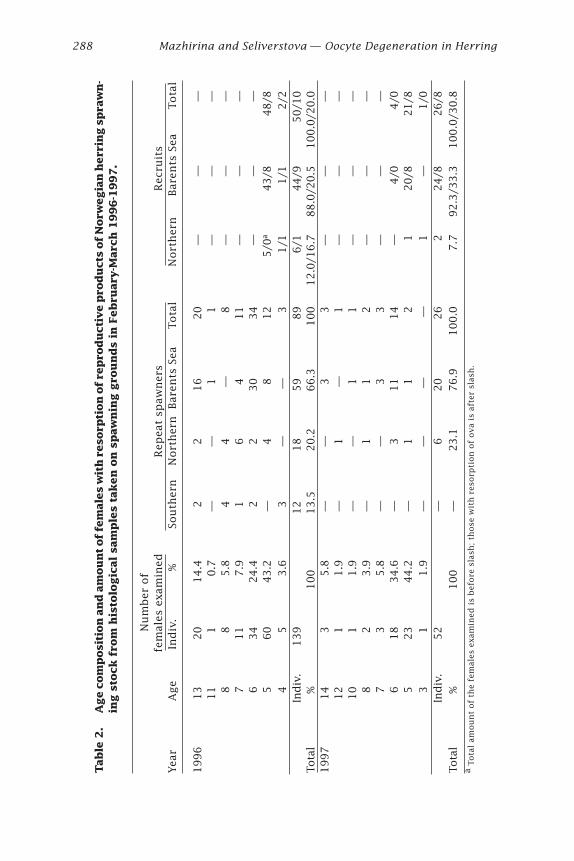
288 Mazhirina and Seliverstova — Oocyte Degeneration in Herring
Table
2.
Age c
om
posi
tion
an
d a
mou
nt of
fem
ale
s w
ith
reso
rpti
on
of
rep
rod
uct
ive p
rod
uct
s of
Norw
egia
n h
err
ing s
pra
wn
-in
g s
tock
fro
m h
isto
logic
al
sam
ple
s ta
ken
on
sp
aw
nin
g g
rou
nd
s in
Feb
ruary
-Marc
h 1
996-1
997.
N
um
ber
of
fem
ales
exa
min
ed
Rep
eat
spaw
ner
s
R
ecru
its
Year
A
ge
Ind
iv.
%
So
uth
ern
No
rth
ern
Bar
ents
Sea
To
tal
No
rth
ern
Bar
ents
Sea
T
ota
l
1996
13
20
14.4
22
16
20
——
—11
10.7
—
—
11
——
—8
85.8
44
—
8—
——
711
7.9
16
411
——
—6
34
24.4
22
30
34
——
—5
60
43.2
—
48
12
5/0
a43/8
48/8
45
3.6
3 —
—
31/1
1/1
2/2
In
div
.139
12
18
59
89
6/1
44/9
50/1
0To
tal
%100
13.5
20.2
66.3
100
12.0
/16.7
88.0
/20.5
100.0
/20.0
1997
14
35.8
—
—
33
——
—12
11.9
—
1 —
1—
——
10
11.9
—
—
11
——
—8
23.9
—
11
2—
——
73
5.8
—
—
33
——
—6
18
34.6
—
311
14
—4/0
4/0
523
44.2
—
11
21
20/8
21/8
31
1.9
—
—
—
—
1—
1/0
In
div
.52
—
620
26
224/8
26/8
Tota
l %
100
—
23.1
76.9
100.0
7.7
92.3
/33.3
100.0
/30.8
a To
tal
amo
un
t o
f th
e fe
mal
es e
xam
ined
is
bef
ore
sla
sh;
tho
se w
ith
res
orp
tio
n o
f o
va
is a
fter
sla
sh.
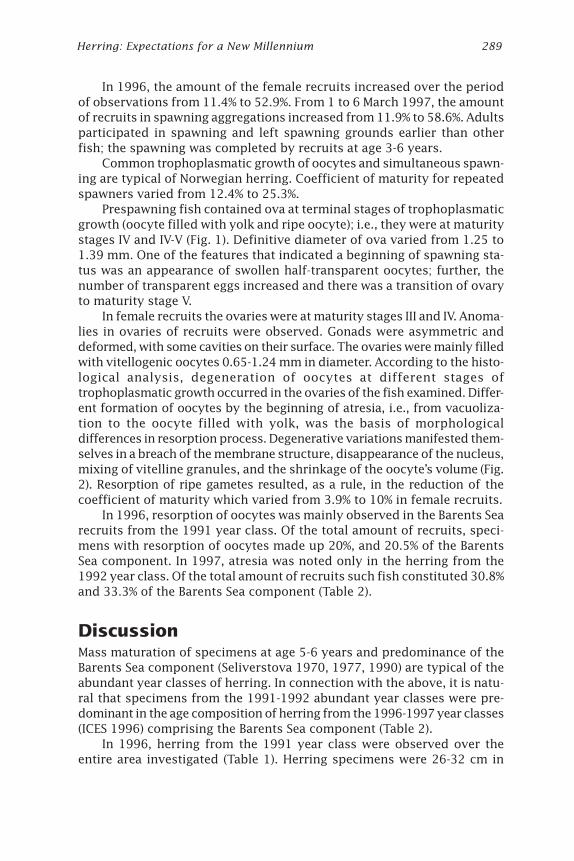
Herring: Expectations for a New Millennium 289
In 1996, the amount of the female recruits increased over the periodof observations from 11.4% to 52.9%. From 1 to 6 March 1997, the amountof recruits in spawning aggregations increased from 11.9% to 58.6%. Adultsparticipated in spawning and left spawning grounds earlier than otherfish; the spawning was completed by recruits at age 3-6 years.
Common trophoplasmatic growth of oocytes and simultaneous spawn-ing are typical of Norwegian herring. Coefficient of maturity for repeatedspawners varied from 12.4% to 25.3%.
Prespawning fish contained ova at terminal stages of trophoplasmaticgrowth (oocyte filled with yolk and ripe oocyte); i.e., they were at maturitystages IV and IV-V (Fig. 1). Definitive diameter of ova varied from 1.25 to1.39 mm. One of the features that indicated a beginning of spawning sta-tus was an appearance of swollen half-transparent oocytes; further, thenumber of transparent eggs increased and there was a transition of ovaryto maturity stage V.
In female recruits the ovaries were at maturity stages III and IV. Anoma-lies in ovaries of recruits were observed. Gonads were asymmetric anddeformed, with some cavities on their surface. The ovaries were mainly filledwith vitellogenic oocytes 0.65-1.24 mm in diameter. According to the histo-logical analysis, degeneration of oocytes at different stages oftrophoplasmatic growth occurred in the ovaries of the fish examined. Differ-ent formation of oocytes by the beginning of atresia, i.e., from vacuoliza-tion to the oocyte filled with yolk, was the basis of morphologicaldifferences in resorption process. Degenerative variations manifested them-selves in a breach of the membrane structure, disappearance of the nucleus,mixing of vitelline granules, and the shrinkage of the oocyte’s volume (Fig.2). Resorption of ripe gametes resulted, as a rule, in the reduction of thecoefficient of maturity which varied from 3.9% to 10% in female recruits.
In 1996, resorption of oocytes was mainly observed in the Barents Searecruits from the 1991 year class. Of the total amount of recruits, speci-mens with resorption of oocytes made up 20%, and 20.5% of the BarentsSea component. In 1997, atresia was noted only in the herring from the1992 year class. Of the total amount of recruits such fish constituted 30.8%and 33.3% of the Barents Sea component (Table 2).
DiscussionMass maturation of specimens at age 5-6 years and predominance of theBarents Sea component (Seliverstova 1970, 1977, 1990) are typical of theabundant year classes of herring. In connection with the above, it is natu-ral that specimens from the 1991-1992 abundant year classes were pre-dominant in the age composition of herring from the 1996-1997 year classes(ICES 1996) comprising the Barents Sea component (Table 2).
In 1996, herring from the 1991 year class were observed over theentire area investigated (Table 1). Herring specimens were 26-32 cm in
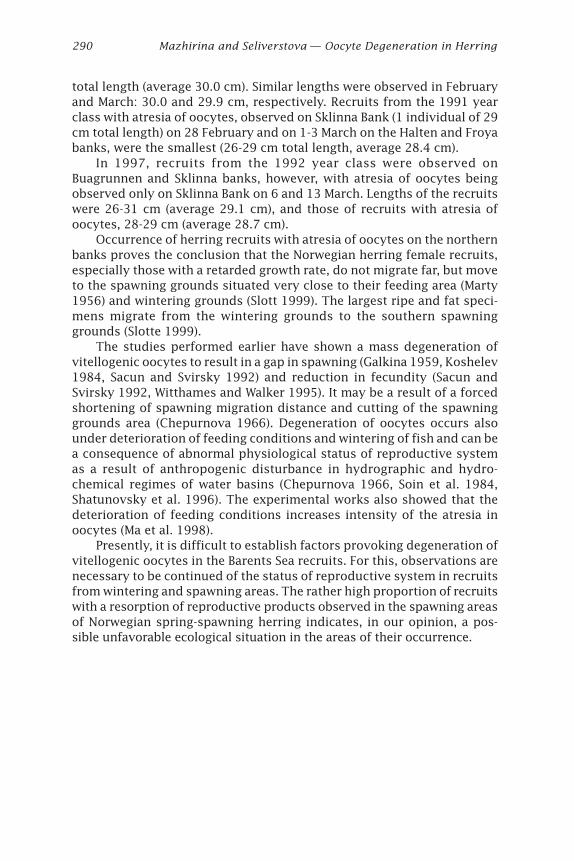
290 Mazhirina and Seliverstova — Oocyte Degeneration in Herring
total length (average 30.0 cm). Similar lengths were observed in Februaryand March: 30.0 and 29.9 cm, respectively. Recruits from the 1991 yearclass with atresia of oocytes, observed on Sklinna Bank (1 individual of 29cm total length) on 28 February and on 1-3 March on the Halten and Froyabanks, were the smallest (26-29 cm total length, average 28.4 cm).
In 1997, recruits from the 1992 year class were observed onBuagrunnen and Sklinna banks, however, with atresia of oocytes beingobserved only on Sklinna Bank on 6 and 13 March. Lengths of the recruitswere 26-31 cm (average 29.1 cm), and those of recruits with atresia ofoocytes, 28-29 cm (average 28.7 cm).
Occurrence of herring recruits with atresia of oocytes on the northernbanks proves the conclusion that the Norwegian herring female recruits,especially those with a retarded growth rate, do not migrate far, but moveto the spawning grounds situated very close to their feeding area (Marty1956) and wintering grounds (Slott 1999). The largest ripe and fat speci-mens migrate from the wintering grounds to the southern spawninggrounds (Slotte 1999).
The studies performed earlier have shown a mass degeneration ofvitellogenic oocytes to result in a gap in spawning (Galkina 1959, Koshelev1984, Sacun and Svirsky 1992) and reduction in fecundity (Sacun andSvirsky 1992, Witthames and Walker 1995). It may be a result of a forcedshortening of spawning migration distance and cutting of the spawninggrounds area (Chepurnova 1966). Degeneration of oocytes occurs alsounder deterioration of feeding conditions and wintering of fish and can bea consequence of abnormal physiological status of reproductive systemas a result of anthropogenic disturbance in hydrographic and hydro-chemical regimes of water basins (Chepurnova 1966, Soin et al. 1984,Shatunovsky et al. 1996). The experimental works also showed that thedeterioration of feeding conditions increases intensity of the atresia inoocytes (Ma et al. 1998).
Presently, it is difficult to establish factors provoking degeneration ofvitellogenic oocytes in the Barents Sea recruits. For this, observations arenecessary to be continued of the status of reproductive system in recruitsfrom wintering and spawning areas. The rather high proportion of recruitswith a resorption of reproductive products observed in the spawning areasof Norwegian spring-spawning herring indicates, in our opinion, a pos-sible unfavorable ecological situation in the areas of their occurrence.
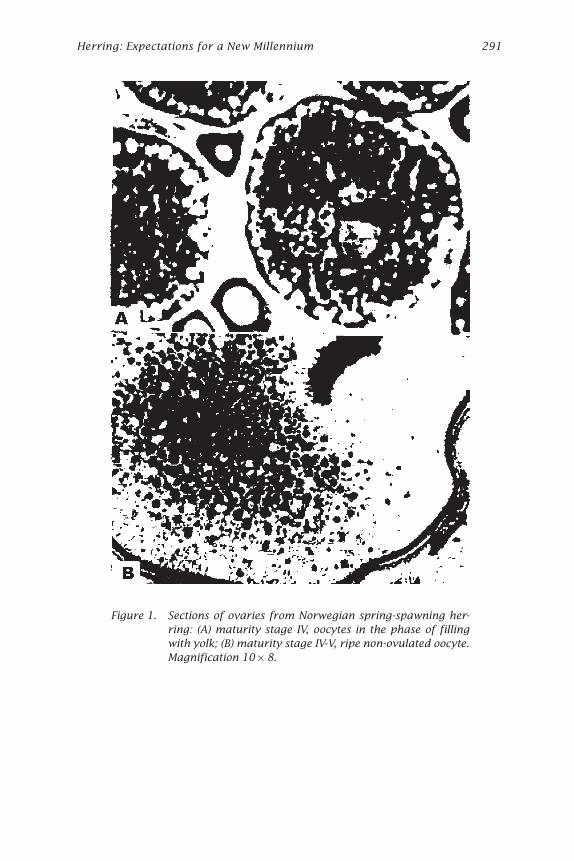
Herring: Expectations for a New Millennium 291
Figure 1. Sections of ovaries from Norwegian spring-spawning her-ring: (A) maturity stage IV, oocytes in the phase of fillingwith yolk; (B) maturity stage IV-V, ripe non-ovulated oocyte.Magnification 10 ¥ 8.
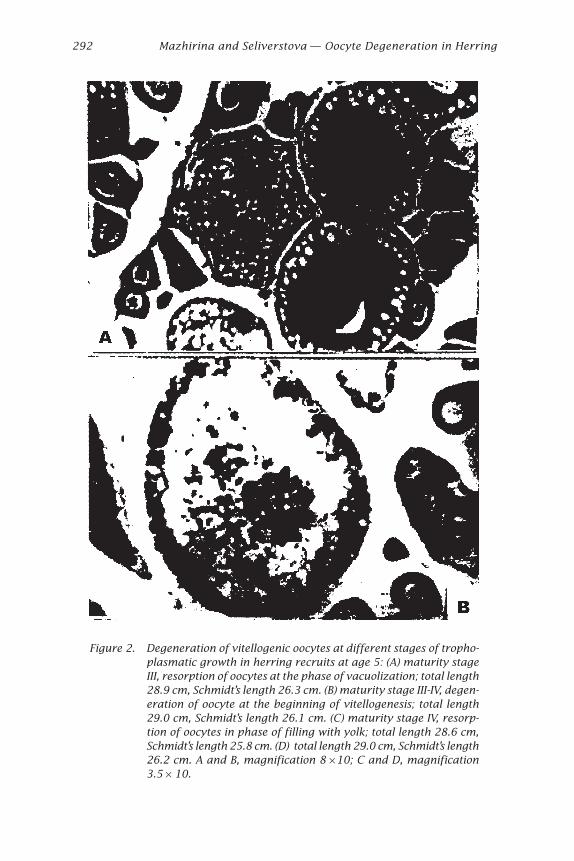
292 Mazhirina and Seliverstova — Oocyte Degeneration in Herring
Figure 2. Degeneration of vitellogenic oocytes at different stages of tropho-plasmatic growth in herring recruits at age 5: (A) maturity stageIII, resorption of oocytes at the phase of vacuolization; total length28.9 cm, Schmidt’s length 26.3 cm. (B) maturity stage III-IV, degen-eration of oocyte at the beginning of vitellogenesis; total length29.0 cm, Schmidt’s length 26.1 cm. (C) maturity stage IV, resorp-tion of oocytes in phase of filling with yolk; total length 28.6 cm,Schmidt’s length 25.8 cm. (D) total length 29.0 cm, Schmidt’s length26.2 cm. A and B, magnification 8 ¥ 10; C and D, magnification3.5 ¥ 10.
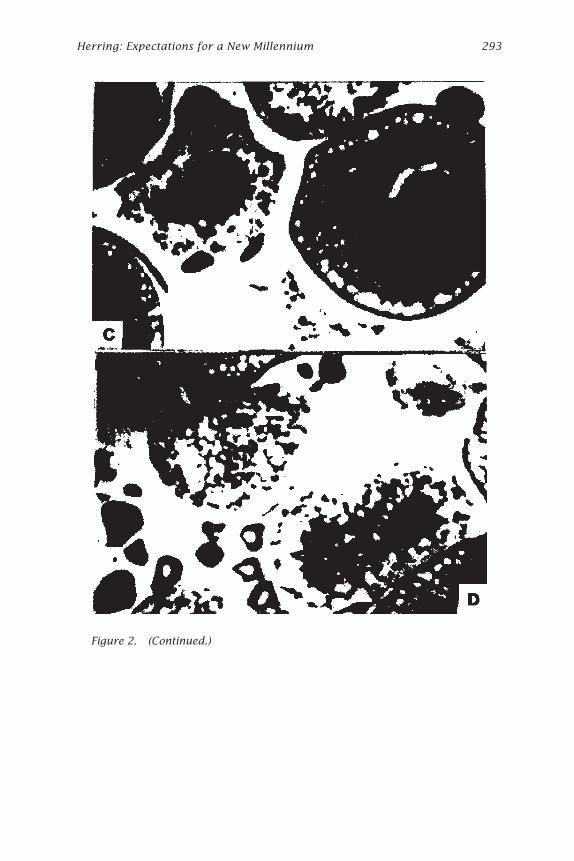
Herring: Expectations for a New Millennium 293
Figure 2. (Continued.)
294 Mazhirina and Seliverstova — Oocyte Degeneration in Herring
ReferencesChepurnova, L.V. 1966. The breaks in ovogenesis of Vimba vimba natio Carinata
(Pallas) due to the shortening of the route of spawning migration and to thediminished spawning area on the Dniester. Vopr. Ikhtiol. 6(1):51-58. (In Russian.)
Galkina, L.A. 1959. Degeneration phenomena in gametes of the Pacific herring.Papers of the USSR Academy of Sciences 126(2):404-405. (In Russian.)
ICES. 1996. Preliminary report of the international 0-group fish survey in the Bar-ents Sea and adjacent waters in August-September 1996. ICES C.M. 1996/G:31.37 pp.
Koshelev, B.V. 1984. Ecology of fish reproduction. Nauka Press, Moscow. 307 pp.(In Russian.)
Kurita, Y., A. Thoresen, M. Fonn, A. Svardal, and O.S. Kjesbu. 2000. Oocyte growthand fecundity regulation of Atlantic herring (Clupea harengus) in relation todeclining body reserves during overwintering. In: Proceedings of the SixthInternational Symposium on the Reproductive Physiology of Fish. Bergen, pp.85-87.
Ma, Y., O.S. Kjesbu, and T. Jørgensen. 1998. Effects of ration on the maturation andfecundity in captive Atlantic herring (Clupea harengus) . Can. J. Fish. Aquat.Sci. 55:900-908.
Marty, Yu.Yu. 1956. Main stages of the life-cycle of the Atlanto-Scandian herring. Tr.PINRO 9:5-61. (In Russian.)
Ottestad, P. 1934. Statistical analysis of the Norwegian herring population. Rapp.P.-V. Reun. Cons. Int. Explor. Mer 88:2-44.
Roskin, G.I., and L.V. Levinson. 1957. Microscopic instruments. Sovetskaya nauka,Moscow. 467 pp. (In Russian.)
Runnstrøm, S. 1936. A study on the life history and migration of the Norwegianspring herring based on the analysis of the winter rings and summer zones ofthe scale. Fiskeridir. Skr. 5(2). 103 pp.
Sacun, O.F., and V.G. Svirsky. 1992. Oocyte degeneration in the periods of perivitel-logenesis and vitellogenesis during reproductive cycle in the Pacific sardine,Sardinops sagax melanostica. Vopr. Ikhtiol. 32(3):52-58. (In Russian.)
Seliverstova, E.I. 1968. The problem of the determination of abundance of the BarentsSea population of the 1950 year-class of the Atlanto-Scandian herring stock inthe Norwegian Sea (according to data for 1954-1958). ICES C.M. 1968/H:12. 16 pp.
Seliverstova, E.I. 1970. Comparative characteristics of the Atlanto-Scandian her-ring of the 1950 and 1959 year-classes (ratio of types of growth: a rate ofsexual maturity). ICES C.M. 1970/H:21. 10 pp.
Seliverstova, E.I. 1977. The relationship between the growth and maturity rates ofthe Atlanto-Scandian herring and the structure of their year-classes. ICES C.M.1977/H:8. 39 pp.
Seliverstova, E.I. 1990. Recommendation on rational exploitation of the Atlanto-Scandian herring stock. PINRO, Murmansk. 83 pp. (In Russian.)

Herring: Expectations for a New Millennium 295
Shatunovsky, M.I., N.V. Akimova, and G.I. Ruban. 1996. Response of fish reproduc-tive system on the anthropogenous influence. Vopr. Ikhtiol. 36(2):229-238. (InRussian.)
Slotte, A. 1999. Effects of fish length and condition on spawning migration in Nor-wegian spring-spawning herring (Clupea harengus L.). Sarsia 84:111-127.
Soin, S.G., O.P. Danil’chenko, and A.S. Khandal’. 1984. Coaction of decreasing salin-ity and triethyl stannic chloride on the development of marine form ofthreespine stickleback Gasterosteus aculeatus L. (Gasterosteidae). Vopr. Ikhti-ol. 24(3):481-489. (In Russian.)
Witthames, P.R., and M.G. Walker. 1995. Determinacy of fecundity and oocyte atre-sia in sole (Solea solea) from the Channel, the North Sea and the Irish Sea.Aquat. Living Resour. 8(1):91-109.