HCMC CBD Market Report | Nov 2014
16
NOVEMBER 2014 | HCMC CENTRAL BUSINESS DISTRICT CBD MARKET REPORT HO CHI MINH CITY www.colliers.com/vietnam
-
Upload
colliers-international-vietnam -
Category
Real Estate
-
view
53 -
download
3
Transcript of HCMC CBD Market Report | Nov 2014
NOVEMBER 2014 | HCMC CENTRAL BUSINESS DISTRICT
CBD MARKET REpoRTHO CHI MINH CITY
www.colliers.com/vietnam
TABLE oF CoNTENTSHCMC CBD MARKET REpoRT | NoVEMBER 2014
Market Highlights
oFFICE MARKET
• Market overview
• Market performance
• outlook
• Table
RETAIL MARKET
• Market overview
• Market performance
• outlook
• Table
HoTEL MARKET
• Market overview
• Market performance
• outlook
• Table
SERVICED ApARTMENT
• Market performance
• outlook
• Table
CoNTACTS
page
2-4
2
3
3
4
4-6
4
4
5
6
6-8
7
7
8
8
8-10
8
9
9
10
. . . . . . . . . . . . . . . . . . . . . . . . . . . . . . . . . . . . . . . . . . . . . . . . . . . . . . . . . . . . . . . .
. . . . . . . . . . . . . . . . . . . . . . . . . . . . . . . . . . . . . . . . . . . . . . . . . . . . . . . . . . . . . . .
. . . . . . . . . . . . . . . . . . . . . . . . . . . . . . . . . . . . . . . . . . . . . . . . . . . . . . . . . . . . . . .
. . . . . . . . . . . . . . . . . . . . . . . . . . . . . . . . . . . . . . . . . . . . . . . . . . . . . . . . . . . . . . .
. . . . . . . . . . . . . . . . . . . . . . . . . . . . . . . . . . . . . . . . . . . . . . . . . . . . . . . . . . . . . . .
. . . . . . . . . . . . . . . . . . . . . . . . . . . . . . . . . . . . . . . . . . . . . . . . . . . . . . . . . . . . . . .
. . . . . . . . . . . . . . . . . . . . . . . . . . . . . . . . . . . . . . . . . . . . . . . . . . . . . . . . . . . . . . .
. . . . . . . . . . . . . . . . . . . . . . . . . . . . . . . . . . . . . . . . . . . . . . . . . . . . . . . . . . . . . . .
. . . . . . . . . . . . . . . . . . . . . . . . . . . . . . . . . . . . . . . . . . . . . . . . . . . . . . . . . . . . . . .
. . . . . . . . . . . . . . . . . . . . . . . . . . . . . . . . . . . . . . . . . . . . . . . . . . . . . . . . . . . . . . .
. . . . . . . . . . . . . . . . . . . . . . . . . . . . . . . . . . . . . . . . . . . . . . . . . . . . . . . . . . . . . . .
. . . . . . . . . . . . . . . . . . . . . . . . . . . . . . . . . . . . . . . . . . . . . . . . . . . . . . . . . . . . . . .
. . . . . . . . . . . . . . . . . . . . . . . . . . . . . . . . . . . . . . . . . . . . . . . . . . . . . . . . . . . . . . .
. . . . . . . . . . . . . . . . . . . . . . . . . . . . . . . . . . . . . . . . . . . . . . . . . . . . . . . . . . . . . . .
. . . . . . . . . . . . . . . . . . . . . . . . . . . . . . . . . . . . . . . . . . . . . . . . . . . . . . . . . . . . . . .
. . . . . . . . . . . . . . . . . . . . . . . . . . . . . . . . . . . . . . . . . . . . . . . . . . . . . . . . . . . . . . .
. . . . . . . . . . . . . . . . . . . . . . . . . . . . . . . . . . . . . . . . . . . . . . . . . . . . . . . . . . . . . . .
. . . . . . . . . . . . . . . . . . . . . . . . . . . . . . . . . . . . . . . . . . . . . . . . . . . . . . . . . . . . . . .
. . . . . . . . . . . . . . . . . . . . . . . . . . . . . . . . . . . . . . . . . . . . . . . . . . . . . . . . . . . . . . .
. . . . . . . . . . . . . . . . . . . . . . . . . . . . . . . . . . . . . . . . . . . . . . . . . . . . . . . . . . . . . . .

As you focus on your customer, we focus on you.You’re an expert in knowing what your customers want—often before they do. We bring the same approach to your business.
Colliers International is built on an enterprising culture of collaboration and innovation. We provide creative, strategic solutions to all our clients.
Whether you need sales and leasing brokerage, property marketing, research and demographics, or asset and property management, we have retail professionals across Vietnam who can meet the real estate needs of retail tenants, landlords and developers.
Today’s real estate challenges require more than geographic reach and local knowledge: they require integrated expertise in market segmentation, valuation, disposition, assembly, debt and equity strategies and much more.
Our integrated platform and our experienced bring you closer to your customers.
HCMC CBD MARKET REpoRT
NOVEMBER 2014 | COMMERCIAL OFFICE MARKET
p.2 | Colliers International
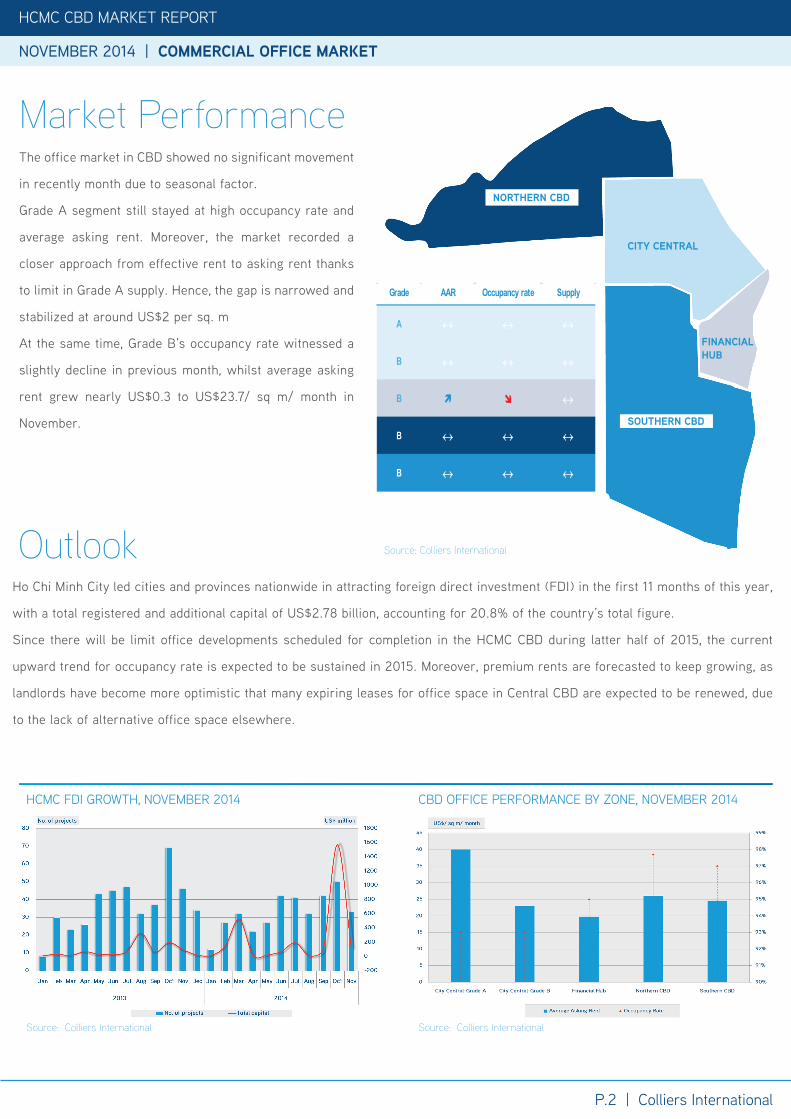
Ho Chi Minh City led cities and provinces nationwide in attracting foreign direct investment (FDI) in the first 11 months of this year,
with a total registered and additional capital of US$2.78 billion, accounting for 20.8% of the country’s total figure.
Since there will be limit office developments scheduled for completion in the HCMC CBD during latter half of 2015, the current
upward trend for occupancy rate is expected to be sustained in 2015. Moreover, premium rents are forecasted to keep growing, as
landlords have become more optimistic that many expiring leases for office space in Central CBD are expected to be renewed, due
to the lack of alternative office space elsewhere.
Outlook
HCMC FDI GRoWTH, NoVEMBER 2014
Source: Colliers International
CBD oFFICE pERFoRMANCE BY ZoNE, NoVEMBER 2014
Source: Colliers International
Source: Colliers International
Grade AAR Occupancy rate Supply
A ↔ ↔ ↔
B ↔ ↔ ↔
B ↔
B ↔ ↔ ↔
B ↔ ↔ ↔
CITY CENTRAL
FINANCIALHUB
NORTHERN CBD
SOUTHERN CBD
Market PerformanceThe office market in CBD showed no significant movement
in recently month due to seasonal factor.
Grade A segment still stayed at high occupancy rate and
average asking rent. Moreover, the market recorded a
closer approach from effective rent to asking rent thanks
to limit in Grade A supply. Hence, the gap is narrowed and
stabilized at around US$2 per sq. m
At the same time, Grade B’s occupancy rate witnessed a
slightly decline in previous month, whilst average asking
rent grew nearly US$0.3 to US$23.7/ sq m/ month in
November.
HCMC CBD MARKET REpoRT
NOVEMBER 2014 | COMMERCIAL OFFICE MARKET
p.3 | Colliers International
HCMC CBD MARKET REpoRT
OCTOBER 2014 | COMMERCIAL OFFICE MARKET
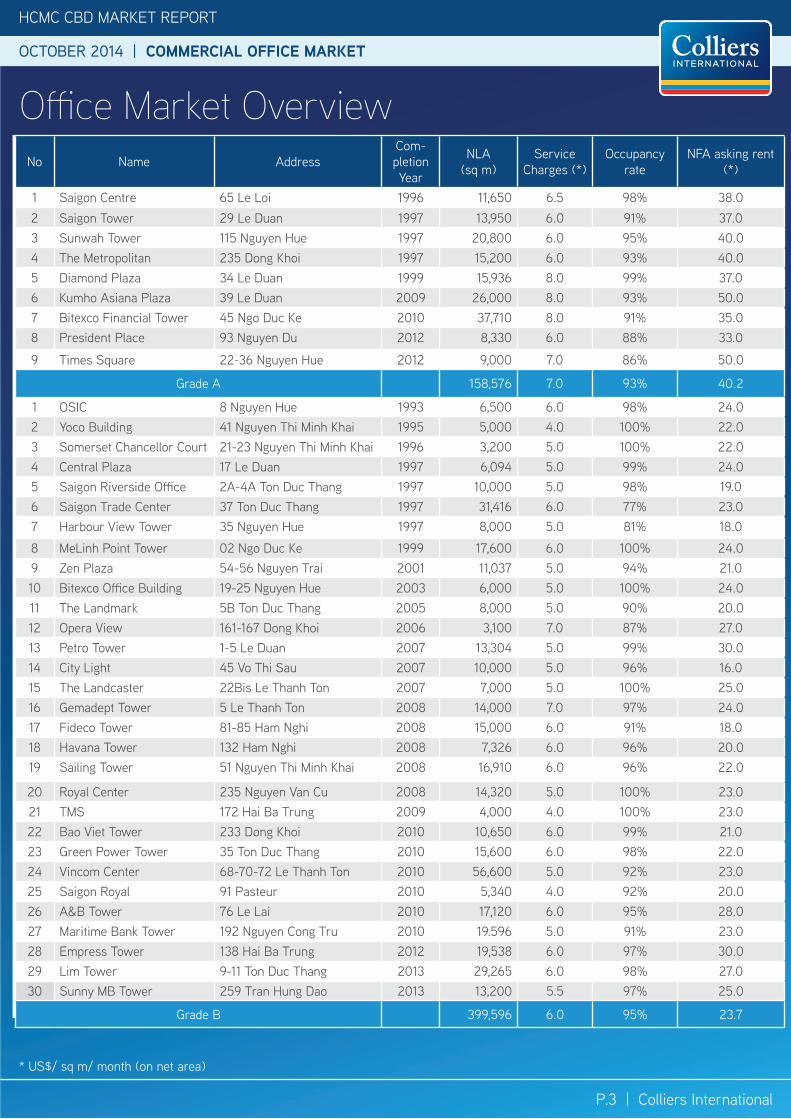
* US$/ sq m/ month (on net area)
Office Market OverviewNo Name Address
Com-pletion Year
NLA (sq m)
Service Charges (*)
occupancy rate
NFA asking rent (*)
1 Saigon Centre 65 Le Loi 1996 11,650 6.5 98% 38.02 Saigon Tower 29 Le Duan 1997 13,950 6.0 91% 37.03 Sunwah Tower 115 Nguyen Hue 1997 20,800 6.0 95% 40.04 The Metropolitan 235 Dong Khoi 1997 15,200 6.0 93% 40.05 Diamond plaza 34 Le Duan 1999 15,936 8.0 99% 37.06 Kumho Asiana plaza 39 Le Duan 2009 26,000 8.0 93% 50.07 Bitexco Financial Tower 45 Ngo Duc Ke 2010 37,710 8.0 91% 35.08 president place 93 Nguyen Du 2012 8,330 6.0 88% 33.0
9 Times Square 22-36 Nguyen Hue 2012 9,000 7.0 86% 50.0
Grade A 158,576 7.0 93% 40.2
1 oSIC 8 Nguyen Hue 1993 6,500 6.0 98% 24.02 Yoco Building 41 Nguyen Thi Minh Khai 1995 5,000 4.0 100% 22.03 Somerset Chancellor Court 21-23 Nguyen Thi Minh Khai 1996 3,200 5.0 100% 22.04 Central plaza 17 Le Duan 1997 6,094 5.0 99% 24.05 Saigon Riverside office 2A-4A Ton Duc Thang 1997 10,000 5.0 98% 19.06 Saigon Trade Center 37 Ton Duc Thang 1997 31,416 6.0 77% 23.07 Harbour View Tower 35 Nguyen Hue 1997 8,000 5.0 81% 18.0
8 MeLinh point Tower 02 Ngo Duc Ke 1999 17,600 6.0 100% 24.09 Zen plaza 54-56 Nguyen Trai 2001 11,037 5.0 94% 21.010 Bitexco office Building 19-25 Nguyen Hue 2003 6,000 5.0 100% 24.011 The Landmark 5B Ton Duc Thang 2005 8,000 5.0 90% 20.012 opera View 161-167 Dong Khoi 2006 3,100 7.0 87% 27.013 petro Tower 1-5 Le Duan 2007 13,304 5.0 99% 30.014 City Light 45 Vo Thi Sau 2007 10,000 5.0 96% 16.015 The Landcaster 22Bis Le Thanh Ton 2007 7,000 5.0 100% 25.016 Gemadept Tower 5 Le Thanh Ton 2008 14,000 7.0 97% 24.017 Fideco Tower 81-85 Ham Nghi 2008 15,000 6.0 91% 18.018 Havana Tower 132 Ham Nghi 2008 7,326 6.0 96% 20.019 Sailing Tower 51 Nguyen Thi Minh Khai 2008 16,910 6.0 96% 22.0
20 Royal Center 235 Nguyen Van Cu 2008 14,320 5.0 100% 23.021 TMS 172 Hai Ba Trung 2009 4,000 4.0 100% 23.022 Bao Viet Tower 233 Dong Khoi 2010 10,650 6.0 99% 21.023 Green power Tower 35 Ton Duc Thang 2010 15,600 6.0 98% 22.024 Vincom Center 68-70-72 Le Thanh Ton 2010 56,600 5.0 92% 23.025 Saigon Royal 91 pasteur 2010 5,340 4.0 92% 20.026 A&B Tower 76 Le Lai 2010 17,120 6.0 95% 28.027 Maritime Bank Tower 192 Nguyen Cong Tru 2010 19.596 5.0 91% 23.028 Empress Tower 138 Hai Ba Trung 2012 19,538 6.0 97% 30.029 Lim Tower 9-11 Ton Duc Thang 2013 29,265 6.0 98% 27.030 Sunny MB Tower 259 Tran Hung Dao 2013 13,200 5.5 97% 25.0
Grade B 399,596 6.0 95% 23.7
p.4 | Colliers International
HCMC CBD MARKET REpoRT
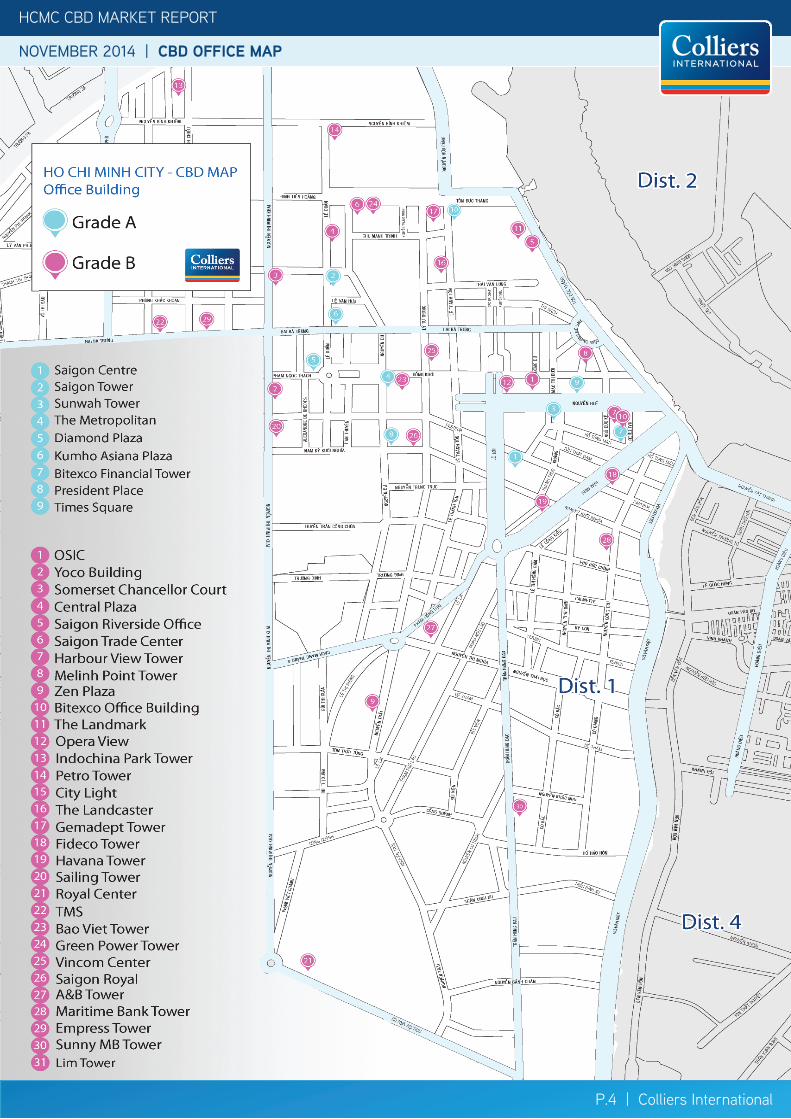
NOVEMBER 2014 | CBD OFFICE MAP
* US$/ sq m/ month (on net area)
HCMC CBD MARKET REpoRT
NOVEMBER 2014 | RETAIL MARKET
HCMC CBD MARKET REpoRT
NOVEMBER 2014 | CBD OFFICE MAP
HCMC CBD MARKET REpoRT
NOVEMBER 2014 | RETAIL MARKET
p.5 | Colliers International
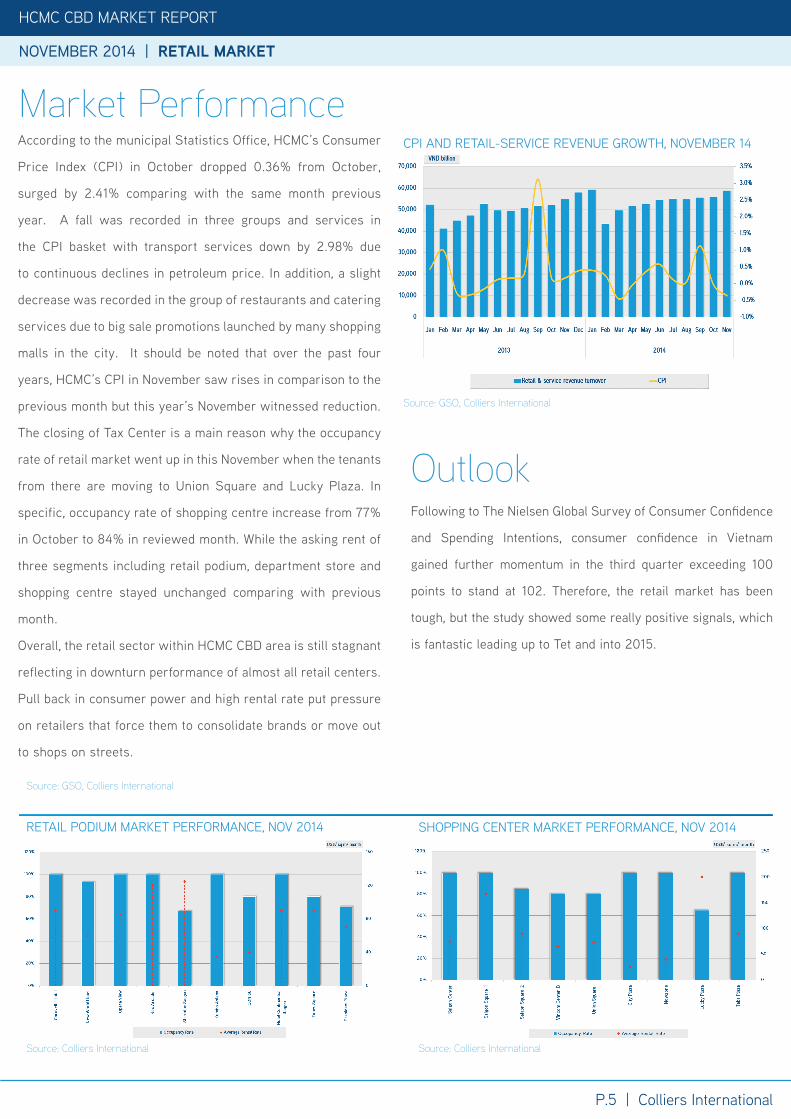
Market Performance
Outlook
SHoppING CENTER MARKET pERFoRMANCE, NoV 2014
Following to The Nielsen Global Survey of Consumer Confidence
and Spending Intentions, consumer confidence in Vietnam
gained further momentum in the third quarter exceeding 100
points to stand at 102. Therefore, the retail market has been
tough, but the study showed some really positive signals, which
is fantastic leading up to Tet and into 2015.
Source: Colliers International
RETAIL poDIUM MARKET pERFoRMANCE, NoV 2014
Source: Colliers International
Source: GSO, Colliers International
According to the municipal Statistics office, HCMC’s Consumer
price Index (CpI) in october dropped 0.36% from october,
surged by 2.41% comparing with the same month previous
year. A fall was recorded in three groups and services in
the CpI basket with transport services down by 2.98% due
to continuous declines in petroleum price. In addition, a slight
decrease was recorded in the group of restaurants and catering
services due to big sale promotions launched by many shopping
malls in the city. It should be noted that over the past four
years, HCMC’s CpI in November saw rises in comparison to the
previous month but this year’s November witnessed reduction.
The closing of Tax Center is a main reason why the occupancy
rate of retail market went up in this November when the tenants
from there are moving to Union Square and Lucky plaza. In
specific, occupancy rate of shopping centre increase from 77%
in october to 84% in reviewed month. While the asking rent of
three segments including retail podium, department store and
shopping centre stayed unchanged comparing with previous
month.
overall, the retail sector within HCMC CBD area is still stagnant
reflecting in downturn performance of almost all retail centers.
pull back in consumer power and high rental rate put pressure
on retailers that force them to consolidate brands or move out
to shops on streets.
CpI AND RETAIL-SERVICE REVENUE GRoWTH, NoVEMBER 14
Source: GSO, Colliers International
p.6 | Colliers International
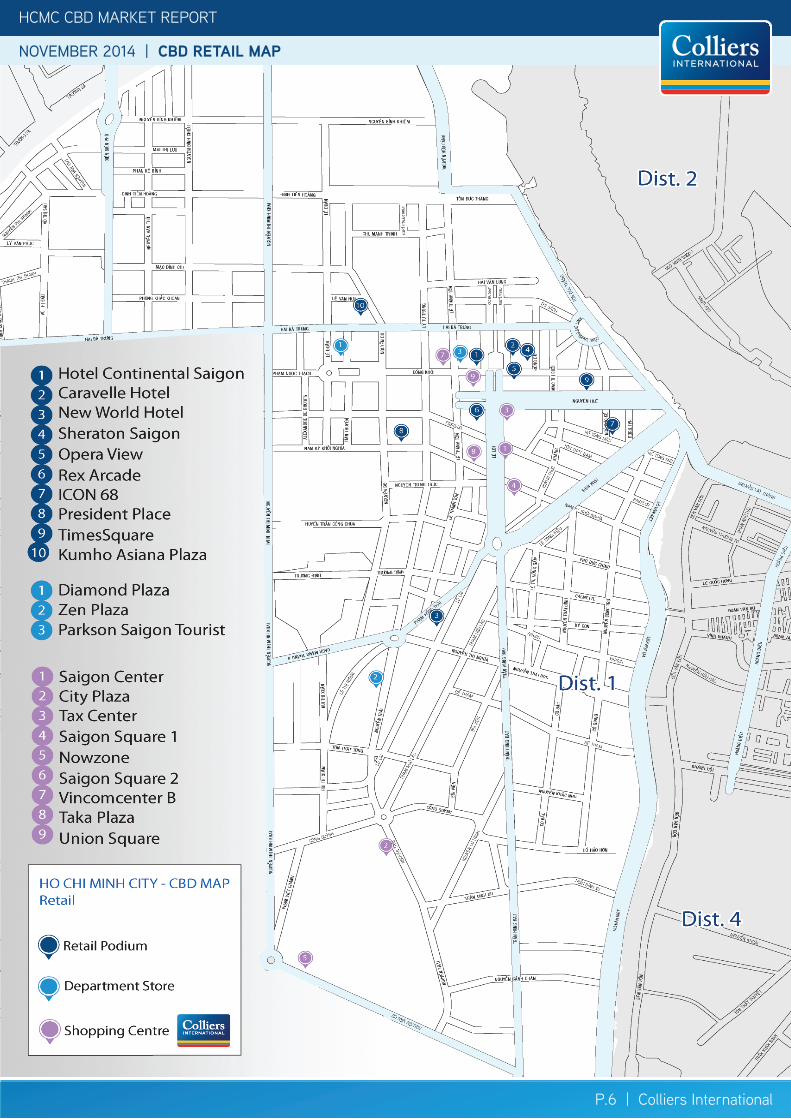
HCMC CBD MARKET REpoRT
NOVEMBER 2014 | CBD RETAIL MAP
* US$/ sq m/ month (on net area)
NOVEMBER 2014 | RETAIL MARKET
NOVEMBER 2014 | HOTEL MARKET
HCMC CBD MARKET REpoRT
NOVEMBER 2014 | CBD RETAIL MAP
KUMHo MoNTHLY MARKET REpoRTNOVEMBER 2014 | RETAIL MARKET HCMC CBD MARKET REPORT
p.7 | Colliers International
NOVEMBER 2014 | HOTEL MARKET HCMC CBD MARKET REPORT
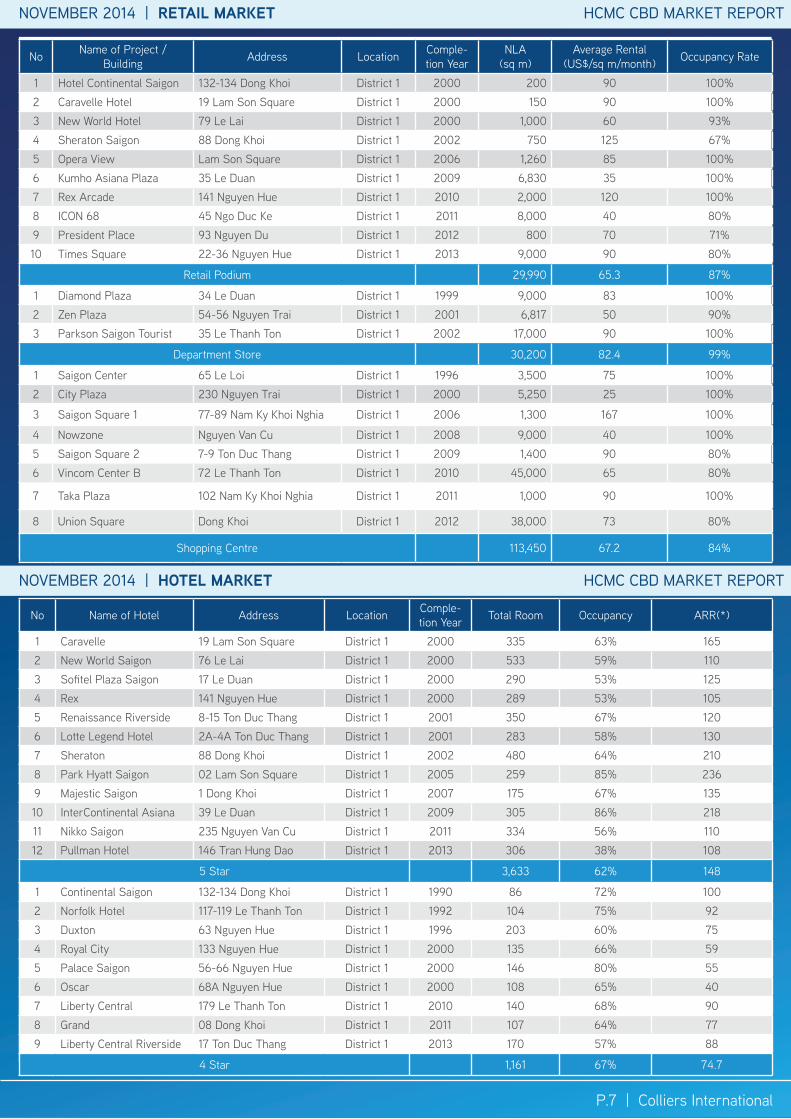
No Name of project /Building Address Location Comple-
tion YearNLA
(sq m)Average Rental
(US$/sq m/month) occupancy Rate
1 Hotel Continental Saigon 132-134 Dong Khoi District 1 2000 200 90 100%2 Caravelle Hotel 19 Lam Son Square District 1 2000 150 90 100%3 New World Hotel 79 Le Lai District 1 2000 1,000 60 93%4 Sheraton Saigon 88 Dong Khoi District 1 2002 750 125 67%5 opera View Lam Son Square District 1 2006 1,260 85 100%6 Kumho Asiana plaza 35 Le Duan District 1 2009 6,830 35 100%7 Rex Arcade 141 Nguyen Hue District 1 2010 2,000 120 100%8 ICoN 68 45 Ngo Duc Ke District 1 2011 8,000 40 80%9 president place 93 Nguyen Du District 1 2012 800 70 71%10 Times Square 22-36 Nguyen Hue District 1 2013 9,000 90 80%
Retail podium 29,990 65.3 87%
1 Diamond plaza 34 Le Duan District 1 1999 9,000 83 100%2 Zen plaza 54-56 Nguyen Trai District 1 2001 6,817 50 90%3 parkson Saigon Tourist 35 Le Thanh Ton District 1 2002 17,000 90 100%
Department Store 30,200 82.4 99%
1 Saigon Center 65 Le Loi District 1 1996 3,500 75 100%2 City plaza 230 Nguyen Trai District 1 2000 5,250 25 100%
3 Saigon Square 1 77-89 Nam Ky Khoi Nghia District 1 2006 1,300 167 100%
4 Nowzone Nguyen Van Cu District 1 2008 9,000 40 100%5 Saigon Square 2 7-9 Ton Duc Thang District 1 2009 1,400 90 80%6 Vincom Center B 72 Le Thanh Ton District 1 2010 45,000 65 80%
7 Taka plaza 102 Nam Ky Khoi Nghia District 1 2011 1,000 90 100%
8 Union Square Dong Khoi District 1 2012 38,000 73 80%
Shopping Centre 113,450 67.2 84%
No Name of Hotel Address Location Comple-tion Year Total Room occupancy ARR(*)
1 Caravelle 19 Lam Son Square District 1 2000 335 63% 1652 New World Saigon 76 Le Lai District 1 2000 533 59% 1103 Sofitel plaza Saigon 17 Le Duan District 1 2000 290 53% 1254 Rex 141 Nguyen Hue District 1 2000 289 53% 1055 Renaissance Riverside 8-15 Ton Duc Thang District 1 2001 350 67% 1206 Lotte Legend Hotel 2A-4A Ton Duc Thang District 1 2001 283 58% 1307 Sheraton 88 Dong Khoi District 1 2002 480 64% 2108 park Hyatt Saigon 02 Lam Son Square District 1 2005 259 85% 2369 Majestic Saigon 1 Dong Khoi District 1 2007 175 67% 13510 InterContinental Asiana 39 Le Duan District 1 2009 305 86% 21811 Nikko Saigon 235 Nguyen Van Cu District 1 2011 334 56% 11012 pullman Hotel 146 Tran Hung Dao District 1 2013 306 38% 108
5 Star 3,633 62% 148
1 Continental Saigon 132-134 Dong Khoi District 1 1990 86 72% 1002 Norfolk Hotel 117-119 Le Thanh Ton District 1 1992 104 75% 923 Duxton 63 Nguyen Hue District 1 1996 203 60% 754 Royal City 133 Nguyen Hue District 1 2000 135 66% 595 palace Saigon 56-66 Nguyen Hue District 1 2000 146 80% 556 oscar 68A Nguyen Hue District 1 2000 108 65% 407 Liberty Central 179 Le Thanh Ton District 1 2010 140 68% 908 Grand 08 Dong Khoi District 1 2011 107 64% 779 Liberty Central Riverside 17 Ton Duc Thang District 1 2013 170 57% 88
4 Star 1,161 67% 74.7
p.8 | Colliers International
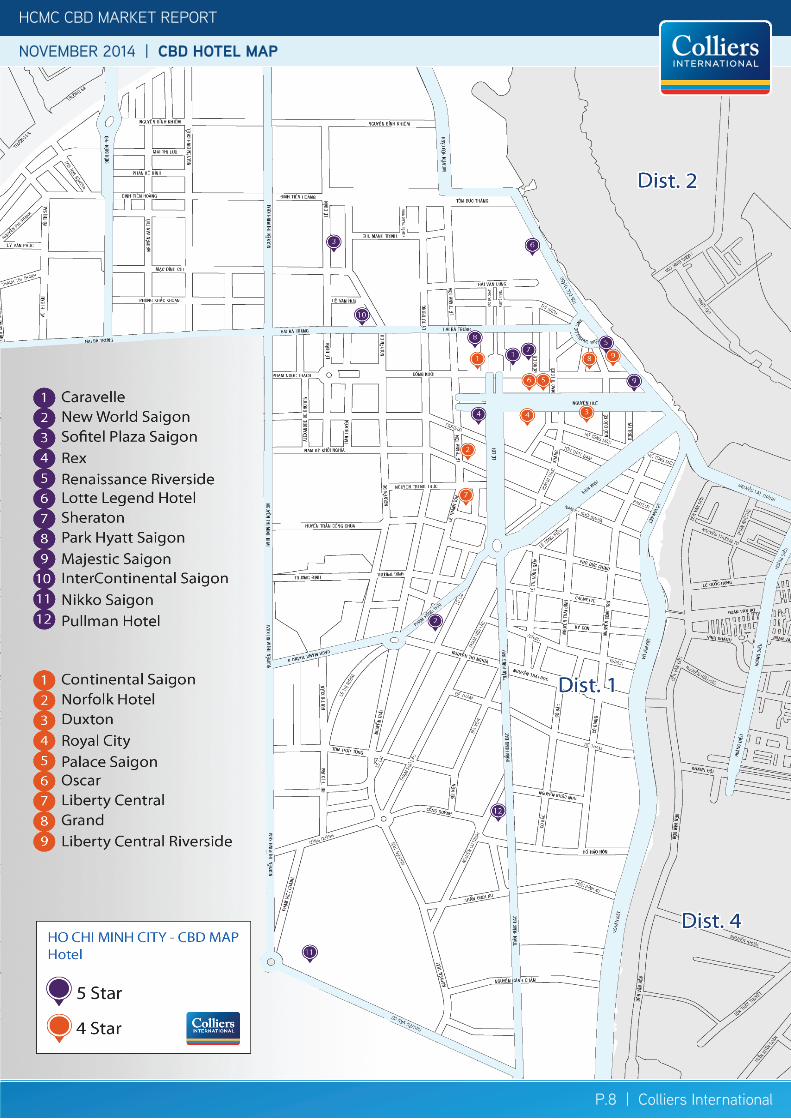
HCMC CBD MARKET REpoRT
NOVEMBER 2014 | CBD HOTEL MAP
* US$/ sq m/ month (on net area)
HCMC CBD MARKET REpoRT
NOVEMBER 2014 | CBD HOTEL MAP
p.9 | Colliers International
HCMC CBD MARKET REpoRT
NOVEMBER 2014 | HOTEL MARKET
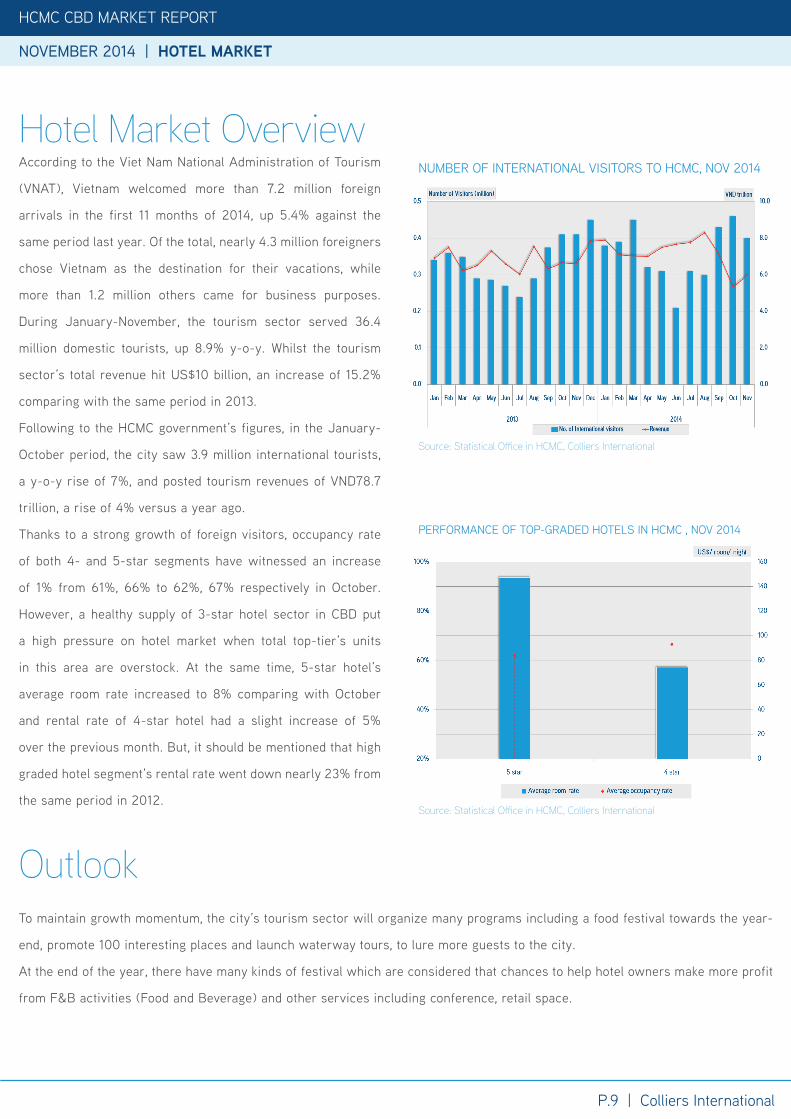
According to the Viet Nam National Administration of Tourism
(VNAT), Vietnam welcomed more than 7.2 million foreign
arrivals in the first 11 months of 2014, up 5.4% against the
same period last year. of the total, nearly 4.3 million foreigners
chose Vietnam as the destination for their vacations, while
more than 1.2 million others came for business purposes.
During January-November, the tourism sector served 36.4
million domestic tourists, up 8.9% y-o-y. Whilst the tourism
sector’s total revenue hit US$10 billion, an increase of 15.2%
comparing with the same period in 2013.
Following to the HCMC government’s figures, in the January-
october period, the city saw 3.9 million international tourists,
a y-o-y rise of 7%, and posted tourism revenues of VND78.7
trillion, a rise of 4% versus a year ago.
Thanks to a strong growth of foreign visitors, occupancy rate
of both 4- and 5-star segments have witnessed an increase
of 1% from 61%, 66% to 62%, 67% respectively in october.
However, a healthy supply of 3-star hotel sector in CBD put
a high pressure on hotel market when total top-tier’s units
in this area are overstock. At the same time, 5-star hotel’s
average room rate increased to 8% comparing with october
and rental rate of 4-star hotel had a slight increase of 5%
over the previous month. But, it should be mentioned that high
graded hotel segment’s rental rate went down nearly 23% from
the same period in 2012.
Hotel Market Overview
To maintain growth momentum, the city’s tourism sector will organize many programs including a food festival towards the year-
end, promote 100 interesting places and launch waterway tours, to lure more guests to the city.
At the end of the year, there have many kinds of festival which are considered that chances to help hotel owners make more profit
from F&B activities (Food and Beverage) and other services including conference, retail space.
NUMBER oF INTERNATIoNAL VISIToRS To HCMC, NoV 2014
Source: Statistical Office in HCMC, Colliers International
Outlook
pERFoRMANCE oF Top-GRADED HoTELS IN HCMC , NoV 2014
Source: Statistical Office in HCMC, Colliers International
p.10 | Colliers International
HCMC CBD MARKET REpoRT
NOVEMBER 2014 | HOTEL MARKET
HCMC CBD MARKET REpoRT
NOVEMBER 2014 | SERVICED APARTMENT MARKET
NOVEMBER 2014 | SERVICED APARTMENT MARKET
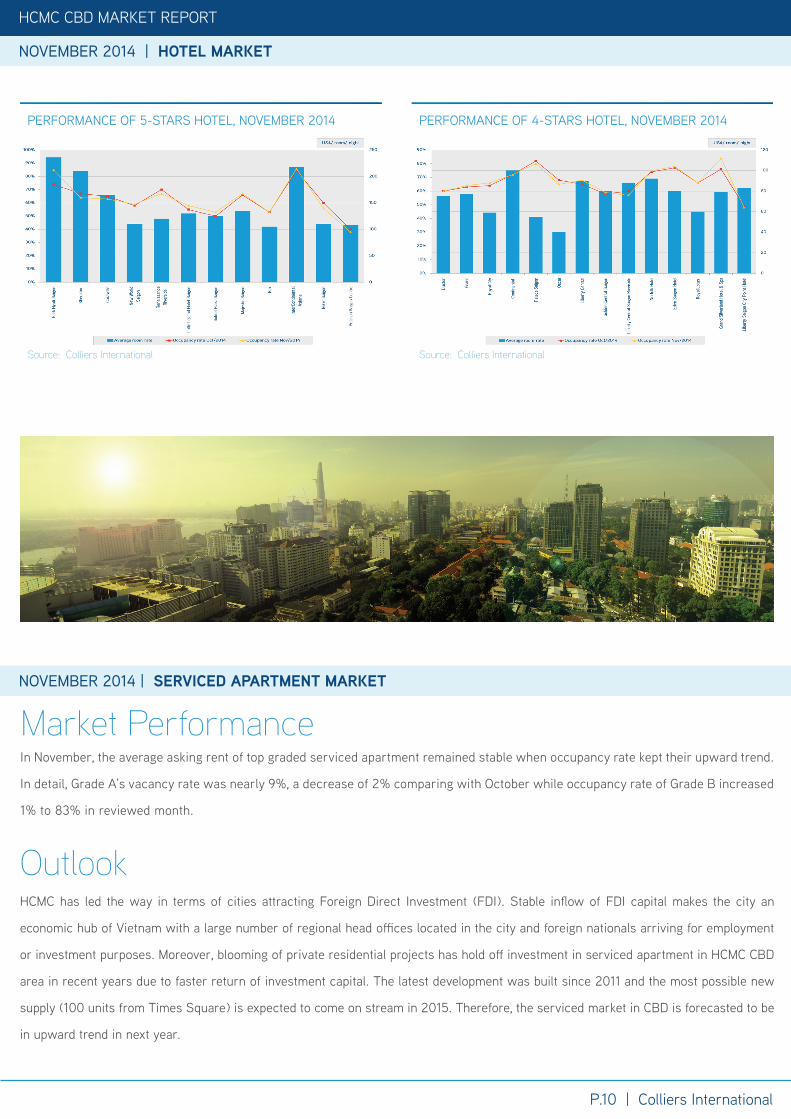
pERFoRMANCE oF 5-STARS HoTEL, NoVEMBER 2014
Source: Colliers International
pERFoRMANCE oF 4-STARS HoTEL, NoVEMBER 2014
Source: Colliers International
HCMC has led the way in terms of cities attracting Foreign Direct Investment (FDI). Stable inflow of FDI capital makes the city an
economic hub of Vietnam with a large number of regional head offices located in the city and foreign nationals arriving for employment
or investment purposes. Moreover, blooming of private residential projects has hold off investment in serviced apartment in HCMC CBD
area in recent years due to faster return of investment capital. The latest development was built since 2011 and the most possible new
supply (100 units from Times Square) is expected to come on stream in 2015. Therefore, the serviced market in CBD is forecasted to be
in upward trend in next year.
Outlook
In November, the average asking rent of top graded serviced apartment remained stable when occupancy rate kept their upward trend.
In detail, Grade A’s vacancy rate was nearly 9%, a decrease of 2% comparing with october while occupancy rate of Grade B increased
1% to 83% in reviewed month.
Market Performance
HCMC CBD MARKET REpoRT
NOVEMBER 2014 | HOTEL MARKET
p.11 | Colliers International
HCMC CBD MARKET REpoRT
* US$/sq m/month** Not including VAT*** Buildings are sorted by Year of Completion
NOVEMBER 2014 | SERVICED APARTMENT MARKET
NOVEMBER 2014 | SERVICED APARTMENT HCMC CBD MARKET REPORT
NOVEMBER 2014 | SERVICED APARTMENT MARKET
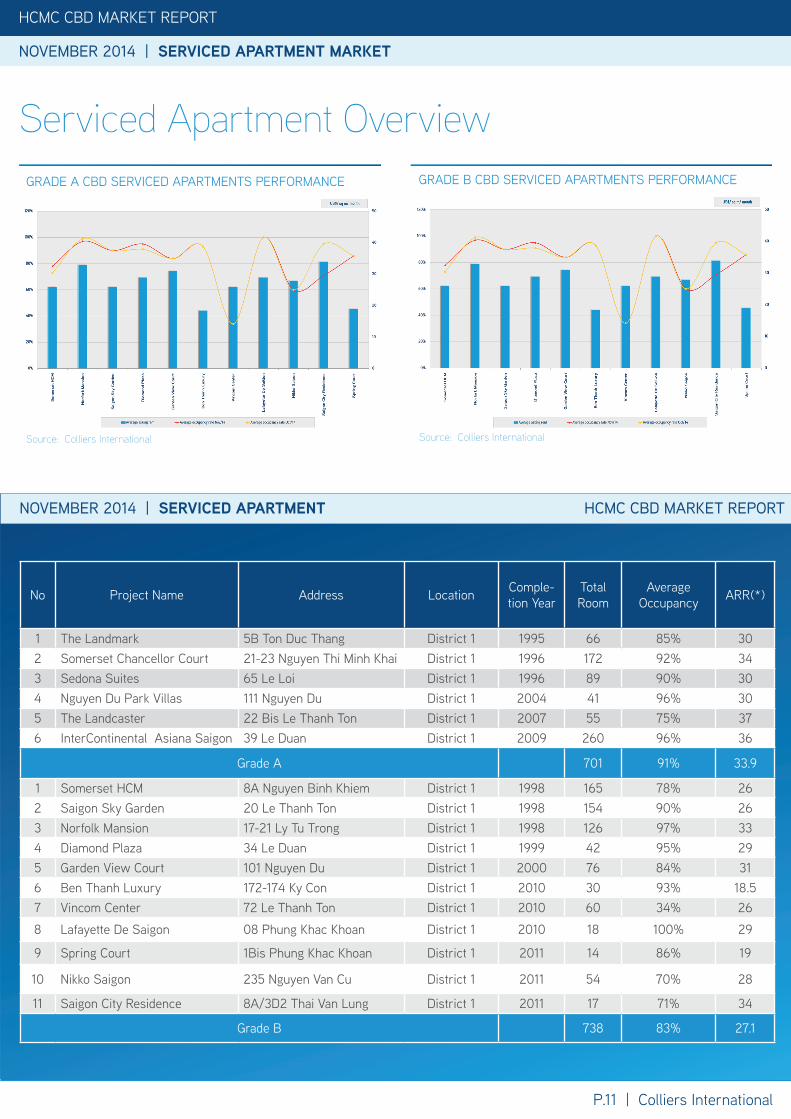
Serviced Apartment OverviewGRADE A CBD SERVICED ApARTMENTS pERFoRMANCE
Source: Colliers International
GRADE B CBD SERVICED ApARTMENTS pERFoRMANCE
Source: Colliers International
No project Name Address Location Comple-tion Year
Total Room
Average occupancy ARR(*)
1 The Landmark 5B Ton Duc Thang District 1 1995 66 85% 302 Somerset Chancellor Court 21-23 Nguyen Thi Minh Khai District 1 1996 172 92% 343 Sedona Suites 65 Le Loi District 1 1996 89 90% 304 Nguyen Du park Villas 111 Nguyen Du District 1 2004 41 96% 305 The Landcaster 22 Bis Le Thanh Ton District 1 2007 55 75% 376 InterContinental Asiana Saigon 39 Le Duan District 1 2009 260 96% 36
Grade A 701 91% 33.9
1 Somerset HCM 8A Nguyen Binh Khiem District 1 1998 165 78% 262 Saigon Sky Garden 20 Le Thanh Ton District 1 1998 154 90% 263 Norfolk Mansion 17-21 Ly Tu Trong District 1 1998 126 97% 334 Diamond plaza 34 Le Duan District 1 1999 42 95% 295 Garden View Court 101 Nguyen Du District 1 2000 76 84% 316 Ben Thanh Luxury 172-174 Ky Con District 1 2010 30 93% 18.57 Vincom Center 72 Le Thanh Ton District 1 2010 60 34% 26
8 Lafayette De Saigon 08 phung Khac Khoan District 1 2010 18 100% 29
9 Spring Court 1Bis phung Khac Khoan District 1 2011 14 86% 19
10 Nikko Saigon 235 Nguyen Van Cu District 1 2011 54 70% 28
11 Saigon City Residence 8A/3D2 Thai Van Lung District 1 2011 17 71% 34
Grade B 738 83% 27.1
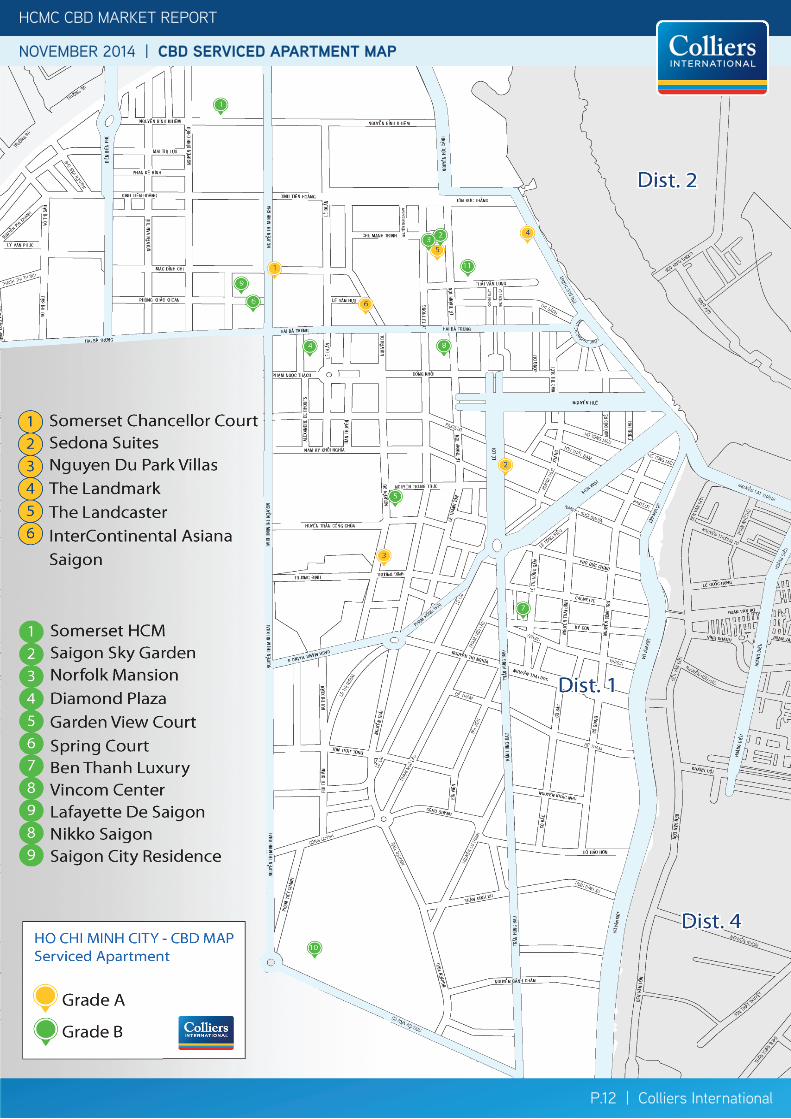
HCMC CBD MARKET REpoRT
NOVEMBER 2014 | CBD SERVICED APARTMENT MAP
p.12 | Colliers International
HCMC CBD MARKET REpoRT
NOVEMBER 2014 | CBD SERVICED APARTMENT MAP
p.12 | Colliers International
HCMC CBD MARKET REPORT | NOVEMBER 2014
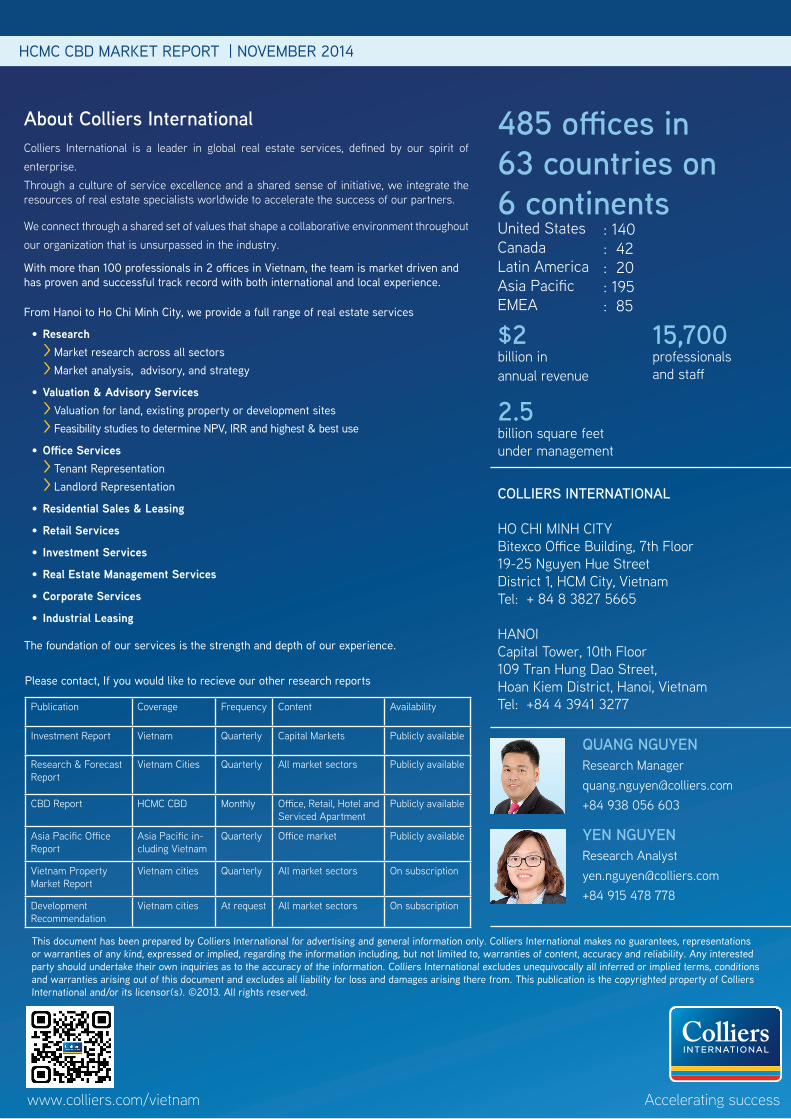
With more than 100 professionals in 2 offices in Vietnam, the team is market driven and has proven and successful track record with both international and local experience.
From Hanoi to Ho Chi Minh City, we provide a full range of real estate services
•Research > Market research across all sectors > Market analysis, advisory, and strategy
•Valuation & Advisory Services > Valuation for land, existing property or development sites > Feasibility studies to determine NPV, IRR and highest & best use
•Office Services > Tenant Representation > Landlord Representation
•Residential Sales & Leasing
•Retail Services
• Investment Services
•Real Estate Management Services
•Corporate Services
• Industrial Leasing
The foundation of our services is the strength and depth of our experience.
COLLIERS INTERNATIONAL
Ho CHI MINH CITYBitexco office Building, 7th Floor19-25 Nguyen Hue StreetDistrict 1, HCM City, VietnamTel: + 84 8 3827 5665
HANoICapital Tower, 10th Floor109 Tran Hung Dao Street, Hoan Kiem District, Hanoi, VietnamTel: +84 4 3941 3277
485 offices in63 countries on6 continentsUnited StatesCanadaLatin AmericaAsia pacificEMEA
Accelerating success
: 140: 42: 20: 195: 85
QUANG NGUYENResearch [email protected]+84 938 056 603
YEN NGUYENResearch [email protected]+84 915 478 778
About Colliers InternationalColliers International is a leader in global real estate services, defined by our spirit of enterprise.Through a culture of service excellence and a shared sense of initiative, we integrate the resources of real estate specialists worldwide to accelerate the success of our partners.
We connect through a shared set of values that shape a collaborative environment throughout our organization that is unsurpassed in the industry.
publication Coverage Frequency Content Availability
Investment Report Vietnam Quarterly Capital Markets publicly available
Research & Forecast Report
Vietnam Cities Quarterly All market sectors publicly available
CBD Report HCMC CBD Monthly office, Retail, Hotel and Serviced Apartment
publicly available
Asia pacific office Report
Asia pacific in-cluding Vietnam
Quarterly office market publicly available
Vietnam property Market Report
Vietnam cities Quarterly All market sectors on subscription
Development Recommendation
Vietnam cities At request All market sectors on subscription
$2billion in annual revenue
2.5billion square feet under management
15,700professionalsand staff
www.colliers.com/vietnam
Please contact, If you would like to recieve our other research reports
This document has been prepared by Colliers International for advertising and general information only. Colliers International makes no guarantees, representations or warranties of any kind, expressed or implied, regarding the information including, but not limited to, warranties of content, accuracy and reliability. Any interested party should undertake their own inquiries as to the accuracy of the information. Colliers International excludes unequivocally all inferred or implied terms, conditions and warranties arising out of this document and excludes all liability for loss and damages arising there from. This publication is the copyrighted property of Colliers International and/or its licensor(s). ©2013. All rights reserved.