H1 17 INTERIM RESULTS - Bourse PLC_Slide...reduced interest on external borrowings ... Enables...
34
H1 17 INTERIM RESULTS 28 SEPTEMBER 2016
Transcript of H1 17 INTERIM RESULTS - Bourse PLC_Slide...reduced interest on external borrowings ... Enables...

H1 17 INTERIM
RESULTS
28 SEPTEMBER 2016
DEFINITIONS
1
The following definitions apply throughout
• Trading Revenue: Revenue excluding discontinued operations, business held for sale and exceptional revenue item
• Trading EBITDA (earnings before interest, tax, depreciation and amortisation): excludes exceptional items, items not
allocated to a segment and discontinued operations
• Cash conversion: net cash flow from continuing operating activities before tax and exceptional items divided by Trading
EBITDA.
• Adjusted basic continuing EPS: Earnings per share excluding discontinued operations adjusts for a number of one-offs of
which the largest are exceptional items, items not allocated to a segment, the amortisation of debt issue fees, penalties on
early repayment of debt and double-running interest costs on Class B/B2 notes
• Personal Members and Business Customers: measured as the number at the period end.

Headlines Bob Mackenzie
Financials Martin Clarke
Strategy and outlook Bob Mackenzie
AGENDA
2

HIGHLIGHTS

GOOD PROGRESS TO DATE IN YEAR 2 OF THE TRANSFORMATION
Results in line with expectations
Transformation firmly on track
Ireland sold; £106m for debt pay down
Recommend interim dividend of 3.6p per share
TRANSFORMATION GAINING MOMENTUM
Growth in paid personal Members since April
Roadside retention up to 81%
App usage increased to 14% of personal
breakdowns
Productivity improved
Cost savings on target
IT investment on plan
Transformation capex – c. £10m saving
Normalised capex levels in sight
4
Transforming the AA into the UK’s pre-eminent Membership services organisation

FINANCIALS

In line with market expectations
FINANCIAL HEADLINES
6
Trading Revenue¹ up 2.2% at £467m despite IPT increase
• Roadside Trading revenue up 3.1% to £370m due to improved mix
Trading EBITDA¹ flat at £192m
• Roadside Trading EBITDA up 4.1% to £179m
Trading EBITDA margin¹ 41.1% (H1 16: 42.0%)
Adjusted EPS 10.3p (H1 16: 10.1p)
Cash conversion 99% (H1 16: 114%); Net debt of £2,677m³ (6.7x Trading EBITDA²)
post Ireland disposal in August
Interim dividend of 3.6p per share declared
¹ Excluding the Glass and Ireland businesses and exceptional revenue item ² Trading EBITDA for the last 12 months³ Net debt at 31 July 2016 plus the net proceeds from the sale of Ireland
P&L
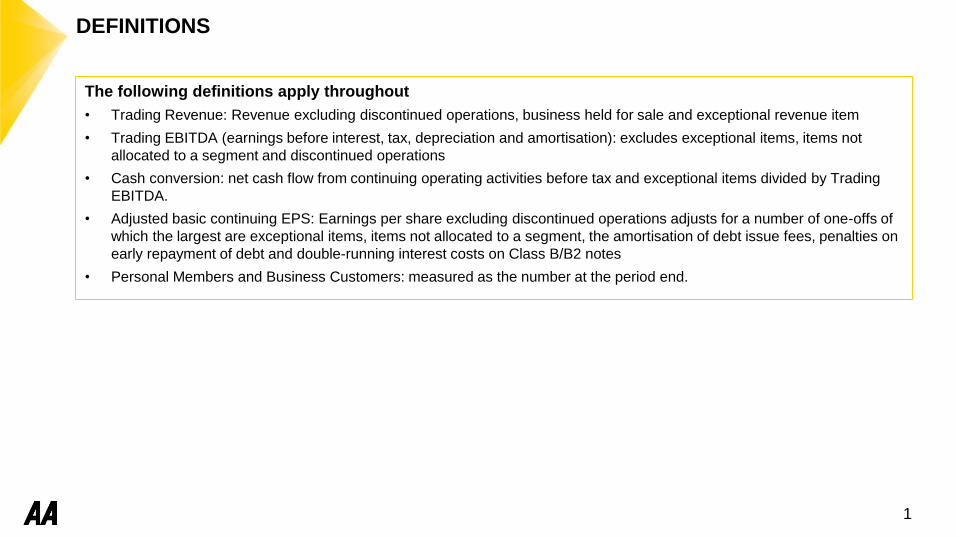
Items not allocated to segment reflect
pension and share based payments
impact
Exceptional items comprise mainly
restructuring activities and provision for
potential refund of customers with
duplicate cover
Decline in net finance cost reflects
reduced interest on external borrowings
and the absence of one-off costs from the
prior year refinancing
Tax expense reflects current tax charge of
£10m, in line with current statutory rate
Adjusted basic EPS of 10.3p reflects the
capital structure in place since July 15
7
£m H117 H116 YoY
Trading Revenue 467 457 +2%
Trading EBITDA 192 192 -
Items not allocated to a segment (10) (9) +11%
Depreciation & amortisation (28) (25) +12%
Exceptional items (22) (26) -15%
Operating profit 132 132 -
Net finance cost (84) (201) -58%
Profit/(loss) before tax 48 (69) +170%
Tax (expense)/credit (10) 13 +177%
Profit/(loss) for the period from continuing
operations
38 (56) +168%
Basic EPS – continuing operations (p/share) 6.2 (9.6) +165%
Adj Basic EPS –continuing operations (p/share) 10.3 10.1 +2%

ROADSIDE ASSISTANCE
8
H117 H116 YoY FY16 H1 on
FY
Personal Members (‘000s) 3,599 3,726 -3% 3,673 -2%
Average income per Member (£) 145 138 +5% 141 +3%
Personal paid² Members (‘000s) 3,321 3,340 -1% 3,331 flat
Average income per paid² Member (£) 157 154 +2% 156 +1%
Business customers (‘000s) 10,179 9,981 +2% 10,216 flat
Average income per business customer (£) 19 18 +6% 18 +6%
Breakdowns attended (‘000s)³ 1,759 1,662 +6% 3,459 n/a
Trading Revenue¹ up 3.1% to £370m
• Retention 81% (H1 16: 80%)
• Paid personal Members -0.6% YoY;
-0.3% on FY 16
• Average income per personal paid
Member +1.9% to £157 (net of 3.5%
uplift in IPT)
• Ancillary revenue up 14%
Trading EBITDA¹ up 4.1% to £179m
• Growth in income per personal Member
and B2B revenue; lower H1 advertising
spend (£5m vs £7.5m in H1 16)
• Partially offset by increased workload
from higher level of breakdowns attended
¹ Excluding items held for sale and exceptional revenue item
² Paid Members: Personal Members excluding free Memberships
³ Relevant period basis
INSURANCE SERVICES
9
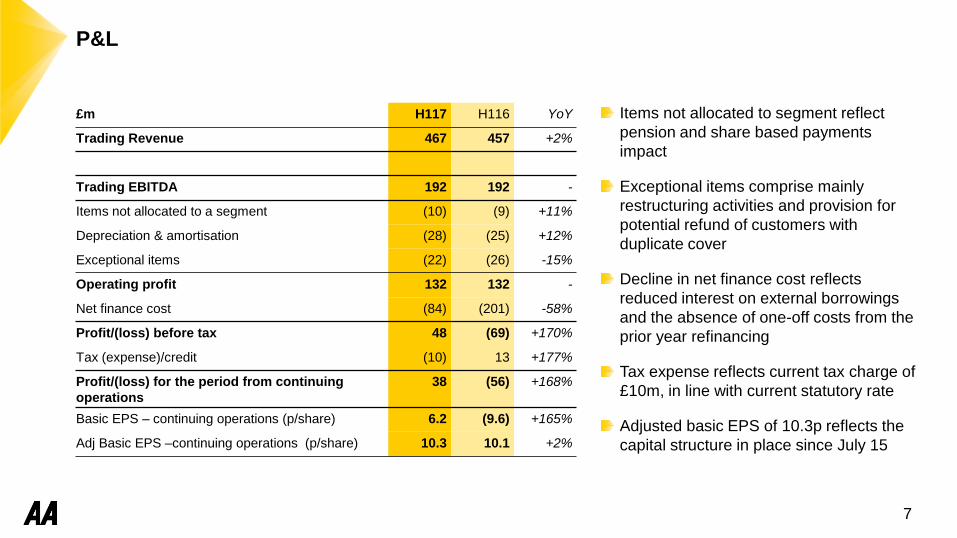
(000s) H117 H116 YoY FY16 H1 on FY
Total insurance
policies
1,962 2,131 -8% 2,074 -5%
Motor policies 572 618 -7% 592 -3%
Home insurance
policies
891 913 -2% 899 -1%
Average income per
policy (£)
67 63 +6% 63 +6%
Financial Services
Products
82 na na 33 +148%
Trading Revenue flat at £64m - lower core
insurance offset by increased FS
Trading EBITDA down £2m to £35m –
managed decline of total insurance policies
• Motor policies down - lower renewal volumes in
high rate increase market environment
• Decline in Home Services policies as we cease
free policies
Motor responding positively in last two months
• Successful retention initiatives; direct sales initiatives
• Additional motor policies through in-house
Underwriter
Financial Services
• Performance to plan: matched book of £160m
assets, £160m liabilities
• Revenue up £3m due to marketing and product
development services provided to BoI

IN-HOUSE UNDERWRITER
DRIVING SERVICES
10
Underwriter
• Progressing well
• Motor launched 30 January – 54k policies to date
• Home insurance underwriting launched in August
Driving Services
• Trading Revenue down 3% but EBITDA flat at £9m
– Fewer driving school franchisees reflecting
market conditions
– DriveTech police speed awareness courses
stable
– Cost savings support EBITDA
– Short term initiatives to improve driving school
performance
H117 H116 YoY FY16 H1 on FY
Policies
underwritten
(‘000s)
25 na na na na
H117 H116 YoY FY16 H1 on FY
Driving
instructors
2,516 2,602 -3% 2,574 -2%
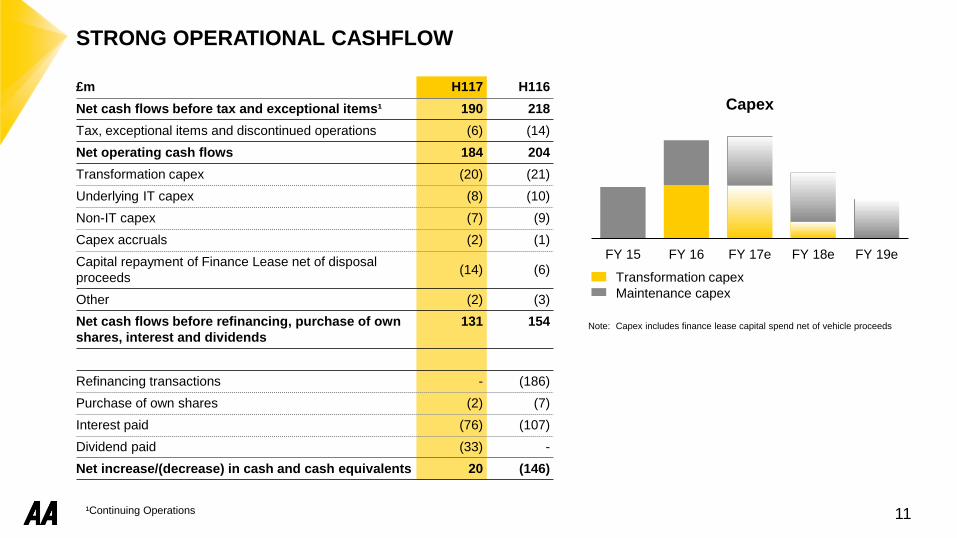
STRONG OPERATIONAL CASHFLOW
£m H117 H116
Net cash flows before tax and exceptional items¹ 190 218
Tax, exceptional items and discontinued operations (6) (14)
Net operating cash flows 184 204
Transformation capex (20) (21)
Underlying IT capex (8) (10)
Non-IT capex (7) (9)
Capex accruals (2) (1)
Capital repayment of Finance Lease net of disposal
proceeds(14) (6)
Other (2) (3)
Net cash flows before refinancing, purchase of own
shares, interest and dividends
131 154
Refinancing transactions - (186)
Purchase of own shares (2) (7)
Interest paid (76) (107)
Dividend paid (33) -
Net increase/(decrease) in cash and cash equivalents 20 (146)
11
Note: Capex includes finance lease capital spend net of vehicle proceeds
FY 15 FY 16 FY 17e FY 18e FY 19e
Capex
Transformation capex
Maintenance capex
¹Continuing Operations
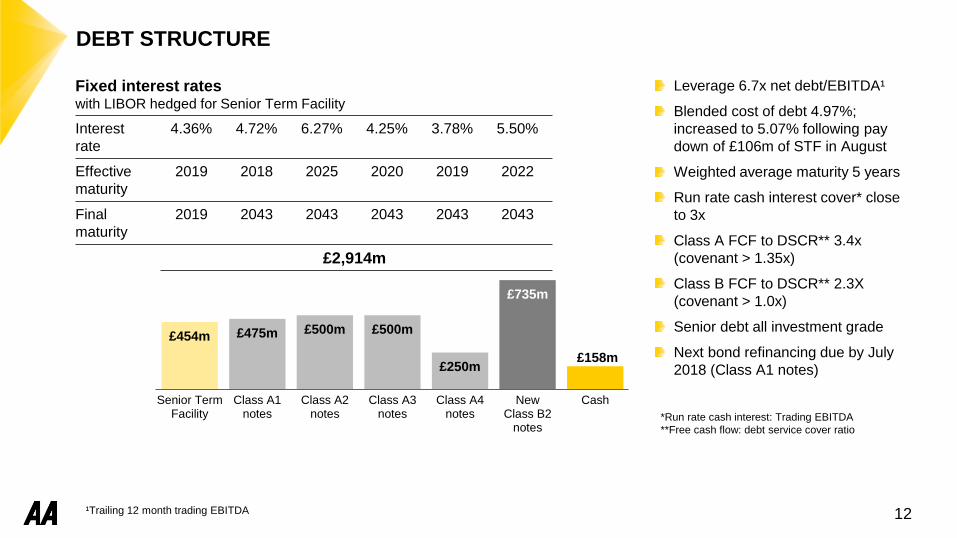
£454m £475m £500m £500m
£250m
£735m
£158m
Senior TermFacility
Class A1notes
Class A2notes
Class A3notes
Class A4notes
NewClass B2
notes
Cash
DEBT STRUCTURE
Leverage 6.7x net debt/EBITDA¹
Blended cost of debt 4.97%;
increased to 5.07% following pay
down of £106m of STF in August
Weighted average maturity 5 years
Run rate cash interest cover* close
to 3x
Class A FCF to DSCR** 3.4x
(covenant > 1.35x)
Class B FCF to DSCR** 2.3X
(covenant > 1.0x)
Senior debt all investment grade
Next bond refinancing due by July
2018 (Class A1 notes)
Fixed interest rates with LIBOR hedged for Senior Term Facility
Interest
rate
4.36% 4.72% 6.27% 4.25% 3.78% 5.50%
Effective
maturity
2019 2018 2025 2020 2019 2022
Final
maturity
2019 2043 2043 2043 2043 2043
£2,914m
12
*Run rate cash interest: Trading EBITDA
**Free cash flow: debt service cover ratio
¹Trailing 12 month trading EBITDA
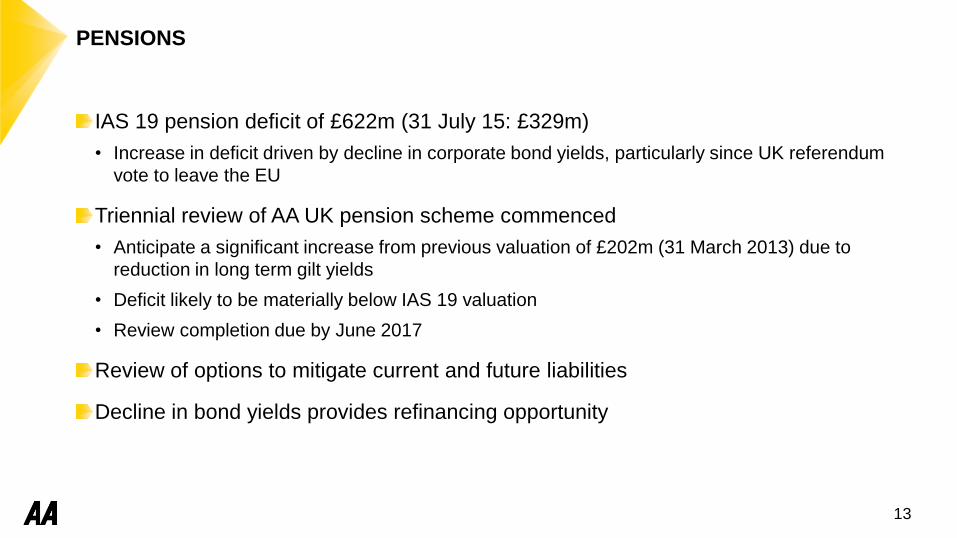
PENSIONS
13
IAS 19 pension deficit of £622m (31 July 15: £329m)
• Increase in deficit driven by decline in corporate bond yields, particularly since UK referendum
vote to leave the EU
Triennial review of AA UK pension scheme commenced
• Anticipate a significant increase from previous valuation of £202m (31 March 2013) due to
reduction in long term gilt yields
• Deficit likely to be materially below IAS 19 valuation
• Review completion due by June 2017
Review of options to mitigate current and future liabilities
Decline in bond yields provides refinancing opportunity
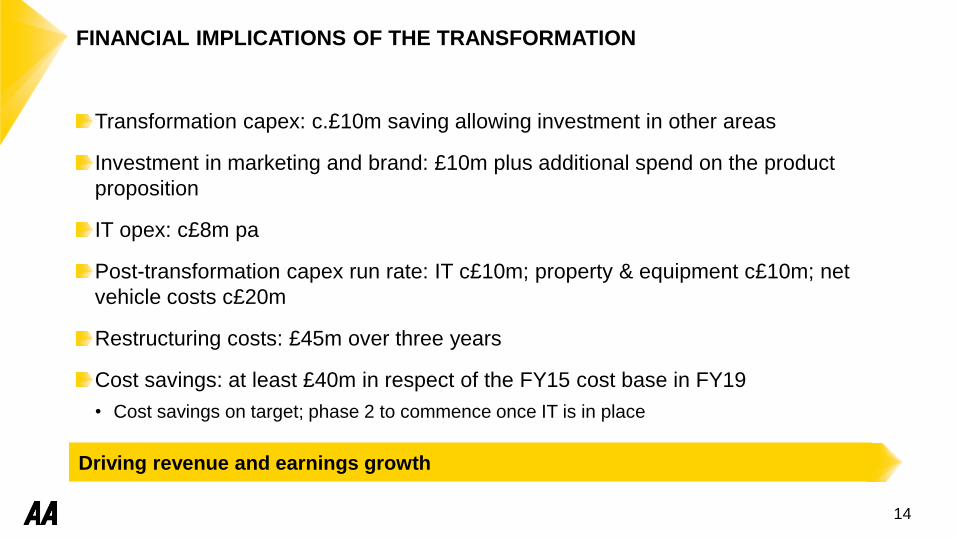
FINANCIAL IMPLICATIONS OF THE TRANSFORMATION
14
Transformation capex: c.£10m saving allowing investment in other areas
Investment in marketing and brand: £10m plus additional spend on the product
proposition
IT opex: c£8m pa
Post-transformation capex run rate: IT c£10m; property & equipment c£10m; net
vehicle costs c£20m
Restructuring costs: £45m over three years
Cost savings: at least £40m in respect of the FY15 cost base in FY19
• Cost savings on target; phase 2 to commence once IT is in place
Driving revenue and earnings growth
STRATEGY
THE STRATEGIC PRIORITIES
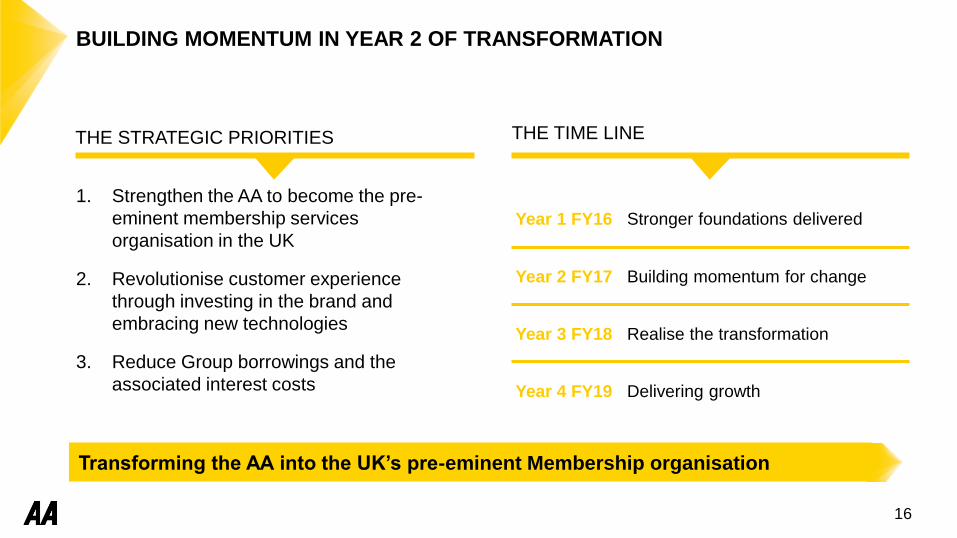
BUILDING MOMENTUM IN YEAR 2 OF TRANSFORMATION
1. Strengthen the AA to become the pre-
eminent membership services
organisation in the UK
2. Revolutionise customer experience
through investing in the brand and
embracing new technologies
3. Reduce Group borrowings and the
associated interest costs
THE TIME LINE
Year 1 FY16 Stronger foundations delivered
Year 2 FY17 Building momentum for change
Year 3 FY18 Realise the transformation
Year 4 FY19 Delivering growth
16
Transforming the AA into the UK’s pre-eminent Membership organisation

ROADSIDE PERSONAL MEMBERSHIP – REVERSING THE DECLINE
Growth in paid personal membership numbers
since April and continuing since July
Retention improved to 81% (80% last year)
Stay AA since inception
• Calls to Stay AA down 9%
• Save rate up 7 percentage points
• Discount rate down 7 percentage points
Double-digit growth in new business volumes
• Re-invigorated marketing approach
• Improved digital capabilities
• Lower price increases to drive retention
• Advertising gaining traction
17
MONTHLY PAID NEW BUSINESS VOLUMES
YoY growth (%)
Jul-1
4
Aug-14
Sep-14
Oct-1
4
Nov-14
Dec-14
Jan-15
Feb-15
Mar-15
Apr-1
5
May-15
Jun-15
Jul-1
5
Aug-15
Sep-15
Oct-1
5
Nov-15
Dec-15
Jan-16
Feb-16
Mar-16
Apr-1
6
May-16
Jun-16
Jul-1
6
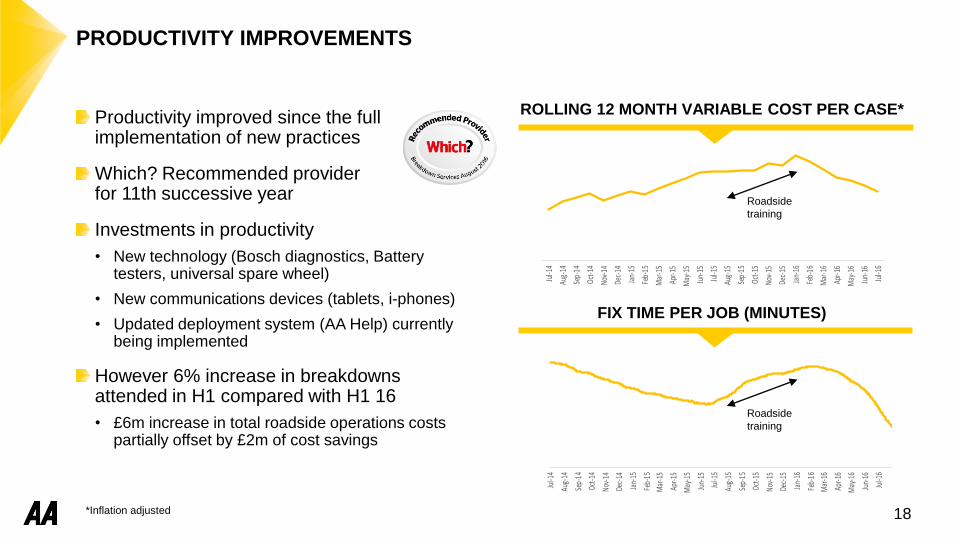
PRODUCTIVITY IMPROVEMENTS
18
Productivity improved since the full implementation of new practices
Which? Recommended provider for 11th successive year
Investments in productivity
• New technology (Bosch diagnostics, Battery testers, universal spare wheel)
• New communications devices (tablets, i-phones)
• Updated deployment system (AA Help) currently being implemented
However 6% increase in breakdowns attended in H1 compared with H1 16
• £6m increase in total roadside operations costs partially offset by £2m of cost savings
ROLLING 12 MONTH VARIABLE COST PER CASE*
Roadside
training
Jul-1
4
Aug-14
Sep-14
Oct-1
4
Nov-14
Dec-14
Jan-15
Feb-15
Mar-15
Apr-1
5
May-15
Jun-15
Jul-1
5
Aug-15
Sep-15
Oct-1
5
Nov-15
Dec-15
Jan-16
Feb-16
Mar-16
Apr-1
6
May-16
Jun-16
Jul-1
6
Roadside
training
FIX TIME PER JOB (MINUTES)
*Inflation adjusted
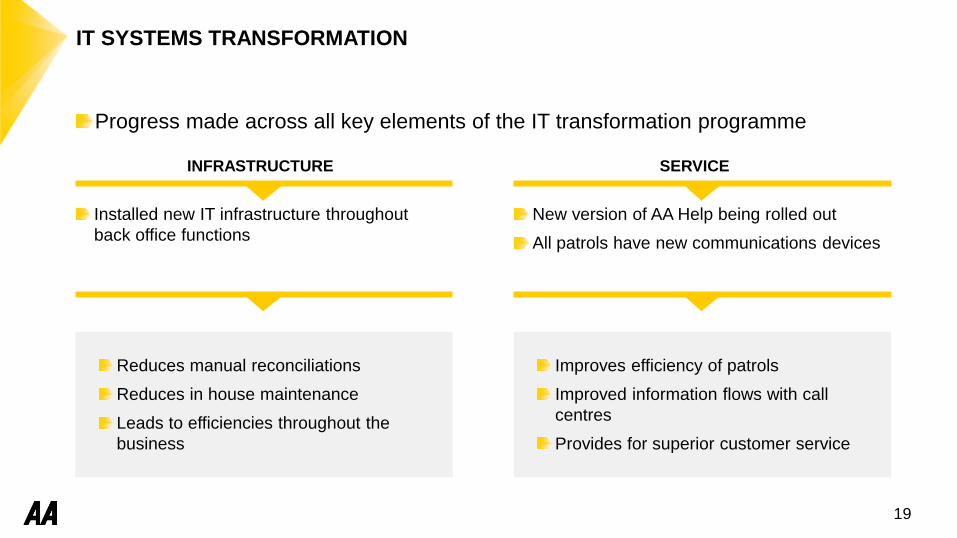
IT SYSTEMS TRANSFORMATION
19
Progress made across all key elements of the IT transformation programme
Installed new IT infrastructure throughout
back office functions
INFRASTRUCTURE
New version of AA Help being rolled out
All patrols have new communications devices
SERVICE
Reduces manual reconciliations
Reduces in house maintenance
Leads to efficiencies throughout the
business
Improves efficiency of patrols
Improved information flows with call
centres
Provides for superior customer service
IT SYSTEMS TRANSFORMATION
20
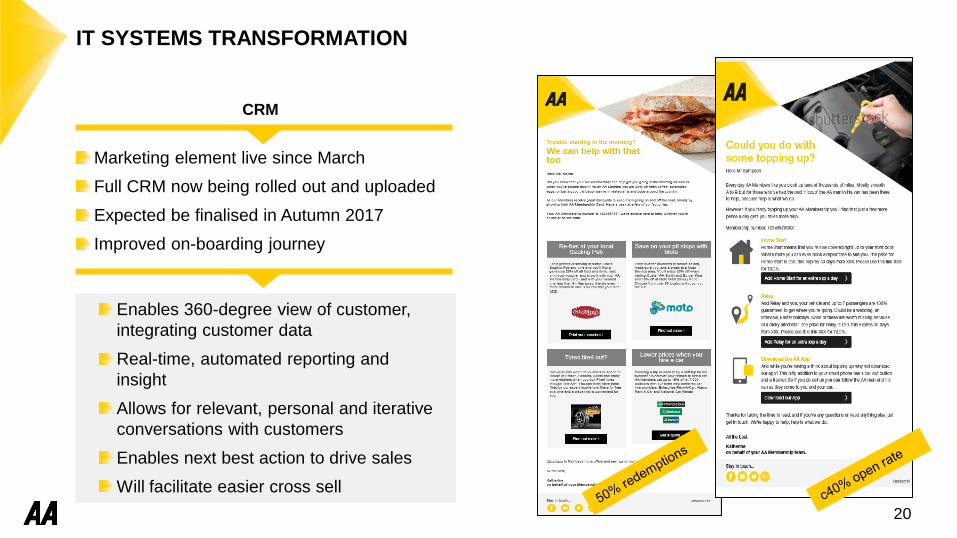
Marketing element live since March
Full CRM now being rolled out and uploaded
Expected be finalised in Autumn 2017
Improved on-boarding journey
CRM
Enables 360-degree view of customer,
integrating customer data
Real-time, automated reporting and
insight
Allows for relevant, personal and iterative
conversations with customers
Enables next best action to drive sales
Will facilitate easier cross sell
IT SYSTEMS TRANSFORMATION
21
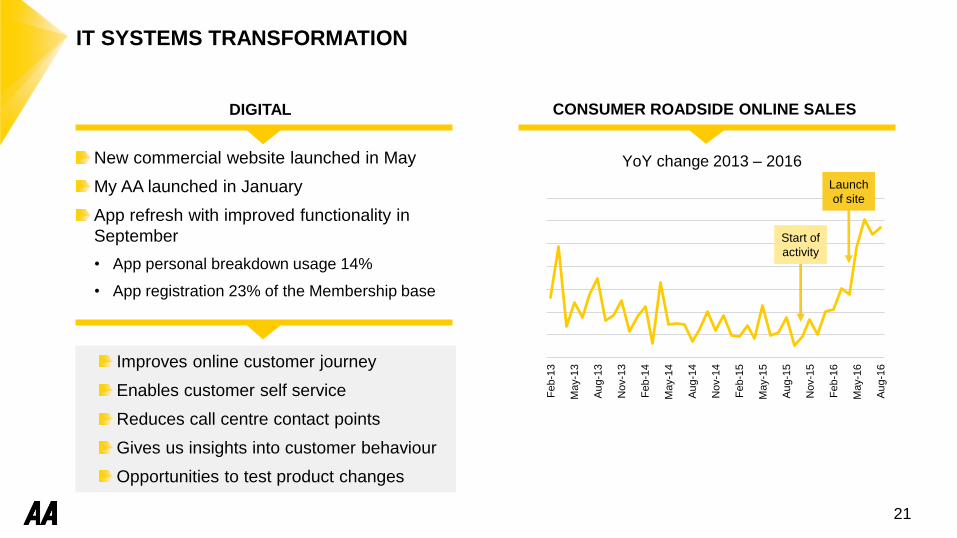
New commercial website launched in May
My AA launched in January
App refresh with improved functionality in
September
• App personal breakdown usage 14%
• App registration 23% of the Membership base
DIGITAL
Improves online customer journey
Enables customer self service
Reduces call centre contact points
Gives us insights into customer behaviour
Opportunities to test product changes
CONSUMER ROADSIDE ONLINE SALES
Fe
b-1
3
May-1
3
Au
g-1
3
Nov-1
3
Fe
b-1
4
May-1
4
Au
g-1
4
Nov-1
4
Fe
b-1
5
May-1
5
Au
g-1
5
Nov-1
5
Fe
b-1
6
May-1
6
Au
g-1
6
Start of
activity
YoY change 2013 – 2016
Launch
of site
ADVERTISING ACHIEVING GREATER IMPACT
22
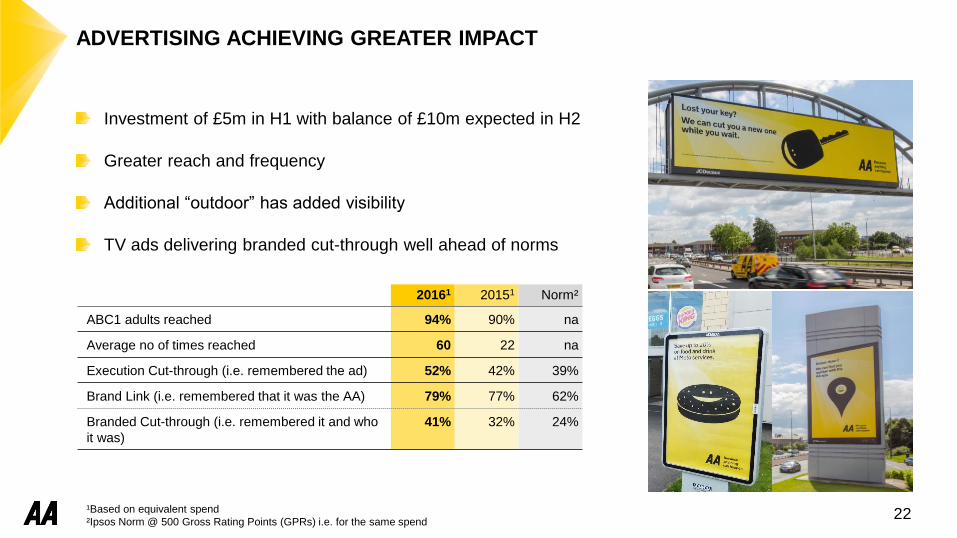
Investment of £5m in H1 with balance of £10m expected in H2
Greater reach and frequency
Additional “outdoor” has added visibility
TV ads delivering branded cut-through well ahead of norms
20161 20151 Norm²
ABC1 adults reached 94% 90% na
Average no of times reached 60 22 na
Execution Cut-through (i.e. remembered the ad) 52% 42% 39%
Brand Link (i.e. remembered that it was the AA) 79% 77% 62%
Branded Cut-through (i.e. remembered it and who
it was)
41% 32% 24%
¹Based on equivalent spend
²Ipsos Norm @ 500 Gross Rating Points (GPRs) i.e. for the same spend

FINANCIAL SERVICES AND IN HOUSE UNDERWRITER
23
Launched cards, loans, savings, and mortgages (in
August) in partnership with the Bank of Ireland
£160m matched book value
AA positioned in top 1-5 savings; top 10 for cards
and loans
FINANCIAL SERVICES INSURANCE UNDERWRITER
Insurance Underwriter launched in January to
participate on the AA’s motor insurance panel
25k policies written by end of July; 54k by end
of September
Home insurance launched in August
Too early for material financial contribution but
early signs are promising
*For cards, this analysis does not show the fee based long dated balance transfer (BT) card segment.
As at 12th September 2016
AA UNDERWRITER POLICIES BY ORIGIN
52%32%
16% Has never been an AA insurancecustomer
Was once previously an AAinsurance customer
An existing AA insurance customer
Strengthened foundations and revolutionising customer experience
SUMMARY
24
Transformation well on track
• Continue to invest in brand marketing and product proposition
• Targeting cost savings from FY19 of at least £40m pa off the FY15 base
• Saving of c.£10m transformation capex allowing investment in other areas
Growth in Membership numbers - continued improvement into August and September
Free cash flow generation to be enhanced following transformation
Trading in line with market expectations for FY17; building momentum for FY18

The UK’s pre-eminent Membership services organisation

APPENDIX

£m H117 H116 Change
% of
Group
Roadside Assistance 370 359 +3.1% 79% Increase in average revenue per customer and
B2B revenue
Insurance Services 64 64 - 14% Lower policy numbers offset by higher income
per policy
Driving Services 32 33 -3.0% 7% Lower driving school franchises
Insurance
Underwriting
1 1 - -
Trading revenue 467 457 +2.2%
Business held for
sales¹
- 9
Exceptional revenue
provision
(10) -
Total revenue 457 466 -1.9%
REVENUE
271 In September 2015, AA plc group completed the sale of its subsidiary Autowindshields (UK) Limited. As a result, this business was presented as held for sale in
the prior period.
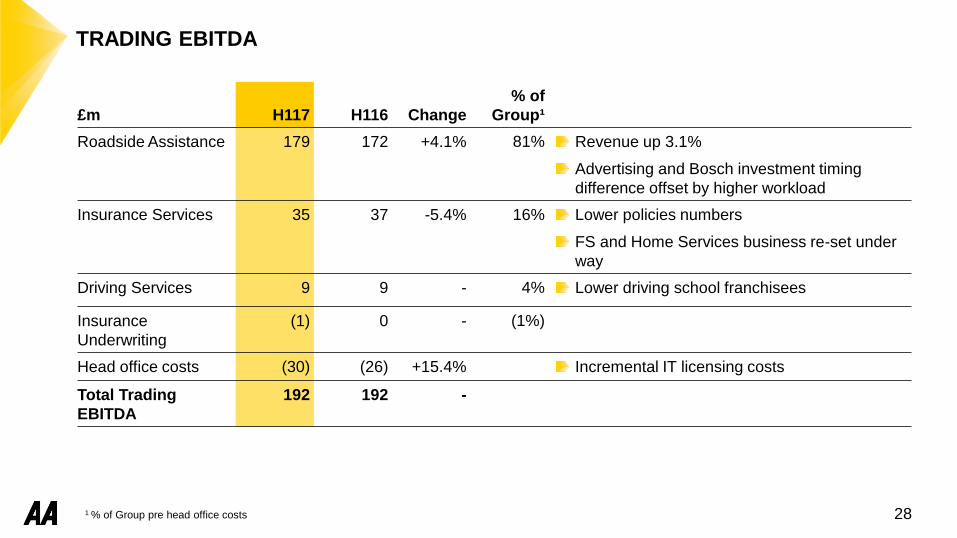
TRADING EBITDA
£m H117 H116 Change
% of
Group¹
Roadside Assistance 179 172 +4.1% 81% Revenue up 3.1%
Advertising and Bosch investment timing
difference offset by higher workload
Insurance Services 35 37 -5.4% 16% Lower policies numbers
FS and Home Services business re-set under
way
Driving Services 9 9 - 4% Lower driving school franchisees
Insurance
Underwriting
(1) 0 - (1%)
Head office costs (30) (26) +15.4% Incremental IT licensing costs
Total Trading
EBITDA
192 192 -
281 % of Group pre head office costs
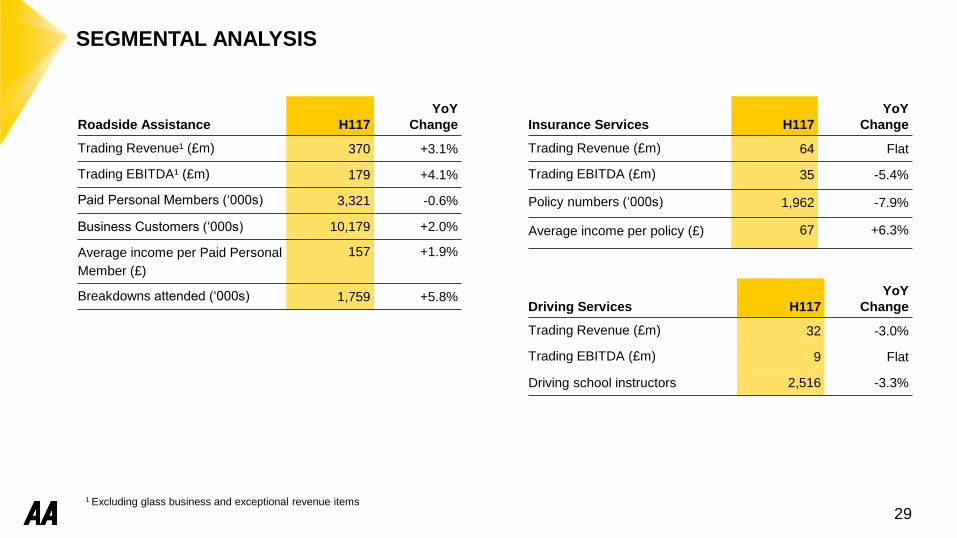
SEGMENTAL ANALYSIS
Insurance Services H117
YoY
Change
Trading Revenue (£m) 64 Flat
Trading EBITDA (£m) 35 -5.4%
Policy numbers (‘000s) 1,962 -7.9%
Average income per policy (£) 67 +6.3%
Driving Services H117
YoY
Change
Trading Revenue (£m) 32 -3.0%
Trading EBITDA (£m) 9 Flat
Driving school instructors 2,516 -3.3%
Roadside Assistance H117
YoY
Change
Trading Revenue¹ (£m) 370 +3.1%
Trading EBITDA¹ (£m) 179 +4.1%
Paid Personal Members (‘000s) 3,321 -0.6%
Business Customers (‘000s) 10,179 +2.0%
Average income per Paid Personal
Member (£)
157 +1.9%
Breakdowns attended (‘000s) 1,759 +5.8%
291 Excluding glass business and exceptional revenue items
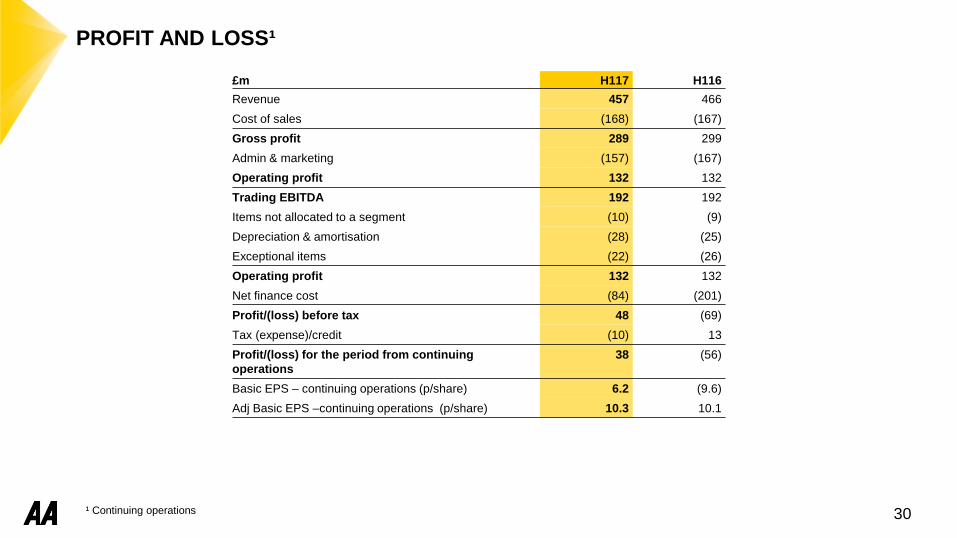
PROFIT AND LOSS¹
£m H117 H116
Revenue 457 466
Cost of sales (168) (167)
Gross profit 289 299
Admin & marketing (157) (167)
Operating profit 132 132
Trading EBITDA 192 192
Items not allocated to a segment (10) (9)
Depreciation & amortisation (28) (25)
Exceptional items (22) (26)
Operating profit 132 132
Net finance cost (84) (201)
Profit/(loss) before tax 48 (69)
Tax (expense)/credit (10) 13
Profit/(loss) for the period from continuing
operations
38 (56)
Basic EPS – continuing operations (p/share) 6.2 (9.6)
Adj Basic EPS –continuing operations (p/share) 10.3 10.1
30¹ Continuing operations

BALANCE SHEET
£m H117 H116
Goodwill and other intangible assets 1,276 1,271
Property, plant and equipment 117 106
Investments in joint ventures and associates 11 8
Deferred tax assets 107 57
Non-current assets 1,511 1,442
Inventories 6 5
Trade and other receivables 169 185
Cash and cash equivalents 158 155
Current assets 333 345
Assets held for sale 93 3
Total assets 1,937 1,790
Trade and other payables (502) (523)
Current tax payable (11) -
Provisions (21) (7)
Current liabilities (534) (530)
Borrowings and loans (2,922) (2,911)
Finance lease obligations (21) (20)
Defined benefit pension scheme liabilities (622) (329)
Provisions (7) (11)
Insurance technical provisions (4) (4)
Non-current liabilities (3,576) (3,275)
Liabilities held for sale (40) (4)
Total liabilities (4,150) (3,809)
Net liabilities (2,213) (2,019)31
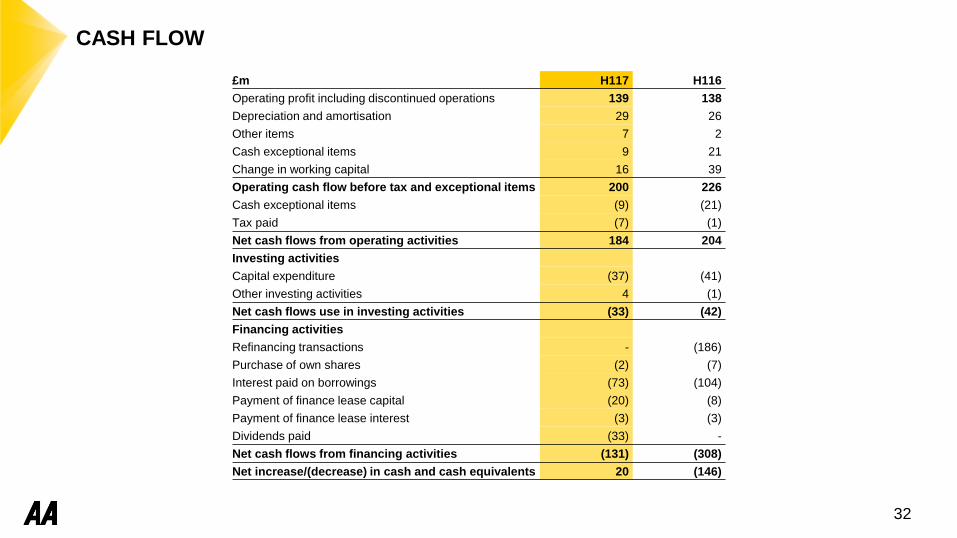
CASH FLOW
£m H117 H116
Operating profit including discontinued operations 139 138
Depreciation and amortisation 29 26
Other items 7 2
Cash exceptional items 9 21
Change in working capital 16 39
Operating cash flow before tax and exceptional items 200 226
Cash exceptional items (9) (21)
Tax paid (7) (1)
Net cash flows from operating activities 184 204
Investing activities
Capital expenditure (37) (41)
Other investing activities 4 (1)
Net cash flows use in investing activities (33) (42)
Financing activities
Refinancing transactions - (186)
Purchase of own shares (2) (7)
Interest paid on borrowings (73) (104)
Payment of finance lease capital (20) (8)
Payment of finance lease interest (3) (3)
Dividends paid (33) -
Net cash flows from financing activities (131) (308)
Net increase/(decrease) in cash and cash equivalents 20 (146)
32
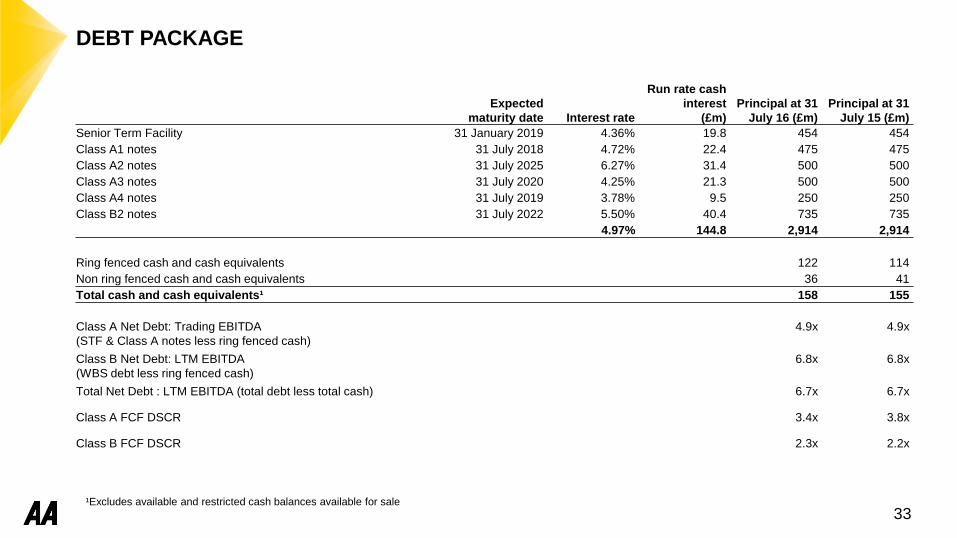
¹Excludes available and restricted cash balances available for sale
DEBT PACKAGE
Expected
maturity date Interest rate
Run rate cash
interest
(£m)
Principal at 31
July 16 (£m)
Principal at 31
July 15 (£m)
Senior Term Facility 31 January 2019 4.36% 19.8 454 454
Class A1 notes 31 July 2018 4.72% 22.4 475 475
Class A2 notes 31 July 2025 6.27% 31.4 500 500
Class A3 notes 31 July 2020 4.25% 21.3 500 500
Class A4 notes 31 July 2019 3.78% 9.5 250 250
Class B2 notes 31 July 2022 5.50% 40.4 735 735
4.97% 144.8 2,914 2,914
Ring fenced cash and cash equivalents 122 114
Non ring fenced cash and cash equivalents 36 41
Total cash and cash equivalents¹ 158 155
Class A Net Debt: Trading EBITDA
(STF & Class A notes less ring fenced cash)
4.9x 4.9x
Class B Net Debt: LTM EBITDA
(WBS debt less ring fenced cash)
6.8x 6.8x
Total Net Debt : LTM EBITDA (total debt less total cash) 6.7x 6.7x
Class A FCF DSCR 3.4x 3.8x
Class B FCF DSCR 2.3x 2.2x
33