Greenhouse Gases and climate change. 2 Equilibrium: Energy/time in = Energy/time out Earth gains...
34
Greenhouse Gases and climate change
-
Upload
agnes-hill -
Category
Documents
-
view
214 -
download
0
Transcript of Greenhouse Gases and climate change. 2 Equilibrium: Energy/time in = Energy/time out Earth gains...

Greenhouse Gases and climate change

2
Equilibrium: Energy/time in = Energy/time out Earth gains energy from the sun, by radiation Earth loses energy to outer space, by radiation Radiated power proportional to T4 (T in Kelvins) With no atmosphere, Earth’s average temp would be
-18 C
3
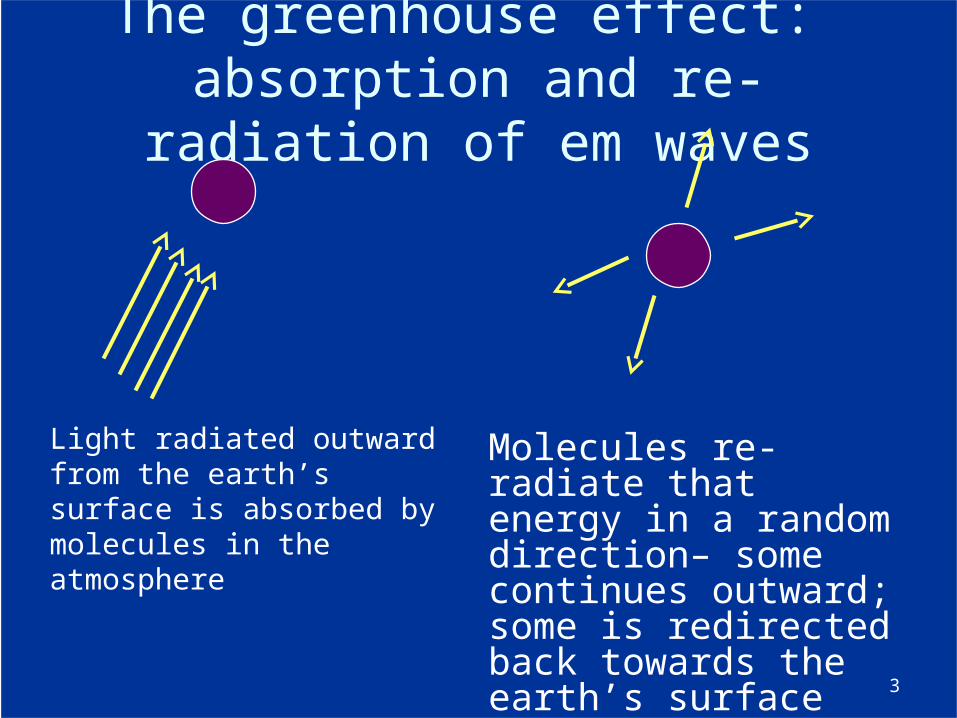
The greenhouse effect: absorption and re-radiation of em waves
Light radiated outward from the earth’s surface is absorbed by molecules in the atmosphere
Molecules re-radiate that energy in a random direction– some continues outward; some is redirected back towards the earth’s surface
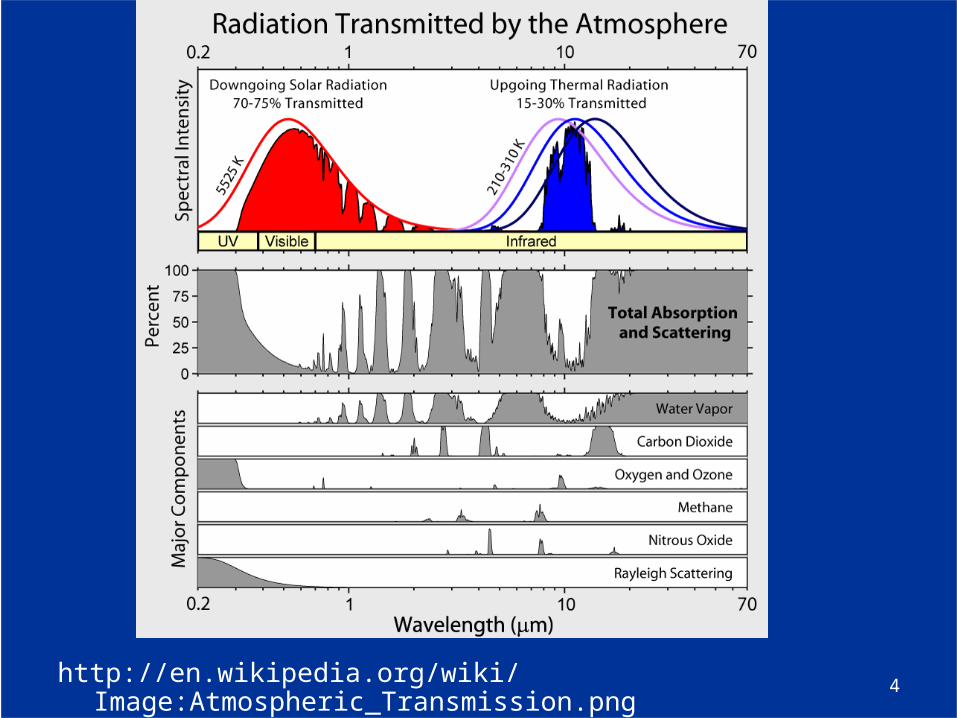
4http://en.wikipedia.org/wiki/Image:Atmospheric_Transmission.png

5
Greenhouse effect: some of the energy radiated outward by the earth is absorbed by greenhouse gases, and reradiated
Thus the earth’s surface is +14 C on average, much warmer than the -18 C we would be have the atmosphere.
In equilibrium (power in = power out), the temperature remains very stable (averaged over the globe).
6
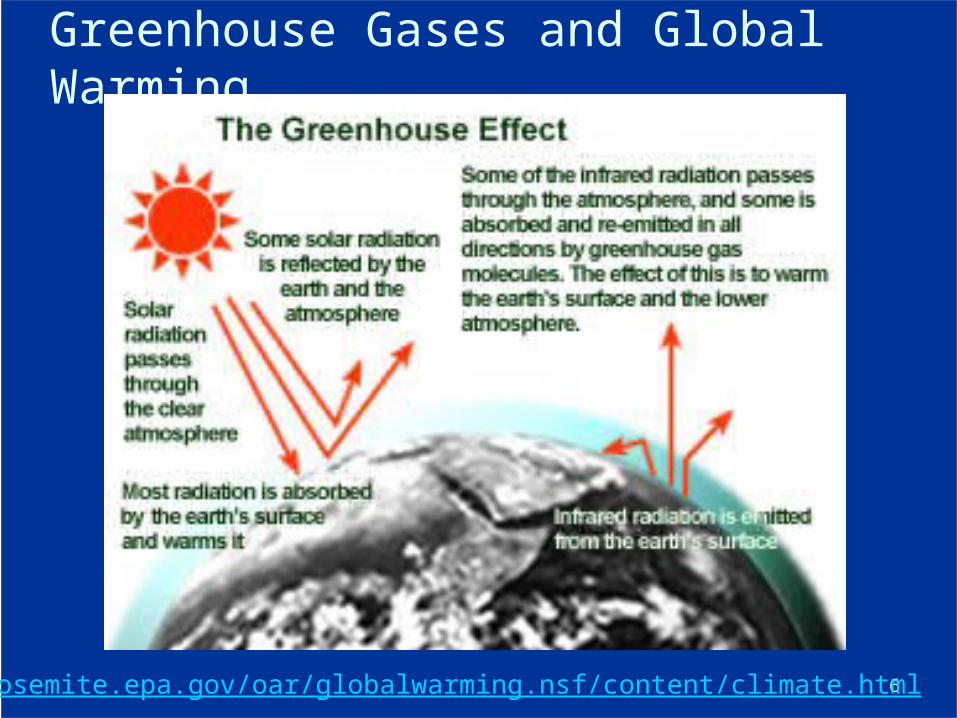
Greenhouse Gases and Global Warming
http://yosemite.epa.gov/oar/globalwarming.nsf/content/climate.html

7

8

9
Deforestation by logging is not a “feedback” mechanism

http://www.youtube.com/watch?v=YegdEOSQotE&feature=related
10
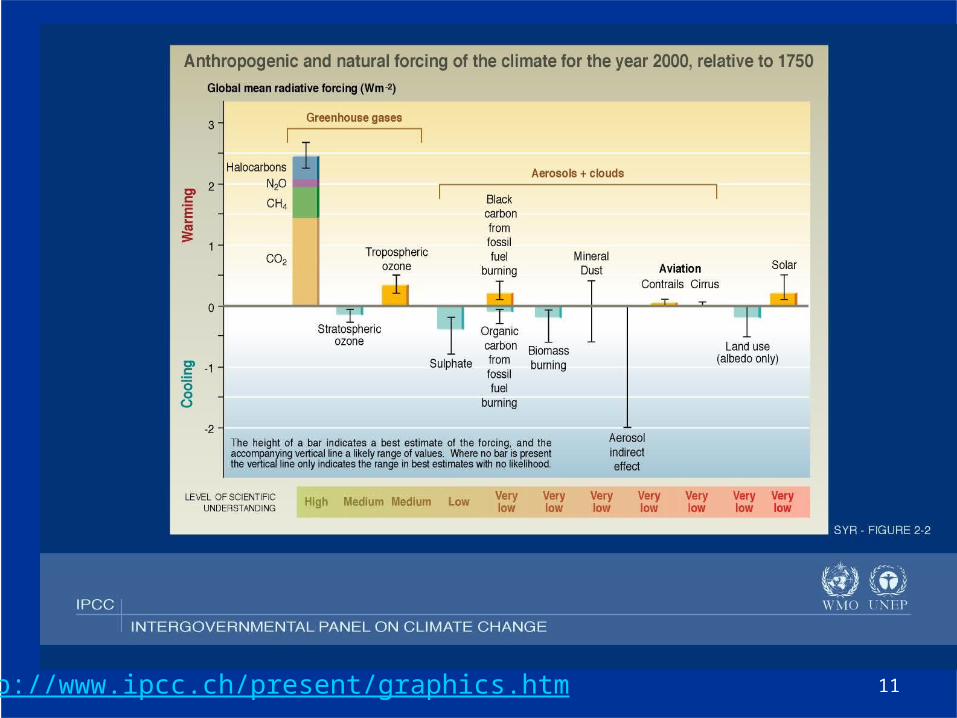
11http://www.ipcc.ch/present/graphics.htm
Current Climate Forcings
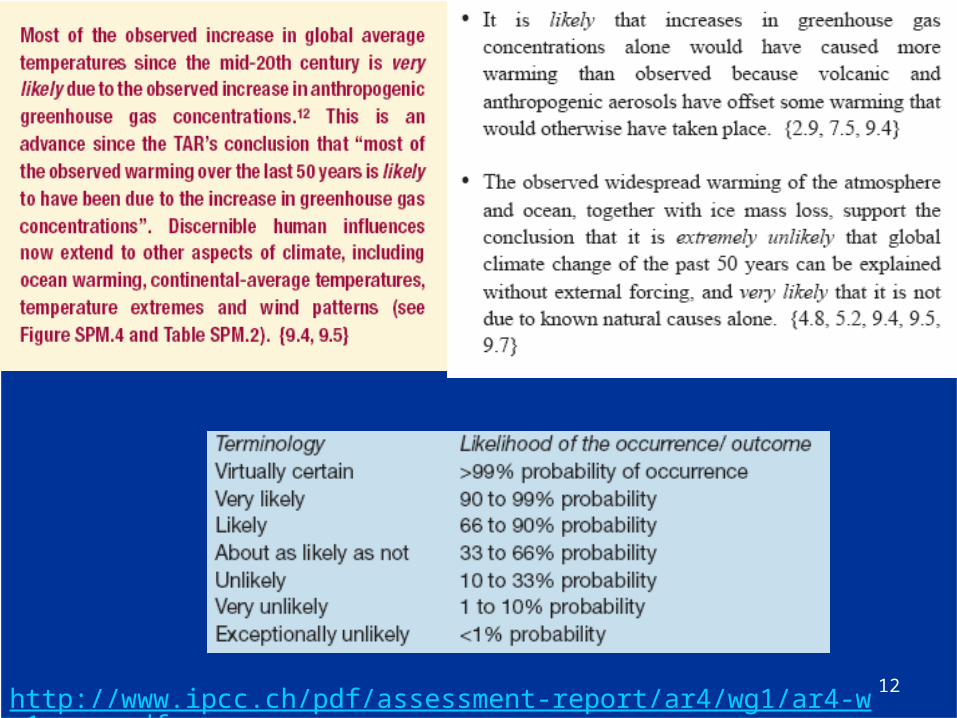
12http://www.ipcc.ch/pdf/assessment-report/ar4/wg1/ar4-wg1-spm.pdf, p 10

13
Temperature Changes in the Last Millennium
http://yosemite.epa.gov/oar/globalwarming.nsf/content/climate.html
14
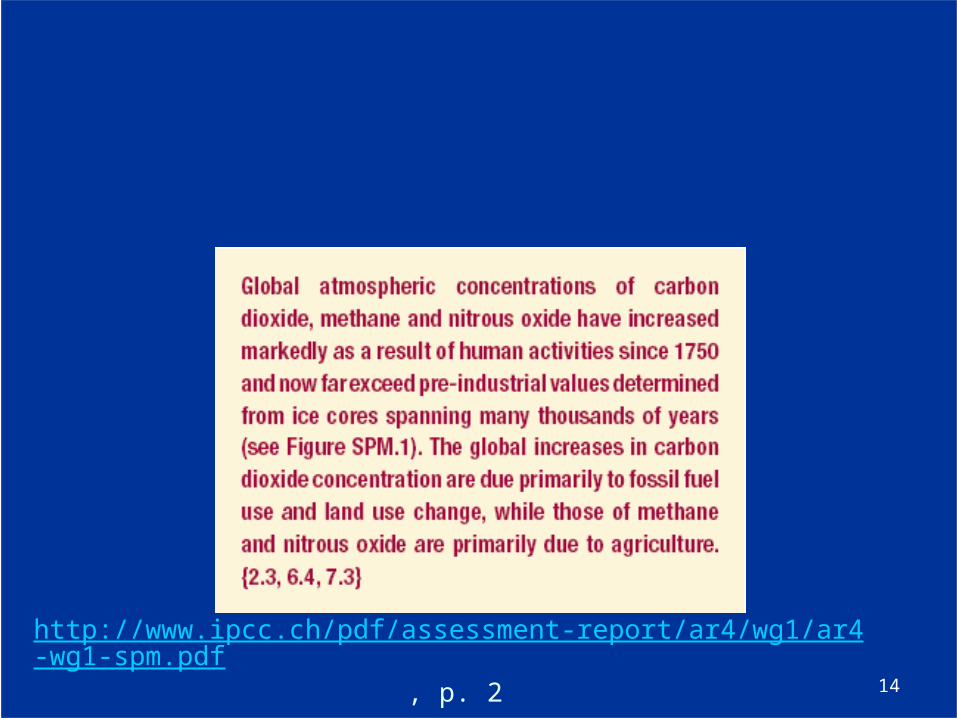
http://www.ipcc.ch/pdf/assessment-report/ar4/wg1/ar4-wg1-spm.pdf, p. 2
15
16
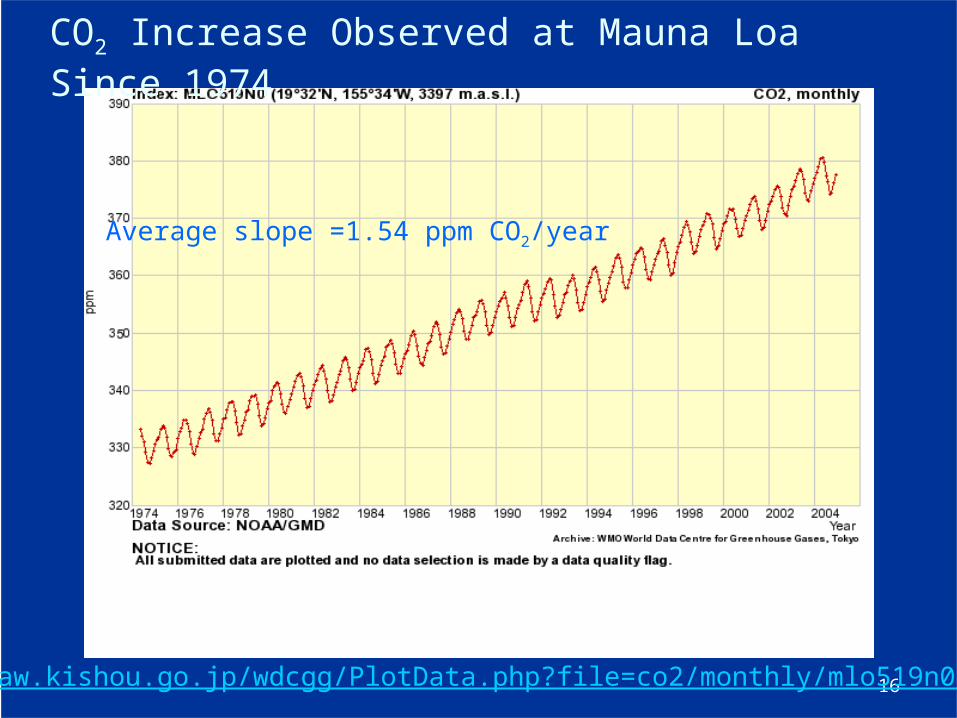
CO2 Increase Observed at Mauna Loa Since 1974
http://gaw.kishou.go.jp/wdcgg/PlotData.php?file=co2/monthly/mlo519n0.dat
Average slope =1.54 ppm CO2/year

17
CO2 Increase Observed at South Pole Since 1974
Increase is occurring over the entire earthIncrease is occurring over the entire earthThis increase is observed everywhere, even at the South Pole.
http://gaw.kishou.go.jp/wdcgg/PlotData.php?file=co2/monthly/spo789s0.dat
18
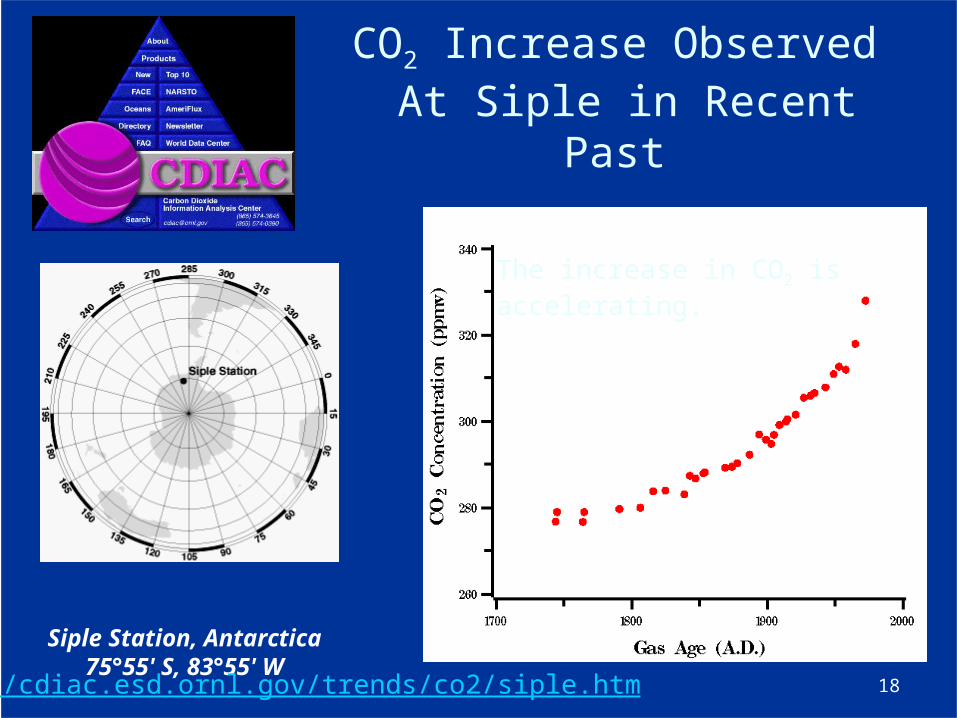
CO2 Increase Observed At Siple in Recent Past
Siple Station, Antarctica75°55' S, 83°55' W
http://cdiac.esd.ornl.gov/trends/co2/siple.htm
The increase in CO2 is accelerating.

19
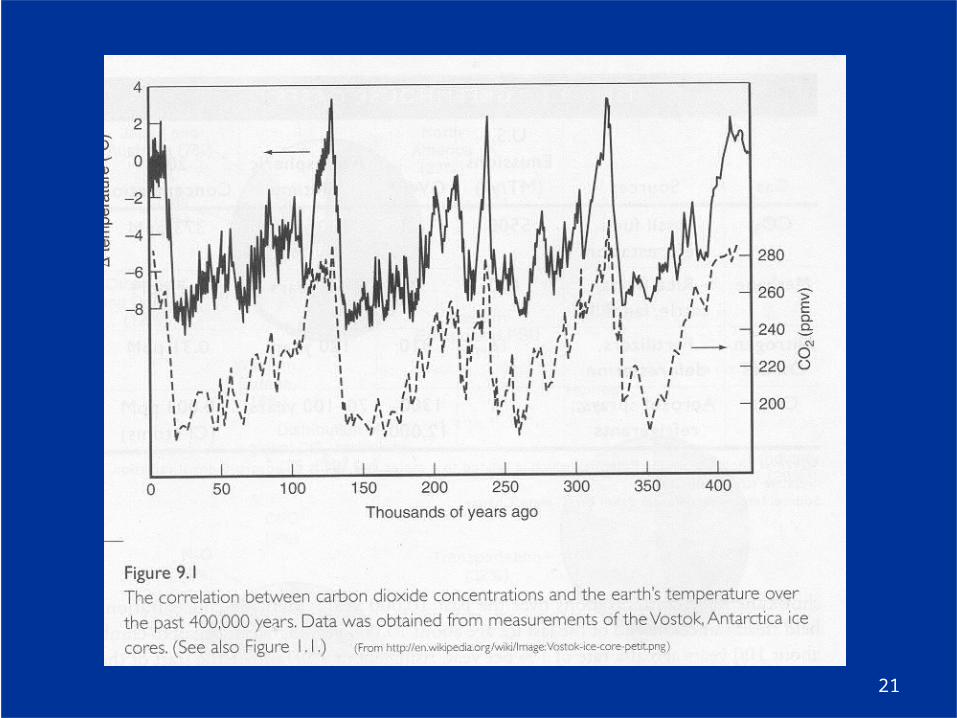
CO2 Fluctuations Obtained from Vostok Ice Core Samples over the Last 400,000 yrs
Vostok, Antarctica 78°28' S, 106°48'E3488 m above MSL
http://cdiac.esd.ornl.gov/trends/co2/graphics/vostok.co2.gif
1 kyr = 1 kilo year = 1000 years

20
Temperature Fluctuations Obtained from Vostok Ice Core Samples over the Last 400,000 yrs
“Because isotopic fractions of the heavier 18-O and D in snowfall are temperature-dependent and a strong spatial correlation exists between the annual mean temperature and the mean isotopic ratio (18O or D) of precipitation, it is possible to derive ice-core climate records… [This was] completed in January 1998, reaching a depth of 3623 m, the deepest ice core ever recovered (Petit et al. 1997, 1999). The resulting core allows the ice core record of climate properties at Vostok to be extended to ~420 kyr BP.”
Source: http://cdiac.esd.ornl.gov/trends/temp/vostok/graphics/tempplot5.gif
21
22
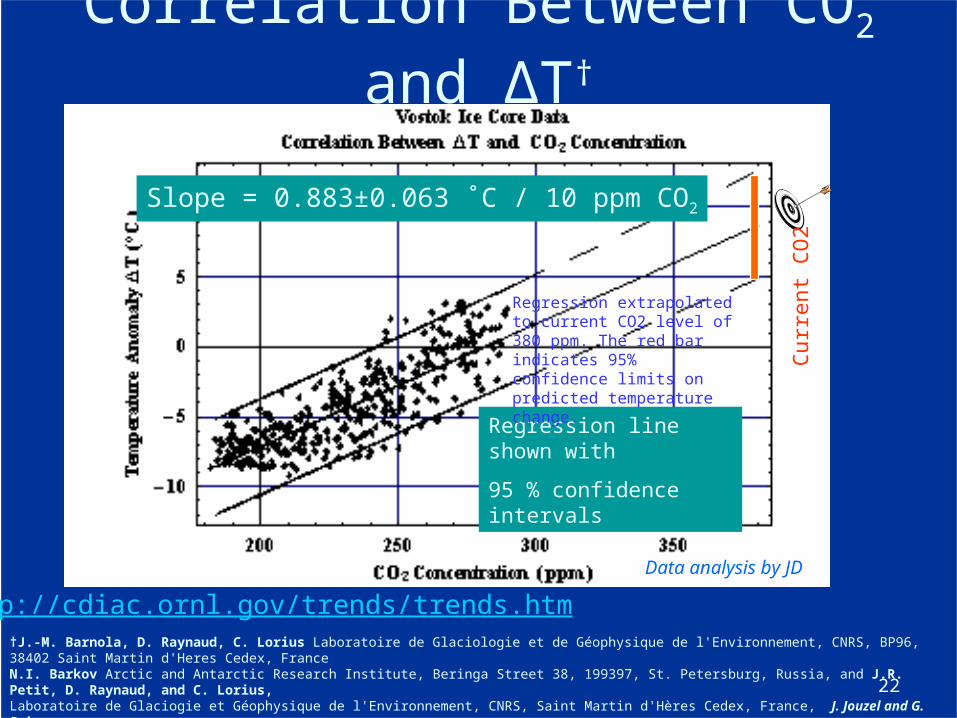
Correlation Between CO2 and ΔT†
Slope = 0.883±0.063 ˚C / 10 ppm CO2
†J.-M. Barnola, D. Raynaud, C. Lorius Laboratoire de Glaciologie et de Géophysique de l'Environnement, CNRS, BP96, 38402 Saint Martin d'Heres Cedex, France N.I. Barkov Arctic and Antarctic Research Institute, Beringa Street 38, 199397, St. Petersburg, Russia, and J.R. Petit, D. Raynaud, and C. Lorius, Laboratoire de Glaciogie et Géophysique de l'Environnement, CNRS, Saint Martin d'Hères Cedex, France, J. Jouzel and G. Delaygue, Laboratoire des Sciences du Climat et de l'Environnement (LSCE), CEA/CNRS, L'Orme des Merisiers, CEA Saclay, 91191 Gif-sur-Yvette Cedex, France
http://cdiac.ornl.gov/trends/trends.htm
Regression line shown with
95 % confidence intervals
Regression extrapolated to current CO2 level of 380 ppm. The red bar indicates 95% confidence limits on predicted temperature change.
Cur
rent
CO
2
Data analysis by JD

23
Temperature Increases Are Observed In Northern and Southern Hemispheres
http://cdiac.esd.ornl.gov/trends/temp/lugina/graphics/allann.jpg
Carbon Dioxide Information Analysis Center

24
Temperature Increases Are Observed On Both Land And Ocean Surfaces
http://www.ncdc.noaa.gov/img/climate/research/anomalies/triad_pg.gif
25
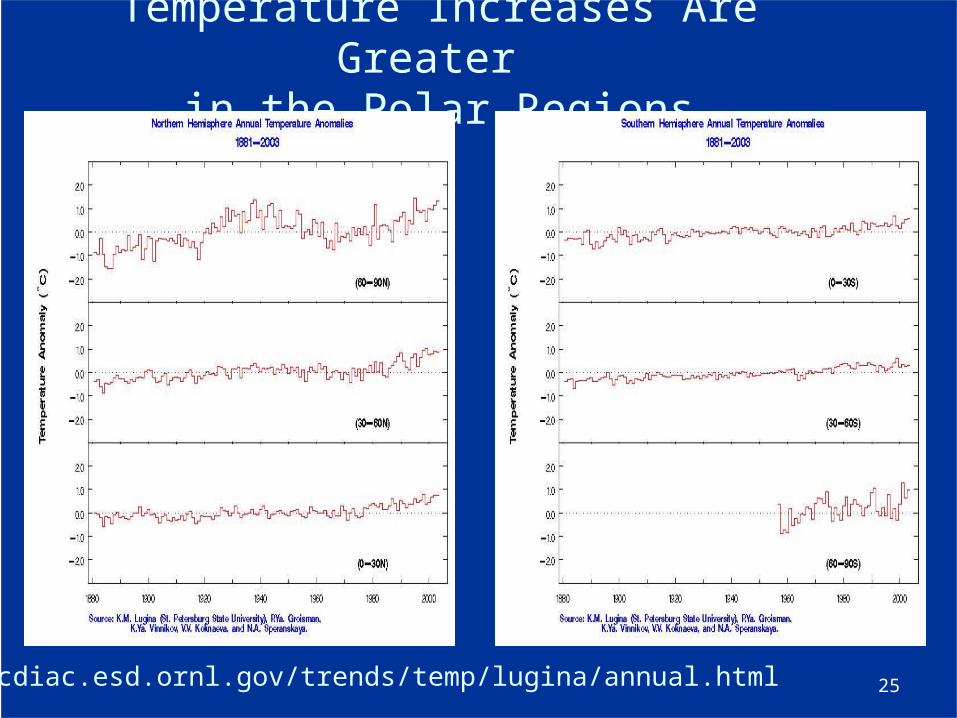
Temperature Increases Are Greater in the Polar Regions
http://cdiac.esd.ornl.gov/trends/temp/lugina/annual.html
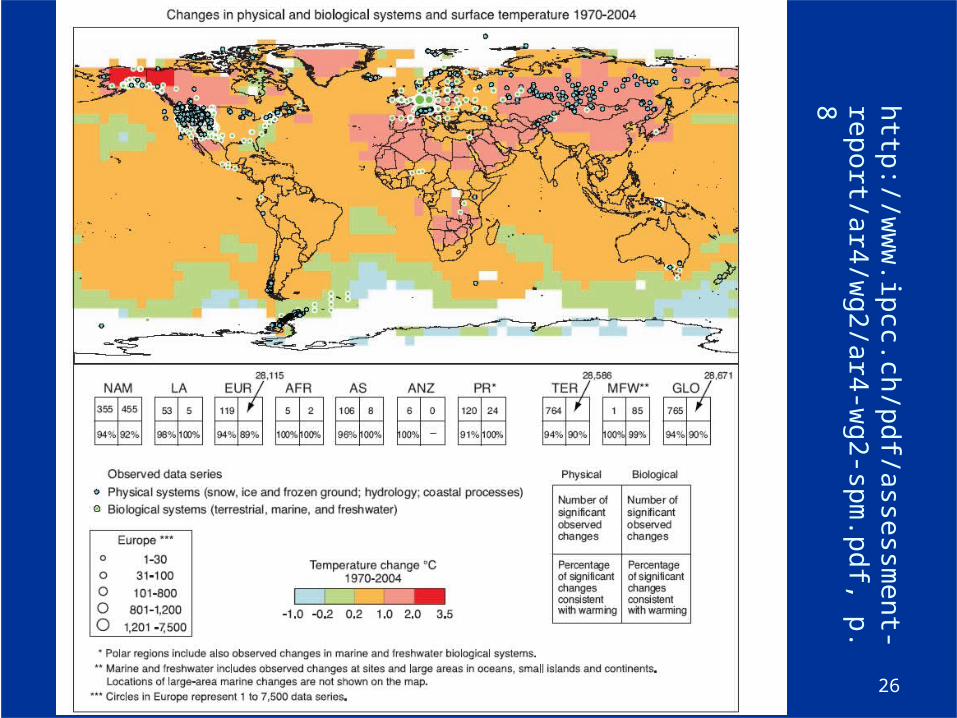
26
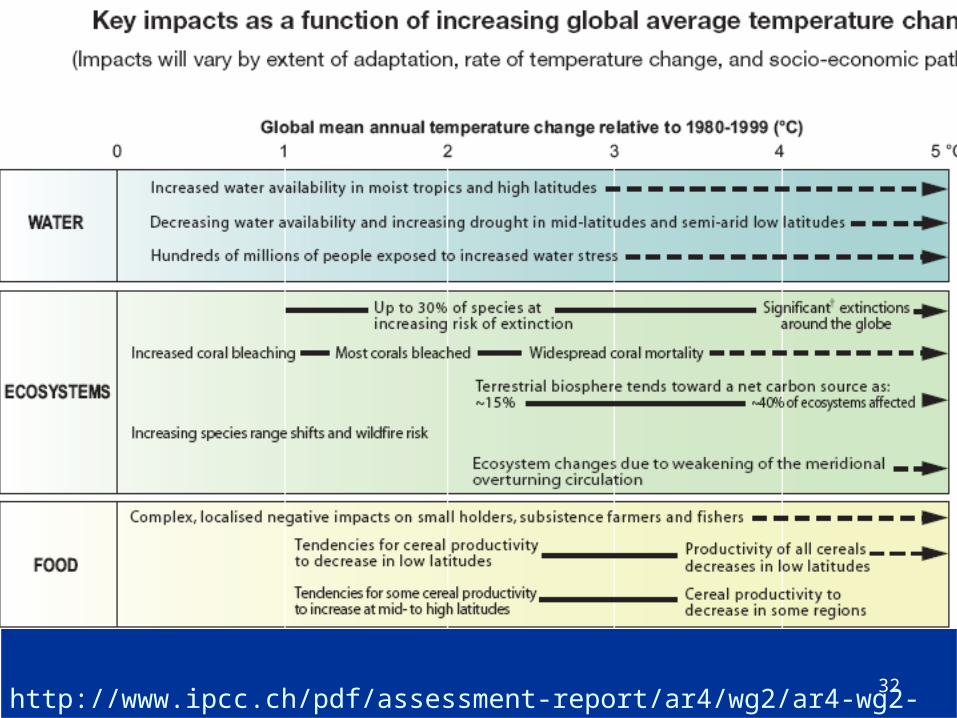
http://ww
w.ipcc.ch/pdf/assessm
ent-report/ar4/w
g2/ar4-wg2-spm
.pdf, p. 8
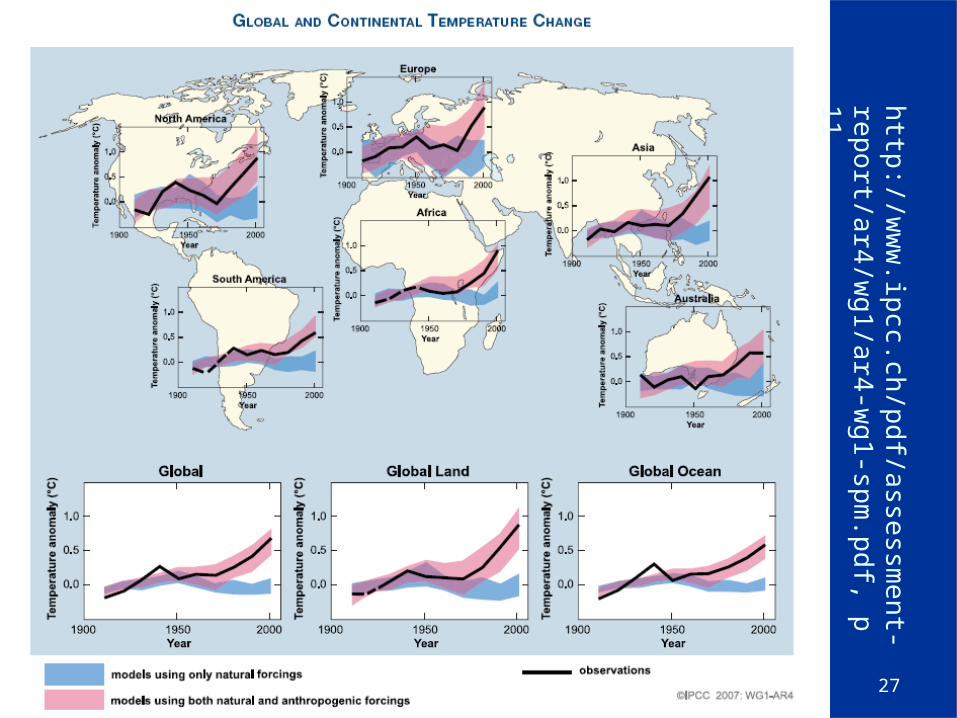
27
http://ww
w.ipcc.ch/pdf/assessm
ent-report/ar4/w
g1/ar4-wg1-spm
.pdf, p 11

28
http://ww
w.ipcc.ch/pdf/assessm
ent-report/ar4/w
g1/ar4-wg1-spm
.pdf, p. 6
29
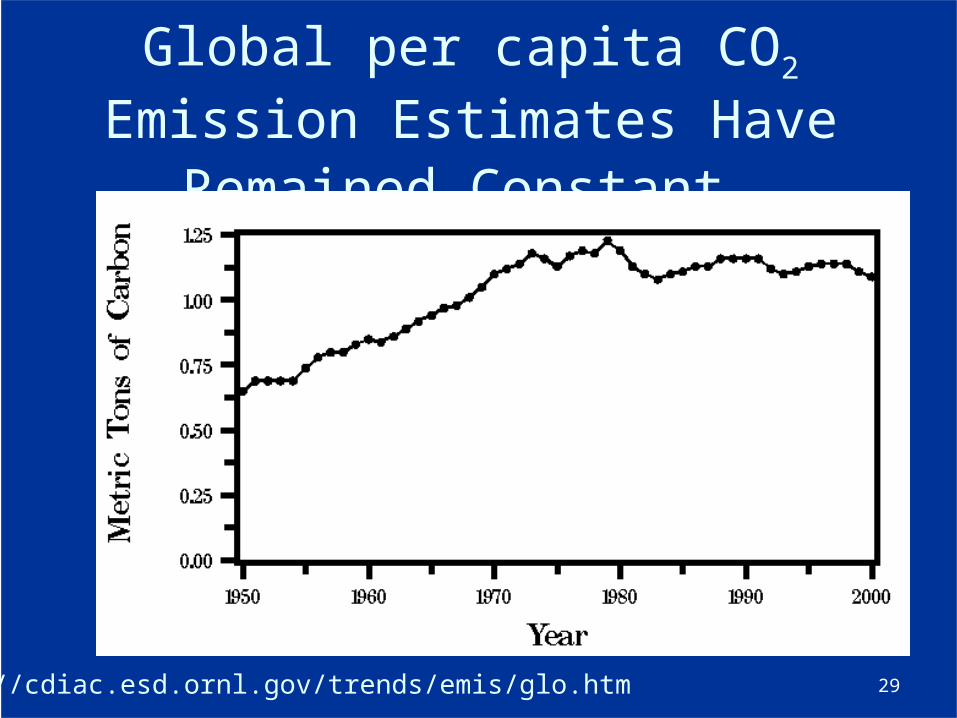
Global per capita CO2 Emission
Estimates Have Remained Constant
http://cdiac.esd.ornl.gov/trends/emis/glo.htm
30
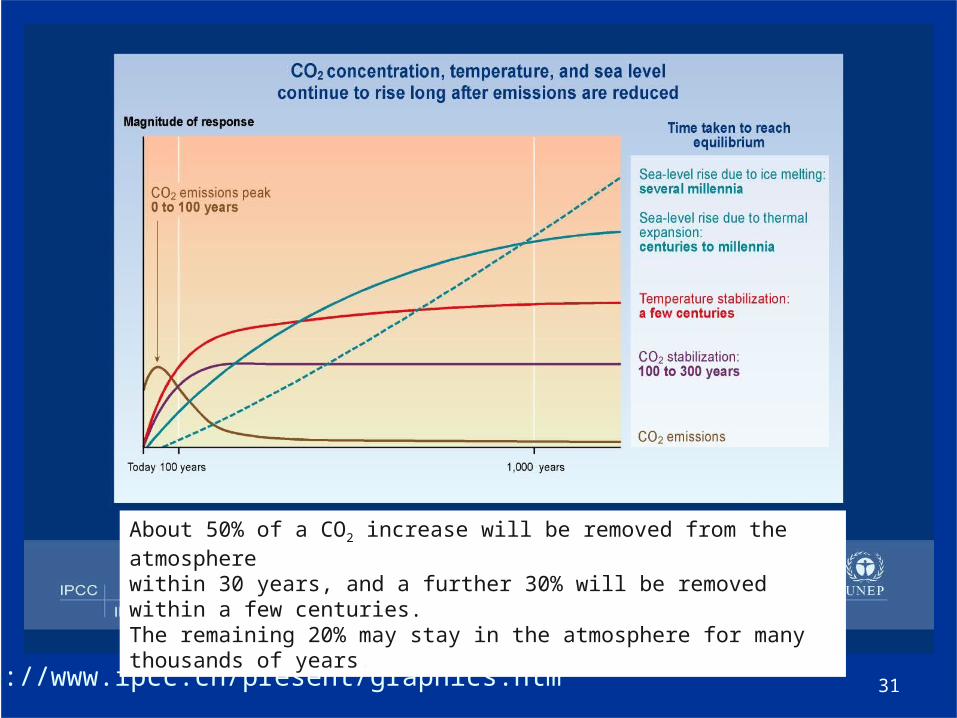
31
http://www.ipcc.ch/present/graphics.htmhttp://www.ipcc.ch/present/graphics.htm
http://www.ipcc.ch/present/graphics.htm
Two CO2 Scenarios
About 50% of a CO2 increase will be removed from the atmosphere within 30 years, and a further 30% will be removed within a few centuries. The remaining 20% may stay in the atmosphere for many thousands of years.
32http://www.ipcc.ch/pdf/assessment-report/ar4/wg2/ar4-wg2-spm.pdf, p. 8
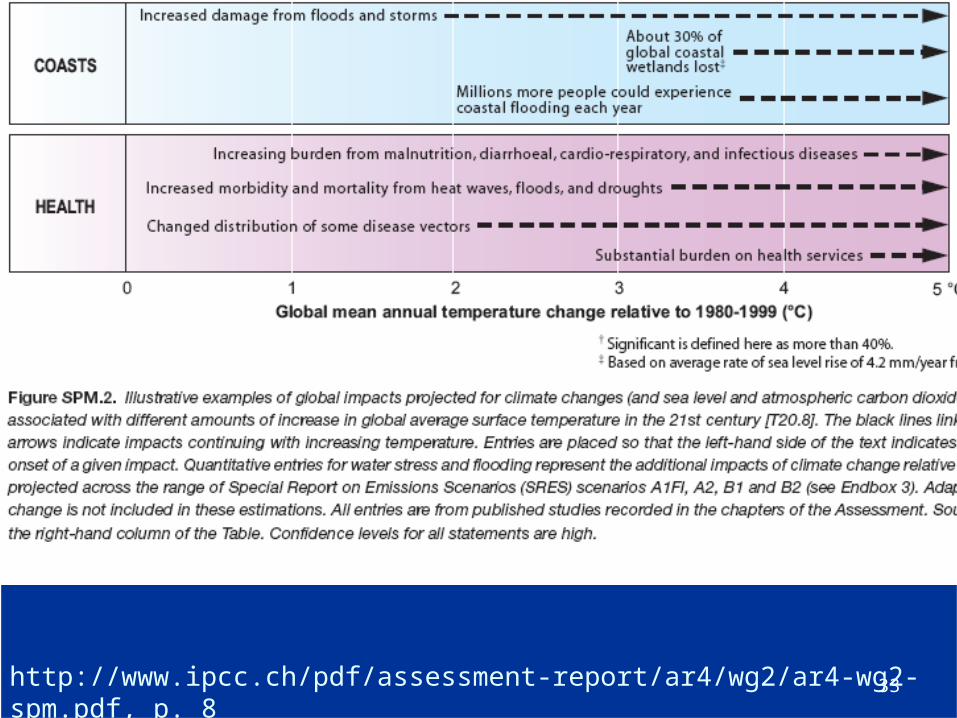
33http://www.ipcc.ch/pdf/assessment-report/ar4/wg2/ar4-wg2-spm.pdf, p. 8
http://www.youtube.com/watch?v=w9SGw75pVas&feature=player_embedded
http://www.ipcc.ch/ http://www.epa.gov/climatechange/
34