Green Building Report 2012 - doee · Green Building Report ... such as development of the Green...
56
Transcript of Green Building Report 2012 - doee · Green Building Report ... such as development of the Green...
2 Green Building Report 2012
TABLE OF CONTENTS
I. EXECUTIVE SUMMARY …………………………………………….……
II. INTRODUCTION……………………………………………………….…...
A. Report Intent ……………………………..…………………………….
B. Sustainability in the District of Columbia ……………………....................
III. GREEN BUILDING REPORT ……………………………………………..
A. Green Building Market Overview ………………..………………………….
B. Public Sector Report ……………………………………………………
C. Private Sector Report …………………………………………………..
IV. BENCHMARKING REPORT ……………………………………………...
A. Overview ……………………………………………………………………
B. Public Building Benchmarking ………………………….………………
C. Private Building Benchmarking Implementation …………………...…
D. Private Building Compliance ……………………………………………
E. Private Building Benchmarking Preliminary Results………..………
F. Recommendations for Improving Benchmarking in the District…....
V. CODES, REGULATIONS & LEGISLATION ……………………………
A. Green Construction Codes…………………………………………….
B. Rulemaking …………..…………………………………………………
C. Legislative Amendments ………………………………………………….
VI. IMPLEMENTATION …………………………………………………………
A. Capacity Building, Training & Education ………………………………
B. Enforcement & Compliance …………………………………………….
C. Green Building Fund ……………………………………………………
D. Incentives ………………………………………………………………..
VII. CONCLUSION ………….…………………..………………………………
GLOSSARY ………………………………………………………………..…
LIST OF APPENDICES …………………………….……………..………
3
7
7
7
12
12
19
20
21
21
22
26
28
29
34
36
36
37
38
39
39
39
41
41
42
43
45
3 Green Building Report 2012
I. EXECUTIVE SUMMARY
The green building report is an annual requirement of the Green Building Act of 2006 (―GBA‖).
It is intended to catalogue the implementation of the GBA and the progress made toward a more
sustainable built environment in the District of Columbia. The report is divided into seven
chapters, and includes a glossary of terms and appendices. The report is published as a joint
effort of the District Department of the Environment (“DDOE”) and the Green Building
Advisory Council (“GBAC”), an entity that DDOE chairs which is made up of private and
public sector individuals dedicated to greening the built environment in the District.
This report summarizes green building efforts and data from calendar year 2012. Some major
projects undertaken in late 2012 and early 2013, such as development of the Green Construction
Code and the Green Building Fund grant program are briefly discussed in this report, but will be
covered more extensively in the 2013 report.
District’s Green Building Leadership
Though it is difficult to precisely quantify what it means to be a national leader in green building
implementation, for the purposes of this report, we will use various green building certification
platforms as indicators of the District‘s leadership, including the U.S. Green Building Council‘s
LEED program, ENERGY STAR, and others. The District continues to lead the nation in these
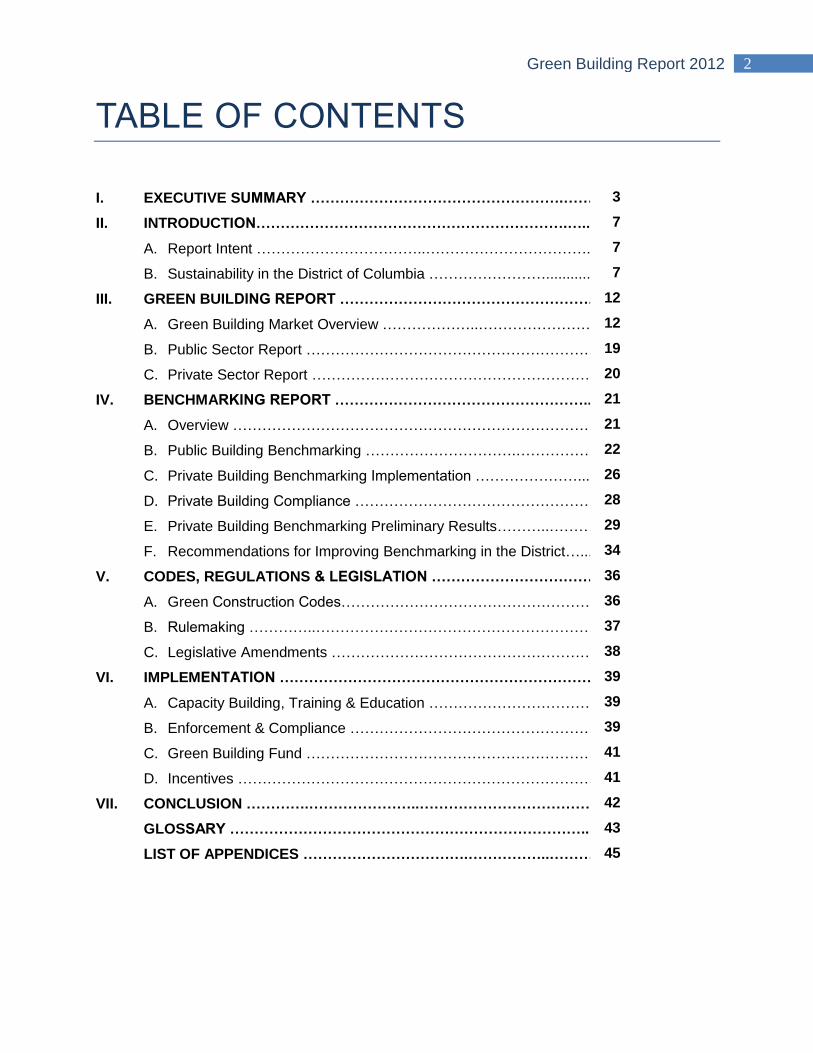
various green building standards on a per capita basis for large cities. At the end of 2012, there
were 346 LEED certified projects including 69,463,873 square feet of total LEED certified space
(not including LEED-Neighborhood Development and LEED-Homes projects). Based on 2010
census data, the District now has more than 100 LEED-certified square feet per capita. Though
Chicago, New York, and Houston each had more total square footage of LEED certified space at
the end of 2012, in per capita numbers the District towered above (see Chart 1 below).
0 20 40 60 80 100 120
WASHINGTON, DC
ATLANTA, GA
SAN FRANCISCO, CA
SEATTLE, WA
LAS VEGAS, NV
BOSTON, MA
CHICAGO, IL
HOUSTON, TX
LOS ANGELES, CA
NEW YORK, NY
12
34
56
78
91
0
Chart 1: Top 10 Cities LEED Square Footage Per Capita
4 Green Building Report 2012
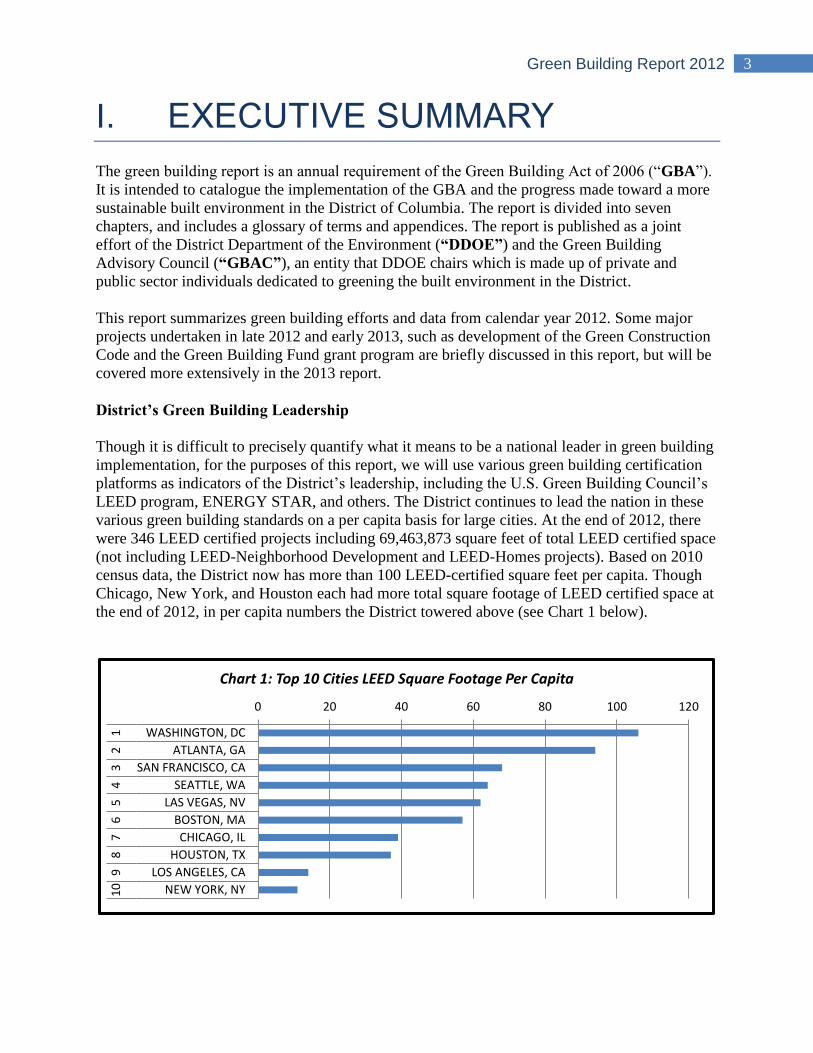
The District‘s growth in green building deployment continues at a rapid pace. As referenced in
the Green Building Report for the District of Columbia, 2007 through 2011, at the close of 2011
there was a total of 236 LEED certified projects representing 43,882,134 square feet of space.
The 346 tally at the close of 2012 represents a growth of 110 projects and 25,581,739 square feet
in one year alone (see Chart 2 below)—a heartening pace for those that care about the efficiency,
cost-savings, and health benefits provided by high-performance buildings.
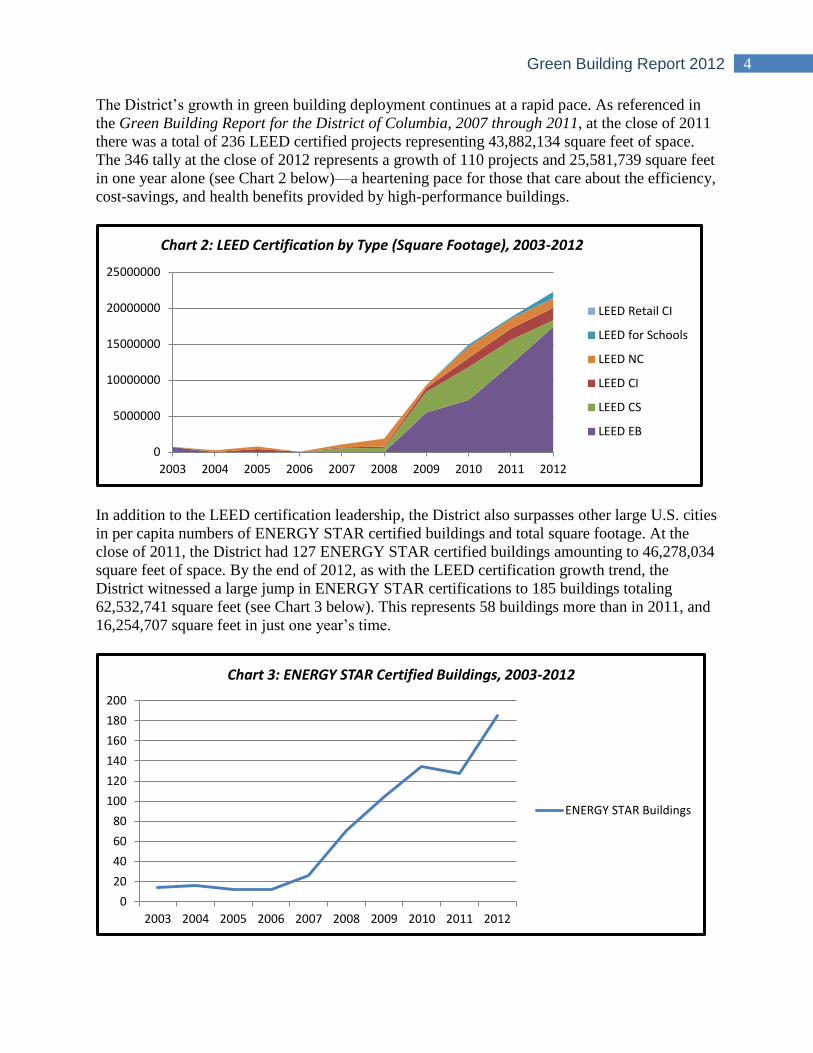
In addition to the LEED certification leadership, the District also surpasses other large U.S. cities
in per capita numbers of ENERGY STAR certified buildings and total square footage. At the
close of 2011, the District had 127 ENERGY STAR certified buildings amounting to 46,278,034
square feet of space. By the end of 2012, as with the LEED certification growth trend, the
District witnessed a large jump in ENERGY STAR certifications to 185 buildings totaling
62,532,741 square feet (see Chart 3 below). This represents 58 buildings more than in 2011, and
16,254,707 square feet in just one year‘s time.
0
5000000
10000000
15000000
20000000
25000000
2003 2004 2005 2006 2007 2008 2009 2010 2011 2012
Chart 2: LEED Certification by Type (Square Footage), 2003-2012
LEED Retail CI
LEED for Schools
LEED NC
LEED CI
LEED CS
LEED EB
0
20
40
60
80
100
120
140
160
180
200
2003 2004 2005 2006 2007 2008 2009 2010 2011 2012
Chart 3: ENERGY STAR Certified Buildings, 2003-2012
ENERGY STAR Buildings
5 Green Building Report 2012
The leadership in greening the built environment also continues beyond LEED and ENERGY
STAR. The District is consistently in the top three and often in first place among cities in total
green power purchasing, city government green power purchasing, green roof installations, urban
parkland space, public transit ridership, bike share ridership, and other sustainability metrics.
Benchmarking
In 2008, the District became the first jurisdiction in the United States to adopt a law requiring the
disclosure of public and privately owned buildings‘ energy performance. Similar laws have now
been adopted by eight other cities. In 2012, DDOE completed regulations to implement the
energy benchmarking program, with the first reporting deadline being set for April 1, 2013. As
of November 8, 2013, 83% of all covered buildings 100,000 square feet and larger had complied.
Summary results of the benchmarking data comprise the bulk of Chapter IV of this report.
Buildings in the District reporting benchmarking data are on average very energy-efficient, with
the median building scoring a 77 on the 1-100 ENERGY STAR scale. The results also show that
from 2010-2012, Department of General Services (“DGS”) buildings reduced energy use by 7%,
and the private buildings that reported data for all three years reduced energy use by 6%. The
report also makes a number of recommendations for future improvements.
Green Construction Codes
The GBA requires that the District‘s construction codes ―incorporate as many green building
practices as practicable,‖ and specifically identifies the need to continually improve the energy
code. As a result, the District is establishing itself as a leader in the arena of green codes
development. In 2008, the District adopted the ―30 Percent Solution‖ for improved performance
of residential buildings, including provisions that required commercial buildings to perform 7%
more energy efficiently than those of surrounding jurisdictions, and other important water
efficiency and stormwater management measures.
In March of 2012, the Construction Codes Coordinating Board (“CCCB”) and its Green
Technical Advisory Group began the process of adapting the 2012 International Green
Construction Code (“IgCC”) and 2012 International Energy Conservation Code for use in the
District. The initial drafts of the Green Construction and Energy Conservation Code amendments
were issued in 2012 for a first round of public comments. In calendar year 2012, the Department
of Consumer and Regulatory Affairs (“DCRA”), DDOE and private sector leaders gave more
than 25 presentations on the proposed green code. DCRA also began training for its staff on the
new code to help insure a more seamless transition when the codes are finalized.
The CCCB completed its work in November 2013 following extensive public engagement, and
submitted the codes to the Mayor and DC Council for their consideration and vote. The District
will be one of the first cities, if not the first, to adopt all of the chapters and Appendix A of the
IgCC, which will lead to one of the greenest construction codes in the country. The ultimate goal
of greening the codes is to make high performance construction more mainstream—and to
eventually get to the point where we don‘t have to call it ―green‖ anymore. When we achieve this
goal, one milestone of the District‘s green building leadership will be achieved.
6 Green Building Report 2012
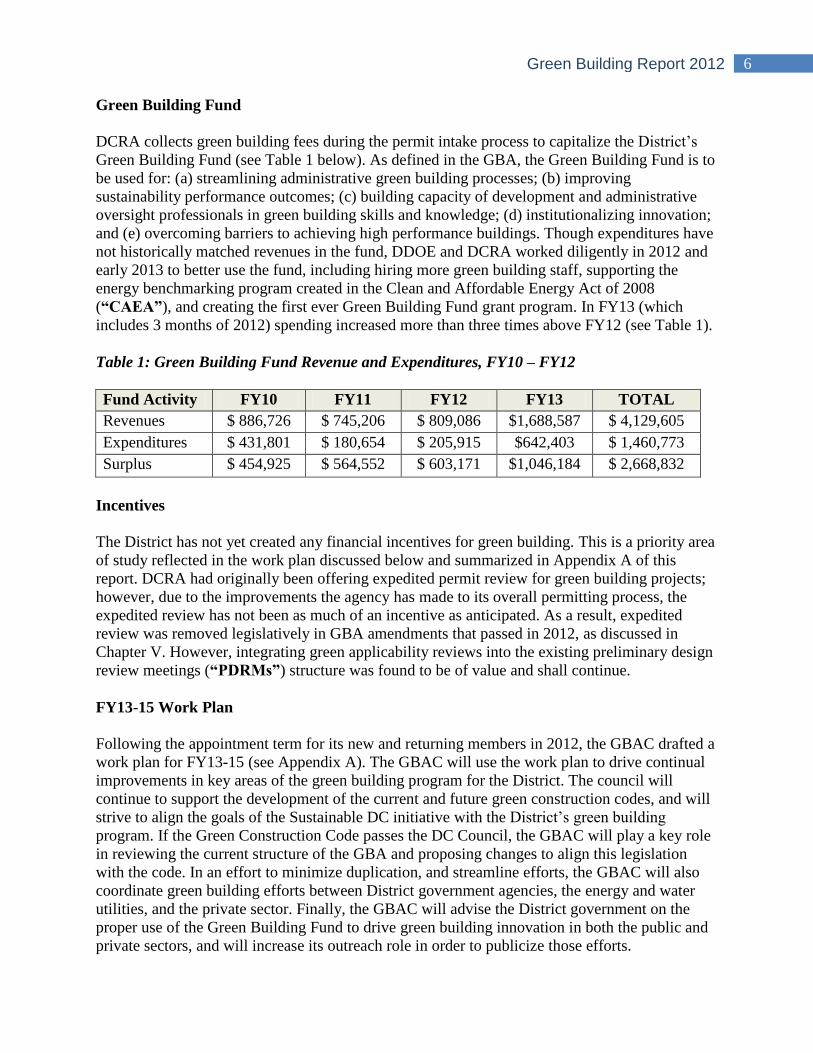
Green Building Fund
DCRA collects green building fees during the permit intake process to capitalize the District‘s
Green Building Fund (see Table 1 below). As defined in the GBA, the Green Building Fund is to
be used for: (a) streamlining administrative green building processes; (b) improving
sustainability performance outcomes; (c) building capacity of development and administrative
oversight professionals in green building skills and knowledge; (d) institutionalizing innovation;
and (e) overcoming barriers to achieving high performance buildings. Though expenditures have
not historically matched revenues in the fund, DDOE and DCRA worked diligently in 2012 and
early 2013 to better use the fund, including hiring more green building staff, supporting the
energy benchmarking program created in the Clean and Affordable Energy Act of 2008
(“CAEA”), and creating the first ever Green Building Fund grant program. In FY13 (which
includes 3 months of 2012) spending increased more than three times above FY12 (see Table 1).
Table 1: Green Building Fund Revenue and Expenditures, FY10 – FY12
Fund Activity FY10 FY11 FY12 FY13 TOTAL
Revenues $ 886,726 $ 745,206 $ 809,086 $1,688,587 $ 4,129,605
Expenditures $ 431,801 $ 180,654 $ 205,915 $642,403 $ 1,460,773
Surplus $ 454,925 $ 564,552 $ 603,171 $1,046,184 $ 2,668,832
Incentives
The District has not yet created any financial incentives for green building. This is a priority area
of study reflected in the work plan discussed below and summarized in Appendix A of this
report. DCRA had originally been offering expedited permit review for green building projects;
however, due to the improvements the agency has made to its overall permitting process, the
expedited review has not been as much of an incentive as anticipated. As a result, expedited
review was removed legislatively in GBA amendments that passed in 2012, as discussed in
Chapter V. However, integrating green applicability reviews into the existing preliminary design
review meetings (“PDRMs”) structure was found to be of value and shall continue.
FY13-15 Work Plan
Following the appointment term for its new and returning members in 2012, the GBAC drafted a
work plan for FY13-15 (see Appendix A). The GBAC will use the work plan to drive continual
improvements in key areas of the green building program for the District. The council will
continue to support the development of the current and future green construction codes, and will
strive to align the goals of the Sustainable DC initiative with the District‘s green building
program. If the Green Construction Code passes the DC Council, the GBAC will play a key role
in reviewing the current structure of the GBA and proposing changes to align this legislation
with the code. In an effort to minimize duplication, and streamline efforts, the GBAC will also
coordinate green building efforts between District government agencies, the energy and water
utilities, and the private sector. Finally, the GBAC will advise the District government on the
proper use of the Green Building Fund to drive green building innovation in both the public and
private sectors, and will increase its outreach role in order to publicize those efforts.
7 Green Building Report 2012
II. INTRODUCTION
A. Report Intent
This report, the second in a series published by the government of the District of Columbia,
documents the District‘s progress towards a ―greener‖ and more sustainable building stock. For
those seeking additional information and earlier data, please refer to the Green Building Report
for the District of Columbia, 2007 through 2011, which can be found on the DDOE website at
www.ddoe.dc.gov/greenbuildings. The 2007-2011 report explains the history of the legislative
framework and requirements for green building in the District and the roles and responsibilities
of various District agencies and the GBAC, therefore that information will not be repeated here.
B. Sustainability in the District of Columbia
In July 2011, Mayor Gray announced his intention to make the District the healthiest, greenest
and most livable city in the United States. Since that time, staff members at DDOE, the Office of
Planning, and other agencies have been working diligently to create and begin implementation of
the Sustainable DC Plan. The original vision for the plan was published in April of 2012 and the
final implementation plan was released in February of 2013. There are seven solution sections in
the plan related to the built environment, energy, food, nature, transportation, waste and water
that are intended to address four challenges that the District faces for jobs and the economy,
health and wellness, equity and diversity, and climate and the environment.
The development of the Sustainable DC Plan included more than 200 meetings, with more than
5,000 involved citizens. Within the plan there are 32 goals, 31 targets, and 143 action items—
many of which are related to issues in and solutions from the building sector. For building
related goals, the plan calls for 50% reductions in greenhouse gas emissions and energy
consumption city-wide, an increase in the use of renewable energy to total 50% of the District‘s
load, and the construction of net-zero energy projects for new construction, among many others.
More detailed information can be found at www.sustainabledc.org.
The greening of buildings will play a crucial role in the execution of the Mayor‘s Sustainable DC
Plan. Simply put, without an aggressive green building program, the plan is unlikely to succeed.
Therefore, it is the goal of the GBAC and the District‘s green building program to integrate our
efforts with the goals and actions in the Sustainable DC Plan.
Unique Built Environment Characteristics
The District of Columbia has some unique land and building characteristics that provide
challenges, as well as opportunities, for achieving the goals in the Sustainable DC Plan.

8 Green Building Report 2012
Challenges
Building height limit: The District has a federally regulated building height limit, which
may limit the District‘s ability to provide bonus density incentives for green building.
Lot-line to lot-line development: In many parts of the District, and particularly in the
Central Business District (―CBD‖), lot-line to lot-line development is standard, which
can limit green building solutions that could otherwise be accommodated within setbacks.
Stormwater responsibilities: There are two different agencies responsible for regulating
stormwater (DDOE and DC Water) with different goals and fee requirements.
Water table: The portions of the District that have a shallow water table have high
dewatering and related cost-considerations.
Challenges for renewables: The District‘s solar insolation provides some good
opportunities for solar energy solutions, but not all sites are able to generate enough of
any one renewable energy source to depend on it as a single primary power source. There
is generally not enough wind velocity in the city to make wind energy development
within the city limits financially viable; however, the District leads cities in the U.S. in
off-site green power purchasing. There is some potential for biomass generation, though
air quality concerns also need to be taken into account.
Ground-source heat pumps: There is great potential for ground source heat pump
deployment in the District, but because of land cost and density the wells generally must
be vertically excavated, which adds expense. Also open-loop wells, which can sometimes
be less expensive than closed-loop, are not permitted due to water quality concerns.
Historically-protected public space: The street network (roads and sidewalks) covers
more than 26% of the District‘s land surface area.1 This represents significant impervious
surface area, and while not a direct ―green building‖ concern, the public right-of-way is
part of the built environment and green infrastructure solutions should be seriously
considered in the right-of-way for long-term sustainability. Also, there are limitations in
the city for the use of the right-of-way for treating building related stormwater runoff.
(For the relative scale of impervious surface impacts, buildings account for
approximately 20% of the city‘s impervious area).
Federal government land ownership: The District has minimal influence on federal
government construction projects, though there are certain regulations with which the
feds have to comply. Federal ownership of park land in the District has many great
benefits, but creates impediments for the District government or the private sector to use
the federal land for certain environmental strategies, such as creating bioretention in
public space to filter stormwater for roads and other impervious surfaces.
1 District Department of Transportation estimates, 2009.
9 Green Building Report 2012
Opportunities
Permanently protected green space: 19.4% of the District is park or open space,
contributing to the current 35% urban tree canopy. Compared to some other cities, the
nearly 20% of open space is a high number.
Uniform roofline: Similar building heights and the predominance of flat roofs provide a
good platform for cool roofs, green roofs and solar energy installations, so stormwater
and solar access concerns may more easily be solved in the District than in other cities.
Federal occupancy: The federal government owns 23% of land in the District, which has
some potential to limit off-site green building solutions, but also creates opportunities for
rapid market transformation due to federal adoption of green building priorities.
Development of large sites: Development areas, such as the Anacostia waterfront, Walter
Reed Army Medical Center, MacMillan Reservoir, and others, could become significant
opportunities to move toward aspirational zero waste, net-zero water, net-zero energy,
and/or micro-grid/off-the-grid utility solutions.
Finally, the District has 55 historic districts and hundreds of buildings with historic designation,
which may equally represent challenges as well as provide opportunities.
Environmental Policies & Framework
In addition to the GBA requirements and zoning, land use, and historic preservation
considerations, the District is also subject to and maintains a variety of environmental regulations
and policies that influence the built environment, such as:
The Municipal Separate Storm Sewer System (―MS4‖) Permit2 issued by the EPA to
the District of Columbia, which requires a 1.2‖ stormwater retention standard for new
construction of a certain size; and,
A proposed citywide Climate Action Plan,3 which aims to achieve 30% greenhouse gas
emissions (―GHG‖) reductions by 2020 and 80% greenhouse gas emissions reductions
by 2050. The Sustainable DC Plan added another mid-term goal of 50% GHG
reductions by 2032. Given that 74% of the District‘s greenhouse gas emissions are
directly attributable to energy use in buildings, the climate change targets reveal the
need for building owners to reduce their use of greenhouse gas-emitting fuels by
adopting significant energy efficiency measures in combination with purchases or
generation of clean energy.
2―District of Columbia Municipal Separate Storm Sewer System National Pollutant Discharge Elimination System
Final Permit,‖ dated October 7, 2011, http://www.epa.gov/reg3wapd/npdes/dcpermits.htm. 3―Climate of Opportunity: A Climate Action Plan for the District of Columbia, Draft September 2010,‖
http://ddoe.dc.gov/service/climate-opportunity-reducing-greenhouse-gas-emissions.
10 Green Building Report 2012
An on-going environmental priority for the District is the restoration and protection of the Rock
Creek, Potomac River, and Anacostia River watersheds. The conditions of the District‘s
waterways are attributable in large part to historically poor industrial practices and the effects of
stormwater runoff, which left a legacy of land and water contamination. The residual impacts on
developers, the city, and neighboring residents is substantial and highlights the role that green
building practices may have in restoring these natural resources.
Green Building Policies & Platforms
The three green building certification programs that are mandated for some projects in the
District are: (1) the U.S. Green Building Council‘s (―USGBC‖) LEED program; (2)
Environmental Protection Agency‘s (―EPA‖) ENERGY STAR Target Finder and Portfolio
Manager energy modeling and benchmarking tools, and (3) Enterprise‘s Green Communities
Criteria (―EGC‖). At the time of the drafting of this report, the District was also considering the
adoption of the International Green Construction Code.
Leadership in Energy and Environmental Design
LEED is a green building certification program created by the USGBC, but administered by the
Green Building Certification Institute (―GBCI‖), a not-for-profit organization that provides
independent oversight of professional credentialing and project certification programs related to
green building.4 To receive certification, a project applies to a specific (or multiple) program(s),
such as LEED-New Construction, LEED-Existing Buildings, LEED-Core and Shell, LEED-
Homes, LEED-Schools, LEED-Commercial Interiors and others.
There are criticisms of the LEED certification system, and issues for governments that mandate
LEED green building certification requirements. These concerns and questions include:
The dependence on a third-party organization, over which the government has no
oversight, to set the District‘s green building standards
The perception that application costs associated with LEED are significant
Despite these critiques, LEED is the recognized national standard for green building certification
and the District will utilize this standard for certain requirements until an alternative solution is
approved. The planned adoption of the new Green Construction Code in 2014 will create a
localized alternative that will allow the District to control its green building standards more
easily in the future. If the Green Construction Code is adopted, at some point the District may
consider transitioning away from the LEED requirement for private sector commercial buildings
that is found in the GBA, but that decision has not yet been made.
4 For more information about GBCI, go to www.gbci.org.
11 Green Building Report 2012
ENERGY STAR
EPA‘s ENERGY STAR Target Finder tool is an energy-modeling tool for new construction that
enables a design team to model and plan future energy performance. Portfolio Manager, the
EPA‘s online energy benchmarking program, is a widely accepted tool that enables building
owners to track energy and water use in their buildings and compare a building‘s performance
against similar buildings nationwide. Portfolio Manager is used for more than 300,000 buildings
throughout the country as the industry-standard tool to track and evaluate energy and water
consumption, develop energy management goals over time, and identify strategic opportunities
for cost savings. Additionally, LEED references Portfolio Manager as the measurement tool to
verify energy performance under the LEED-Existing Buildings Operations and Maintenance
standard. The GBA and its amendment, the CAEA, have various requirements for the use of
EPA‘s Target Finder and Portfolio Manager.
Enterprise Green Communities Criteria
Enterprise Green Communities is a green building rating system that was developed by
Enterprise Community Partners, with the mission to ―fundamentally transform the way we think
about, design and build affordable homes.‖5 It is a certification program for affordable housing
development (new construction and renovation), and the District has identified EGC as the
standard for GBA compliance for publicly-funded residential projects. The intent for requiring
EGC instead of LEED for residential projects under the GBA is to insure a reasonable level of
environmental, health and economic performance without the burden of the fees associated with
LEED certification.
International Green Construction Code
In addition to a rigorous update to the energy code, the District began the adoption process of the
IgCC in 2012. The three certification programs discussed above serve as aspirational standards,
but the new green code, if passed by the DC Council, will serve as a minimum green building
standard for all commercial projects in the District that are 10,000 square feet and larger, and all
multi-family residential projects that are both 10,000 square feet and larger and four stories or
higher. If adopted, we will have a baseline of what it means to build green in the District, which
will be the first step towards standardizing green construction. Though projects built under the
new code and under the aforementioned certification programs will achieve high levels of
environmental performance, generally speaking those projects will not achieve true
―sustainability.‖ For the next evolution in green building towards buildings that have zero, or
potentially even a positive, impact on the environment, the District may have to consider the
development of an incentive program, at least in the short term.
5 For more information on Enterprise Green Communities Criteria, go to www.greencommunitiesonline.org.
12 Green Building Report 2012
III. Green Building Report
A. Green Building Market Overview
As mentioned in the executive summary, it is difficult to draw a direct connection between the
deployment of various building certification programs, and how ―green‖ a city is. There are
many more elements of the environmental performance of buildings within a city than those that
are covered in the LEED, ENERGY STAR, or EGC programs. However, looking at the
numbers, and particular the growth over time, of buildings certified using the various platforms
remains at least one valid indicator for analyzing the District‘s built environment.
LEED Projects
Washington, DC, is one of the nation‘s most active cities for green building, measured by the
number and square footage of LEED certified buildings, levels of LEED certification attained,
number and square footage of ENERGY STAR certifications, and number of EGC buildings. At
the close of 2012, the USGBC reported 346 LEED certified projects (excluding LEED-Homes
and LEED-Neighborhood Design) representing 69,463,873 square feet of space. More than 700
additional projects have been registered representing well over 100 million additional square feet
of projects that could become certified.6 (See Appendix C: LEED Certifications, 2012).
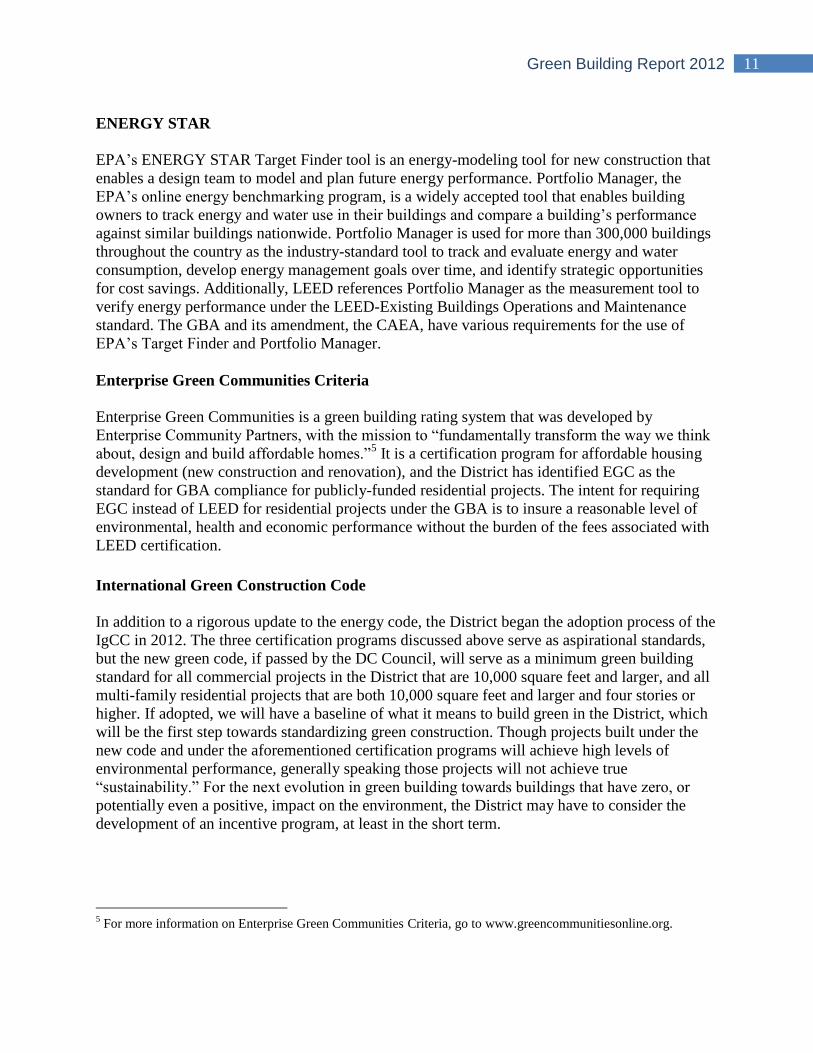
Not only was there a significant increase of certifications in 2012, the proportion of LEED-Gold
and Platinum certifications also increased relative to the number of LEED-Certified and LEED-
Silver projects, resulting in 68.4% of the District‘s LEED projects being certified at the Gold or
Platinum levels (see Chart 4 below).
6 For an up-to-date listing of LEED projects in the District, visit: http://www.gbig.org/places/2015
Platinum, 12.1
Gold, 56.3
Silver, 25.6
Certified, 6
Chart 4: Percentage of LEED Certifications by Type, 2012
Platinum
Gold
Silver
Certified
13 Green Building Report 2012
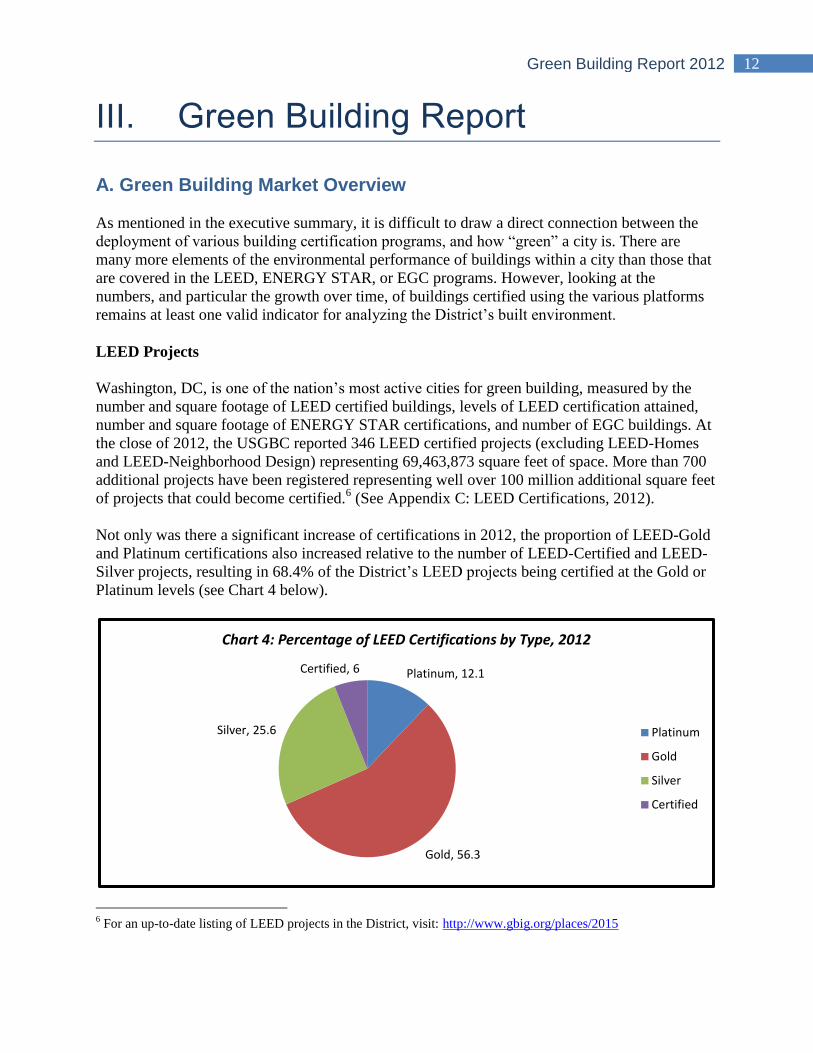
By comparison, from 2006-2011, 60% of the District‘s LEED buildings were Gold or Platinum,
and the national average for Gold and Platinum certifications during that time period was 45%
relative to all LEED certifications (see Chart 5 below). The District is therefore seeing both an
increase in the total number of green buildings, but also an increase in the percentage of higher
performing green building—an excellent trend for those who care about the environmental
benefits of these types of projects.
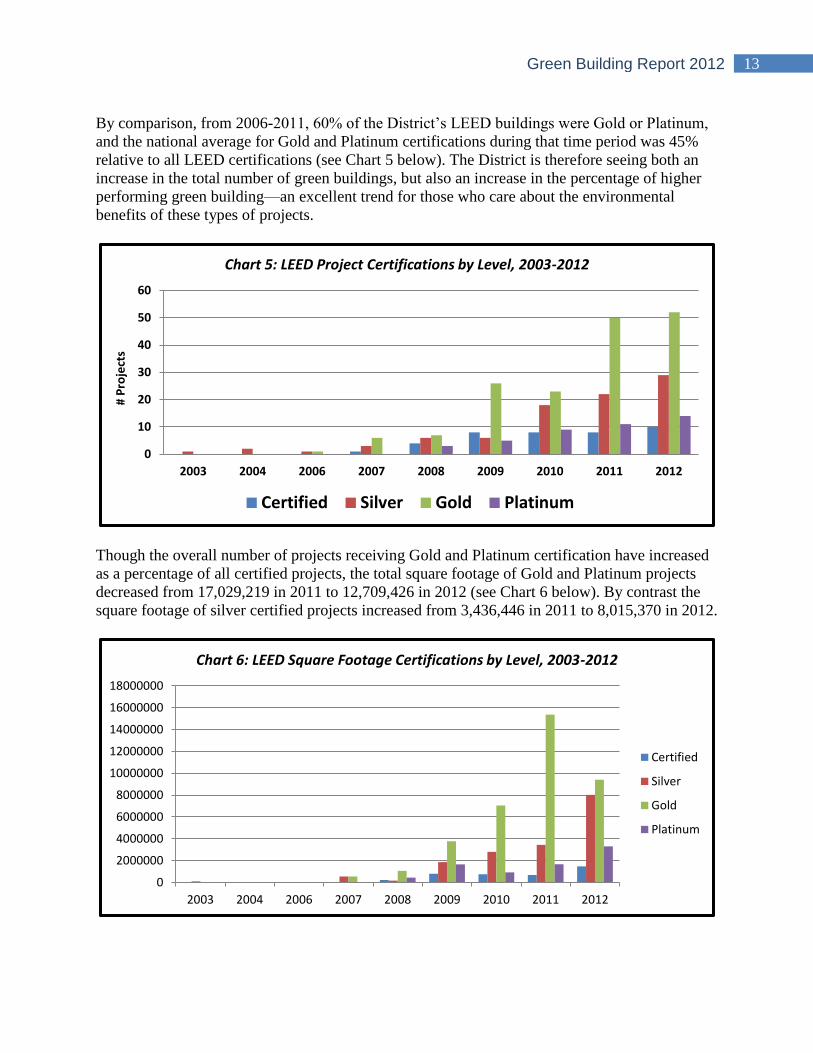
Though the overall number of projects receiving Gold and Platinum certification have increased
as a percentage of all certified projects, the total square footage of Gold and Platinum projects
decreased from 17,029,219 in 2011 to 12,709,426 in 2012 (see Chart 6 below). By contrast the
square footage of silver certified projects increased from 3,436,446 in 2011 to 8,015,370 in 2012.
0
10
20
30
40
50
60
2003 2004 2006 2007 2008 2009 2010 2011 2012
# P
roje
cts
Chart 5: LEED Project Certifications by Level, 2003-2012
Certified Silver Gold Platinum
0
2000000
4000000
6000000
8000000
10000000
12000000
14000000
16000000
18000000
2003 2004 2006 2007 2008 2009 2010 2011 2012
Chart 6: LEED Square Footage Certifications by Level, 2003-2012
Certified
Silver
Gold
Platinum
14 Green Building Report 2012
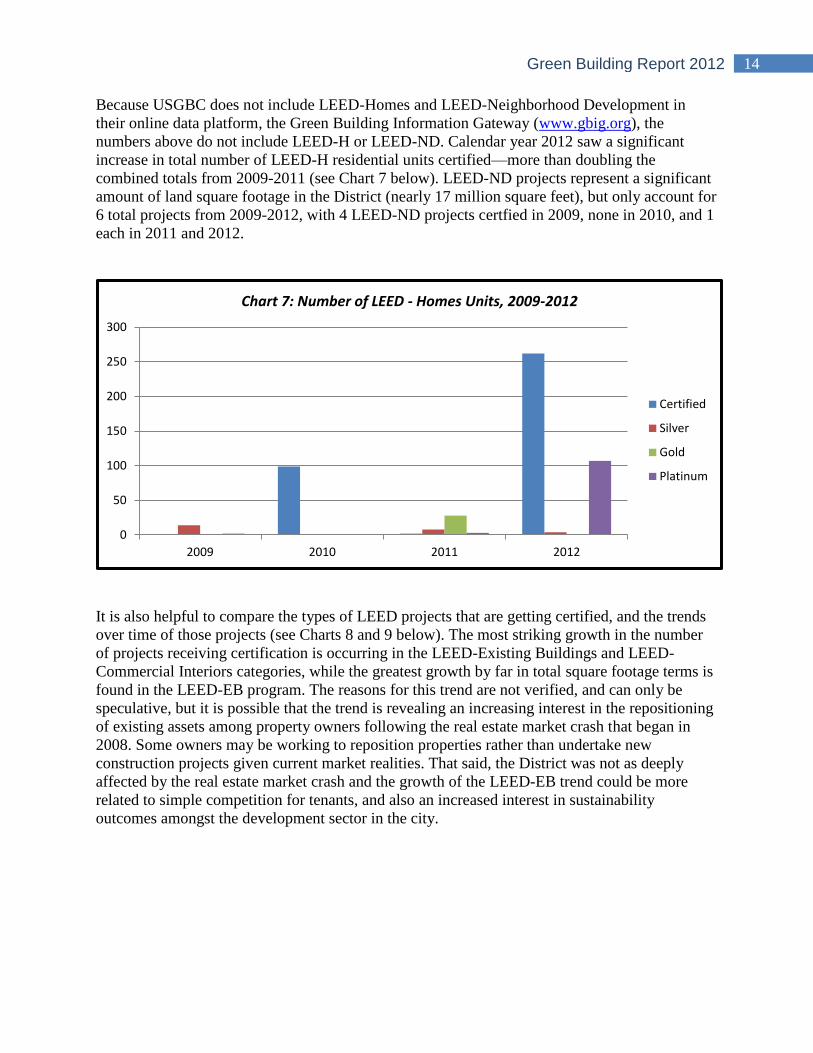
Because USGBC does not include LEED-Homes and LEED-Neighborhood Development in
their online data platform, the Green Building Information Gateway (www.gbig.org), the
numbers above do not include LEED-H or LEED-ND. Calendar year 2012 saw a significant
increase in total number of LEED-H residential units certified—more than doubling the
combined totals from 2009-2011 (see Chart 7 below). LEED-ND projects represent a significant
amount of land square footage in the District (nearly 17 million square feet), but only account for
6 total projects from 2009-2012, with 4 LEED-ND projects certfied in 2009, none in 2010, and 1
each in 2011 and 2012.
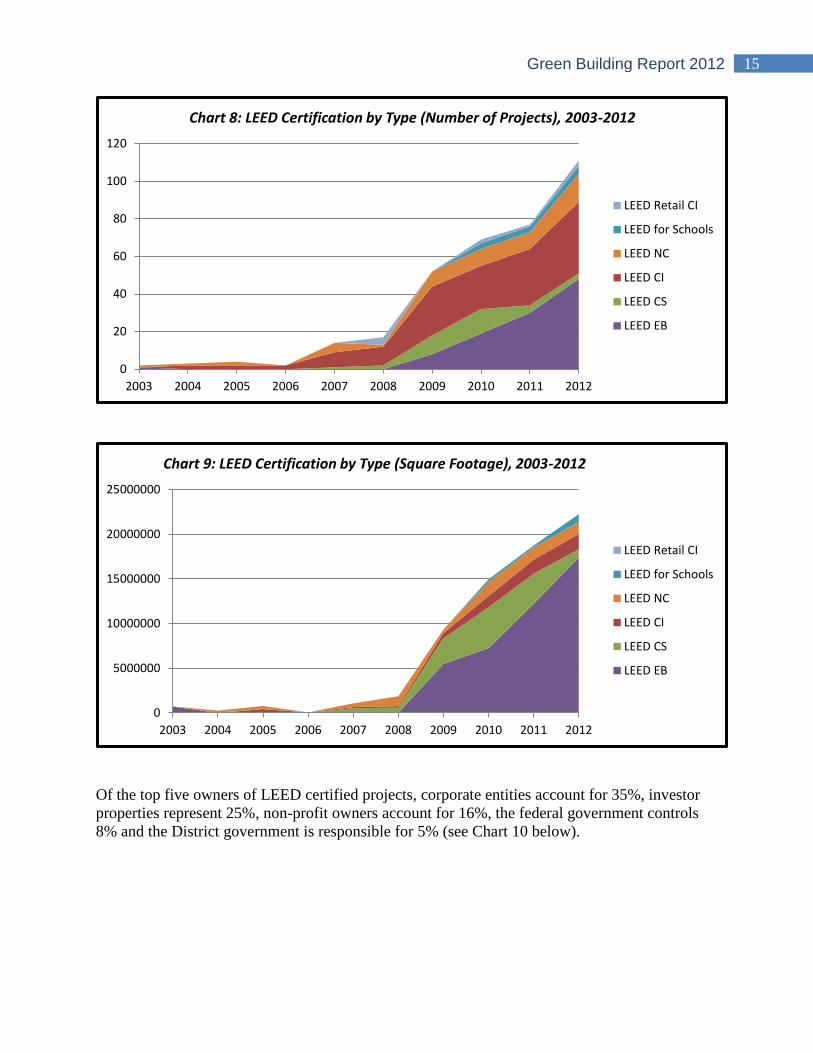
It is also helpful to compare the types of LEED projects that are getting certified, and the trends
over time of those projects (see Charts 8 and 9 below). The most striking growth in the number
of projects receiving certification is occurring in the LEED-Existing Buildings and LEED-
Commercial Interiors categories, while the greatest growth by far in total square footage terms is
found in the LEED-EB program. The reasons for this trend are not verified, and can only be
speculative, but it is possible that the trend is revealing an increasing interest in the repositioning
of existing assets among property owners following the real estate market crash that began in
2008. Some owners may be working to reposition properties rather than undertake new
construction projects given current market realities. That said, the District was not as deeply
affected by the real estate market crash and the growth of the LEED-EB trend could be more
related to simple competition for tenants, and also an increased interest in sustainability
outcomes amongst the development sector in the city.
0
50
100
150
200
250
300
2009 2010 2011 2012
Chart 7: Number of LEED - Homes Units, 2009-2012
Certified
Silver
Gold
Platinum
15 Green Building Report 2012
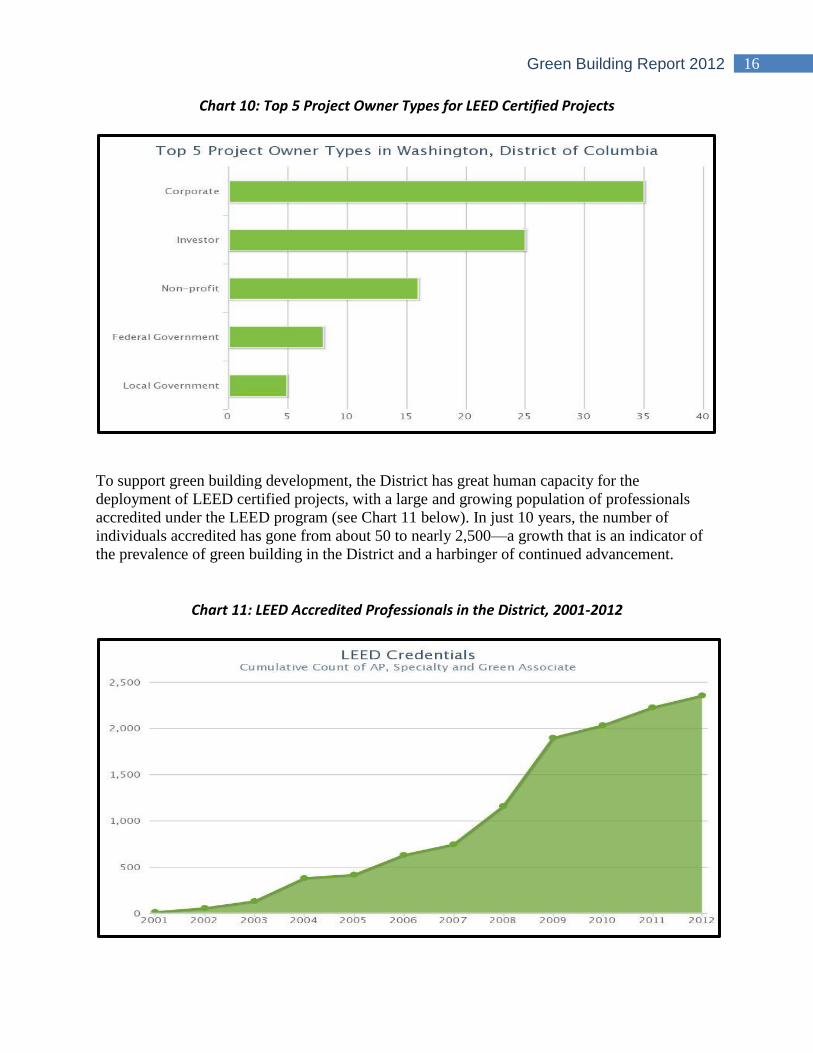
Of the top five owners of LEED certified projects, corporate entities account for 35%, investor
properties represent 25%, non-profit owners account for 16%, the federal government controls
8% and the District government is responsible for 5% (see Chart 10 below).
0
20
40
60
80
100
120
2003 2004 2005 2006 2007 2008 2009 2010 2011 2012
Chart 8: LEED Certification by Type (Number of Projects), 2003-2012
LEED Retail CI
LEED for Schools
LEED NC
LEED CI
LEED CS
LEED EB
0
5000000
10000000
15000000
20000000
25000000
2003 2004 2005 2006 2007 2008 2009 2010 2011 2012
Chart 9: LEED Certification by Type (Square Footage), 2003-2012
LEED Retail CI
LEED for Schools
LEED NC
LEED CI
LEED CS
LEED EB
16 Green Building Report 2012
Chart 10: Top 5 Project Owner Types for LEED Certified Projects
To support green building development, the District has great human capacity for the
deployment of LEED certified projects, with a large and growing population of professionals
accredited under the LEED program (see Chart 11 below). In just 10 years, the number of
individuals accredited has gone from about 50 to nearly 2,500—a growth that is an indicator of
the prevalence of green building in the District and a harbinger of continued advancement.
Chart 11: LEED Accredited Professionals in the District, 2001-2012
17 Green Building Report 2012
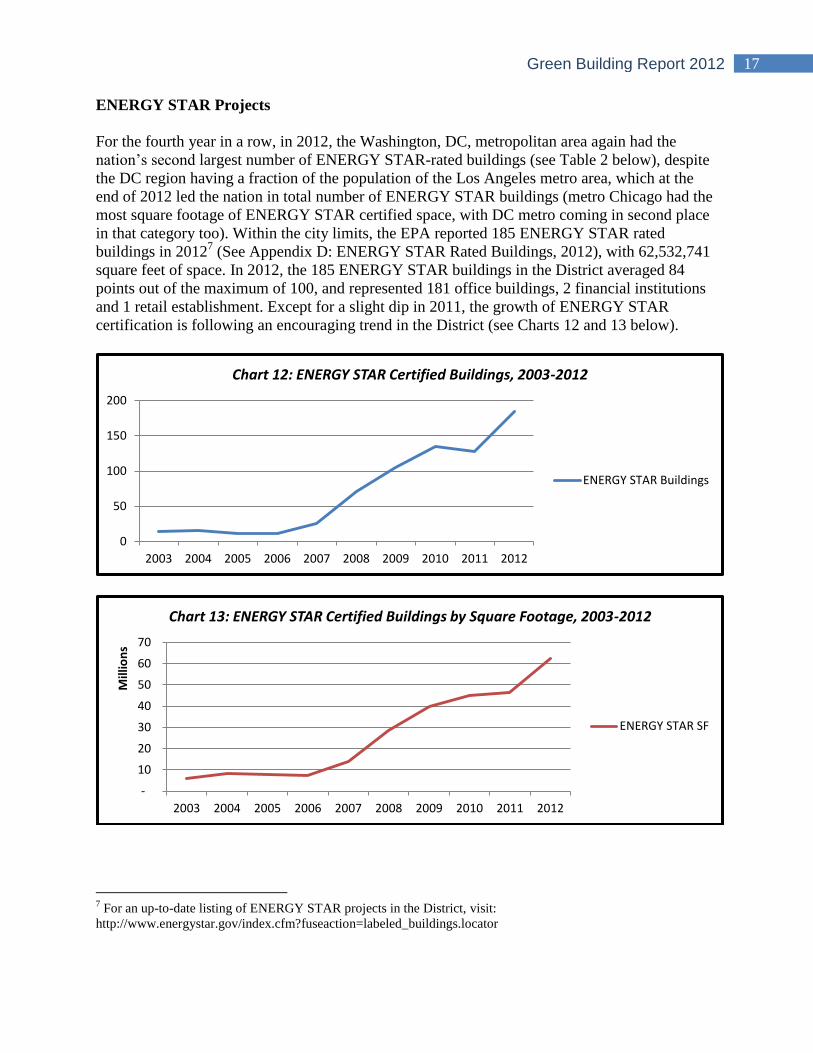
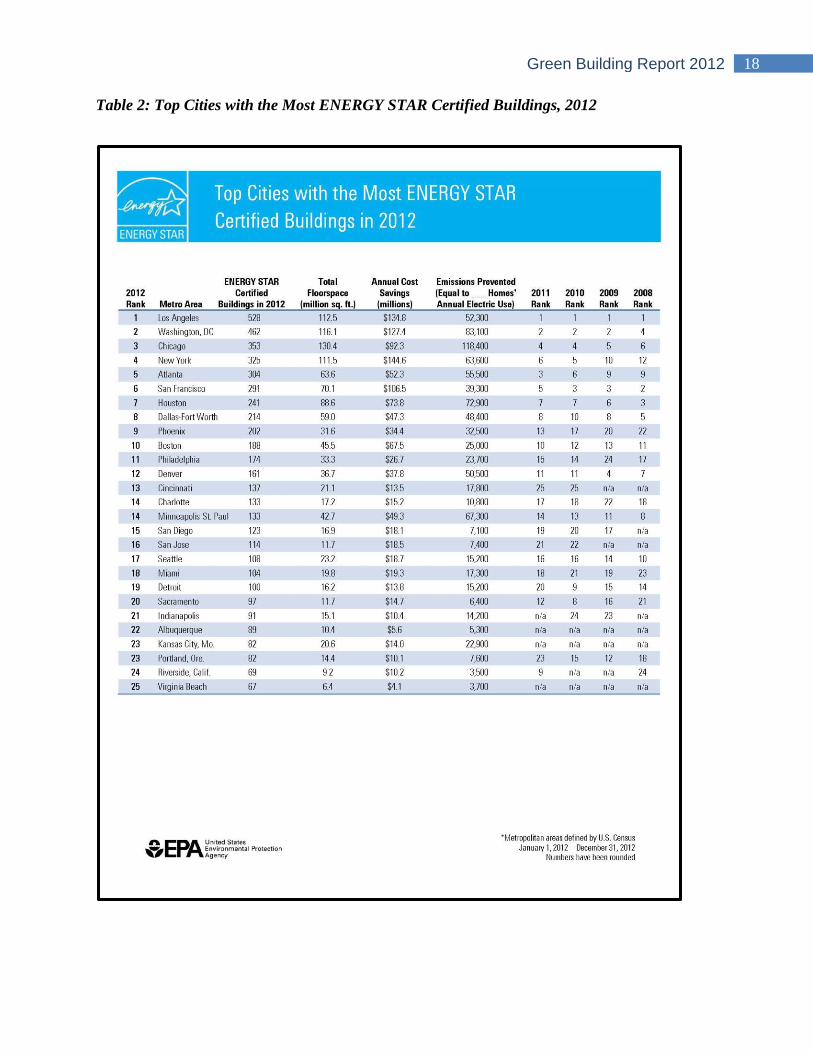
ENERGY STAR Projects
For the fourth year in a row, in 2012, the Washington, DC, metropolitan area again had the
nation‘s second largest number of ENERGY STAR-rated buildings (see Table 2 below), despite
the DC region having a fraction of the population of the Los Angeles metro area, which at the
end of 2012 led the nation in total number of ENERGY STAR buildings (metro Chicago had the
most square footage of ENERGY STAR certified space, with DC metro coming in second place
in that category too). Within the city limits, the EPA reported 185 ENERGY STAR rated
buildings in 20127 (See Appendix D: ENERGY STAR Rated Buildings, 2012), with 62,532,741
square feet of space. In 2012, the 185 ENERGY STAR buildings in the District averaged 84
points out of the maximum of 100, and represented 181 office buildings, 2 financial institutions
and 1 retail establishment. Except for a slight dip in 2011, the growth of ENERGY STAR
certification is following an encouraging trend in the District (see Charts 12 and 13 below).
7 For an up-to-date listing of ENERGY STAR projects in the District, visit:
http://www.energystar.gov/index.cfm?fuseaction=labeled_buildings.locator
0
50
100
150
200
2003 2004 2005 2006 2007 2008 2009 2010 2011 2012
Chart 12: ENERGY STAR Certified Buildings, 2003-2012
ENERGY STAR Buildings
-
10
20
30
40
50
60
70
2003 2004 2005 2006 2007 2008 2009 2010 2011 2012
Mill
ion
s
Chart 13: ENERGY STAR Certified Buildings by Square Footage, 2003-2012
ENERGY STAR SF
18 Green Building Report 2012
Table 2: Top Cities with the Most ENERGY STAR Certified Buildings, 2012
19 Green Building Report 2012
Green Communities Projects
Only one additional Enterprise Green Communities project was certified in 2012—and since the
passage of the Green Building Act in 2006, there are now a total of 10 projects certified under
the EGC program. According to Enterprise staff, there are an additional 10 projects that have
been approved for step one of the certification program and are waiting on the project
completion and verification process. Early in 2013, Mayor Gray announced his intention to
significantly increase the amount of money that the District dedicates to affordable housing
development, which will likely lead to an increase in the number of EGC certified projects.
B. Public Sector Report
The GBA contains green building requirements for public- and publicly-financed construction
projects. The Act requires all public, and publicly-financed (with 15% or more of project costs
coming from District sources), new construction and substantial improvement commercial
projects to meet the LEED standard at the Silver level. Residential new construction and
substantial improvement projects 10,000 square feet and larger are required to meet the
Enterprise Green Communities standard.
Summary of Public Sector Implementation
The District‘s agencies continue to make tremendous gains in the area of green building—both
with respect to LEED certification, and also with other new innovative green building initiatives.
In 2012, the District‘s Department of General Services continued to seek to ‗lead by example‘
with its new construction efforts and, when possible, exceed the GBA mandated LEED-Silver
certification requirement. In total, 7 of 10 LEED projects were certified Gold, and DGS achieved
its first Platinum certification with the 331,789 square foot construction of 200 I Street, SE (see
Appendix E for a list of projects).
DGS also pursued other innovative new green building projects in 2012. Two highlights:
DGS completed its first ever power purchase agreement (“PPA”) for a 500kW solar
array at Dunbar High School. This precedent-setting agreement, which leverages third-
party capital and does not impact the District‘s debt capacity, will allow the District to
achieve significant scale with onsite solar over the next several years.
Through a partnership with the local utility (Pepco), the District now receives near real-
time electricity consumption data in 15-minute intervals for the majority of its facilities.
This information, made transparent through the District‘s BuildSmartDC.com website, is
a central component of DGS‘s landmark ‗Game Change‘ initiative to reduce energy
consumption by 20% in government facilities.
Though the majority of this report focuses on calendar year 2012, for the projects supported by
the Department of Housing and Community Development (“DHCD”), the report uses fiscal year
2013 data because the elements tracked in the agency‘s key performance indicators report in
20 Green Building Report 2012
FY13 more closely aligned with the report‘s goals. In fiscal year 2013 (October 1, 2012-
September 30, 2013), DHCD supported the creation of 375 new affordable housing units and the
rehabilitation of 482 units. Out of those projects, a total of 230 special needs housing units (for
the elderly, disabled and homeless populations) and 24 new homeownership units were funded.
In total, the agency created 3.8 units per $100,000 of financial assistance. All of the units that
were developed under the requirements of the GBA were built to the Enterprise Green
Communities standard.
Exemptions
The GBA allows exemptions to be made, provided that a project demonstrates ―substantial
evidence of practical infeasibility or hardship‖ as a result of the law. There were no official
exemptions awarded by DDOE in calendar year 2012.
C. Private Sector Report
The GBA requirements for private projects were phased in over time. The first mandate took
effect January 2009, which applied to non-residential projects larger than 50,000 square feet. As
required by Section 4 of the GBA, these projects were required to submit a non-binding green
building checklist (the ―Green Building Intake Form‖ or ―Checklist‖) with their building
permit applications. The purpose of the Checklist was to increase developer awareness of green
building strategies. There is currently no information available on the number of Green Building
Intake Forms completed, or total number of projects larger than 50,000 square feet that applied
for building permits; however, DCRA is updating their tracking system to gather this information
in the future.
The second mandate of the GBA became effective January 1, 2012, and all private projects
50,000 square feet and larger permitted since that date are now required to attain LEED
certification. There has been significant discussion about how the District, specifically DCRA,
will manage private sector compliance with the GBA, as well as the financial security required
by the GBA. But the development of DCRA‘s green building program and the publication of
regulations have been completed, which will help the agency ensure compliance with the GBA.
With an eye towards improving data tracking and analysis, in early 2013 DCRA began updating
the "green building" section of its online permit application to track buildings being built to the
proposed Green Construction Code or one the alternative pathways to the code. During the
update process, DCRA is taking the opportunity to improve the tracking of public and private
buildings being built to the requirements of the GBA. In addition to updating the online permit
application, DCRA is adding additional checks and balances to the standard operating procedure
of the building permit intake process to ensure that the most accurate and current data is being
fully captured. This includes adding staff capacity to the third-party plan review program to
ensure the adequate screening of projects; training plan review coordinators on the applicability
provisions of the green code, Green Building Act, and Energy Conservation Code; and requiring
a mandatory "green review" at the permit stage for all projects 10,000 square feet and larger.
21 Green Building Report 2012
IV. Benchmarking Report
A. Overview
DDOE‘s 2012 inventory confirms that buildings are responsible for 74% of our greenhouse gas
emissions. Most of this building stock will still be here in 20 years. Therefore, any effort to
reduce energy use in the District and mitigate climate change must include not just new buildings
and renovations, but also existing buildings. Energy benchmarking is the starting point for efforts
to reduce the energy use of existing buildings, as you can‘t manage what you haven‘t measured.
CAEA amended the GBA to require all District government buildings 10,000 square feet and
larger and all private buildings 50,000 square feet and larger to annually benchmark their energy
consumption using the ENERGY STAR Portfolio Manager tool (―Portfolio Manager‖), and
report the results to DDOE for public disclosure. In 2012, the DC Council amended this
requirement to also include reporting of water consumption. The District was the first
jurisdiction in the U.S. to adopt a law requiring the public disclosure of the energy performance
of privately owned buildings. Similar laws have now been adopted by eight other cities—New
York, Seattle, San Francisco, Austin, Philadelphia, Minneapolis, Boston, and Chicago.
The goals of the benchmarking program are threefold. Individual building owners and managers
will gain information they need to improve their buildings—in many cases becoming aware for
the first time of the energy savings potential. Secondly, DDOE will publically disclose the
results, which can drive transformation in the marketplace as energy performance becomes well-
understood and interested parties use comparative energy performance when evaluating different
rental or purchase options, thus turning energy efficiency from something invisible into
something with real market implications. Finally, a successful benchmarking program will
ensure that DDOE and the DC Sustainable Energy Utility (“DC SEU”) have the granular energy
data they need to plan for the future, design more effective programs, and target incentives.
All District government buildings 10,000 square feet and larger under the management of the
DGS have been benchmarked for fiscal years 2009 through 2012. The results are discussed in
subsection B below. DGS is now going above and beyond the legal requirements by publishing
summary energy data on almost 400 buildings, along with detailed 15-minute-interval electricity
consumption data for the previous day, week, and month on www.buildsmartdc.com.
In 2012, after extensive stakeholder outreach, DDOE completed the process of finalizing the
rulemaking for private building benchmarking, resulting in the program being implemented in
2013. The first deadline was set for April 1, 2013. DDOE has now collected data from more than
800 private buildings, and is analyzing the results. The findings comprise the majority of this
section of the report. Details on the rulemaking are provided in subsection C. A discussion of the
implementation process, compliance-to-date, and preliminary findings comprise the remainder of
this chapter.
22 Green Building Report 2012
B. Public Building Benchmarking
CAEA mandates that each year the District benchmark the energy and water performance of all
District government facilities 10,000 gross square feet and larger, and report the results publicly.
This provision applies not just to facilities managed by DGS, but also to other District
instrumentalities, including, but not limited to, the DC Housing Authority, the DC Courts, DC
Water, the Washington Convention Center and other Events DC facilities, and the University of
the District of Columbia.
In 2012, DGS revisited earlier benchmarking data and found many inconsistencies and errors,
which required fixing. DDOE, with substantial assistance from the DC SEU, then used this new
data to benchmark the performance of the facilities using Portfolio Manager. On January 18,
2013, DDOE published the benchmarking results for 230 DGS facilities for fiscal years 2012,
2011, and 2010. In addition, the report included revised and updated data for fiscal year 2009,
replacing the previous report that had been issued on FY 2009 public building performance. Full
building-by-building results can be found at http://ddoe.dc.gov/energybenchmarking/. DDOE is
still working with the other District agencies and instrumentalities to benchmark and publish the
results for their buildings, and expects to do so in 2014. Therefore, the summary below will
focus only on the DGS facilities.
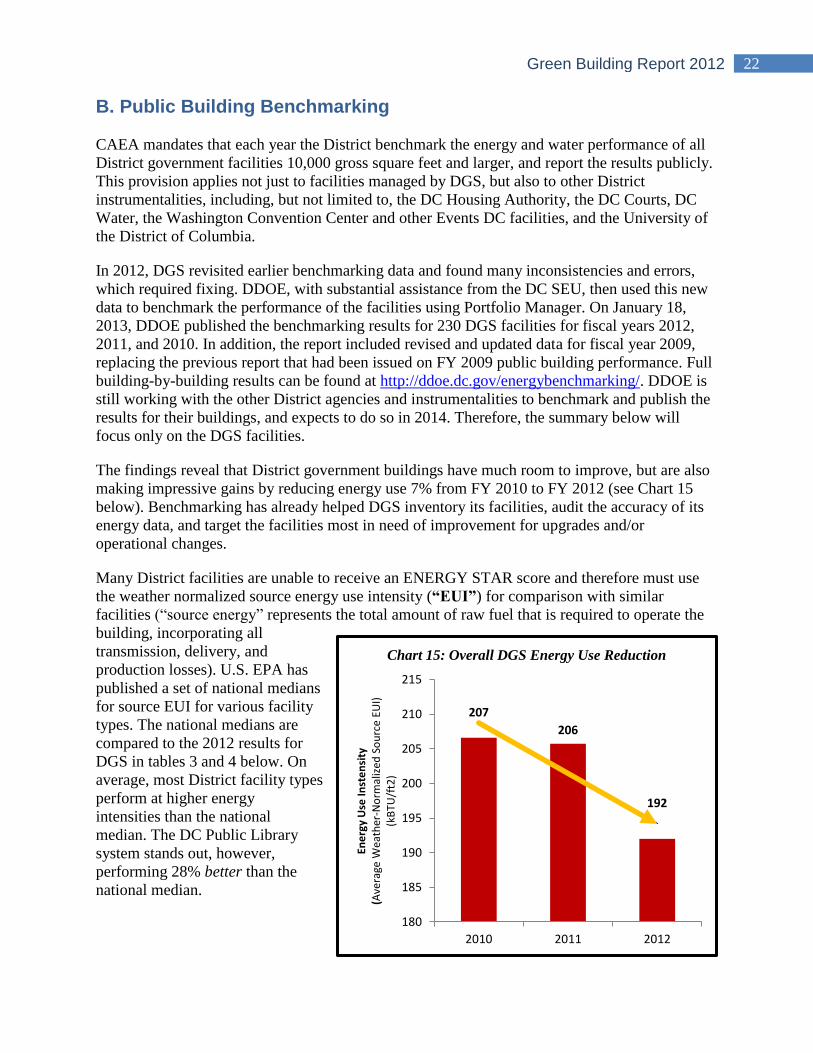
The findings reveal that District government buildings have much room to improve, but are also
making impressive gains by reducing energy use 7% from FY 2010 to FY 2012 (see Chart 15
below). Benchmarking has already helped DGS inventory its facilities, audit the accuracy of its
energy data, and target the facilities most in need of improvement for upgrades and/or
operational changes.
Many District facilities are unable to receive an ENERGY STAR score and therefore must use
the weather normalized source energy use intensity (“EUI”) for comparison with similar
facilities (―source energy‖ represents the total amount of raw fuel that is required to operate the
building, incorporating all
transmission, delivery, and
production losses). U.S. EPA has
published a set of national medians
for source EUI for various facility
types. The national medians are
compared to the 2012 results for
DGS in tables 3 and 4 below. On
average, most District facility types
perform at higher energy
intensities than the national
median. The DC Public Library
system stands out, however,
performing 28% better than the
national median.
207
206
192
180
185
190
195
200
205
210
215
2010 2011 2012
Ene
rgy
Use
Inst
en
sity
(A
vera
ge W
eath
er-N
orm
aliz
ed S
ou
rce
EUI)
(k
BTU
/ft2
)
Chart 15: Overall DGS Energy Use Reduction
23 Green Building Report 2012
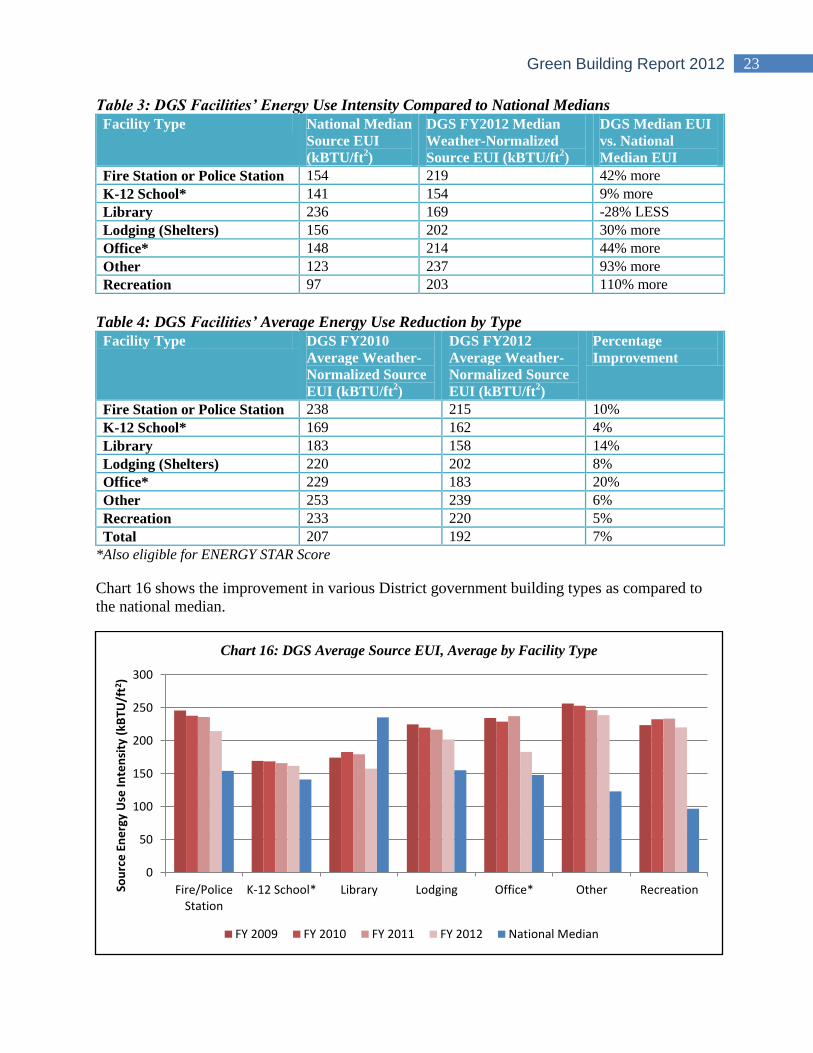
Table 3: DGS Facilities’ Energy Use Intensity Compared to National Medians
Facility Type National Median
Source EUI
(kBTU/ft2)
DGS FY2012 Median
Weather-Normalized
Source EUI (kBTU/ft2)
DGS Median EUI
vs. National
Median EUI
Fire Station or Police Station 154 219 42% more
K-12 School* 141 154 9% more
Library 236 169 -28% LESS
Lodging (Shelters) 156 202 30% more
Office* 148 214 44% more
Other 123 237 93% more
Recreation 97 203 110% more
Table 4: DGS Facilities’ Average Energy Use Reduction by Type
Facility Type DGS FY2010
Average Weather-
Normalized Source
EUI (kBTU/ft2)
DGS FY2012
Average Weather-
Normalized Source
EUI (kBTU/ft2)
Percentage
Improvement
Fire Station or Police Station 238 215 10%
K-12 School* 169 162 4%
Library 183 158 14%
Lodging (Shelters) 220 202 8%
Office* 229 183 20%
Other 253 239 6%
Recreation 233 220 5%
Total 207 192 7%
*Also eligible for ENERGY STAR Score
Chart 16 shows the improvement in various District government building types as compared to
the national median.
0
50
100
150
200
250
300
Fire/PoliceStation
K-12 School* Library Lodging Office* Other RecreationSou
rce
En
erg
y U
se In
ten
sity
(kB
TU/f
t2 )
Chart 16: DGS Average Source EUI, Average by Facility Type
FY 2009 FY 2010 FY 2011 FY 2012 National Median
24 Green Building Report 2012
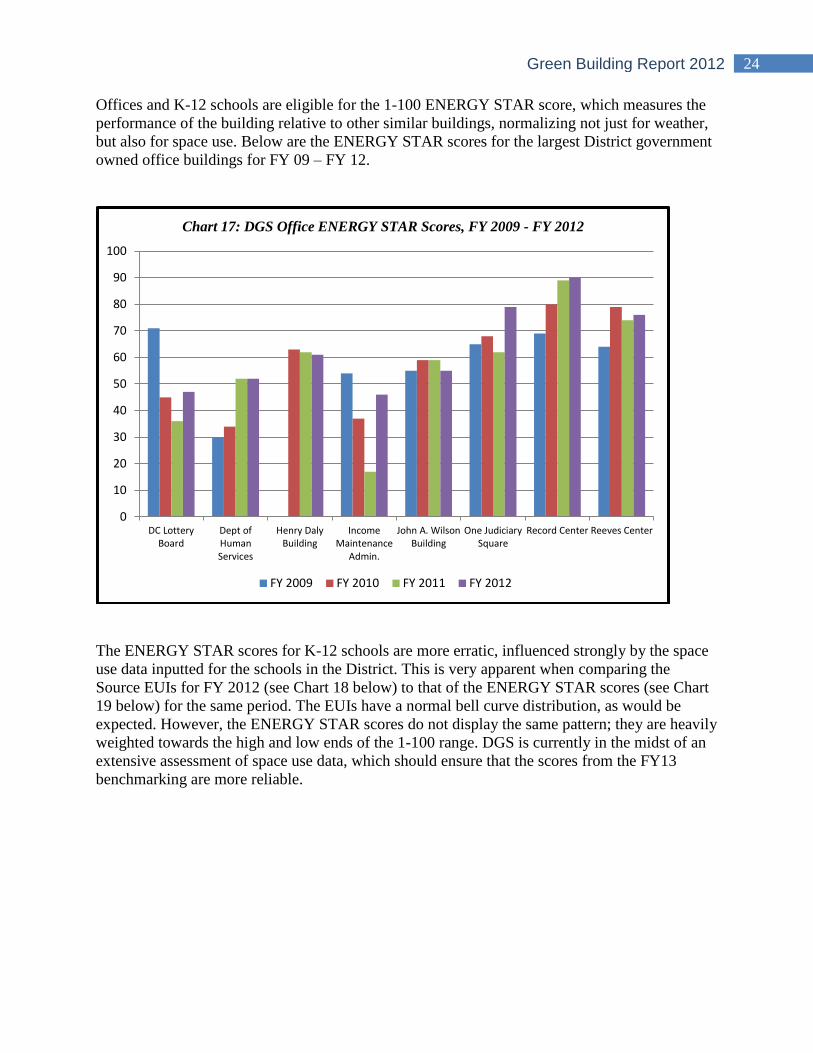
Offices and K-12 schools are eligible for the 1-100 ENERGY STAR score, which measures the
performance of the building relative to other similar buildings, normalizing not just for weather,
but also for space use. Below are the ENERGY STAR scores for the largest District government
owned office buildings for FY 09 – FY 12.
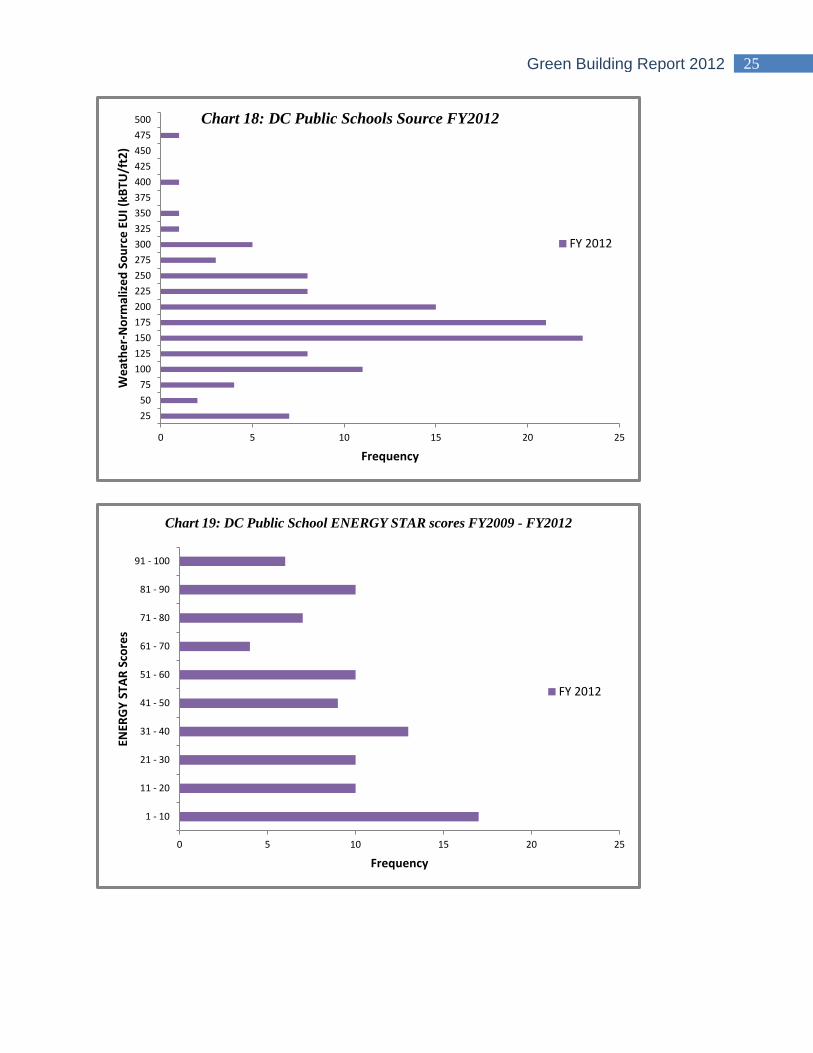
The ENERGY STAR scores for K-12 schools are more erratic, influenced strongly by the space
use data inputted for the schools in the District. This is very apparent when comparing the
Source EUIs for FY 2012 (see Chart 18 below) to that of the ENERGY STAR scores (see Chart
19 below) for the same period. The EUIs have a normal bell curve distribution, as would be
expected. However, the ENERGY STAR scores do not display the same pattern; they are heavily
weighted towards the high and low ends of the 1-100 range. DGS is currently in the midst of an
extensive assessment of space use data, which should ensure that the scores from the FY13
benchmarking are more reliable.
0
10
20
30
40
50
60
70
80
90
100
DC LotteryBoard
Dept ofHumanServices
Henry DalyBuilding
IncomeMaintenance
Admin.
John A. WilsonBuilding
One JudiciarySquare
Record Center Reeves Center
Chart 17: DGS Office ENERGY STAR Scores, FY 2009 - FY 2012
FY 2009 FY 2010 FY 2011 FY 2012
25 Green Building Report 2012
0 5 10 15 20 25
25
50
75
100
125
150
175
200
225
250
275
300
325
350
375
400
425
450
475
500
Frequency
We
ath
er-
No
rmal
ize
d S
ou
rce
EU
I (k
BTU
/ft2
) Chart 18: DC Public Schools Source FY2012
FY 2012
0 5 10 15 20 25
1 - 10
11 - 20
21 - 30
31 - 40
41 - 50
51 - 60
61 - 70
71 - 80
81 - 90
91 - 100
Frequency
ENER
GY
STA
R S
core
s
Chart 19: DC Public School ENERGY STAR scores FY2009 - FY2012
FY 2012
26 Green Building Report 2012
C. Private Building Benchmarking Implementation
Regulations
The final rulemaking on ENERGY STAR benchmarking of privately owned buildings was
published in the DC Register on January 18, 2013 (60 DCR 3), following extensive stakeholder
engagement in calendar year 2012. The details of the rulemaking are described in chapter V.
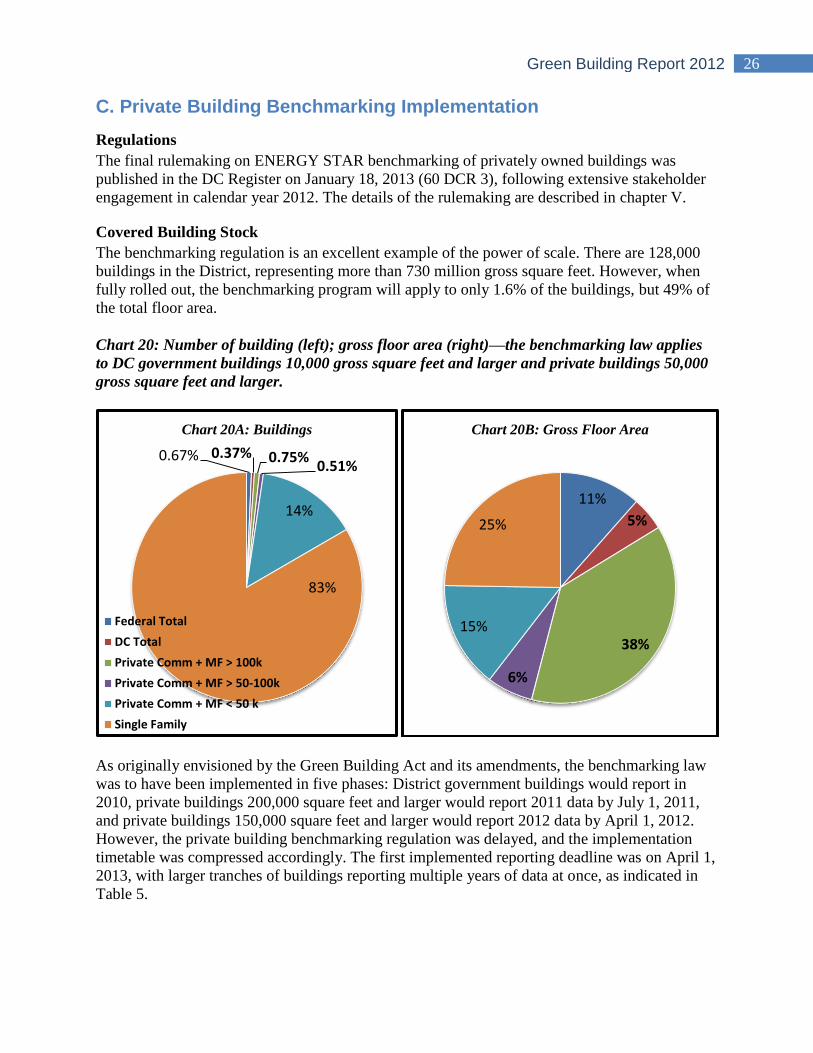
Covered Building Stock
The benchmarking regulation is an excellent example of the power of scale. There are 128,000
buildings in the District, representing more than 730 million gross square feet. However, when
fully rolled out, the benchmarking program will apply to only 1.6% of the buildings, but 49% of
the total floor area.
Chart 20: Number of building (left); gross floor area (right)—the benchmarking law applies
to DC government buildings 10,000 gross square feet and larger and private buildings 50,000
gross square feet and larger.
As originally envisioned by the Green Building Act and its amendments, the benchmarking law
was to have been implemented in five phases: District government buildings would report in
2010, private buildings 200,000 square feet and larger would report 2011 data by July 1, 2011,
and private buildings 150,000 square feet and larger would report 2012 data by April 1, 2012.
However, the private building benchmarking regulation was delayed, and the implementation
timetable was compressed accordingly. The first implemented reporting deadline was on April 1,
2013, with larger tranches of buildings reporting multiple years of data at once, as indicated in
Table 5.
0.67% 0.37% 0.75% 0.51%
14%
83%
Chart 20A: Buildings
Federal Total
DC Total
Private Comm + MF > 100k
Private Comm + MF > 50-100k
Private Comm + MF < 50 k
Single Family
11%
5%
38%
6%
15%
25%
Chart 20B: Gross Floor Area
27 Green Building Report 2012
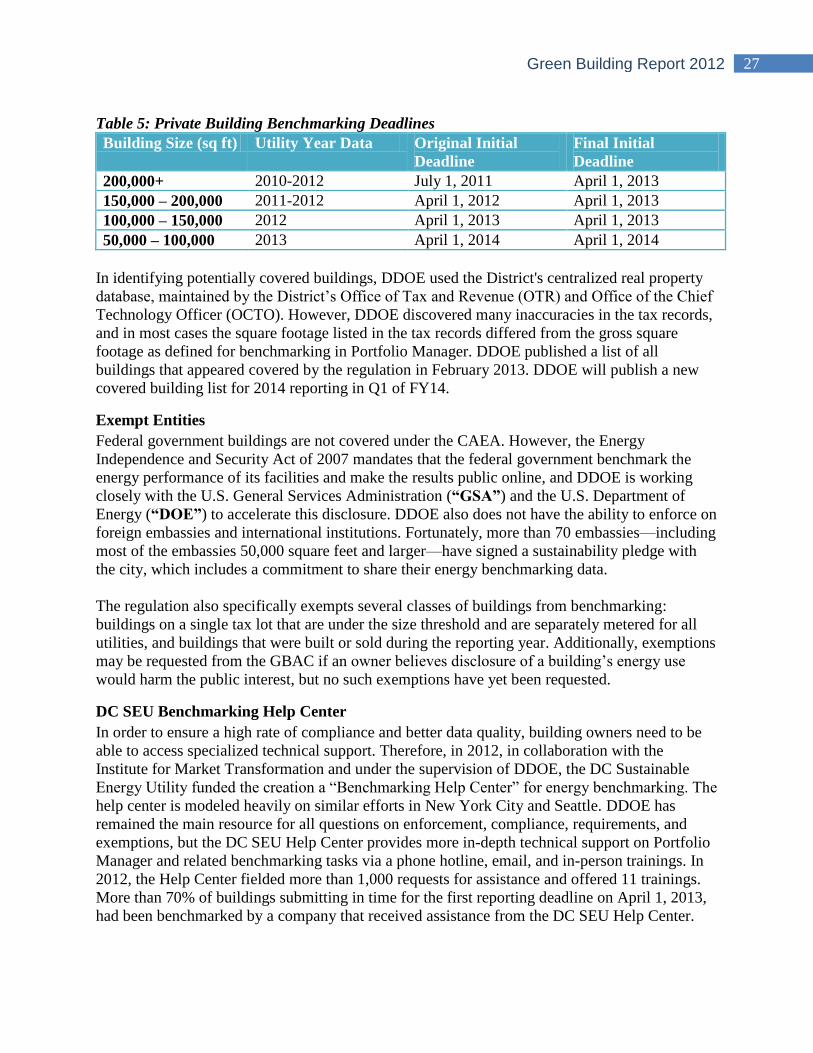
Table 5: Private Building Benchmarking Deadlines
Building Size (sq ft) Utility Year Data Original Initial
Deadline
Final Initial
Deadline
200,000+ 2010-2012 July 1, 2011 April 1, 2013
150,000 – 200,000 2011-2012 April 1, 2012 April 1, 2013
100,000 – 150,000 2012 April 1, 2013 April 1, 2013
50,000 – 100,000 2013 April 1, 2014 April 1, 2014
In identifying potentially covered buildings, DDOE used the District's centralized real property
database, maintained by the District‘s Office of Tax and Revenue (OTR) and Office of the Chief
Technology Officer (OCTO). However, DDOE discovered many inaccuracies in the tax records,
and in most cases the square footage listed in the tax records differed from the gross square
footage as defined for benchmarking in Portfolio Manager. DDOE published a list of all
buildings that appeared covered by the regulation in February 2013. DDOE will publish a new
covered building list for 2014 reporting in Q1 of FY14.
Exempt Entities
Federal government buildings are not covered under the CAEA. However, the Energy
Independence and Security Act of 2007 mandates that the federal government benchmark the
energy performance of its facilities and make the results public online, and DDOE is working
closely with the U.S. General Services Administration (“GSA”) and the U.S. Department of
Energy (“DOE”) to accelerate this disclosure. DDOE also does not have the ability to enforce on
foreign embassies and international institutions. Fortunately, more than 70 embassies—including
most of the embassies 50,000 square feet and larger—have signed a sustainability pledge with
the city, which includes a commitment to share their energy benchmarking data.
The regulation also specifically exempts several classes of buildings from benchmarking:
buildings on a single tax lot that are under the size threshold and are separately metered for all
utilities, and buildings that were built or sold during the reporting year. Additionally, exemptions
may be requested from the GBAC if an owner believes disclosure of a building‘s energy use
would harm the public interest, but no such exemptions have yet been requested.
DC SEU Benchmarking Help Center
In order to ensure a high rate of compliance and better data quality, building owners need to be
able to access specialized technical support. Therefore, in 2012, in collaboration with the
Institute for Market Transformation and under the supervision of DDOE, the DC Sustainable
Energy Utility funded the creation a ―Benchmarking Help Center‖ for energy benchmarking. The
help center is modeled heavily on similar efforts in New York City and Seattle. DDOE has
remained the main resource for all questions on enforcement, compliance, requirements, and
exemptions, but the DC SEU Help Center provides more in-depth technical support on Portfolio
Manager and related benchmarking tasks via a phone hotline, email, and in-person trainings. In
2012, the Help Center fielded more than 1,000 requests for assistance and offered 11 trainings.
More than 70% of buildings submitting in time for the first reporting deadline on April 1, 2013,
had been benchmarked by a company that received assistance from the DC SEU Help Center.
28 Green Building Report 2012
Utility Data Access
In order to successfully and accurately benchmark their buildings, owners and managers need
access to whole-building energy and water consumption data. Utility provision of whole building
energy data has been critical to the success of mandatory benchmarking in New York City and
Seattle. District law and DDOE regulations require non-residential tenants to provide their
landlord with data the owner needs to benchmark the buildings—the tenants are liable for
$100/day fines for non-compliance. Residential tenants have no requirements. This requirement
on non-residential tenants renders moot many of the privacy concerns surrounding utility data of
non-residential tenants in buildings covered by CAEA.
In collaboration with DDOE, the District‘s electric utility, Pepco, is supporting the
benchmarking regulations by providing aggregate energy use data to authorized requestors where
five or more accounts are present in the building. The aggregation of 5 accounts on a monthly
interval ensures that no individual account‘s data can be isolated. The use of this service was
optional in 2013, but will be required in 2014. In 2013, more than 100 buildings acquired whole
building utility data from Pepco for reporting to DDOE. For cases where there are fewer than 5
accounts, and for water and natural gas data, DDOE has designed a common waiver form that a
tenant can use to authorize their landlord to access their energy and water consumption data.
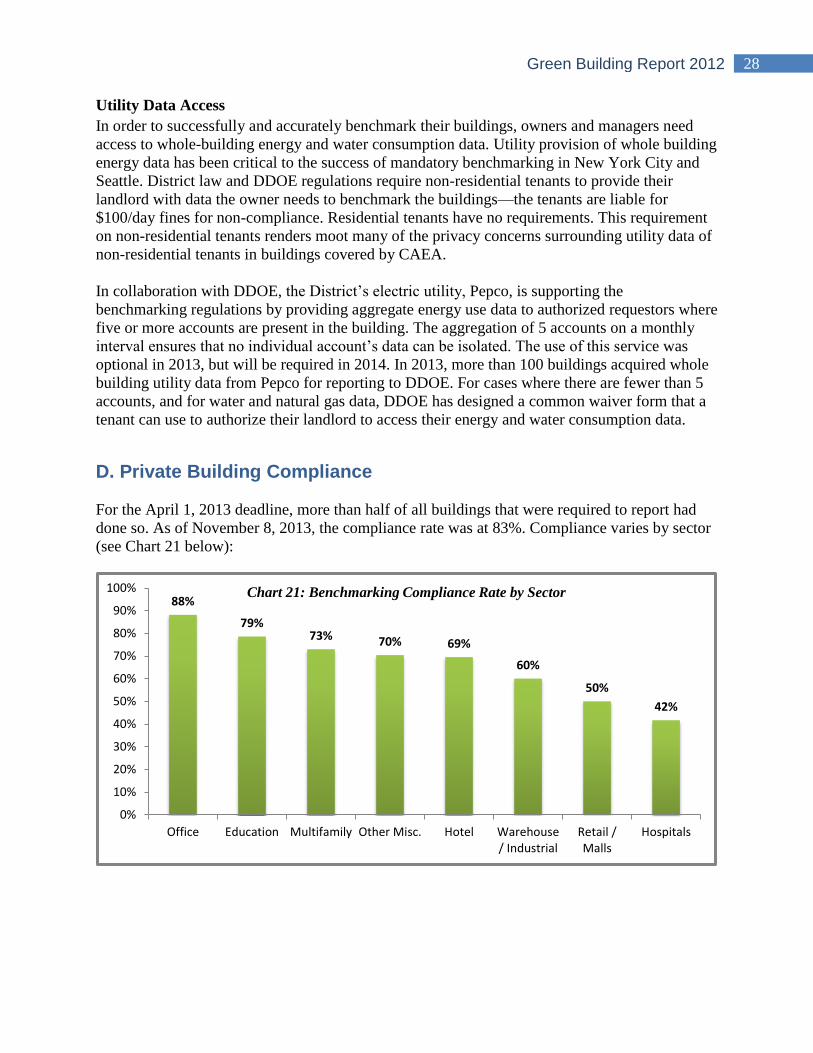
D. Private Building Compliance
For the April 1, 2013 deadline, more than half of all buildings that were required to report had
done so. As of November 8, 2013, the compliance rate was at 83%. Compliance varies by sector
(see Chart 21 below):
88%
79% 73% 70% 69%
60%
50%
42%
0%
10%
20%
30%
40%
50%
60%
70%
80%
90%
100%
Office Education Multifamily Other Misc. Hotel Warehouse/ Industrial
Retail /Malls
Hospitals
Chart 21: Benchmarking Compliance Rate by Sector
29 Green Building Report 2012
E. Private Building Benchmarking Preliminary Results
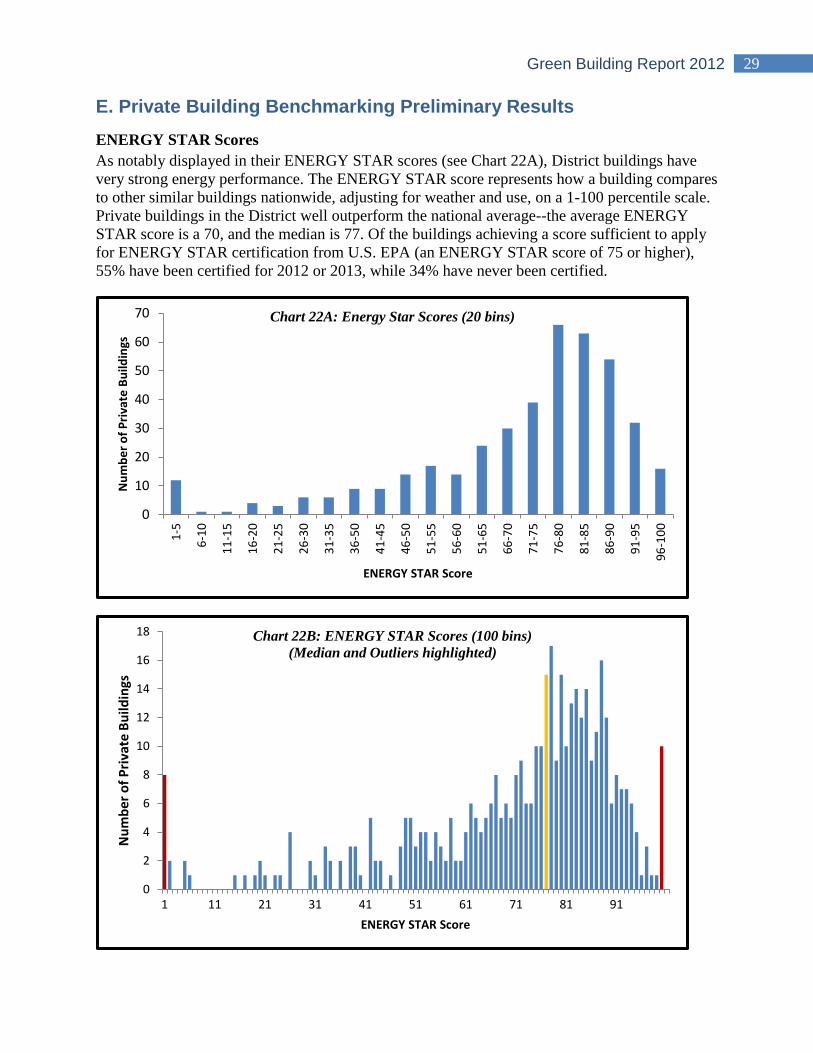
ENERGY STAR Scores
As notably displayed in their ENERGY STAR scores (see Chart 22A), District buildings have
very strong energy performance. The ENERGY STAR score represents how a building compares
to other similar buildings nationwide, adjusting for weather and use, on a 1-100 percentile scale.
Private buildings in the District well outperform the national average--the average ENERGY
STAR score is a 70, and the median is 77. Of the buildings achieving a score sufficient to apply
for ENERGY STAR certification from U.S. EPA (an ENERGY STAR score of 75 or higher),
55% have been certified for 2012 or 2013, while 34% have never been certified.
0
10
20
30
40
50
60
70
1-5
6-1
0
11
-15
16
-20
21
-25
26
-30
31
-35
36
-50
41
-45
46
-50
51
-55
56
-60
51
-65
66
-70
71
-75
76
-80
81
-85
86
-90
91
-95
96
-10
0
Nu
mb
er
of
Pri
vate
Bu
ildin
gs
ENERGY STAR Score
Chart 22A: Energy Star Scores (20 bins)
0
2
4
6
8
10
12
14
16
18
1 11 21 31 41 51 61 71 81 91
Nu
mb
er o
f P
riva
te B
uild
ings
ENERGY STAR Score
Chart 22B: ENERGY STAR Scores (100 bins)
(Median and Outliers highlighted)
30 Green Building Report 2012
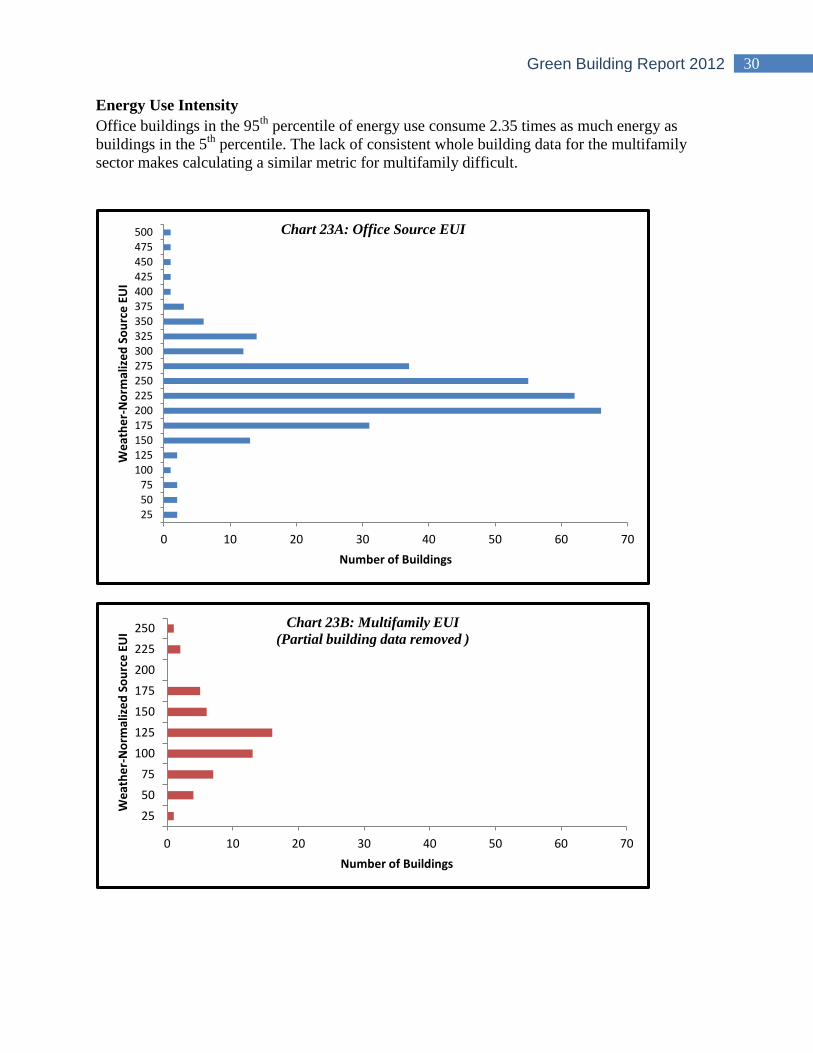
Energy Use Intensity
Office buildings in the 95th
percentile of energy use consume 2.35 times as much energy as
buildings in the 5th
percentile. The lack of consistent whole building data for the multifamily
sector makes calculating a similar metric for multifamily difficult.
0 10 20 30 40 50 60 70
255075
100125150175200225250275300325350375400425450475500
Number of Buildings
We
ath
er-
No
rmal
ize
d S
ou
rce
EU
I
Chart 23A: Office Source EUI
0 10 20 30 40 50 60 70
25
50
75
100
125
150
175
200
225
250
Number of Buildings
We
ath
er-
No
rmal
ize
d S
ou
rce
EU
I
Chart 23B: Multifamily EUI
(Partial building data removed )
31 Green Building Report 2012
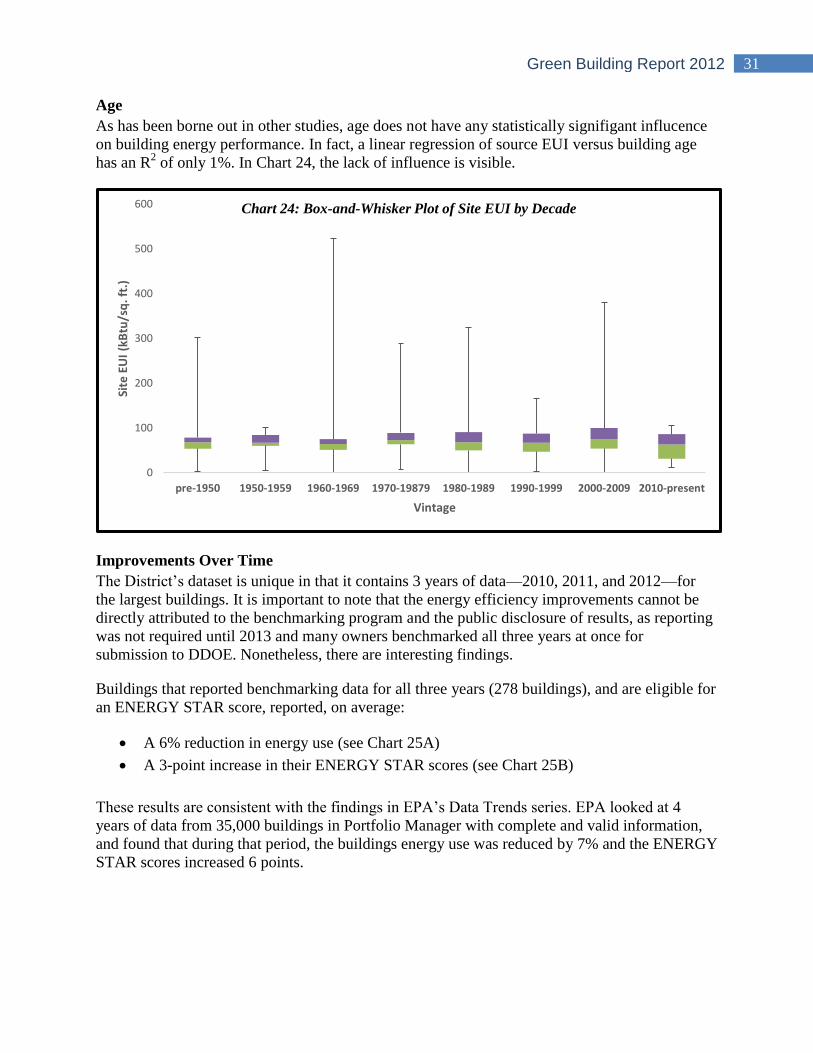
Age
As has been borne out in other studies, age does not have any statistically signifigant influcence
on building energy performance. In fact, a linear regression of source EUI versus building age
has an R2 of only 1%. In Chart 24, the lack of influence is visible.
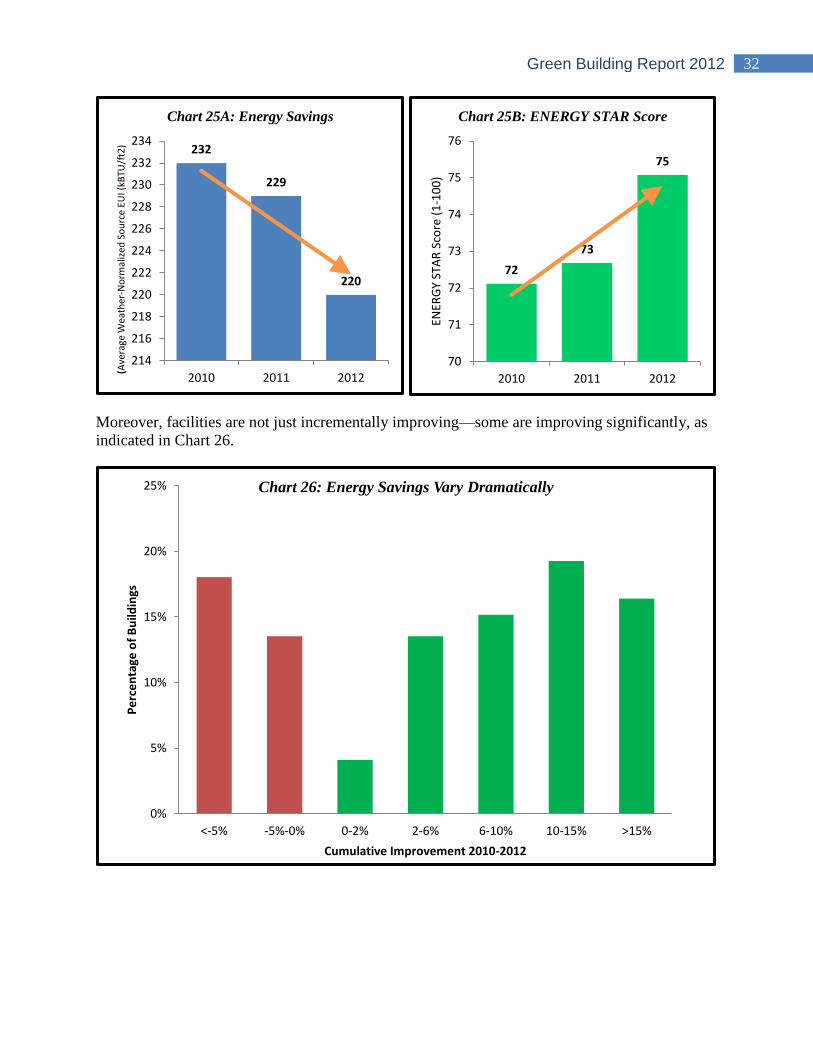
Improvements Over Time
The District‘s dataset is unique in that it contains 3 years of data—2010, 2011, and 2012—for
the largest buildings. It is important to note that the energy efficiency improvements cannot be
directly attributed to the benchmarking program and the public disclosure of results, as reporting
was not required until 2013 and many owners benchmarked all three years at once for
submission to DDOE. Nonetheless, there are interesting findings.
Buildings that reported benchmarking data for all three years (278 buildings), and are eligible for
an ENERGY STAR score, reported, on average:
A 6% reduction in energy use (see Chart 25A)
A 3-point increase in their ENERGY STAR scores (see Chart 25B)
These results are consistent with the findings in EPA‘s Data Trends series. EPA looked at 4
years of data from 35,000 buildings in Portfolio Manager with complete and valid information,
and found that during that period, the buildings energy use was reduced by 7% and the ENERGY
STAR scores increased 6 points.
0
100
200
300
400
500
600
pre-1950 1950-1959 1960-1969 1970-19879 1980-1989 1990-1999 2000-2009 2010-present
Site
EU
I (k
Btu
/sq
. ft.
)
Vintage
Chart 24: Box-and-Whisker Plot of Site EUI by Decade
32 Green Building Report 2012
Moreover, facilities are not just incrementally improving—some are improving significantly, as
indicated in Chart 26.
232
229
220
214
216
218
220
222
224
226
228
230
232
234
2010 2011 2012
(Ave
rage
Wea
ther
-No
rmal
ized
So
urc
e EU
I (kB
TU/f
t2)
Chart 25A: Energy Savings
72
73
75
70
71
72
73
74
75
76
2010 2011 2012
ENER
GY
STA
R S
core
(1
-10
0)
Chart 25B: ENERGY STAR Score
0%
5%
10%
15%
20%
25%
<-5% -5%-0% 0-2% 2-6% 6-10% 10-15% >15%
Pe
rce
nta
ge o
f B
uild
ings
Cumulative Improvement 2010-2012
Chart 26: Energy Savings Vary Dramatically
33 Green Building Report 2012
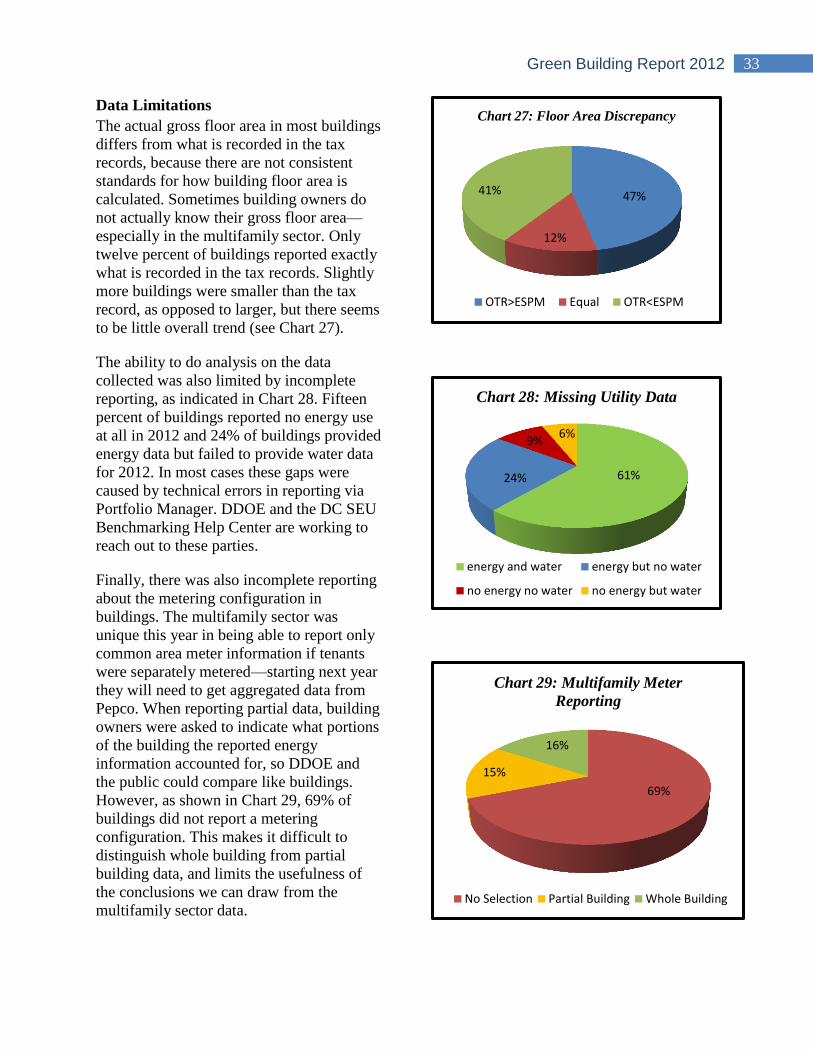
Data Limitations
The actual gross floor area in most buildings
differs from what is recorded in the tax
records, because there are not consistent
standards for how building floor area is
calculated. Sometimes building owners do
not actually know their gross floor area—
especially in the multifamily sector. Only
twelve percent of buildings reported exactly
what is recorded in the tax records. Slightly
more buildings were smaller than the tax
record, as opposed to larger, but there seems
to be little overall trend (see Chart 27).
The ability to do analysis on the data
collected was also limited by incomplete
reporting, as indicated in Chart 28. Fifteen
percent of buildings reported no energy use
at all in 2012 and 24% of buildings provided
energy data but failed to provide water data
for 2012. In most cases these gaps were
caused by technical errors in reporting via
Portfolio Manager. DDOE and the DC SEU
Benchmarking Help Center are working to
reach out to these parties.
Finally, there was also incomplete reporting
about the metering configuration in
buildings. The multifamily sector was
unique this year in being able to report only
common area meter information if tenants
were separately metered—starting next year
they will need to get aggregated data from
Pepco. When reporting partial data, building
owners were asked to indicate what portions
of the building the reported energy
information accounted for, so DDOE and
the public could compare like buildings.
However, as shown in Chart 29, 69% of
buildings did not report a metering
configuration. This makes it difficult to
distinguish whole building from partial
building data, and limits the usefulness of
the conclusions we can draw from the
multifamily sector data.
47%
12%
41%
Chart 27: Floor Area Discrepancy
OTR>ESPM Equal OTR<ESPM
61% 24%
9% 6%
Chart 28: Missing Utility Data
energy and water energy but no water
no energy no water no energy but water
69%
15%
16%
Chart 29: Multifamily Meter
Reporting
No Selection Partial Building Whole Building
34 Green Building Report 2012
F. Recommendations for Improving Benchmarking in the District
Public Buildings
While most District government buildings are either owned or leased by DGS, and thus now
benchmarked in Portfolio Manager, there are other public facilities not under the DGS umbrella
that have not been comprehensively benchmarked. These facilities are managed by the DC
Housing Authority, the DC Courts, the Washington Convention Center, the University of the
District of Columbia, and DC Water. DDOE is actively working to get benchmarking data from
the entities listed above.
DGS facilities have been benchmarked using monthly consumption data for electricity, natural
gas, and district steam. However, some facilities may also use fuel oil or other fuel sources
which need to be tracked as well. Water data also needs to be tracked and disclosed. For truly
accurate benchmarking in all public facilities, improved space use data will also be required.
Private Buildings
Building owners need to be able to easily access whole building energy consumption data in
order for benchmarking to be reliable and comprehensive. Pepco is already providing aggregated
whole building electricity consumption where 5 or more accounts are present. To further advance
this program, DDOE and Pepco have joined the DOE Better Buildings Data Access Accelerator.
Under this partnership, Pepco has committed to continue providing whole building data, and is
also working to provide direct upload of data to Portfolio Manager by the end of the year. In
2014, the use of whole building electricity data will be required by the benchmarking program.
DDOE is now seeking to get Washington Gas and DC Water to follow Pepco‘s lead. To further
advance this goal, the GBAC recommends that the DC Council adopt the ―Aggregate
Benchmarking Data Amendment Act of 2013,‖ which the Mayor sent to the DC Council on
October 1, 2013. The Act will mandate that utilities provide whole building data to building
owners and upload it to Portfolio Manager on a monthly basis automatically.
Currently, when a building is sold, the new owner does not have to benchmark it until the first
full calendar year after purchase. DDOE analysis indicates that ~50% of the building stock more
than 50,000 square feet is sold each year, resulting in a potential flux of up to 10% in the total
buildings that report benchmarking data each year, as buildings leave and return from the
covered building set. It would be better if the seller simply transferred the benchmarking data to
the buyer and the buyer was required to benchmark for the year in which they bought the
building. Building managers will also benefit from the richer baseline data for comparing the
building‘s current performance. To make this a requirement, the Mayor has sent to DC Council
the ―Benchmarking Data Transfer Improvement Amendment Act of 2013,‖ which GBAC
recommends for adoption by the DC Council.
35 Green Building Report 2012
V. Codes, Regulations & Legislation
A. Green Construction Codes
The GBA specifically mandates that ―the Mayor shall, in consultation with the GBAC, submit
construction code revisions to the DC Council that incorporate as many green building practices
as practicable,‖ and identifies the need to continually improve the energy code. As a result, the
District is establishing itself as a leader in the arena of green codes development:
In 2008, the District completed a comprehensive building code update, involving
stakeholders including the GBAC, DDOE, DCRA, the District of Columbia Building
Industry Association (―DCBIA‖), the Apartment and Office Building Association
(―AOBA‖), and others. The following code improvements were adopted:
o More stringent efficiency requirements for building envelope, water fixtures, and
removal of impediments for the use of waterless urinals and green piping
o Adoption of ASHRAE Standard 90.1-2007 for commercial buildings
o ―30 Percent Solution‖8 energy efficiency strategies for low-rise residential buildings
o Stormwater management measures, including on site rainwater retention and easier
methods for disconnecting downspouts
o Urban heat island requirements for flat roofs
In 2012, the Mayor issued a directive for the District‘s Construction Codes Coordinating
Board (“CCCB”) to leapfrog the International Code Council 2009 model codes and
instead move directly to the 2012 versions. The 2012 I-codes include the International
Green Construction Code (“IgCC”) for the first time, as well as a new International
Energy Conservation Code (“IECC”). In March of 2012, the CCCB and its Green and
Energy Technical Advisory Groups began the process of adapting the IgCC and IECC for
use in the District. The initial versions of the Green and Energy Conservation Codes were
issued for a first public comment period in late 2012. The CCCB submitted the final code
proposals to the Mayor in 2013 for consideration in early 2014 by the DC Council.
Following the adoption of the 2012 model I-codes, including the new IgCC and IECC, the
District will have one of the greenest construction codes in the country. But adoption is just one
part of the process—having a green code in place helps, but ensuring compliance with the codes
is equally essential. Building codes enforcement is one of the most effective tools available for
improving the environmental and energy performance of buildings. In the District, as in other
parts of the country, compliance and enforcement needs to be significantly improved. The codes
have limited impact if plan reviewers do not check for green construction specifications, or if
building inspectors are not trained in the new requirements when confirming compliance during
project site visits.
8Advanced by the Energy Efficient Codes Coalition, http://www.energyefficientcodes.org/.
36 Green Building Report 2012
DCRA is spending a significant amount of Green Building Fund revenue for training its staff and
third-party plan reviewers and inspectors to prepare them for the adoption of the new green and
energy codes. The agency intends to continue this commitment to training and enforcement in
years to come, and is working on unique training concepts such as in-the-field, peer-to-peer, and
virtual training for agency staff and the private sector. If high performance codes are to be
considered as a viable alternative to a LEED-based green building requirement for many of the
District‘s buildings, code enforcement will be paramount to this strategy‘s success.
B. Rulemaking
A number of new rules related to the implementation of the GBA were published in 2012:
D.C. Register 11318, Volume 59, Number 47, issued November 23, 2012:
These rules provide guidance for the binding pledge and financial security agreements
required by the GBA. As set forth in the Act, financial security can take the form of
either: (1) cash; (2) an irrevocable letter of credit; (3) a bond; or (4) a binding pledge. The
form for the Binding Pledge Agreement defined in this rule is deemed to satisfy the
financial security requirement of the Act.
D.C. Register 11318, Volume 59, Number 48, issued November 23, 2012:
In this rule, DCMR Title 12 Chapter 2A was amended to include new definitions,
Chapter 13A was altered, and Chapter 35A was amended to add new reference standards.
These regulations apply to all construction projects that are required to comply with the
GBA (D.C. Official Code § 6-1451.01), including publicly-owned or publicly financed
projects, and private-owned projects with 50,000 square feet or more of gross floor area.
The emergency regulations allow the use of the following LEED standards for
compliance: New Construction & Major Renovations; Commercial Interiors; Core &
Shell; Healthcare; Retail; and Schools. For private-owned projects, a financial security
must be submitted to DCRA before the issuance of the first certificate of occupancy for
occupiable space in a story above grade plane. Failure to comply with the GBA
requirements or to achieve the minimum required LEED standard will result in the
forfeiture of either 100% or 50% of the financial security, with the possibility of
additional monthly fines.
60 DC Register 367, Volume 60, Number 3, published January 18, 2013:
Though this final rulemaking was published outside the scope of this report, it is included
here because the work of drafting and finalizing it was completed in 2012 and because
the results of its implementation are significant (See Section IV). In this rule a new
section, 3513, was added to DCMR Title 20, Chapter 35, and the definitions in Section
3599 were amended. The final rulemaking followed an extensive stakeholder engagement
37 Green Building Report 2012
process with two rounds of proposed regulations in 2011 and 2012, and was supported by
multiple guidance documents published online. These final regulations and guidance
documents implement the energy and water performance benchmarking provisions of the
Green Building Act and its amendments, which mandate that owners of privately-owned
buildings annually benchmark their buildings using the Portfolio Manager tool and report
the results to the District for public disclosure.
D.C. Register 11318, Volume 60, Number 33, issued August 2, 2013:
Though this rulemaking was published outside of the scope of this report (published in
calendar year 2013), a reference is included here because the rule clarifies the emergency
regulations that were published in November of 2012, which are described above. In this
rule, DCMR Title 12 Chapter 2A was amended to include new definitions.
These emergency regulations apply to all construction projects that are required to
comply with the GBA (D.C. Official Code § 6-1451.01), including publicly-owned or
publicly financed projects, and private-owned projects of 50,000 square feet or more of
gross floor area. The emergency regulations further clarify the GBA‘s intended definition
of ―residential occupancy‖ to include ―residential group R-2, R-3 or R-4 occupancies, and
buildings regulated by the Residential Code.‖
The rule also further clarifies the definitions of new construction and substantial
improvement that are found in the Act. New construction is now defined as ―the
construction of any building or structure whether as a stand-alone, or an addition to, a
building or structure. The term ‗new construction‘ includes new buildings and additions
or enlargements of existing buildings, exclusive of any alterations or repairs to any
existing portion of a building.‖ Substantial improvement is defined as ―any repair or
alteration of, or addition to, a building or structure, the cost of which equals or exceeds
50 percent of the market value of the building or structure before the repair, alteration, or
addition is started.‖
C. Legislative Amendments
One legislative amendment was made to the GBA in 2012, which is summarized below:
Green Building Compliance, Technical Corrections and Clarification Amendment Act of
2012:
This act corrects and further refines various definitions and requirements of the GBA.
The act includes a requirement for public and charter schools to target LEED-Gold,
clarifies application for mixed-use and publicly-financed projects, adds a new penalty for
the failure of publicly funded projects to fulfill GBA, introduces a penalty for failure to
comply with the Act‘s benchmarking requirements, further addresses the GBA‘s financial
security requirements, and revises the uses of the Green Building Fund, including more
oversight by the DC Council and GBAC. The amendment was unanimously approved by
the DC Council in early March and signed by the Mayor on March 28, 2012.
38 Green Building Report 2012
VI. Implementation
A. Capacity Building, Training & Education
The District continues to build agency capacity to support green building implementation, and to
put significant resources into training and education for the advancement of green building
activity in the city.
Capacity Building
In calendar year 2012, DCRA began putting the pieces in place to build a significant green
building program in that agency. The position for DCRA‘s green building coordinator was
posted in 2012, and was filled in early 2013. In the FY13-FY14 budget plan for the Green
Building Fund, an additional four positions are listed to support the work of DCRA‘s program.
These hires are crucial to the development of the new green and energy codes being proposed for
adoption, and to ensuring compliance with the new codes. An additional position was dedicated
in the Green Building Fund to support a staff person to work on the ENERGY STAR
benchmarking program at DDOE. Finally, monies were set aside from the fund and earmarked
for DGS to support the work of energy and water benchmarking for our public buildings.
Training & Education
DCRA spent a significant amount of money and dedicated much staff time to code and other
trainings. The agency held 21 trainings with more than 800 participants in 2012, including
several focused on green building and energy code compliance, including the list below:
USGBC - Green Building Basics and LEED Online
ICC - 2012 IECC Fundamentals
ICC - Developing Green Building Ordinances and Programs
Prospect Solar - Solar Panel Installation
ASHRAE - Complying With Standard 90.1 - 2010
ASHRAE – Fundamental Requirements of Standard 62.1
ASHRAE - Basics of High Performance Building Design
ASHRAE - Understanding Standard 189.1 - 2011
B. Enforcement & Compliance
Enforcement of, and compliance with, the GBA occurs at multiple levels: agency Director
accountability to the Mayor, the public disclosure of benchmarking results, publication of the
Green Building Report, building permitting and inspection of individual projects, and more. The
weight of compliance rests on the permitting and inspection process however, and that is the
focus of this section.
39 Green Building Report 2012
Project Permitting and Inspections
Permitting intake processes (called the ―Green Building Intake Form‖), standard operating
procedures (“SOPs”), and tracking systems (Accela) have been put in place by DCRA.
However, lack of adequate plan review staff and inspectors remains an ongoing concern. Staffing
needs have been neglected for several reasons: (a) austerity measures imposed on the
government as a result of fiscal hardships from FY10-FY12; and (b) legal issues around DCRA‘s
right to enforce the GBA were unresolved. The legal issues included:
DCRA‘s legal authority to enforce legislative requirements outside of the agency‘s
narrow mission to enforce District codes
DCRA‘s legal authority to reject permit applications for causes other than noncompliance
DCRA‘s legal authority to reject a certificate of occupancy on anything other than
noncompliance with construction codes
Since the above issues were resolved by the publication of new regulations, DCRA has
developed the following mechanisms to manage GBA project compliance at the permitting stage:
A Green Building Intake Form for private projects 50,000 square feet or larger
Tracking of green features in the Accela project tracking system
SOPs including review for applicable GBA documentation, with LEED and Green
Communities Criteria checklists and the general Green Building Intake Form, registration
with a third party certifying organization if appropriate, demonstration of ENERGY
STAR Target Finder compliance, and third party standards for permitting, inspections,
and certification for green building
Inclusion of GBA requirements in full project permit applications so that a permit
application is not deemed completed unless it incorporates documentation demonstrating
compliance with the GBA
Project Bonding Requirement
The GBA requires some form of financial surety for mandated green building projects. Until the
passage of the Green Building Compliance, Technical Corrections, and Clarification Amendment
Act of 2012 (―TCCAA‖) was passed, obstacles to implementing a ―green building bond‖ were
cited, which included arguments about the lack of availability of a ―green building bond‖ in the
private marketplace, the pricing associated with a novel and niche product, identification of
which firm (developer, architect, contractor, or sustainability consultant) was the appropriate
responsible party; and others.
As a result of the TCCAA, the interests of the government to have financial security are better
aligned with the range of tools available to private practitioners. Specifically, the types of
financial security that are now permitted include: (i) cash deposited into an escrow account; (ii)
letters of credit; (iii) bonds; and (iv) binding pledges to fulfill green building certification. If the
building owner fails to receive the required green building certification, the District now has the
ability to draw down on funds or levy fines against the applicant.
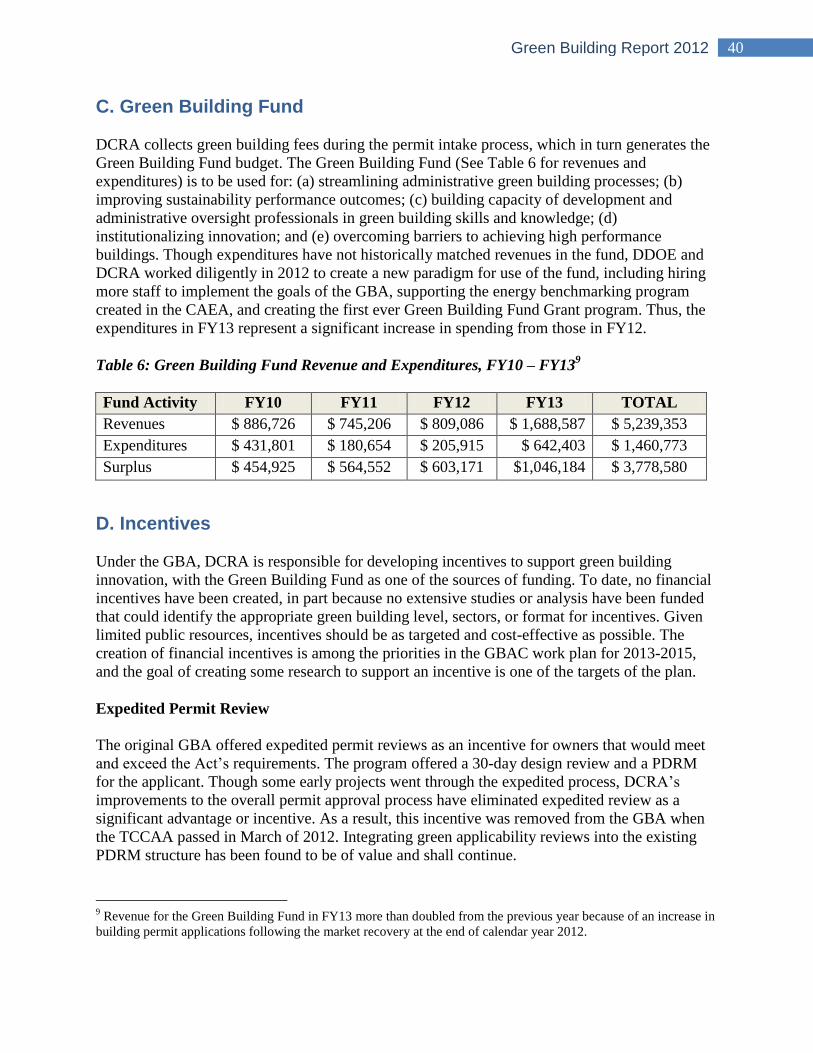
40 Green Building Report 2012
C. Green Building Fund
DCRA collects green building fees during the permit intake process, which in turn generates the
Green Building Fund budget. The Green Building Fund (See Table 6 for revenues and
expenditures) is to be used for: (a) streamlining administrative green building processes; (b)
improving sustainability performance outcomes; (c) building capacity of development and
administrative oversight professionals in green building skills and knowledge; (d)
institutionalizing innovation; and (e) overcoming barriers to achieving high performance
buildings. Though expenditures have not historically matched revenues in the fund, DDOE and
DCRA worked diligently in 2012 to create a new paradigm for use of the fund, including hiring
more staff to implement the goals of the GBA, supporting the energy benchmarking program
created in the CAEA, and creating the first ever Green Building Fund Grant program. Thus, the
expenditures in FY13 represent a significant increase in spending from those in FY12.
Table 6: Green Building Fund Revenue and Expenditures, FY10 – FY139
Fund Activity FY10 FY11 FY12 FY13 TOTAL
Revenues $ 886,726 $ 745,206 $ 809,086 $ 1,688,587 $ 5,239,353
Expenditures $ 431,801 $ 180,654 $ 205,915 $ 642,403 $ 1,460,773
Surplus $ 454,925 $ 564,552 $ 603,171 $1,046,184 $ 3,778,580
D. Incentives
Under the GBA, DCRA is responsible for developing incentives to support green building
innovation, with the Green Building Fund as one of the sources of funding. To date, no financial
incentives have been created, in part because no extensive studies or analysis have been funded
that could identify the appropriate green building level, sectors, or format for incentives. Given
limited public resources, incentives should be as targeted and cost-effective as possible. The
creation of financial incentives is among the priorities in the GBAC work plan for 2013-2015,
and the goal of creating some research to support an incentive is one of the targets of the plan.
Expedited Permit Review
The original GBA offered expedited permit reviews as an incentive for owners that would meet
and exceed the Act‘s requirements. The program offered a 30-day design review and a PDRM
for the applicant. Though some early projects went through the expedited process, DCRA‘s
improvements to the overall permit approval process have eliminated expedited review as a
significant advantage or incentive. As a result, this incentive was removed from the GBA when
the TCCAA passed in March of 2012. Integrating green applicability reviews into the existing
PDRM structure has been found to be of value and shall continue.
9 Revenue for the Green Building Fund in FY13 more than doubled from the previous year because of an increase in
building permit applications following the market recovery at the end of calendar year 2012.
41 Green Building Report 2012
VII. Conclusion
Ultimately, there are six simple targets the District needs to hit to move toward sustainability in
our built environment. We need to use as little energy as possible in our buildings, and produce
the rest onsite or nearby; we need to use as little water as possible, and collect rainwater onsite or
nearby to cover the balance; and we need to create minimal or zero waste (both waste water and
solid waste) and minimize the impacts of the remaining waste that leaves the site. If we do those
things, and also eliminate toxic products in our buildings, we will be on a path to constructing
truly sustainable structures.
Though these targets are simple in theory, the implementation of true sustainability is more
difficult in practice. But we are not starting from scratch. As discussed in this report, the District
was the first large city in the nation to pass a law that required green building certifications for
both the public and private sectors; the first city to pass a law requiring energy benchmarking;
and we are now poised to pass what may be the greenest construction code in the country.
This report shows the exponential growth of green building deployment since the passage of the
GBA and the energy benchmarking requirements, all of which has coincided with a remarkable
growth in development and population in the District, proving that being a green city has more
than one meaning. Though we have had remarkable growth, we have also realized a significant
reduction in the District‘s carbon emissions. Our next step is to finalize the green construction
codes and ensure that there is sufficient training, education and enforcement in place to continue
to raise the bar and to normalize green building for all projects in the District.
The District‘s green building program, with the support of the GBAC, must now be integrated
with the goals of Mayor Gray‘s Sustainable DC Plan in order to continue the District‘s national
leadership in green building deployment, and to start us on the path towards sustainability. We
must continue the creative use of the Green Building Fund to finance innovative ideas and
analysis in order to drive us to the next evolution of green building.
But the GBA, energy benchmarking, and the new green codes will not lead directly to true
sustainability. There are new programs, such as zero-energy and Living Building Challenge
certifications, which are beginning to drive high performance projects, but currently those
projects are a small minority of total construction. In order to move them to the mainstream, the
city should explore incentive programs that can help off-set the differential costs of these deep
green building solutions.
The growth of green building in both the private and public sectors discussed in this report
reveals that the District has the will to continue driving towards true sustainability, and the
progressive nature of our program shows that we have the ―way.‖ If we continue to follow it, this
path can lead us to achieve the Mayor‘s goal of being the ―healthiest, greenest and most livable
city in the nation.‖
42 Green Building Report 2012
Glossary
AOBA Apartment and Office Building Association
ASHRAE American Society of Heating, Refrigerating and Air-Conditioning Engineers
AWDZ Anacostia Waterfront Development Zone
AWDZ Act National Capitol Revitalization Corporation and Anacostia Waterfront Corporation
Reorganization Act of 2008
CAEA Clean and Affordable Energy Act of 2008
CBD Central Business District
CCCB Construction Codes Coordinating Board
DCBIA District of Columbia Building Industry Association
DCPL District of Columbia Public Libraries
DCRA Department of Consumer and Regulatory Affairs
DDOE District Department of the Environment
DHCD Department of Housing and Community Development
DMPED Office of the Deputy Mayor for Planning and Economic Development
DGS Department of General Services
DOC Department of Corrections
DOH Department of Health
DPR Department of Parks and Recreation
DPW Department of Public Works
DYRS Department of Youth Rehabilitation Services
FEMS Fire and Emergency Medical Services
GBA Green Building Act of 2006
GBAC Green Building Advisory Council
GBCI Green Building Certification Institute
43 Green Building Report 2012
EGC Enterprise Green Communities
GSA U.S. General Services Administration
HFA Housing Finance Agency
ICC International Code Council
IECC International Energy Conservation Code
IgCC International Green Construction Code
LEED Leadership in Energy and Environmental Design
LEED-AP LEED-Accredited Professional
LID Low-Impact Development
MPD Metropolitan Police Department
MS4 Municipal Separate Storm Sewer System
OP Office of Planning
OTR Office of Tax and Revenue
PDRM Preliminary Design Review Meetings
RFP Request for Proposals
SOP Standard Operating Procedures
TAG Technical Advisory Group
TCCAA Green Building Technical Corrections, Clarification and Revision Amendment Act
UDC University of the District of Columbia
USGBC U.S. Green Building Council
44 Green Building Report 2012
List of Appendices
Appendix A: 2013-2015 Work Plan
Appendix B: Green Building Advisory Council Appointees
Appendix C: LEED Certifications in the District, 2012
Appendix D: ENERGY STAR Rated Buildings, 2012
Appendix E: Public Projects, 2012
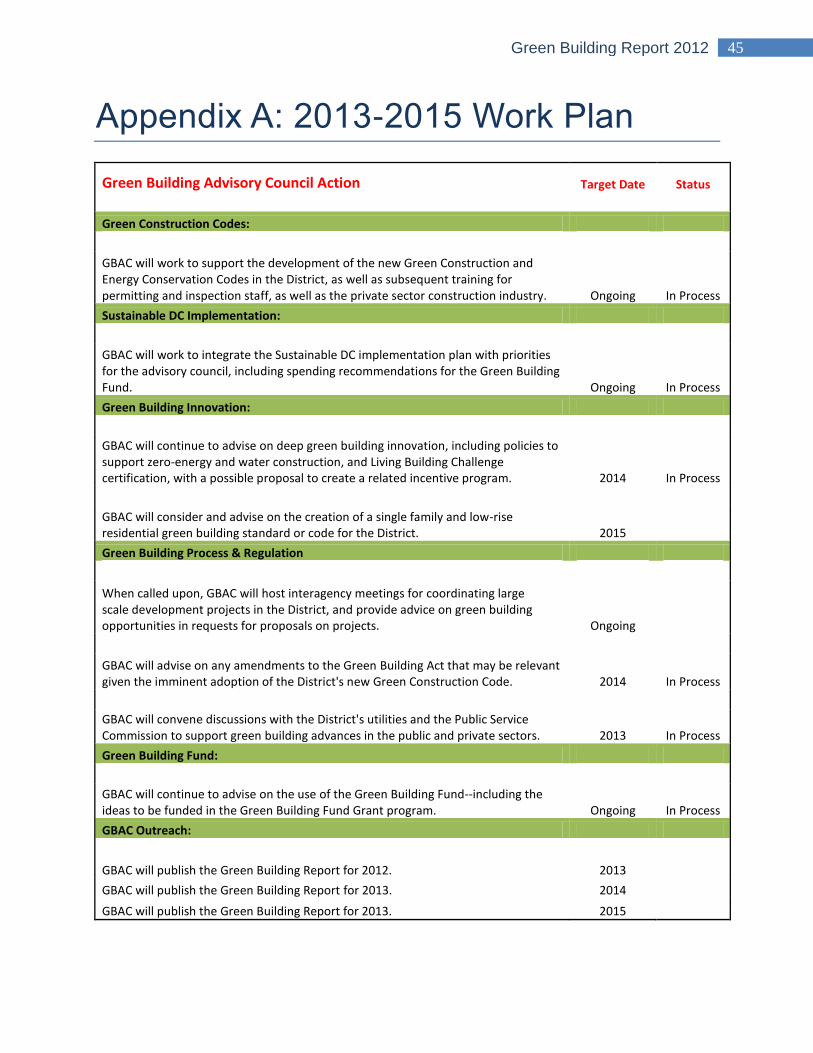
45 Green Building Report 2012
Appendix A: 2013-2015 Work Plan
Green Building Advisory Council Action Target Date Status
Green Construction Codes:
GBAC will work to support the development of the new Green Construction and Energy Conservation Codes in the District, as well as subsequent training for permitting and inspection staff, as well as the private sector construction industry. Ongoing In Process
Sustainable DC Implementation:
GBAC will work to integrate the Sustainable DC implementation plan with priorities for the advisory council, including spending recommendations for the Green Building Fund. Ongoing In Process
Green Building Innovation:
GBAC will continue to advise on deep green building innovation, including policies to support zero-energy and water construction, and Living Building Challenge certification, with a possible proposal to create a related incentive program. 2014 In Process
GBAC will consider and advise on the creation of a single family and low-rise residential green building standard or code for the District. 2015
Green Building Process & Regulation
When called upon, GBAC will host interagency meetings for coordinating large scale development projects in the District, and provide advice on green building opportunities in requests for proposals on projects. Ongoing
GBAC will advise on any amendments to the Green Building Act that may be relevant given the imminent adoption of the District's new Green Construction Code. 2014 In Process
GBAC will convene discussions with the District's utilities and the Public Service Commission to support green building advances in the public and private sectors. 2013 In Process
Green Building Fund:
GBAC will continue to advise on the use of the Green Building Fund--including the ideas to be funded in the Green Building Fund Grant program. Ongoing In Process
GBAC Outreach:
GBAC will publish the Green Building Report for 2012. 2013
GBAC will publish the Green Building Report for 2013. 2014
GBAC will publish the Green Building Report for 2013. 2015
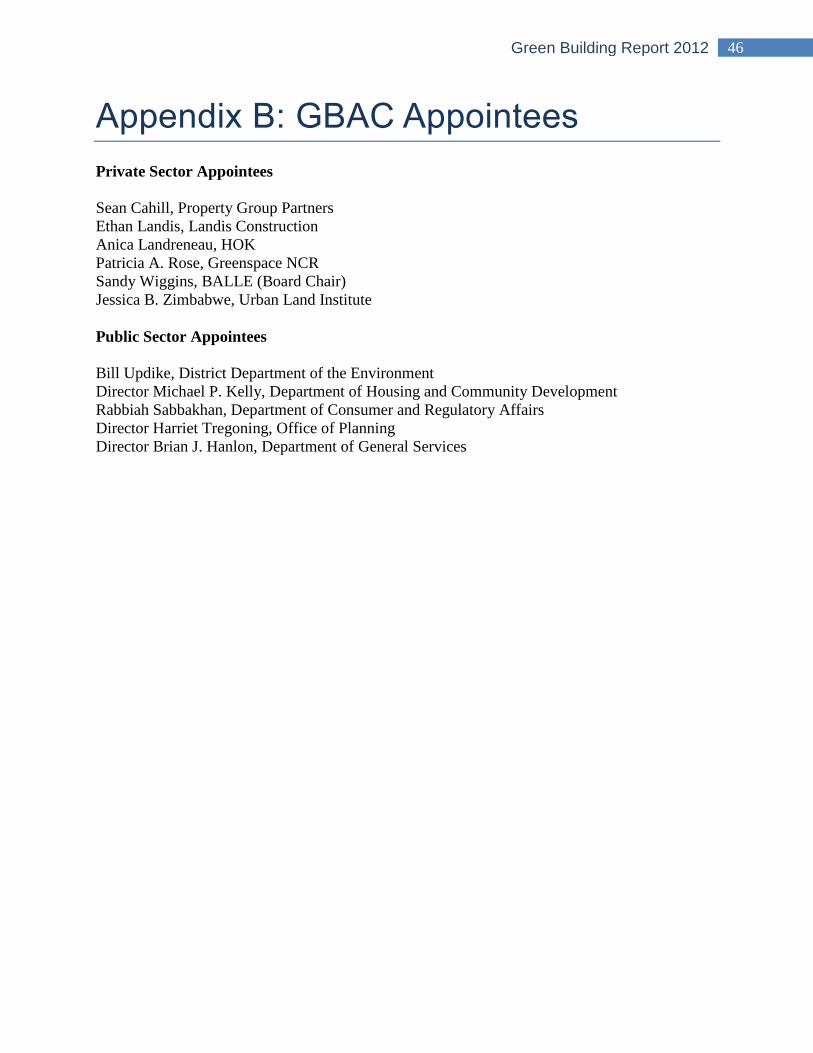
46 Green Building Report 2012
Appendix B: GBAC Appointees
Private Sector Appointees
Sean Cahill, Property Group Partners
Ethan Landis, Landis Construction
Anica Landreneau, HOK
Patricia A. Rose, Greenspace NCR
Sandy Wiggins, BALLE (Board Chair)
Jessica B. Zimbabwe, Urban Land Institute
Public Sector Appointees
Bill Updike, District Department of the Environment
Director Michael P. Kelly, Department of Housing and Community Development
Rabbiah Sabbakhan, Department of Consumer and Regulatory Affairs
Director Harriet Tregoning, Office of Planning
Director Brian J. Hanlon, Department of General Services
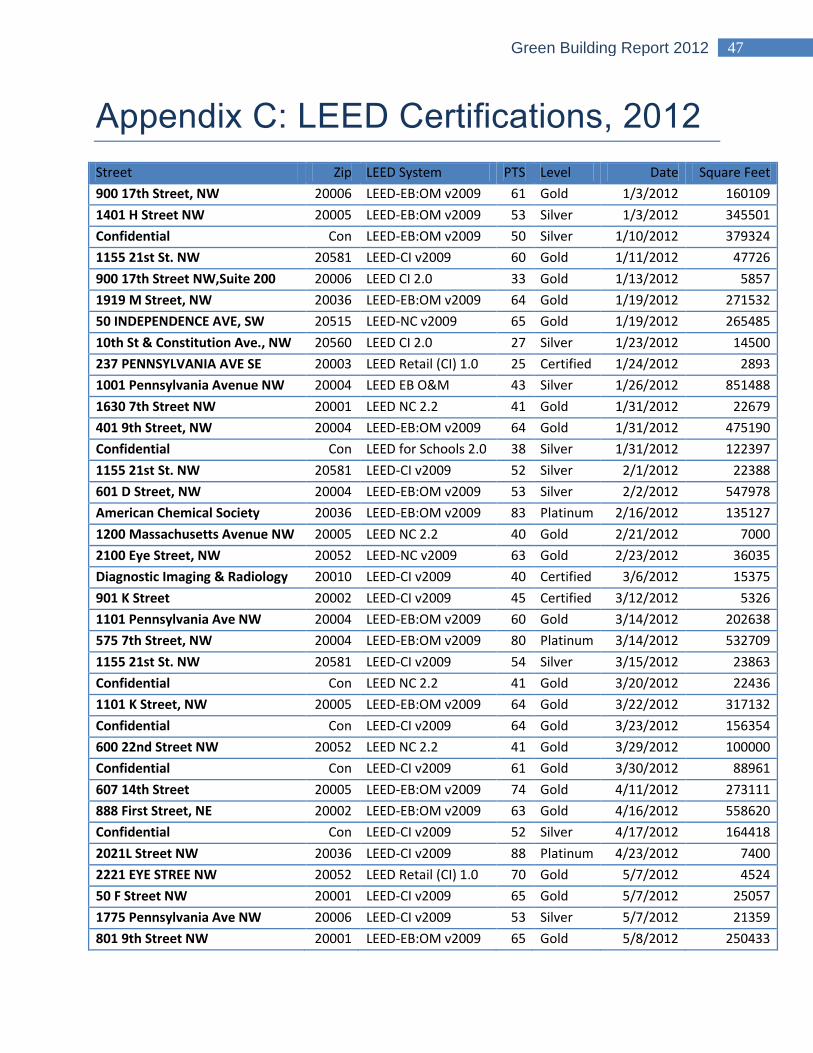
47 Green Building Report 2012
Appendix C: LEED Certifications, 2012
Street Zip LEED System PTS Level Date Square Feet
900 17th Street, NW 20006 LEED-EB:OM v2009 61 Gold 1/3/2012 160109
1401 H Street NW 20005 LEED-EB:OM v2009 53 Silver 1/3/2012 345501
Confidential Con LEED-EB:OM v2009 50 Silver 1/10/2012 379324
1155 21st St. NW 20581 LEED-CI v2009 60 Gold 1/11/2012 47726
900 17th Street NW,Suite 200 20006 LEED CI 2.0 33 Gold 1/13/2012 5857
1919 M Street, NW 20036 LEED-EB:OM v2009 64 Gold 1/19/2012 271532
50 INDEPENDENCE AVE, SW 20515 LEED-NC v2009 65 Gold 1/19/2012 265485
10th St & Constitution Ave., NW 20560 LEED CI 2.0 27 Silver 1/23/2012 14500
237 PENNSYLVANIA AVE SE 20003 LEED Retail (CI) 1.0 25 Certified 1/24/2012 2893
1001 Pennsylvania Avenue NW 20004 LEED EB O&M 43 Silver 1/26/2012 851488
1630 7th Street NW 20001 LEED NC 2.2 41 Gold 1/31/2012 22679
401 9th Street, NW 20004 LEED-EB:OM v2009 64 Gold 1/31/2012 475190
Confidential Con LEED for Schools 2.0 38 Silver 1/31/2012 122397
1155 21st St. NW 20581 LEED-CI v2009 52 Silver 2/1/2012 22388
601 D Street, NW 20004 LEED-EB:OM v2009 53 Silver 2/2/2012 547978
American Chemical Society 20036 LEED-EB:OM v2009 83 Platinum 2/16/2012 135127
1200 Massachusetts Avenue NW 20005 LEED NC 2.2 40 Gold 2/21/2012 7000
2100 Eye Street, NW 20052 LEED-NC v2009 63 Gold 2/23/2012 36035
Diagnostic Imaging & Radiology 20010 LEED-CI v2009 40 Certified 3/6/2012 15375
901 K Street 20002 LEED-CI v2009 45 Certified 3/12/2012 5326
1101 Pennsylvania Ave NW 20004 LEED-EB:OM v2009 60 Gold 3/14/2012 202638
575 7th Street, NW 20004 LEED-EB:OM v2009 80 Platinum 3/14/2012 532709
1155 21st St. NW 20581 LEED-CI v2009 54 Silver 3/15/2012 23863
Confidential Con LEED NC 2.2 41 Gold 3/20/2012 22436
1101 K Street, NW 20005 LEED-EB:OM v2009 64 Gold 3/22/2012 317132
Confidential Con LEED-CI v2009 64 Gold 3/23/2012 156354
600 22nd Street NW 20052 LEED NC 2.2 41 Gold 3/29/2012 100000
Confidential Con LEED-CI v2009 61 Gold 3/30/2012 88961
607 14th Street 20005 LEED-EB:OM v2009 74 Gold 4/11/2012 273111
888 First Street, NE 20002 LEED-EB:OM v2009 63 Gold 4/16/2012 558620
Confidential Con LEED-CI v2009 52 Silver 4/17/2012 164418
2021L Street NW 20036 LEED-CI v2009 88 Platinum 4/23/2012 7400
2221 EYE STREE NW 20052 LEED Retail (CI) 1.0 70 Gold 5/7/2012 4524
50 F Street NW 20001 LEED-CI v2009 65 Gold 5/7/2012 25057
1775 Pennsylvania Ave NW 20006 LEED-CI v2009 53 Silver 5/7/2012 21359
801 9th Street NW 20001 LEED-EB:OM v2009 65 Gold 5/8/2012 250433
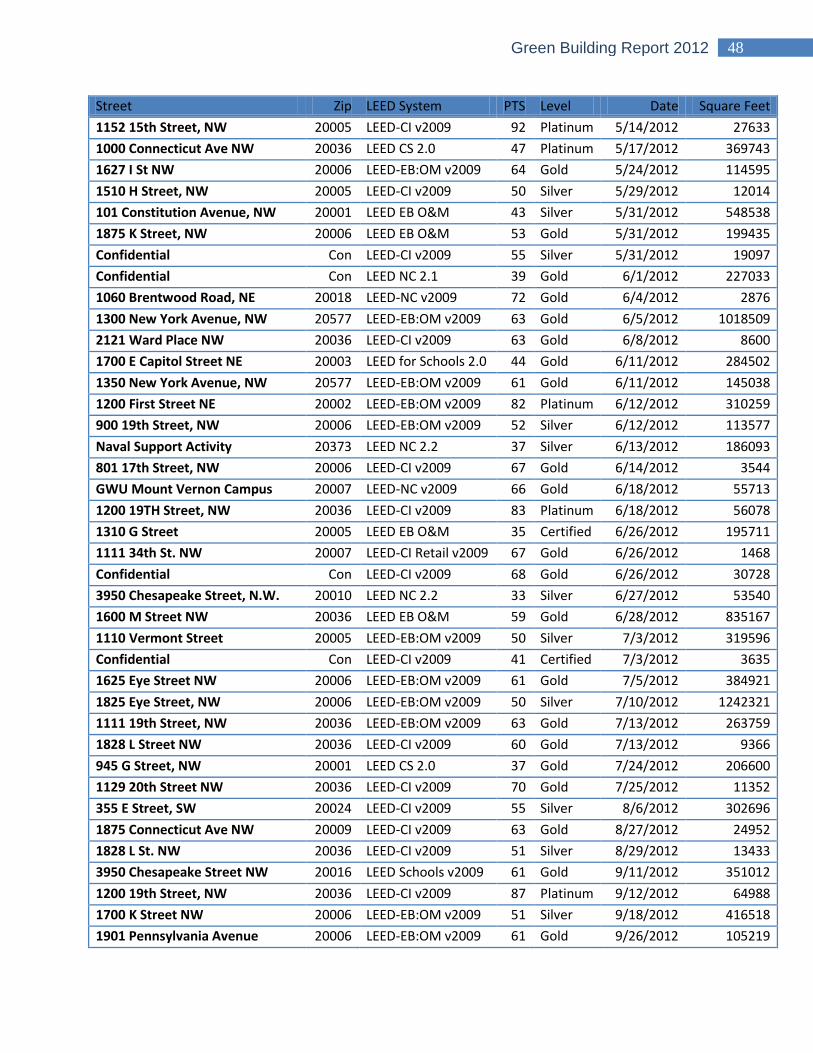
48 Green Building Report 2012
Street Zip LEED System PTS Level Date Square Feet
1152 15th Street, NW 20005 LEED-CI v2009 92 Platinum 5/14/2012 27633
1000 Connecticut Ave NW 20036 LEED CS 2.0 47 Platinum 5/17/2012 369743
1627 I St NW 20006 LEED-EB:OM v2009 64 Gold 5/24/2012 114595
1510 H Street, NW 20005 LEED-CI v2009 50 Silver 5/29/2012 12014
101 Constitution Avenue, NW 20001 LEED EB O&M 43 Silver 5/31/2012 548538
1875 K Street, NW 20006 LEED EB O&M 53 Gold 5/31/2012 199435
Confidential Con LEED-CI v2009 55 Silver 5/31/2012 19097
Confidential Con LEED NC 2.1 39 Gold 6/1/2012 227033
1060 Brentwood Road, NE 20018 LEED-NC v2009 72 Gold 6/4/2012 2876
1300 New York Avenue, NW 20577 LEED-EB:OM v2009 63 Gold 6/5/2012 1018509
2121 Ward Place NW 20036 LEED-CI v2009 63 Gold 6/8/2012 8600
1700 E Capitol Street NE 20003 LEED for Schools 2.0 44 Gold 6/11/2012 284502
1350 New York Avenue, NW 20577 LEED-EB:OM v2009 61 Gold 6/11/2012 145038
1200 First Street NE 20002 LEED-EB:OM v2009 82 Platinum 6/12/2012 310259
900 19th Street, NW 20006 LEED-EB:OM v2009 52 Silver 6/12/2012 113577
Naval Support Activity 20373 LEED NC 2.2 37 Silver 6/13/2012 186093
801 17th Street, NW 20006 LEED-CI v2009 67 Gold 6/14/2012 3544
GWU Mount Vernon Campus 20007 LEED-NC v2009 66 Gold 6/18/2012 55713
1200 19TH Street, NW 20036 LEED-CI v2009 83 Platinum 6/18/2012 56078
1310 G Street 20005 LEED EB O&M 35 Certified 6/26/2012 195711
1111 34th St. NW 20007 LEED-CI Retail v2009 67 Gold 6/26/2012 1468
Confidential Con LEED-CI v2009 68 Gold 6/26/2012 30728
3950 Chesapeake Street, N.W. 20010 LEED NC 2.2 33 Silver 6/27/2012 53540
1600 M Street NW 20036 LEED EB O&M 59 Gold 6/28/2012 835167
1110 Vermont Street 20005 LEED-EB:OM v2009 50 Silver 7/3/2012 319596
Confidential Con LEED-CI v2009 41 Certified 7/3/2012 3635
1625 Eye Street NW 20006 LEED-EB:OM v2009 61 Gold 7/5/2012 384921
1825 Eye Street, NW 20006 LEED-EB:OM v2009 50 Silver 7/10/2012 1242321
1111 19th Street, NW 20036 LEED-EB:OM v2009 63 Gold 7/13/2012 263759
1828 L Street NW 20036 LEED-CI v2009 60 Gold 7/13/2012 9366
945 G Street, NW 20001 LEED CS 2.0 37 Gold 7/24/2012 206600
1129 20th Street NW 20036 LEED-CI v2009 70 Gold 7/25/2012 11352
355 E Street, SW 20024 LEED-CI v2009 55 Silver 8/6/2012 302696
1875 Connecticut Ave NW 20009 LEED-CI v2009 63 Gold 8/27/2012 24952
1828 L St. NW 20036 LEED-CI v2009 51 Silver 8/29/2012 13433
3950 Chesapeake Street NW 20016 LEED Schools v2009 61 Gold 9/11/2012 351012
1200 19th Street, NW 20036 LEED-CI v2009 87 Platinum 9/12/2012 64988
1700 K Street NW 20006 LEED-EB:OM v2009 51 Silver 9/18/2012 416518
1901 Pennsylvania Avenue 20006 LEED-EB:OM v2009 61 Gold 9/26/2012 105219
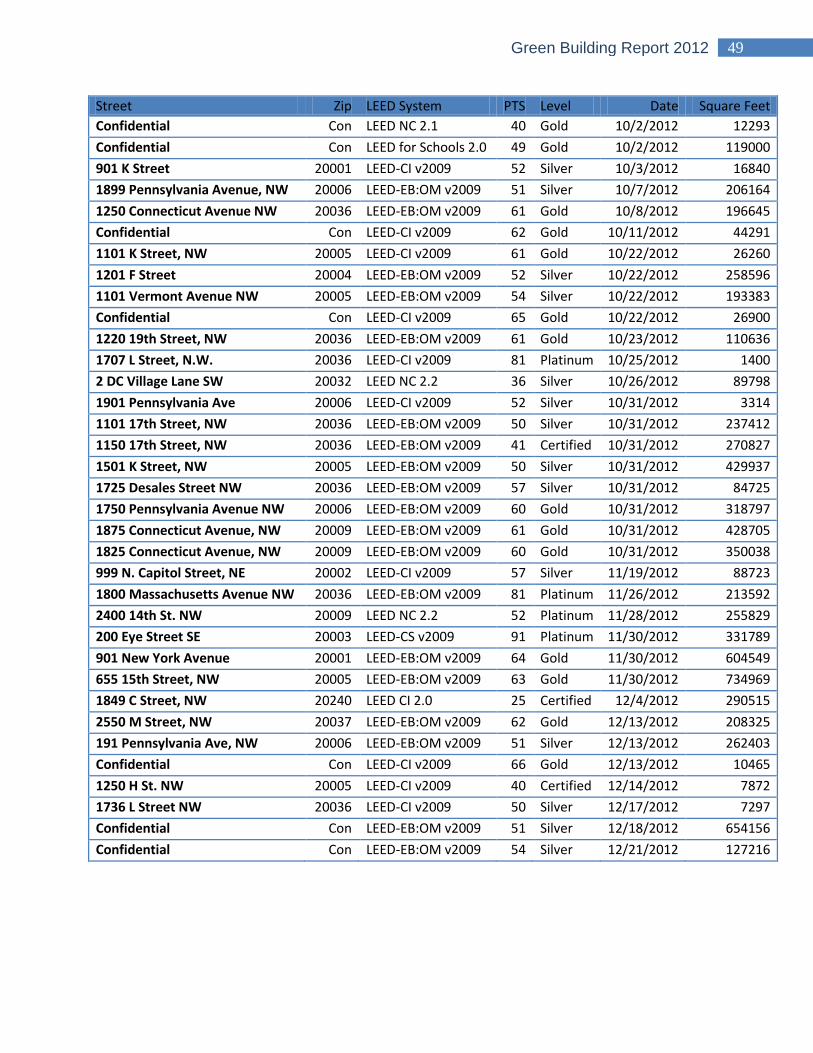
49 Green Building Report 2012
Street Zip LEED System PTS Level Date Square Feet
Confidential Con LEED NC 2.1 40 Gold 10/2/2012 12293
Confidential Con LEED for Schools 2.0 49 Gold 10/2/2012 119000
901 K Street 20001 LEED-CI v2009 52 Silver 10/3/2012 16840
1899 Pennsylvania Avenue, NW 20006 LEED-EB:OM v2009 51 Silver 10/7/2012 206164
1250 Connecticut Avenue NW 20036 LEED-EB:OM v2009 61 Gold 10/8/2012 196645
Confidential Con LEED-CI v2009 62 Gold 10/11/2012 44291
1101 K Street, NW 20005 LEED-CI v2009 61 Gold 10/22/2012 26260
1201 F Street 20004 LEED-EB:OM v2009 52 Silver 10/22/2012 258596
1101 Vermont Avenue NW 20005 LEED-EB:OM v2009 54 Silver 10/22/2012 193383
Confidential Con LEED-CI v2009 65 Gold 10/22/2012 26900
1220 19th Street, NW 20036 LEED-EB:OM v2009 61 Gold 10/23/2012 110636
1707 L Street, N.W. 20036 LEED-CI v2009 81 Platinum 10/25/2012 1400
2 DC Village Lane SW 20032 LEED NC 2.2 36 Silver 10/26/2012 89798
1901 Pennsylvania Ave 20006 LEED-CI v2009 52 Silver 10/31/2012 3314
1101 17th Street, NW 20036 LEED-EB:OM v2009 50 Silver 10/31/2012 237412
1150 17th Street, NW 20036 LEED-EB:OM v2009 41 Certified 10/31/2012 270827
1501 K Street, NW 20005 LEED-EB:OM v2009 50 Silver 10/31/2012 429937
1725 Desales Street NW 20036 LEED-EB:OM v2009 57 Silver 10/31/2012 84725
1750 Pennsylvania Avenue NW 20006 LEED-EB:OM v2009 60 Gold 10/31/2012 318797
1875 Connecticut Avenue, NW 20009 LEED-EB:OM v2009 61 Gold 10/31/2012 428705
1825 Connecticut Avenue, NW 20009 LEED-EB:OM v2009 60 Gold 10/31/2012 350038
999 N. Capitol Street, NE 20002 LEED-CI v2009 57 Silver 11/19/2012 88723
1800 Massachusetts Avenue NW 20036 LEED-EB:OM v2009 81 Platinum 11/26/2012 213592
2400 14th St. NW 20009 LEED NC 2.2 52 Platinum 11/28/2012 255829
200 Eye Street SE 20003 LEED-CS v2009 91 Platinum 11/30/2012 331789
901 New York Avenue 20001 LEED-EB:OM v2009 64 Gold 11/30/2012 604549
655 15th Street, NW 20005 LEED-EB:OM v2009 63 Gold 11/30/2012 734969
1849 C Street, NW 20240 LEED CI 2.0 25 Certified 12/4/2012 290515
2550 M Street, NW 20037 LEED-EB:OM v2009 62 Gold 12/13/2012 208325
191 Pennsylvania Ave, NW 20006 LEED-EB:OM v2009 51 Silver 12/13/2012 262403
Confidential Con LEED-CI v2009 66 Gold 12/13/2012 10465
1250 H St. NW 20005 LEED-CI v2009 40 Certified 12/14/2012 7872
1736 L Street NW 20036 LEED-CI v2009 50 Silver 12/17/2012 7297
Confidential Con LEED-EB:OM v2009 51 Silver 12/18/2012 654156
Confidential Con LEED-EB:OM v2009 54 Silver 12/21/2012 127216
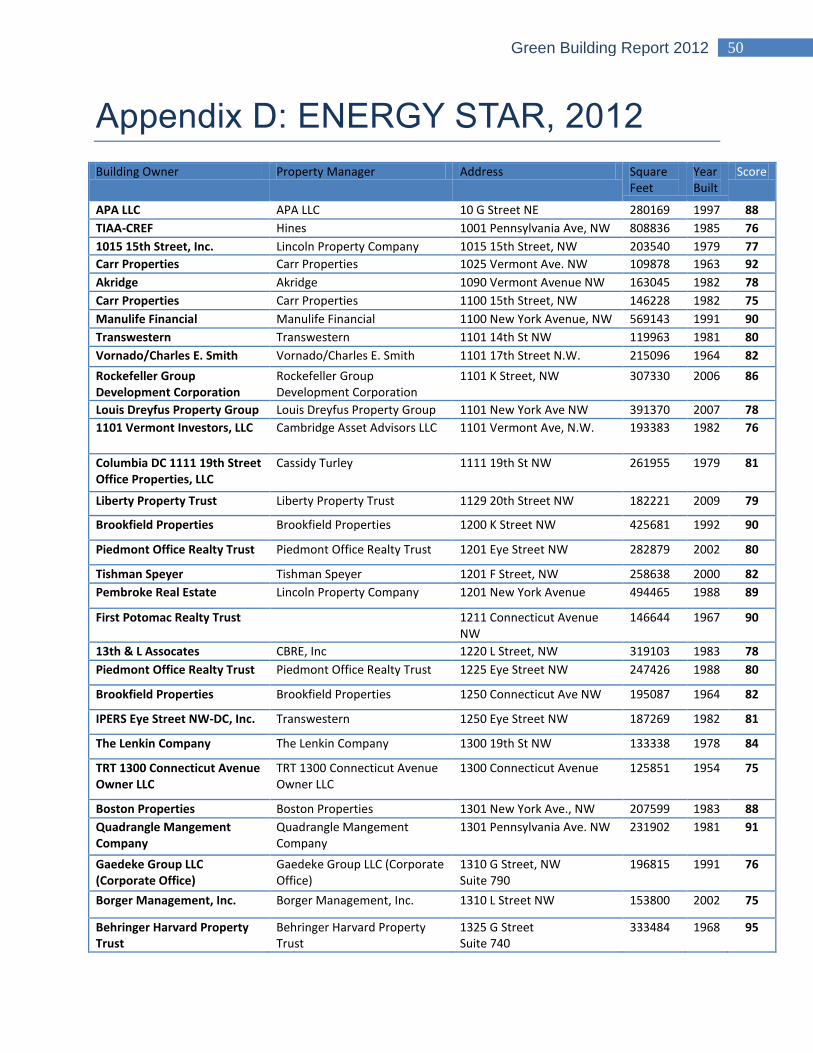
50 Green Building Report 2012
Appendix D: ENERGY STAR, 2012
Building Owner Property Manager Address Square Feet
Year Built
Score
APA LLC APA LLC 10 G Street NE 280169 1997 88
TIAA-CREF Hines 1001 Pennsylvania Ave, NW 808836 1985 76
1015 15th Street, Inc. Lincoln Property Company 1015 15th Street, NW 203540 1979 77
Carr Properties Carr Properties 1025 Vermont Ave. NW 109878 1963 92
Akridge Akridge 1090 Vermont Avenue NW 163045 1982 78
Carr Properties Carr Properties 1100 15th Street, NW 146228 1982 75
Manulife Financial Manulife Financial 1100 New York Avenue, NW 569143 1991 90
Transwestern Transwestern 1101 14th St NW 119963 1981 80
Vornado/Charles E. Smith Vornado/Charles E. Smith 1101 17th Street N.W. 215096 1964 82
Rockefeller Group Development Corporation
Rockefeller Group Development Corporation
1101 K Street, NW 307330 2006 86
Louis Dreyfus Property Group Louis Dreyfus Property Group 1101 New York Ave NW 391370 2007 78
1101 Vermont Investors, LLC Cambridge Asset Advisors LLC 1101 Vermont Ave, N.W. 193383 1982 76
Columbia DC 1111 19th Street Office Properties, LLC
Cassidy Turley 1111 19th St NW 261955 1979 81
Liberty Property Trust Liberty Property Trust 1129 20th Street NW 182221 2009 79
Brookfield Properties Brookfield Properties 1200 K Street NW 425681 1992 90
Piedmont Office Realty Trust Piedmont Office Realty Trust 1201 Eye Street NW 282879 2002 80
Tishman Speyer Tishman Speyer 1201 F Street, NW 258638 2000 82
Pembroke Real Estate Lincoln Property Company 1201 New York Avenue 494465 1988 89
First Potomac Realty Trust 1211 Connecticut Avenue NW
146644 1967 90
13th & L Assocates CBRE, Inc 1220 L Street, NW 319103 1983 78
Piedmont Office Realty Trust Piedmont Office Realty Trust 1225 Eye Street NW 247426 1988 80
Brookfield Properties Brookfield Properties 1250 Connecticut Ave NW 195087 1964 82
IPERS Eye Street NW-DC, Inc. Transwestern 1250 Eye Street NW 187269 1982 81
The Lenkin Company The Lenkin Company 1300 19th St NW 133338 1978 84
TRT 1300 Connecticut Avenue Owner LLC
TRT 1300 Connecticut Avenue Owner LLC
1300 Connecticut Avenue 125851 1954 75
Boston Properties Boston Properties 1301 New York Ave., NW 207599 1983 88
Quadrangle Mangement Company
Quadrangle Mangement Company
1301 Pennsylvania Ave. NW 231902 1981 91
Gaedeke Group LLC (Corporate Office)
Gaedeke Group LLC (Corporate Office)
1310 G Street, NW Suite 790
196815 1991 76
Borger Management, Inc. Borger Management, Inc. 1310 L Street NW 153800 2002 75
Behringer Harvard Property Trust
Behringer Harvard Property Trust
1325 G Street Suite 740
333484 1968 95
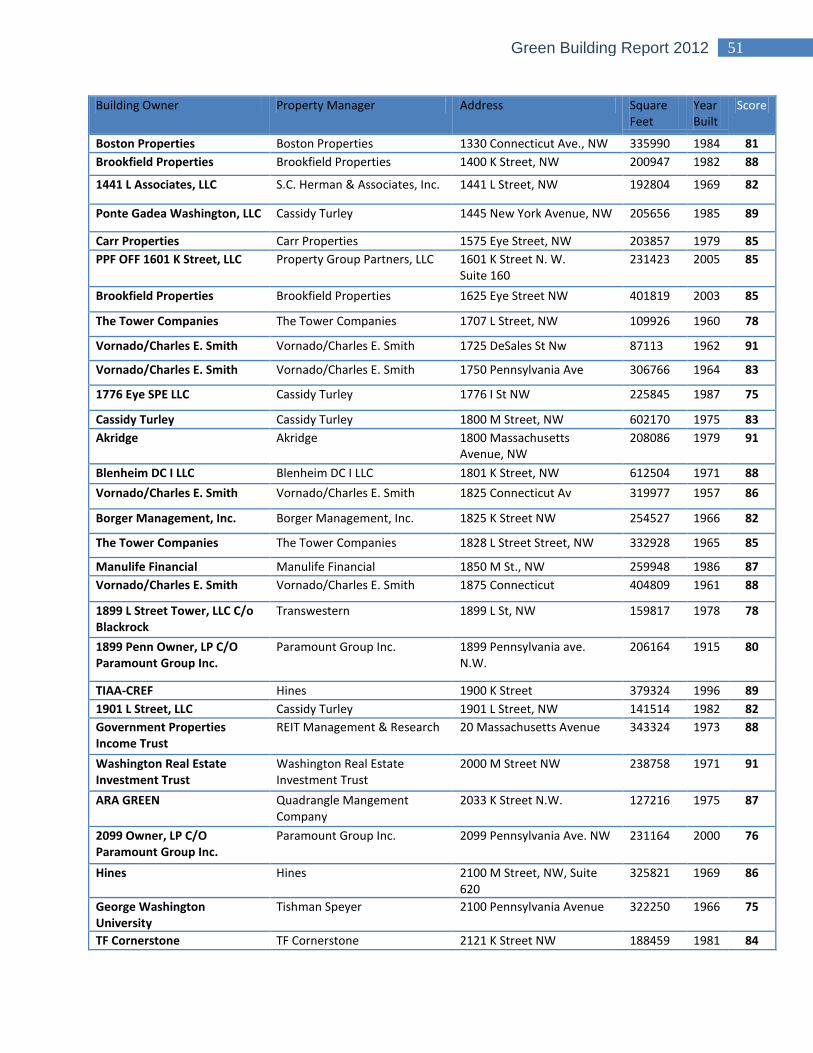
51 Green Building Report 2012
Building Owner Property Manager Address Square Feet
Year Built
Score
Boston Properties Boston Properties 1330 Connecticut Ave., NW 335990 1984 81
Brookfield Properties Brookfield Properties 1400 K Street, NW 200947 1982 88
1441 L Associates, LLC S.C. Herman & Associates, Inc. 1441 L Street, NW 192804 1969 82
Ponte Gadea Washington, LLC Cassidy Turley 1445 New York Avenue, NW 205656 1985 89
Carr Properties Carr Properties 1575 Eye Street, NW 203857 1979 85
PPF OFF 1601 K Street, LLC Property Group Partners, LLC 1601 K Street N. W. Suite 160
231423 2005 85
Brookfield Properties Brookfield Properties 1625 Eye Street NW 401819 2003 85
The Tower Companies The Tower Companies 1707 L Street, NW 109926 1960 78
Vornado/Charles E. Smith Vornado/Charles E. Smith 1725 DeSales St Nw 87113 1962 91
Vornado/Charles E. Smith Vornado/Charles E. Smith 1750 Pennsylvania Ave 306766 1964 83
1776 Eye SPE LLC Cassidy Turley 1776 I St NW 225845 1987 75
Cassidy Turley Cassidy Turley 1800 M Street, NW 602170 1975 83
Akridge Akridge 1800 Massachusetts Avenue, NW
208086 1979 91
Blenheim DC I LLC Blenheim DC I LLC 1801 K Street, NW 612504 1971 88
Vornado/Charles E. Smith Vornado/Charles E. Smith 1825 Connecticut Av 319977 1957 86
Borger Management, Inc. Borger Management, Inc. 1825 K Street NW 254527 1966 82
The Tower Companies The Tower Companies 1828 L Street Street, NW 332928 1965 85
Manulife Financial Manulife Financial 1850 M St., NW 259948 1986 87
Vornado/Charles E. Smith Vornado/Charles E. Smith 1875 Connecticut 404809 1961 88
1899 L Street Tower, LLC C/o Blackrock
Transwestern 1899 L St, NW 159817 1978 78
1899 Penn Owner, LP C/O Paramount Group Inc.
Paramount Group Inc. 1899 Pennsylvania ave. N.W.
206164 1915 80
TIAA-CREF Hines 1900 K Street 379324 1996 89
1901 L Street, LLC Cassidy Turley 1901 L Street, NW 141514 1982 82
Government Properties Income Trust
REIT Management & Research 20 Massachusetts Avenue 343324 1973 88
Washington Real Estate Investment Trust
Washington Real Estate Investment Trust
2000 M Street NW 238758 1971 91
ARA GREEN Quadrangle Mangement Company
2033 K Street N.W. 127216 1975 87
2099 Owner, LP C/O Paramount Group Inc.
Paramount Group Inc. 2099 Pennsylvania Ave. NW 231164 2000 76
Hines Hines 2100 M Street, NW, Suite 620
325821 1969 86
George Washington University
Tishman Speyer 2100 Pennsylvania Avenue 322250 1966 75
TF Cornerstone TF Cornerstone 2121 K Street NW 188459 1981 84
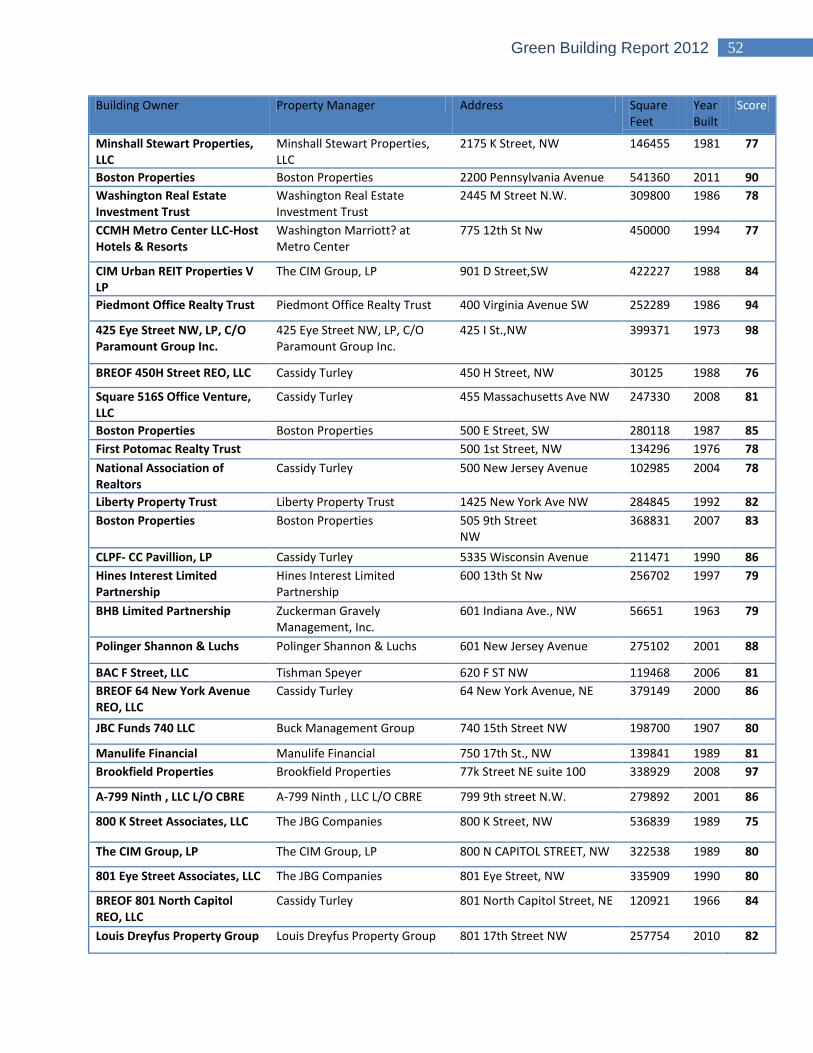
52 Green Building Report 2012
Building Owner Property Manager Address Square Feet
Year Built
Score
Minshall Stewart Properties, LLC
Minshall Stewart Properties, LLC
2175 K Street, NW 146455 1981 77
Boston Properties Boston Properties 2200 Pennsylvania Avenue 541360 2011 90
Washington Real Estate Investment Trust
Washington Real Estate Investment Trust
2445 M Street N.W. 309800 1986 78
CCMH Metro Center LLC-Host Hotels & Resorts
Washington Marriott? at Metro Center
775 12th St Nw 450000 1994 77
CIM Urban REIT Properties V LP
The CIM Group, LP 901 D Street,SW 422227 1988 84
Piedmont Office Realty Trust Piedmont Office Realty Trust 400 Virginia Avenue SW 252289 1986 94
425 Eye Street NW, LP, C/O Paramount Group Inc.
425 Eye Street NW, LP, C/O Paramount Group Inc.
425 I St.,NW 399371 1973 98
BREOF 450H Street REO, LLC Cassidy Turley 450 H Street, NW 30125 1988 76
Square 516S Office Venture, LLC
Cassidy Turley 455 Massachusetts Ave NW 247330 2008 81
Boston Properties Boston Properties 500 E Street, SW 280118 1987 85
First Potomac Realty Trust 500 1st Street, NW 134296 1976 78
National Association of Realtors
Cassidy Turley 500 New Jersey Avenue 102985 2004 78
Liberty Property Trust Liberty Property Trust 1425 New York Ave NW 284845 1992 82
Boston Properties Boston Properties 505 9th Street NW
368831 2007 83
CLPF- CC Pavillion, LP Cassidy Turley 5335 Wisconsin Avenue 211471 1990 86
Hines Interest Limited Partnership
Hines Interest Limited Partnership
600 13th St Nw 256702 1997 79
BHB Limited Partnership Zuckerman Gravely Management, Inc.
601 Indiana Ave., NW 56651 1963 79
Polinger Shannon & Luchs Polinger Shannon & Luchs 601 New Jersey Avenue 275102 2001 88
BAC F Street, LLC Tishman Speyer 620 F ST NW 119468 2006 81
BREOF 64 New York Avenue REO, LLC
Cassidy Turley 64 New York Avenue, NE 379149 2000 86
JBC Funds 740 LLC Buck Management Group 740 15th Street NW 198700 1907 80
Manulife Financial Manulife Financial 750 17th St., NW 139841 1989 81
Brookfield Properties Brookfield Properties 77k Street NE suite 100 338929 2008 97
A-799 Ninth , LLC L/O CBRE A-799 Ninth , LLC L/O CBRE 799 9th street N.W. 279892 2001 86
800 K Street Associates, LLC The JBG Companies 800 K Street, NW 536839 1989 75
The CIM Group, LP The CIM Group, LP 800 N CAPITOL STREET, NW 322538 1989 80
801 Eye Street Associates, LLC The JBG Companies 801 Eye Street, NW 335909 1990 80
BREOF 801 North Capitol REO, LLC
Cassidy Turley 801 North Capitol Street, NE 120921 1966 84
Louis Dreyfus Property Group Louis Dreyfus Property Group 801 17th Street NW 257754 2010 82
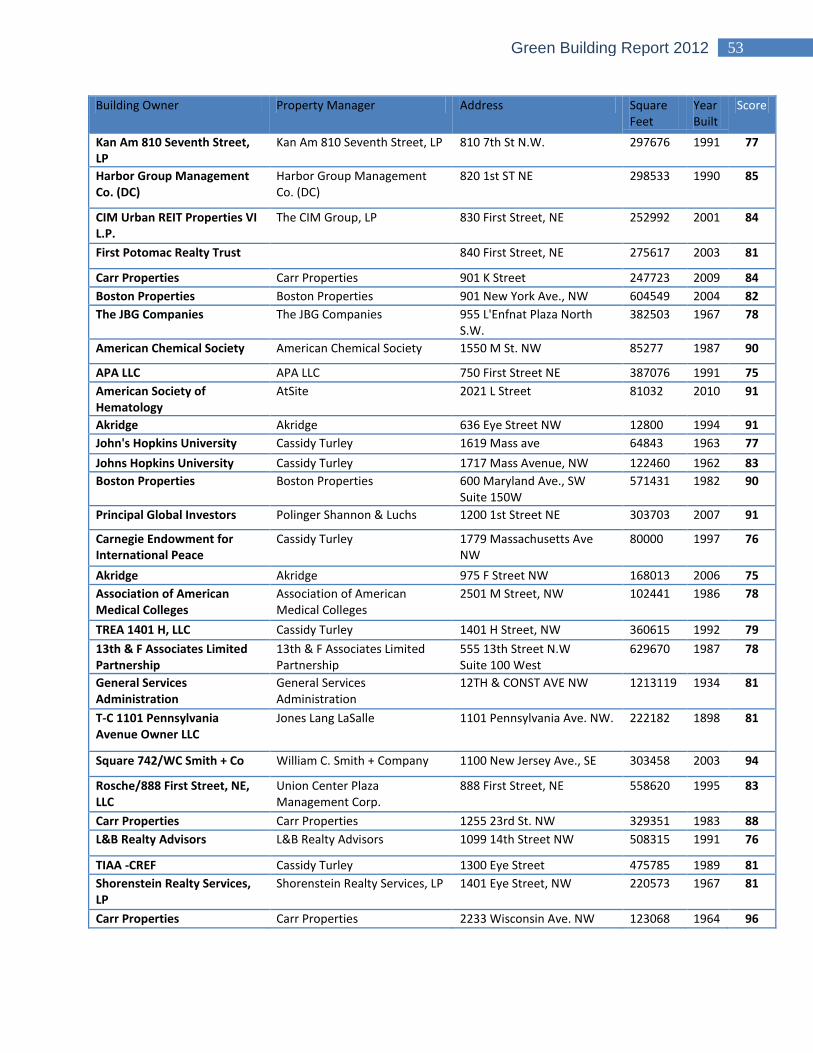
53 Green Building Report 2012
Building Owner Property Manager Address Square Feet
Year Built
Score
Kan Am 810 Seventh Street, LP
Kan Am 810 Seventh Street, LP 810 7th St N.W. 297676 1991 77
Harbor Group Management Co. (DC)
Harbor Group Management Co. (DC)
820 1st ST NE 298533 1990 85
CIM Urban REIT Properties VI L.P.
The CIM Group, LP 830 First Street, NE 252992 2001 84
First Potomac Realty Trust 840 First Street, NE 275617 2003 81
Carr Properties Carr Properties 901 K Street 247723 2009 84
Boston Properties Boston Properties 901 New York Ave., NW 604549 2004 82
The JBG Companies The JBG Companies 955 L'Enfnat Plaza North S.W.
382503 1967 78
American Chemical Society American Chemical Society 1550 M St. NW 85277 1987 90
APA LLC APA LLC 750 First Street NE 387076 1991 75
American Society of Hematology
AtSite 2021 L Street 81032 2010 91
Akridge Akridge 636 Eye Street NW 12800 1994 91
John's Hopkins University Cassidy Turley 1619 Mass ave 64843 1963 77
Johns Hopkins University Cassidy Turley 1717 Mass Avenue, NW 122460 1962 83
Boston Properties Boston Properties 600 Maryland Ave., SW Suite 150W
571431 1982 90
Principal Global Investors Polinger Shannon & Luchs 1200 1st Street NE 303703 2007 91
Carnegie Endowment for International Peace
Cassidy Turley 1779 Massachusetts Ave NW
80000 1997 76
Akridge Akridge 975 F Street NW 168013 2006 75
Association of American Medical Colleges
Association of American Medical Colleges
2501 M Street, NW 102441 1986 78
TREA 1401 H, LLC Cassidy Turley 1401 H Street, NW 360615 1992 79
13th & F Associates Limited Partnership
13th & F Associates Limited Partnership
555 13th Street N.W Suite 100 West
629670 1987 78
General Services Administration
General Services Administration
12TH & CONST AVE NW 1213119 1934 81
T-C 1101 Pennsylvania Avenue Owner LLC
Jones Lang LaSalle 1101 Pennsylvania Ave. NW. 222182 1898 81
Square 742/WC Smith + Co William C. Smith + Company 1100 New Jersey Ave., SE 303458 2003 94
Rosche/888 First Street, NE, LLC
Union Center Plaza Management Corp.
888 First Street, NE 558620 1995 83
Carr Properties Carr Properties 1255 23rd St. NW 329351 1983 88
L&B Realty Advisors L&B Realty Advisors 1099 14th Street NW 508315 1991 76
TIAA -CREF Cassidy Turley 1300 Eye Street 475785 1989 81
Shorenstein Realty Services, LP
Shorenstein Realty Services, LP 1401 Eye Street, NW 220573 1967 81
Carr Properties Carr Properties 2233 Wisconsin Ave. NW 123068 1964 96
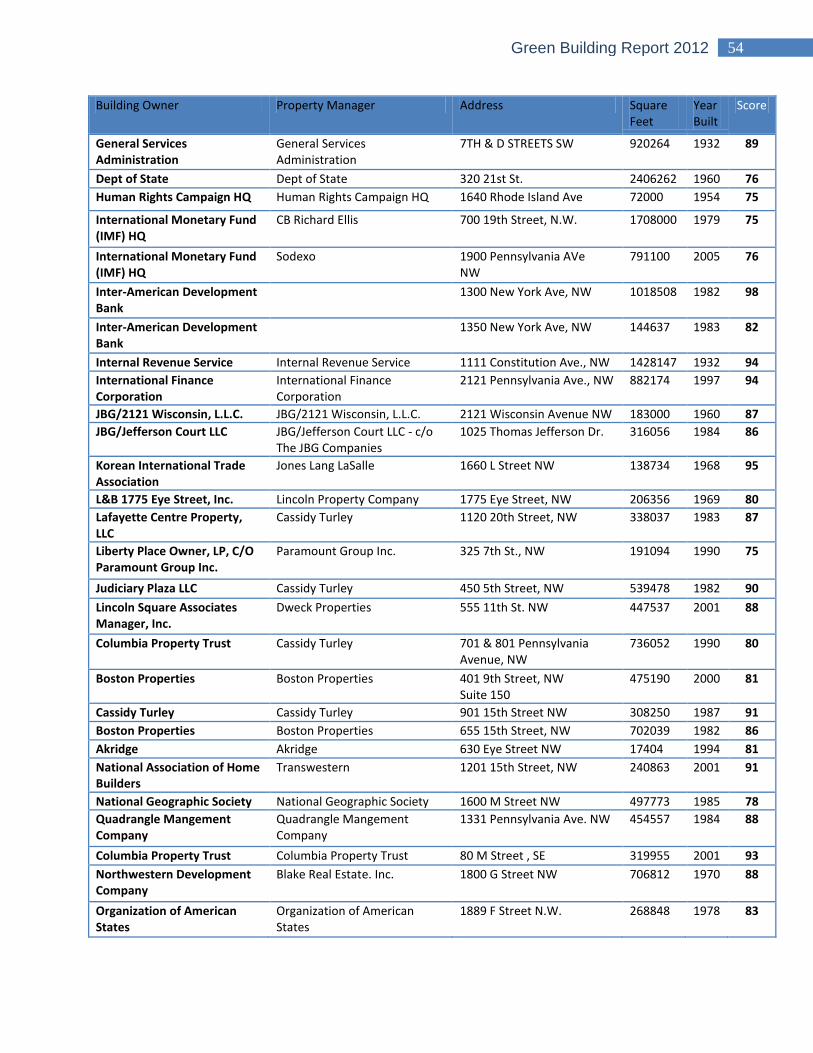
54 Green Building Report 2012
Building Owner Property Manager Address Square Feet
Year Built
Score
General Services Administration
General Services Administration
7TH & D STREETS SW 920264 1932 89
Dept of State Dept of State 320 21st St. 2406262 1960 76
Human Rights Campaign HQ Human Rights Campaign HQ 1640 Rhode Island Ave 72000 1954 75
International Monetary Fund (IMF) HQ
CB Richard Ellis 700 19th Street, N.W. 1708000 1979 75
International Monetary Fund (IMF) HQ
Sodexo 1900 Pennsylvania AVe NW
791100 2005 76
Inter-American Development Bank
1300 New York Ave, NW 1018508 1982 98
Inter-American Development Bank
1350 New York Ave, NW 144637 1983 82
Internal Revenue Service Internal Revenue Service 1111 Constitution Ave., NW 1428147 1932 94
International Finance Corporation
International Finance Corporation
2121 Pennsylvania Ave., NW 882174 1997 94
JBG/2121 Wisconsin, L.L.C. JBG/2121 Wisconsin, L.L.C. 2121 Wisconsin Avenue NW 183000 1960 87
JBG/Jefferson Court LLC JBG/Jefferson Court LLC - c/o The JBG Companies
1025 Thomas Jefferson Dr. 316056 1984 86
Korean International Trade Association
Jones Lang LaSalle 1660 L Street NW 138734 1968 95
L&B 1775 Eye Street, Inc. Lincoln Property Company 1775 Eye Street, NW 206356 1969 80
Lafayette Centre Property, LLC
Cassidy Turley 1120 20th Street, NW 338037 1983 87
Liberty Place Owner, LP, C/O Paramount Group Inc.
Paramount Group Inc. 325 7th St., NW 191094 1990 75
Judiciary Plaza LLC Cassidy Turley 450 5th Street, NW 539478 1982 90
Lincoln Square Associates Manager, Inc.
Dweck Properties 555 11th St. NW 447537 2001 88
Columbia Property Trust Cassidy Turley 701 & 801 Pennsylvania Avenue, NW
736052 1990 80
Boston Properties Boston Properties 401 9th Street, NW Suite 150
475190 2000 81
Cassidy Turley Cassidy Turley 901 15th Street NW 308250 1987 91
Boston Properties Boston Properties 655 15th Street, NW 702039 1982 86
Akridge Akridge 630 Eye Street NW 17404 1994 81
National Association of Home Builders
Transwestern 1201 15th Street, NW 240863 2001 91
National Geographic Society National Geographic Society 1600 M Street NW 497773 1985 78
Quadrangle Mangement Company
Quadrangle Mangement Company
1331 Pennsylvania Ave. NW 454557 1984 88
Columbia Property Trust Columbia Property Trust 80 M Street , SE 319955 2001 93
Northwestern Development Company
Blake Real Estate. Inc. 1800 G Street NW 706812 1970 88
Organization of American States
Organization of American States
1889 F Street N.W. 268848 1978 83
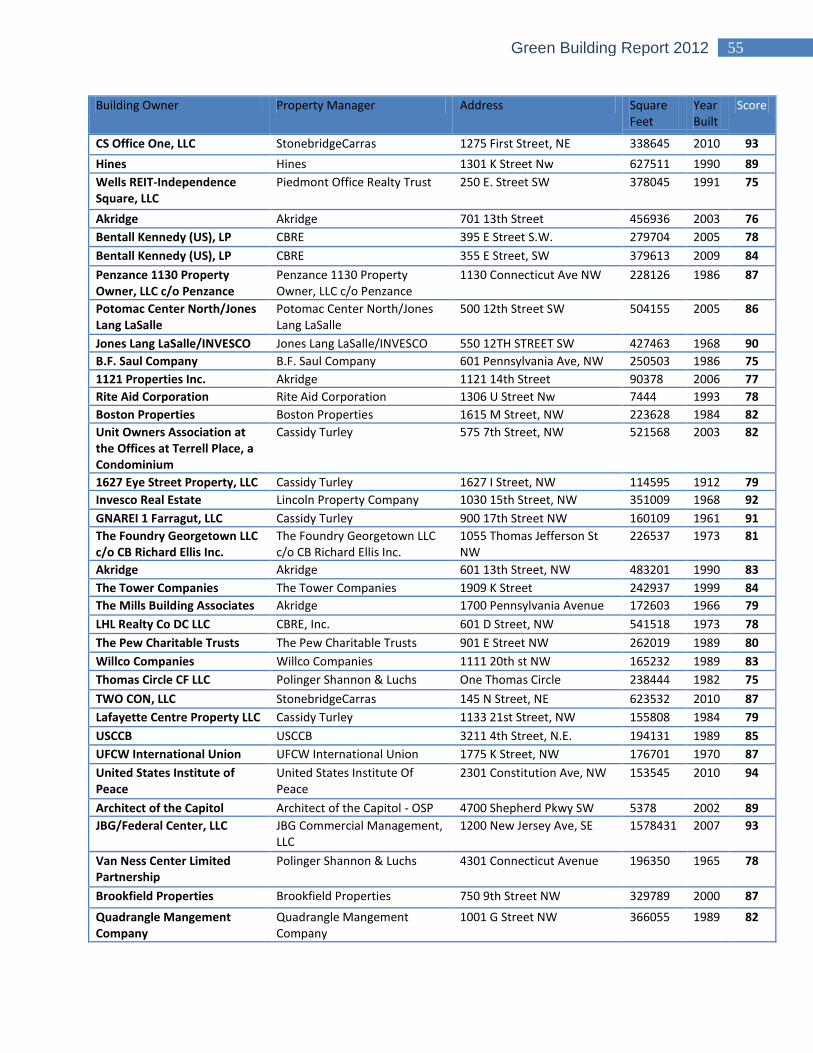
55 Green Building Report 2012
Building Owner Property Manager Address Square Feet
Year Built
Score
CS Office One, LLC StonebridgeCarras 1275 First Street, NE 338645 2010 93
Hines Hines 1301 K Street Nw 627511 1990 89
Wells REIT-Independence Square, LLC
Piedmont Office Realty Trust 250 E. Street SW 378045 1991 75
Akridge Akridge 701 13th Street 456936 2003 76
Bentall Kennedy (US), LP CBRE 395 E Street S.W. 279704 2005 78
Bentall Kennedy (US), LP CBRE 355 E Street, SW 379613 2009 84
Penzance 1130 Property Owner, LLC c/o Penzance
Penzance 1130 Property Owner, LLC c/o Penzance
1130 Connecticut Ave NW 228126 1986 87
Potomac Center North/Jones Lang LaSalle
Potomac Center North/Jones Lang LaSalle
500 12th Street SW 504155 2005 86
Jones Lang LaSalle/INVESCO Jones Lang LaSalle/INVESCO 550 12TH STREET SW 427463 1968 90
B.F. Saul Company B.F. Saul Company 601 Pennsylvania Ave, NW 250503 1986 75
1121 Properties Inc. Akridge 1121 14th Street 90378 2006 77
Rite Aid Corporation Rite Aid Corporation 1306 U Street Nw 7444 1993 78
Boston Properties Boston Properties 1615 M Street, NW 223628 1984 82
Unit Owners Association at the Offices at Terrell Place, a Condominium
Cassidy Turley 575 7th Street, NW 521568 2003 82
1627 Eye Street Property, LLC Cassidy Turley 1627 I Street, NW 114595 1912 79
Invesco Real Estate Lincoln Property Company 1030 15th Street, NW 351009 1968 92
GNAREI 1 Farragut, LLC Cassidy Turley 900 17th Street NW 160109 1961 91
The Foundry Georgetown LLC c/o CB Richard Ellis Inc.
The Foundry Georgetown LLC c/o CB Richard Ellis Inc.
1055 Thomas Jefferson St NW
226537 1973 81
Akridge Akridge 601 13th Street, NW 483201 1990 83
The Tower Companies The Tower Companies 1909 K Street 242937 1999 84
The Mills Building Associates Akridge 1700 Pennsylvania Avenue 172603 1966 79
LHL Realty Co DC LLC CBRE, Inc. 601 D Street, NW 541518 1973 78
The Pew Charitable Trusts The Pew Charitable Trusts 901 E Street NW 262019 1989 80
Willco Companies Willco Companies 1111 20th st NW 165232 1989 83
Thomas Circle CF LLC Polinger Shannon & Luchs One Thomas Circle 238444 1982 75
TWO CON, LLC StonebridgeCarras 145 N Street, NE 623532 2010 87
Lafayette Centre Property LLC Cassidy Turley 1133 21st Street, NW 155808 1984 79
USCCB USCCB 3211 4th Street, N.E. 194131 1989 85
UFCW International Union UFCW International Union 1775 K Street, NW 176701 1970 87
United States Institute of Peace
United States Institute Of Peace
2301 Constitution Ave, NW 153545 2010 94
Architect of the Capitol Architect of the Capitol - OSP 4700 Shepherd Pkwy SW 5378 2002 89
JBG/Federal Center, LLC JBG Commercial Management, LLC
1200 New Jersey Ave, SE 1578431 2007 93
Van Ness Center Limited Partnership
Polinger Shannon & Luchs 4301 Connecticut Avenue 196350 1965 78
Brookfield Properties Brookfield Properties 750 9th Street NW 329789 2000 87
Quadrangle Mangement Company
Quadrangle Mangement Company
1001 G Street NW 366055 1989 82
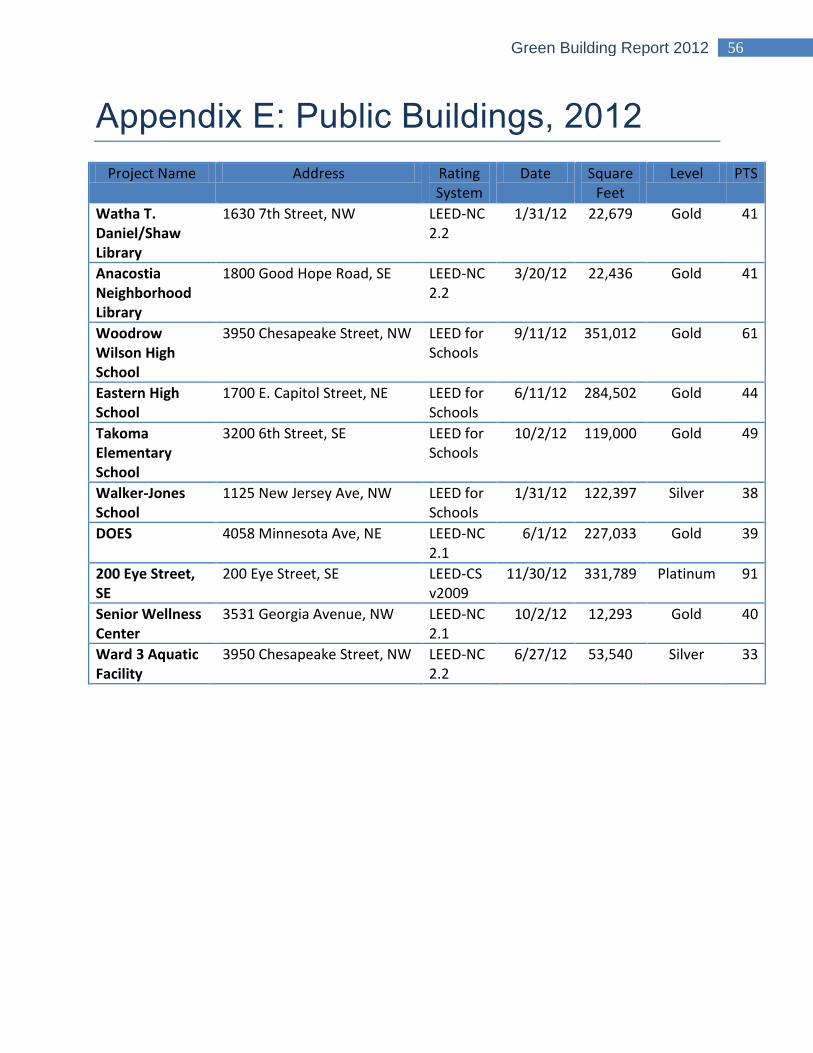
56 Green Building Report 2012
Appendix E: Public Buildings, 2012
Project Name Address Rating System
Date Square Feet
Level PTS
Watha T. Daniel/Shaw Library
1630 7th Street, NW LEED-NC 2.2
1/31/12 22,679 Gold 41
Anacostia Neighborhood Library
1800 Good Hope Road, SE LEED-NC 2.2
3/20/12 22,436 Gold 41
Woodrow Wilson High School
3950 Chesapeake Street, NW LEED for Schools
9/11/12 351,012 Gold 61
Eastern High School
1700 E. Capitol Street, NE LEED for Schools
6/11/12 284,502 Gold 44
Takoma Elementary School
3200 6th Street, SE LEED for Schools
10/2/12 119,000 Gold 49
Walker-Jones School
1125 New Jersey Ave, NW LEED for Schools
1/31/12 122,397 Silver 38
DOES 4058 Minnesota Ave, NE LEED-NC 2.1
6/1/12 227,033 Gold 39
200 Eye Street, SE
200 Eye Street, SE LEED-CS v2009
11/30/12 331,789 Platinum 91
Senior Wellness Center
3531 Georgia Avenue, NW LEED-NC 2.1
10/2/12 12,293 Gold 40
Ward 3 Aquatic Facility
3950 Chesapeake Street, NW LEED-NC 2.2
6/27/12 53,540 Silver 33