Geothermal Development in Oguni, Central Kyushu Development in Oguni, Central Kyushu Toshiyuki...
10
PROCEEDINGS, 43rd Workshop on Geothermal Reservoir Engineering Stanford University, Stanford, California, February 12-14, 2018 SGP-TR-213 1 Geothermal Development in Oguni, Central Kyushu Toshiyuki Tosha 1 , Yoshiharu Kida 2 , Yuzo Obara 1 , Tomohiro Yamazaki 2 , Hidehisa Watanabe 2 1 Kumamoto University, Kurokami2-39-1, Chuo, Kumamoto, 860-8555, JAPAN 2 Japan Oil Gas and Metals National Corporation, 2-10-1 Toranomon, Minato, 105-0001, JAPAN 2 Mitsui Mineral Development Engineering Co. Ltd, Osaki1-11-1, Shinagawa, 141-0032, JAPAN [email protected], [email protected], [email protected], [email protected], [email protected] Keywords: Country report, Kyushu, Airborne Survey, Gravity gradient, Variogram, SI index ABSTRACT The development of renewable energy is expected against not only the global warming but also the disaster of nuclear power plant. METI announced an energy policy and showed a plan of the electricity generation for each energy in 2030. Geothermal energy is desired to install power generation more than 1,500MW under this new policy, which is almost three times of the current installed capacity. Deregulation is being conducted for the development in national parks and many developers are carrying out surveys to find out a new geothermal field and complete the policy. However, achievement of the political goal is so high. The Oguni geothermal field is located in the Kumamoto prefecture, central Kyushu Island, near the Okake and the Hacchobaru Geothermal Power Plants. EPDC (Electric Power Development Co. Ltd, currently J-Power) started to develop in 1983 and evaluated the geothermal potential in the geothermal field. They planned to construct a geothermal power plant with an install capacity of 20MW. In 2002 EPDC resigned the development because of disagreement of few local people for the development. Since then no plan to develop was discussed. In 2015 a small power plant with the capacity of 2MW was installed and gain momentum to construct a bigger power plant. There is, however, no estimation of the additional power generation after the operation of the 2MW power plant and there is no answer to the question whether there is still resource for 20MW electricity generation. We have reviewed models in the Oguni geothermal field and construct a new model covered larger area to answer the question. 1. INTRODUCTION Geothermal energy is environmentally harmonized energy resource and the recognition is widely known and accepted. There are, however, various obstacles against its development in Japan. In particular, there are said to be three major obstacles in Japan. The first obstacle is geothermal energy taking long time to be developed and the second is national parks where development is restricted very much although a lot of resources exist. The last one is the opposite opinions of local residents. There are many cases where local residents cannot understand the meaning of the development and warry about the depletion of the hot water supply in their hot springs. This last obstacle is often caused by "hot spring" culture which is the unique culture of in Japan. In promoting geothermal development, the opposite opinion that the development affects the serious damage against the hot springs often happens outside of the developing area and it sometimes cause the suspension of the development. It is undeniable that lack of such risk communication has caused the background of discontinuation of development by EPDC in Oguni. Since it is impossible to grasp the exact influence of the underground in development in current science, monitoring of temperature, water level, geochemical components and so on is necessary to carry out at hot springs around the developing area where the influence is concerned in development. If the influence becomes noticeable, we have to discuss on the development. Taking monitoring and discussing on the data is fundamental to gain understanding of the local residents. On the other hand, for the other two obstacles, it is no longer impediment factors in the development of geothermal resources by the enhancement of subsidies by public funds and the deregulation in the natural parks. Survey in a wide area is often required in the geothermal energy development. In the past, investigation was common at the ground surface and it was extremely difficult to study in a wide area with a uniform specification and it was impossible to carry out the survey in the national park. The survey in the national park becomes possible due to the deregulation. Currently, airborne survey by an aircraft and a helicopter can be promoted (JOGMEC, 2015, 2016; Tosha et al., 2015, 2017). Extensive survey including the nation park will becomes necessary. In this report, we introduce the recent survey result and describe he current state of development in Oguni region in Kumamoto. 2. RECENT GEOTHERMAL ENERGY DEVELOPMENT IN JAPAN 2.1 Global warming After the Industrial Revolution in the eighteenth century, emission of Greenhouse gases (GHGs) to the atmosphere is increasing by the rapid increase of the fossil energy use. This increase of the emission caused environmental problems, the global warming. Mitigation against the global warming consists of several actions, which limit the long-term human emission of GHGs in magnitude and in rate.
Transcript of Geothermal Development in Oguni, Central Kyushu Development in Oguni, Central Kyushu Toshiyuki...
PROCEEDINGS, 43rd Workshop on Geothermal Reservoir Engineering
Stanford University, Stanford, California, February 12-14, 2018
SGP-TR-213
1
Geothermal Development in Oguni, Central Kyushu
Toshiyuki Tosha1, Yoshiharu Kida2, Yuzo Obara1, Tomohiro Yamazaki2, Hidehisa Watanabe2
1 Kumamoto University, Kurokami2-39-1, Chuo, Kumamoto, 860-8555, JAPAN
2Japan Oil Gas and Metals National Corporation, 2-10-1 Toranomon, Minato, 105-0001, JAPAN
2Mitsui Mineral Development Engineering Co. Ltd, Osaki1-11-1, Shinagawa, 141-0032, JAPAN
[email protected], [email protected], [email protected], [email protected], [email protected]
Keywords: Country report, Kyushu, Airborne Survey, Gravity gradient, Variogram, SI index
ABSTRACT
The development of renewable energy is expected against not only the global warming but also the disaster of nuclear power plant. METI
announced an energy policy and showed a plan of the electricity generation for each energy in 2030. Geothermal energy is desired to
install power generation more than 1,500MW under this new policy, which is almost three times of the current installed capacity.
Deregulation is being conducted for the development in national parks and many developers are carrying out surveys to find out a new
geothermal field and complete the policy. However, achievement of the political goal is so high.
The Oguni geothermal field is located in the Kumamoto prefecture, central Kyushu Island, near the Okake and the Hacchobaru
Geothermal Power Plants. EPDC (Electric Power Development Co. Ltd, currently J-Power) started to develop in 1983 and evaluated the
geothermal potential in the geothermal field. They planned to construct a geothermal power plant with an install capacity of 20MW. In
2002 EPDC resigned the development because of disagreement of few local people for the development. Since then no plan to develop
was discussed. In 2015 a small power plant with the capacity of 2MW was installed and gain momentum to construct a bigger power
plant. There is, however, no estimation of the additional power generation after the operation of the 2MW power plant and there is no
answer to the question whether there is still resource for 20MW electricity generation. We have reviewed models in the Oguni geothermal
field and construct a new model covered larger area to answer the question.
1. INTRODUCTION
Geothermal energy is environmentally harmonized energy resource and the recognition is widely known and accepted. There are,
however, various obstacles against its development in Japan. In particular, there are said to be three major obstacles in Japan. The first
obstacle is geothermal energy taking long time to be developed and the second is national parks where development is restricted very
much although a lot of resources exist. The last one is the opposite opinions of local residents. There are many cases where local residents
cannot understand the meaning of the development and warry about the depletion of the hot water supply in their hot springs. This last
obstacle is often caused by "hot spring" culture which is the unique culture of in Japan.
In promoting geothermal development, the opposite opinion that the development affects the serious damage against the hot springs
often happens outside of the developing area and it sometimes cause the suspension of the development. It is undeniable that lack of
such risk communication has caused the background of discontinuation of development by EPDC in Oguni. Since it is impossible to
grasp the exact influence of the underground in development in current science, monitoring of temperature, water level, geochemical
components and so on is necessary to carry out at hot springs around the developing area where the influence is concerned in
development. If the influence becomes noticeable, we have to discuss on the development. Taking monitoring and discussing on the
data is fundamental to gain understanding of the local residents. On the other hand, for the other two obstacles, it is no longer
impediment factors in the development of geothermal resources by the enhancement of subsidies by public funds and the deregulation
in the natural parks.
Survey in a wide area is often required in the geothermal energy development. In the past, investigation was common at the ground
surface and it was extremely difficult to study in a wide area with a uniform specification and it was impossible to carry out the survey
in the national park. The survey in the national park becomes possible due to the deregulation. Currently, airborne survey by an aircraft
and a helicopter can be promoted (JOGMEC, 2015, 2016; Tosha et al., 2015, 2017). Extensive survey including the nation park will
becomes necessary. In this report, we introduce the recent survey result and describe he current state of development in Oguni region
in Kumamoto.
2. RECENT GEOTHERMAL ENERGY DEVELOPMENT IN JAPAN
2.1 Global warming
After the Industrial Revolution in the eighteenth century, emission of Greenhouse gases (GHGs) to the atmosphere is increasing by the
rapid increase of the fossil energy use. This increase of the emission caused environmental problems, the global warming. Mitigation
against the global warming consists of several actions, which limit the long-term human emission of GHGs in magnitude and in rate.
Tosha et al.
2
Energies without emission of GHGs are also expected to develop. Nuclear power is one of possible answers against the global warming
but it causes another serious problems with high risks.
The Paris Agreement was adopted in COP21 (the 21st conference of the Party under The United Nations Climate Change Conferences)
which aims to suppress GHG emission in order to hold the increase in the global average temperature to below 2 ˚C above pre-industrial
levels. This agreement is a successor of the Kyoto Protocol, which is a previous guideline to reduce the emission in COP3. The Paris
Agreement requires Japan to reduce 26% of CO2 emission against 2013FY (25.4% against 2005FY, 1,079 MtCO2eq). Amount of
reduction is greater than that in the Kyoto Protocol (6% against 1990FY).
2.2 Policy in Japanese government
After the terrible disaster at the Fukushima Nuclear Power Plant happened in March, 2011, demand for stable and renewable energy
supply has been increasing not only against the global warming but less supply electricity by nuclear power plants, which were suspended
for the generation after the disaster.
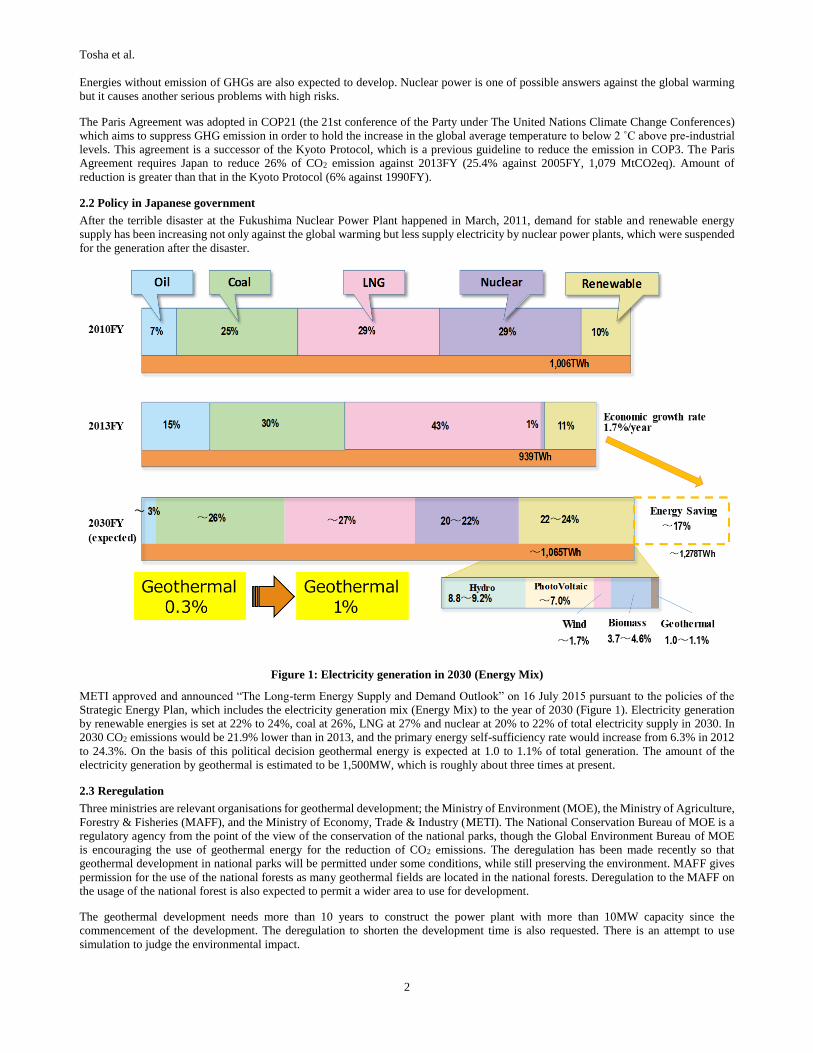
Figure 1: Electricity generation in 2030 (Energy Mix)
METI approved and announced “The Long-term Energy Supply and Demand Outlook” on 16 July 2015 pursuant to the policies of the
Strategic Energy Plan, which includes the electricity generation mix (Energy Mix) to the year of 2030 (Figure 1). Electricity generation
by renewable energies is set at 22% to 24%, coal at 26%, LNG at 27% and nuclear at 20% to 22% of total electricity supply in 2030. In
2030 CO2 emissions would be 21.9% lower than in 2013, and the primary energy self-sufficiency rate would increase from 6.3% in 2012
to 24.3%. On the basis of this political decision geothermal energy is expected at 1.0 to 1.1% of total generation. The amount of the
electricity generation by geothermal is estimated to be 1,500MW, which is roughly about three times at present.
2.3 Reregulation
Three ministries are relevant organisations for geothermal development; the Ministry of Environment (MOE), the Ministry of Agriculture,
Forestry & Fisheries (MAFF), and the Ministry of Economy, Trade & Industry (METI). The National Conservation Bureau of MOE is a
regulatory agency from the point of the view of the conservation of the national parks, though the Global Environment Bureau of MOE
is encouraging the use of geothermal energy for the reduction of CO2 emissions. The deregulation has been made recently so that
geothermal development in national parks will be permitted under some conditions, while still preserving the environment. MAFF gives
permission for the use of the national forests as many geothermal fields are located in the national forests. Deregulation to the MAFF on
the usage of the national forest is also expected to permit a wider area to use for development.
The geothermal development needs more than 10 years to construct the power plant with more than 10MW capacity since the
commencement of the development. The deregulation to shorten the development time is also requested. There is an attempt to use
simulation to judge the environmental impact.

Tosha et al.
3
2.4 Financial Supports
The committee in the Japanese Government reported that it takes about 25.9 billion JPY (Approx. 235 million USD) to construct a 30MW
Geothermal Power Plant (Cabinet office, 2011). The construction of the power plant house including the installation of the turbine and
generator need huge costs. Huge costs are also incurred in the exploration part of geothermal resource development. Even if a promising
geothermal reserve is found at the exploration stage, major risks still remain, such as necessity of the long period between completing the
construction of a power station and its being brought on stream. The report also pointed out the long development time, which is estimated
to be more than 11 years to complete a 30MW Geothermal Power Plant project from start to finish (Cabinet office, 2011). To cope with
these risks, JOGMEC (Japan Oil Gas and Metals National Corporation), a government enterprise to promote geothermal energy
development, offers several types of financial support, including subsidy, equity capital, and liability guarantee. For example, subsidies
will be applied for a survey period, equity capital for an exploration period and liability guarantee for a construction period of the power
plant for the development in Japan.
The financial support began in 2012 and a total of 71 applications have been filed until the end of 2017 (Figure 2). The applied projects
for the supports are mainly in the Tohoku / Hokkaido and the Kyushu regions and the most of the scale of power generation are 1 MW or
less. However, there are few large-scale development projects. As a large-scale project, the Wasabizawa geothermal power plant in the
Tohoku region has an output of 42 MW, and it is scheduled to commence in operation in May 2019.
Figure 2: Map of the geothermal development projects with financial supports
2.5 Development in Oguni
Oguni Town is located in the central part of the Kyushu region and belongs to Kumamoto prefecture (Figure 3). In the central part of
Kyushu, the Hatchobara and the Otake power stations are in operation which are located across Mt. Waita. Therefore, this area is
recognized as one of the high potential areas for geothermal resources and the project of geothermal development has been progressing
from long ago.

Tosha et al.
4
Figure 3: Map of the study area and flight (survey) lines
Beginning with the oil crisis of 1974 and 1979, developing alternative sources of energy to oil became a national project. In Oguni the
momentum of geothermal development increased, and in 1978 a national survey project around the middle Kyushu region was conducted
and within the survey project geophysical surveys in wider area were carried out and many well have been drilled. Following this survey,
in 1983 EPDC aiming for 2 MW power generation. However, some local residents don’t agree to the development EPDC abandoned the
developing plan in 2002. A small-scale power generation facility of 2 MW has been built by companies that added locals in 2016 and is
now in operation.
3. GEOPHYSICAL SURVEY USING A HELICOPTER
3.1 Survey in a wide area
The development promotion survey project that began at the establishment of NEDO (New Energy Development Organization) in 1980,
the first survey conducted a wide area exploration method in geological and geophysical methods. Gravity survey was widely carried out
and there remained useful data even in the recent development. After the survey and exploration of the wide area, the areas where the
probability of existence of resources is high area selected and investigation and exploration methods which excavated more detailed
characteristics of the geothermal resources and the well drilling are conducted.
3.2 Gravity measurement
In the geothermal development, gravity exploration has been used to obtain the rough geological structure, AIST (2011) compiled the
gravity data and published. Recently investigation for a finer geological structure is planned by measuring the deviation of gravity. In
particular, the measurement of gravity gradients in the air is announced to be suitable for exploration of mineral resources such as ore
deposits in vast exploration areas such as Australia because an air plane and a helicopter can explore in a wide area with uniform search
density.
3.3 Gravity gradient measurement
The gravity gradient measurement in the airplane and the helicopter was introduced to investigate the geological structure of the
geothermal area. Originally, gravity is a vector with three components, and the gravity gradient, which is a spatial differentiation, is a
tensor quantity of 3 rows × 3 columns (Figure 4). If there is no excess mass distribution in the measurement region, the tensor solution of
the gravity gradient satisfies the Laplace’s equation, suggesting that the sum of the diagonal components becomes zero theoretically.
Corresponding non-diagonal components of the matrix can be assumed to be equal (Gxy=Gyx, Gxz=Gzx, Gvz=Gzy). Then the independent
components of nine tensor components reduces to be five. Measuring these five components is called the “Full Tensor Measurement” and
the gravity field will be identified, but the measurement system we used in the geothermal field was the Partial Tensor Measurement”,
which two independent components were measured. Other shortfall components of the tensor are performed using a theoretical model,
which is not open to the public.

Tosha et al.
5
Figure 5: Conceptual diagram showing gravity and gravity gradients
4. ANALYSIS METHODS
4.1 Variogram
Variogram is a statistical method that characterizes the spatial continuity or roughness of a data set and was developed as a method for
estimating quality at a gold mine(e.g. Davis, 1973), but from the point of view of spatial features, it is used at not only the development
of resources such as mining but at meteorology and agriculture as it is a technique that is often used in geostatistics with basic data. If
there are two data sets, even if the one-dimensional analysis decides that they are almost identical, the continuity of the space is quite
possible to recognise. The variogram analysis consists of a variogram model and an experimental variogram calculated from the data.
Experimental variogram is obtained by adding the square of the difference between observed values (Zi and Zj) at two points to all pairs
where the distance between two points is less than a certain value (h) and divided by a factor of two as follows;
)(
2)(N(h)2
1=γ(h)
hN
ZjZi (1)
Since the experimental variogram γ (h) is discrete, it is sometimes difficult to use. Therefore, we approximate the experiment variogram
with continuous functions such as spherical, exponential, and linear. In some case we can use this function (variogram model) as a
variogram. In this study we use only experimental variogram. In addition, by approximating the number N of pairs where the distance
between two points is h is sufficiently larger than h, we can get a relationship among the unbiased variance V, the autocovariance C (h),
and the autocorrelation coefficient r such as
} r(h)-1 { V
C(h)-V=γ(h)
(2)
Figure 5: A schematic model of flower structure
This indicates that the variogram becomes zero or minimum when the autocorrelation becomes high at a certain distance h if the similar
event repeats at the distance. That is, since the variogram is one of representations of autocorrelation, we can expect that the variogram
takes a minimum value if any event is repeated (Shoji and Koike, 2007). Faults have the flower structures that is expected where faults
are exposed to the ground surface with equal intervals (Figure 5). Flower structure is a shallow structure of the faults which might converge
to a single fault in deeper layer. Flower structures have become the mail candidate geometry (eg. Wilcox et al., 1973; Woodcock and
Rickards, 2003). We can estimate the faults by the analysis of the variogram.

Tosha et al.
6
To be exact, γ (h) is called a semivariogram, and the variogram is called 2γ (h) before dividing by a factor of 2, but in many cases both
are confused to use. We will call γ (h) as a variogram in this paper. Also, since points i and j are distributed in space, the difference
between the observed values (Zi and Zj) at two points is generally a vector, but in this analysis the helicopter flies along one survey line.
Therefore, we can treat it as a scalar value. N (h) is the number of point pairs whose distance is h. However, if the distance between two
points is within the range of allowable error (± Δh), it is assumed that the distance is h and the variogram is calculated. We used the result
as (experimental) variogram in this analysis
4.2 Spatial filter (Shape Index; SI)
There are several filters to apply survey data to detect and emphasise some geoscientific feature. High pass filters such as HGA (Horizontal
Gradient Analysis) and TDR (Tilt Derivative) are possible to detect fault structure and other filters are also useful (e.g. Cooper and Cowan,
2006; Ma, 2013; Miller and Singh, 1994; ten Brick and Ben-Szarham, 1993). When a high-density abnormal body exists in shallow
subsurface, the gravity is affected by the high density abnormal body. An equal gravity potential plane shows a convex shape above the
high density body. In order to make the geological boundary clearer than Gzz, the vertical gravity gradient, and make it easier to interpret
geological structure, Shape Index (SI) representing the shape of the equal gravity potential plane has been proposed (Koenderink and can
Doom, 1992; Roberts, 2001; Cevallos et al., 2013). SI is attended to focus on the curvature of the potential surface such as gravity.
Figure 6: Schematic mages of shape index (SI)
SI =2
𝜋𝑎𝑟𝑐𝑡𝑎𝑛
[ 𝜕𝐺𝑧
𝜕𝑧
√(𝜕𝐺𝑥𝜕𝑥
−𝜕𝐺𝑦
𝜕𝑦)2
+4(𝜕𝐺𝑥𝜕𝑦
)]
(3)
SI takes values from -1 to 1. SI becomes 1(Cap) when the gravity potential plane is bulging upward, 0(Saddle or Flat) when it is saddle
or flat, and -1 (Cup) in the shape of a bowl dropping downward. As the SI decreases, the shape of the potential plane changes from Cap,
Dome, Saddle, to Cup (Figure 6). Since the SI is positive and negative in the case of positive and negative gravity anomaly, respectively,
it is possible to process the shape of the gravity basement numerically.
5. DISCUSSIONS
5.1 Analysis using the variogram
More than several tens km of the flight will be expected at a long investigation line. It is sometimes difficult to calculate the autocorrelation
for such a long survey line in the variogram analysis. Therefore, it is important to determine the length of the survey line to analyse as one
data set. Several adjutant survey lines were selected with a length of about 10km and we analysed which observation line can detect the
minimum value of the autocorrelation. Through these preliminary analyses, it became clear that there are survey lines taking the local
minima and those lines are close to each other. This means that fracture system in the geothermal field consists of several faults which
show the minimum value in the variogram analysis.
On the other hand, when computing a variogram, it is possible to infer at which point of the station the fault is developed by using a certain
part instead of using all the stations. Therefore, when calculating the variogram, instead of using the data of all measurement points, by
dividing into several windows, we decided to investigate to which area the fault has developed. We investigated the optimum window
length by changing the number of stations. As a result, the measurement about 3,000 m length is the optimum length that is most effective
to detect the fractures. Based on this investigation result, we analysed the variogram with a fixed windows length starting at 2500, 3000,
and 3500m from the start survey point and found that faults are developed at the area around 3000 m and 3000m from the beginning of
the measurement point. In this way, it is possible to specify the area where the fracture system associated with the geothermal resources
Tosha et al.
7
develops by making the variogram while shifting the window in a certain survey line. These estimations are, however, temporary and
parameter should be changed in the other survey area. Another study should be necessary to determine optimum size of the window.
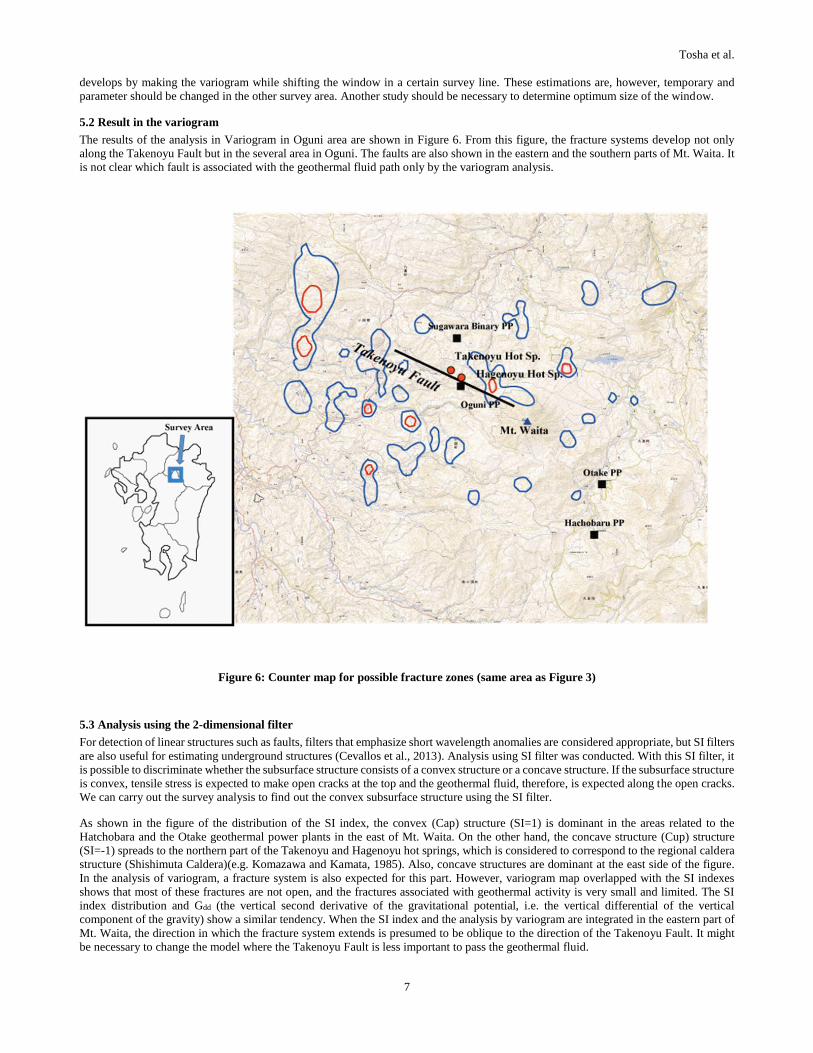
5.2 Result in the variogram
The results of the analysis in Variogram in Oguni area are shown in Figure 6. From this figure, the fracture systems develop not only
along the Takenoyu Fault but in the several area in Oguni. The faults are also shown in the eastern and the southern parts of Mt. Waita. It
is not clear which fault is associated with the geothermal fluid path only by the variogram analysis.
Figure 6: Counter map for possible fracture zones (same area as Figure 3)
5.3 Analysis using the 2-dimensional filter
For detection of linear structures such as faults, filters that emphasize short wavelength anomalies are considered appropriate, but SI filters
are also useful for estimating underground structures (Cevallos et al., 2013). Analysis using SI filter was conducted. With this SI filter, it
is possible to discriminate whether the subsurface structure consists of a convex structure or a concave structure. If the subsurface structure
is convex, tensile stress is expected to make open cracks at the top and the geothermal fluid, therefore, is expected along the open cracks.
We can carry out the survey analysis to find out the convex subsurface structure using the SI filter.
As shown in the figure of the distribution of the SI index, the convex (Cap) structure (SI=1) is dominant in the areas related to the
Hatchobara and the Otake geothermal power plants in the east of Mt. Waita. On the other hand, the concave structure (Cup) structure
(SI=-1) spreads to the northern part of the Takenoyu and Hagenoyu hot springs, which is considered to correspond to the regional caldera
structure (Shishimuta Caldera)(e.g. Komazawa and Kamata, 1985). Also, concave structures are dominant at the east side of the figure.
In the analysis of variogram, a fracture system is also expected for this part. However, variogram map overlapped with the SI indexes
shows that most of these fractures are not open, and the fractures associated with geothermal activity is very small and limited. The SI
index distribution and Gdd (the vertical second derivative of the gravitational potential, i.e. the vertical differential of the vertical
component of the gravity) show a similar tendency. When the SI index and the analysis by variogram are integrated in the eastern part of
Mt. Waita, the direction in which the fracture system extends is presumed to be oblique to the direction of the Takenoyu Fault. It might
be necessary to change the model where the Takenoyu Fault is less important to pass the geothermal fluid.

Tosha et al.
8
Figure 7: A map of the distribution of SI
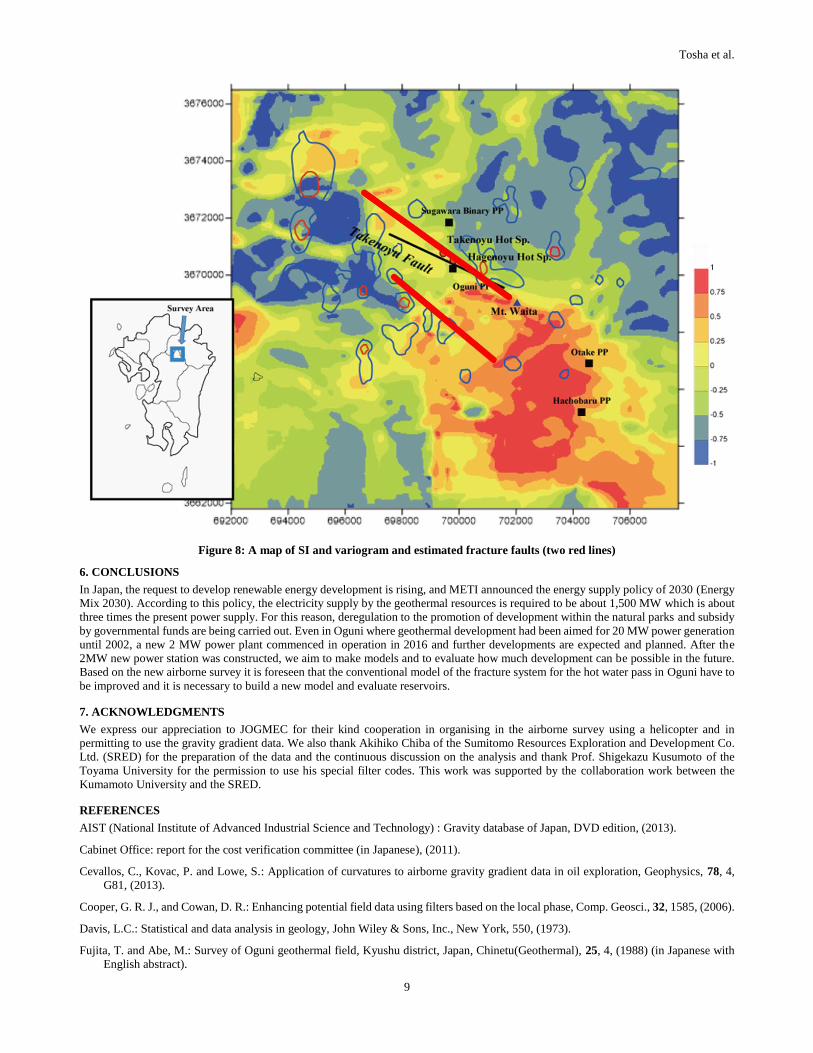
5.4 A new structure model
The geothermal fluid flows north-eastward along the Takenoyu Fault trending the northeast - southwest direction at the conventional
model, while the geothermal fluid comes up from the underground of the Mt. Waita, and flows to the Sugawara Binary Power Plant by
changing its direction on the way to the north. In the eastern part of Mt. Waita the mode is accepted that the flow path is regulated in the
Takenoyu Fault which is found along the valley topography and the flow changes its direction, because the north part of this area has
permeable geology and the temperature of the hot springs in the west part is low.
However, there was not sufficient explanation why the flow path changes to the north on the way. Taking the results of this airborne
survey with the helicopter into account, the structure extending linearly from Mt. Waita to the Sugawara Binary Power Plant is clear, and
it might be possible to estimate the underground fracture system that is oblique to the Takenoyu Fault on the surface (Figure 8). If this
fracture system is responsible for the geothermal activity in Oguni area, it can explain that the geothermal fluid generated under the Mt.
Waita reaches Sugawara directly and also reaches the Asozuru hot spring ahead. Moreover, another fracture system through which
geothermal fluid passes in south of the Takenoyu Fault is also expected. The geothermal flow should supply hot water in the southern
Oguni area. Simulation should be carried out based on this model.
5.5 Improvement of variogram analysis
Currently, the survey for geological fracture in a geothermal area is generally carried out by applying spatial filter processing on
gravitational gradient data taken in an airplane and/or a helicopter. The data are, however, converted based on a certain model, and the
details of the model are not open. In addition, the distance between the two survey lines is fundamentally the same as the distance between
helicopter tracks (generally 250 m), but the measurement interval along a survey line depends on the sampling frequency (about 5 m in
the current specification). In this way, it might be necessary to examine whether or not the filtering process that assumes a uniform
measurement density is suitable for airborne data whose measurement interval is significantly different depending on the direction.
From this point of view, we tried to analyse using the variogram in order to use only raw data of measurements. However, to calculate the
variogram, not all the survey line data are used at once, but data of a subset were created and analysed. It is necessary to examine the
method in terms of how to pick up this subset and how to introduce a 2D variogram in the future
Tosha et al.
9
Figure 8: A map of SI and variogram and estimated fracture faults (two red lines)
6. CONCLUSIONS
In Japan, the request to develop renewable energy development is rising, and METI announced the energy supply policy of 2030 (Energy
Mix 2030). According to this policy, the electricity supply by the geothermal resources is required to be about 1,500 MW which is about
three times the present power supply. For this reason, deregulation to the promotion of development within the natural parks and subsidy
by governmental funds are being carried out. Even in Oguni where geothermal development had been aimed for 20 MW power generation
until 2002, a new 2 MW power plant commenced in operation in 2016 and further developments are expected and planned. After the
2MW new power station was constructed, we aim to make models and to evaluate how much development can be possible in the future.
Based on the new airborne survey it is foreseen that the conventional model of the fracture system for the hot water pass in Oguni have to
be improved and it is necessary to build a new model and evaluate reservoirs.
7. ACKNOWLEDGMENTS
We express our appreciation to JOGMEC for their kind cooperation in organising in the airborne survey using a helicopter and in
permitting to use the gravity gradient data. We also thank Akihiko Chiba of the Sumitomo Resources Exploration and Development Co.
Ltd. (SRED) for the preparation of the data and the continuous discussion on the analysis and thank Prof. Shigekazu Kusumoto of the
Toyama University for the permission to use his special filter codes. This work was supported by the collaboration work between the
Kumamoto University and the SRED.
REFERENCES
AIST (National Institute of Advanced Industrial Science and Technology) : Gravity database of Japan, DVD edition, (2013).
Cabinet Office: report for the cost verification committee (in Japanese), (2011).
Cevallos, C., Kovac, P. and Lowe, S.: Application of curvatures to airborne gravity gradient data in oil exploration, Geophysics, 78, 4,
G81, (2013).
Cooper, G. R. J., and Cowan, D. R.: Enhancing potential field data using filters based on the local phase, Comp. Geosci., 32, 1585, (2006).
Davis, L.C.: Statistical and data analysis in geology, John Wiley & Sons, Inc., New York, 550, (1973).
Fujita, T. and Abe, M.: Survey of Oguni geothermal field, Kyushu district, Japan, Chinetu(Geothermal), 25, 4, (1988) (in Japanese with
English abstract).

Tosha et al.
10
JOGMEC: Report to examine methods for using airborne survey data of gravity measurement, 246, (2015) (in Japanese).
JOGMEC: Report Geothermal resource evaluation work of "Kuju area" based on gravity deviation data (Phase 1)-Filter analysis and
evaluation work, 50, (2016) (in Japanese).
Koenderink, J. J., and van Doornm A. J.:Surface shape and curvature scales, Im. Vis. Comp., 10, 5557. (1992).
Komazawa, M. and Kamata, H.: The basement structure of the Hohi geothermal area obtained by gravimentric analysis in central-north
Kyushu, Japan, Rept. Geol. Surv. Japan, 264, 303, (1985) (in Japanese with English abstract).
Ma, G.:Edge detection of potential field data using improved local phase filter, Expl. Geophys., 44, 36, (2013) .
Miller, H. G., and Singh, V.:Potential field tilt – A new concept for location of potential field sources, Jour. Appl. Geophys., 32, 213,
(1994).
Roberts, A.:Curvature attributes and their application to 3D interpreted horizons, First Break, 19, 85, (2001).
Shoji, T. and Koike, K.: Variogram-Data analysis of spatial continuity, J. Geotherm. Res. Soc. Japan, 29, 125, (2007) (in Japanese with
English abstract).
ten Brink, U. S., Ben-Avarham, Z., Bell, R. E., Hassouneh, M., Coleman, D. F., Andreasen, F., Tibor, G., and Coakley, B.:Structure of
the Dead Sea Pull-apart Basin from Gravity Analyses, J. Geophys. Res., 98, 21877, (1993).
Tosha, T., Shimada, T., and Fukuda, M: Data analyses of the airborne survey to clarify the geothermal structure and to evaluate the
geothermal potential, Proc. NZGW, 136, (2015).
Tosha, T., Inagaki, H., Soengkono, S., Kita, Y :On the airborne survey by a helicopter – a brief outline and several analyses of the survey,
Proc. NZGW, 59, (2017).
Wilcox, R. E., Harding, T.P., Seely, D.R.,: Basic Wrench Tectonics, AAPG Bull. 57, 74-79, (1973).
Woodcock, N. H. and Rickards, B.,: Transpressive duplex and flower structure: Dent Fault System, NW England: J. Struct. Geol., 25,
1981-1992, (2003).