
GEOTECHNICAL POLICIES AND PROCEDURES … 7 Analysis, Design, and Report Format…………… ......
156
GEOTECHNICAL POLICIES AND PROCEDURES MANUAL April 2012
Transcript of GEOTECHNICAL POLICIES AND PROCEDURES … 7 Analysis, Design, and Report Format…………… ......

GEOTECHNICAL POLICIES
AND PROCEDURES
MANUAL
April 2012
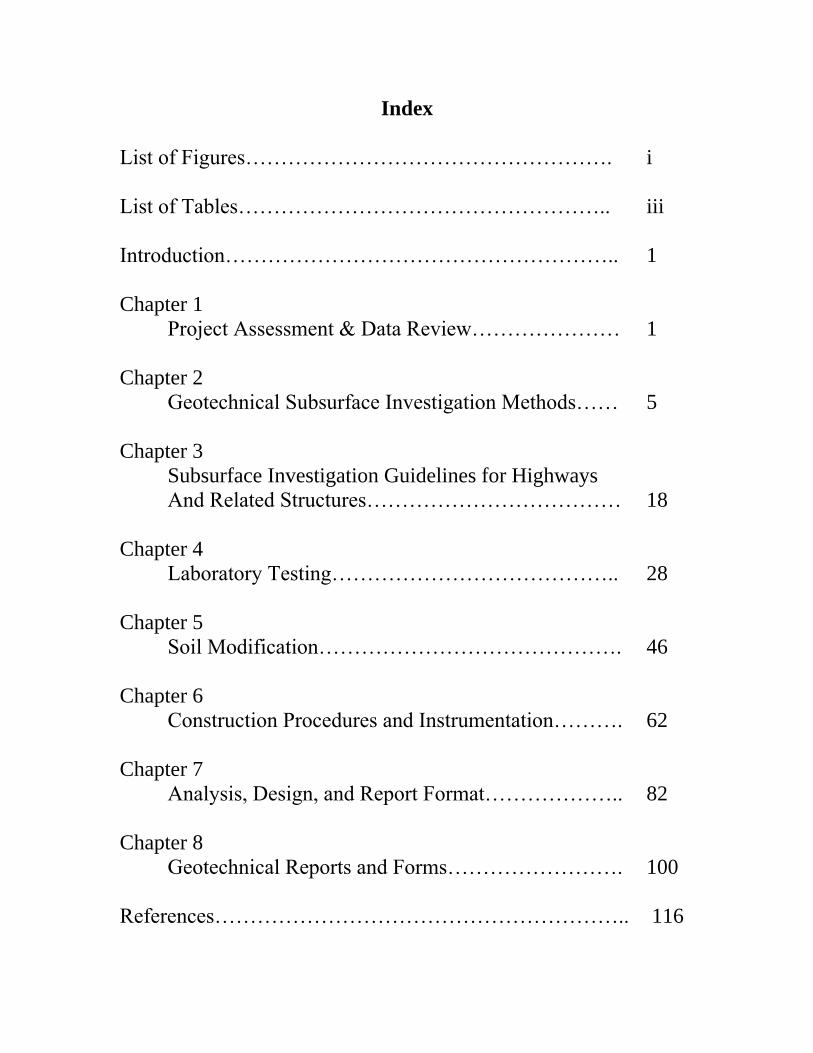
Index
List of Figures……………………………………………. i
List of Tables…………………………………………….. iii
Introduction……………………………………………….. 1
Chapter 1
Project Assessment & Data Review………………… 1
Chapter 2
Geotechnical Subsurface Investigation Methods…… 5
Chapter 3
Subsurface Investigation Guidelines for Highways
And Related Structures……………………………… 18
Chapter 4
Laboratory Testing………………………………….. 28
Chapter 5
Soil Modification……………………………………. 46
Chapter 6
Construction Procedures and Instrumentation………. 62
Chapter 7
Analysis, Design, and Report Format……………….. 82
Chapter 8
Geotechnical Reports and Forms……………………. 100
References………………………………………………….. 116
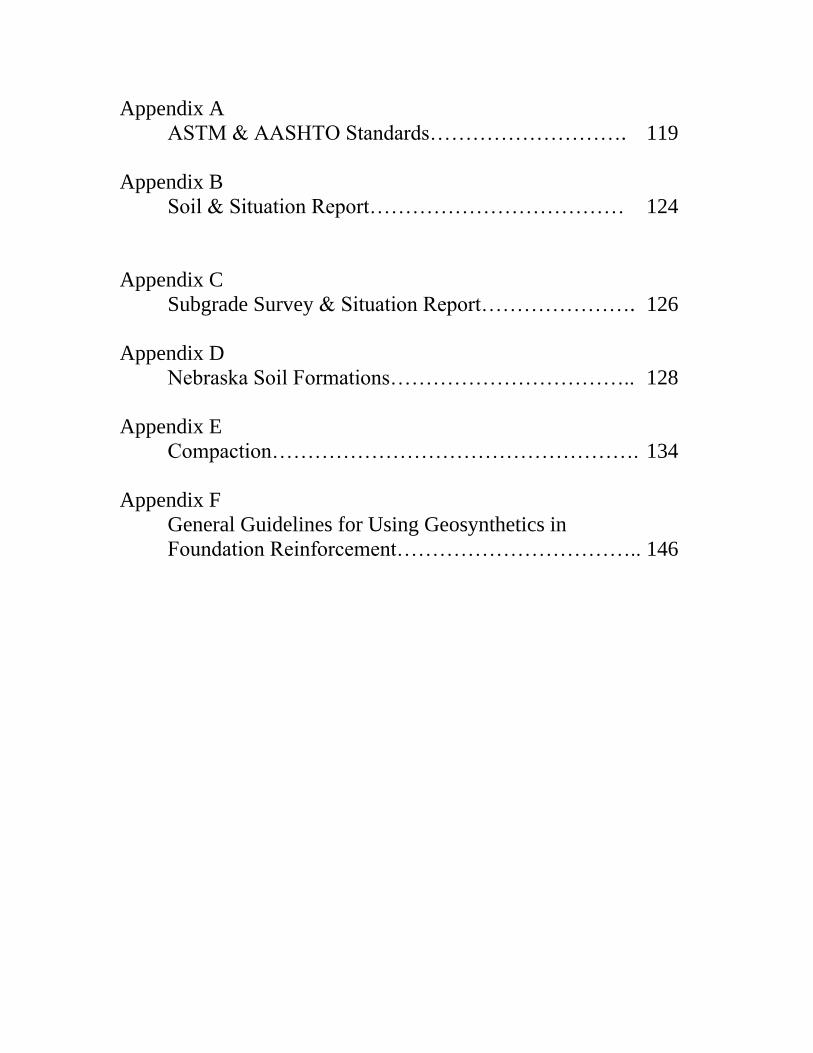
Appendix A
ASTM & AASHTO Standards………………………. 119
Appendix B
Soil & Situation Report……………………………… 124
Appendix C
Subgrade Survey & Situation Report…………………. 126
Appendix D
Nebraska Soil Formations…………………………….. 128
Appendix E
Compaction……………………………………………. 134
Appendix F
General Guidelines for Using Geosynthetics in
Foundation Reinforcement…………………………….. 146
i
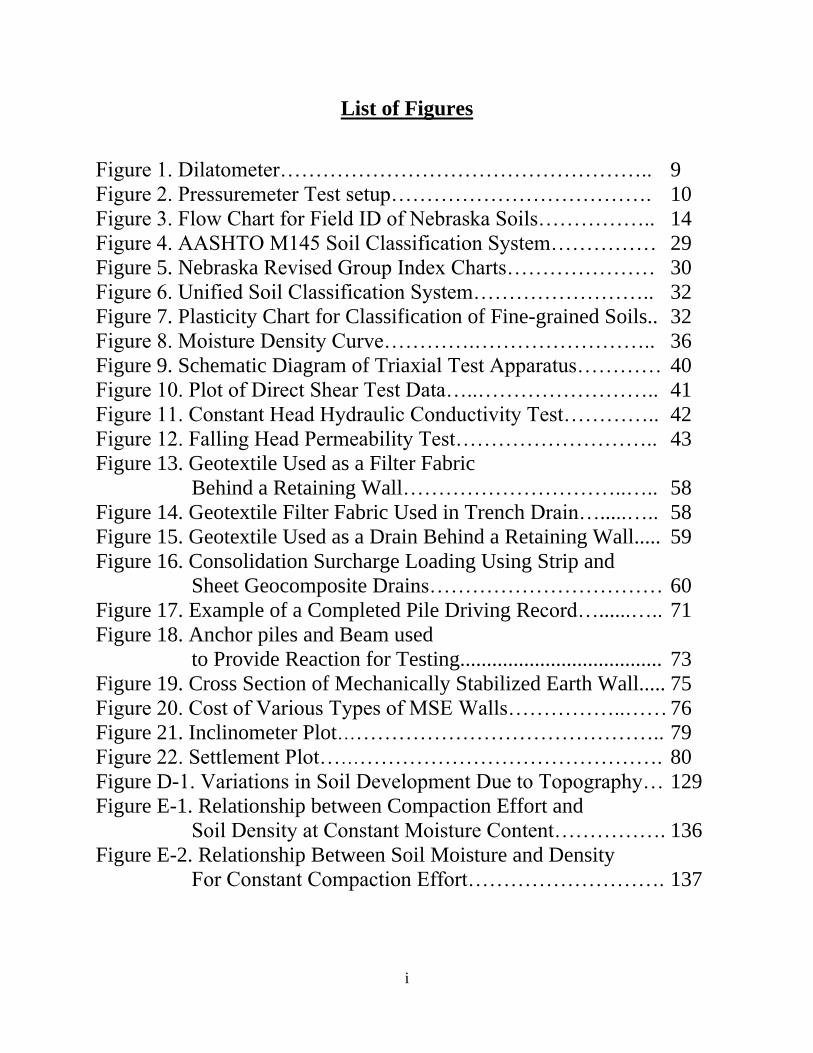
List of Figures
Figure 1. Dilatometer…………………………………………….. 9
Figure 2. Pressuremeter Test setup………………………………. 10
Figure 3. Flow Chart for Field ID of Nebraska Soils…………….. 14
Figure 4. AASHTO M145 Soil Classification System…………… 29
Figure 5. Nebraska Revised Group Index Charts………………… 30
Figure 6. Unified Soil Classification System…………………….. 32
Figure 7. Plasticity Chart for Classification of Fine-grained Soils.. 32
Figure 8. Moisture Density Curve………….…………………….. 36
Figure 9. Schematic Diagram of Triaxial Test Apparatus………… 40
Figure 10. Plot of Direct Shear Test Data…..…………………….. 41
Figure 11. Constant Head Hydraulic Conductivity Test………….. 42
Figure 12. Falling Head Permeability Test……………………….. 43
Figure 13. Geotextile Used as a Filter Fabric
Behind a Retaining Wall…………………………..….. 58
Figure 14. Geotextile Filter Fabric Used in Trench Drain….....….. 58
Figure 15. Geotextile Used as a Drain Behind a Retaining Wall..... 59
Figure 16. Consolidation Surcharge Loading Using Strip and
Sheet Geocomposite Drains…………………………… 60
Figure 17. Example of a Completed Pile Driving Record…......….. 71
Figure 18. Anchor piles and Beam used
to Provide Reaction for Testing...................................... 73
Figure 19. Cross Section of Mechanically Stabilized Earth Wall..... 75
Figure 20. Cost of Various Types of MSE Walls……………..…… 76
Figure 21. Inclinometer Plot……………………………………….. 79
Figure 22. Settlement Plot…………………………………………. 80
Figure D-1. Variations in Soil Development Due to Topography… 129
Figure E-1. Relationship between Compaction Effort and
Soil Density at Constant Moisture Content……………. 136
Figure E-2. Relationship Between Soil Moisture and Density
For Constant Compaction Effort………………………. 137
ii
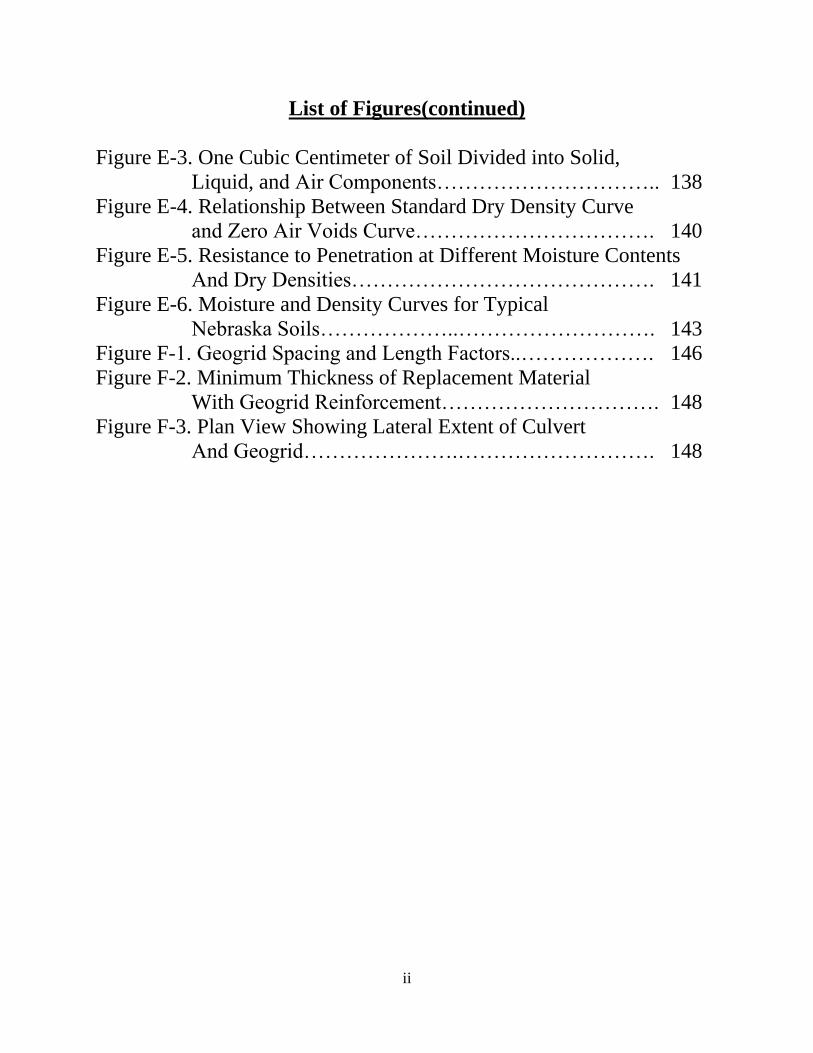
List of Figures(continued)
Figure E-3. One Cubic Centimeter of Soil Divided into Solid,
Liquid, and Air Components………………………….. 138
Figure E-4. Relationship Between Standard Dry Density Curve
and Zero Air Voids Curve……………………………. 140
Figure E-5. Resistance to Penetration at Different Moisture Contents
And Dry Densities……………………………………. 141
Figure E-6. Moisture and Density Curves for Typical
Nebraska Soils………………..………………………. 143
Figure F-1. Geogrid Spacing and Length Factors..………………. 146
Figure F-2. Minimum Thickness of Replacement Material
With Geogrid Reinforcement…………………………. 148
Figure F-3. Plan View Showing Lateral Extent of Culvert
And Geogrid………………….………………………. 148
iii
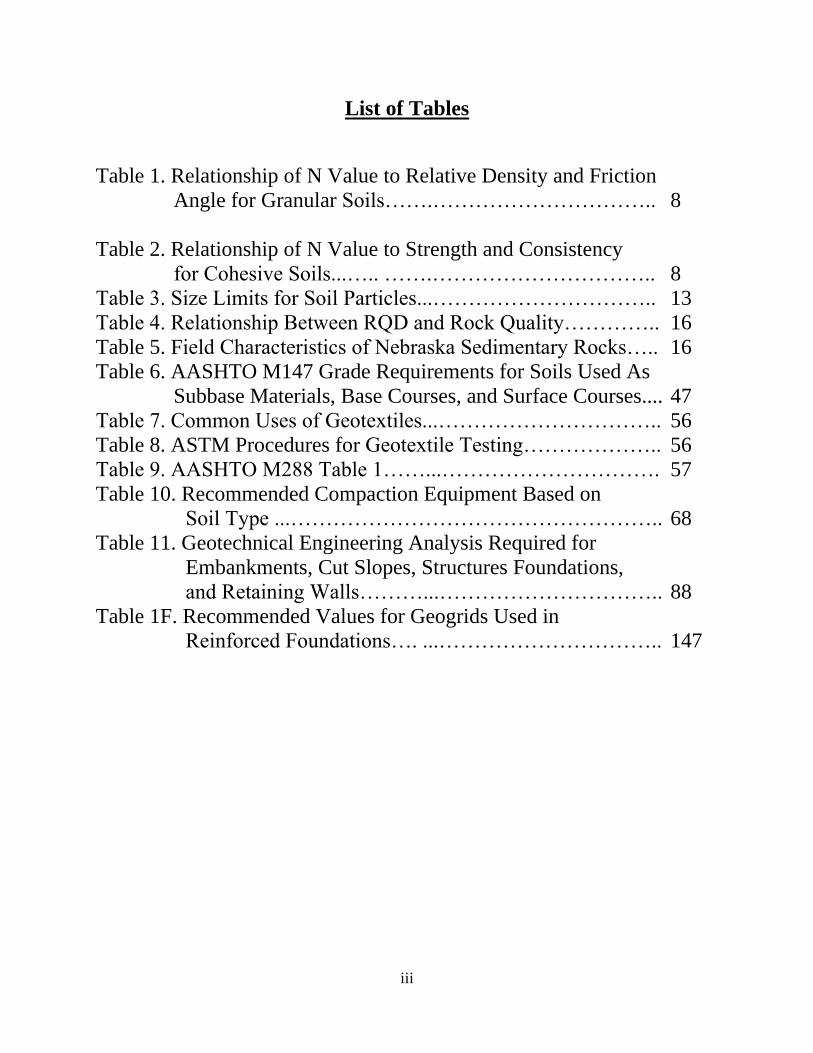
List of Tables
Table 1. Relationship of N Value to Relative Density and Friction
Angle for Granular Soils…….………………………….. 8
Table 2. Relationship of N Value to Strength and Consistency
for Cohesive Soils...….. …….………………………….. 8
Table 3. Size Limits for Soil Particles...………………………….. 13
Table 4. Relationship Between RQD and Rock Quality………….. 16
Table 5. Field Characteristics of Nebraska Sedimentary Rocks….. 16
Table 6. AASHTO M147 Grade Requirements for Soils Used As
Subbase Materials, Base Courses, and Surface Courses.... 47
Table 7. Common Uses of Geotextiles...………………………….. 56
Table 8. ASTM Procedures for Geotextile Testing……………….. 56
Table 9. AASHTO M288 Table 1……...…………………………. 57
Table 10. Recommended Compaction Equipment Based on
Soil Type ...…………………………………………….. 68
Table 11. Geotechnical Engineering Analysis Required for
Embankments, Cut Slopes, Structures Foundations,
and Retaining Walls………...………………………….. 88
Table 1F. Recommended Values for Geogrids Used in
Reinforced Foundations…. ...………………………….. 147
1
Introduction
The purpose of this manual is to provide Geotechnical Engineers guidance to expected
procedures when performing geotechnical investigations, analysis, and reporting for the
Nebraska Department of Roads (NDOR). This manual is intended to provide general
guidelines for the geotechnical duties of a typical project, as each project has unique
considerations and requires engineering judgment based on knowledge of an individual
situation. Design and construction of roadway projects is complex and involves the
contribution of many department units and therefore requires good communication and
coordination between the Geotechnical Engineer and other units. This interaction is
important in designing a reliable and cost-effective project.
Chapter 1
Review of Available Data
The inherent complexity of projects and varying soil types makes it difficult if not
impossible to establish a fixed format for geotechnical investigations within the State of
Nebraska. However, there are basic guidelines that should be considered for any project.
A review of data available will indicate what information has already been collected and
what information will have to be obtained through surface or subsurface investigations at
the project site.
1.1 Assessment of Project Requirements.
The first step in performing any geotechnical investigation is a thorough review of
the basic physical and engineering parameters of the proposed project. This review
should include the project location, orientation of the project, locations of all
structures, loads on structures (as appropriate), delineation of project cut and fill
areas and any restrictions on construction activities based upon natural conditions,
flora or fauna at the project site. Preliminary plans (also known as plan-in-hand or
P.I.H. plans) consisting of a location map, typical section, site layout, drainage
plans, plan & profile sheets, 2L sheets (geometric, construction and removal plans)
wetland delineation plans, standard cross sections and culvert cross sections may
serve as a basis for this review. In addition, geologic cross sections are available
upon request for this review.
Specific information concerning the geotechnical aspects of many projects is readily
available before venturing into the field for preliminary reconnaissance. The most
useful sources of geotechnical data are briefly outlined below.
2
1.2a Sources of Geotechnical Data.
o Topographic Maps.
Topographic maps are prepared by the U.S. Geological Survey (USGS) and
are available as a uniform map series covering the entire area of the United
States. The best-known USGS topographic maps are the 1:24,000 scale
series, also known as the 7.5-minute quadrangles. Topographic maps portray
physical features, elevation and relief of the ground surface, some vegetation
data, surface water and some man-made features. Topographic maps are
commonly used to determine distances, directions and slopes. The Soil
Survey Section of Materials and Research Division maintains topographic
map coverage of the entire State of Nebraska.
o Aerial Photographs.
Aerial photographs are available from various state and federal agencies.
Current aerial photographs can be used to gain an up-to-date picture of the
area of interest or to supplement maps for current use interpretations. Most
man-made features including roadways, buildings, quarries, railroads, and
drainage structures are readily visible on aerial photography. Experienced
interpreters can determine considerable information concerning soil types and
textures using only aerial photographs. Historical aerial photographs such as
those archived in the NDOR Roadway Design Vault may be useful in
determining the natural topography prior to construction of existing man-
made features. Historical aerial photographs may also reveal remnants of
previously existing man-made structures, some of which could adversely
affect proposed structures.
o Geologic Maps and Reports.
Information on geologic formations and structures that lie below the ground
surface, including the strike and dip of beds, can be obtained from geologic
maps and reports. Geologic maps show the location and relative position of
different geologic strata and contain information concerning the
characteristics of various layers. This information can be used to evaluate the
characteristics of the rock along proposed routes as well to indirectly evaluate
soil characteristics, as parent material is one of the factors significantly
influencing soil characteristics. Geologic maps and reports can be obtained
directly from the United States Geologic Survey (USGS). The Soil Survey
Section of Materials and Research Division maintains geologic maps that
pertain to the State of Nebraska.
3
o Soil Conservation Service (SCS) and USDA Surveys.
USDA and SCS soil surveys are compiled by the U.S. Department of
Agriculture, usually in the form of county soil maps. SCS Soil surveys show
the extent of soil units classified on the basis of the characteristics of different
soil horizons and the texture of the surface soil. Soil surveys can provide
extensive data on surface soils, including composition, grain size distribution,
drainage characteristics, geologic origin, and depth to bedrock. Soil maps are
often used in conjunction with geologic maps, as when the two are used
together they can provide exceptional clarity concerning soil conditions both
at and below the ground surface. The Soil Survey Section of Materials and
Research Division maintains those published USDA and SCS soil maps that
pertain to the State of Nebraska.
o Adjacent Projects.
Geotechnical data may also be available from nearby NDOR, county, city or
federal government projects. Geotechnical data from adjacent projects is
most commonly found in the form of boring logs. A boring log is continuous
record of the soil or rock types encountered as a shaft is extended downward
through subsurface layers. A brief description of the classification of the
various soil and rock types encountered as well as changes in rock/soil type
and level of water table are considered minimal information. Data such as
soil color, consistency, strength and compressibility are included in some
boring logs.
Boring logs maintained within Nebraska Department of Roads are stored in
three separate locations. The Bridge Foundation Unit stores written boring
logs for most bridge foundation location on Nebraska roads, dating from
approximately 1927 to the present. The Bridge Foundation Unit also stores
pile-driving records associated with pier and bent construction at specific
bridges, dating from approximately 1932 to the present. The Soil Survey
Unit stores boring data associated with grading operations for some projects,
with the earliest records dating from the early 1950’s. Older records are not
usually as complete as more recent information.
The Materials and Research Division Geotechnial Section recently began
storing boring logs in electronic format using in-house boring log software.
This information is available on the NDOR intranet at http:/soils/websel. The
Soil Survey Unit also maintains some borings logs from specific sites in
paper format, dating from approximately 1958 to the present.
A final source of geotechnical data may be as-built drawings from adjacent
projects. As-built drawings may contain soil conditions and properties
encountered during excavation or when creating cut sections. Data of this

4
type can prove invaluable for identifying problem areas or for establishing
preliminary boring locations and depths for subsequent borings.
Maintenance records for existing nearby roads and structures may provide
insight into surface soil conditions for some proposed projects. As-built
plans are available from Road Design and Bridge sections and through the
Communication’s Records Management Center.
o Field Reconnaissance
After the review of the existing data, the Geotechnical Engineer should visit
the project site. This visit will enable the engineer to obtain knowledge of
existing field conditions, confirm the observations with the data obtained in
the office, and determine the feasibility of boring locations.
5
Chapter 2
Geotechnical Subsurface Investigation Methods
2.1 Administrative Requirements
This section provides project managers, field boring supervisors and consultants
with guidance concerning the various requirements for obtaining subsurface data in
support of NDOR projects. Requirements contained herein may not be all
inclusive, especially when hazardous materials are encountered. General
requirements for all borings include:
o Check to ensure that the drilling equipment is adequately powered and
tooled to drill and sample all of the anticipated rock and soil strata. Check to
determine if special drilling or sampling procedures will be required.
o Observe and comply with federal, state and local laws, ordinances and
regulations that in any way affect the work being conducted.
o Obtain all applicable permits and licenses from the appropriate agencies.
Notify landowners of any work done on private land.
o Determine if environmental or archeological clearances are required if there
is sufficient evidence to suspect this may be a concern.
o Contact the Nebraska Digger Hotline at least 48 hours prior to starting any
drilling and/or sounding operations. Obtain a list of the underground utility
owners or administering organizations contacted by the Digger Hotline and
note if any of these organizations have indicated that their underground lines
are “clear” of the proposed drilling and/or sounding locations. Provide this
information to the field crew so that they can determine if all remaining
underground utilities have been marked at the field location. The field crew
must positively identify all underground utilities in the immediate area and
maintain a safe working distance from buried and overhead utility lines.
o Avoid clearing and grubbing operations if possible. If clearing and/or
grubbing is required, determine the minimum extent of clearing/grubbing to
provide access and working space at each boring location.
o Take reasonable precautions against damage to public and private property.
Document damage and promptly repair or make arrangements or pay for any
damage in accordance with NDOR administrative procedures.
o Ensure proper closure of all bore holes, according to applicable laws and
regulations of the State of Nebraska and local agencies.
6
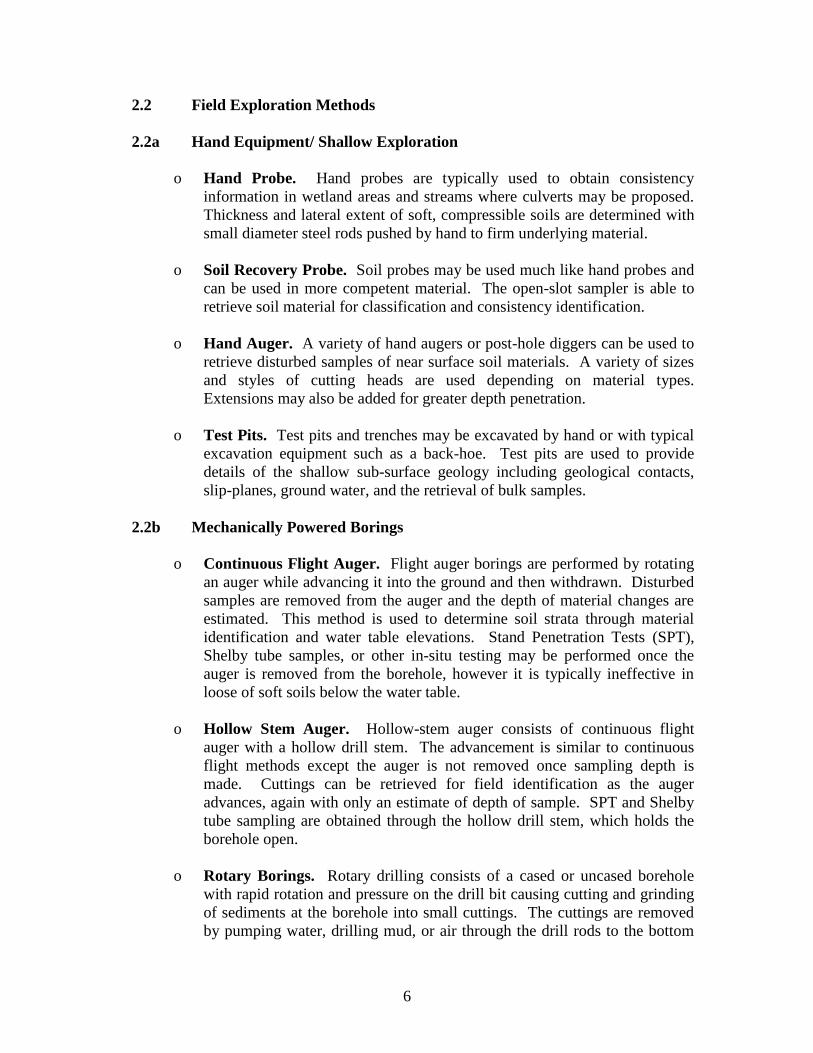
2.2 Field Exploration Methods
2.2a Hand Equipment/ Shallow Exploration
o Hand Probe. Hand probes are typically used to obtain consistency
information in wetland areas and streams where culverts may be proposed.
Thickness and lateral extent of soft, compressible soils are determined with
small diameter steel rods pushed by hand to firm underlying material.
o Soil Recovery Probe. Soil probes may be used much like hand probes and
can be used in more competent material. The open-slot sampler is able to
retrieve soil material for classification and consistency identification.
o Hand Auger. A variety of hand augers or post-hole diggers can be used to
retrieve disturbed samples of near surface soil materials. A variety of sizes
and styles of cutting heads are used depending on material types.
Extensions may also be added for greater depth penetration.
o Test Pits. Test pits and trenches may be excavated by hand or with typical
excavation equipment such as a back-hoe. Test pits are used to provide
details of the shallow sub-surface geology including geological contacts,
slip-planes, ground water, and the retrieval of bulk samples.
2.2b Mechanically Powered Borings
o Continuous Flight Auger. Flight auger borings are performed by rotating
an auger while advancing it into the ground and then withdrawn. Disturbed
samples are removed from the auger and the depth of material changes are
estimated. This method is used to determine soil strata through material
identification and water table elevations. Stand Penetration Tests (SPT),
Shelby tube samples, or other in-situ testing may be performed once the
auger is removed from the borehole, however it is typically ineffective in
loose of soft soils below the water table.
o Hollow Stem Auger. Hollow-stem auger consists of continuous flight
auger with a hollow drill stem. The advancement is similar to continuous
flight methods except the auger is not removed once sampling depth is
made. Cuttings can be retrieved for field identification as the auger
advances, again with only an estimate of depth of sample. SPT and Shelby
tube sampling are obtained through the hollow drill stem, which holds the
borehole open.
o Rotary Borings. Rotary drilling consists of a cased or uncased borehole
with rapid rotation and pressure on the drill bit causing cutting and grinding
of sediments at the borehole into small cuttings. The cuttings are removed
by pumping water, drilling mud, or air through the drill rods to the bottom
7
of the borehole. Drilling mud or casing is typically used to keep a borehole
open in soft or loose soils. Cuttings are observed at the surface for
identification and SPT or Shelby tubes can be obtained in an open borehole.
o Rock Coring. A core barrel is advanced through the rock through
simultaneous rotation and down-pressure. Circulation of water cools the bit
and removes cuttings. The rate of advancement depends on rock materials
with the desire to obtain maximum core recovery.
2.2c Soundings/ In-Situ Testing
A sounding is a type of exploration where a static or dynamic force is applied
to a rod tipped with a testing device with various sensors to penetrate soil.
Information obtained is measured and used to correlate with various soil
properties.
Standard Penetration Test (SPT). The most widely used test in the
geotechnical field, this test is a simple test that obtains a sample and data for
correlations. The sampling device is 2.5 feet long (0.762 m), with an outside
diameter of 2 inches (51 mm) and an inside diameter of 1.375 inches (35
mm). The device consists of a drive shoe, a split barrel and a head, which
attaches to drill rods. The SPT is normally conducted at 5-foot (1.5 m)
vertical intervals. The sampler is driven 6 inches (152 mm) below the bottom
of the hole to insure proper seating. It is then driven two additional 6-inch
increments, recording the blow count for each interval in a field log. (Note
that a calibrated auto-hammer is required for all SPT tests on NDOR
projects). The number of blows required to advance the split-spoon for each
of three 6-inch increments is recorded. The blow sum for the last 12 inches
of the test is called the N-value (blows per foot). Representative samples of
subsurface soils are obtained for purposes of identification, classification,
moisture or density testing or to obtain a measure of the relative density of
subsurface soils. The results of a SPT test can be correlated with the relative
density of granular cohesionless soils and somewhat less accurately with the
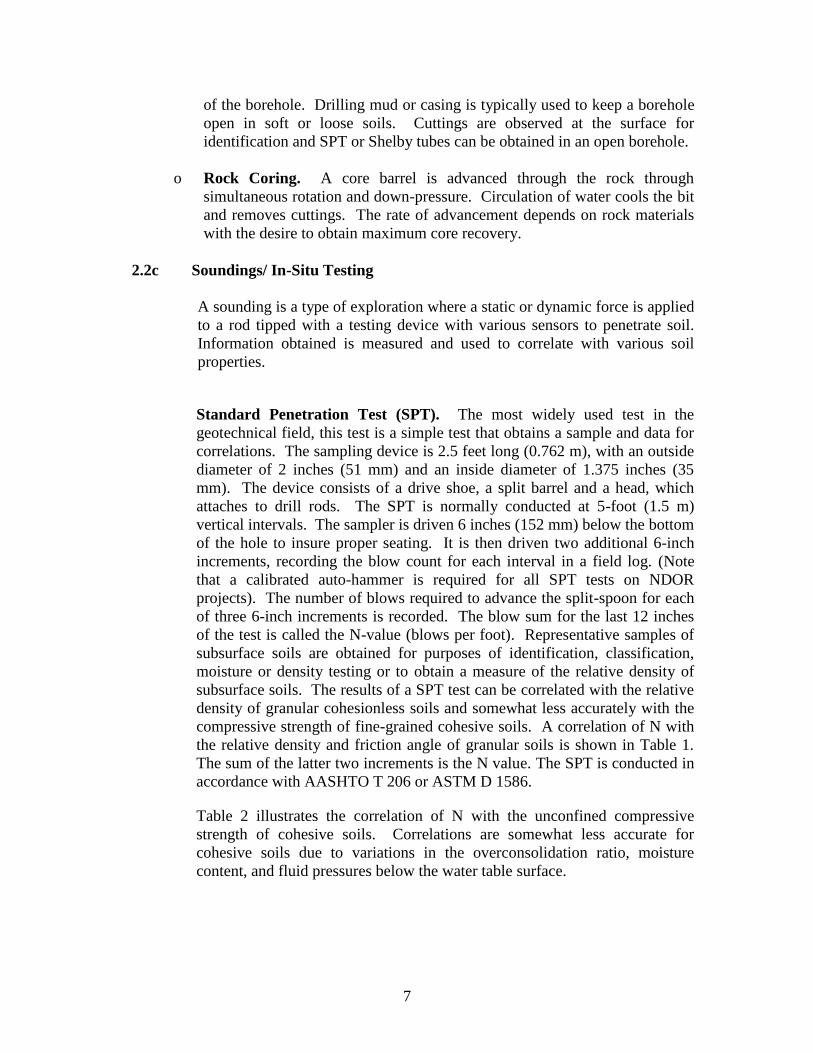
compressive strength of fine-grained cohesive soils. A correlation of N with
the relative density and friction angle of granular soils is shown in Table 1.
The sum of the latter two increments is the N value. The SPT is conducted in
accordance with AASHTO T 206 or ASTM D 1586.
Table 2 illustrates the correlation of N with the unconfined compressive
strength of cohesive soils. Correlations are somewhat less accurate for
cohesive soils due to variations in the overconsolidation ratio, moisture
content, and fluid pressures below the water table surface.
8
Table 1 – Relationship of N Value to Relative Density
and Friction Angle for Granular Soils
N Value Relative Density Friction Angle
0 - 4 Very Loose 26 - 30
4 - 10 Loose 28 - 34
10 - 30 Medium Dense 30 - 40
30 - 50 Dense 33 - 45
Over 50 Very Dense <50
Table 2 – Relationship of N Value to Strength and Consistency for
Cohesive Soils
N Value Consistency Strength, Qu, kPa (tsf)
< 2 Very Soft < 25 (0.25)
2 - 4 Soft 25 - 50 (0.25 - 0.50)
4 - 8 Medium Stiff 50 - 100 (0.50 - 1.0)
8 - 15 Stiff 100 - 200 (1.0 - 2.0)
15 - 30 Very Stiff 200 - 400 (2.0 - 4.0)
> 30 Hard 400 - 800 (4.0 - 8.0)
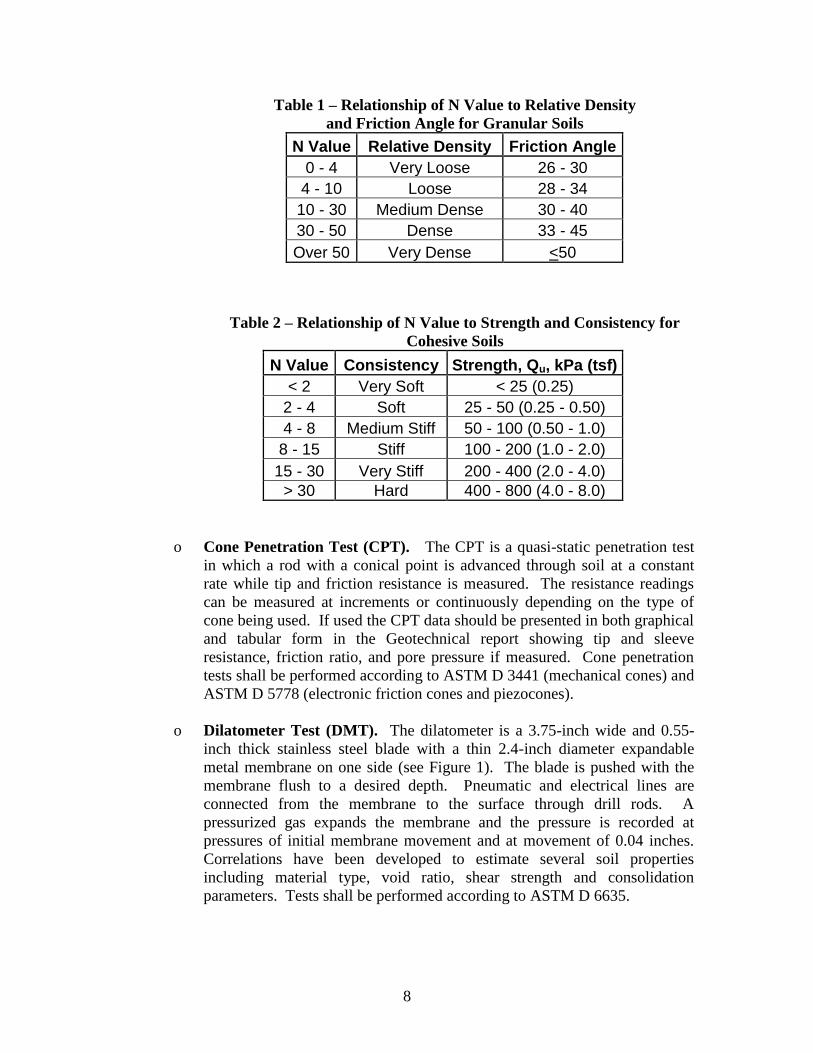
o Cone Penetration Test (CPT). The CPT is a quasi-static penetration test
in which a rod with a conical point is advanced through soil at a constant
rate while tip and friction resistance is measured. The resistance readings
can be measured at increments or continuously depending on the type of
cone being used. If used the CPT data should be presented in both graphical
and tabular form in the Geotechnical report showing tip and sleeve
resistance, friction ratio, and pore pressure if measured. Cone penetration
tests shall be performed according to ASTM D 3441 (mechanical cones) and
ASTM D 5778 (electronic friction cones and piezocones).
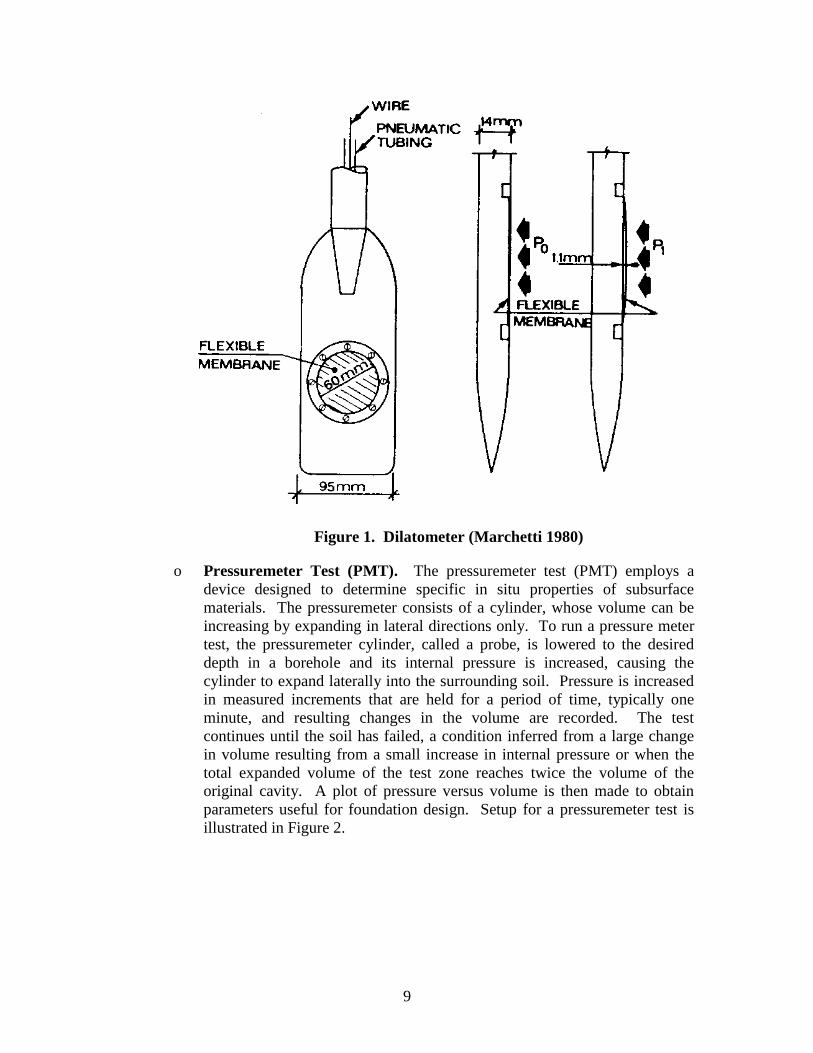
o Dilatometer Test (DMT). The dilatometer is a 3.75-inch wide and 0.55-
inch thick stainless steel blade with a thin 2.4-inch diameter expandable
metal membrane on one side (see Figure 1). The blade is pushed with the
membrane flush to a desired depth. Pneumatic and electrical lines are
connected from the membrane to the surface through drill rods. A
pressurized gas expands the membrane and the pressure is recorded at
pressures of initial membrane movement and at movement of 0.04 inches.
Correlations have been developed to estimate several soil properties
including material type, void ratio, shear strength and consolidation
parameters. Tests shall be performed according to ASTM D 6635.
9
Figure 1. Dilatometer (Marchetti 1980)
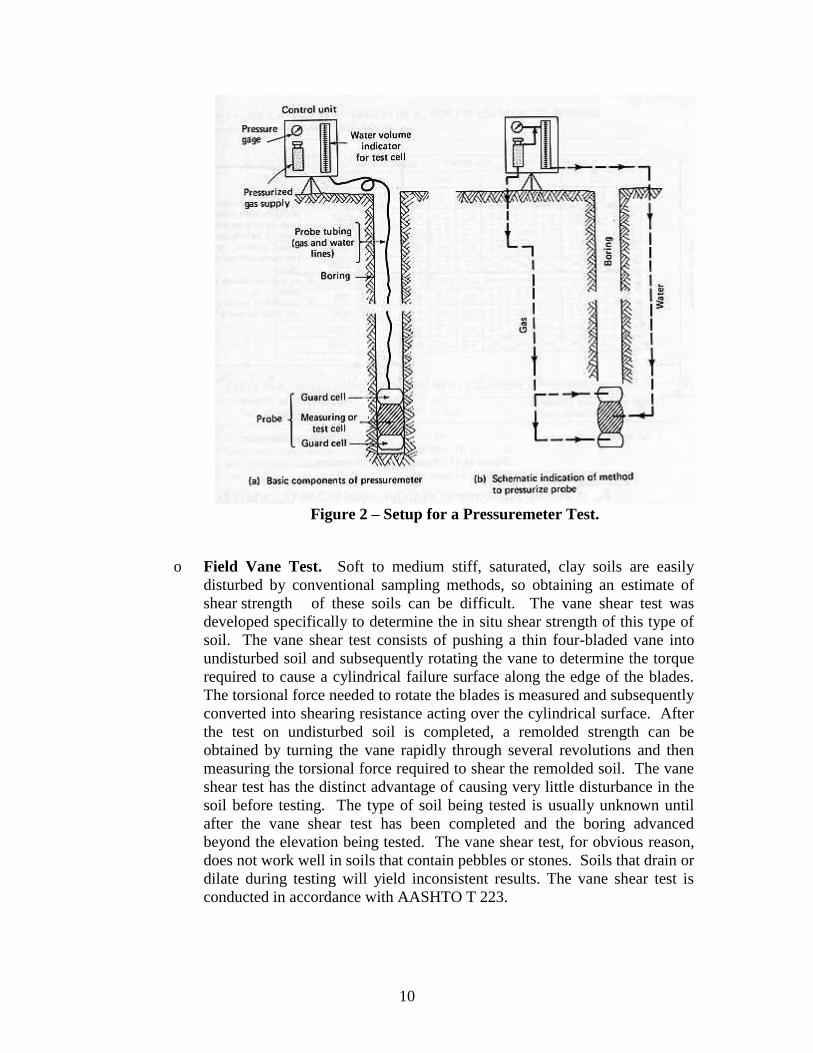
o Pressuremeter Test (PMT). The pressuremeter test (PMT) employs a
device designed to determine specific in situ properties of subsurface
materials. The pressuremeter consists of a cylinder, whose volume can be
increasing by expanding in lateral directions only. To run a pressure meter
test, the pressuremeter cylinder, called a probe, is lowered to the desired
depth in a borehole and its internal pressure is increased, causing the
cylinder to expand laterally into the surrounding soil. Pressure is increased
in measured increments that are held for a period of time, typically one
minute, and resulting changes in the volume are recorded. The test
continues until the soil has failed, a condition inferred from a large change
in volume resulting from a small increase in internal pressure or when the
total expanded volume of the test zone reaches twice the volume of the
original cavity. A plot of pressure versus volume is then made to obtain
parameters useful for foundation design. Setup for a pressuremeter test is
illustrated in Figure 2.
10
Figure 2 – Setup for a Pressuremeter Test.
o Field Vane Test. Soft to medium stiff, saturated, clay soils are easily
disturbed by conventional sampling methods, so obtaining an estimate of
shear strength of these soils can be difficult. The vane shear test was
developed specifically to determine the in situ shear strength of this type of
soil. The vane shear test consists of pushing a thin four-bladed vane into
undisturbed soil and subsequently rotating the vane to determine the torque
required to cause a cylindrical failure surface along the edge of the blades.
The torsional force needed to rotate the blades is measured and subsequently
converted into shearing resistance acting over the cylindrical surface. After
the test on undisturbed soil is completed, a remolded strength can be
obtained by turning the vane rapidly through several revolutions and then
measuring the torsional force required to shear the remolded soil. The vane
shear test has the distinct advantage of causing very little disturbance in the
soil before testing. The type of soil being tested is usually unknown until
after the vane shear test has been completed and the boring advanced
beyond the elevation being tested. The vane shear test, for obvious reason,
does not work well in soils that contain pebbles or stones. Soils that drain or
dilate during testing will yield inconsistent results. The vane shear test is
conducted in accordance with AASHTO T 223.
11
o Quick Shear Tests (Pocket Penetrometer and Torevane). The pocket
penetrometer and Torevane tests represent quick approximations of the
unconfined compression test. The first is performed using a hand held
penetration device called a pocket penetrometer. The device consists of
calibrated spring and 0.25 inch (6.4 mm) diameter piston, both contained
within an external metal casing. The test is performed in the field,
commonly on split spoon samples or on auger cuttings. When the piston
is forced (by hand pressure) to penetrate into a soil sample, the calibrated
spring is compressed providing an indication of unconfined compressive
strength, Qu, on the scale. The values obtained from the pocket
penetrometer test are generally not accurate enough for design
recommendations. The extremely small area of the piston, the skill of the
operator, and the specific point on the sample to which the piston is applied
influence the soil strength value obtained during this test. If small pebbles
are present in the sample, vastly different strength values may be obtained
from the same sample depending upon where the piston is inserted. Several
different penetrometer readings should be taken from the same and different
specimens and averaged before test results are reported. The pocket
penetrometer test provides the most accurate readings when used on soft to
medium stiff clays.
2.3 Soil Sampling
Common methods of sampling for Nebraska soil types are described below.
All samples should be properly preserved, labeled, and transported carefully
to the laboratory to ensure the integrity of the samples are maintained
according to ASTM D 4220.
o Bulk Bag Samples. These samples are disturbed samples obtained from
auger cuttings or test pits. The amount of sample obtained depends on the
intended testing to be performed but can be as little as 200 grams to 50 lbs
or more. Typically testing on these samples includes moisture content,
index tests, and moisture-density relations.
o Split-Barrel. Also know as split-spoon samples from the Standard
Penetration Test, the sampler is 2 inches in outer diameter and driven 18
inches. The sample is removed after driving, logged, and placed in an air-
tight container for later moisture content and index testing but are
considered disturbed samples and should not be used for strength of
consolidation testing. Refer to ASTM D 1586.
o Shelby Tube. This sampler is a thin-walled steel tube, typically 3 inches in
O.D. and 30 inches in length. The sampler is pushed into the soil in a fairly
rapid smooth motion, retracted and sealed on both ends for transportation.
Shelby tube samples are relatively undisturbed and are suitable for strength
and consolidation tests. Refer to ASTM D 1587 (AASHTO T 207).
12
2.4 Rock Core Sampling.
Rock cores shall be obtained in accordance to ASTM D 2113 Standard
Practice for Diamond Core Drilling for Site Excavation using either a double
or triple wall core barrel utilizing diamond or tungsten-carbine tipped bits.
There are basically three types of core barrels: Single tube, double tube, and
triple tube. Single tube core barrels generally provide poor recovery rates
and are not preferred. Refer to ASTM D 5079 for preserving and
transporting rock core samples.
o Double Tube Core Barrel. This core barrel consists of inner and outer tubes
equipped with a diamond or tungsten-carbide drill bit. As coring progresses
drilling fluid circulates downward between the inner and outer tubes to cool
the bit and wash ground up rock to the surface. The inner tube protects the
core sample from erosion of the drilling fluid. In a rigid type core barrel
both the inner and outer tubes rotate. In a swivel type core barrel the inner
tube remains stationary while the outer tube rotates.
o Triple Tube Core Barrel. This core barrel is similar to the double tube
except it has an additional liner that is either a clear plastic solid tube or a
thin metal split tube in which the core is retained. This barrel is preferred
when coring in fractured and poor quality rock.
2.5 Logging Requirements
Exploratory borings and soundings and in-situ testing are the main resource
of subsurface information which describes the geologic constraints pertaining
to a specific project and is the basis from which design decisions are made
from. Those involved in the subsurface investigation are responsible for
obtaining accurate information on which later engineering analysis will rely
on. The “Logger” is the term used for the person who records the data in the
field.
2.5a Duties of the Logger
o Acquire accurate subsurface information needed for the proper evaluation of
the geology of the project site.
o Observe, describe, record and evaluate all subsurface information,
exploration methods, and other operations performed as part of the
investigation.
o Examine drilling and sampling equipment for defects and that required
materials are available.
o Maintain a production summary of each boring that describes location,
elevation, depth, tests, start and finish date.
13
o Complete all logs using the established classification and testing criteria. (the
more information the better)
o Ensure proper sampling, preservation, labeling, storage, and transportation
methods.
o Communicate with the geologist or geotechnical engineer.
2.5b Field Identification of Soils (ASTM D 2488).
Tentative field identification of soil is based upon basic manual and visual
tests. Field identification should only be considered approximate. Field
identification of soil should always be confirmed by laboratory testing before
this information is used for design.
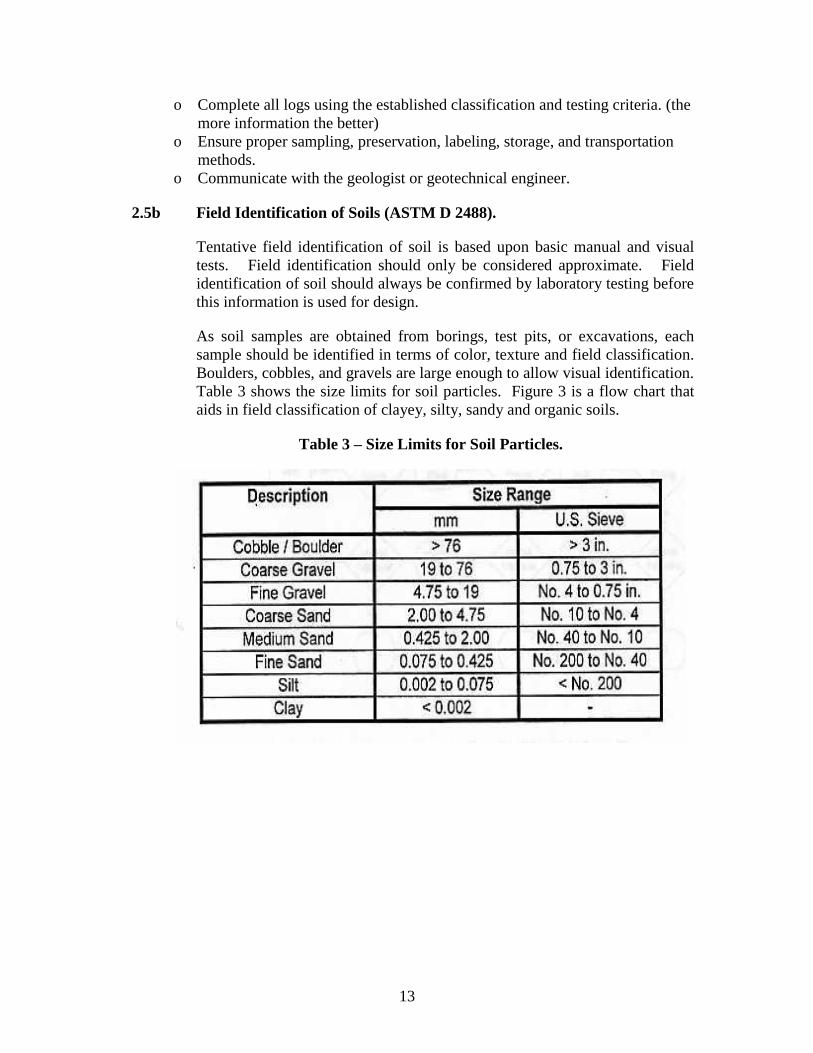
As soil samples are obtained from borings, test pits, or excavations, each
sample should be identified in terms of color, texture and field classification.
Boulders, cobbles, and gravels are large enough to allow visual identification.
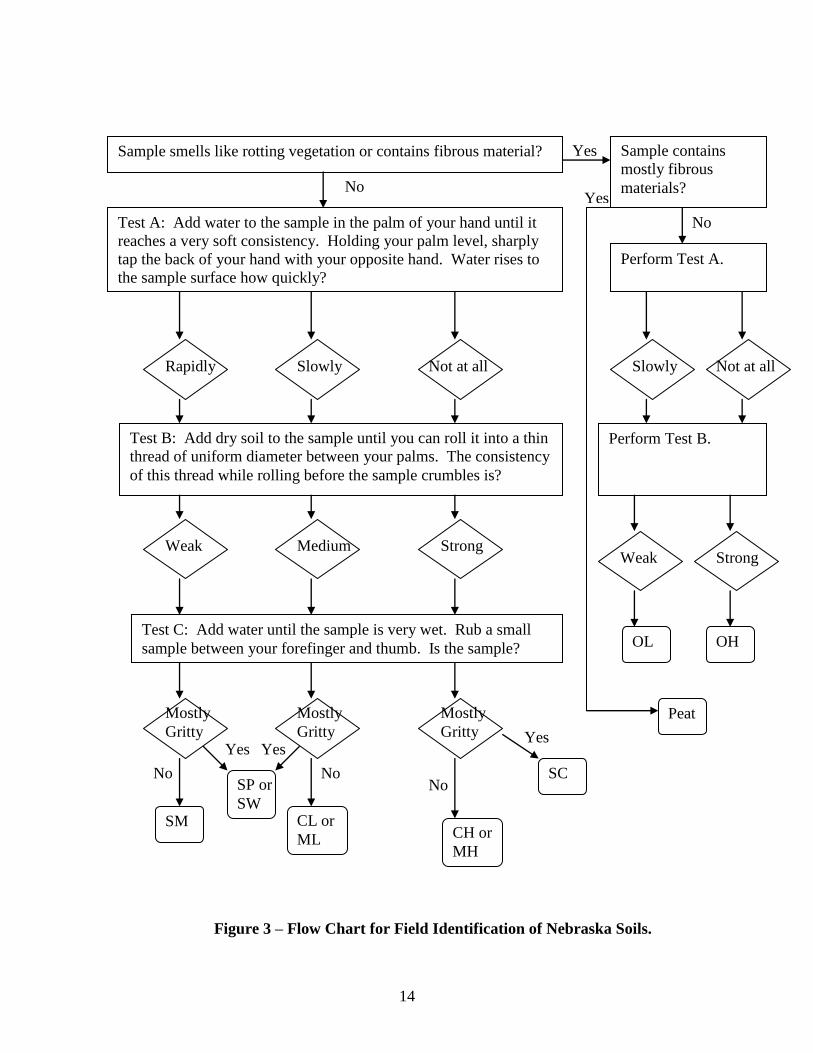
Table 3 shows the size limits for soil particles. Figure 3 is a flow chart that
aids in field classification of clayey, silty, sandy and organic soils.
Table 3 – Size Limits for Soil Particles.
14
Figure 3 – Flow Chart for Field Identification of Nebraska Soils.
Sample smells like rotting vegetation or contains fibrous material? Sample contains
mostly fibrous
materials?
Yes
Test A: Add water to the sample in the palm of your hand until it
reaches a very soft consistency. Holding your palm level, sharply
tap the back of your hand with your opposite hand. Water rises to
the sample surface how quickly?
Perform Test A.
No
No
Rapidly Slowly Not at all Not at all
Test B: Add dry soil to the sample until you can roll it into a thin
thread of uniform diameter between your palms. The consistency
of this thread while rolling before the sample crumbles is?
Perform Test B.
Test C: Add water until the sample is very wet. Rub a small
sample between your forefinger and thumb. Is the sample?
Weak
Mostly
Gritty
Yes
Slowly
Medium Strong
Mostly
Gritty
Mostly
Gritty
No SP or
SW SM
Yes
No
CL or
ML
Weak Strong
OL OH
Peat
Yes
SC No
CH or
MH
Yes
15
2.5c Field Identification of Rock.
Rock is the parent material of soil and is normally more coherent and
consolidated than soil. Rock is classified into three broad categories,
igneous, sedimentary and metamorphic. Igneous rocks result from
volcanism, either at the earth’s surface or below. Sedimentary rocks result
from the debris of physical and chemical weathering processes being
deposited in sedimentary basins, compacted and then uplifted. Metamorphic
rocks result from some other type of rock being exposed to temperatures and
pressures commonly found inside the earth’s crust. Only sedimentary rocks
are commonly encountered in Nebraska.
At minimum, field identification of rock should include:
o Rock type, if possible (shale, sandstone or mudstone)
o Color (which may change with weathering/moisture)
o Moisture condition (wet or dry)
o Grain size and shape (if visible)
o Texture (stratified, foliated, thin-bedded, massive, etc.)
o Noticeable weathering or alteration of sample
When core samples of rock are obtained, core recovery and rock quality
designation (RQD) should be measured. The core recovery ratio is the length
of rock core recovered from a core run, divided by the total length of the core
run. The core recovery ratio provides information regarding the presence of
weathered zones within the rock mass.
The RQD is the sum of the lengths of all pieces of sound core over 4 inches
(100 mm) in length from a core run divided by the length of a core run. To
illustrate, if the core run length is 48 inches, and there are12 rock pieces, 8 of
which have lengths less than 4 inches and 4 pieces with lengths of 4.1 inches,
5.0 inches, 5.5 inches and 6.1 inches respectively, the RQD for this rock is
(4.1 + 5.0 + 5.5 + 6.1)/48 = 43.1%. The length of each piece is an average
measured from the midpoints of each end. Several correlations have been
developed that relate the RQD with the strength and quality of a rock mass.
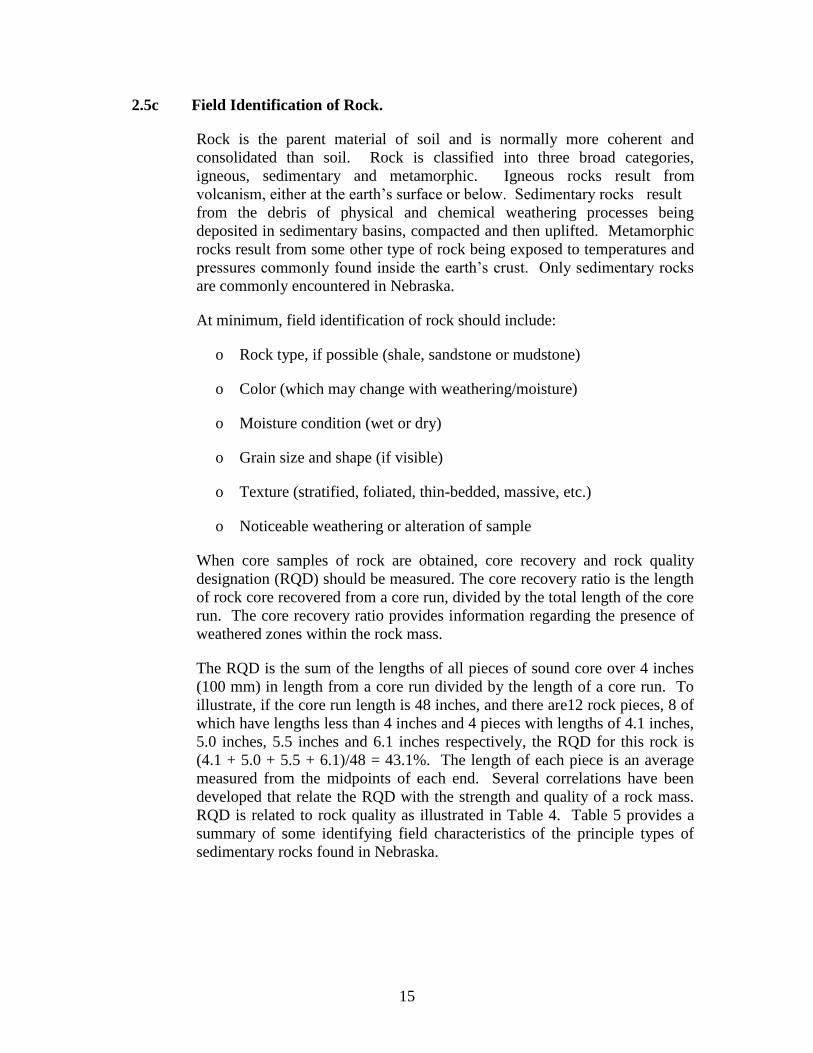
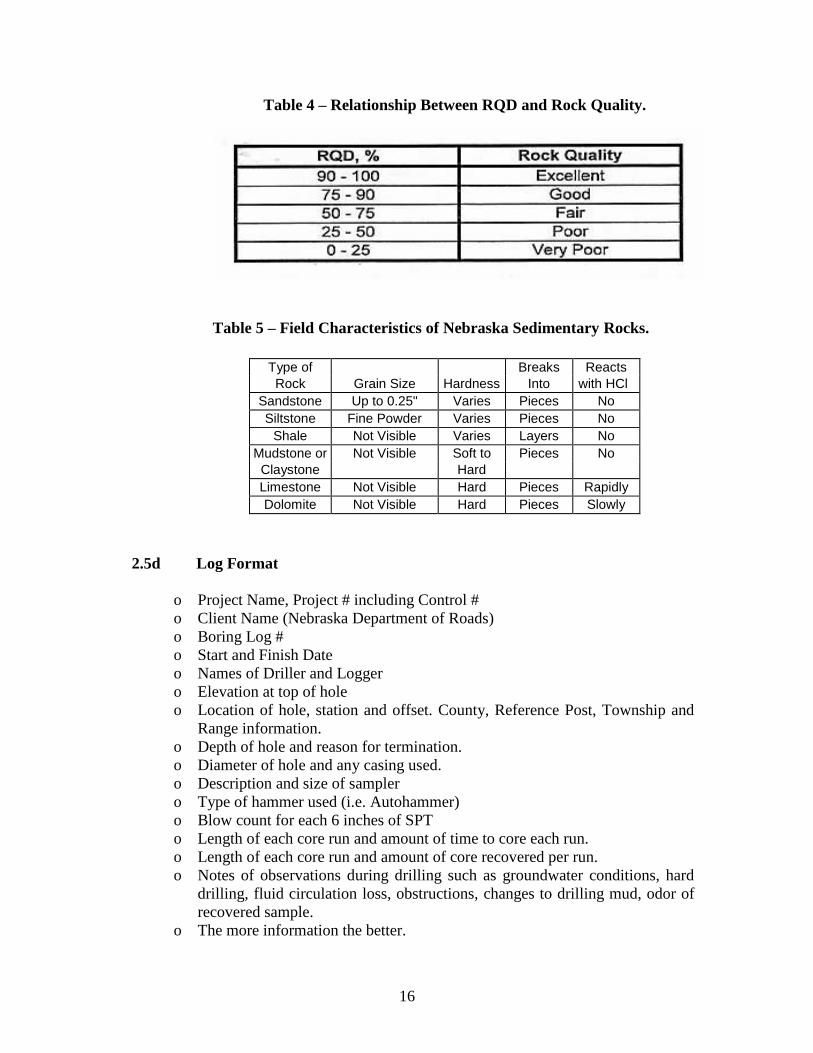
RQD is related to rock quality as illustrated in Table 4. Table 5 provides a
summary of some identifying field characteristics of the principle types of
sedimentary rocks found in Nebraska.
16
Table 4 – Relationship Between RQD and Rock Quality.
Table 5 – Field Characteristics of Nebraska Sedimentary Rocks.
Type of Breaks Reacts
Rock Grain Size Hardness Into with HCl
Sandstone Up to 0.25" Varies Pieces No
Siltstone Fine Powder Varies Pieces No
Shale Not Visible Varies Layers No
Mudstone or Not Visible Soft to Pieces No
Claystone Hard
Limestone Not Visible Hard Pieces Rapidly
Dolomite Not Visible Hard Pieces Slowly
2.5d Log Format
o Project Name, Project # including Control #
o Client Name (Nebraska Department of Roads)
o Boring Log #
o Start and Finish Date
o Names of Driller and Logger
o Elevation at top of hole
o Location of hole, station and offset. County, Reference Post, Township and
Range information.
o Depth of hole and reason for termination.
o Diameter of hole and any casing used.
o Description and size of sampler
o Type of hammer used (i.e. Autohammer)
o Blow count for each 6 inches of SPT
o Length of each core run and amount of time to core each run.
o Length of each core run and amount of core recovered per run.
o Notes of observations during drilling such as groundwater conditions, hard
drilling, fluid circulation loss, obstructions, changes to drilling mud, odor of
recovered sample.
o The more information the better.
17
2.5e Backfilling Borings.
Recommended procedures for backfilling geotechnical borings contained in
the paragraphs that follow pertain to typical situations only. In atypical
situations, additional seals or plugs may be required to prevent contamination
of adjacent aquifers. AASHTO PP33-96 “Standard Guide for
Decommissioning Geotechnical Exploratory Boreholes” and AASHTO R 21-
96 “Standard Recommended Practice for Drilling for Subsurface
Investigations – Unexpectedly Encountering Suspected Hazardous Material”
provide additional details for closing boreholes in atypical situations.
Where no aquifers are encountered during drilling, borings may be backfilled
with auger cuttings. Borings in alluvial valleys should be backfilled with an
impervious grout seal or a bentonite clay plug. The plug should be emplaced
as the casings are extracted from the completed boring. The plug should
extend upward from the top of water table elevation a minimum of three feet
(one meter). The remainder of the borehole may be backfilled with auger
cuttings.
Borings that intersect multiple aquifers should be backfilled with impervious
grout seals or bentonite clay plugs as the casing is extracted from the
completed borehole. The plugs should extend upward from the top of each
aquifer for a minimum of three feet (one meter). The remainder of the
borehole may be backfilled with auger cuttings.
Impervious grout seals and bentonite clay plugs are emplaced to prevent
surface water or water from shallow water pockets from entering lower
elevation aquifers. Seals and/or plugs also prevent migration of water
between adjacent vertical aquifers via the borehole.
18
Chapter 3
Subsurface Investigation Guidelines for Highways and Related
Structures
A subsurface investigation should be performed at locations of new structures,
roadways, widening, extensions, and repair locations as directed by the
Geotechnical Engineer. This chapter provides guidance on planning a
subsurface investigation for typical roadway construction. The amount and
type of information obtained during a subsurface investigation are often
limited by time, manpower, equipment, access, or funding. However, an
investigation should provide at a minimum, sufficient data for the
Geotechnical Engineer to recommend the most efficient design.
3.1 General Requirements
The extent of an exploration varies based on the nature of the project and the
complexity of the existing geology. The following standards apply to all
investigations for the specific project agreed upon by the Geotechnical
Engineer.
o Preliminary exploration depths should be estimated from the review of
available data, the field reconnaissance, and local experience. The borings
should penetrate through unsuitable foundation materials (soft clays, loose
sands, etc.) and terminate in competent material capable for support of the
proposed foundations.
o Borings for bridges over waterways shall extend a minimum of 30’ below
estimated scour depth.
o Each boring, sounding, hand boring, or test pit shall be given a unique
identification number for easy identification. Bridge borings shall have the
prefix of “BR”, Soil Mechanics borings a prefix of “SM”, and Soil Survey
borings a prefix of “SS”.
o The ground surface elevation and location shall be located accurately for
each boring either by survey using GPS or project stationing.
o A sufficient number of samples shall be collected for each soil layer
encountered in order to provide sufficient testing capability.
o Water table observation within each boring or test pit should be recorded at
first encounter and after sufficient time has allowed for the water table to
stabilize.
19
o Unless used as an observation well, each borehole, sounding, hand boring,
and test pit shall be backfilled according AASHTO PP33-96 “Standard
Guide for Decommissioning Geotechnical Exploratory Boreholes”.
3.2 Minimum Guidelines for Investigations
The following guidelines represent the minimum extent of exploration and
testing expected for most typical projects and shall be adapted to the specific
requirements of each project. It should be noted that these guidelines only
discuss the use of conventional borings. The Geotechnical Engineer may
consider it appropriate to use additional methods such as soundings,
geophysical methods, test pits, or in-situ testing to supplement or substitute
borings for some of the conventional borings noted in the following sections.
3.3a Soil and Subgrade Survey Borings for Roadways.
Soil and subgrade surveys are an essential part of a preliminary engineering
survey for location and design purposes. Information on the distribution of
soils and groundwater conditions must be obtained before a reasonable and
economic design can be developed for a highway project. The information
contained within these surveys is also useful for construction inspectors, as it
provides a method of checking construction practices.
A soil survey is generally conducted prior to final preparation of the grading
plans for roads on which the ultimate surface will be rigid or flexible
pavement. A soil survey is conducted by drilling a row of holes into the
proposed excavation, usually along the centerline or offset along either side
of the centerline within the limits of construction. When drilling into rock
layers that are not level or when one row of holes will not provide the
required information, additional rows of holes may be drilled. Soils are
examined visually and by “feel” as they emerge from the auger. A
description of each soil and depth of each soil layer change is recorded in the
drilling log. In addition, samples are retrieved for laboratory testing. If a
water table or wet zone is encountered during the survey, its location and
extent are recorded. Additional supplemental borings should be taken to
determine the source and extent of the water.
A subgrade survey is generally conducted on previously graded roads for
which rigid or flexible pavement is being designed. Reasons for conducting a
subgrade survey include: 1) divide the project into sections based upon type
of soil in the upper subgrade, 2) identify and locate any problems with
moisture in the existing subgrade, 3) provide information for the design of the
pavement section. A subgrade survey is similar to a soil survey with the
exception that the boreholes for a subgrade survey are on or near the road
centerline or within the proposed traffic lanes. Areas showing “frost boil” on
the existing road surface are generally bored in detail to determine the cause
20
and possible methods of mitigating boiling. Requirements for spacing, depth
and sampling when conducting soil and subgrade surveys are contained in the
following paragraphs.
o Spacing Requirements.
Borings should be spaced at intervals of 500 ft (150 meters) or less depending
upon degree of variation in soil properties. Boring intervals may be reduced
to as little as 25 ft (8 m) in areas where a high water table exists or where a
complex subsurface profile exists. The soil surveyor will determine all
drilling locations. Sufficient borings will be completed to determine the
cause, extent and possible mitigation for wet zones and water tables, as well
as other potential problem soils.
o Depth Requirements.
Borings should be deep enough to penetrate the major soil types at each
location. Normally a depth of 5 feet (1.5 meters) beneath the grade or below
the base elevation of the deepest excavation will be sufficient for soil
surveys. A depth of 4 ft (1.2 m) will generally be sufficient for subgrade
surveys. The soil surveyor will determine if greater depth is necessary at
certain locations or for specific projects.
o Sampling Requirements.
Sampling and soil testing requirements are primarily dependent upon
pavement design. Samples should normally be taken at every change in soil
type or once for every five borings. If the soil type in a particular boring is
similar to that represented by a sample taken previously, this is indicated in
the notes in lieu of taking another sample. Thus the total number of samples
submitted for testing is held to a reasonable number. Large samples (60
lbs/35 kg) of each soil type encountered are initially collected for testing.
Two smaller samples (20 lbs/10 kg) are collected per linear mile to confirm
that the soil type has not changed. Moisture content samples are collected
when soils appear to be excessively wet and as significant changes in
moisture content are noticed.
3.3b Borings for Borrow Pits.
Investigation of borrow pit locations is primarily directed toward the stability
properties of soil for use as subgrade material or within embankments. Since
excavation and remolding tend to intermix soil units, thin seams of soil
within thicker units may not require separate testing. However, suspected
deleterious properties of a soil seam of any thickness should be noted in the
drilling log as boring progresses.
The number of borings required at a particular location is highly dependent
upon the stratigraphy, layout and depth of the borrow site. Borings should be

21
spaced close enough to accurately determine all soil types and the thickness
of each soil unit within the borrow area. Representative samples should be
obtained from the proposed borrow area and tested for Atterberg limits,
percent silt, percent clay, particle size distribution, in-situ moisture content,
group index, USCS soil classification, percent organic material, moisture-
density relationship and remolded compressive strength.
3.3c Borings for Wetlands.
Borings for wetlands are performed primarily to determine depth to the
ground water table. However, samples should be taken of each soil type
encountered and lab tests conducted to determine its engineering properties.
NDOR Planning and Project Development Section may specify the pattern
and location of boreholes or this may be left to the discretion of field
personnel. A geologist or soil surveyor should determine distance between
boreholes. Distance between boreholes depends upon variations in the soil
or geologic profiles encountered at each project location. In locations where
little to no variation in profiles exists, one borehole may suffice for the entire
project.
3.4a Borings for Soil Mechanics
Soil Mechanics borings are performed for embankments, retaining walls,
culverts, and slope failure locations with an emphasis on settlement, bearing
capacity, and slope stability.
o Embankment Spacing Requirements.
New Roadway Alignments: If embankment height will be greater than or
equal to 20 ft (6 m), boring interval should range from 300 ft (90 m) to 1,000
ft (300 m). Typically borings will be situated along the centerline of a single
pavement or along the median if the embankment will support multiple
pavements. Larger intervals can be used when drilling boreholes for smaller
embankments.
Roadway Widening: Boreholes should be located along the shoulders and in
the roadway ditch for embankments associated with roadway widening or
slope flattening projects. For long, tall embankments with heights greater
than 20 ft (6 m) or longer than 500 ft (150 m), the boring interval should
range from 300 ft (90 m) to 1,000 ft (300 m). When an embankment will
support the entire roadway width, borings should be alternated between sides
of the roadway at the same interval.
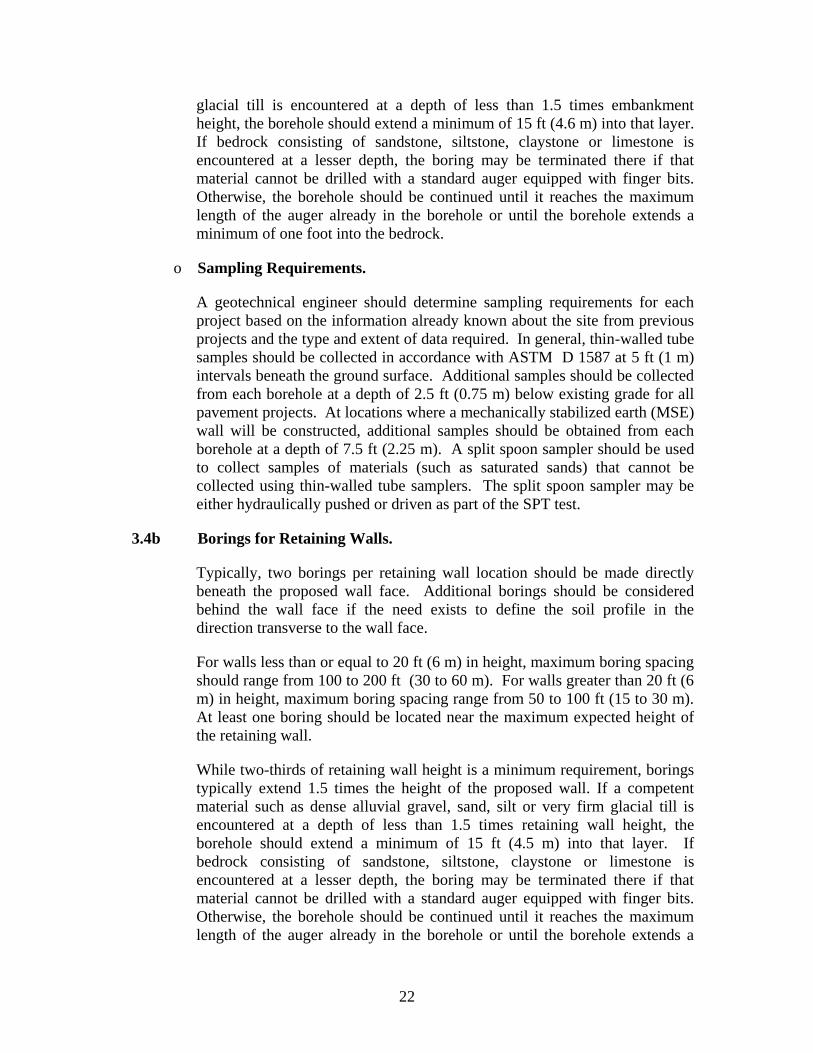
o Depth Requirements.
While two-thirds of embankment height is the minimum requirement, borings
typically extend 1.5 times the height of the proposed embankment. If a
competent material such as dense alluvial gravel, sand, silt or very firm
22
glacial till is encountered at a depth of less than 1.5 times embankment
height, the borehole should extend a minimum of 15 ft (4.6 m) into that layer.
If bedrock consisting of sandstone, siltstone, claystone or limestone is
encountered at a lesser depth, the boring may be terminated there if that
material cannot be drilled with a standard auger equipped with finger bits.
Otherwise, the borehole should be continued until it reaches the maximum
length of the auger already in the borehole or until the borehole extends a
minimum of one foot into the bedrock.
o Sampling Requirements.
A geotechnical engineer should determine sampling requirements for each
project based on the information already known about the site from previous
projects and the type and extent of data required. In general, thin-walled tube
samples should be collected in accordance with ASTM D 1587 at 5 ft (1 m)
intervals beneath the ground surface. Additional samples should be collected
from each borehole at a depth of 2.5 ft (0.75 m) below existing grade for all
pavement projects. At locations where a mechanically stabilized earth (MSE)
wall will be constructed, additional samples should be obtained from each
borehole at a depth of 7.5 ft (2.25 m). A split spoon sampler should be used
to collect samples of materials (such as saturated sands) that cannot be
collected using thin-walled tube samplers. The split spoon sampler may be
either hydraulically pushed or driven as part of the SPT test.
3.4b Borings for Retaining Walls.
Typically, two borings per retaining wall location should be made directly
beneath the proposed wall face. Additional borings should be considered
behind the wall face if the need exists to define the soil profile in the
direction transverse to the wall face.
For walls less than or equal to 20 ft (6 m) in height, maximum boring spacing
should range from 100 to 200 ft (30 to 60 m). For walls greater than 20 ft (6
m) in height, maximum boring spacing range from 50 to 100 ft (15 to 30 m).
At least one boring should be located near the maximum expected height of
the retaining wall.
While two-thirds of retaining wall height is a minimum requirement, borings
typically extend 1.5 times the height of the proposed wall. If a competent
material such as dense alluvial gravel, sand, silt or very firm glacial till is
encountered at a depth of less than 1.5 times retaining wall height, the
borehole should extend a minimum of 15 ft (4.5 m) into that layer. If
bedrock consisting of sandstone, siltstone, claystone or limestone is
encountered at a lesser depth, the boring may be terminated there if that
material cannot be drilled with a standard auger equipped with finger bits.
Otherwise, the borehole should be continued until it reaches the maximum
length of the auger already in the borehole or until the borehole extends a
23
minimum of one foot into the bedrock. The boring depth for sheet piling
should be at least twice the minimum exposed wall height.
3.4c Borings for Culverts.
o Borings for Concrete Box Culverts.
A concrete box culvert relies on the soil beneath its base to support its weight
and to provide structural stability. Because most box culverts are located in
stream or riverbeds, subsurface deposits at proposed box culvert locations
often consist of alluvial materials that may not have sufficient stability to
adequately support the proposed structure. At least one boring or other type
of subsurface investigation (SPT, CPT, etc.) is recommended at each
proposed box culvert location where the height of embankment will be in
excess of 12 ft (3.5 m) above stream channel level or 10 ft (3 m) above the
top of the culvert. The information collected will enable a geotechnical
engineer to anticipate subsurface conditions and recommend prudent
subgrade improvement.
o Borings for Pipe Culverts.
NDOR currently does not require any subsurface investigation prior to
installation of pipe culverts. Pipe culverts are similar to box culverts, except
pipe culverts are generally smaller, round versus rectangular in shape, and are
commonly precast versus cast-in-place. Their smaller size, round shape and
precast construction make pipe culverts much less susceptible to problems
resulting from poor soil conditions than traditional box culverts. At least one
type of subsurface investigation (boring, SPT, CPT, etc.) is recommended at
each proposed location where problems associated with differential
settlement are anticipated. If surface soils are found to be unsuitable at a
proposed location, the subsurface investigation will provide information that
will enable a geotechnical engineer to recommend a suitable method of
subgrade improvement.
3.5a Borings for Bridge Foundations
A single boring at the location of a proposed structure will cost less than a
single pile, but the knowledge obtained from that single boring might allow
elimination of all piles beneath a structure. Without boring data, the design
engineer is unable to utilize his knowledge or experience to design a safe but
economical foundation. He must instead use an extremely conservative
design characterized by a high factor of safety, which is always more
expensive.
If general knowledge of local subsurface conditions is available from
geological studies, earlier investigations or records from nearby existing
24
structures, the scope of a foundation investigation may be detailed in
advance. Otherwise, the extent of work is normally established as the
investigation proceeds. The number, depth, spacing and specific tests
required in a subsurface investigation are so dependent upon the type of
structure and specific site conditions that no general rules are applicable in all
situations.
o Spacing Requirements
A minimum of one boring is commonly required for each structural abutment
or pier, and at the end of any wingwall that measures over 30 ft (9 m) in
length. The pattern should be staggered so that borings are at the opposite
ends of adjacent footings. Piers or abutments over 100 feet (30 m) in length
require one boring at the extremities of each abutment. For spread footing
designs on sloping rock surfaces, additional borings are recommended.
o Boring Depths
Boring depths must consider the most likely foundation type for the bridge
based on the existing geology and design loads. The depth of boring required
can estimated from earlier investigations, from adjacent projects, or from
specified boring resistance data such as “The borings for structural
foundations shall be terminated when a minimum resistance criteria of 20
blows per foot on the sample spoon has been achieved for 20 feet of drilling”.
The minimum resistance criteria is commonly modified depending upon the
foundation capacity required at the site.
o Sampling Requirements
Split spoon samples are normally obtained at 5-foot (1.5 m) intervals or when
changes in material are encountered. Continuous split spoon samples are
recommended for the top 15-foot (5 m) when the footings will be placed on
natural soils. Split spoon samples are generally “disturbed” when obtained
and thus are not suitable for laboratory determination of strength or
consolidation parameters. Undisturbed Shelby tube samples should be
obtained at 5-foot (1.5 m) intervals when working with cohesive soils. For
cohesive soils greater than 30-foot (10 m) in depth, Shelby tube sample
intervals can be increased to 10 feet (3 m). In soft clay soils, in-situ vane
shear strength tests are recommended at 5 to 10-foot (1.5-3.0 m) intervals.
Split spoon samples must be carefully sealed in plastic bags and placed in jars
before being sent to the laboratory for analysis. Shelby tube samples must be
sealed and stored upright in a shockproof container for transportation to the
laboratory.
Standard penetration test (SPT) data should be recorded for each boring in
accordance with ASTM D 1586 and placed in the drill log. The drill crew
25
should also continuously perform a rough visual analysis of soil samples and
record their observations in the drill log.
Cone Penetration Test (CPT) soundings may be performed in accordance
with ASTM D 3441-94 to supplement borings to help identify the depth and
thicknesses of hard and soft layers, sampling selecting, and provide
information between borings.
The water level in each borehole should be recorded along with data on when
the observation was made. Artesian pressure can be measured by extending
the drill casing above ground level until flow stops. An erroneous indication
of water level may result when water is used as a drilling fluid and adequate
time is not allowed after hole completion for the water level to stabilize. In
clay soils, one week or more is required before an accurate reading can be
obtained.
To avoid confusion, a unique number should be used to identify each
borehole on a project. One solution to avoid duplication is to designate that
all boreholes for bridge piers or abutments begin with the letter “BR”, and a
sequential number from a series of numbers assigned to that specific project.
For example, the first borehole on a bridge project might be designated BR-
100. Drill holes for embankments begin with the letters “SM” while drill
holes for cut sections could begin with the letter “SS”.
The guidelines listed in previous paragraphs will provide minimum data on
the soil types, their relative density and the position of the groundwater table
required by the design engineer to create a safe and economical foundation.
Extremely soft or otherwise unusual soil conditions may require testing in
addition to what has been specified above.
3.6a Borings for Other Structures
3.6b Borings for Buildings.
The number of borings and spacing between borings for a building project is
directly related to the type and size of the planned structure along with the
associated live and dead loads. Variations in soil conditions will affect the
extent to which the design engineer feels comfortable interpolating
subsurface conditions between borings. Demands of municipal building
codes and the funds available for the boring program may also affect the
number of borings completed for a building.
Most building projects are unique to some degree, so it is difficult to establish
a set of rules which will answer all of the designer’s or contractor’s questions
under all circumstances. A minimum of two borings or a combination of one
boring and one subsurface test (SPT, CPT, shear vane test, etc.) should be
taken at the proposed site of any building. Larger buildings will require more
data. Building corners are typically selected as borehole/subsurface test
26
locations. Borehole/subsurface test spacing should not exceed 200 feet. For
buildings with critical components requiring small settlement tolerances or
high load capacity or where the subsurface conditions are extremely variable,
boring/subsurface test pacing should be reduced accordingly. Borings
/subsurface test locations should be selected to investigate known or
suspected special conditions, such as filled-in basements, covered drainage
pathways or historic dump sites.
Consideration should be given to performing a preliminary investigation to
obtain information about general subsurface conditions. From the
information obtained during the preliminary investigation, a final subsurface
exploration program that answers most questions can be planned.
Borings/subsurface test depths will vary according to the type of soil present
at the project location. For cohesive soils, test holes should extend to a depth
where loads imposed on the soil surface have dissipated to approximately ten
percent of the surface value. This depth is approximately three times the
spread footing width below the base of the footing. Test holes should not be
terminated in cohesive soils where the consistency is less than medium stiff
(unconfined compressive strength is less than 0.5 tsf).
In granular soils, boreholes should extend to a depth at least three times the
footing width below the base of the footing, or 1.5 times the height of
emplaced fill, whichever is greater. When boreholes extend through
stratified layers of both cohesive and granular materials, depth should be
determined by the more stringent of the above criteria. If bedrock is
encountered before the above criteria are met, the borehole can be stopped at
that point.
A geotechnical or soil mechanics engineer should provide the driller with an
estimate of the type and depth of materials expected. The driller should
contact the engineer if significant differences are encountered. Additional
depth, additional sampling frequency or additional boreholes may be
required.
Sampling frequency is dependent upon the type of subsurface testing being
performed in conjunction with the drilling program. More sophisticated
subsurface testing (i.e. electronic CPT testing) may allow for significant
reduction in the number of samples versus would be required without testing.
Sampling frequency (with no additional subsurface testing) should be no
greater than 2.5 feet of depth, with samples taken in cohesive soils using thin-
wall tubes while SPT samples are collected for granular soils. Samples
should be taken to a minimum depth corresponding to the footing width or to
a depth at least five feet below the base of the footing whichever is greater. If
the borehole extends beyond this depth, sample frequency can be reduced to
one sample for every five feet of borehole.
27
3.6c Borings for Traffic Control Structures.
Responsibility commonly rests with the contractor to investigate soil
conditions, emplace the foundation for and erect traffic control structures.
The major concern is to have adequate foundation depth to resist the
overturning moment resulting from wind loads acting near the opposite end
of the structure. If the structure is a single support cantilever design,
rotational forces resulting from the weight of the structure itself must also be
considered.
Foundation designers often complete an initial design based upon assumed
minimum soil strength. If soil strength is questionable, a split-spoon or
Shelby tube boring can be made at the proposed location to obtain a soil
sample for testing. The test will either verify the assumed minimum soil
strength or provide the foundation designer with additional data that can be
used to modify the design.
3.6d Borings for Light Poles.
Light poles are similar to traffic control structures, except that a section of the
pole generally serves as the foundation for the length of pole extending above
the ground surface. The length of pole beneath the soil surface must be
sufficient to resist overturning moment resulting from wind loads near the top
of the structure. Depth of embedment is generally fairly constant based upon
experience or extended practice. Few light poles fail from insufficient depth
of embedment.
Light pole failure generally results from soils having insufficient shear
strength to resist lateral wind forces. In some instances, the wind can exert
sufficient lateral force to move the pole from a nearly vertical orientation to a
more severely inclined orientation. In locations near where this situation has
occurred in the past, one or more subsurface borings will provide data
necessary for a geotechnical engineer to provide suggestions on how to
alleviate the problem.
28
Chapter 4
Laboratory Testing
Laboratory testing is a vital part of the geotechnical investigation and must be done
correctly and according to AASHTO and ASTM procedures. Consequently all firms
performing geotechnical laboratory testing for NDOR must be certified by AMRL or
equivalent agency. An efficient and accurate lab testing program should provide the
engineer with sufficient information to complete an effective and economical design.
This chapter briefly describes typical laboratory tests, their purpose, and the use of the
data obtained from the tests. Not every test is described may be applicable to every
project. Engineering judgment must be used to set up a testing program to provide the
information required for each individual project.
4.1 Soil Classification Systems (AASHTO and USCS).
o AASHTO M145 Soil Classification System.
The primary purpose of a soil classification system is to allow construction
personnel to recognize and utilize specific types of soil under field
conditions. The most widely recognized system of soil classification
associated with roadways was devised by the Public Roads Administration
(now the Federal Highway Administration) for classification of subgrade
soils. In this system, known as the AASHTO M145 standard, soils are
classified into one of seven groups, designated A-1 through A-7, according to
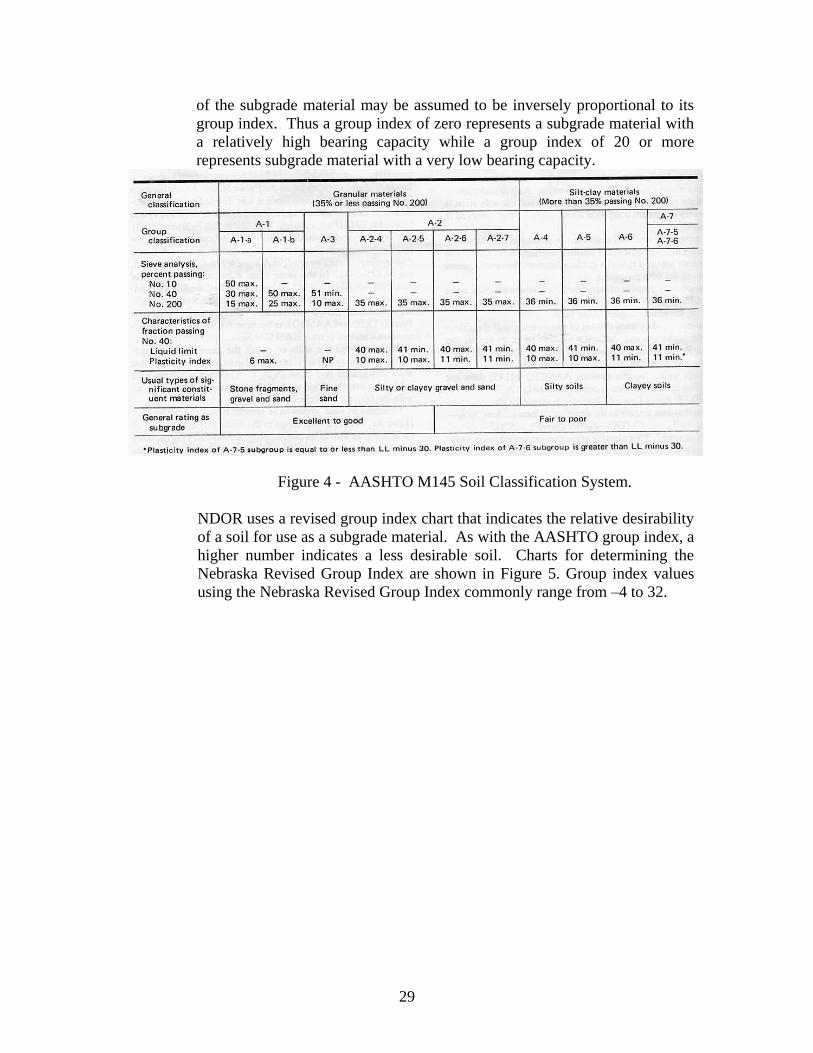
their general load carrying capacity. The AASHTO M145 classification
standard for highway subgrade materials is illustrated in Figure 4.
An AASHTO soil classification is expressed as a group classification
followed by a group index in parenthesis. For example, a soil with a group
classification of A-4 and a group index of 20 would be reported as A-4 (20).
The group index is computed using the following equation:
Group Index = (F-35)[0.2 + 0.005(wL-40)] + 0.01(F-15)(IP-10)
where: F = fines content (percentage passing #200 sieve)
wL = liquid limit
IP = plasticity index
The group index value is always expressed as a whole number. There is no
upper limit for the group index value. Increasing values of group index within
a group classification reflect the effects of increasing liquid limit and
plasticity index, which coupled with a decreasing percentage of coarser
material, combines to reduce the bearing capacity of a specific subgrade.
Computed group values of less than zero are reported as zero. Under
conditions of good drainage and thorough compaction, the bearing capacity
29
of the subgrade material may be assumed to be inversely proportional to its
group index. Thus a group index of zero represents a subgrade material with
a relatively high bearing capacity while a group index of 20 or more
represents subgrade material with a very low bearing capacity.
Figure 4 - AASHTO M145 Soil Classification System.
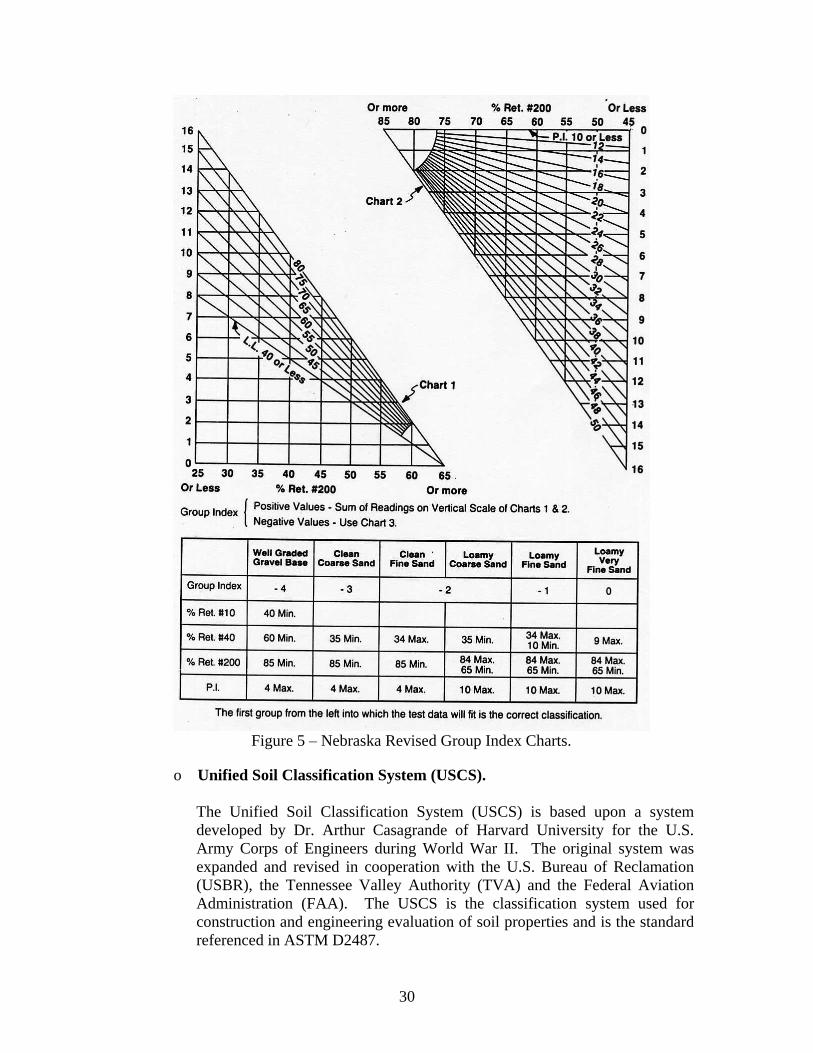
NDOR uses a revised group index chart that indicates the relative desirability
of a soil for use as a subgrade material. As with the AASHTO group index, a
higher number indicates a less desirable soil. Charts for determining the
Nebraska Revised Group Index are shown in Figure 5. Group index values
using the Nebraska Revised Group Index commonly range from –4 to 32.
30
Figure 5 – Nebraska Revised Group Index Charts.
o Unified Soil Classification System (USCS).
The Unified Soil Classification System (USCS) is based upon a system
developed by Dr. Arthur Casagrande of Harvard University for the U.S.
Army Corps of Engineers during World War II. The original system was
expanded and revised in cooperation with the U.S. Bureau of Reclamation
(USBR), the Tennessee Valley Authority (TVA) and the Federal Aviation
Administration (FAA). The USCS is the classification system used for
construction and engineering evaluation of soil properties and is the standard
referenced in ASTM D2487.
31
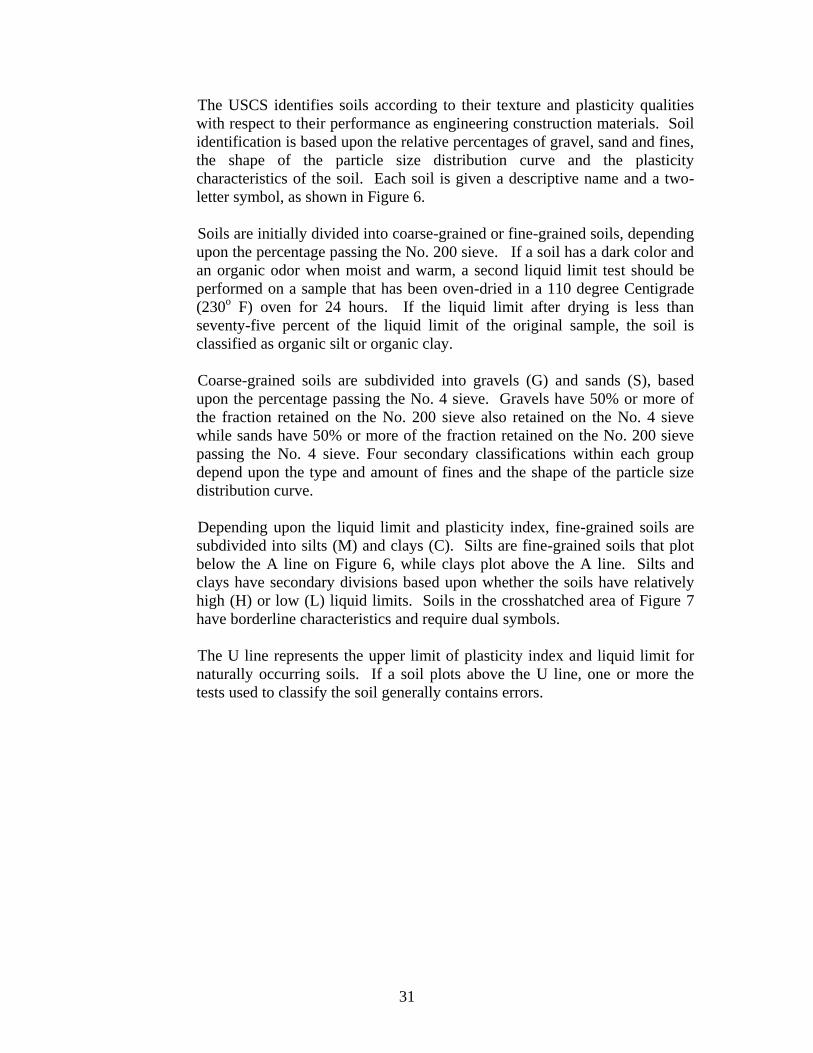
The USCS identifies soils according to their texture and plasticity qualities
with respect to their performance as engineering construction materials. Soil
identification is based upon the relative percentages of gravel, sand and fines,
the shape of the particle size distribution curve and the plasticity
characteristics of the soil. Each soil is given a descriptive name and a two-
letter symbol, as shown in Figure 6.
Soils are initially divided into coarse-grained or fine-grained soils, depending
upon the percentage passing the No. 200 sieve. If a soil has a dark color and
an organic odor when moist and warm, a second liquid limit test should be
performed on a sample that has been oven-dried in a 110 degree Centigrade
(230o F) oven for 24 hours. If the liquid limit after drying is less than
seventy-five percent of the liquid limit of the original sample, the soil is
classified as organic silt or organic clay.
Coarse-grained soils are subdivided into gravels (G) and sands (S), based
upon the percentage passing the No. 4 sieve. Gravels have 50% or more of
the fraction retained on the No. 200 sieve also retained on the No. 4 sieve
while sands have 50% or more of the fraction retained on the No. 200 sieve
passing the No. 4 sieve. Four secondary classifications within each group
depend upon the type and amount of fines and the shape of the particle size
distribution curve.
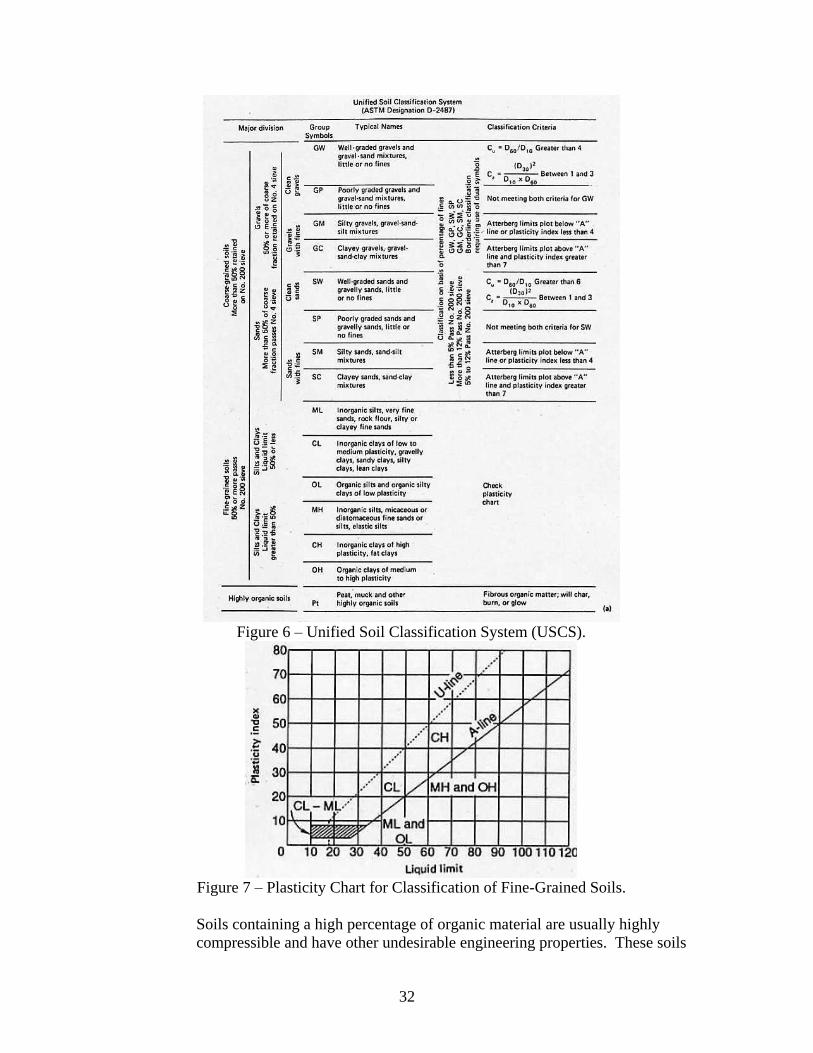
Depending upon the liquid limit and plasticity index, fine-grained soils are
subdivided into silts (M) and clays (C). Silts are fine-grained soils that plot
below the A line on Figure 6, while clays plot above the A line. Silts and
clays have secondary divisions based upon whether the soils have relatively
high (H) or low (L) liquid limits. Soils in the crosshatched area of Figure 7
have borderline characteristics and require dual symbols.
The U line represents the upper limit of plasticity index and liquid limit for
naturally occurring soils. If a soil plots above the U line, one or more the
tests used to classify the soil generally contains errors.
32
Figure 6 – Unified Soil Classification System (USCS).
Figure 7 – Plasticity Chart for Classification of Fine-Grained Soils.
Soils containing a high percentage of organic material are usually highly
compressible and have other undesirable engineering properties. These soils
33
are classified into one category, Pt. Soils of this type include peat, humus
and many swamp soils.
4.2 Particle Size.
Particle size analysis is a quantitative determination of the distribution of
particle sizes in a sample of soil. Complete particle size analysis requires two
tests, a sieve analysis and a hydrometer analysis. The sieve analysis is
conducted in accordance with AASHTO T 27/T11 while the hydrometer
analysis is conducted in accordance with AASHTO T 88.
Sieve analysis is normally conducted on soil samples where most particles
will be retained on the No. 200 (0.075 mm) while the hydrometer test is
conducted on soil samples where a majority of particles will pass the No. 200
sieve. In the sieve analysis, the soil sample is shaken through a stack of wire
screens with standard size openings. The side dimension of a square hole
thus becomes the definition of particle diameter. Hydrometer analysis is
based upon Stokes equation for the velocity of freely falling spheres. The
diameter of a sphere of the same density that falls at the same velocity as the
particle being measured thus becomes the definition of particle diameter for
the hydrometer test.
Results of both sieve and hydrometer analysis are often presented on a single
particle size distribution curve. Particle size distribution curves can be used
for soil classification, determination of hydraulic conductivity, identification
of frost-susceptible soils and assessment of soil strength.
4.3 Specific Gravity.
Specific gravity of a soil is determined in accordance with AASHTO T 100.
Specific gravity is the ratio of the mass in air of a given volume of soil at a
specific temperature compared to the mass in gas-free, distilled water of the
same volume of soil at the same temperature. The specific gravity of most
soils lies within the range of 2.60-2.85. Soils with high organic content or
porous particles may have a much lower specific gravity, while soils
containing an appreciable quantity of heavy minerals may have much higher
values of specific gravity.
4.4 Moisture Content (Atterberg Limits).
Soil moisture content is measured in accordance with AASHTO T 265 or
ASTM D 2216-87/ASTM D 4643-87. Moisture content is the defined as the
ratio of mass of the water in a specimen to the mass of solids in the dry
sample. The equation used to calculate moisture content is:
W (%) = Mw/Ms (100%)
34
The difference in weight between the wet and dry sample is the mass of
water, Mw while the weight of the dry sample is the mass of the soil, Ms.
Note that the equation defining water content differs from standard equations
for determining the percentage of constituent materials. A specimen
containing 25 grams of water and 25 grams of dry soil has a moisture content
of 100%, but water comprises only 50% of the sample by weight.
The moisture content test requires only a scale and a means of drying the
sample. The soil can be dried at a constant temperature of 110o C using a
conventional oven for 15-16 hours (ASTM D 2216-87), or by using a
microwave oven requiring only a few minutes (ASTM D 4643-87). Moisture
content is an important soil property, which has been correlated with shear
strength, hydraulic conductivity, compressibility and unit weight of the soil.
Moisture content is important for interpretation of moisture-density
relationships and forms the basis of Atterberg Limit testing.
Albert M. Atterberg defined five different water contents describing soil
consistency, know referred to as the Atterberg limits. Starting from a very
wet state and then drying, the five water contents defined by Atterberg
include the liquid limit, the plastic limit, the shrinkage limit, the sticky limit
and the cohesion limit. Only the liquid limit and plastic limit tests are
performed on a routine basis to aid in soil classification.
The liquid limit (LL) is the moisture content of the soil at the boundary
between the liquid and plastic states. At moisture contents greater than the
liquid limit, the soil has little or no shear strength. The plastic limit (PL) is
the moisture content of the soil at the boundary between the plastic and semi-
solid states. The plasticity index (PI) is the range in moisture content
between the liquid limit and the plastic limit, and represents the range of
moisture contents over which the soil exhibits plastic deformation. The
shrinkage limit (SL) is the moisture content below which an unloaded soil
will not change in volume.
4.5 Liquid Limit.
The liquid limit test requires a Casagrande liquid limit device and a
specifically designed grooving tool. The liquid limit of a soil sample is
determined by measuring the moisture content at which two halves of a soil
mass will flow together over a distance of 0.5 inches (13 mm) along the
bottom of a uniform groove separating the two halves, when a bowl
containing the soil is dropped 0.4 inches (10 mm) at a rate of two impacts per
second. At least three tests at different moisture contents are conducted and
the results plotted on semi-log paper. The liquid limit corresponds to the
moisture content interpolated to 25 blows. Detailed parameters for this test
can be found in ASTM D 4318 and AASHTO T 89.
35
4.6 Plastic Limit.
The plastic limit of a soil sample is ascertained by determining the minimum
moisture content at which a sample of soil can be consistently rolled into
threads 0.125 inches (3.3 mm) in diameter without the material crumbling.
Detailed parameters for this test can be found in ASTM D 4318 or AASHTO
T 90.
4.7 Shrinkage Limit.
The shrinkage limit is defined as the water content at which the soil no longer
decreases in volume as the degree of saturation decreases. The shrinkage test
is primarily preformed on soils that may undergo large volume changes as
water content increases or decreases.
4.8 Unit weight.
The unit weight of a soil is represented by the symbol . Unit weight is
commonly expressed in pounds per cubic foot or kilonewtons per cubic
meter. Unit weights can be reported as wet unit weight, wet or dry unit
weight, dry. Wet unit weight is calculated by dividing the total weight of a
mass of soil containing water by its total volume. Dry unit weight is
calculated by dividing the weight of dry soil by its total volume. Wet unit
weight thus includes the weight of water as well as the soil particles while
dry unit weight includes only the weight of the soil particles. Wet unit weight
can be converted to dry unit weight by dividing wet unit weight by one plus
the water content.
4.9 Moisture Density Relationship.
Projects have specifications that indicate the soil density and the range of
moisture content that must be achieved to be considered satisfactory. These
requirements are normally based upon the results of laboratory compaction
tests (more properly described as moisture-density tests). Moisture density
tests determine the maximum dry unit weight for a specific soil and the range
of moisture contents over which a specified degree of compaction can be
achieved.
The most widely used procedure for moisture density testing consists of
compacting soil layers in a cylindrical mold using a drop hammer (AASHTO
T 99, AASHTO T 180, ASTM D 698, or ASTM D 1557). For each
procedure, a mold with uniform dimensions is specified. The number of
layers used to fill the mold plus the weight and drop height of the hammer is
also specified. To determine the moisture density relationship for a particular
soil, separate samples must be compacted at different water contents. Each
sample is compacted using the same procedure (identical volume, same
number of layers, equal compaction energy). Weighing the mold,
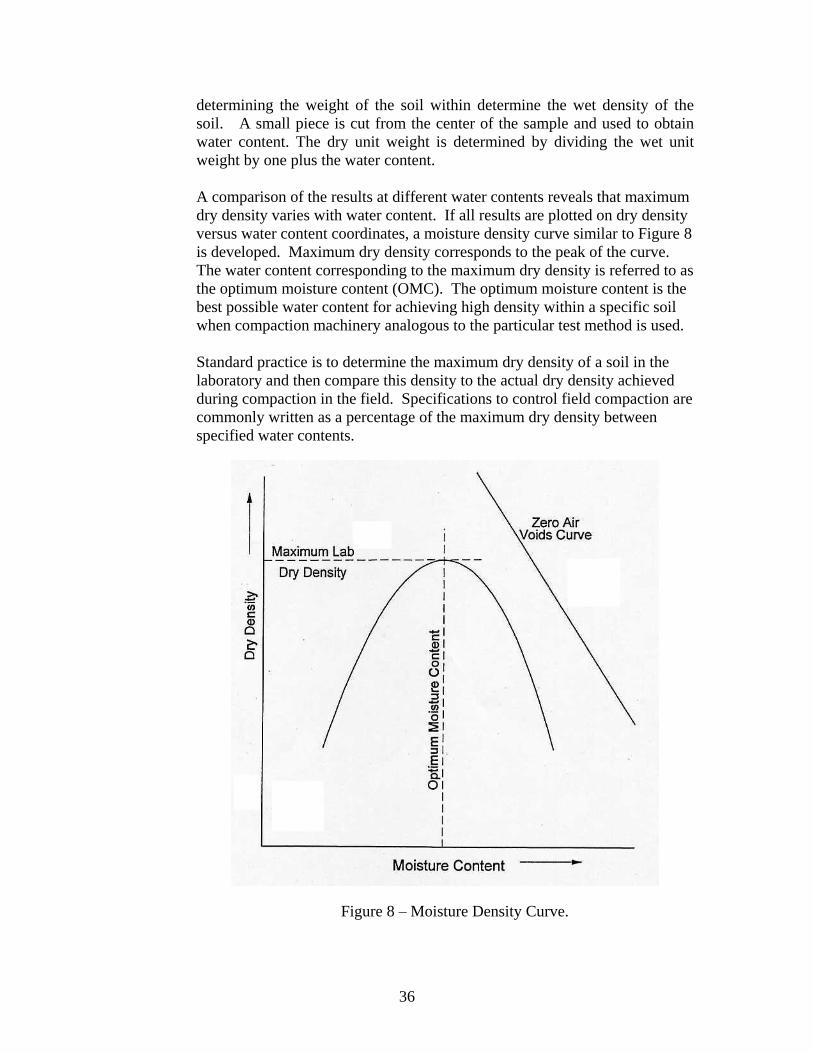
36
determining the weight of the soil within determine the wet density of the
soil. A small piece is cut from the center of the sample and used to obtain
water content. The dry unit weight is determined by dividing the wet unit
weight by one plus the water content.
A comparison of the results at different water contents reveals that maximum
dry density varies with water content. If all results are plotted on dry density
versus water content coordinates, a moisture density curve similar to Figure 8
is developed. Maximum dry density corresponds to the peak of the curve.
The water content corresponding to the maximum dry density is referred to as
the optimum moisture content (OMC). The optimum moisture content is the
best possible water content for achieving high density within a specific soil
when compaction machinery analogous to the particular test method is used.
Standard practice is to determine the maximum dry density of a soil in the
laboratory and then compare this density to the actual dry density achieved
during compaction in the field. Specifications to control field compaction are
commonly written as a percentage of the maximum dry density between
specified water contents.
Figure 8 – Moisture Density Curve.
37
Knowledge of soil OMC is important to both the contractor and the inspector.
Informed decisions often must be made relative to the treatment of the soil
prior to or during compaction. If the soil has actual moisture content vastly
different from OMC, continued compaction will prove uneconomical to
achieve the desire results. If the soil is below OMC, moisture can be added
by a variety of systems and mixed with the soil by blading or disking. If the
soil is above OMC, the contractor may remove water from the soil by
scarifying and allowing the surface to dry. In extreme cases, treatment with
desiccating mixtures such as lime or removal of the excessively wet soil mass
and replacement with drier soil have been used.
4.10 Consolidation/Swell/Collapse Tests.
o One-Dimensional Consolidation Test.
The one dimensional consolidation test (AASHTO T 216 / ASTM 2435) can
be used to determine the rate and amount of both total and differential
settlement for a structure or embankment. The term consolidation refers to
the phenomenon of transfer of applied load from the pore water pressure to
the soil particles. The results of the consolidation test are normally more
accurate if performed on relatively undisturbed samples, which are often
obtained by Shelby tube.
A sample is fitted into a ring or cylinder designed to confine the sample
against lateral displacement. A vertical load of known magnitude in the
range of anticipated design loads is then imposed on the sample. The amount
of compression and time required for compression to occur are recorded. The
test usually consists of a series of increasing vertical loads, followed by a
shorter series of deceasing vertical loads. Each load increment is held for 24
hours or until the linear portion of the secondary settlement curves appears.
The readings from consolidation tests for the various pressure readings are
plotting as height versus time and height versus square root of time on
separate plots. From this data, the void ratio (e) versus log of pressure (log P)
curve is plotted. The shape of this curve is significant in that a relatively
straight line indicates the sample has been disturbed while a line with two
distinct straight line segments with different slopes indicate a relatively
undisturbed sample. One result obtained from the e-log P curve is
determination of the compression index, Cc , which is defined as the slope of
the lower portion of the e-log P curve. The compression index is used to
calculate the amount of primary settlement expected.
One-dimensional consolidation tests are normally performed only on
relatively insensitive normally consolidated clays. This test overestimates the
magnitude of settlement for overconsolidated clays and for silty/sandy soils.
For sensitive clays, the results of the one-dimensional consolidation test yield
settlements that may be much too low. The test gives no indication of
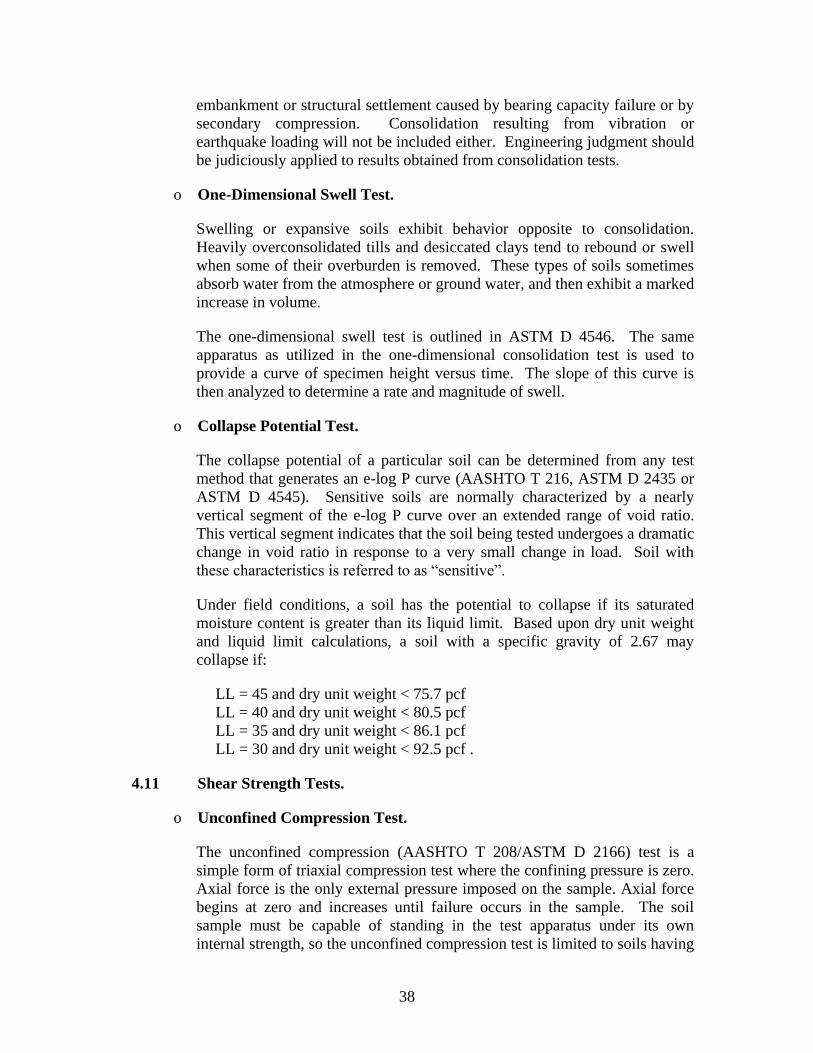
38
embankment or structural settlement caused by bearing capacity failure or by
secondary compression. Consolidation resulting from vibration or
earthquake loading will not be included either. Engineering judgment should
be judiciously applied to results obtained from consolidation tests.
o One-Dimensional Swell Test.
Swelling or expansive soils exhibit behavior opposite to consolidation.
Heavily overconsolidated tills and desiccated clays tend to rebound or swell
when some of their overburden is removed. These types of soils sometimes
absorb water from the atmosphere or ground water, and then exhibit a marked
increase in volume.
The one-dimensional swell test is outlined in ASTM D 4546. The same
apparatus as utilized in the one-dimensional consolidation test is used to
provide a curve of specimen height versus time. The slope of this curve is
then analyzed to determine a rate and magnitude of swell.
o Collapse Potential Test.
The collapse potential of a particular soil can be determined from any test
method that generates an e-log P curve (AASHTO T 216, ASTM D 2435 or
ASTM D 4545). Sensitive soils are normally characterized by a nearly
vertical segment of the e-log P curve over an extended range of void ratio.
This vertical segment indicates that the soil being tested undergoes a dramatic
change in void ratio in response to a very small change in load. Soil with
these characteristics is referred to as “sensitive”.
Under field conditions, a soil has the potential to collapse if its saturated
moisture content is greater than its liquid limit. Based upon dry unit weight
and liquid limit calculations, a soil with a specific gravity of 2.67 may
collapse if:
LL = 45 and dry unit weight < 75.7 pcf
LL = 40 and dry unit weight < 80.5 pcf
LL = 35 and dry unit weight < 86.1 pcf
LL = 30 and dry unit weight < 92.5 pcf .
4.11 Shear Strength Tests.
o Unconfined Compression Test.
The unconfined compression (AASHTO T 208/ASTM D 2166) test is a
simple form of triaxial compression test where the confining pressure is zero.
Axial force is the only external pressure imposed on the sample. Axial force
begins at zero and increases until failure occurs in the sample. The soil
sample must be capable of standing in the test apparatus under its own
internal strength, so the unconfined compression test is limited to soils having
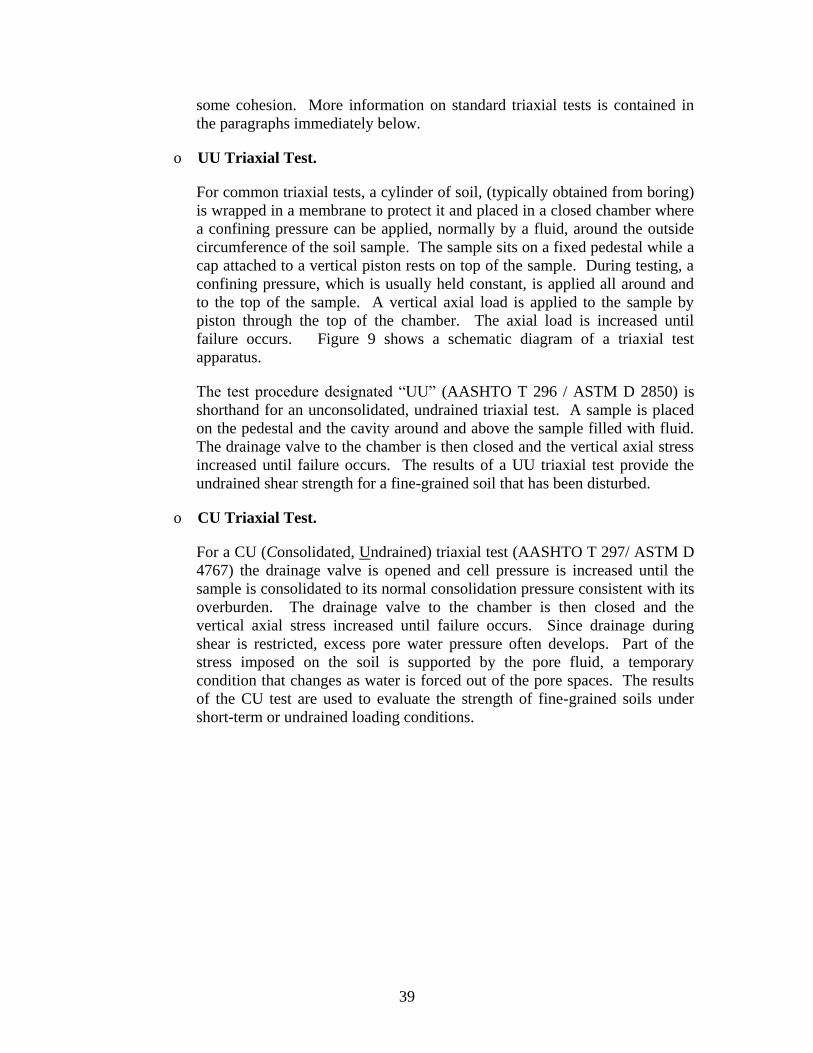
39
some cohesion. More information on standard triaxial tests is contained in
the paragraphs immediately below.
o UU Triaxial Test.
For common triaxial tests, a cylinder of soil, (typically obtained from boring)
is wrapped in a membrane to protect it and placed in a closed chamber where
a confining pressure can be applied, normally by a fluid, around the outside
circumference of the soil sample. The sample sits on a fixed pedestal while a
cap attached to a vertical piston rests on top of the sample. During testing, a
confining pressure, which is usually held constant, is applied all around and
to the top of the sample. A vertical axial load is applied to the sample by
piston through the top of the chamber. The axial load is increased until
failure occurs. Figure 9 shows a schematic diagram of a triaxial test
apparatus.
The test procedure designated “UU” (AASHTO T 296 / ASTM D 2850) is
shorthand for an unconsolidated, undrained triaxial test. A sample is placed
on the pedestal and the cavity around and above the sample filled with fluid.
The drainage valve to the chamber is then closed and the vertical axial stress
increased until failure occurs. The results of a UU triaxial test provide the
undrained shear strength for a fine-grained soil that has been disturbed.
o CU Triaxial Test.
For a CU (Consolidated, Undrained) triaxial test (AASHTO T 297/ ASTM D
4767) the drainage valve is opened and cell pressure is increased until the
sample is consolidated to its normal consolidation pressure consistent with its
overburden. The drainage valve to the chamber is then closed and the
vertical axial stress increased until failure occurs. Since drainage during
shear is restricted, excess pore water pressure often develops. Part of the
stress imposed on the soil is supported by the pore fluid, a temporary
condition that changes as water is forced out of the pore spaces. The results
of the CU test are used to evaluate the strength of fine-grained soils under
short-term or undrained loading conditions.
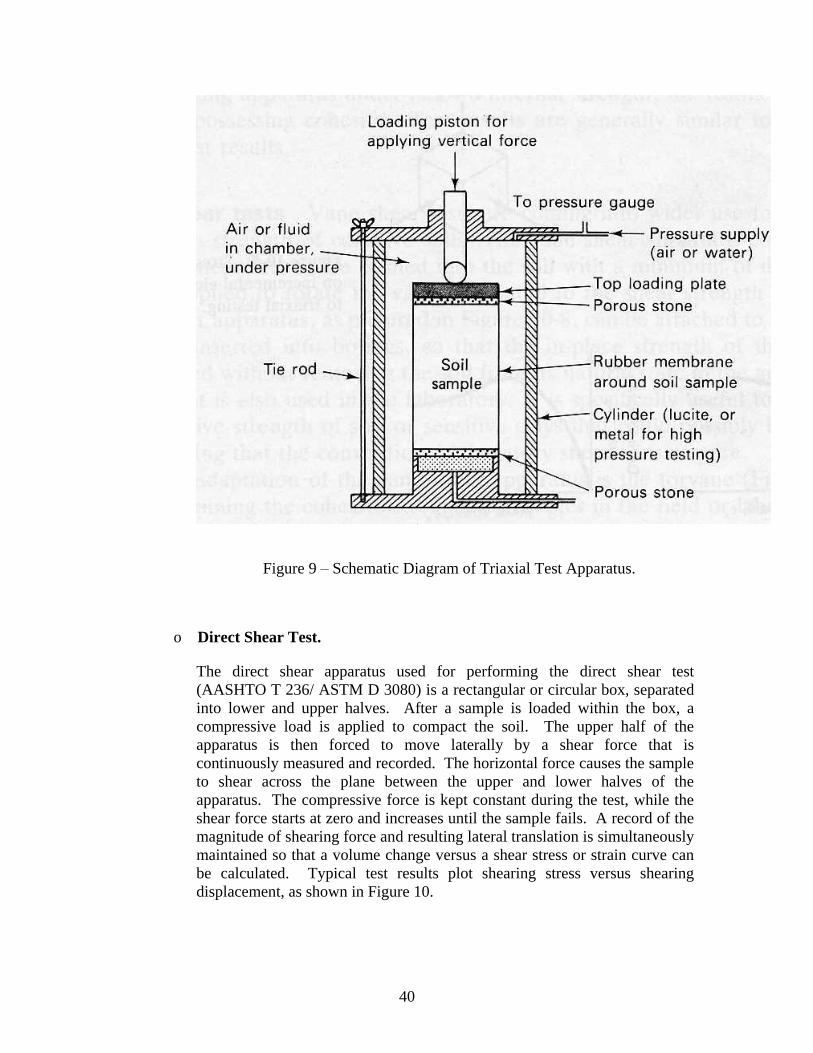
40
Figure 9 – Schematic Diagram of Triaxial Test Apparatus.
o Direct Shear Test.
The direct shear apparatus used for performing the direct shear test
(AASHTO T 236/ ASTM D 3080) is a rectangular or circular box, separated
into lower and upper halves. After a sample is loaded within the box, a
compressive load is applied to compact the soil. The upper half of the
apparatus is then forced to move laterally by a shear force that is
continuously measured and recorded. The horizontal force causes the sample
to shear across the plane between the upper and lower halves of the
apparatus. The compressive force is kept constant during the test, while the
shear force starts at zero and increases until the sample fails. A record of the
magnitude of shearing force and resulting lateral translation is simultaneously
maintained so that a volume change versus a shear stress or strain curve can
be calculated. Typical test results plot shearing stress versus shearing
displacement, as shown in Figure 10.
41
Figure 10 – Plot of Direct Shear Test Data.
Two types of direct shear test are commonly used. In a stress-controlled test,
the magnitude of shearing force is controlled. The stress is increased at a
uniform rate or in established increments. As each increment of shearing
force is applied, it is held constant until no further shearing deformation
occurs. In a strain-controlled test, the shearing deformation (lateral
displacement) occurs at a controlled rate, usually at a constant speed. The
strain controlled shear test is the most widely used.
4.12 Hydraulic Conductivity Tests.
o Constant Head Test.
The constant head test (AASHTO T 215/ ASTM D 2434) is used to measure
the hydraulic conductivity of a soil. Two reservoirs are used, a higher
reservoir on the upstream side and a lower reservoir on the downstream side
of the permeameter. The difference in the surface water elevations provides a
total driving head, causing water to flow downward through the sample in the
permeameter. The volume of water in the lower tank is measured after a
given period of time. The time, volume of water collected, length and cross-
sectional area of the permeameter and driving head are substituted into the
equation shown in Figure 11 to determine hydraulic conductivity for the
sample. The constant head test works best when used to determine the
hydraulic conductivity of coarse-grained soils.
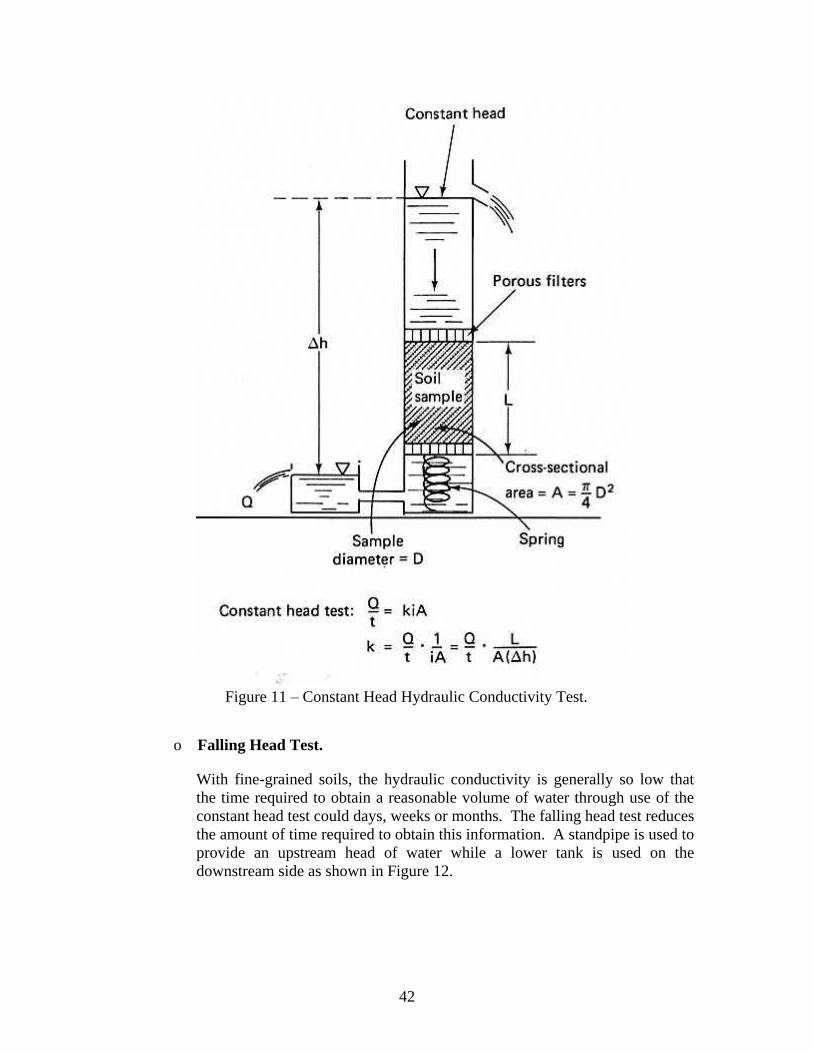
42
o Falling Head Test.
With fine-grained soils, the hydraulic conductivity is generally so low that
the time required to obtain a reasonable volume of water through use of the
constant head test could days, weeks or months. The falling head test reduces
the amount of time required to obtain this information. A standpipe is used to
provide an upstream head of water while a lower tank is used on the
downstream side as shown in Figure 12.
Figure 11 – Constant Head Hydraulic Conductivity Test.
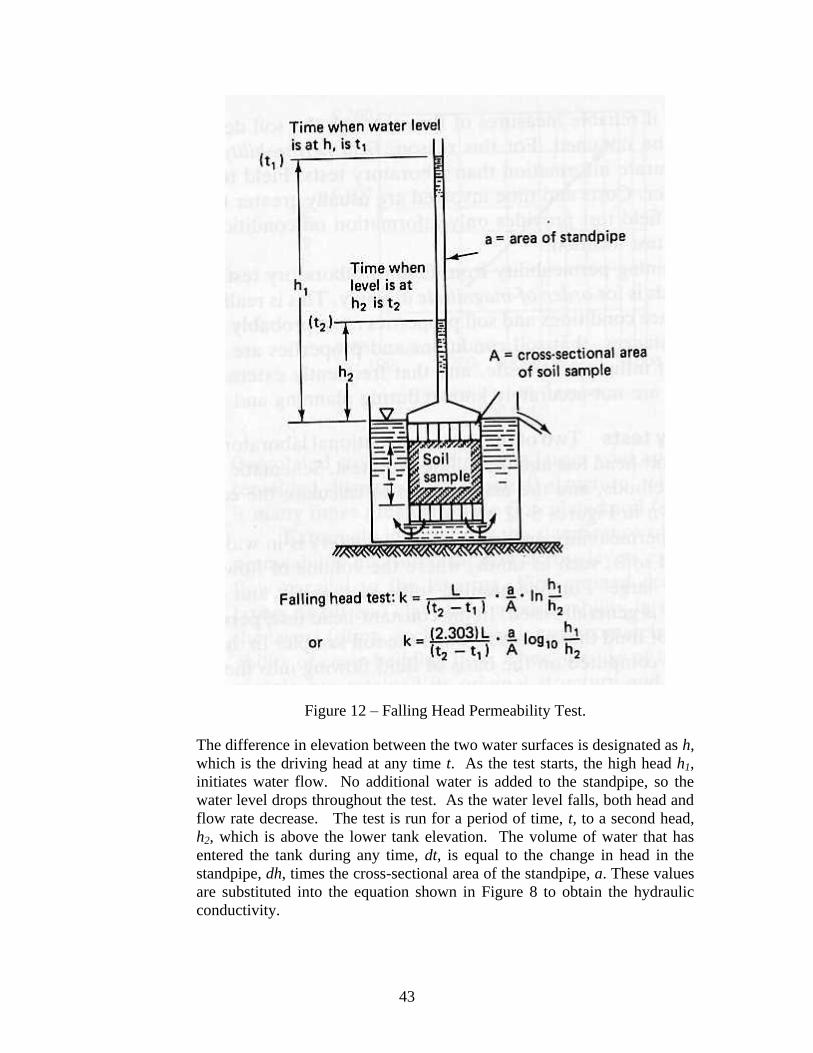
43
Figure 12 – Falling Head Permeability Test.
The difference in elevation between the two water surfaces is designated as h,
which is the driving head at any time t. As the test starts, the high head h1,
initiates water flow. No additional water is added to the standpipe, so the
water level drops throughout the test. As the water level falls, both head and
flow rate decrease. The test is run for a period of time, t, to a second head,
h2, which is above the lower tank elevation. The volume of water that has
entered the tank during any time, dt, is equal to the change in head in the
standpipe, dh, times the cross-sectional area of the standpipe, a. These values
are substituted into the equation shown in Figure 8 to obtain the hydraulic
conductivity.
44
o Flexible Wall Permeameter Test.
Certain limitations are inherent in the procedures used in the constant head
and falling head permeability tests, some of which are created by the physical
constraints of confining a soil within a fixed diameter cylinder.
Permeameters are commonly constructed of some type of plastic, so the sides
of the permeameter enclosing the sample may be relatively smooth compared
to the average particle size within the sample. Relatively large void spaces
can develop next to the sides of the permeameter, allowing water to flow
around the sample at a rate well in excess of its true permeability.
Flexible wall permeameters have been created to address this problem. A
flexible wall permeameter consists of an elastic tube used as a container for
the sample. Water is forced through the sample while it is suspended within
this flexible tube. Use of a flexible tube allows the walls of the permeameter
to conform to bumps and depressions along the sides of a sample, reducing
voids and limiting flow along the sides of the container. A flexible wall
permeameter can be used as the sample container for either a constant or
falling head test.
4.13 Field Density Tests.
o Nuclear Moisture Density Testing.
The wet field density of a soil can be determined by the nuclear gauge
method (AASHTO T 238) using the direct transmission procedure. The
source of gamma radiation is placed at a known depth while the detector
remains at the surface. Attenuation of radiation received at the detector is
displayed as wet density by the gauge. A calibration curve must be
developed for each gauge to correlate the intensity of radiation registered
with actual wet density of the soil.
The moisture content of the soil can be determined by the nuclear gauge
method (AASHTO T 239) using the backscatter procedure. The neutron
source and neutron detector both remain at the surface for this test. When
fast neutrons collide with hydrogen nuclei within water molecules, they slow
down. The detector measures the quantity of slow neutrons resulting from
these collisions. The moisture content is proportional to the total hydrogen
content of the soil and is directly related to the water content per unit volume.
The accuracy of nuclear gauge measurements of moisture contents is subject
to certain chemical interactions. Organic hydrocarbons such as road oil and
asphalt will appear as moisture to the nuclear gauge, which will result in a
measured moisture content that is higher than actual. Chemically bound
water (such as that found in gypsum) will be included as free water in nuclear
gauge observations, resulting in a higher than actual moisture content as well.
45
Soils containing iron or iron oxides will have higher fast neutron capture rate,
which will indicate a lower than actual moisture content on the gauge.
o Rubber Balloon Method (ASTM D 2167).
The rubber balloon method measures in-place moist unit weight of a soil. A
hole, approximately six inches in diameter, and semi-spherical in shape, is
dug at the desired test location. All of the removed soil is collected so that its
total weight and water content can be determined. The volume of the hole is
then determined by measuring the volume of water that can be pumped into a
rubber balloon filling the hole. Weight of the excavated soil divided by
volume of the hole provides the unit weight of the material excavated.
o Sand Cone Method (ASTM D 1556).
The sand cone method is similar to the rubber balloon method. A hole is
excavated at the desired test site and the material removed is collected to
determine its total weight and water content. A volume of uniform sand with
a known unit weight is carefully weighed. Sand is poured into the hole until
the hole is filled level with the original ground surface. The weight of sand
required to fill the hole is divided by the unit weight of sand to calculate the
volume of the hole. The wet (or dry) weight of material removed divided by
the volume of the hole determines the corresponding unit weight for the soil.
46
Chapter 5
Soil Modification
When a construction project encounters inadequate soil conditions, four possible
alternatives exist. These include:
o Avoid the site completely. Relocate the planned highway or structure to
some other location.
o Design the planned structure according to limitations imposed by the soil on
site. The solution will depend upon performance criteria specified, which
may include bearing capacity, embankment stability, subgrade stability,
settlement and/or seepage.
o Remove and replace the unsuitable soil.
o Attempt to modify the existing soil.
Similar options must be considered when good quality material for construction of
embankments, roads, or dams is lacking. This chapter is concerned with the last
alternative mentioned, modification of the existing material. Modification of existing soil
may take the form of mechanical, electrical, thermal or hydraulic, modification of
physical or chemical properties, by addition of inclusions or by confinement.
5.1 Surface and/or Subgrade Treatment.
5.1a Topsoil.
Nebraska has many areas where only minor topographic relief is
encountered, particularly along roadways that parallel river valleys. In these
locations, topsoil may be the primary construction material available.
Topsoil, the layer of natural soil found at the ground surface, generally
contains varying quantities of organic matter and humus (decaying organic
matter) in addition to natural soil particles. Topsoil is often removed and set
aside for use when establishing vegetation on slopes or embankments. When
topsoil extends to a depth below the shallow root zone (approximately 24
inches or 600 mm), its suitability for use as a construction material or as a fill
material should be evaluated.
Similar requirements apply when using topsoil for a construction material as
apply when using any soil as a fill material or when selecting any material for
use in the top layers of a pavement subgrade. AASHTO M 57 specifies that
for construction of embankments and subgrades, AASHTO soil
classifications A-1, A-2-4, A-2-5 and A-3 (corresponding to USCS soil

47
classifications of gravels or sands) are preferred while AASHTO
classifications A-2-6, A-2-7, A-4 and A-5 (corresponding to USCS soil
classifications of silts and clays) are generally unsuitable without of some
type of design or soil modification.
AASHTO M 147 (Table 6) specifies various particle size gradations for
material that can be used for construction of subbases, base courses and
surface courses. This information is presented in graphical form as Table 8.
Gradations A-F are recommended for subbase material and base courses,
while surface courses should be composed of material meeting the
specifications of gradations C-F.
Properties of unsuitable topsoil can be modified by various methods and
procedures, many of which are discussed later in this chapter. Topsoil that
does not meet all criteria for use as a subgrade material need not always be
removed to its full depth. Removal of a layer of topsoil equal to the
thickness of the base course is often sufficient to mitigate most problems.
Table 6 – AASHTO M147 Grade Requirements for Soils Used as
Subbase Materials, Base Courses and Surface Courses.
AASHTO M147-65 (80) Percentage Passing by Mass
Sieve Size Grades
(mm) (in) A B C D E F
50 2 100 100
25 1 75-95 100 100 100 100
9.5 3/8” 30-65 40-75 50-85 60-100
4.47 No. 4 25-55 30-60 35-65 50-85 55-100 70-100
2.00 No. 10 15-40 20-45 25-50 40-70 40-100 55-100
0.425 No. 40 8-20 15-30 15-30 25-45 20-50 30-70
0.075 No. 200 2-8 5-20 5-15 5-20 6-20 8-25
5.1b Unsuitable Soils.
As a general rule, soil used in most highway construction applications should
have a minimum dry unit weight of 90 pounds per cubic foot, an organic
content less than 2%, a liquid limit of less than 50% and 70% maximum by
weight passing the No. 40 sieve. Soils outside of these limits will normally
require some type of modification to alleviate adverse characteristics.
If a soil with a liquid limit higher than 50% is present in the subgrade or must
be used as fill material, both soil treatment and drainage options are
available. Examination of existing pavement in the immediate area of the
48
project may reveal if high plasticity soils are unstable. If the soil is stable, no
treatment is necessary. If treatment is necessary, it generally consists of
various methods of drainage, removal and replacement of the soil, treatment
of the soil with additives to reduce its plasticity or some combination of two
or more of these procedures.
Some soils have a natural structure that may become unstable and collapse
under certain impact loading and moisture conditions. The natural structure
of loess and other slightly cemented soils may collapse when water infiltrates
the soil layers. Placing a pavement directly over unaltered loess will often
trap moisture beneath the pavement, allowing the loess to accumulate
moisture from the bottom upward. Vibration of traffic on the roadway over a
loess deposit may then cause the soil structure to collapse. Normal
construction practices result in sufficient densification of loess that collapse
will not occur.
Dispersive soils represent another problem. Dispersive is a term applied to
soils containing clay minerals that are composed of a high percentage of
sodium montmorillonites. These particular clay minerals break down to
form a suspension when exposed to water. The suspended clay particles can
be transported away when exposed to moving water, leaving voids in the soil
structure. This phenomenon is known as piping when the voids assume a
cylindrical shape with the long axis in the direction of water movement.
Piping often occurs along foundations, and if allowed to proceed, can result
in loss of bearing and ultimately structural failure.
ASTM D 6572 - Standard Test Methods of Determining Dispersive
Characteristics of Clayey Soils by the Crumb Test can be used to determine
if a soil has dispersive qualities. Compaction with proper equipment at the
specified range of moisture greatly reduces problems with dispersive soils.
Cement, gypsum, fly ash and lime have all been used to treat dispersive soils
with varying levels of success.
5.2 Soil Modification Procedures.
Some natural soils do not possess adequate strength and stiffness to support a
roadway. When materials to remove and replace these soils are unavailable
and the roadway cannot be moved, soil modification procedures must be
used. A variety of soil modification procedures are available at various costs.
It is not always evident which procedure is optimal for a given situation.
5.2a Surface and/or Subsurface Drainage.
Soil drainage may have several objectives, including lowering a water table,
redirecting seepage away from a cut section or reducing the water content of
a soil mass. Surface drainage techniques have traditionally been based upon
49
gravity drainage with gravity flow or pumping to remove collected water
from sumps or ditches. These techniques are relatively inexpensive and work
well for relative shallow excavations in coarse granular soils. Slopes
consisting of fine-grained soils can be gravity drained by constructing a toe
drain with gravel filled slots.
Subsurface drainage is accomplished using a combination of granular or
geotextile filters, slotted pipe, trenches, sumps, wells, and/or drainage fabric.
Design of subsurface drainage systems is more complex than design of
surface drainage systems. Internal drainage of pavement systems was
discussed in Chapter 3.
5.2b Modification of Surface Soil Moisture Content.
The strength and stiffness of a cohesive soil are primarily dependent upon
moisture content and degree of compaction. Soil with moisture content
significantly greater than optimum is inherently unstable, and will prove
difficult to use as a platform for operation of construction equipment.
Disking, tilling or scarifying and allowing the soil to dry naturally are
effective only for the top 8-12 inches (200-300 mm). Actual reduction in
moisture content for surface soil is very dependent upon weather conditions
while the soil is being worked.
If a soil remains moist or becomes wetter with depth, drying the surface may
not suffice. Heavy repeated loading of soil layers where a drier layer is
located above a wetter layer causes the moisture content in the surface layer
to increase with a corresponding decrease in strength. Granular soils that
drain relatively rapidly can be stabilized by the installation of subdrains
alone. Cohesive soils require application of external loads after the drainage
system has been installed to drain effectively.
If a soil has been compacted drier than optimum moisture content, the soil
may have sufficient strength but fail to satisfy density requirements. Low-
density soils tend to absorb greater moisture when exposed to water, which is
accompanied by a corresponding decrease in strength. The significance of
this loss of strength in the subgrade depends upon overall pavement design.
The most common method of increasing soil moisture content during
construction is use of a water distributor and disc to mix water into the
surface layer immediately before compaction.
If a clay soil has been compacted dry of optimum and at high density, the soil
has significant strength, but fails the moisture requirements. High density
soils (especially clays) with low moisture contents will eventually absorb
moisture, especially beneath pavements. This absorption can cause the clay
soils to swell and heave the pavement structures causing damage to the
pavement and a rough surface. Again, the most common method of
50
increasing soil moisture content during construction is use of a water
distributor and disc to mix water into the surface layer immediately before
compaction. It is important that proper field testing is performed to ensure
that the moisture content and density requirements are met.
5.2c Use of Soil Admixtures.
There are a variety of soil stabilizing agents available, which are commonly
divided into two categories, active and passive agents. Active agents produce
a chemical reaction with specific soil minerals, which in turn produces
desirable changes in the engineering characteristics of the soil. Lime is one
example of an active agent. When lime is added to medium to fine-grained
soils, it produces numerous desirable changes in soil properties.
Passive stabilizers do not react chemically with the soil, but instead bind
together natural aggregates within the soil. Bituminous admixtures, cement
and lime-fly ash mixtures are common examples of passive stabilizers.
Passive stabilizers are more commonly applied to coarse-grained soils.
o Lime Stabilization.
During periods of excessive precipitation, the physical condition of a
roadway construction site on cohesive soils may be so soft and wet as to
prevent construction activities. If the soil cannot be dried out by aeration
within an acceptable period of time, consideration should be given to treating
the soil with an additive that will improve its strength. Lime is the most
commonly used additive in these situations. A small quantity of lime may be
added to the soil to dry out the subgrade material. If a greater quantity of
lime is added to the same soil, the lime stabilized soil mixture will gain
sufficient strength to serve as the roadway base course. This process is
known as lime stabilization. Practical lime admixtures vary from 2% to 8%
by weight. The optimal percentage of lime to be used for each project should
be determined by triaxial or other specified tests.
Lime treatment has several inherent advantages. Removal and replacement
of material below the subgrade is minimized, saving time and money. Lime
stabilized soil has improved workability, resulting from a decreased plasticity
index due to an increased plastic limit. Lime treatment increases the strength
of a clay soil as measured by an unconfined compression test. Increased
strength confers improved durability under cyclic loading and improved
resistance to wind, water and freeze-thaw cycles.
51
o Soil Cement Stabilization.
The most commonly used admixture for soil stabilization is Portland cement.
The reaction of cement and water in the soil forms cementatious calcium and
aluminum hydrosilicates, which bind granular soil particles together.
Hydration of the cement results in slaked lime, Ca(OH)2, which in turn reacts
with the clay components of the soil to improve strength. Hydration is
independent of the soil type, so cement stabilization is effective for a wide
range of soil types. Soil cement stabilization results in increased strength and
stiffness, better volume stability and increased durability of the soil being
treated.
The benefits of soil cement stabilization are dependent upon the degree of
mixing and compaction achieved under field conditions. Good mixing and
good compaction result in a dense, strong subbase. Typical cement contents
vary from 2% to 10% by weight. Cement stabilization reduces the plasticity
index of most soils, improving their workability. The unconfined
compressive strength of soil increases directly in proportion to the percentage
of cement used during the treatment process.
o Calcium Chloride Stabilization.
Calcium chloride is a common salt with properties that make it particularly
suitable for certain geotechnical engineering applications. Calcium chloride
is hygroscopic, meaning that it attracts and absorbs moisture from the
atmosphere. CaCl2 is highly soluble in water, raises the surface tension of
and a lowers the freezing point of water.
Calcium chloride replaces the Na+ ions within the diffuse double layers of
sodium montmorillonites with Ca++
ions, reducing the thickness of that layer,
thereby decreasing the plasticity and increasing the strength of the soil.
CaCl2 reduces evaporative water loss from soils, facilitating moisture control
during construction. Its hygroscopic properties make calcium chloride an
ideal substance to help control dust on unpaved roads at construction sites.
o Fly Ash Stabilization.
Fly ash is a waste product resulting from the combustion of coal. It is
transported out of the combustion chamber by flue gasses and extracted by
electrostatic precipitators and filter bags. Fly ash is composed primarily of
silt sized particles and is usually dark to light tan in color.
Under a microscope, fly ash appears to be glassy spheres surrounded by
shards of crystalline material. The principle components of fly ash are silica
(SiO2), alumina (Al2O3), ferric oxide (Fe2O3) and calcium oxide (CaO).
ASTM C618 divides fly ash into two categories, class F and class C. Class F
52
fly ash is produced by burning anthracitic or bituminous coal, while class C
fly ash is produced by burning subbituminous or lignite coal. Class F fly ash
is pozzolonic while class C fly ash is both pozzolonic and cementitious.
Fly ash (F) is commonly mixed with lime (L), cement (C) and/or aggregate
(A) to create LFA, CFA or LCFA bases and subbases for roadways.
Guidelines for the relative percentages of constituents for various types of
soils are available from either the FHWA or from NDOR. Fly ash mixed
with either cement or lime can also be used to stabilize a variety of soils that
may serve as the surface layer for light traffic roadways. Stabilization of a
sandy base with fly ash/cement mix (versus cement alone) creates a stiffer
base with less hydraulic conductivity. Fly ash/cement mixtures used to
stabilize soils exhibit less shrinkage and surface cracking than mixtures
containing cement alone. Fly ash by itself can be used to dry out wet
subgrade soils and increase soil strength.
o Bitumen Stabilization.
Bitumen refers to the product obtained by processing the residue that remains
after distillation of crude oil. Bitumen is generally mixed into the soil in the
form of an emulsion or cutback, and only rarely applied as “foamed”
bitumen. In an emulsion, small drops of bitumen are dispersed in water and
prevented form coagulating by chemical emulsifiers. When applied as a
cutback, a volatile solvent that evaporates after placement temporarily
reduces the viscosity of the bitumen. Foamed bitumen is generally applied to
the soil by a process where steam is blown through the hot bitumen using
special nozzles, forming thin film bubbles with excellent coating ability.
Bitumen is generally added to a soil to reduce water absorption or to add
cohesion to granular soils. Strength of compacted bitumen stabilized soil
increases with the quantity of binder added until a maximum stability is
reached; thereafter increasing the bitumen quantity decreases strength. The
effectiveness of bitumen toward imparting cohesion and water absorption
depends primarily upon the type of soil. Emulsions are said to be most
effective when applied to well-graded sands with a fines content of 8-20%.
Sands with greater fines content will have improved strength and better water
resistance if bitumen is applied as a cutback rather than as an emulsion.
The soils most suitable for bituminous admixtures include sandy gravels,
sands, clayey and silty sands, and fine crushed rock. Bitumen is not as
common as other soil admixtures, primarily because of its relatively high
cost. Considerable expertise is required in controlling viscosities, choosing
correct proportions and mixing times for emulsions and cutbacks and in
optimizing curing rates.
53
5.2d Over-Excavation and Replacement of Soil.
Removal of a weak subgrade soil and replacement with more suitable
material is a commonly used method of treatment. If consolidation is not a
problem, relatively shallow cuts may be sufficient. When deep deposits of
expansive clays are encountered, extensive removal and replacement may be
required to alleviate problems with consolidation.
Another often-utilized solution is to cover a soft subgrade with a
predetermined depth of granular material or to remove a predetermined depth
of soft material immediately below the finished grade line and replace it with
granular material. The granular material distributes the wheel loads over a
much larger area of the subgrade, thereby stabilizing the roadway.
The removal and replacement method is simple and does not require
equipment other than that normally available on most construction projects.
If suitable fill material is available near the project, this method can be quite
inexpensive. Costs associated with this method include excavating and
disposing of the unsuitable material plus purchasing, placing and compacting
the replacement material.
Several problems may be encountered when using the removal and
replacement method. If subgrade material lacks strength because of a high
water table, the properties of the material used as backfill may also be
adversely affected by the water conditions. If high water table conditions
exist at the project site, the backfill selected should be relatively unaffected
by changes in water content. Unless some type of separation membrane is
used between the subgrade and granular layer, material from the soft
subgrade may migrate into the granular material, significantly reducing the
effectiveness of the granular layer over time.
5.2e Soil Reinforcement.
Reinforcement of a soil mass by strips, bars, meshes, or fabrics imparts a
greater than normal tensile strength to a mass of soil. Structures designed and
constructed using reinforcing strips, bars, meshes, or fabrics are referred to as
reinforced earth structures. The most common type of reinforced earth
structure consists of horizontal layers of soil interspaced with reinforcing
strips, bars, grids or fabrics. The reinforcing members may or may not be
attached to the wall face.
Backfill criteria and construction specifications for reinforced earth structures
are relatively stringent. Percentage of fines (particles <0.08 mm in diameter)
are normally less than 15% of the backfill material by weight. If fines
compose greater than 15% of a material, it may still be suitable for use as
backfill, but special tests must be performed to determine that sufficient
54
pullout resistance can be developed between the reinforcement and the
backfill material before it can be used.
Backfill must be placed and compacted at less than optimal moisture content.
Backfill on FHWA projects is restricted to soils falling within AASHTO soil
classification A-1-a (USCS GW or SW). Current backfill requirements are
designed to produce a freely draining structure with a soil reinforcement
friction factor (tan ) not less than 0.3. Backfill material restrictions are
derived from measurements of undrained shear strength of granular materials
contaminated by clay and upon direct shear tests on reinforcing materials
performed using a standard shear box.
Reinforced soil failure modes are characterized as either internal or external.
If the major failure plane lies outside of the reinforced earth mass, the failure
mode is external (also known as global failure). External failure modes
consist of bearing failure, sliding and overturning; these failure modes are
analyzed using traditional retaining wall analyses. Internal failure modes
consist of rupture of the reinforcement, slippage between the reinforcement
and the surrounding soil, failure of reinforcement by excessive deformation
or by buckling of the face elements.
Reinforcing strips were initially composed of galvanized metal in various
configurations and sizes. Many different shapes and types of materials are
now used for reinforcement, including mats, grids and meshes. Mats, grids
and meshes perform the double function of strengthening the soil surface
while acting as reinforcement for the soil mass. Meshes, mats and grids
consist of flexible sheets of varying thickness with relatively large openings
in relation to the size of the connecting segments. Extrusion, stretching, or
fabric welding processes are used to create these materials.
In recent years, a wide variety of synthetic materials have become available
that have rapidly gained acceptance. Synthetic materials have proven easy to
transport and to place, exhibit predicable properties once emplaced, and are
able to withstand degradation under subsurface conditions. Synthetic fabrics
are commonly referred to as geotextiles, a broad classification encompasses
numerous materials developed for specific geotechnical engineering
applications, including geonets, geogrids and geocomposites. The term
“geotextile” commonly refers to a synthetic fabric that has the general
appearance of cloth but has no attached accessories, such as a reinforcing
mesh.
Geotextile fabrics are anisotropic with regard to many of their material
properties. Fabric properties are listed with regard to the machine direction,
the direction in which the fabric was manufactured and the cross machine
direction, which is orthogonal to the machine direction. Geotextile fabrics
are classified according to the way in which the threads were linked together,
55
with woven, non-woven and knitted fabrics representing the most common
types. Non-woven fabrics commonly have a random orientation of strands
within the fabric itself. To produce non-woven fabrics, filaments of material
are spread on a conveyor belt and then bonded by the addition of resins or by
heating.
The introduction of geotextile fabrics into the U.S. market in the 1970s
prompted development of many different forms of geosynthetics, which were
subsequently combined with other materials to form composites tailored to
specific applications. One example is a geotextile envelope constructed
around a synthetic core that is incompressible enough to hold the geotextile
sheets apart, allowing water to flow easily within the plane of the combined
materials. This combination is known as a geocomposite. Geocomposites
allow a single item to be ordered, transported to the site and inserted as a
drain. Geocomposites can provide an excellent drainage system at
considerable savings when compared to the cost of using natural materials to
construct a similar drainage system.
A whole series of geosynthetic products are now available which can
perform specific functions in addition to soil reinforcement. These functions
include separation of material, filtration, and drainage. Table 7 lists some of
the more common uses of geosynthetic products within the transportation
industry.
American Society for Testing and Materials (ASTM) procedures for testing
the mechanical, hydraulic and durability properties of geotextiles are detailed
in Table 8.
Geotextiles are extremely versatile, adapt readily to site circumstances, and
can be combined without adverse effects with most traditional construction
materials. The key to design with geotextiles lies in understanding the
various functions of geotextiles and relating these functions to improvement
in soil properties.
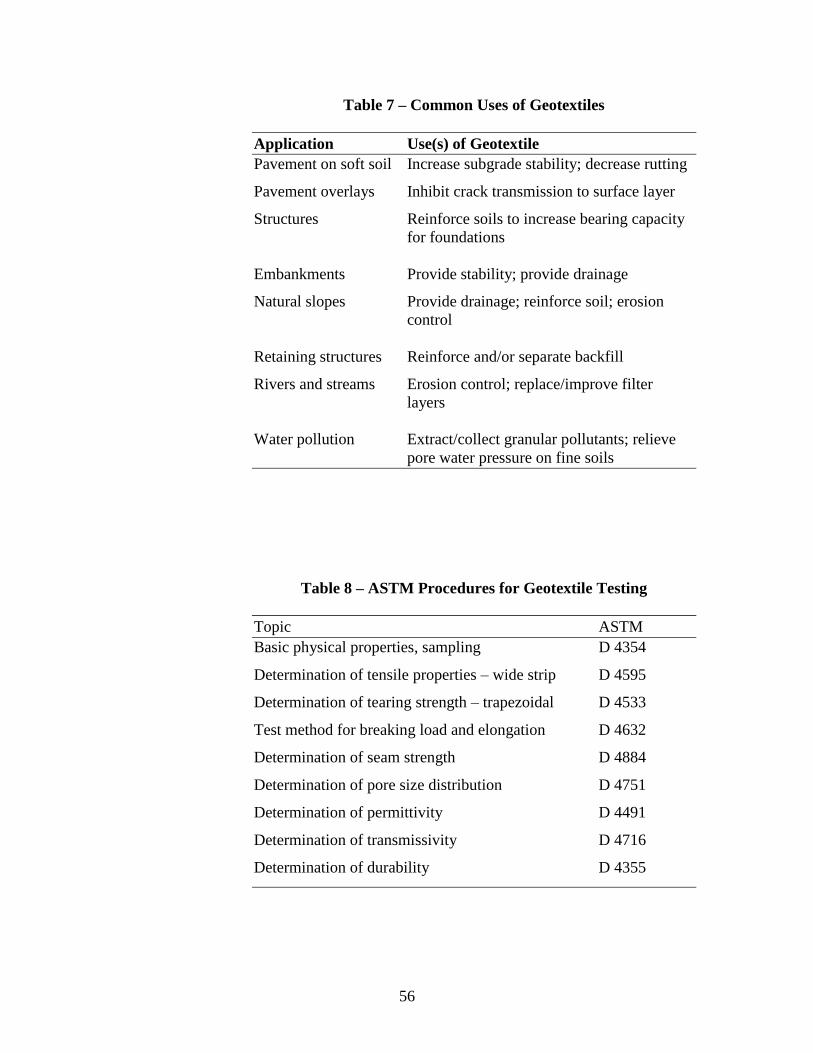
56
Table 7 – Common Uses of Geotextiles
Application Use(s) of Geotextile
Pavement on soft soil Increase subgrade stability; decrease rutting
Pavement overlays Inhibit crack transmission to surface layer
Structures Reinforce soils to increase bearing capacity
for foundations
Embankments Provide stability; provide drainage
Natural slopes Provide drainage; reinforce soil; erosion
control
Retaining structures Reinforce and/or separate backfill
Rivers and streams Erosion control; replace/improve filter
layers
Water pollution Extract/collect granular pollutants; relieve
pore water pressure on fine soils
Table 8 – ASTM Procedures for Geotextile Testing
Topic ASTM
Basic physical properties, sampling D 4354
Determination of tensile properties – wide strip D 4595
Determination of tearing strength – trapezoidal D 4533
Test method for breaking load and elongation D 4632
Determination of seam strength D 4884
Determination of pore size distribution D 4751
Determination of permittivity D 4491
Determination of transmissivity D 4716
Determination of durability D 4355
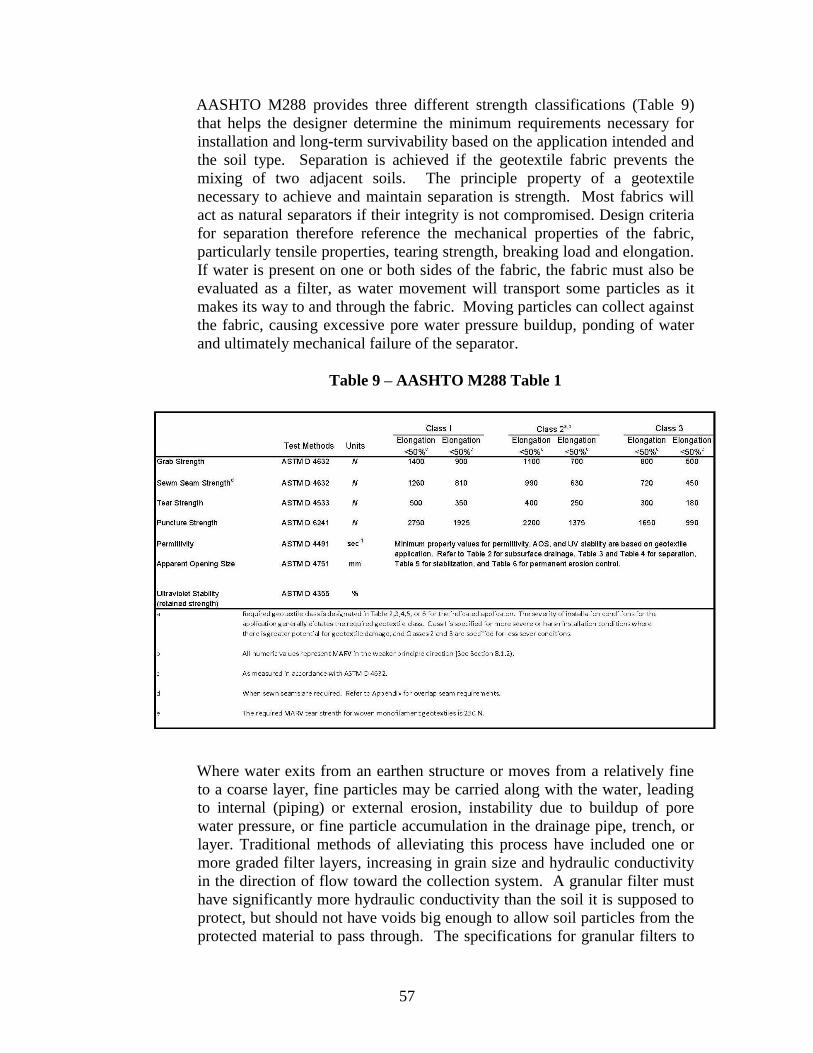
57
AASHTO M288 provides three different strength classifications (Table 9)
that helps the designer determine the minimum requirements necessary for
installation and long-term survivability based on the application intended and
the soil type. Separation is achieved if the geotextile fabric prevents the
mixing of two adjacent soils. The principle property of a geotextile
necessary to achieve and maintain separation is strength. Most fabrics will
act as natural separators if their integrity is not compromised. Design criteria
for separation therefore reference the mechanical properties of the fabric,
particularly tensile properties, tearing strength, breaking load and elongation.
If water is present on one or both sides of the fabric, the fabric must also be
evaluated as a filter, as water movement will transport some particles as it
makes its way to and through the fabric. Moving particles can collect against
the fabric, causing excessive pore water pressure buildup, ponding of water
and ultimately mechanical failure of the separator.
Table 9 – AASHTO M288 Table 1
Where water exits from an earthen structure or moves from a relatively fine
to a coarse layer, fine particles may be carried along with the water, leading
to internal (piping) or external erosion, instability due to buildup of pore
water pressure, or fine particle accumulation in the drainage pipe, trench, or
layer. Traditional methods of alleviating this process have included one or
more graded filter layers, increasing in grain size and hydraulic conductivity
in the direction of flow toward the collection system. A granular filter must
have significantly more hydraulic conductivity than the soil it is supposed to
protect, but should not have voids big enough to allow soil particles from the
protected material to pass through. The specifications for granular filters to
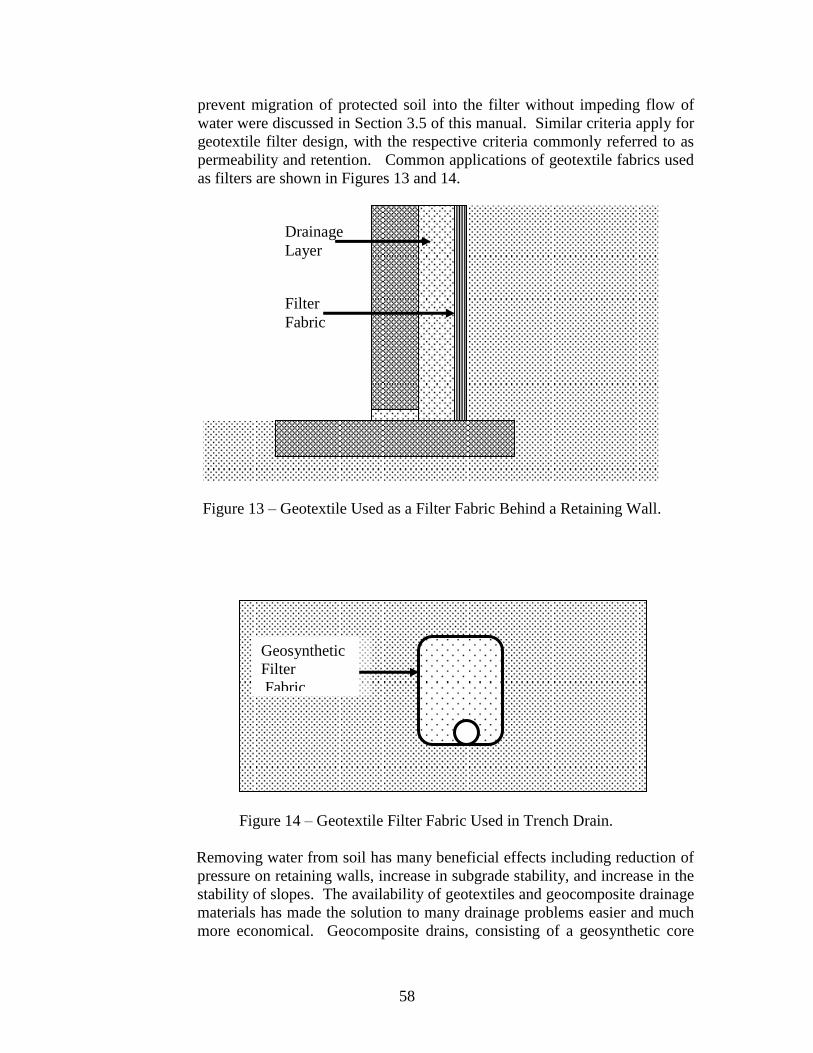
58
prevent migration of protected soil into the filter without impeding flow of
water were discussed in Section 3.5 of this manual. Similar criteria apply for
geotextile filter design, with the respective criteria commonly referred to as
permeability and retention. Common applications of geotextile fabrics used
as filters are shown in Figures 13 and 14.
Figure 13 – Geotextile Used as a Filter Fabric Behind a Retaining Wall.
Figure 14 – Geotextile Filter Fabric Used in Trench Drain.
Removing water from soil has many beneficial effects including reduction of
pressure on retaining walls, increase in subgrade stability, and increase in the
stability of slopes. The availability of geotextiles and geocomposite drainage
materials has made the solution to many drainage problems easier and much
more economical. Geocomposite drains, consisting of a geosynthetic core
Drainage
Layer
Filter
Fabric
Geosynethetic
Filter
Fabric
Geosynthetic
Filter
Fabric
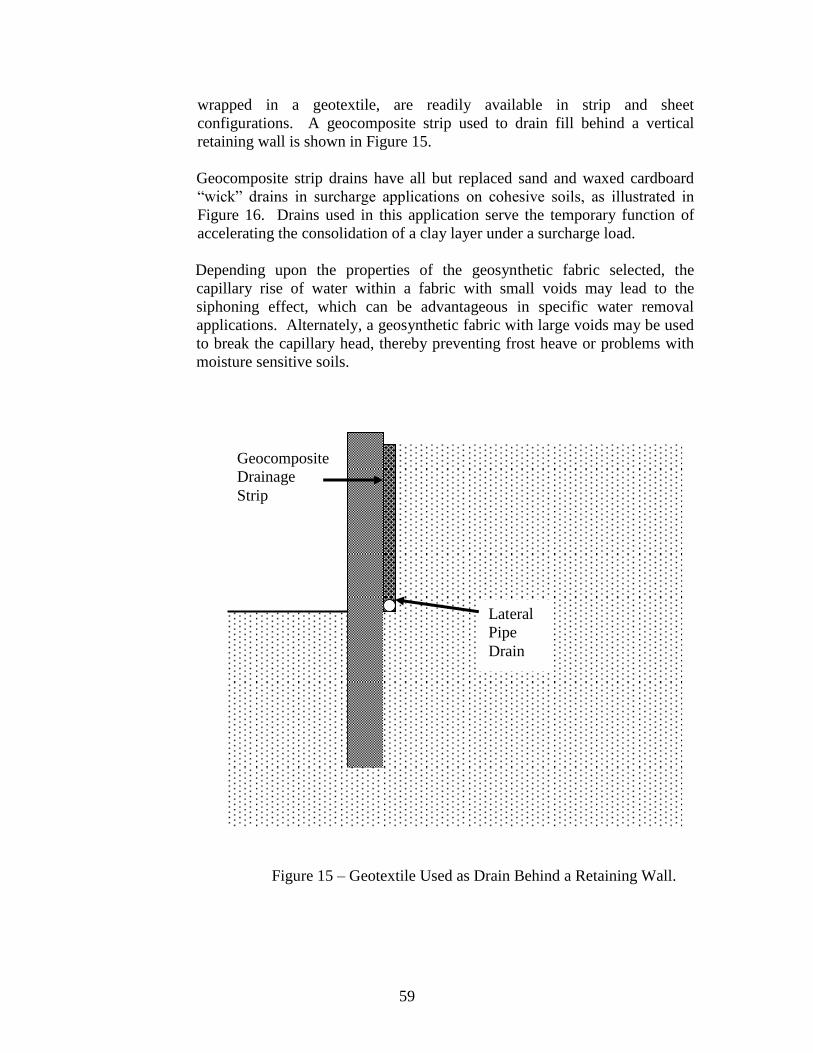
59
wrapped in a geotextile, are readily available in strip and sheet
configurations. A geocomposite strip used to drain fill behind a vertical
retaining wall is shown in Figure 15.
Geocomposite strip drains have all but replaced sand and waxed cardboard
“wick” drains in surcharge applications on cohesive soils, as illustrated in
Figure 16. Drains used in this application serve the temporary function of
accelerating the consolidation of a clay layer under a surcharge load.
Depending upon the properties of the geosynthetic fabric selected, the
capillary rise of water within a fabric with small voids may lead to the
siphoning effect, which can be advantageous in specific water removal
applications. Alternately, a geosynthetic fabric with large voids may be used
to break the capillary head, thereby preventing frost heave or problems with
moisture sensitive soils.
Figure 15 – Geotextile Used as Drain Behind a Retaining Wall.
Lateral
Pipe
Drain
Geocomposite
Drainage
Strip
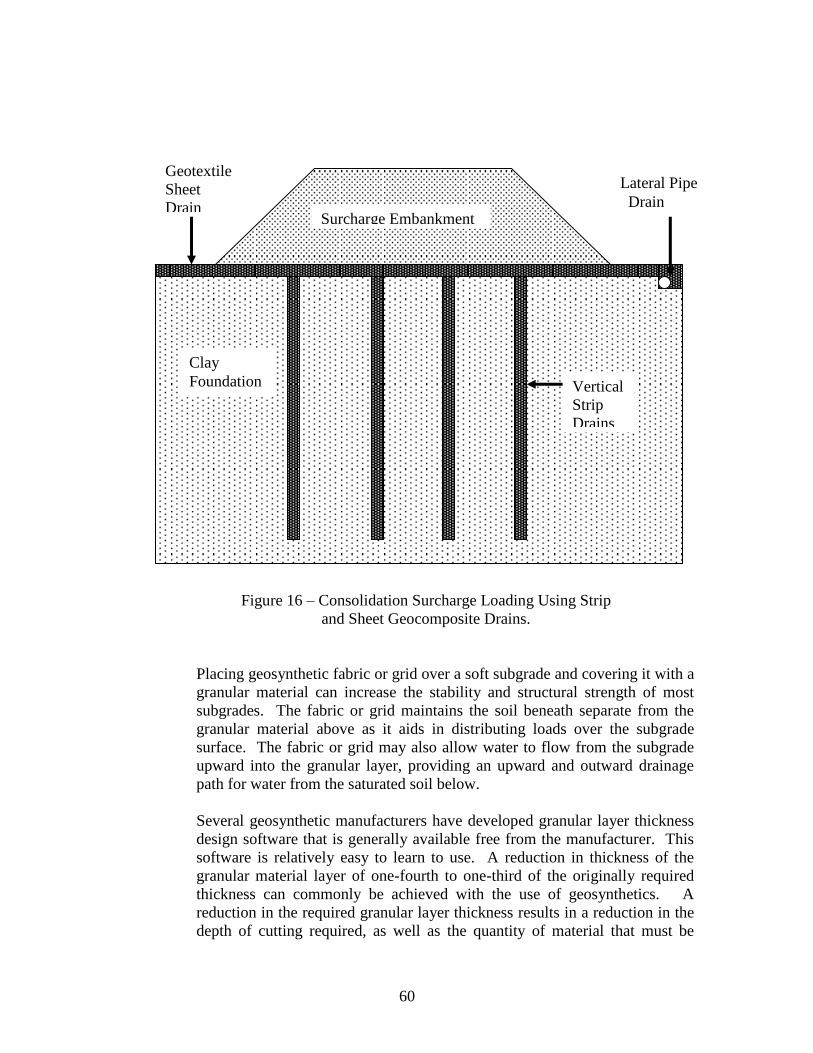
60
Figure 16 – Consolidation Surcharge Loading Using Strip
and Sheet Geocomposite Drains.
Placing geosynthetic fabric or grid over a soft subgrade and covering it with a
granular material can increase the stability and structural strength of most
subgrades. The fabric or grid maintains the soil beneath separate from the
granular material above as it aids in distributing loads over the subgrade
surface. The fabric or grid may also allow water to flow from the subgrade
upward into the granular layer, providing an upward and outward drainage
path for water from the saturated soil below.
Several geosynthetic manufacturers have developed granular layer thickness
design software that is generally available free from the manufacturer. This
software is relatively easy to learn to use. A reduction in thickness of the
granular material layer of one-fourth to one-third of the originally required
thickness can commonly be achieved with the use of geosynthetics. A
reduction in the required granular layer thickness results in a reduction in the
depth of cutting required, as well as the quantity of material that must be
Surcharge Embankment
Vertical
Strip
Drains
Geotextile
Sheet
Drain
Clay
Foundation
Lateral Pipe
Drain

61
purchased and transported to the project site. The design engineer must
determine whether the geosynthetic fabric and installation costs are offset by
the reduced cost of cutting to a shallower depth and a reduced thickness of
aggregate. Subgrade strength, extent of traffic loading and properties of the
geosynthetic material all influence the thickness of granular layer required.
Open mesh type geotextile fabrics in conjunction with straw, mulch or wood
shavings and seeds have been used to provide temporary stability to cut
slopes until vegetation is established. Open mesh geotextiles can be used to
create sand fences for dune management. Denser fabrics can be used as silt
curtains to prevent floating matter and suspended particles from entering
stream channels.
62
Chapter 6
Construction Procedures and Instrumentation
Soil provides the foundation for most of man’s structures. Soil is also used
extensively as a construction material. The principle reason for using soil as a
building material is that soil is available almost anywhere, it is durable and it has
comparatively low cost when compared to other building materials.
When soil is used as a construction material, it is typically placed in relatively thin
layers to develop a final section and elevation. Each layer is compacted before
being covered by the next layer. When each layer has been properly placed and
compacted, the resulting soil mass has strength and support properties considerably
better than the natural soil strata.
When soil is used as a foundation material, it is desirable for the soil to have certain
properties. The soil should possess adequate strength, be relatively unresponsive
with regard to volume changes as the water content varies, be durable and not
deteriorate over time. These factors can be achieved to some degree at all sites
through selection of the proper soil type and by use of proper placement techniques.
Almost any soil can be used for fill, if it does not contain organic or foreign matter
that would decompose and undergo volume change after placement. Granular soils
are generally the preferred material at construction sites, as these soils are capable of
developing high strength with minimal changes in volume after compaction, and can
be emplaced under most moisture conditions. Compacted silt is stable, develops
fairly high strength, and has a slight tendency to exhibit volume changes with
variations in moisture content. Silty soils can, however, prove very difficult to
compact when the soil is wet or under rainy conditions. Compacted clay soils can
develop high strength, but the assemblage of clay minerals present determines their
stability against shrinkage and expansion under varying moisture contents.
Compacted clays have low to very low hydraulic conductivity, a factor that can
prove beneficial or deleterious depending upon hydraulic conductivity needed for
the project. Clay soils can be compacted only with great difficulty when wet.
6.1 Embankments
Design of an embankment to support a roadway must consider settlement,
slope stability and bearing capacity at the base of the embankment.
Settlement must be within required specifications, especially when the
embankment is located adjacent to a rigid structure such as a bridge.
Differential settlement is normally more of a concern than total settlement.
When excessive settlement or slope stability is a problem, the most common
(and often most economical) solution is treatment of the soil as it is emplaced
during embankment construction. For most Nebraska soils, a minimum
63
design factor of safety of 1.25 will be required against slope or bearing
failure.
6.1a Settlement
Embankments constructed over the top of certain types of deposits often
experience settlement that varies in magnitude and the length of time required
to reach equilibrium. Laboratory tests conducted on undisturbed samples can
be evaluated to determine the amount of settlement expected and the period
of time that settlement will be a problem. Many treatment methods are
available at various costs and durations. The design engineer must compare
the economics of each method of treatment while considering the time
required to achieve primary settlement. Some of the most commonly used
methods of mitigating settlement include:
o Removal and replacement of the soil displaying excessive settlement.
Removal/replacement of materials is generally not economical when
the depth of removal exceeds 10 ft (3 meters).
o Placing a load, usually in the form of a temporary fill above the
compressible layer to accelerate settlement. This is known as
preloading.
o Use of sand or wick drains in conjunction with preloading or the
planned embankment to accelerate settlement.
o Use of instrumentation and time delays when the settlement problem is
located adjacent to structural foundations. Bridge approaches are often
constructed as the last sections of pavement constructed to allow
additional time for consolidation at these critical locations.
Instrumentation is installed and used to monitor settlement, so that
construction of the pavement is delayed only until primary settlement is
completed.
o Vibrocompaction, if granular materials are the foundation soils are the
cause of the settlement.
o Dynamic compaction of material used to densify the compressible
foundation soils by dropping a weight from a specified height in a
regular pattern over the soil surface.
The rate of settlement depends upon the hydraulic conductivity and thickness
of the consolidating layer, the shape and length of the drainage pattern, and
the magnitude of excess pore water pressure. An economical option to
decrease the rate of settlement is adding a surcharge (typically 5 to 8 feet) of
fill to the finished subgrade elevation of the embankment. The additional
load from the surcharge often can increases the total amount of settlement but
also decreases the time it takes for the settlement that is expected for the
embankment without the surcharge. After settlement completion the
surcharge is removed. It is important that slope stability analysis be
64
performed for the embankment with the surcharge to determine if there is a
possibility for a safety factor reduction below minimum requirements.
Duration of settlement for an embankment can be significantly reduced
through use of a sand blanket to relieve pore water pressure. A sand blanket
is a horizontal layer of clean, granular material, not less than 24 inches (600
mm) thick. The sand layer is placed directly upon the original ground
surface. The drainage blanket acts as a pervious foundation over which the
embankment is constructed. The edges of the drainage blanket may be left
exposed and allowed to drain freely, or PVC drainpipes may be spaced within
the drainage layer to provide free drainage.
Depending upon the height of embankment, providing drainage pathways for
excessive pore water pressure through use of vertical or inclined sand or wick
drains may also shorten the duration of consolidation. Design of a successful
drainage system requires a detailed subsurface analysis, careful design and
meticulous installation of the drains. The nature of the substrata and its
influence on drainage must also be considered.
6.1b Stability
Techniques used to improve slope stability of an embankment include some
of the same techniques used to preclude settlement. Slope stability
improvement techniques often include one or more of the following actions:
o Removal and replacement of the unsuitable material.
o Use of a soil berm, usually at the base or sometimes embankment
midslope.
o Installation of some type of a drainage system.
o Installation of some type of structural support system, such as a
retaining wall, soil nails, or micropiles.
o Soil reinforcement consisting of a geogrid or geotextiles used at the
base of or within the embankment fill.
o Construction of a shear key or toe key at the toe of slope.
o Reinforcement.
Construction of a reinforced soil slope should be considered when there is
insufficient Row-of-Way for a stable embankment slope. The reinforced soil
slope should be evaluated for both internal and external stability and be
designed to have an acceptable magnitude of settlement. Special provisions
may be necessary to mitigate surface erosion, as the reinforced slope will
normally be steeper than adjacent natural slopes composed of similar
material.
65
Proprietary systems or a system designed by a geotechnical engineer for the
specific location can be used. If a proprietary system is used, initial plans
should be completed showing both line and grade drawings. A special
provision should be added to the specifications providing reinforced slope
requirements and a list of approved proprietary systems that meet those
requirements. The manufacturer of the proprietary system or the contractor
installing the system should submit detailed shop drawings and stability
analysis for review and approval by NDOR engineers.
If a geotechnical engineer completes a unique design based upon a specific
location, his/her design recommendations should include surface treatment,
required properties of fill soil, compaction specifications, surface slope angle,
specifications for geosynthetic materials recommended, locations and
spacing of geosynthetic materials and soil layer thicknesses.
o Cut Slopes.
There a several analysis methods available to evaluate the stability of a cut
slope. For most types of soils found in Nebraska, a minimum design factor of
safety of 1.5, based upon laboratory tests of undisturbed samples, is required.
A higher FOS is required for cut slopes (than for embankments), as cut
slopes normally weather more adversely when exposed to surface drainage
conditions.
Flattening the slope or improving drainage are the principle methods used to
improve the stability of slopes that are too steep. Flattening of a slope is
commonly accomplished by construction of one or more benches. Benches
should be at least ten feet (3 meters) wide to allow tractor mowing. Ground
water seepage through the face of a cut slope is normal but it may result in
slope failure when the rate of discharge is inadequate to relieve pore water
pressure. Seepage also removes fine materials from the slope face resulting
in surface instability. Perhaps the most effective way of dealing with
groundwater seepage is to extract the water at a higher level up the slope
using some form of subsurface drainage system. Interceptor trenches or
trench drains can be used to intercept water higher on the slope, rendering the
face of a slope more stable.
Constrained rights-of-way may require unique solutions to ensure cut slope
stability. Problems in specific locations may be mitigated through the use of
various types of retaining walls, sheeting, or by construction of specially
designed soil berms.
6.1c Surface Compaction Methods and Procedures.
Construction of a fill section consists of two distinct operations, placing and
spreading of material to create each layer and the subsequent compaction
66
process. Compaction is normally the more critical of the two steps and its
rate often controls the rate of progress for the entire job. The use of proper
and adequate compaction equipment is a matter of economic necessity for the
contractor. Various types of specialized equipment have been developed
specially for use by the construction industry. Some equipment has been
designed for compacting particular types of soil, while other types of
equipment are suitable for use on more than one type of soil.
Sheep’s foot rollers and other rollers with projecting feet compact by a
combination of tamping and kneading action. These compactors consist of a
steel drum with small projections welded onto the outside. For most rollers,
the drum can be filled with water or sand to increase the weight of
compaction. Roller weight is imposed primarily upon the projections,
resulting in high compaction pressures in the range of 100-600 psi (700-4200
kN/m2), depending upon the size of the roller.
When loose soil is compacted, the drum projections penetrate into the layer
and compact the soil near the bottom of the layer first. In subsequent passes,
the roller projections sink into the layer less and less, indicative of the fact
that the zone being compacted continually is rising upward. Rising of the
roller projections through the layer with each pass is referred to as the
compactor “walking out” of the lift. The depth of layer that can be
compacted is related to the length of the drum projections and the compactor
weight. Large, heavy units can compact lifts ranging upward to one foot in
thickness in three to five passes, while smaller, lighter units can compact lifts
only six inches in thickness for the same number of passes. Sheep’s foot
rollers are well suited for compacting clay and silt-clay soils. They are not
recommended for cohesionless soils, because the projections continuously
disturb the surface being compacted.
Pneumatic tire rollers compact by kneading soil between the tires. The
number of tires per axle may vary from two to six or more. Some types of
pneumatic tire rollers have bent axles for a “wobbley-wheel” effect, resulting
in a weaving path being followed by each wheel. Pneumatic tire rollers are
normally equipped with a weight or ballast box, to allow easy variation of the
roller’s weight. These rollers are available in a wide variety of sizes and
weights, the most common being 50-ton (450-kN) rollers.
Pneumatic tire rollers are the best equipment for general compaction use.
They are capable of compacting both cohesive and cohesionless soils.
Lighter rollers (20 tons or 20,000 kg) are generally capable of compacting
lifts up to six inches in thickness in three to five passes, while equipment in
the 40-50 ton range (40,000-50,000 kg) is capable of compacting layers up to
twelve inches in thickness in three to five passes. Pneumatic tire compaction
is not limited to specific compaction equipment. Other rubber-tired
67
equipment (graders, trucks and scrapers) are capable of providing effective
compaction, especially under emergency conditions.
Vibratory compactors are available in a wide variety of configurations,
including vibrating drum and vibrating pneumatic tire compactors. Vibrating
drum equipment has a separate motor that powers a series of eccentric
weights, resulting in a high frequency, low amplitude, up and down
movement of the drum. Both sheep’s foot and smooth drums models are
available. A vibratory pneumatic tire compactor has a separate vibratory unit
attached to the axle, so that the wheels vibrate while the ballast is not
affected. Both types of roller are generally available as either towed or self-
propelled equipment.
Many vibratory compactors have a dash control that allows the operator to
vary the vibrating frequency. Frequencies available generally range from
1500-2500 cycles per minute. Most soils are composed of particles that
oscillate in unison within the above frequency range, allowing repeated
impacts from the compactor’s weight to shake them into a denser
configuration. Vibratory compactors achieve best results when operated at
speeds of 2-4 mph (3-6 km/hr). Smooth drum vibratos are effective when
compacting granular soils. With little or no silt or clay, a lift thickness of 3 ft
(1m) can compacted to near maximum modified Proctor value. As the
percentage of fine material increases, the thickness of layer being compacted
must be reduced. Vibratory pneumatic wheel rollers have also been
successfully used to compact granular soils, but the maximum lift thickness
for effective compaction is limited to about 1 ft (0.3 m).
Conventional (non-vibratory) smooth drum rollers are not well suited for
compacting soil because the size of the drum and large contact area result in
relatively low compaction pressure. Smooth drum rollers can be used to seal
the surface of project at the end of each workday. Sealing provides a smooth
surface allowing rainwater to run off, as opposed to rainwater soaking into
the upper layers and creating a soft working surface for the next day. Table
10 provides a generalized summary that relates soil types to the
characteristics of equipment considered suitable for achieving compaction.
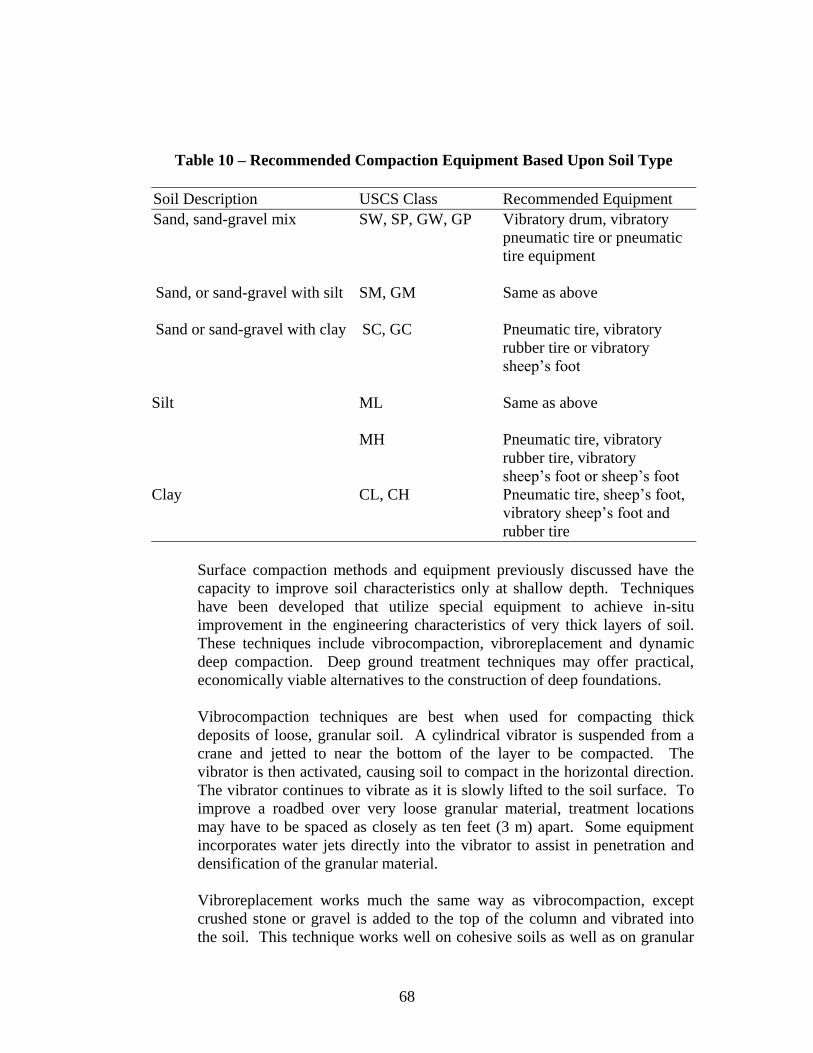
68
Table 10 – Recommended Compaction Equipment Based Upon Soil Type
Soil Description USCS Class Recommended Equipment
Sand, sand-gravel mix SW, SP, GW, GP Vibratory drum, vibratory
pneumatic tire or pneumatic
tire equipment
Sand, or sand-gravel with silt SM, GM Same as above
Sand or sand-gravel with clay SC, GC Pneumatic tire, vibratory
rubber tire or vibratory
sheep’s foot
Silt ML Same as above
MH Pneumatic tire, vibratory
rubber tire, vibratory
sheep’s foot or sheep’s foot
Clay CL, CH Pneumatic tire, sheep’s foot,
vibratory sheep’s foot and
rubber tire
Surface compaction methods and equipment previously discussed have the
capacity to improve soil characteristics only at shallow depth. Techniques
have been developed that utilize special equipment to achieve in-situ
improvement in the engineering characteristics of very thick layers of soil.
These techniques include vibrocompaction, vibroreplacement and dynamic
deep compaction. Deep ground treatment techniques may offer practical,
economically viable alternatives to the construction of deep foundations.
Vibrocompaction techniques are best when used for compacting thick
deposits of loose, granular soil. A cylindrical vibrator is suspended from a
crane and jetted to near the bottom of the layer to be compacted. The
vibrator is then activated, causing soil to compact in the horizontal direction.
The vibrator continues to vibrate as it is slowly lifted to the soil surface. To
improve a roadbed over very loose granular material, treatment locations
may have to be spaced as closely as ten feet (3 m) apart. Some equipment
incorporates water jets directly into the vibrator to assist in penetration and
densification of the granular material.
Vibroreplacement works much the same way as vibrocompaction, except
crushed stone or gravel is added to the top of the column and vibrated into
the soil. This technique works well on cohesive soils as well as on granular
69
soils. The introduced stone mixes with the in-situ soil only in the area
subject to vibration, creating a column partially supported by the stone. This
type of stone column can provide a bearing capacity up to 40 tons. The
overall capacity of a site treated by vibroreplacement will depend upon the
spacing of the stone columns and the bearing capacity of the material beneath
the columns.
Dynamic deep compaction is a method in which a heavy (2-50 ton) weight is
dropped from a relatively great height 30-150 ft (10-45 m). The weight and
height utilized is dependent upon the equipment available and the depth of
soil requiring improvement. A closely spaced grid pattern is commonly laid
out on the soil surface and multiple drops are scheduled at each location.
This process can be used successfully with most types of soils building
problem soils consisting of building rubble and buried garbage fills. A
depression is created at each drop location that must be filled in and
compacted using normal surface compaction methods.
The intent of deep compaction is to improve marginal surface deposit that
already exists at the site to obtain a capacity adequate for roadways or other
relatively light surface loads. If used successfully, dynamic deep compaction
precludes constructing deep foundations or removal and replacement of a
significant thickness of surface material.
6.1d Pile Installation
Pile installation involves furnishing, driving, trimming, and testing bearing of
various types of piles. Specifications for this type of work can be found in
Section 703 of NDOR’s Standard Specifications for Highway Construction.
The selection of pile type usually depends on the foundation soil conditions.
For NDOR the common practice is:
o H-piles are used for fine grain, clay, or on the rock conditions.
o Concrete pile are used in sands.
o Pipe piles are used in sands and clays.
o Pile Capacity Field Determination
Capacity of piles driven through certain types of soil can be directly related
to the resistance to penetration developed in the pile during driving. This
relationship holds only for soils that do not develop high pore water pressure
as piles are driven, including free-draining granular soils and stiff clays. In
cohesive saturated soils, high pore water pressures develop because of soil
displacement caused by driving. The predicted capacity based upon such a
soil’s resistance to pile penetration is very different from the capacity
developed after the excess pore water pressure dissipates.

70
Since field personnel must be aware of when driving can be stopped, pile
capacity is often expressed as number of blows to drive a pile a specified
distance (one foot is common). Driven pile foundations require that records
be maintained for every pile installed. An example of a completed pile
driving record is shown in Figure 17. The size and driven length of each pile
should be recorded, as well as the number of inches per hammer blow needed
to drive the pile the last ten blows.
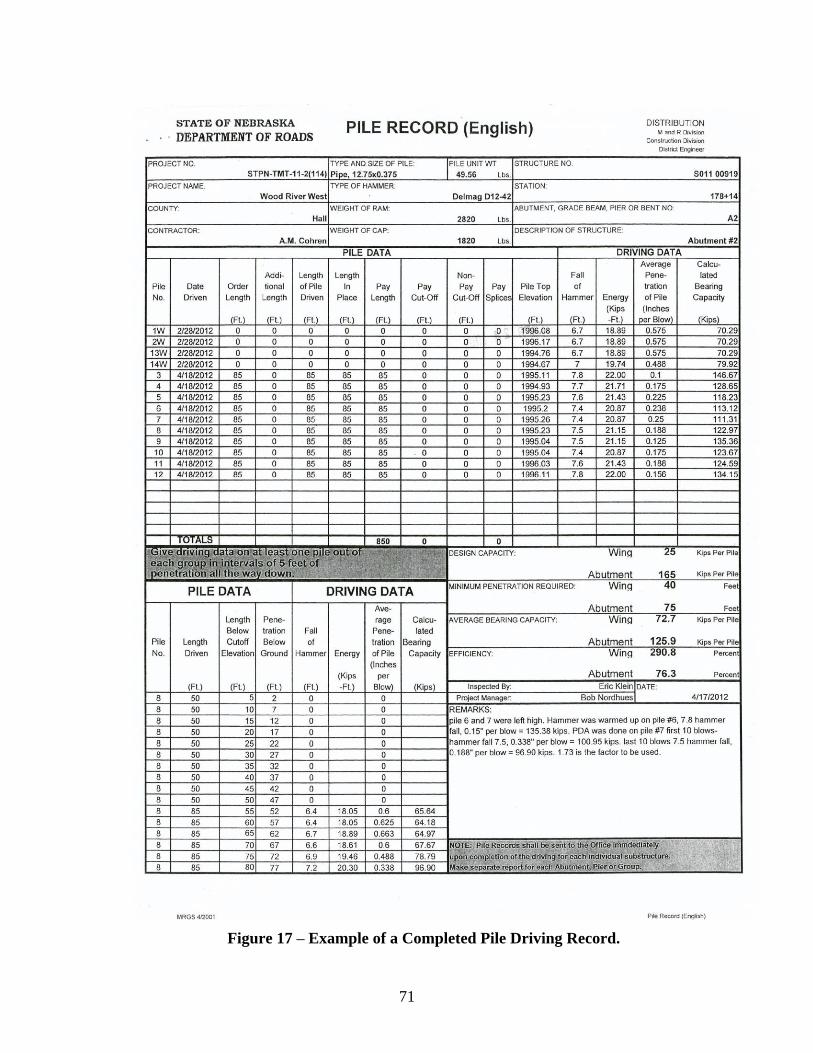
71
Figure 17 – Example of a Completed Pile Driving Record.
72
At NDOR, the pile capacity is verified using two methods: 1) CAPWAP,
and 2) the Nebraska Modified ENR Formula.
o CAPWAP
The CAPWAP method is based on the data from the Pile Driving Analyzer
(PDA). Sensors are attached to the pile in question and the PDA measures
the dynamic response of a pile during driving. The Case Pile Wave Analysis
Program (CAPWAP) takes the signal inputs of force and velocity from
driving collected from the PDA and matches the results with the wave theory
to obtain results to simulate a static load test.
o Nebraska Modified ENR Formula
The Nebraska Modified ENR Formula is based on the correlation between
hammer energy and the resistance of the pile based on Nebraska Soil Types.
The original Nebraska Modified ENR Formula was updated in 2007 to
incorporate the AASHTO LRFD codes and is shown as:
P = 4E .
(S+0.5)
Where P is the factored pile capacity in kips, S is the average penetration in
inches of the pile per blow for the last ten blows for steam or diesel hammers,
and E is the energy (the ram fall distance in feet times the ram weight) in
foot-kips. This pile capacity formula is used for both concrete and steel piles
in all Nebraska soil types.
o Pile Load Tests
Both cohesive and granular soils will have their properties altered by the
installation of a driven pile. In cohesive soils, driving a pile will cause
remolding and a temporary loss of strength. With time, much of the lost
strength will be recovered, so the testing of piles driven in clay should be
delayed until several weeks after driving for the results to be valid. Piles
driven through granular soils may exhibit a temporary increase in resistance.
In the first week after driving, most of this temporary resistance is lost, so
load testing on piles driven through granular soils should be postponed at
least five days to make the results are valid.
Loads are applied to the piles during a load test using an anchored platform
as illustrated in Figure 18. Measurements of applied load can be taken
directly from a load cell and/or from a pressure gauge on the jack. A
qualified lab should calibrate both the jack and load cell before testing.
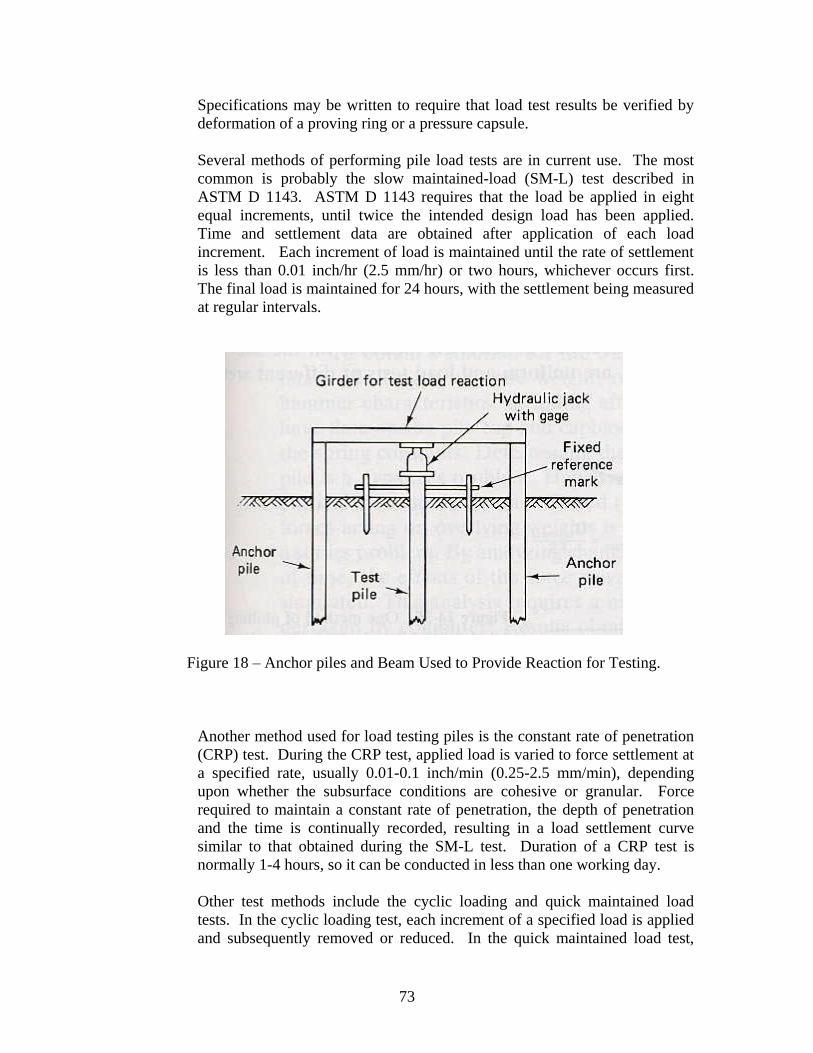
73
Specifications may be written to require that load test results be verified by
deformation of a proving ring or a pressure capsule.
Several methods of performing pile load tests are in current use. The most
common is probably the slow maintained-load (SM-L) test described in
ASTM D 1143. ASTM D 1143 requires that the load be applied in eight
equal increments, until twice the intended design load has been applied.
Time and settlement data are obtained after application of each load
increment. Each increment of load is maintained until the rate of settlement
is less than 0.01 inch/hr (2.5 mm/hr) or two hours, whichever occurs first.
The final load is maintained for 24 hours, with the settlement being measured
at regular intervals.
Figure 18 – Anchor piles and Beam Used to Provide Reaction for Testing.
Another method used for load testing piles is the constant rate of penetration
(CRP) test. During the CRP test, applied load is varied to force settlement at
a specified rate, usually 0.01-0.1 inch/min (0.25-2.5 mm/min), depending
upon whether the subsurface conditions are cohesive or granular. Force
required to maintain a constant rate of penetration, the depth of penetration
and the time is continually recorded, resulting in a load settlement curve
similar to that obtained during the SM-L test. Duration of a CRP test is
normally 1-4 hours, so it can be conducted in less than one working day.
Other test methods include the cyclic loading and quick maintained load
tests. In the cyclic loading test, each increment of a specified load is applied
and subsequently removed or reduced. In the quick maintained load test,
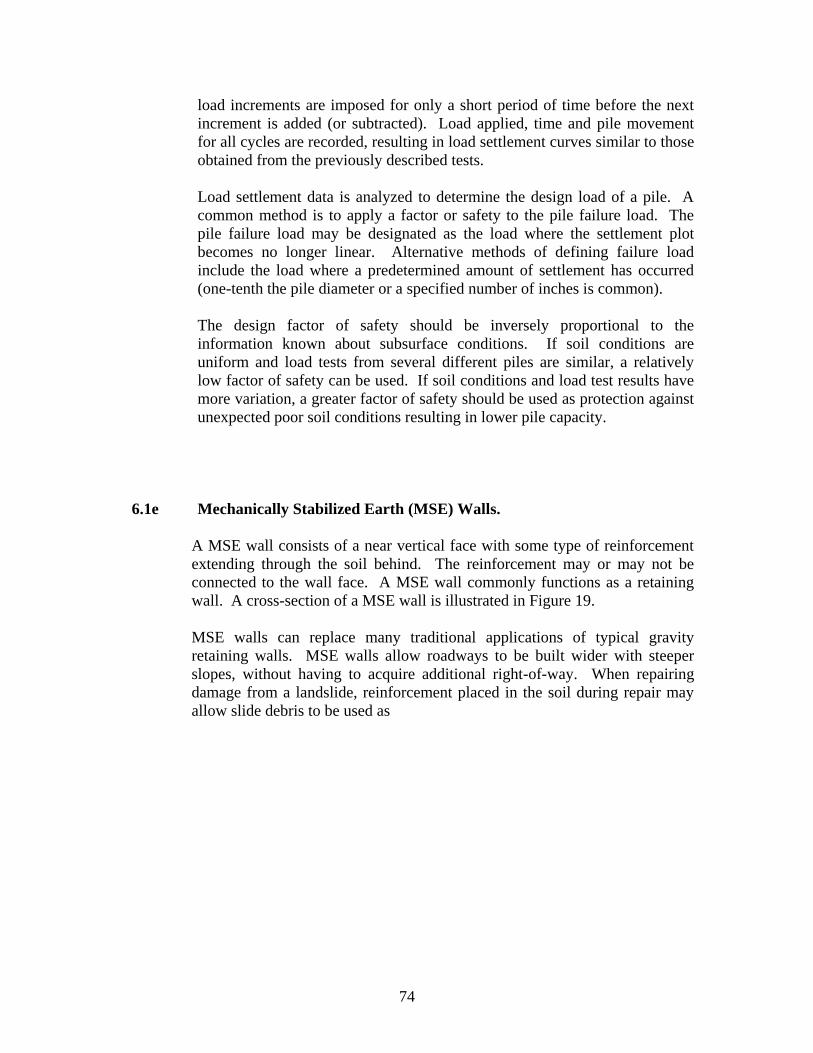
74
load increments are imposed for only a short period of time before the next
increment is added (or subtracted). Load applied, time and pile movement
for all cycles are recorded, resulting in load settlement curves similar to those
obtained from the previously described tests.
Load settlement data is analyzed to determine the design load of a pile. A
common method is to apply a factor or safety to the pile failure load. The
pile failure load may be designated as the load where the settlement plot
becomes no longer linear. Alternative methods of defining failure load
include the load where a predetermined amount of settlement has occurred
(one-tenth the pile diameter or a specified number of inches is common).
The design factor of safety should be inversely proportional to the
information known about subsurface conditions. If soil conditions are
uniform and load tests from several different piles are similar, a relatively
low factor of safety can be used. If soil conditions and load test results have
more variation, a greater factor of safety should be used as protection against
unexpected poor soil conditions resulting in lower pile capacity.
6.1e Mechanically Stabilized Earth (MSE) Walls.
A MSE wall consists of a near vertical face with some type of reinforcement
extending through the soil behind. The reinforcement may or may not be
connected to the wall face. A MSE wall commonly functions as a retaining
wall. A cross-section of a MSE wall is illustrated in Figure 19.
MSE walls can replace many traditional applications of typical gravity
retaining walls. MSE walls allow roadways to be built wider with steeper
slopes, without having to acquire additional right-of-way. When repairing
damage from a landslide, reinforcement placed in the soil during repair may
allow slide debris to be used as
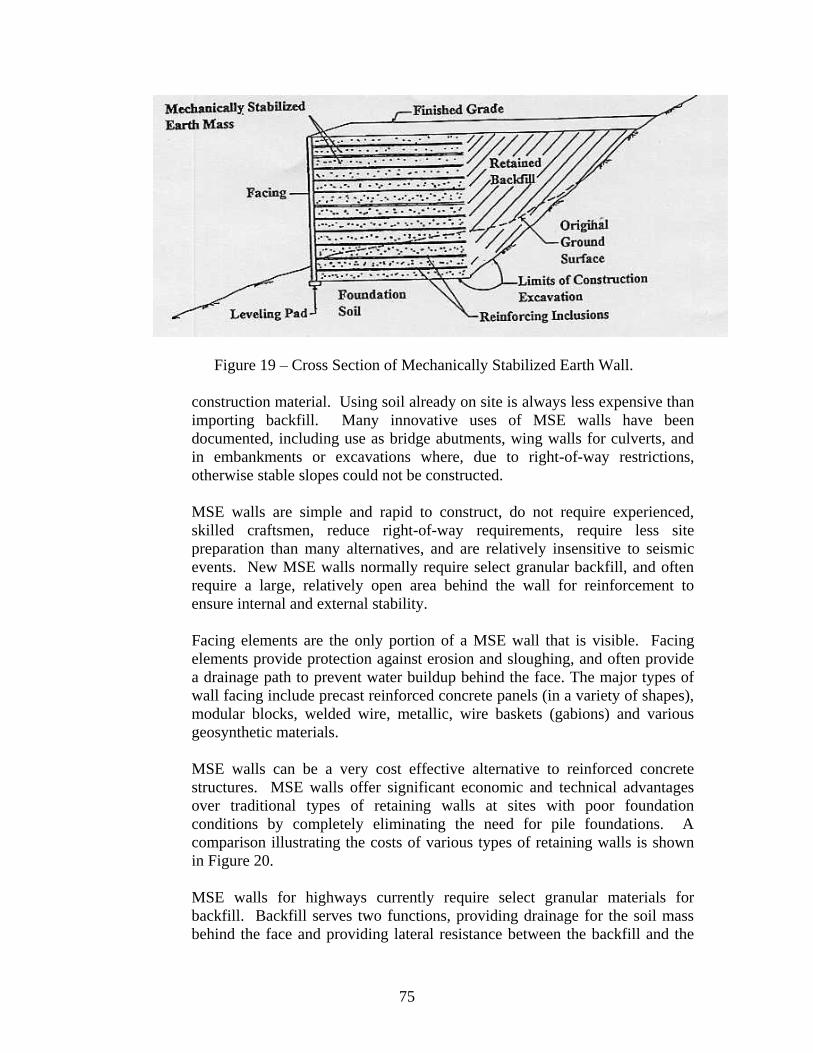
75
Figure 19 – Cross Section of Mechanically Stabilized Earth Wall.
construction material. Using soil already on site is always less expensive than
importing backfill. Many innovative uses of MSE walls have been
documented, including use as bridge abutments, wing walls for culverts, and
in embankments or excavations where, due to right-of-way restrictions,
otherwise stable slopes could not be constructed.
MSE walls are simple and rapid to construct, do not require experienced,
skilled craftsmen, reduce right-of-way requirements, require less site
preparation than many alternatives, and are relatively insensitive to seismic
events. New MSE walls normally require select granular backfill, and often
require a large, relatively open area behind the wall for reinforcement to
ensure internal and external stability.
Facing elements are the only portion of a MSE wall that is visible. Facing
elements provide protection against erosion and sloughing, and often provide
a drainage path to prevent water buildup behind the face. The major types of
wall facing include precast reinforced concrete panels (in a variety of shapes),
modular blocks, welded wire, metallic, wire baskets (gabions) and various
geosynthetic materials.
MSE walls can be a very cost effective alternative to reinforced concrete
structures. MSE walls offer significant economic and technical advantages
over traditional types of retaining walls at sites with poor foundation
conditions by completely eliminating the need for pile foundations. A
comparison illustrating the costs of various types of retaining walls is shown
in Figure 20.
MSE walls for highways currently require select granular materials for
backfill. Backfill serves two functions, providing drainage for the soil mass
behind the face and providing lateral resistance between the backfill and the
76
soil reinforcing material. Most MSE wall systems depend upon friction
between the reinforcing elements and the backfill to generate lateral force to
hold the wall in place.
Figure 20 – Cost of Various Types of MSE Walls.
Lower quality backfill could possibly be used, but the engineering
characteristics of the lower quality material needs to be taken into account in
the design. Granular material offers excellent drainage characteristics, which
provide increased life to the reinforcing elements, especially when the
reinforcing elements are primarily metallic. The methods used to construct
and compact granular backfill also increase the speed of wall construction and
decrease variations in alignment as the wall face is constructed upward.
The construction sequence for a MSE wall starts with site preparation. A non-
structural leveling pad is then constructed for the wall face, followed by
placing the first row of facing panels on the leveling pad. Backfill is then
placed on the subgrade up to the level of the first layer of reinforcement. This
backfill is compacted and the first layer of reinforcing elements is placed on
the compacted backfill. The second layer of backfill is then placed over the
reinforcing elements and compacted. This process is repeated until the wall
reaches its design height. Specifications for both concrete panel and modular
block wall facing materials and construction processes are contained within
Sections 714 and 715 of NDOR’s Standard Specifications for Highway
Construction.
Reinforced soil slopes (RSS) can be a cost effective alternative to MSE wall
construction in instances where transportation cost for suitable backfill is
prohibitive. A reinforced soil slope is usually constructed at angles steeper
than could otherwise be safely built and maintained for a natural soil slope.
77
Reinforcement strengthens the tensile properties of the soil, increasing slope
stability during both wet and dry conditions. Reinforcement also improves
compaction and tensile properties of the soil immediately adjacent to the slope
face, thereby decreasing sloughing.
RSS are usually constructed without facing. Slopes constructed without
facing or with flexible facing can more easily adapt to distortion caused by
settlement, freeze-thaw cycles, and wet-dry cycles. RSS are relatively
unaffected by changes in water content, so RSS have some applications when
dealing with saturated soils. Some specific applications include preventing
sloughing slopes during periods of saturation, various uses in flood control
structures, and slope stability for increasing the height of dams.
RSS increase the factor of safety against sliding, allowing steeper than natural
slopes, allow repair of landslides using material from the site and decrease
right-of-way requirements. However, maintenance operations (mowing) may
become more complicated on steeper slopes. The practice of designing and
constructing RSS is still evolving and has yet to be standardized.
6.2 Instrumentation.
Field instrumentation is often used in conjunction with major road projects
before, during and after construction. During the design phase, field
instrumentation can assist engineers by providing data that allows refinement
of the final design. An example of instrumentation used during the design
phase might include a small, instrumented test embankment constructed
before the project begins. Measurements of consolidation in the test
embankment assist in prediction of rates of and magnitudes of settlement on
the actual project.
On projects where laboratory tests or instrumentation has indicated potential
problems with settlement or embankment stability, instrumentation is often
installed to monitor conditions during construction. The locations and
orientations of all instrumentation should be included in foundation and
earthwork plans. Design notes should also specify all provisions for time and
consolidation constraints that the contractor needs to consider (i.e. fill
material will be compacted to the extent that settlement will not exceed 1
inch (25mm) per 24 hours) before and during construction.
Instrumentation can also be installed to provide information on existing
slopes or embankments. Slope indicators placed within an existing slope can
provide data useful in determining the rate of slope movement and in
designing remediation systems to mitigate slope movement.
Most of the instrumentation described in this chapter has some type of
appendages that protrude above ground level on the construction site. These
78
appendages are particularly susceptible to damage by construction equipment
working at the site. Pieces, parts or cables protruding above ground should
be clearly marked in a conspicuous manner so that each is visible to
construction personnel. The project manager should ensure that all
contractors and subcontractors are aware of this equipment and its
importance to the project.
6.2a Inclinometers (Slope Indicators).
Inclinometers are used to monitor the stability of an embankment or slope.
The inclinometer casing consists of a grooved metal or plastic tube that is
inserted down a borehole. The casing should be inserted to sufficient depth
to penetrate all layers in which stability problems are anticipated. The
bottom of the casing is commonly anchored in rock, concrete or other dense
material so that it remains at a fixed location. A probe is lowered down the
casing and readings that measure the horizontal deflection of the casing are
taken at fixed depths. Successive readings taken over a period of time
provide a chronological record of horizontal deformation in the inclinometer
casing as a function of depth (see Figure 21).
When inserting an inclinometer casing, space sometimes exists between the
borehole wall and the casing. This space is normally filled with gravel, sand
or firm grout. If compressible soils are being used for embankment
construction, telescoping couplings are available which prevent damage to
the inclinometer casing as the soil consolidates.
Casings must be installed so that the grooved channels are as close to vertical
as possible. Spiraling of the casing will result in the grooves at depth being
oriented differently from the grooves at the surface. Excessive spiraling of
the casing will require a spiral-checking sensor and a computerized data
reduction routine to provide meaningful data.
Inclinometer casings are normally placed at or near the toe of a slope to
monitor stability as a high embankment is constructed. Readings should be
taken frequently during embankment construction. Fill operations should be
halted immediately if a sudden increase in rate of slope movement is
detected.
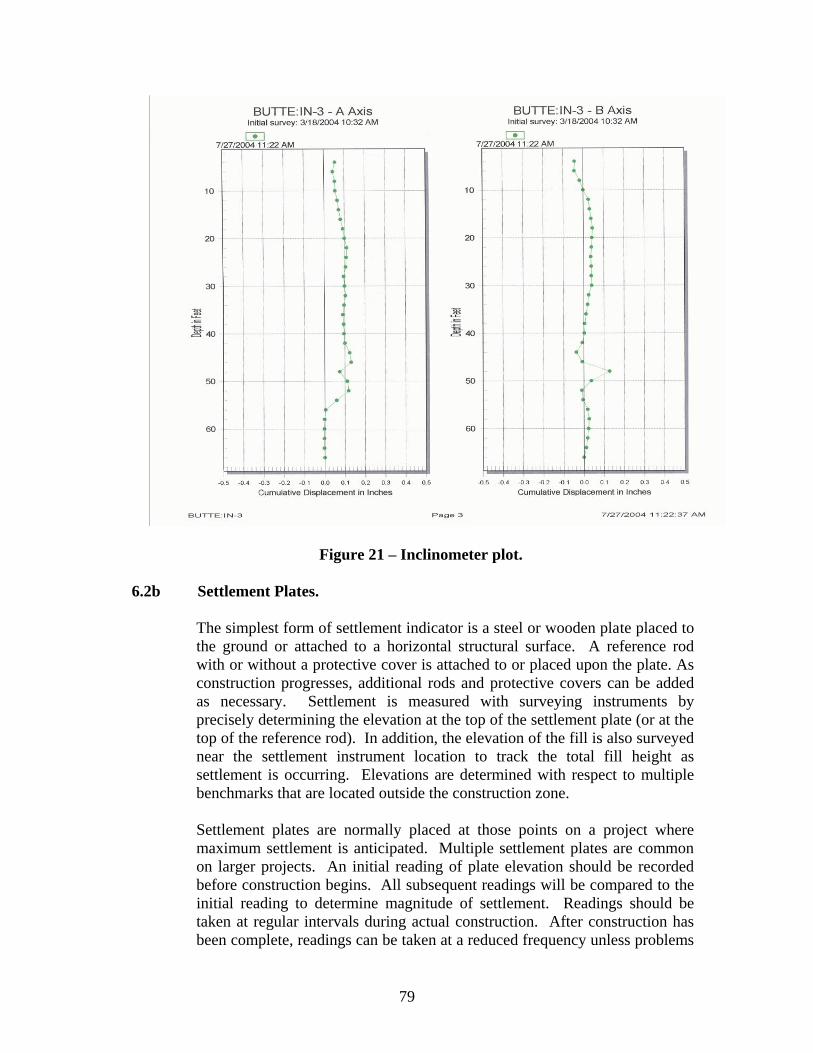
79
Figure 21 – Inclinometer plot.
6.2b Settlement Plates.
The simplest form of settlement indicator is a steel or wooden plate placed to
the ground or attached to a horizontal structural surface. A reference rod
with or without a protective cover is attached to or placed upon the plate. As
construction progresses, additional rods and protective covers can be added
as necessary. Settlement is measured with surveying instruments by
precisely determining the elevation at the top of the settlement plate (or at the
top of the reference rod). In addition, the elevation of the fill is also surveyed
near the settlement instrument location to track the total fill height as
settlement is occurring. Elevations are determined with respect to multiple
benchmarks that are located outside the construction zone.
Settlement plates are normally placed at those points on a project where
maximum settlement is anticipated. Multiple settlement plates are common
on larger projects. An initial reading of plate elevation should be recorded
before construction begins. All subsequent readings will be compared to the
initial reading to determine magnitude of settlement. Readings should be
taken at regular intervals during actual construction. After construction has
been complete, readings can be taken at a reduced frequency unless problems
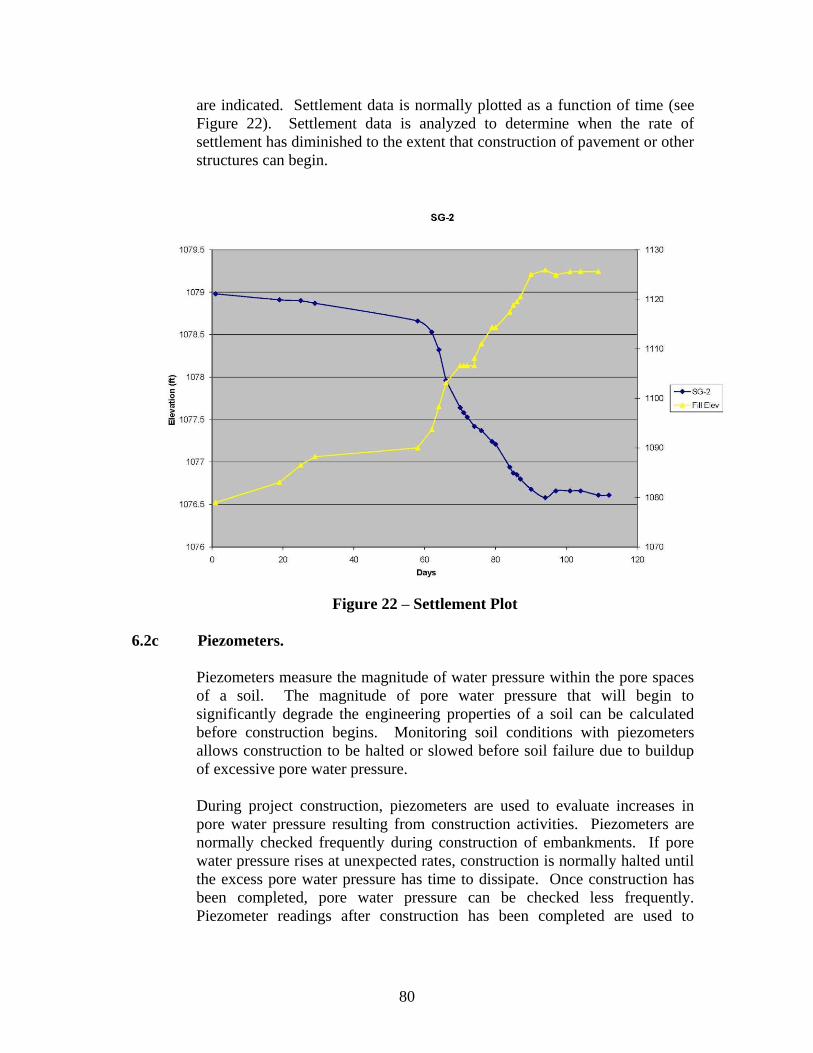
80
are indicated. Settlement data is normally plotted as a function of time (see
Figure 22). Settlement data is analyzed to determine when the rate of
settlement has diminished to the extent that construction of pavement or other
structures can begin.
Figure 22 – Settlement Plot
6.2c Piezometers.
Piezometers measure the magnitude of water pressure within the pore spaces
of a soil. The magnitude of pore water pressure that will begin to
significantly degrade the engineering properties of a soil can be calculated
before construction begins. Monitoring soil conditions with piezometers
allows construction to be halted or slowed before soil failure due to buildup
of excessive pore water pressure.
During project construction, piezometers are used to evaluate increases in
pore water pressure resulting from construction activities. Piezometers are
normally checked frequently during construction of embankments. If pore
water pressure rises at unexpected rates, construction is normally halted until
the excess pore water pressure has time to dissipate. Once construction has
been completed, pore water pressure can be checked less frequently.
Piezometer readings after construction has been completed are used to
81
evaluate the dissipation of pore water pressure over time, which is directly
related to the rate of soil consolidation.
The simplest type of piezometer consists of an open standpipe extending
through the fill. Since open standpipe piezometers may experience a
significant time lag in registering changes in pore water pressure, this type
has largely been replaced by pneumatic, vibrating wire or electrical
piezometers. Pneumatic piezometers are used primarily to monitor static
water levels, while vibrating wire and electrical piezometers are more
commonly used to measure changes in water pressure.
Piezometers (other than the standpipe type) consist of a body containing a
flexible diaphragm installed over a pressure sensitive device. The sensor is
installed at the location where water pressure is to be measured. Tubes or
wires commonly attach the sensor to a readout unit, and in some instances to
a data logger, which provides a continuous record of pore water pressure.
Piezometers are normally installed prior to or during construction at any
location where excess pore water pressure may develop into a problem.
Piezometers may be placed at various depths within the same project
depending upon the thickness of the layers involved, the loads anticipated
and the construction activities scheduled.
6.2d Monitoring Wells
Monitoring wells are used to monitor groundwater levels typically in the
design phase of a project or during construction. It consists of a perforated
section of pipe attached to a riser pipe. The perforated section of pipe is
located within the expected water-bearing portion of the soil or formation and
is backfilled with clean free-draining sand. The clean sand is capped with a
bentonite layer and then backfilled with cuttings to the surface.
Monitoring wells are often used in proposed wetland projects or for special
applications where the water table can have an adverse impact on
construction. Monitoring wells shall be installed and abandoned by a
Licensed Well Drilling Contractor in the State of Nebraska according to
Nebraska Department of Health and Human Services regulations.
82
Chapter 7
Analysis, Design and Report Format
7.1 Introduction
Upon completion of the subsurface exploration and laboratory testing, the
Geotechnical Engineer will organize, perform analysis, and provide design
recommendations. The extent of the analysis is dependent on the scope of the
project and the soil conditions.
This chapter discusses the factors that must be considered during the analysis and
design phase and typical methods for solving possible project problems. Guidelines
for suggested analysis are provided from FHWA and are shown in Table 11. Any
computer software used for analysis shall be stated in the Geotechnical Engineering
Report.
It is the responsibility of the Geotechnical Engineer to keep updated as new
standards, methods, and technology in the engineering and construction field
progresses. The suggested methods and references provide guidance for typical
geotechnical situations with many other methods and options possible.
7.1a Roadway Embankment
Soil Survey explorations are used to determine the suitability of the existing
materials for use as roadway embankment according to Division 200
“Earthwork” of the Standard Specifications for Highway Construction.
The soil types encountered shall be classified according to both the Nebraska
Modified Group Index (Chapter 4) and USCS. Any problematic soils shall
be delineated both horizontally and vertically. Recommendations for soil
types, shallow groundwater table, or other conditions that may adversely
affect the pavement performance and constructability of the project shall be
provided. Examples of the Soil Survey’s Soil & Situation Report and the
Subgrade Survey & Situation Report are provided in Appendixes C and D,
respectively. Typical recommendations for problematic soils include:
o Excavation and replacement with controlled earth fill.
o Stabilization with lime, cement, fly ash, ckd.
o Stabilization with geosynthetics.
o Moisture conditioning of soil (i.e. wetting or drying)
o Installation of drainage system.
Other situations that may become visible during a Soil Survey exploration
include expansive soils, rocky soils, springs, and frost-susceptible soils, etc.
83
The observation and affect of these properties on roadway performance
should be stated and addressed.
7.1b Embankment Settlement/Stability
o Settlement
Settlement calculations shall be based on the results of consolidation tests
performed on high-quality undisturbed samples. Design procedures should
follow that of:
o Soils and Foundations Workshop Manual – Cheney, Richard, S.,
Chassie, Ronald, G., FHWA-NHI-00-045, 2000
o Foundation Analysis and Design – Fifth Edition, Bowles, Joseph, E.,
New York: McGraw-Hill Companies, 1996.
The results of consolidation curves should be plotted on a time-settlement
curve included in the report. The total settlement estimate should be based
on primary consolidation. The period of time for the settlement to occur
(paving delay period) should be based on all but 0.5 inches of remaining of
the total primary consolidation. The extent of the paving delay period shall
be delineated in the Geotechnical report (i.e. station to station). If based on
project criteria, the amount and/or paving delay period is excessive, a method
of dealing with the problem must be addressed. There also may be a need to
design and monitor a field instrumentation program. Possible solutions to
excessive settlement and/or paving delays are:
o Provide a waiting period to allow for a majority of settlement to
occur.
o Reduce fill height.
o Use of fill surcharge.
o Use of lightweight fill
o Excavate compressible material and replace with granular or
controlled earth fill.
o Install wick drain system.
o Design or recommend ground modification such as stone columns,
deep soil mixing, etc.
o Combinations of some of above.
7.1c Stability
Stability analysis is performed based on results from in-situ strength tests and
laboratory strength tests on high quality undisturbed samples. Both
undrained and undrained triaxial tests shall be used to consider both short-
term and long-term embankment stability. LRFD slope stability analysis
84
shall be based on a resistance factor of 0.75 for slopes supporting or affecting
traffic. For slopes supporting structures a resistance factor of 0.65 shall be
used in accordance with the current AASHTO LRFD Bridge Design
Specifications. Design procedures should follow that of:
o Soils and Foundations Workshop Manual – Cheney, Richard, S.,
Chassie, Ronald, G., FHWA-NHI-00-045, 2000
o Advanced Technology for Slope Stability: Volume I, Slope Stability
Manual – Abramson, L., Boyce, Lee, T., Sharma, S., -FHWA-SA-94-
005, 1994.
The soil resistance shall be calculated for possible slope conditions (i.e.
surcharge loading, equipment loading, varying water tables, etc.) for the
service limit state. The geotechnical engineer shall design a method of
dealing with potential stability issues and may also need to design and
monitor a field instrumentation program. Possible solutions to slope stability
remediation include:
o Highway realignment.
o Reduce fill height.
o Flatten slope.
o Staged construction allowing for weak soils to gain strength through
consolidation.
o Excavate and replace weak soils.
o Use of berms at toe.
o Construct shear key or toe key.
o Use of lightweight fill.
o Ground modification such as stone columns, deep soil mixing, etc.
o Install underdrain system to minimize water infiltration into soils.
o Proper drainage at the top of the slope, diverting surface water from
the slope face.
o Combinations of the above.
7.1d Retaining Wall Design
All retaining walls; including gravity walls, cantilever walls, mechanically
stabilized earth (MSE) walls, soil anchor walls, and soil nail walls; shall be
designed in accordance with the current AASHTO LRFD Bridge Design
Specifications with sufficient soil resistance to bearing, sliding, overturning,
and global stability. Internal stability for MSE walls shall be the
responsibility of the Contractor’s designer.
85
o Gravity Walls
Design procedures should follow that of:
o Foundations and Earth Structures – NAVFAC DM-7.2, Department
of the Navy, Naval Facilities Engineering Command, 1986.
o Principles of Foundation Engineering – Sixth Edition, DAS, Braja,
M., Thomson, 2007.
o MSE Walls
Design procedures should follow that of:
o AASHTO LRFD Bridge Design Specifications, American
Association of State Highway and Transportation Officials, current
edition.
o Mechanically Stabilized Earth Walls and Reinforced Soil Slopes
Design and Construction Guidelines, Elias, Victor, Christopher, Barry
R., and Berg, Ryan R., FHW-NHI-00-043, 2000.
o NDOR Standard Specifications for Highway Construction, Sections
714 and 715, current edition.
NDOR maintains a list of approved proprietary mse wall systems on the
Approved Product List. The Geotechnical Engineer is responsible for
determining the total and differential settlement and the external stability
(bearing, sliding, overturning, and global stability) for the proposed wall to
ensure it is suitable for the existing foundation soils. Roadway plans provide
the wall geometry and foundation soil information to allow the wall system
vendor to design the proposed wall. Refer to Sections 714 & 715 of NDOR
Standard Specifications for Highway Construction for procedures on design
of walls.
o Cantilever Retaining Walls
Design procedures should follow that of:
o AASHTO LRFD Bridge Design Specifications, American
Association of State Highway and Transportation Officials, current
edition.
o Foundations and Earth Structures – NAVFAC DM-7.2, Department
of the Navy, Naval Facilities Engineering Command, 1986.
o Principles of Foundation Engineering – Sixth Edition, DAS, Braja,
M., Thomson, 2007.
86
Although these wall types are typically more robust than mse walls, it is very
important that settlement, especially differential, is minimized. It is also
critical to have proper drainage and backfill requirements behind the wall.
o Soil Nail Walls
Design procedures should follow that of:
o Soil Nail Walls, Lazarte, C., Elias, V., Espinoza, D., Sabatini, P.,
FHWA GEC7, FHWA-IF-03-017, 2003.
The geotechnical engineer shall provide foundation soil properties for the
design of the soil nail walls. Roadway plans shall provide wall location and
geometry.
o Soldier Pile Walls
Design procedures should follow that of:
o AASHTO LRFD Bridge Design Specifications, American
Association of State Highway and Transportation Officials, current
edition.
o Foundations and Earth Structures – NAVFAC DM-7.2, Department
of the Navy, Naval Facilities Engineering Command, 1986.
o Foundation Analysis and Design – Fifth Edition, Bowles, Joseph, E.,
New York: McGraw-Hill Companies, 1996.
Soldier pile and lagging walls typically consist of steel H-piles and horizontal
lagging and are primarily used for top-down construction. Soldier piles may
be cantilevered or anchored. Soldier Pile walls can be considered at
locations where sheet pile walls are needed, but difficulty in sheet pile
installation is expected.
7.1e Foundation Types
Most foundation types in Nebraska consist of spread footings, driven piles,
and drilled shafts, with driven piles and drilled shafts being the predominant
foundation type used for bridges. Design capacity for these foundations shall
be based on SPT, and/or cone penetration tests, laboratory and/or in-situ
strength tests, and consolidation tests. Consideration should be given to
additional field tests when variable soil conditions are encountered. All
foundations shall be designed based on the most current edition of the
AASHTO LRFD Bridge Design Specifications.
87
o Spread Footings
The use of spread footings is typically controlled by the proposed loads, the
depth to adequate bearing material, and the potential for settlement. Design
procedures should follow that of:
o Soils and Foundations Workshop Manual – Cheney, Richard, S.,
Chassie, Ronald, G., FHWA-NHI-00-045, 2000
o Foundations and Earth Structures – NAVFAC DM-7.2, Department
of the Navy, Naval Facilities Engineering Command, 1986.
o Spread Footings for Highway Bridges– Haley & Aldrich, Inc.,
FHWA-RD-86-185, 1987.
Varying depths of footings should be considered to achieve maximum
efficiency of design. Scour depth shall be the controlling factor at water
crossings and may exclude spread footings. The total and differential
settlement, along with the rate of settlement shall be addressed.
Recommendations regarding difficult conditions such as dewatering and
foundation soil preparation should be provided.
o Driven Piles
Driven piles shall be designed for axial and lateral loading conditions as
applicable. The following types of driven piles are considered acceptable for
supporting structural loads on permanent NDOR structures:
o Steel H-piles
o Concrete piles
o Steel Pipe piles
o Other pile types may be considered
Design procedures should follow that of:
o AASHTO LRFD Bridge Design Specifications, American
Association of State Highway and Transportation Officials, current
edition.
o Soils and Foundations Workshop Manual – Cheney, Richard, S.,
Chassie, Ronald, G., FHWA-NHI-00-045, 2000
o Design and Construction of Driven Pile Foundations Volumes I & II,
FHWA-NHI-05-042 and 043, 2006.
Different pile types and sizes should be analyzed to obtain the most efficient
design. Depth of scour must be considered for both axial and lateral load
analysis at water crossings. Pile group effects, punching shear in thin bearing
layers, settlement and downdrag shall be addressed as applicable.
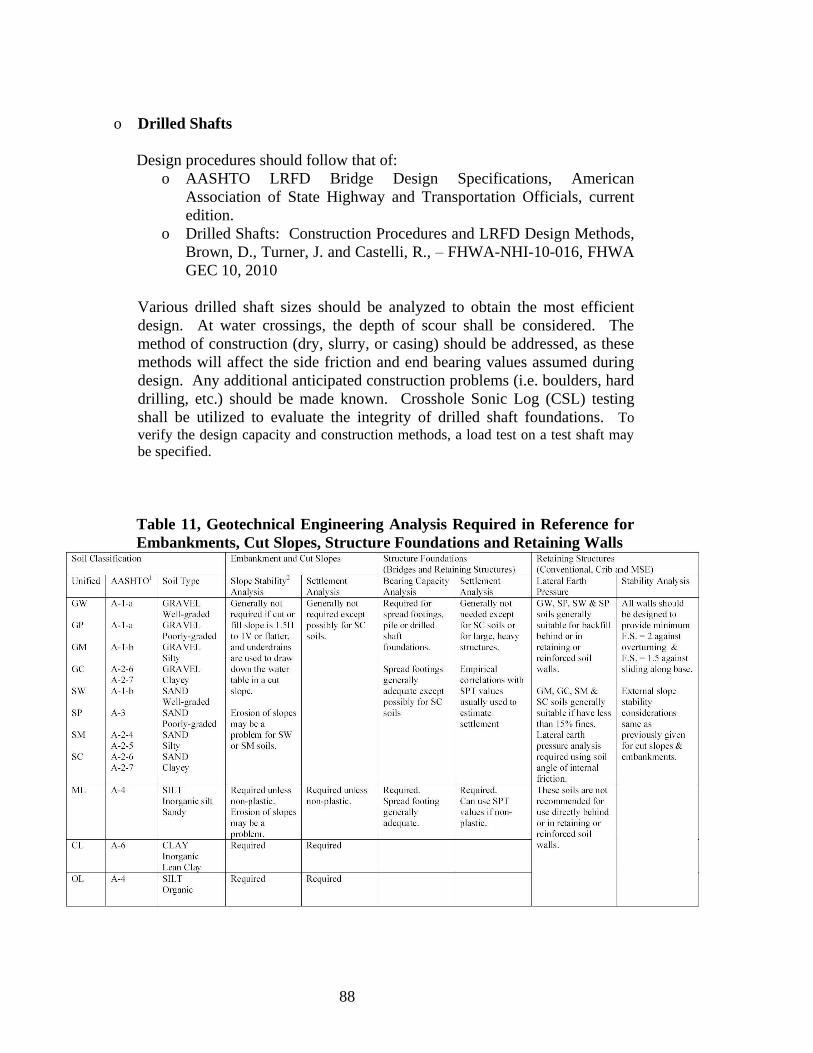
88
o Drilled Shafts
Design procedures should follow that of:
o AASHTO LRFD Bridge Design Specifications, American
Association of State Highway and Transportation Officials, current
edition.
o Drilled Shafts: Construction Procedures and LRFD Design Methods,
Brown, D., Turner, J. and Castelli, R., – FHWA-NHI-10-016, FHWA
GEC 10, 2010
Various drilled shaft sizes should be analyzed to obtain the most efficient
design. At water crossings, the depth of scour shall be considered. The
method of construction (dry, slurry, or casing) should be addressed, as these
methods will affect the side friction and end bearing values assumed during
design. Any additional anticipated construction problems (i.e. boulders, hard
drilling, etc.) should be made known. Crosshole Sonic Log (CSL) testing
shall be utilized to evaluate the integrity of drilled shaft foundations. To
verify the design capacity and construction methods, a load test on a test shaft may
be specified.
Table 11, Geotechnical Engineering Analysis Required in Reference for
Embankments, Cut Slopes, Structure Foundations and Retaining Walls
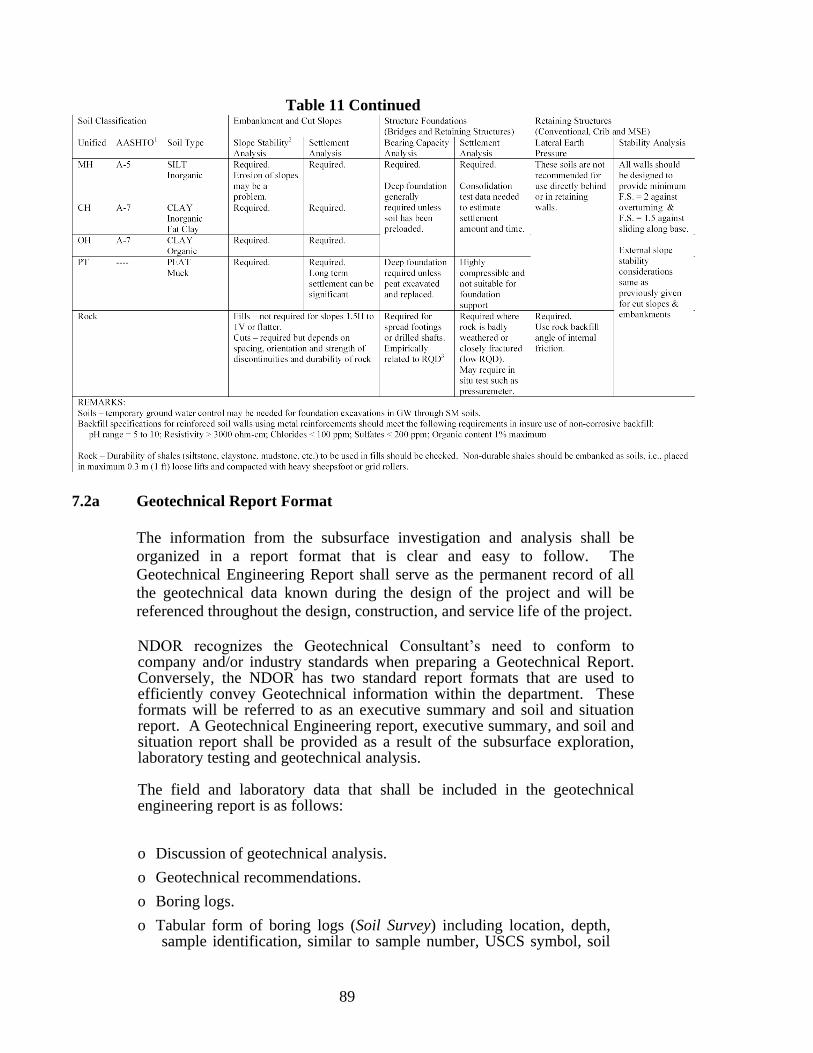
89
Table 11 Continued
7.2a Geotechnical Report Format
The information from the subsurface investigation and analysis shall be
organized in a report format that is clear and easy to follow. The
Geotechnical Engineering Report shall serve as the permanent record of all
the geotechnical data known during the design of the project and will be
referenced throughout the design, construction, and service life of the project.
NDOR recognizes the Geotechnical Consultant’s need to conform to company and/or industry standards when preparing a Geotechnical Report. Conversely, the NDOR has two standard report formats that are used to efficiently convey Geotechnical information within the department. These formats will be referred to as an executive summary and soil and situation report. A Geotechnical Engineering report, executive summary, and soil and situation report shall be provided as a result of the subsurface exploration, laboratory testing and geotechnical analysis. The field and laboratory data that shall be included in the geotechnical engineering report is as follows:
o Discussion of geotechnical analysis.
o Geotechnical recommendations.
o Boring logs.
o Tabular form of boring logs (Soil Survey) including location, depth, sample identification, similar to sample number, USCS symbol, soil
90
description, depth to water, % moisture, % retained #200 sieve, plasticity index, group index (Nebraska).
o Tabular form of lab test data (Soil Survey) including lab identification, sample identification, location, depth of material, sieve analysis, % silt, % clay, liquid limit, plasticity index, group index, in-situ moisture content, maximum density, optimum moisture.
o Density and moisture content of undisturbed soil samples.
o Unconfined compressive test, triaxial test and consolidation test reports.
o Soil classification test data. The Executive Summary Report shall conform to the format presented in Attachment B. The Soil and Situation Report for the Soil Survey shall contain in order.
o Description of project location and length.
o Description of proposed construction.
o Description of topography, drainage and water table.
o General description of the soils, pedology and geology.
o Tabulation summarizing the different soils types showing the range of % retained on the 200 sieve, plasticity index and group index (Nebraska) for each soil type.
Draft reports shall be provided to NDOR for review prior to issuance of final reports.
Monitoring wells are used to monitor groundwater levels typically in the
design phase of a project or during construction. It consists of a perforated
section of pipe attached to a riser pipe. The perforated section of pipe is
located within the expected water-bearing portion of the soil or formation and
is backfilled with clean free-draining sand. The clean sand is capped with a
bentonite layer and then backfilled with cuttings to the surface.
Monitoring wells are often used in proposed wetland projects or for special
applications where the water table can have an adverse impact on
construction. Monitoring wells shall be installed and abandoned by a
Licensed Well Drilling Contractor in the State of Nebraska according to
Nebraska Department of Health and Human Services regulations.
7.2b Example of Geotechnical Executive Summary Format
The following are examples of report templates that are frequently used for common conditions. The intent of this document is to provide a guide in preparing the general style of the Geotechnical Executive Summary. Modifications to the following verbiage will very like be necessary to fit conditions that are encountered.
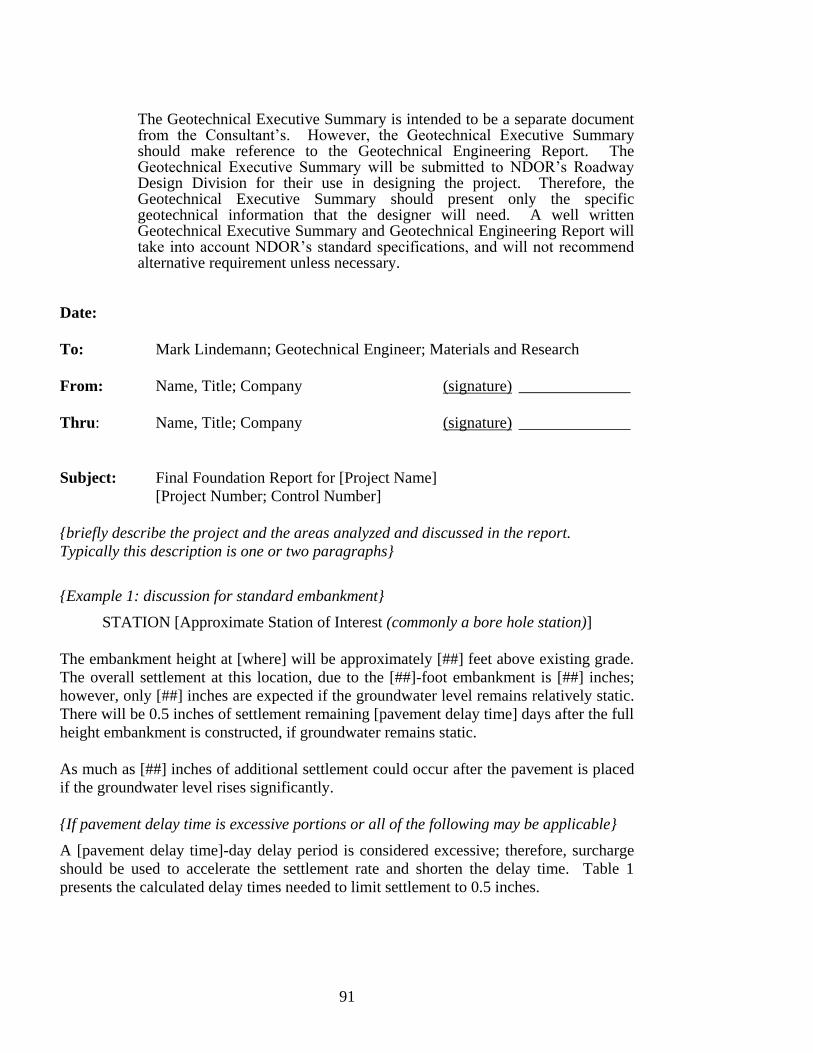
91
The Geotechnical Executive Summary is intended to be a separate document from the Consultant’s. However, the Geotechnical Executive Summary should make reference to the Geotechnical Engineering Report. The Geotechnical Executive Summary will be submitted to NDOR’s Roadway Design Division for their use in designing the project. Therefore, the Geotechnical Executive Summary should present only the specific geotechnical information that the designer will need. A well written Geotechnical Executive Summary and Geotechnical Engineering Report will take into account NDOR’s standard specifications, and will not recommend alternative requirement unless necessary.
Date:
To: Mark Lindemann; Geotechnical Engineer; Materials and Research
From: Name, Title; Company (signature) ______________
Thru: Name, Title; Company (signature) ______________
Subject: Final Foundation Report for [Project Name]
[Project Number; Control Number]
{briefly describe the project and the areas analyzed and discussed in the report.
Typically this description is one or two paragraphs}
{Example 1: discussion for standard embankment}
STATION [Approximate Station of Interest (commonly a bore hole station)]
The embankment height at [where] will be approximately [##] feet above existing grade.
The overall settlement at this location, due to the [##]-foot embankment is [##] inches;
however, only [##] inches are expected if the groundwater level remains relatively static.
There will be 0.5 inches of settlement remaining [pavement delay time] days after the full
height embankment is constructed, if groundwater remains static.
As much as [##] inches of additional settlement could occur after the pavement is placed
if the groundwater level rises significantly.
{If pavement delay time is excessive portions or all of the following may be applicable}
A [pavement delay time]-day delay period is considered excessive; therefore, surcharge
should be used to accelerate the settlement rate and shorten the delay time. Table 1
presents the calculated delay times needed to limit settlement to 0.5 inches.
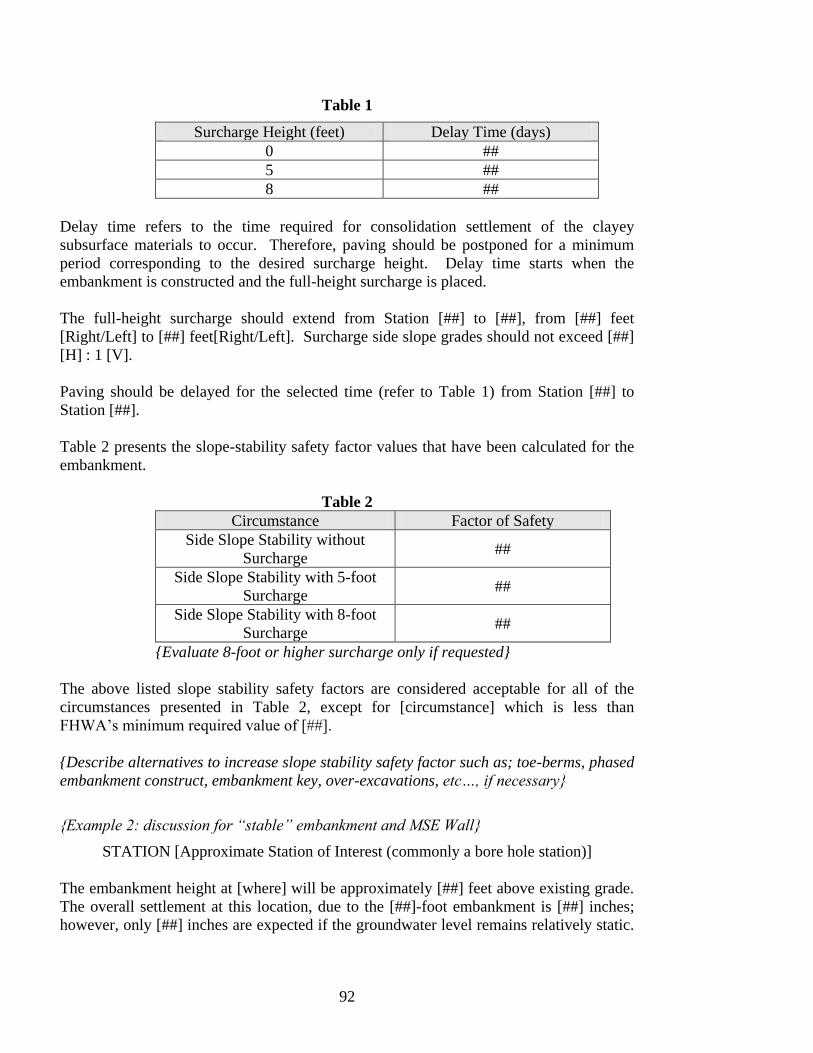
92
Table 1
Surcharge Height (feet) Delay Time (days)
0 ##
5 ##
8 ##
Delay time refers to the time required for consolidation settlement of the clayey
subsurface materials to occur. Therefore, paving should be postponed for a minimum
period corresponding to the desired surcharge height. Delay time starts when the
embankment is constructed and the full-height surcharge is placed.
The full-height surcharge should extend from Station [##] to [##], from [##] feet
[Right/Left] to [##] feet[Right/Left]. Surcharge side slope grades should not exceed [##]
[H] : 1 [V].
Paving should be delayed for the selected time (refer to Table 1) from Station [##] to
Station [##].
Table 2 presents the slope-stability safety factor values that have been calculated for the
embankment.
Table 2
Circumstance Factor of Safety
Side Slope Stability without
Surcharge ##
Side Slope Stability with 5-foot
Surcharge ##
Side Slope Stability with 8-foot
Surcharge ##
{Evaluate 8-foot or higher surcharge only if requested}
The above listed slope stability safety factors are considered acceptable for all of the
circumstances presented in Table 2, except for [circumstance] which is less than
FHWA’s minimum required value of [##].
{Describe alternatives to increase slope stability safety factor such as; toe-berms, phased
embankment construct, embankment key, over-excavations, etc…, if necessary}
{Example 2: discussion for “stable” embankment and MSE Wall}
STATION [Approximate Station of Interest (commonly a bore hole station)]
The embankment height at [where] will be approximately [##] feet above existing grade.
The overall settlement at this location, due to the [##]-foot embankment is [##] inches;
however, only [##] inches are expected if the groundwater level remains relatively static.
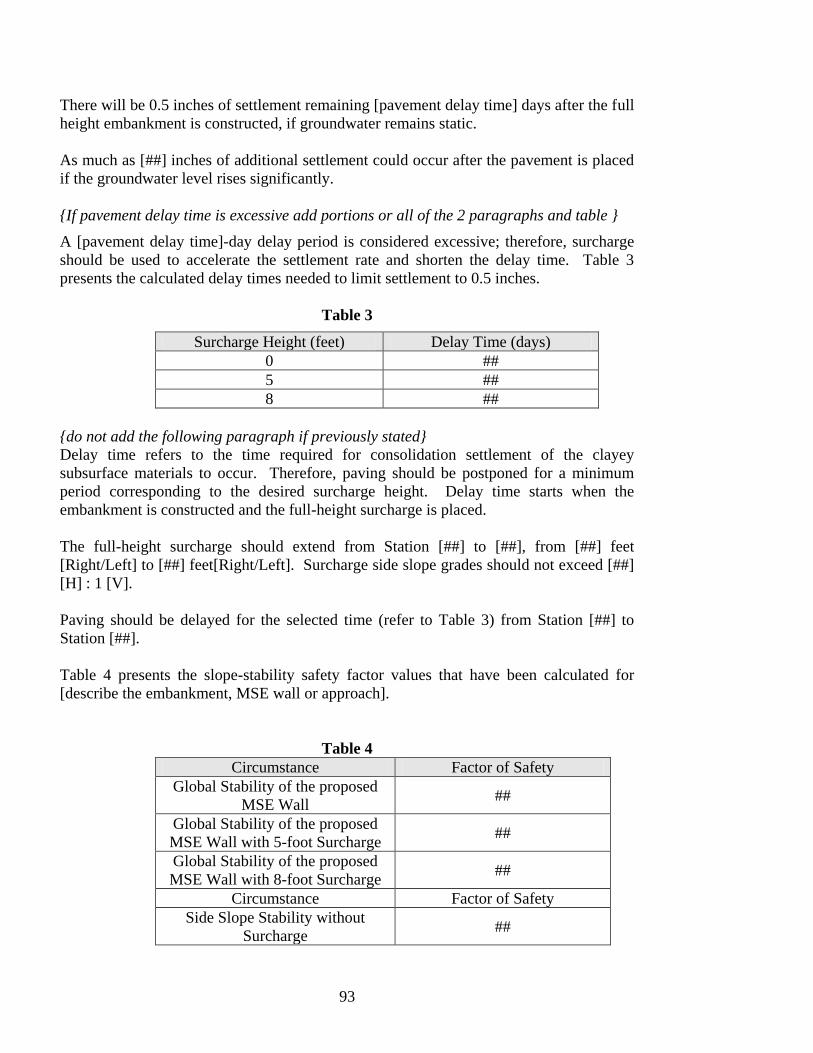
93
There will be 0.5 inches of settlement remaining [pavement delay time] days after the full
height embankment is constructed, if groundwater remains static.
As much as [##] inches of additional settlement could occur after the pavement is placed
if the groundwater level rises significantly.
{If pavement delay time is excessive add portions or all of the 2 paragraphs and table }
A [pavement delay time]-day delay period is considered excessive; therefore, surcharge
should be used to accelerate the settlement rate and shorten the delay time. Table 3
presents the calculated delay times needed to limit settlement to 0.5 inches.
Table 3
Surcharge Height (feet) Delay Time (days)
0 ##
5 ##
8 ##
{do not add the following paragraph if previously stated}
Delay time refers to the time required for consolidation settlement of the clayey
subsurface materials to occur. Therefore, paving should be postponed for a minimum
period corresponding to the desired surcharge height. Delay time starts when the
embankment is constructed and the full-height surcharge is placed.
The full-height surcharge should extend from Station [##] to [##], from [##] feet
[Right/Left] to [##] feet[Right/Left]. Surcharge side slope grades should not exceed [##]
[H] : 1 [V].
Paving should be delayed for the selected time (refer to Table 3) from Station [##] to
Station [##].
Table 4 presents the slope-stability safety factor values that have been calculated for
[describe the embankment, MSE wall or approach].
Table 4
Circumstance Factor of Safety
Global Stability of the proposed
MSE Wall ##
Global Stability of the proposed
MSE Wall with 5-foot Surcharge ##
Global Stability of the proposed
MSE Wall with 8-foot Surcharge ##
Circumstance Factor of Safety
Side Slope Stability without
Surcharge ##
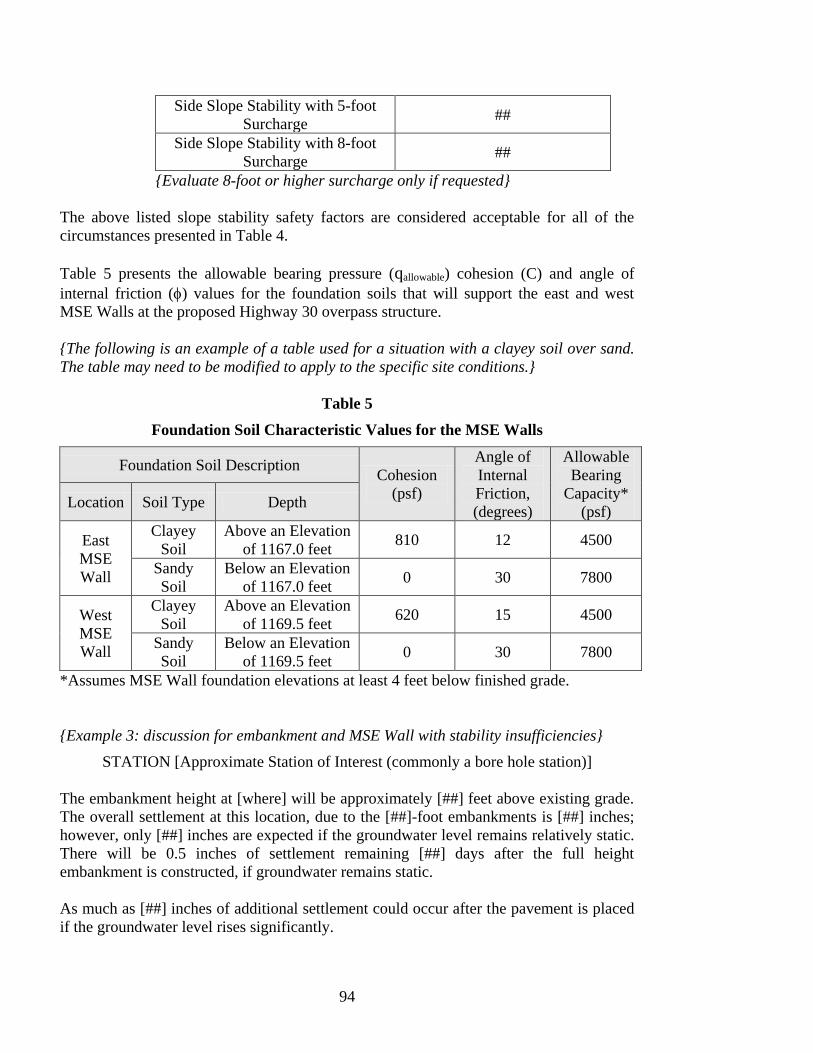
94
Side Slope Stability with 5-foot
Surcharge ##
Side Slope Stability with 8-foot
Surcharge ##
{Evaluate 8-foot or higher surcharge only if requested}
The above listed slope stability safety factors are considered acceptable for all of the
circumstances presented in Table 4.
Table 5 presents the allowable bearing pressure (qallowable) cohesion (C) and angle of
internal friction () values for the foundation soils that will support the east and west
MSE Walls at the proposed Highway 30 overpass structure.
{The following is an example of a table used for a situation with a clayey soil over sand.
The table may need to be modified to apply to the specific site conditions.}
Table 5
Foundation Soil Characteristic Values for the MSE Walls
Foundation Soil Description Cohesion
(psf)
Angle of
Internal
Friction,
(degrees)
Allowable
Bearing
Capacity*
(psf) Location Soil Type Depth
East
MSE
Wall
Clayey
Soil
Above an Elevation
of 1167.0 feet 810 12 4500
Sandy
Soil
Below an Elevation
of 1167.0 feet 0 30 7800
West
MSE
Wall
Clayey
Soil
Above an Elevation
of 1169.5 feet 620 15 4500
Sandy
Soil
Below an Elevation
of 1169.5 feet 0 30 7800
*Assumes MSE Wall foundation elevations at least 4 feet below finished grade.
{Example 3: discussion for embankment and MSE Wall with stability insufficiencies}
STATION [Approximate Station of Interest (commonly a bore hole station)]
The embankment height at [where] will be approximately [##] feet above existing grade.
The overall settlement at this location, due to the [##]-foot embankments is [##] inches;
however, only [##] inches are expected if the groundwater level remains relatively static.
There will be 0.5 inches of settlement remaining [##] days after the full height
embankment is constructed, if groundwater remains static.
As much as [##] inches of additional settlement could occur after the pavement is placed
if the groundwater level rises significantly.
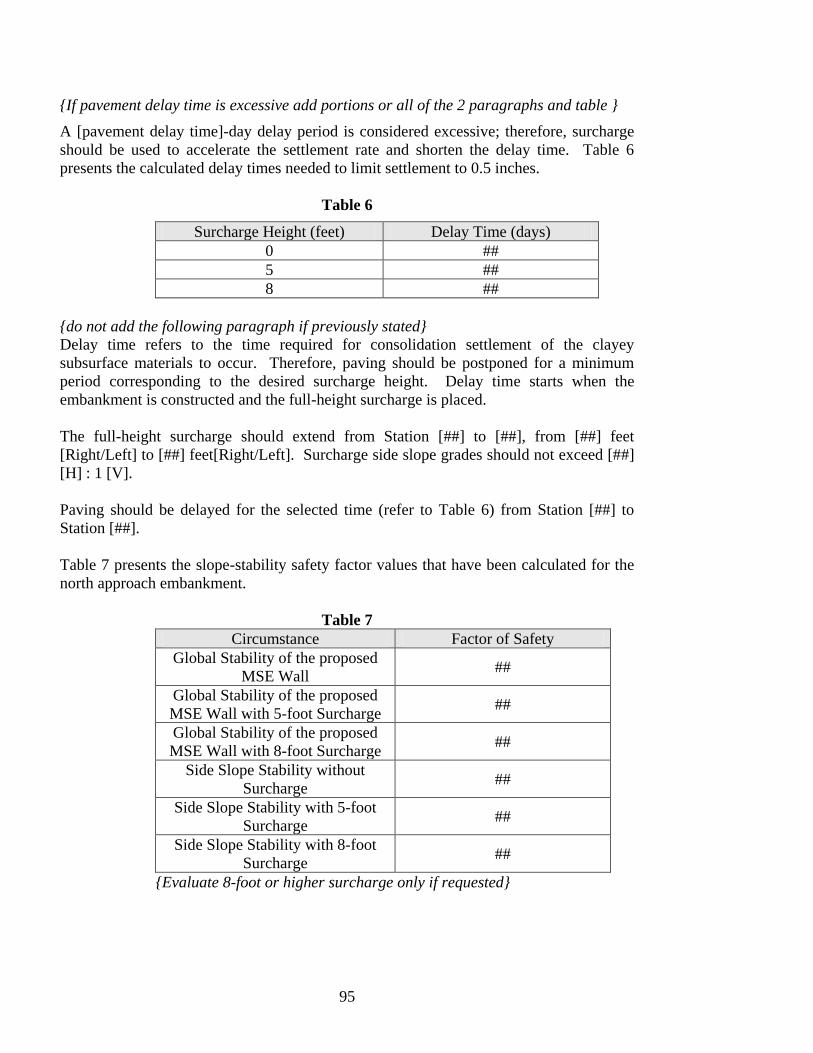
95
{If pavement delay time is excessive add portions or all of the 2 paragraphs and table }
A [pavement delay time]-day delay period is considered excessive; therefore, surcharge
should be used to accelerate the settlement rate and shorten the delay time. Table 6
presents the calculated delay times needed to limit settlement to 0.5 inches.
Table 6
Surcharge Height (feet) Delay Time (days)
0 ##
5 ##
8 ##
{do not add the following paragraph if previously stated}
Delay time refers to the time required for consolidation settlement of the clayey
subsurface materials to occur. Therefore, paving should be postponed for a minimum
period corresponding to the desired surcharge height. Delay time starts when the
embankment is constructed and the full-height surcharge is placed.
The full-height surcharge should extend from Station [##] to [##], from [##] feet
[Right/Left] to [##] feet[Right/Left]. Surcharge side slope grades should not exceed [##]
[H] : 1 [V].
Paving should be delayed for the selected time (refer to Table 6) from Station [##] to
Station [##].
Table 7 presents the slope-stability safety factor values that have been calculated for the
north approach embankment.
Table 7
Circumstance Factor of Safety
Global Stability of the proposed
MSE Wall ##
Global Stability of the proposed
MSE Wall with 5-foot Surcharge ##
Global Stability of the proposed
MSE Wall with 8-foot Surcharge ##
Side Slope Stability without
Surcharge ##
Side Slope Stability with 5-foot
Surcharge ##
Side Slope Stability with 8-foot
Surcharge ##
{Evaluate 8-foot or higher surcharge only if requested}
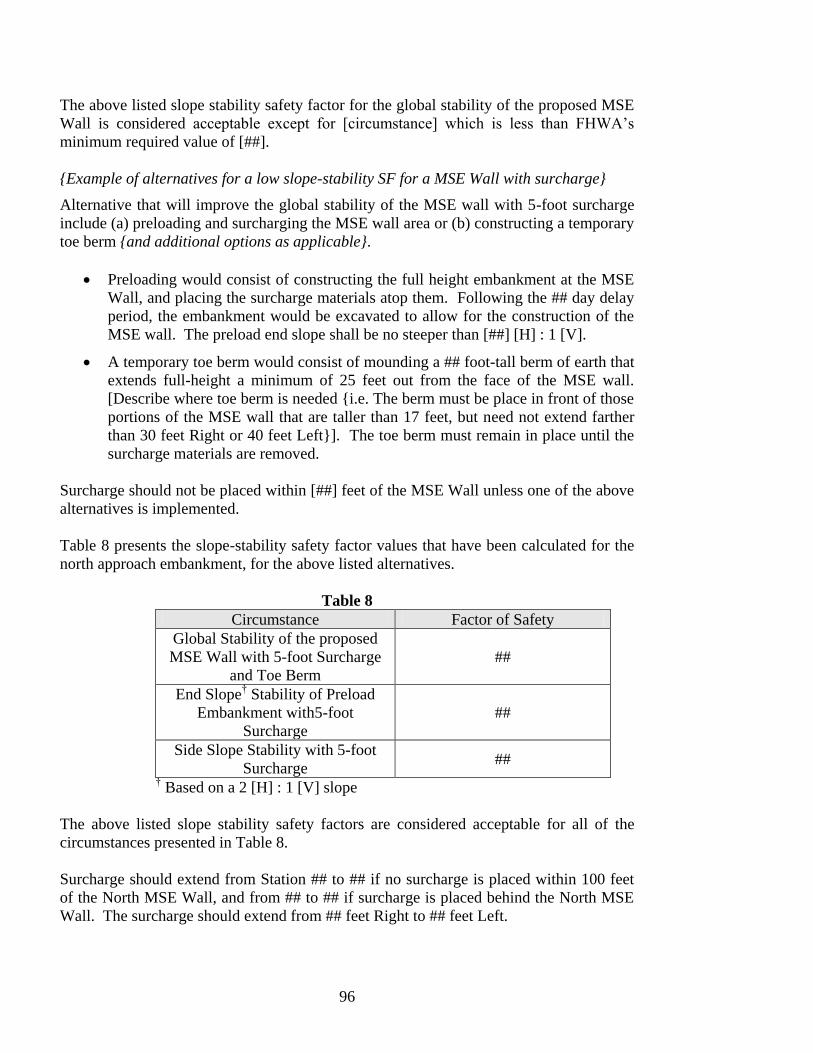
96
The above listed slope stability safety factor for the global stability of the proposed MSE
Wall is considered acceptable except for [circumstance] which is less than FHWA’s
minimum required value of [##].
{Example of alternatives for a low slope-stability SF for a MSE Wall with surcharge}
Alternative that will improve the global stability of the MSE wall with 5-foot surcharge
include (a) preloading and surcharging the MSE wall area or (b) constructing a temporary
toe berm {and additional options as applicable}.
Preloading would consist of constructing the full height embankment at the MSE
Wall, and placing the surcharge materials atop them. Following the ## day delay
period, the embankment would be excavated to allow for the construction of the
MSE wall. The preload end slope shall be no steeper than [##] [H] : 1 [V].
A temporary toe berm would consist of mounding a ## foot-tall berm of earth that
extends full-height a minimum of 25 feet out from the face of the MSE wall.
[Describe where toe berm is needed {i.e. The berm must be place in front of those
portions of the MSE wall that are taller than 17 feet, but need not extend farther
than 30 feet Right or 40 feet Left}]. The toe berm must remain in place until the
surcharge materials are removed.
Surcharge should not be placed within [##] feet of the MSE Wall unless one of the above
alternatives is implemented.
Table 8 presents the slope-stability safety factor values that have been calculated for the
north approach embankment, for the above listed alternatives.
Table 8
Circumstance Factor of Safety
Global Stability of the proposed
MSE Wall with 5-foot Surcharge
and Toe Berm
##
End Slope† Stability of Preload
Embankment with5-foot
Surcharge
##
Side Slope Stability with 5-foot
Surcharge ##
† Based on a 2 [H] : 1 [V] slope
The above listed slope stability safety factors are considered acceptable for all of the
circumstances presented in Table 8.
Surcharge should extend from Station ## to ## if no surcharge is placed within 100 feet
of the North MSE Wall, and from ## to ## if surcharge is placed behind the North MSE
Wall. The surcharge should extend from ## feet Right to ## feet Left.
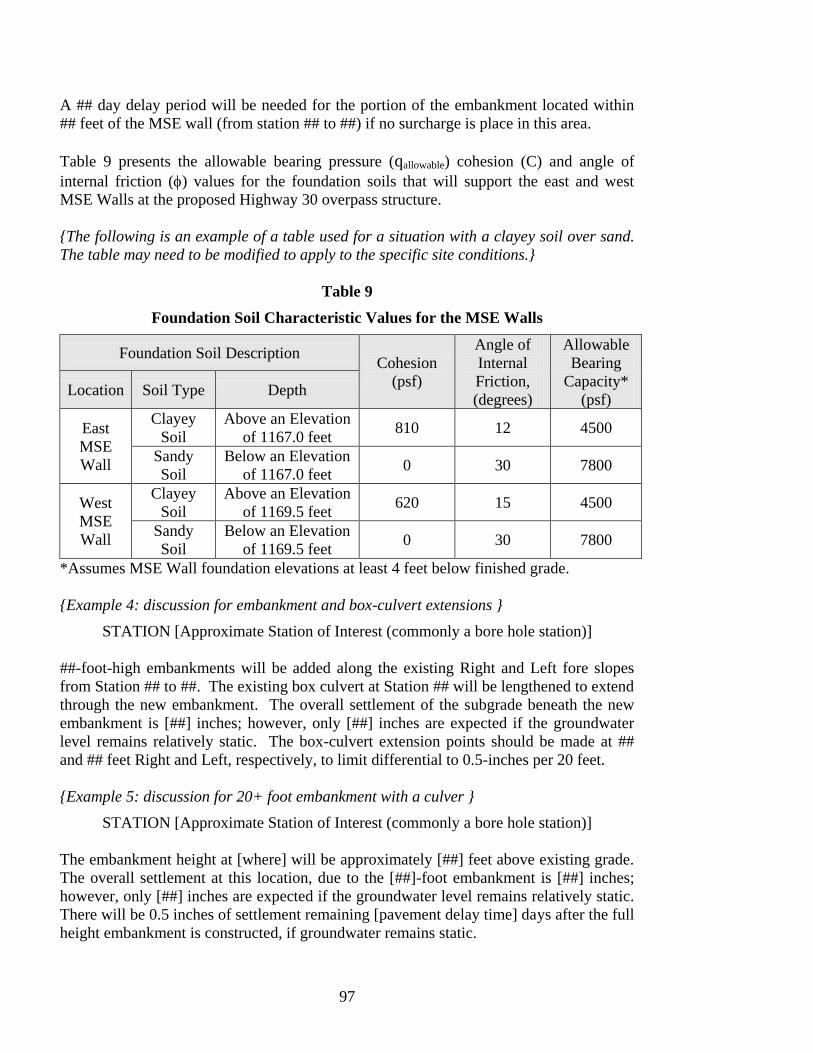
97
A ## day delay period will be needed for the portion of the embankment located within
## feet of the MSE wall (from station ## to ##) if no surcharge is place in this area.
Table 9 presents the allowable bearing pressure (qallowable) cohesion (C) and angle of
internal friction () values for the foundation soils that will support the east and west
MSE Walls at the proposed Highway 30 overpass structure.
{The following is an example of a table used for a situation with a clayey soil over sand.
The table may need to be modified to apply to the specific site conditions.}
Table 9
Foundation Soil Characteristic Values for the MSE Walls
Foundation Soil Description Cohesion
(psf)
Angle of
Internal
Friction,
(degrees)
Allowable
Bearing
Capacity*
(psf) Location Soil Type Depth
East
MSE
Wall
Clayey
Soil
Above an Elevation
of 1167.0 feet 810 12 4500
Sandy
Soil
Below an Elevation
of 1167.0 feet 0 30 7800
West
MSE
Wall
Clayey
Soil
Above an Elevation
of 1169.5 feet 620 15 4500
Sandy
Soil
Below an Elevation
of 1169.5 feet 0 30 7800
*Assumes MSE Wall foundation elevations at least 4 feet below finished grade.
{Example 4: discussion for embankment and box-culvert extensions }
STATION [Approximate Station of Interest (commonly a bore hole station)]
##-foot-high embankments will be added along the existing Right and Left fore slopes
from Station ## to ##. The existing box culvert at Station ## will be lengthened to extend
through the new embankment. The overall settlement of the subgrade beneath the new
embankment is [##] inches; however, only [##] inches are expected if the groundwater
level remains relatively static. The box-culvert extension points should be made at ##
and ## feet Right and Left, respectively, to limit differential to 0.5-inches per 20 feet.
{Example 5: discussion for 20+ foot embankment with a culver }
STATION [Approximate Station of Interest (commonly a bore hole station)]
The embankment height at [where] will be approximately [##] feet above existing grade.
The overall settlement at this location, due to the [##]-foot embankment is [##] inches;
however, only [##] inches are expected if the groundwater level remains relatively static.
There will be 0.5 inches of settlement remaining [pavement delay time] days after the full
height embankment is constructed, if groundwater remains static.
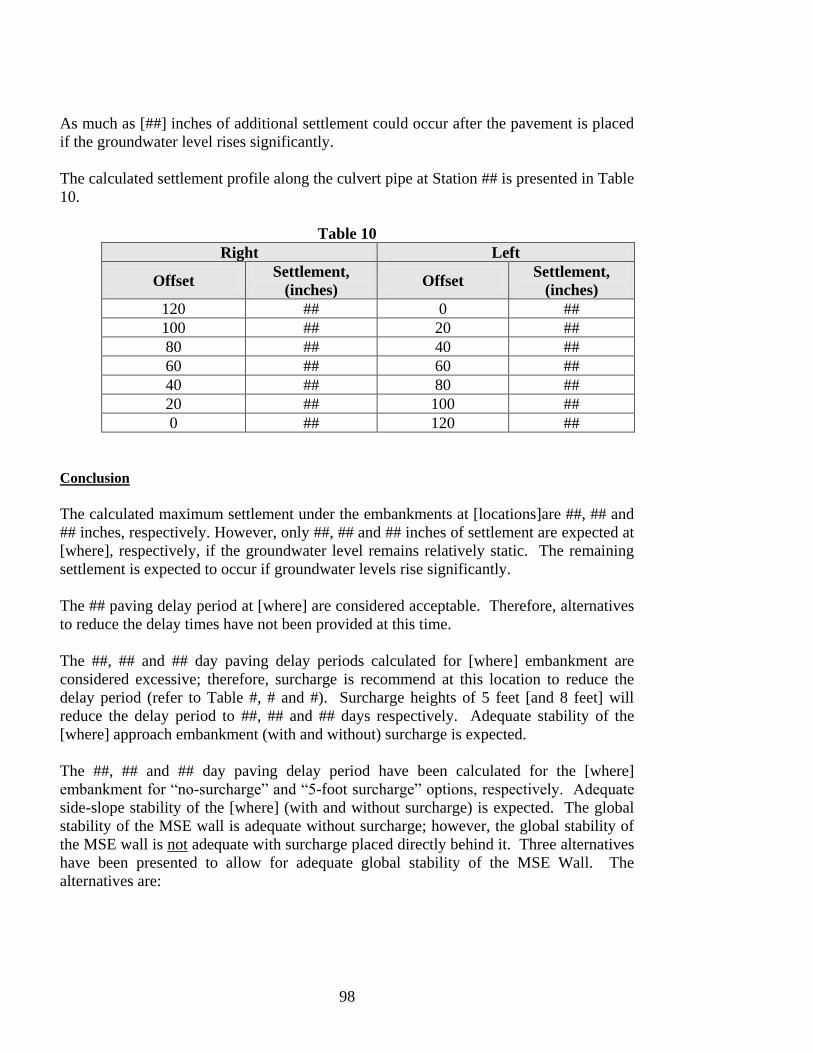
98
As much as [##] inches of additional settlement could occur after the pavement is placed
if the groundwater level rises significantly.
The calculated settlement profile along the culvert pipe at Station ## is presented in Table
10.
Table 10
Right Left
Offset Settlement,
(inches) Offset
Settlement,
(inches)
120 ## 0 ##
100 ## 20 ##
80 ## 40 ##
60 ## 60 ##
40 ## 80 ##
20 ## 100 ##
0 ## 120 ##
Conclusion
The calculated maximum settlement under the embankments at [locations]are ##, ## and
## inches, respectively. However, only ##, ## and ## inches of settlement are expected at
[where], respectively, if the groundwater level remains relatively static. The remaining
settlement is expected to occur if groundwater levels rise significantly.
The ## paving delay period at [where] are considered acceptable. Therefore, alternatives
to reduce the delay times have not been provided at this time.
The ##, ## and ## day paving delay periods calculated for [where] embankment are
considered excessive; therefore, surcharge is recommend at this location to reduce the
delay period (refer to Table #, # and #). Surcharge heights of 5 feet [and 8 feet] will
reduce the delay period to ##, ## and ## days respectively. Adequate stability of the
[where] approach embankment (with and without) surcharge is expected.
The ##, ## and ## day paving delay period have been calculated for the [where]
embankment for “no-surcharge” and “5-foot surcharge” options, respectively. Adequate
side-slope stability of the [where] (with and without surcharge) is expected. The global
stability of the MSE wall is adequate without surcharge; however, the global stability of
the MSE wall is not adequate with surcharge placed directly behind it. Three alternatives
have been presented to allow for adequate global stability of the MSE Wall. The
alternatives are:

99
1. Do not place surcharge within 100 feet of the North MSE Wall, and delay paving
in this portion for 150 days following the construction of the full height wall and
embankment.
2. Preload and surcharge the North MSE Wall area for 90 days to allow for
settlement. Then excavate the preloaded embankment area to construct the North
MSE Wall.
3. Provide a temporary toe berm in front of the North MSE Wall during the time
period when the 5-foot surcharge is in-place behind the wall.
Please contact the [Consultant] via the NDOR Geotechnical Section if you have questions
or comments about this transmittal, or if additional information is needed.
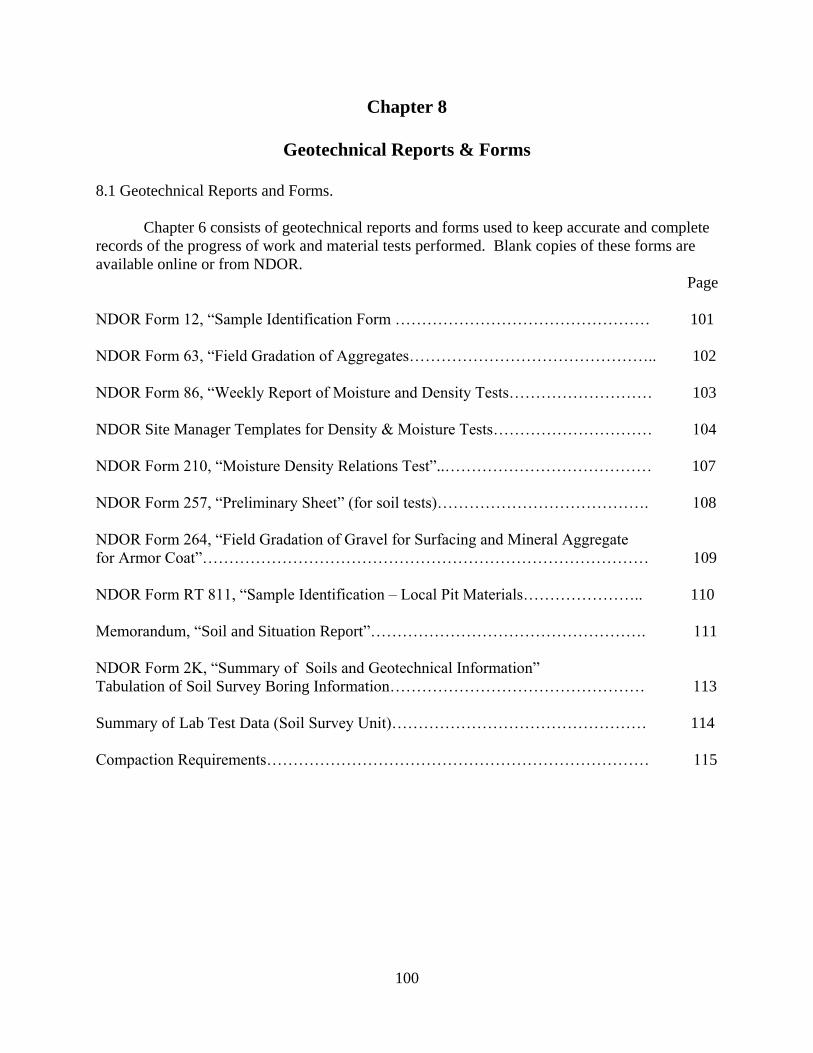
100
Chapter 8
Geotechnical Reports & Forms
8.1 Geotechnical Reports and Forms.
Chapter 6 consists of geotechnical reports and forms used to keep accurate and complete
records of the progress of work and material tests performed. Blank copies of these forms are
available online or from NDOR.
Page
NDOR Form 12, “Sample Identification Form ………………………………………… 101
NDOR Form 63, “Field Gradation of Aggregates……………………………………….. 102
NDOR Form 86, “Weekly Report of Moisture and Density Tests……………………… 103
NDOR Site Manager Templates for Density & Moisture Tests………………………… 104
NDOR Form 210, “Moisture Density Relations Test”..………………………………… 107
NDOR Form 257, “Preliminary Sheet” (for soil tests)…………………………………. 108
NDOR Form 264, “Field Gradation of Gravel for Surfacing and Mineral Aggregate
for Armor Coat”………………………………………………………………………… 109
NDOR Form RT 811, “Sample Identification – Local Pit Materials………………….. 110
Memorandum, “Soil and Situation Report”……………………………………………. 111
NDOR Form 2K, “Summary of Soils and Geotechnical Information”
Tabulation of Soil Survey Boring Information………………………………………… 113
Summary of Lab Test Data (Soil Survey Unit)………………………………………… 114
Compaction Requirements……………………………………………………………… 115
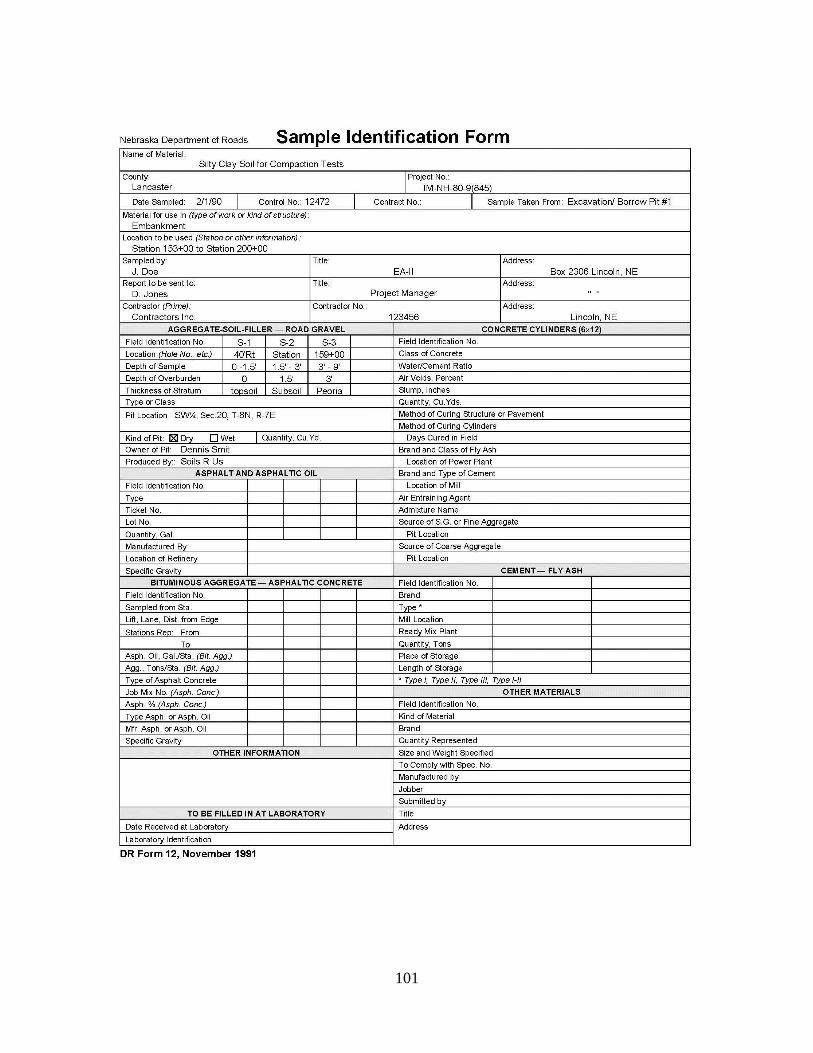
101

102

103

104

105

106
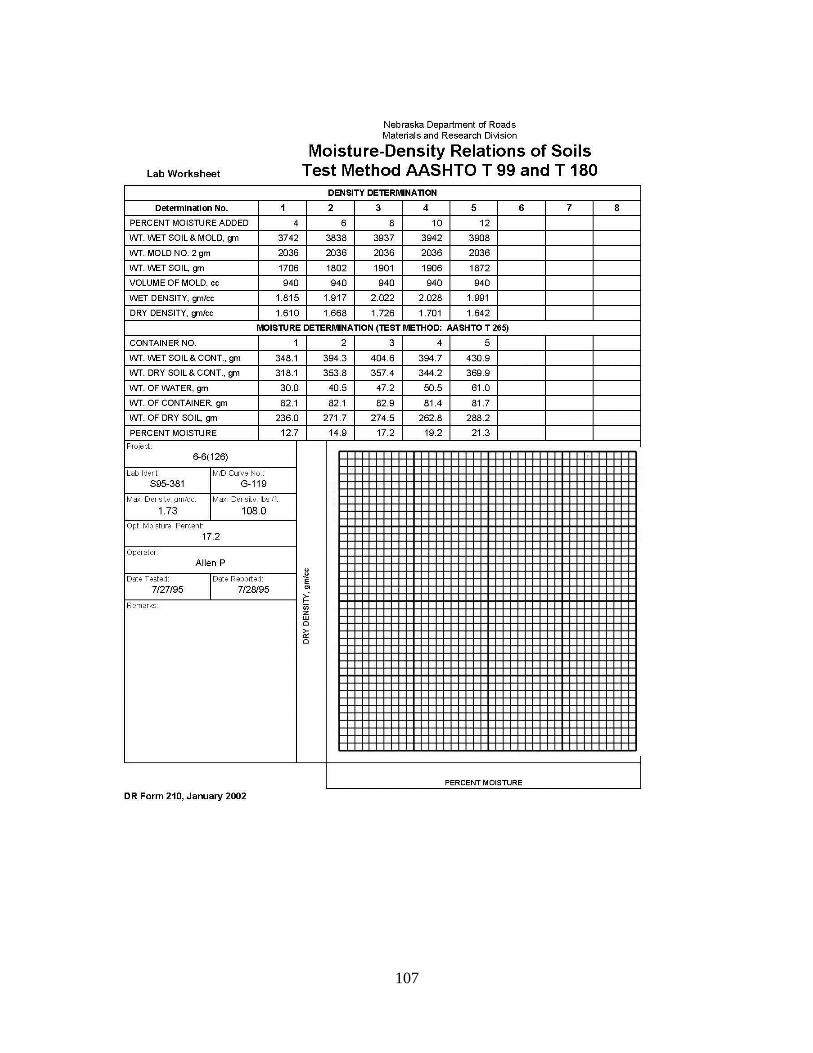
107

108

109
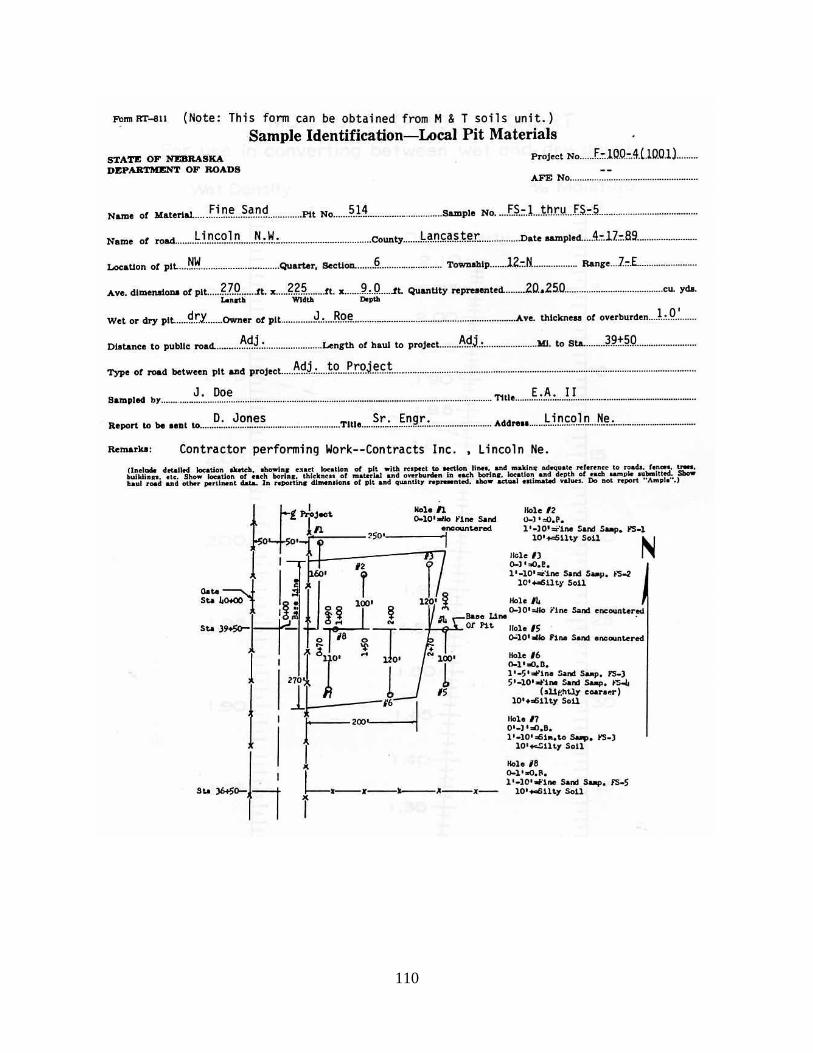
110
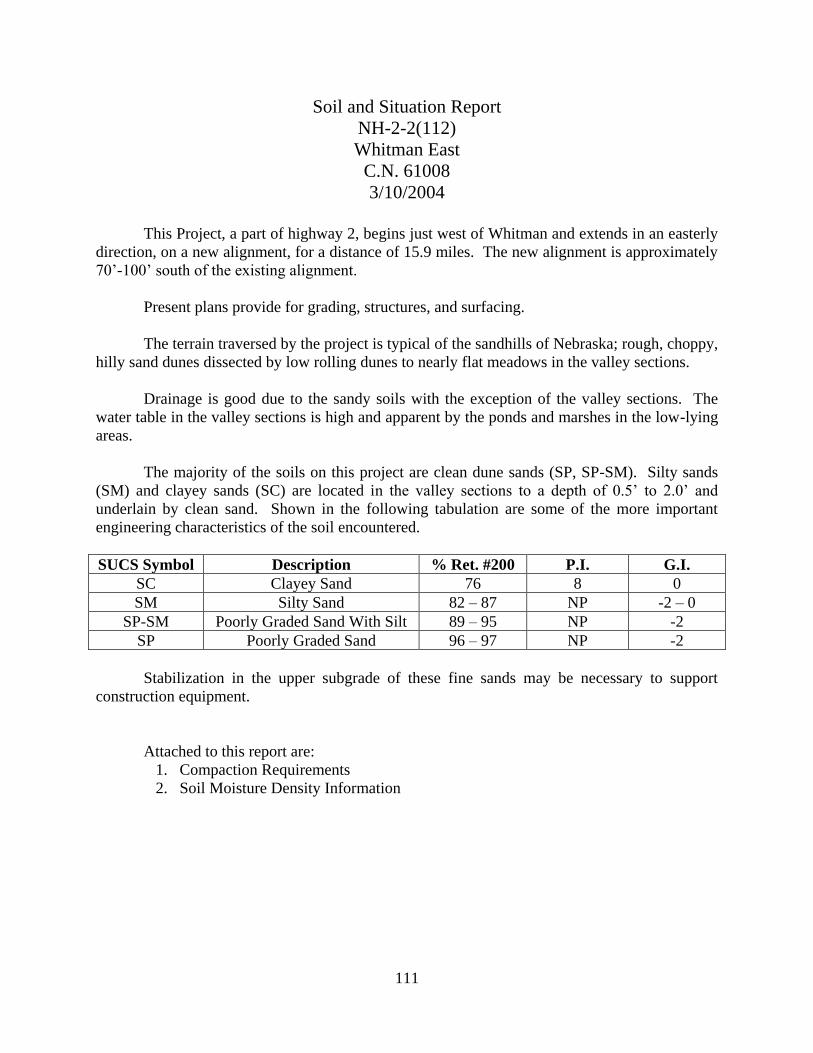
111
Soil and Situation Report
NH-2-2(112)
Whitman East
C.N. 61008
3/10/2004
This Project, a part of highway 2, begins just west of Whitman and extends in an easterly
direction, on a new alignment, for a distance of 15.9 miles. The new alignment is approximately
70’-100’ south of the existing alignment.
Present plans provide for grading, structures, and surfacing.
The terrain traversed by the project is typical of the sandhills of Nebraska; rough, choppy,
hilly sand dunes dissected by low rolling dunes to nearly flat meadows in the valley sections.
Drainage is good due to the sandy soils with the exception of the valley sections. The
water table in the valley sections is high and apparent by the ponds and marshes in the low-lying
areas.
The majority of the soils on this project are clean dune sands (SP, SP-SM). Silty sands
(SM) and clayey sands (SC) are located in the valley sections to a depth of 0.5’ to 2.0’ and
underlain by clean sand. Shown in the following tabulation are some of the more important
engineering characteristics of the soil encountered.
SUCS Symbol Description % Ret. #200 P.I. G.I.
SC Clayey Sand 76 8 0
SM Silty Sand 82 – 87 NP -2 – 0
SP-SM Poorly Graded Sand With Silt 89 – 95 NP -2
SP Poorly Graded Sand 96 – 97 NP -2
Stabilization in the upper subgrade of these fine sands may be necessary to support
construction equipment.
Attached to this report are:
1. Compaction Requirements
2. Soil Moisture Density Information

112
March 11, 2004
C.N. 61008
SOIL COMPACTION CURVES
Project No. NH-2-2(112)
Project Name Whitman East
In order to assist in the density control of the subgrade of embankment on this project; the
following soils data is shown for information on compaction samples taken previously on
this project or adjacent ones
Originally constructed as Project No. F-80(13)
Year constructed 1956
Curve
No.
USCS symbol &
Soil description
Location
Depth
% Retained P.I
.
G.I. Max.
Density
Opt.
Moisture #10 #50 #200
C-100 SP-SM Poorly graded sand w/ silt 0-4.0’ 0 2 90 NP -2 1.71 13.2
C-101 SP-SM Poorly graded sand w/ silt 0-12.0’ 0 7 94 NP -2 1.71 13.2
C-102 SP-SM Poorly graded sand w/ silt 0-12.0’ 0 4 92 NP -2 1.70 14.2
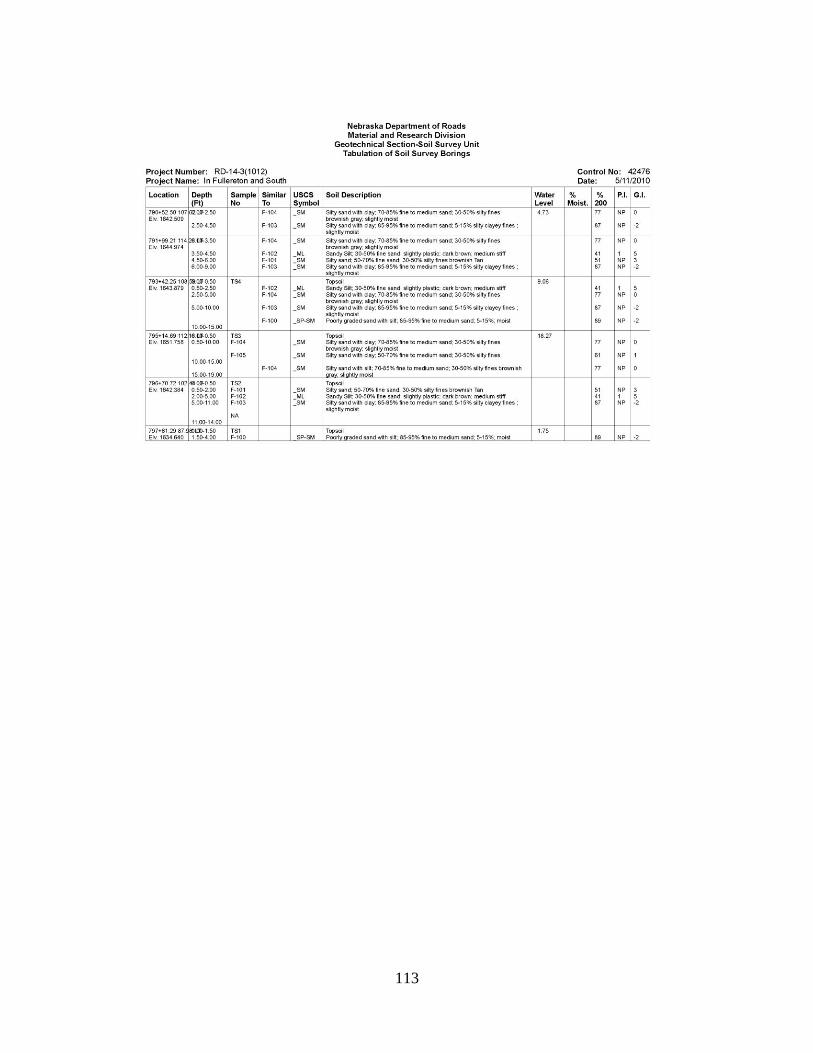
113

114
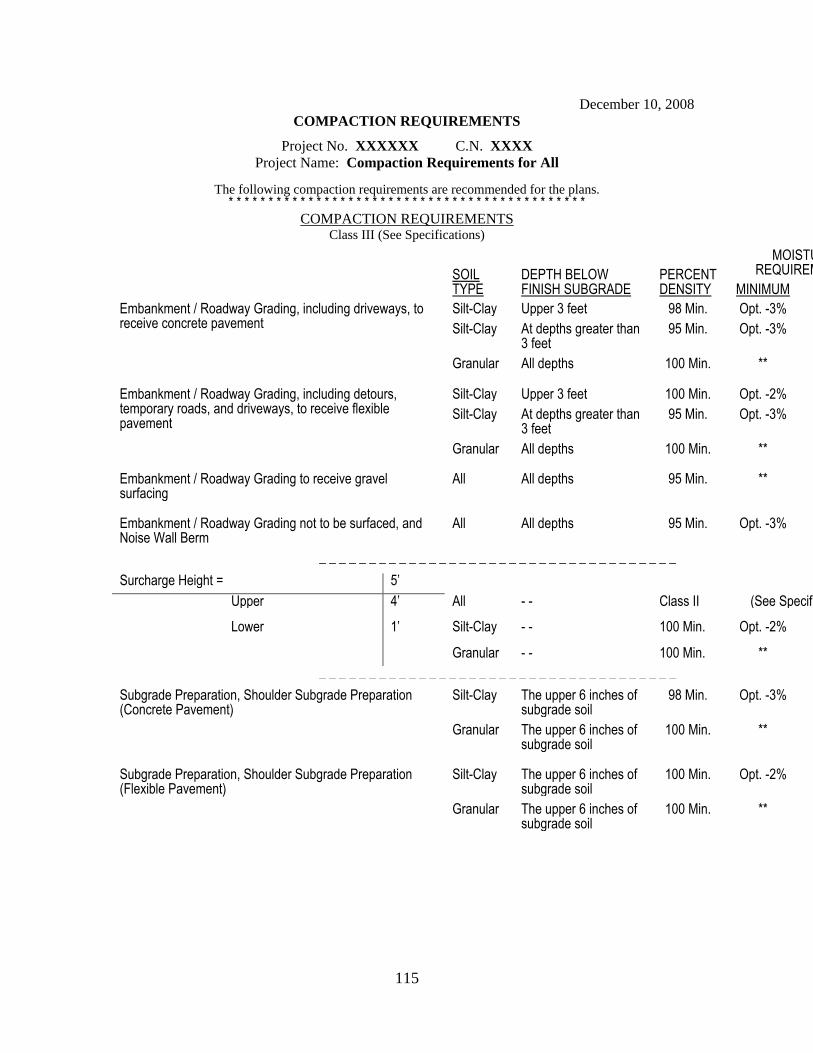
115
December 10, 2008
COMPACTION REQUIREMENTS
Project No. XXXXXX C.N. XXXX
Project Name: Compaction Requirements for All
The following compaction requirements are recommended for the plans. * * * * * * * * * * * * * * * * * * * * * * * * * * * * * * * * * * * * * * * * * * * * *
COMPACTION REQUIREMENTS Class III (See Specifications)
SOIL TYPE
DEPTH BELOW FINISH SUBGRADE
PERCENT DENSITY
MOISTURE REQUIREMENTS
MINIMUM MAXIMUM
Embankment / Roadway Grading, including driveways, to receive concrete pavement
Silt-Clay Upper 3 feet 98 Min. Opt. -3% Opt. +2%
Silt-Clay At depths greater than 3 feet
95 Min. Opt. -3% Opt. +2%
Granular All depths 100 Min. ** **
Embankment / Roadway Grading, including detours, temporary roads, and driveways, to receive flexible pavement
Silt-Clay Upper 3 feet 100 Min. Opt. -2% Opt. +1%
Silt-Clay At depths greater than 3 feet
95 Min. Opt. -3% Opt. +2%
Granular All depths 100 Min. ** **
Embankment / Roadway Grading to receive gravel surfacing
All All depths 95 Min. ** **
Embankment / Roadway Grading not to be surfaced, and Noise Wall Berm
All All depths 95 Min. Opt. -3% Opt. +2%
_ _ _ _ _ _ _ _ _ _ _ _ _ _ _ _ _ _ _ _ _ _ _ _ _ _ _ _ _ _ _ _ _ _ _ _ Surcharge Height = 5’
Upper 4’ All - - Class II (See Specifications)
Lower 1’ Silt-Clay - - 100 Min. Opt. -2% Opt. +1%
Granular - - 100 Min. ** **
_ _ _ _ _ _ _ _ _ _ _ _ _ _ _ _ _ _ _ _ _ _ _ _ _ _ _ _ _ _ _ _ _ _ _ _ Subgrade Preparation, Shoulder Subgrade Preparation (Concrete Pavement)
Silt-Clay The upper 6 inches of subgrade soil
98 Min. Opt. -3% Opt. +2%
Granular
The upper 6 inches of subgrade soil
100 Min. ** **
Subgrade Preparation, Shoulder Subgrade Preparation (Flexible Pavement)
Silt-Clay
The upper 6 inches of subgrade soil
100 Min. Opt. -2% Opt. +1%
Granular The upper 6 inches of subgrade soil
100 Min. ** **
116
References
AASHTO LRFD Bridge Design Specifications, American Association of State Highway
and Transportation Officials, 2010.
Abramson, L., G. Boyce, T. Lee, and S. Sharma (1994), Advanced Technology for Soil
Slope Stability, Volume 1, Slope Stability Manual, FHWA-SA-94-005.
American Society for Testing and Materials (2001), Annual Book of ASTM Standards
Soil and Rock, Volumes 4.08 and 4.09.
American Association of State Highway and Transportation Officials (1998), Manual on
Subsurface Investigations, Washington, D.C.
Arman, A., N. Samtani, R. Castelli and G. Munfakh (1997), Geotechnical and Foundation
Engineering, Module 1 – Subsurface Investigations, FHWA-HI-97-021.
Berg, R.R. (1992), Guidelines for Design, Specification and Contracting of Geosynthetic
Mechanically Stabilized Earth Slopes on Firm Foundations, FHWA-SA-93-025.
Bowders, J.J., H. B. Scranton, and G. P. Broderick., Editors (1998), Geosynthetics in
Foundation Reinforcement and Erosion Control Systems, ASCE Special Publication No.
76, Boston, MA.
Bowles, J.E., (1996), Foundation Analysis and Design, Fifth Edition, New York:
McGraw-Hill Companies.
Braja, M., (2007), Principles of Foundation Engineering, Sixth Edition, Thompson.
Briaud, J.L. (1989) The Pressuremeter Test for Highway Applications, FHWA-IP-89-
008.
Brown, D., Turner, J., and Castelli, R., Drilled Shafts: Construction Procedures and
LRFD Design Methods, (2010), - FHWA-NHI-10-016, FHWA GEC10.
Chamberlain, E.J. (1982), Frost Susceptibility of Soil: Review of Index Tests, FHWA-
RD-82-081.
Cheney, R.S. (2001) Soils and Foundations Participant Workbook, FHWA-NHI-01-015.
Cheney, R.S. and R.B. Chassie (2000) Soils and Foundations Workshop Reference
Manual, FHWA-NHI-00-045.
Christopher, B.R., S.A. Gill, J.P. Giroud, I. Juran, J.K. Mitchell, F. Schlosser and J.
Dunnicliff (1990a) Reinforced Soil Structures, Volume I: Design and Construction
Guidelines, FHWA-RD-89-043.

117
Christopher, B.R., S.A. Gill, J.P. Giroud, I. Juran, J.K. Mitchell, F. Schlosser and J.
Dunnicliff (1990b) Reinforced Soil Structures, Volume II: Summary of Research and
System Information, FHWA-RD-89-044.
Christopher, B.R. and R.D. Holtz (1989), Geotextile Design and Construction Guidelines,
FHWA-HH-90-001.
Corps of Engineers, U.S. Army (1995) Geophysical Exploration for Engineering and
Environmental Investigations, Engineering Manual 1110-1-1802, Department of the
Army.
Davis, T. (2001), Geotechnical Testing, Observation and Documentation, ASCE Press,
Reston, VA.
Department of the Navy, Naval Facilities Engineering Command (1986), Foundations
and Earth Structures – NAVFAC DM-7.2
Dimillio, A.F. (1982), Performance of Highway Bridge Abutments on Spread Footings,
FHWA-RD-81-184.
Dunnicliff, J. (1998) Geotechnical Instrumentation, FHWA-HI-98-034.
Elias, V. , B.R. Christopher, Berg, R.R., (2000), Mechanically Stabilized Earth Walls
and Reinforced Soil Slopes, Design and Construction Guidelines, FHW-NHI-00-043.
Forrester, Kevin (2001), Subsurface Drainage for Slope Stabilization, ASCE
Publications, Reston, VA.
Florida Department of Transportation (2000), Soils and Foundations Handbook, State
Materials Office, Gainesville, FL. Available online at
http://www11.myflorida.com/structures/ Manuals/sfh2000.pdf.
Hannigan, P.J., G.G. Goble, G. Thendean, G.E. Likins and F. Rausche (1997), Design
and Construction of Driven Pile Foundations, FHWA-HI-97-013, Volumes I and II.
Holtz, R.D., B.R. Christopher, and R.R. Berg (1995), Geosynthetic Design and
Construction Guidelines, FHWA-HI-95-038.
Illinois Department of Transportation (1999), Geotechnical Manual, Bureau of Materials
and Physical Research, Springfield, IL.
Lazarte, C., Elias, V., Espinoza, D., Sabatini, P., (2003), Soil Nail Walls, FHWA –
GEC7, FHWA-IF-03-017.
118
Lukas, R.G. (1995), Dynamic Compaction, Geotechnical Circular No. 1, FHWA-SA-95-
037.
McCarthy, David F. (1993), Essentials of Soil Mechanics and Foundations, (4th
ed.),
Prentice Hall Career and Technology, Englewood Cliffs, NJ.
Moulton, L.K. and Principal Engineer (1980), Highway Subgrade Drainage, FHWA-TS-
80-224.
Nebraska Department of Roads (1990), Earthwork Engineering Guide, Materials and
Tests Division, Lincoln, NE.
Nebraska Department of Roads (2002), Construction Manual, Supplemental
Specifications for Highway Construction, Supplemental and Standard Specifications for
Highway Construction, all available online at http://doroads.nol.org/ref-man/.
Portland Cement Association (1992), PCA Soil Primer, 40p.
Riaund, J.L. and J. Miran (1992), The Cone Penetrometer Test, FHWA-SA-91-043.
Riaund, J.L. and J. Miran (1992), The Flat Diltometer Test, FHWA-SA-91-044.
Rixner, J.J., S.R. Kramer and A.D. Smith (1986), Prefabricated Vertical Drains, Volume I
– Engineering Guidelines, FHWA-RD-86-168.
Sabatini, P.J., V. Elias, G.R. Schmertmann, and R. Bonparte (1997), Earth Retaining
Systems, Geotechnical Engineering Circular No. 2, FHWA-SA-96-038.
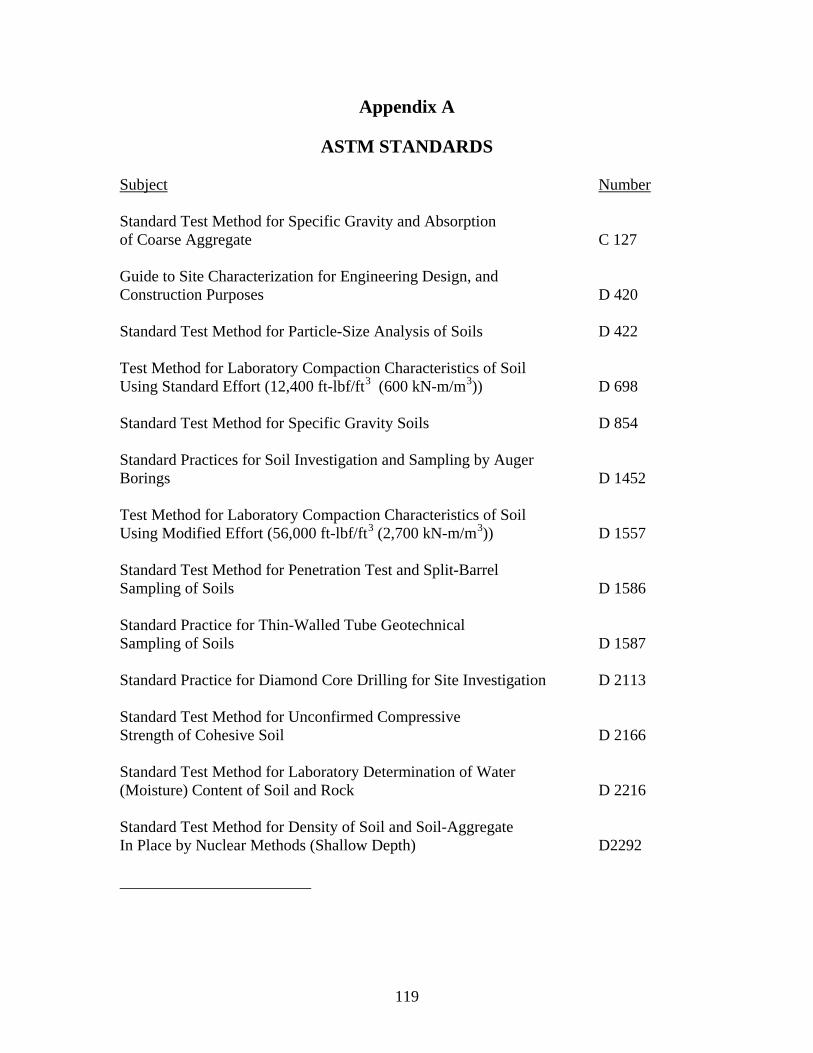
119
Appendix A
ASTM STANDARDS
Subject Number Standard Test Method for Specific Gravity and Absorption of Coarse Aggregate C 127 Guide to Site Characterization for Engineering Design, and Construction Purposes D 420 Standard Test Method for Particle-Size Analysis of Soils D 422 Test Method for Laboratory Compaction Characteristics of Soil Using Standard Effort (12,400 ft-lbf/ft3 (600 kN-m/m3)) D 698 Standard Test Method for Specific Gravity Soils D 854 Standard Practices for Soil Investigation and Sampling by Auger Borings D 1452 Test Method for Laboratory Compaction Characteristics of Soil Using Modified Effort (56,000 ft-lbf/ft3 (2,700 kN-m/m3)) D 1557 Standard Test Method for Penetration Test and Split-Barrel Sampling of Soils D 1586 Standard Practice for Thin-Walled Tube Geotechnical Sampling of Soils D 1587 Standard Practice for Diamond Core Drilling for Site Investigation D 2113 Standard Test Method for Unconfirmed Compressive Strength of Cohesive Soil D 2166 Standard Test Method for Laboratory Determination of Water (Moisture) Content of Soil and Rock D 2216 Standard Test Method for Density of Soil and Soil-Aggregate In Place by Nuclear Methods (Shallow Depth) D2292
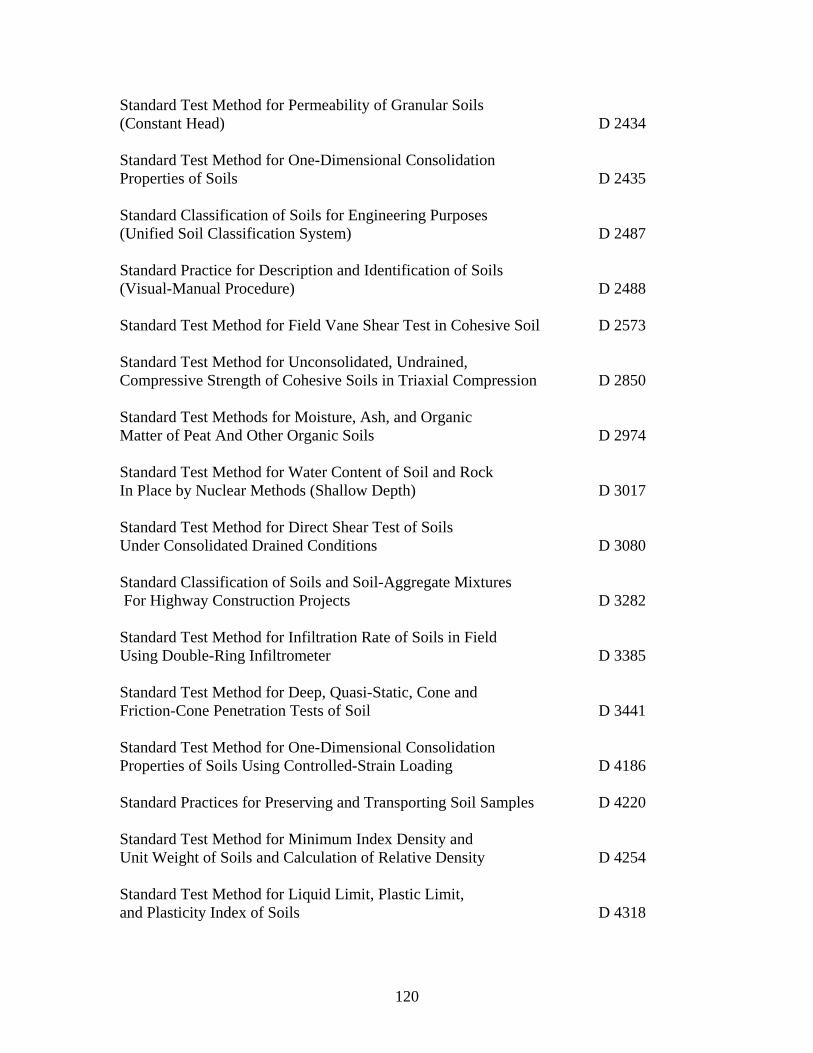
120
Standard Test Method for Permeability of Granular Soils (Constant Head) D 2434 Standard Test Method for One-Dimensional Consolidation Properties of Soils D 2435 Standard Classification of Soils for Engineering Purposes (Unified Soil Classification System) D 2487 Standard Practice for Description and Identification of Soils (Visual-Manual Procedure) D 2488 Standard Test Method for Field Vane Shear Test in Cohesive Soil D 2573 Standard Test Method for Unconsolidated, Undrained, Compressive Strength of Cohesive Soils in Triaxial Compression D 2850 Standard Test Methods for Moisture, Ash, and Organic Matter of Peat And Other Organic Soils D 2974 Standard Test Method for Water Content of Soil and Rock In Place by Nuclear Methods (Shallow Depth) D 3017 Standard Test Method for Direct Shear Test of Soils Under Consolidated Drained Conditions D 3080 Standard Classification of Soils and Soil-Aggregate Mixtures For Highway Construction Projects D 3282 Standard Test Method for Infiltration Rate of Soils in Field Using Double-Ring Infiltrometer D 3385 Standard Test Method for Deep, Quasi-Static, Cone and Friction-Cone Penetration Tests of Soil D 3441 Standard Test Method for One-Dimensional Consolidation Properties of Soils Using Controlled-Strain Loading D 4186 Standard Practices for Preserving and Transporting Soil Samples D 4220 Standard Test Method for Minimum Index Density and Unit Weight of Soils and Calculation of Relative Density D 4254 Standard Test Method for Liquid Limit, Plastic Limit, and Plasticity Index of Soils D 4318
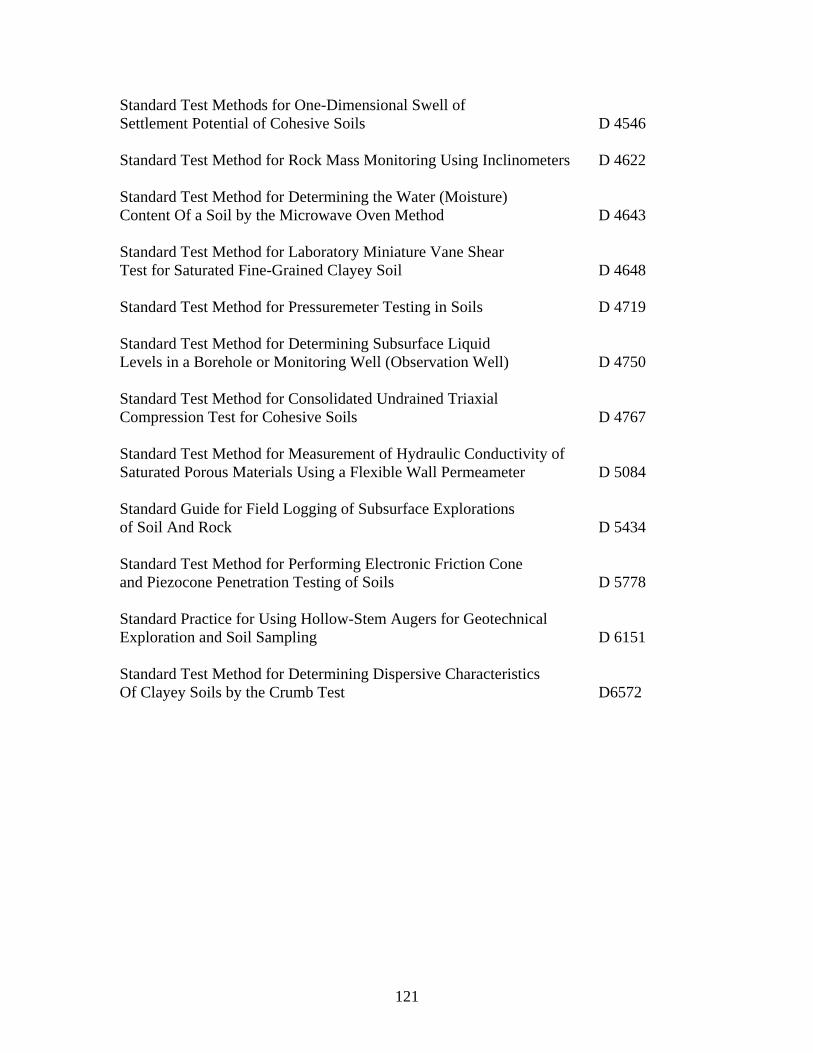
121
Standard Test Methods for One-Dimensional Swell of Settlement Potential of Cohesive Soils D 4546 Standard Test Method for Rock Mass Monitoring Using Inclinometers D 4622 Standard Test Method for Determining the Water (Moisture) Content Of a Soil by the Microwave Oven Method D 4643 Standard Test Method for Laboratory Miniature Vane Shear Test for Saturated Fine-Grained Clayey Soil D 4648 Standard Test Method for Pressuremeter Testing in Soils D 4719 Standard Test Method for Determining Subsurface Liquid Levels in a Borehole or Monitoring Well (Observation Well) D 4750 Standard Test Method for Consolidated Undrained Triaxial Compression Test for Cohesive Soils D 4767 Standard Test Method for Measurement of Hydraulic Conductivity of Saturated Porous Materials Using a Flexible Wall Permeameter D 5084 Standard Guide for Field Logging of Subsurface Explorations of Soil And Rock D 5434 Standard Test Method for Performing Electronic Friction Cone and Piezocone Penetration Testing of Soils D 5778 Standard Practice for Using Hollow-Stem Augers for Geotechnical Exploration and Soil Sampling D 6151 Standard Test Method for Determining Dispersive Characteristics Of Clayey Soils by the Crumb Test D6572
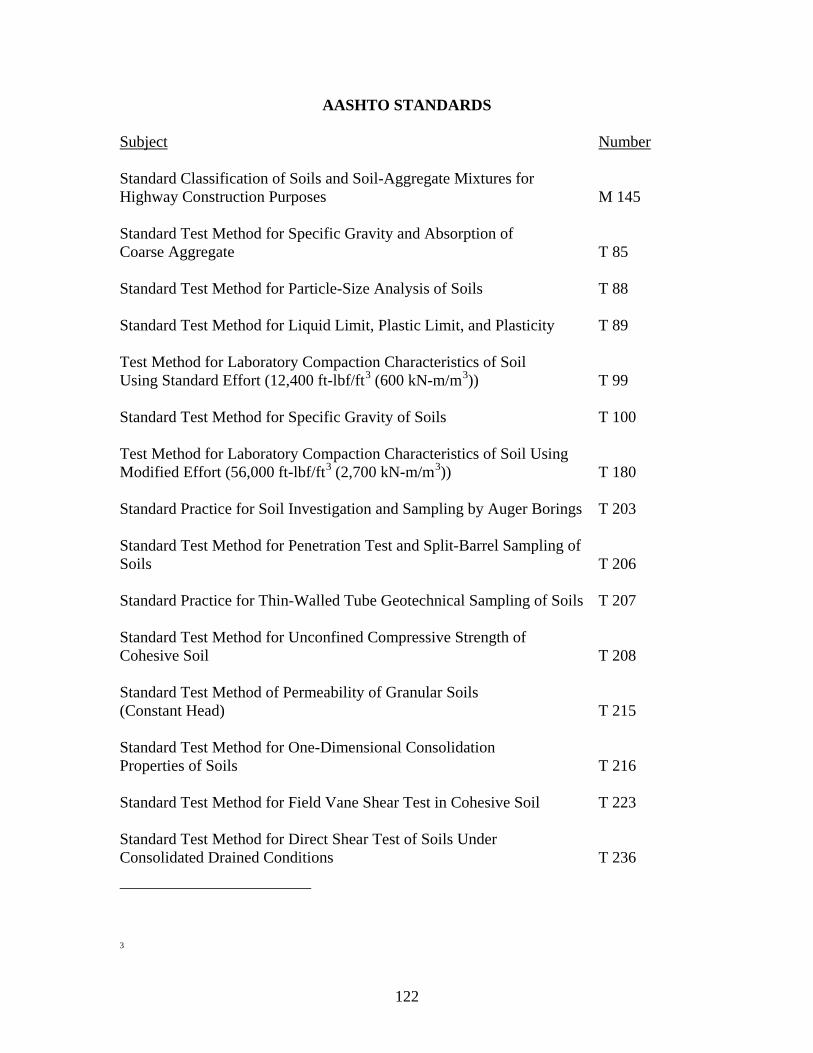
122
AASHTO STANDARDS
Subject Number Standard Classification of Soils and Soil-Aggregate Mixtures for Highway Construction Purposes M 145 Standard Test Method for Specific Gravity and Absorption of Coarse Aggregate T 85 Standard Test Method for Particle-Size Analysis of Soils T 88 Standard Test Method for Liquid Limit, Plastic Limit, and Plasticity T 89 Test Method for Laboratory Compaction Characteristics of Soil Using Standard Effort (12,400 ft-lbf/ft3 (600 kN-m/m3)) T 99 Standard Test Method for Specific Gravity of Soils T 100 Test Method for Laboratory Compaction Characteristics of Soil Using Modified Effort (56,000 ft-lbf/ft3 (2,700 kN-m/m3)) T 180 Standard Practice for Soil Investigation and Sampling by Auger Borings T 203 Standard Test Method for Penetration Test and Split-Barrel Sampling of Soils T 206 Standard Practice for Thin-Walled Tube Geotechnical Sampling of Soils T 207 Standard Test Method for Unconfined Compressive Strength of Cohesive Soil T 208 Standard Test Method of Permeability of Granular Soils (Constant Head) T 215 Standard Test Method for One-Dimensional Consolidation Properties of Soils T 216 Standard Test Method for Field Vane Shear Test in Cohesive Soil T 223 Standard Test Method for Direct Shear Test of Soils Under Consolidated Drained Conditions T 236
3
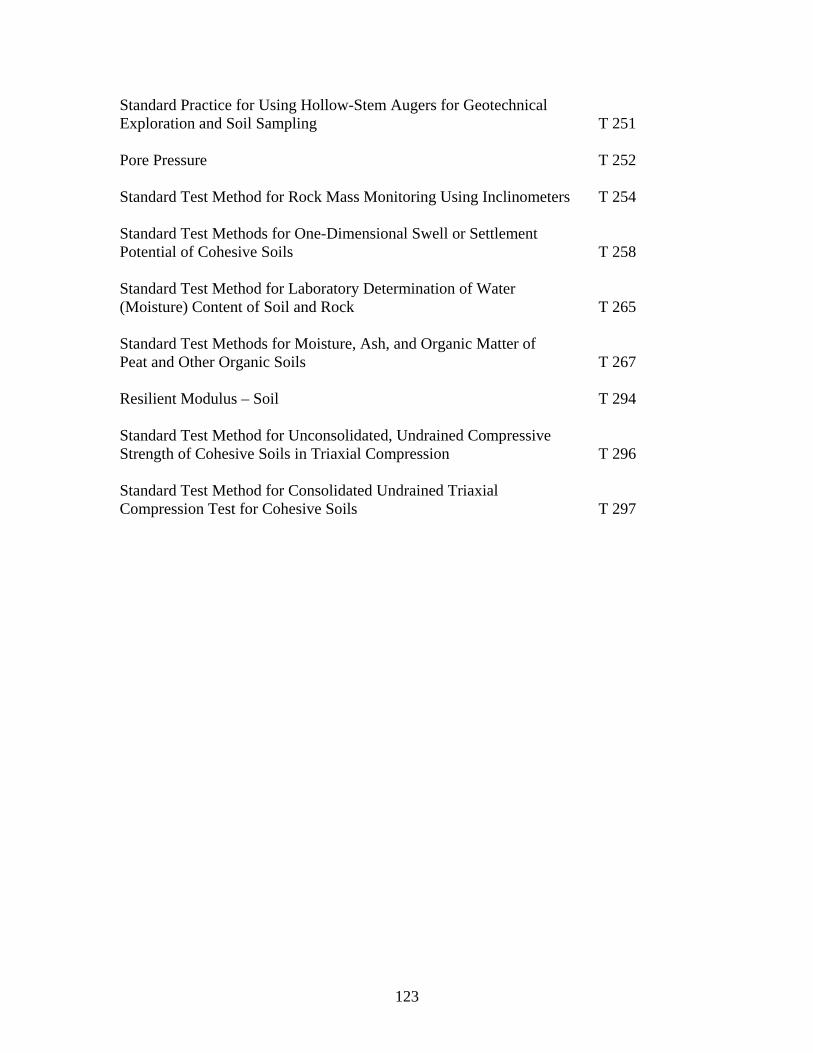
123
Standard Practice for Using Hollow-Stem Augers for Geotechnical Exploration and Soil Sampling T 251 Pore Pressure T 252 Standard Test Method for Rock Mass Monitoring Using Inclinometers T 254 Standard Test Methods for One-Dimensional Swell or Settlement Potential of Cohesive Soils T 258 Standard Test Method for Laboratory Determination of Water (Moisture) Content of Soil and Rock T 265 Standard Test Methods for Moisture, Ash, and Organic Matter of Peat and Other Organic Soils T 267 Resilient Modulus – Soil T 294 Standard Test Method for Unconsolidated, Undrained Compressive Strength of Cohesive Soils in Triaxial Compression T 296 Standard Test Method for Consolidated Undrained Triaxial Compression Test for Cohesive Soils T 297
124
Appendix B
SOIL AND SITUATION REPORT
The Soil and Situation Report (SSR) has two primary objectives. The first is to report
soil, situation and water table data, while the second is to transmit recommendations from
the Materials and Tests Division to the Design and Construction Divisions. The SSR
usually consists of four parts, the test or body of the report, a tabulation of soil properties
and subgrade borings, tabulations of test results and a diagram or diagrams illustrating the
soil profile.
The text of the SSR begins with a statement regarding project location and length,
followed by a description of the proposed construction. The next paragraph commonly
discusses topography, drainage characteristics and location of the water table.
Information concerning soil formations and geology of the project area follows. The soil
horizons and soil formations encountered in the project area are discussed in detail. A
general description of the soils encountered and a tabulation of some of the more
important engineering properties of the soil in each horizon are included. A table
concerning recommendations for compaction requirements is normally included either in
this section or attached as an enclosure.
If selective handling of excavated materials is recommended, requirements are discussed
in detail. Selective handling of excavated material is currently limited to five general
cases:
1) To produce embankment sections of uniform material (i.e. all silt-clay or sandy
materials in an embankment).
2) To place materials suitable for use in a Bituminous Sand Base Course in the
upper subgrade.
3) To place unsuitable materials at depth or in the outer slopes of an embankment.
4) To place select materials over heavy clays to reduce moisture problems.
5) To use select granular materials in lieu of a foundation course on projects when
PCC pavement is the planned surface course.
Selective handling notes are based upon and should always specify the planned project
surface.
Larger projects are often divided into cut and fill sections, according to soil types or
volumes of material available for cut and fill operations. A discussion is usually included
indicating the approximate volume of and properties of soil to be excavated or placed
within each section. A single set of recommendations sufficient for the entire project is
used whenever possible.
On some projects, soil may be mostly granular on one part of the project while in another
part of the same project it is mostly cohesive. The soil report will require granular
material in upper embankments through the granular areas, and may or may not require
undercutting of cohesive soils to a specified depth and backfilling with granular materials

125
when cohesive soils are encountered. To produce a uniform embankment, granular
materials encountered as layers in predominantly cohesive soils are usually buried or
placed near the outer edge of the embankment.
126
Appendix C
SUBGRADE SURVEY/SUBGRADE AND SITUATION REPORT
A subgrade survey is conducted on previously graded roads for which rigid or flexible
pavement is being designed. It principle objectives are:
1) To sectionalize the project as to the type of soil in the upper subgrade.
2) To locate and explore any portions of the project where the subgrade may be of
questionable stability due to seepage, springs, wet zones, etc.
3) To evaluate gravel windrow or crust which may have been placed or developed
through the use of the project during temporary gravel or clay surfacing.
4) To obtain a check on the conditions resulting from the selective placement
required by the grading plans.
In making a subgrade survey, holes are drilled to depths of 5 feet (1.5 m) or more into the
subgrade. As in a soil survey, samples are not obtained from every borehole. The party
chief is responsible for deciding when soil properties have changed sufficiently to require
taking another sample. As the survey progresses along a project, locations of soil
changes in the subgrade soil are noted and recorded.
Depth to water table should be determined and recorded if the water table is within nine
feet (3 m) of the surface. “Frost boils” frequently develop on Nebraska highways in
situations where the upper subgrade soil is underlain by a less permeable material at
depths of five feet (1.5 m) or less. Springs, visible seepage water and high water tables
often occur in these locations. All potential “frost boil” areas should be explored fully
and carefully by borings during a subgrade survey. Recommendations for special
underdrain systems, selective handling of subgrade soils, and/or extra strength pavement
are commonly required at these locations.
In some locations, road gravel has been placed on the surface as the primary wearing
course. Gravel surfaced roads may form a gravel crust from the rolling action of traffic
combined with periodic mixing by maintenance equipment. The gravel or rock surface
course should be mixed with and embedded into the upper layer of subgrade prior to
placing rigid or flexible pavement as a surface course.
A “Subgrade and Situation Report” (report of a subgrade survey) is prepared when there
is a significant period of time between grading and preparation of the paving plans. When
grading and paving are let by the same contract, the design of the base and surface course
is based upon information obtained during the soil survey.

127
A Subgrade and Situation Report is usually brief and contains the following entries as
applicable:
1) Location.
2) Proposed construction.
3) Existing surface.
a) Year the project was last graded.
b) Width to which the project was graded.
c) Amount of grade that was left low.
4) Foundation course requirements (on PCC projects).
5) Topography
6) Pedology
7) Surface and subsurface drainage.
8) Water table (depths of water and dates borings made).
9) Compactions recommendations.
10) Statement of Attachments (Tabulations of tests, borings, etc.)
11) Notes for clay surfacing removal, if necessary.
12) Subgrade distress areas, including visible and potential areas and those
reported by maintenance.
13) Embankment and slope stability areas.
14) Summary of subgrade soils by section.
128
Appendix D
NEBRASKA SOIL FORMATIONS
This section is intended to aid soil surveyors and grade inspectors in identifying various soil
formations exposed in various parts of Nebraska.
Undisturbed soil has a zonal arrangement of near horizontal layers lying one over the other.
These layers are collectively called the soil profile. In its simplest form, a soil profile is made up
of three distinct layers, topsoil, subsoil, and parent material.
Topsoil is usually dark in color and extends from the surface of the ground to a depth of two feet
or greater. Its exact nature will vary with the parent material from which it is developed, but it
will usually be characterized by its relatively low clay content when compared to the underlying
subsoil. The low clay content of topsoil is due to the action of percolating water removing or
leaching the fine clay and soluble materials from the top layer.
Subsoil can vary in thickness from a few inches to as much as three feet or more. It is
characterized by the presence of the additional clay and soluble material, which has been
removed by leaching from the topsoil. The subsoil may vary in nature from light clay content
when compared to topsoil to a tough and impervious claypan layer. In most soil profiles found
in Nebraska, the subsoil contains more clay than the layer above it or below it.
The topsoil and subsoil taken together are known as the solum, or zone of weathered material.
Below the solum, lies the parent material or the geologic formation from which the solum is
developing. The parent material is, in turn, underlain by other geologic formations. The various
geologic formations are usually different enough from each other that the change is readily
recognized when boring or examining open excavations.
Natural processes form soil formations. The nature of the soil profile will vary depending upon
the type of parent material, climate, topography, and vegetation in an area, and the length of time
during which soil forming processes have been at work. A soil profile sketch (Figure D-1)
shows the variation in soil development due to topography. Development of a soil profile
depends on the action of percolating water to leach the topsoil and redeposit the leached material
in the subsoil. On relatively flat areas where surface runoff is slight, more of the rainfall
becomes ground water. On slopes, a large percentage of the water runs off. Consequently,
topsoil and subsoil will usually be thicker on flat areas than on the slopes. If slopes are
sufficiently steep to carry away the surface water fast enough to cause erosion, the topsoil and
subsoil may be removed as fast as they are formed, resulting in parent material exposed at the
soil surface.
In some instances, soil will be eroded from the slopes and redeposited along terraces and on
stream bottoms in layers many feet thick. As these deposits are of recent origin and material is
constantly being added, a soil of considerable thickness may be deposited in which no zonal
arrangement or profile can be discerned. Such materials are commonly encountered in stream
channels and are referred to as alluvial or colluvial deposits.
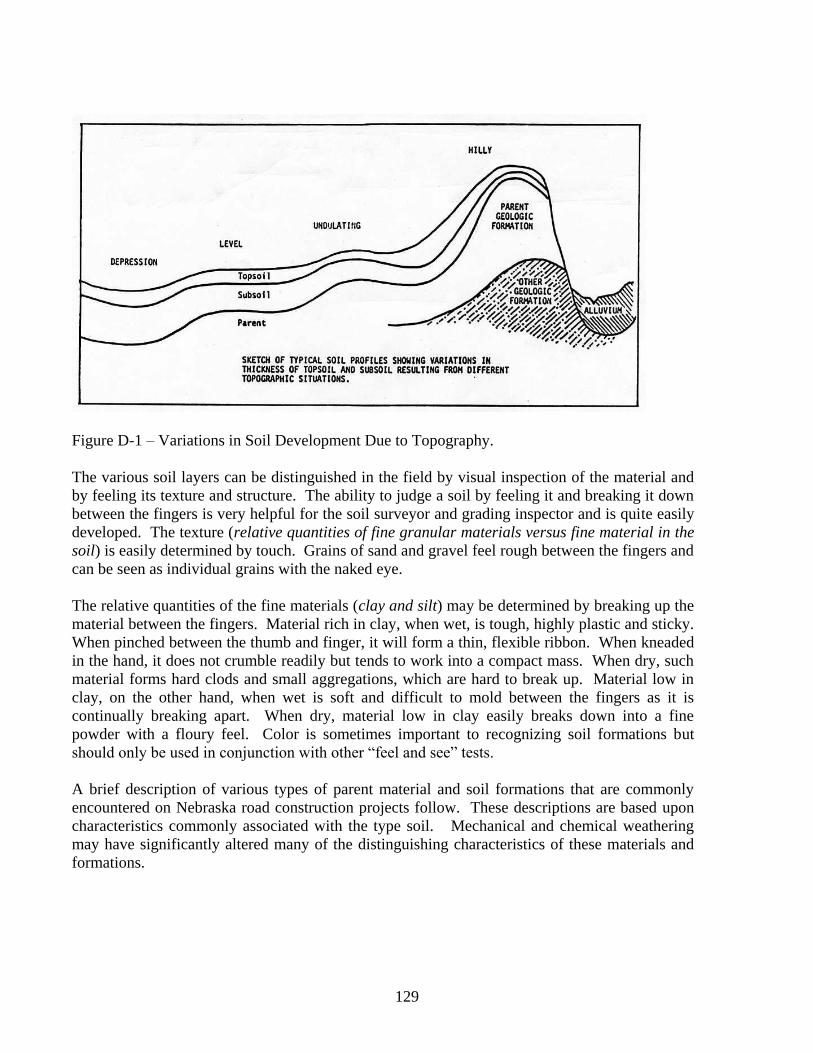
129
Figure D-1 – Variations in Soil Development Due to Topography.
The various soil layers can be distinguished in the field by visual inspection of the material and
by feeling its texture and structure. The ability to judge a soil by feeling it and breaking it down
between the fingers is very helpful for the soil surveyor and grading inspector and is quite easily
developed. The texture (relative quantities of fine granular materials versus fine material in the
soil) is easily determined by touch. Grains of sand and gravel feel rough between the fingers and
can be seen as individual grains with the naked eye.
The relative quantities of the fine materials (clay and silt) may be determined by breaking up the
material between the fingers. Material rich in clay, when wet, is tough, highly plastic and sticky.
When pinched between the thumb and finger, it will form a thin, flexible ribbon. When kneaded
in the hand, it does not crumble readily but tends to work into a compact mass. When dry, such
material forms hard clods and small aggregations, which are hard to break up. Material low in
clay, on the other hand, when wet is soft and difficult to mold between the fingers as it is
continually breaking apart. When dry, material low in clay easily breaks down into a fine
powder with a floury feel. Color is sometimes important to recognizing soil formations but
should only be used in conjunction with other “feel and see” tests.
A brief description of various types of parent material and soil formations that are commonly
encountered on Nebraska road construction projects follow. These descriptions are based upon
characteristics commonly associated with the type soil. Mechanical and chemical weathering
may have significantly altered many of the distinguishing characteristics of these materials and
formations.
130
Soil Formations of Recent Age
ALLUVIUM: Water deposited material in stream floodplains. Zones of development may
be missing. Local variations in texture are denoted by Oa for Sand, Ob for Silt, and
Oc for Clay.
TOPSOIL: Surface soil that supports vegetation. Topsoil is usually composed of sand, silt,
and clay and is dark colored.
BURIED TOPSOIL: Remains of one-time surface soil buried beneath later deposits.
REDEPOSITED TOPSOIL: Topsoil accumulated on terraces or bottomlands as colluvium, then
washed down by sheet erosion from adjacent uplands.
SUBSOIL: Soil formation layer resulting from the infiltration and accumulation of fines leached
from the overlying topsoil.
CLAYPAN: Subsurface condition characterized by the development of a dense impervious clay
layer.
BURIED SUBSOIL: Clay subsoil formed during a previous geologic age and now buried under
later deposits.
REDEPOSITED SUBSOIL: Subsoil that has been eroded from its original position and
redeposited at a lower elevation.
Formations of Pleistocene Age
PEORIAN LOESS: Prevalent type of parent soil material in Nebraska. Wind deposited
Pleistocene silt-clay materials that blanket much of eastern, central, and southwestern Nebraska.
Exposed slopes in loess have a tendency to stand in near vertical faces. The color is light brown
varying to tan or light buff.
SANDY PEORIAN: Loess mixed with sand found in areas transitional between the Nebraska
Sandhills and typical Peorian loess mantle in east, south and southwestern Nebraska.
SAND LENSES IN PEORIAN: Very fine sand in thin beds that occasionally occurs in Peorian
loess deposits.
REDEPOSITED PEORIAN: Loess that has eroded out of position; often found in talus at the
toe of exposed loess slopes. The characteristic of loess to stand in vertical slopes is lost when
loess has been redeposited.
LOVELAND LOESS: Loess deposit older than Peorian having a distinguishing reddish tint; it is
usually heavier textured than Peorian loess. A buried weathering surface occasionally occurs at
131
the contact between Loveland and Peorian loesses. This is often seen in roadway cuts where the
two are exposed in contact with one another.
SANDY LOVELAND LOESS: Textural phase of the Loveland Loess.
REDEPOSITED LOVELAND: Loveland loess that has slumped out of its original position.
UPLAND FORMATION: Greenish-gray silts, clays and sandy marl, sometimes intermixed with
volcanic ash, usually found immediately above the Grand Island formation.
FULLERTON FORMATION: Gray silt-clay material usually found between the Grand Island
and Holdrege formation.
GLACIAL TILL: Largely heavy clay soil with intermixed sand, rocks, and silt. It varies widely
in color and may contain some pebbles. No distinction for NDOR purposes is made between the
Kansas and Nebraskan till.
GLACIAL GRAVEL: Mixed sand, gravel, and boulders transported to their current location by
glaciers.
GLACIAL SAND: Local sand deposits associated with glacial till.
FINE SAND AND NATURAL SAND: Wind-blown dune sands covering the Sandhill area of
Nebraska and water deposited fine sands, wherever they may occur.
GRAND ISLAND AND HOLDREGE SAND OR GRAVEL: Sand-gravel materials from which
the bulk of the road gravels are pumped in the valleys of the Platte, Blue, and Republican Rivers.
The two are usually separated by the Fullerton formation. They also underlie, at considerable
depth, the upland plain extending south from the Platte Valley to the Republican Valley. This
formation is the source of most of the water for irrigation wells south of the Platte River and west
of the town of Seward.
Formations of Tertiary Age
KIMBALL FORMATION: Pinkish to gray partly cemented silt, clay, and fine sand capped by
gray algal limestone beds.
SIDNEY GRAVEL: Sheet-like complex of channel or basin gravel deposits not widely
persistent, occurring between the Kimball and Ash Hollow formations.
ASH HOLLOW, VALENTINE, BOX BUTTE, SAND CANYON, SPOTTED TAIL, AND
MARSLAND FORMATIONS: Soft sandstone with interbedded sandy clay and irregularly
cemented mortar beds. Concretions are generally missing.
132
HARRISON, MONROE CREEK AND GERING FORMATIONS: Distinguished from Ash
Hollow by the Prevalence of “pipe” concretions, much clean fine sand and channel deposits.
REDEPOSITED CONCRETIONS: Transported concretions and coarse material making up
coarse gravel deposits. Source of Class “D” limerock.
BRULE CLAY: A massive compact pinkish silty clay, occasionally imbedded thin with layers
of volcanic ash.
REDEPOSITED BRULE: Slumped and weathered Brule Formation. It is loose and friable, very
similar to loess in appearance and characteristics.
CHADRON: Greenish to buff colored clay, silt, and sandy clay. This material often weathers
into a plastic, “gumbo-like” soil. Usually encountered only in the Hat Creek Basin, which is
north of the Pine Ridge escarpment and in the extreme western part of the North Platte Valley.
Formations of Cretaceous Age
PIERRE SHALE: Dark gray massive clay, containing some chalk, bentonite, thin sandstones
and some concretions. It is a very plastic clay soil and is a very poor subgrade material since it
absorbs water readily and changes volume dramatically when wet.
NIOBRARA CHALK: Lead gray to yellowish buff, massive to thin beds of chalk with some
imbedded shales. It is a very poor subgrade material since it absorbs water readily and is very
unstable when wet.
CARLILE SHALE: Gray shales containing a layer of fine-grained sandstone. It is not
widespread at depths where it would be commonly encountered in Nebraska Highway
construction.
GREENHOUSE LIMESTONE: Thin, medium soft gray limestones interbedded with gray
shales. The presence of many oyster shell-like fossils marks the upper portions and makes it
easy to identify.
GRANEROS SHALE: Dark gray plastic shale with some thin calcareous layers, sandy and
sandy shale, and coal-like materials.
DAKOTA SANDSTONE AND DAKOTA SHALES: Mainly of importance as a source of fine
sand, this sand varies from loose clean fine or slightly coarse sand to highly cemented sandstone
and “ironstone” requiring blasting or ripping for removal. The Dakota Shales are usually
interbedded with the sands and are fine-grained silty clay shales which generally have high swell
characteristics and are detrimental subgrade materials. They usually have a glossy or soapy
appearance and are multicolored.

133
Formations of Permian-Pennsylvanian Age
PERMIAN-PENNSYLVANIAN: Limes and Shales. No distinction is usually made between
the Permian and Pennsylvanian. The limestone usually exists as ledges with clay layers beneath.
Shale beds are usually thicker than limestone beds. Exposures are limited to the southeastern
portion of the state.

134
Appendix E
COMPACTION
Soil is used in greater quantities for construction of roads than any other material. All
pavement and roadway structures depend upon soil for support. Without suitable design
specifications, even the most carefully planned and constructed embankments, bridges
and pavements are prone to failure.
This appendix has been prepared for use as a reference and instructional guide for
contractors and inspectors working with compaction and grading projects across
Nebraska. The following sources contain additional information and specifications
applicable to compaction and grading operations. These sources are available online at
http://doroads.nol.org/ref-man/:
Standard Specifications for Highway Construction
Division 200 – Earthwork
Division 300 – Subgrade Preparation, Foundation Courses, Bases Courses,
Shoulder Construction and Grade Resurfacing
Division 700 - Bridges, Culverts and Related Construction
Division 800 – Roadside Development and Erosion Control
Division 900 – Incidental Construction
Supplemental Specifications for Highway Construction
Division 200 – Earthwork
Division 300 – Subgrade Preparation, Foundation Courses, Bases Courses,
Shoulder Construction and Grade Resurfacing
Division 700 - Bridges, Culverts and Related Construction
Division 800 – Roadside Development and Erosion Control
Division 900 – Incidental Construction
Division 1000 – Materials Details
2002 Construction Manual
Division 200 – Earthwork
Division 700 - Bridges, Culverts and Related Construction
Division 900 – Incidental Construction
Division 1000 – Materials Details
In the appendix entitled NDOR Forms, the following examples of forms
are available in pdf format:
DR 8 – Water Applied Haul Sheet
DR 23 – Moisture Density Relationships of Soils
DR 64 – Site Release
DR 86 – Weekly Report of Moisture and Density Tests
(or computer printout)
DR 99 – Earthwork Computations
135
DR 101 – Truck Capacity Computations
DR 210 – Moisture Density Test
DR 232 – Final Status Material and Site Releases
DR 264 – Field Gradation Tests of Gravel
DR 309A, B, C – Contractor’s Estimate
(Fuel Adjustment Computations)
DR 234 – Source of Aggregate to be Used
DR 348 – Material Pit Contract Release
DR 478 – Nuclear Density Record
Compaction
One characteristic of soil that is important to highway construction is its ability to support
loads without excessive deformation or displacement. The load carrying capability of
most soils is reduced as moisture content increases. The ability of a soil to support
imposed loads also varies with soil density. To support maximum loads, most soils
should be compacted as dry and dense as possible. However, excessive amounts of work
are required to attain high densities in very dry soils. Detrimental amounts of swell are
also more likely to occur in a soil that has been compacted under very dry conditions. An
understanding of the relationship between moisture content, soil density, load carrying
capacity and compaction effort is necessary if soil is to be properly emplaced in
embankments.
Research indicates that increased weight of rollers is more effective in obtaining higher
soil densities than requiring additional passes by a smaller roller. The relationship
between soil density and compaction effort at constant moisture content is shown in
Figure E-1. This figure shows the relationship between dry density and number of blows
with a 5.5-pound hammer dropping twelve inches (standard Proctor) and a 10-pound
hammer dropping eighteen inches (modified Proctor). Note the increase in soil density
obtained from the larger hammer remains approximately constant across the entire range
of number of hammer blows.
Typical moisture density curves for constant compaction effort are shown in Figure E-2.
To obtain data from which to plot these curves, several identical samples were
compacting into a mold at different moisture contents varying from 12-21%. The same
amount of compaction effort was used on each sample (25 blows per layer for each of
three layers by a 5.5 lb hammer dropped twelve inches). The weight of the wet
compacted soil was divided by the soil volume to obtain the moist unit weight for each
measured moisture content. The dry density curve was obtained by dividing the wet
density by one plus the decimal moisture content. The equations are summarized below:
Wet density = wet unit weight/volume
Dry density = wet unit weight/1 + decimal moisture content
Where moisture content (%) = ((weight wet-weight dry) /weight dry)*100%
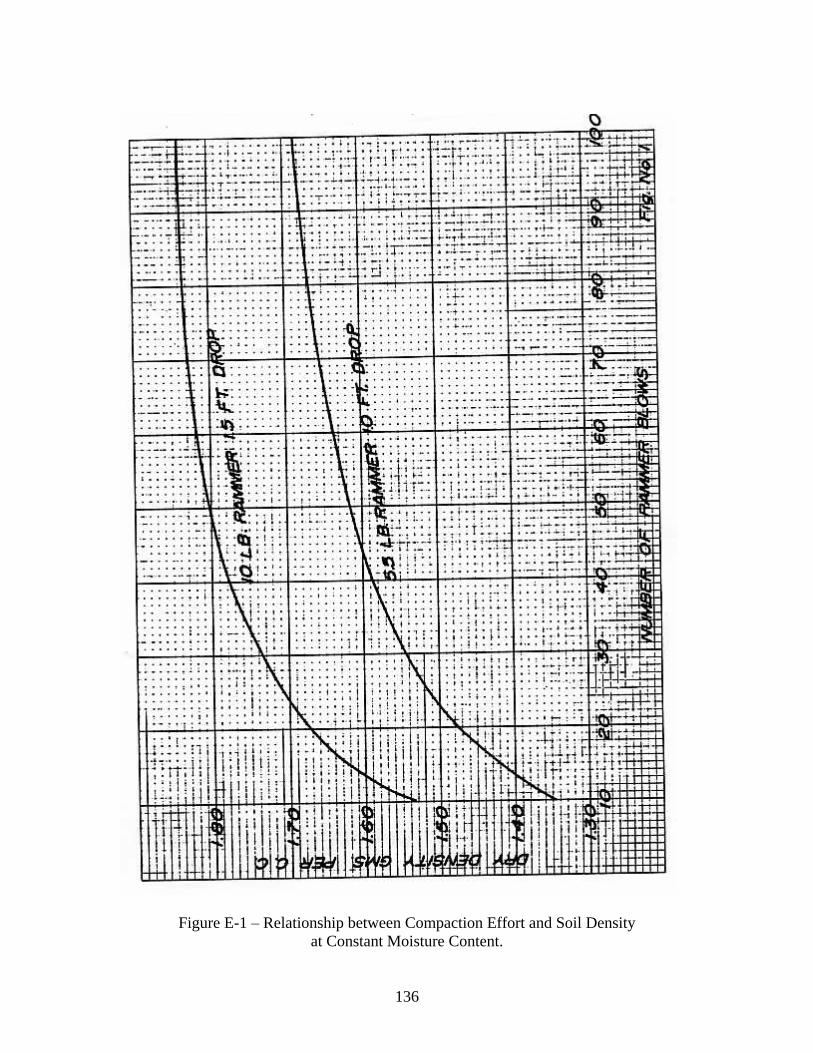
136
Figure E-1 – Relationship between Compaction Effort and Soil Density
at Constant Moisture Content.
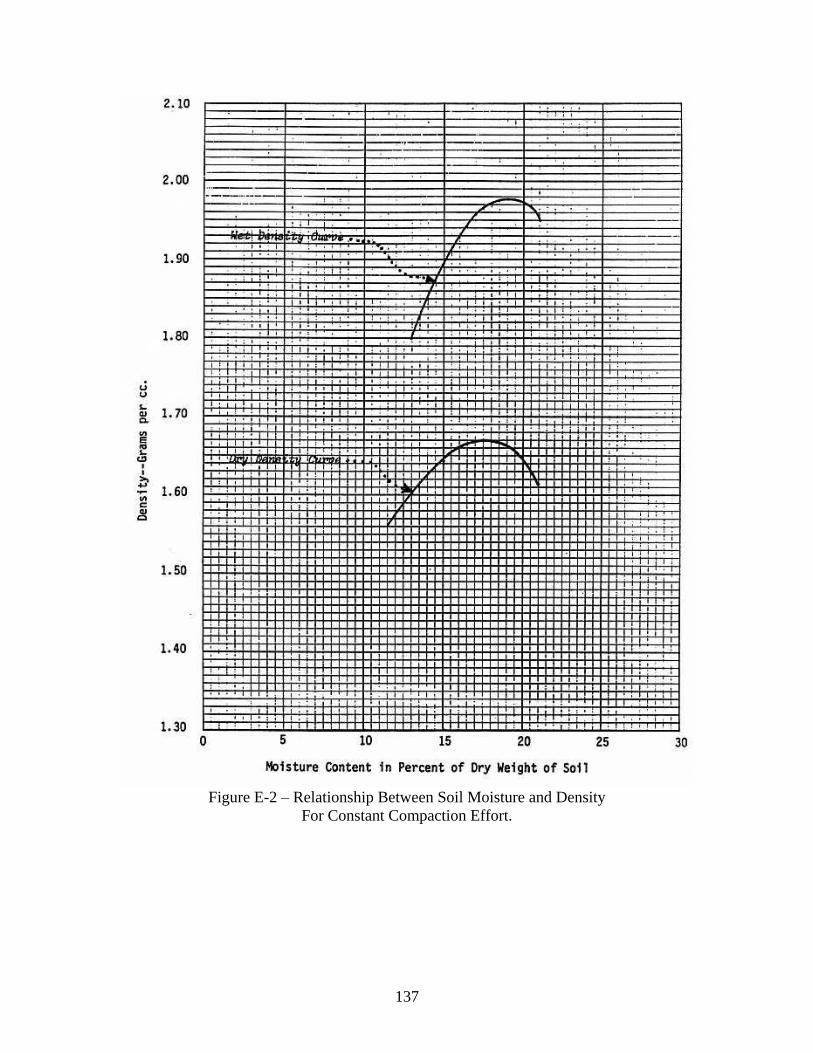
137
Figure E-2 – Relationship Between Soil Moisture and Density
For Constant Compaction Effort.
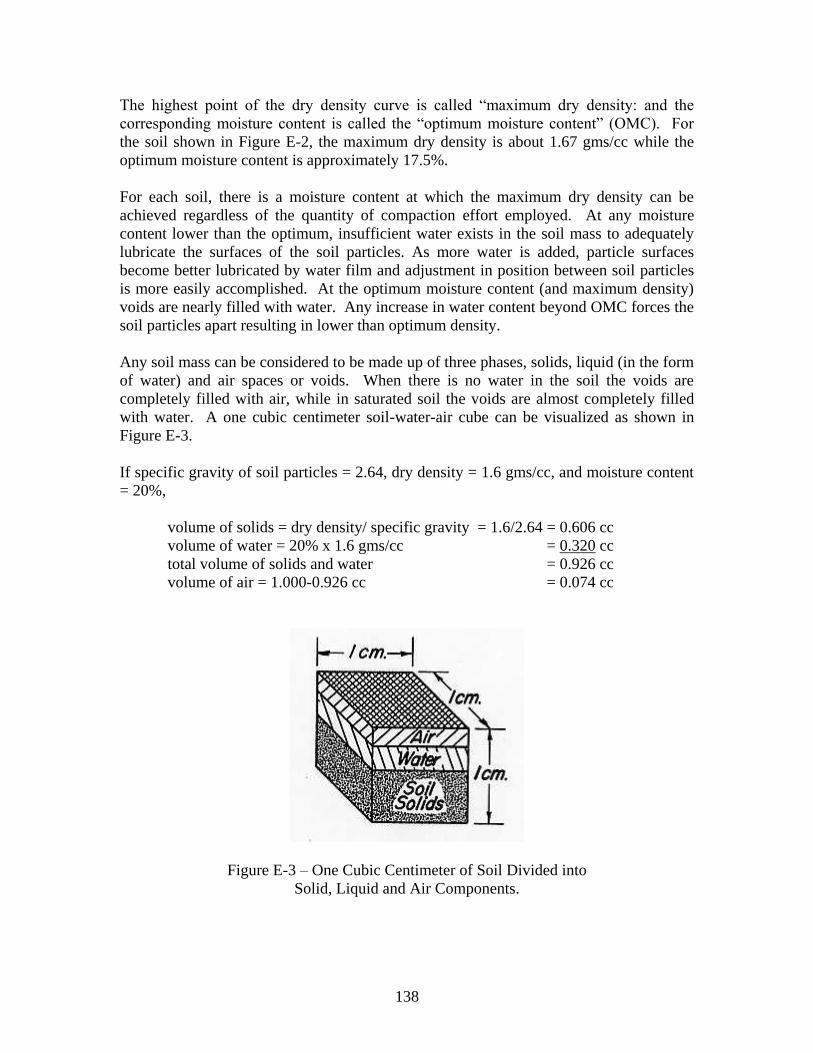
138
The highest point of the dry density curve is called “maximum dry density: and the
corresponding moisture content is called the “optimum moisture content” (OMC). For
the soil shown in Figure E-2, the maximum dry density is about 1.67 gms/cc while the
optimum moisture content is approximately 17.5%.
For each soil, there is a moisture content at which the maximum dry density can be
achieved regardless of the quantity of compaction effort employed. At any moisture
content lower than the optimum, insufficient water exists in the soil mass to adequately
lubricate the surfaces of the soil particles. As more water is added, particle surfaces
become better lubricated by water film and adjustment in position between soil particles
is more easily accomplished. At the optimum moisture content (and maximum density)
voids are nearly filled with water. Any increase in water content beyond OMC forces the
soil particles apart resulting in lower than optimum density.
Any soil mass can be considered to be made up of three phases, solids, liquid (in the form
of water) and air spaces or voids. When there is no water in the soil the voids are
completely filled with air, while in saturated soil the voids are almost completely filled
with water. A one cubic centimeter soil-water-air cube can be visualized as shown in
Figure E-3.
If specific gravity of soil particles = 2.64, dry density = 1.6 gms/cc, and moisture content
= 20%,
volume of solids = dry density/ specific gravity = 1.6/2.64 = 0.606 cc
volume of water = 20% x 1.6 gms/cc = 0.320 cc
total volume of solids and water = 0.926 cc
volume of air = 1.000-0.926 cc = 0.074 cc
Figure E-3 – One Cubic Centimeter of Soil Divided into
Solid, Liquid and Air Components.
139
If the dry density of compacted soil and specific gravity of soil particles are known, the
moisture content where the voids will be completely filled with water can be calculated.
If the specific gravity of the soil particles = 2.64 and dry density = 1.6 gms/cc,
volume of soil solids = dry density/specific gravity = 1.6/2.64 = 0.606 cc
volume of water to completely fill the voids = 1.000 – 0.606 = 0.394 cc
0.394 cc of water weights 0.394 gms at 4o C
% moisture with all voids filled = 0.394/1.6 x 100% = 24.63%
If this calculation is made for different values of dry density, a curve called the “zero air
voids curve” (ZAV curve) can be plotted. The curve shown in Figure E-4 is for soil
solids with a specific gravity of 2.64. Since the position of the zero air voids curve with
respect to the moisture density curve is significant, the moisture density curve is shown in
Figure E-4 as well.
Zero air voids curves can be plotted for soils with a variety of different specific gravities.
ZAV curves commonly shift slightly from right to left corresponding to various values of
specific gravities. This shift is slight for the range of specific gravities normally
encountered when working with Nebraska soils. Since the zero air voids curve
represents the condition where all void space is completely filled by water, no
combination of dry density and moisture content can fall to the right of that curve. No
known method of field compaction is capable of removing all of the air voids from a soil.
Thus, the ZAV curve can serve as a check of test results for moisture density; if in
plotting the results a sample falls on or to the right of the ZAV curve, an error has
obviously been made.
Resistance to penetration can be considered as one method of measuring the ability of a
soil to support loads. The dry density from Figure E-2 is plotted again on Figure E-5. A
curve showing resistance to penetration, a ZAV curve and a curve for 3% air voices are
also superimposed on Figure E-5. Values for plotting resistance to penetration were
obtained by recording the pressure (in psi) required to force a needle of known end area
into the compacted soil at a rate of 0.5 in/sec. Figure E-5 shows that resistance to
penetration becomes weaker as moisture content increases, suggested that soil at higher
moisture contents will carry less load.
Examination of Figure E-5 indicates that when this soil is compacted at a moisture
content of 11.5%, resistance to penetration is greater than 2,000 psi. If water enters the
soil at this density and it becomes nearly saturated (3% air voids), resistance to
penetration falls to zero (by interpolation at bottom of resistance to penetration curve). If
the soil shown in Figure E-5 is compacted to its maximum dry density (1.67 gms/cc) and
saturated in the same manner (3% air voids), the soil now has approximately 300 psi
resistance to penetration.
Research suggests that densities of typical Nebraska soils supporting flexible pavements
remain near as-constructed density or show a slight increase in density due to the
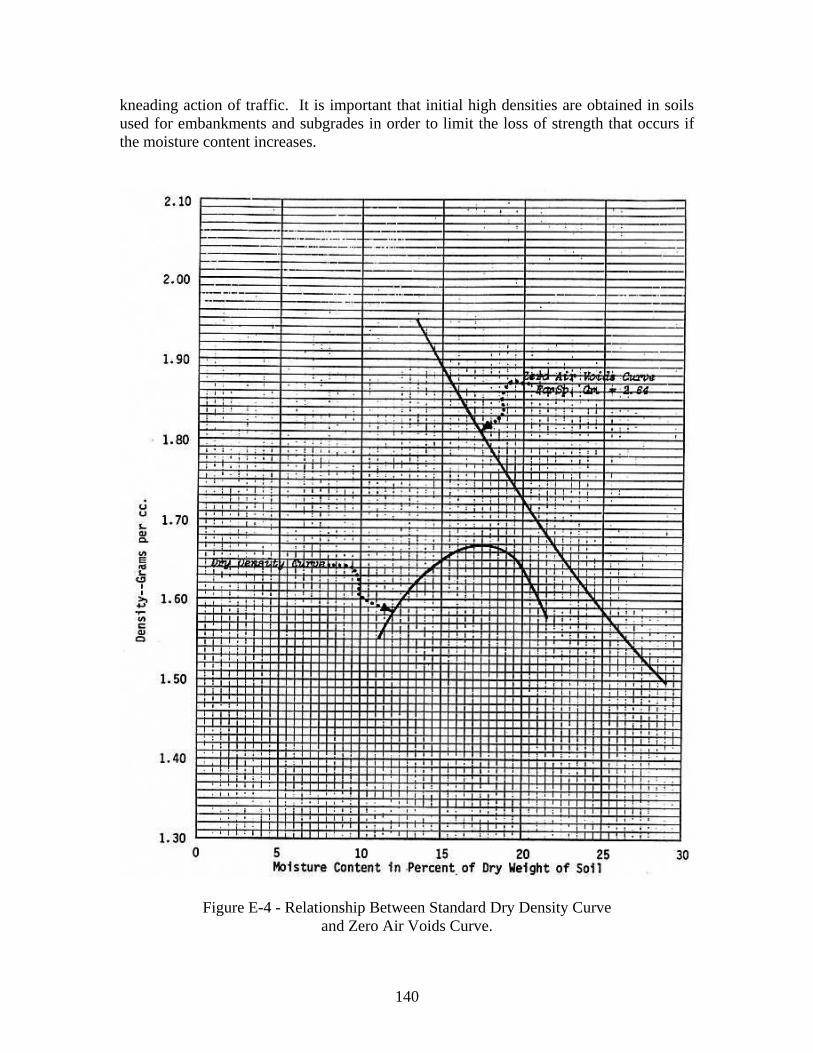
140
kneading action of traffic. It is important that initial high densities are obtained in soils
used for embankments and subgrades in order to limit the loss of strength that occurs if
the moisture content increases.
Figure E-4 - Relationship Between Standard Dry Density Curve
and Zero Air Voids Curve.
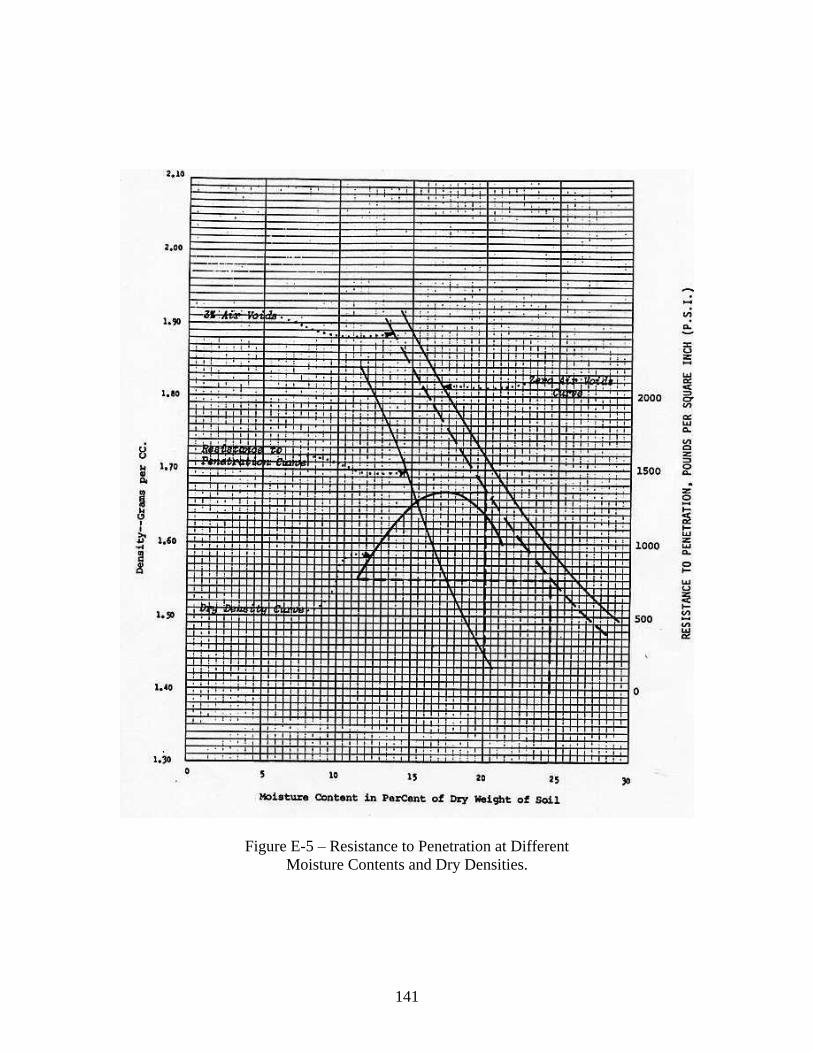
141
Figure E-5 – Resistance to Penetration at Different
Moisture Contents and Dry Densities.
142
For any given method of compaction, the maximum density and optimum moisture
content varies with the type of soil. In general, well-graded soils containing a mixture of
gravel, sand, silt and clay have high maximum densities and low optimum moisture
contents. Poorly graded and silt-clay soils have lower maximum densities and higher
optimum moisture contents. Figure E-6 show moisture density curves representing
typical Nebraska soils. The ZAV curve is also plotted to show its position with respect to
this family of curves.
These typical curves can be used in field emergencies field when a different soil type is
encountered for which no moisture density curve has been plotted. One compaction test
is conducted using the unknown soil and standard ASTM procedure, having first adjusted
the moisture content to near the anticipated optimum level. The moisture content and dry
density of the compacted sample are than determined and plotted on the graph of typical
curves. A new curve is drawn through the OMC, parallel with the curve(s) nearest the
point. The new curve can be used as the moisture density curve for the unknown soil.
This procedure should only be used on a temporary basis. If a significant quantity of
unknown soil is encountered, standard moisture density testing should be conducted over
a range of water contents so that a standard moisture density curve can be plotted.
When plotting a moisture density on a graph of typical curves, it is necessary to classify
the soil as either granular or silt-clay. This can generally be determined with sufficient
accuracy by visual inspection and by feeling the texture of the soil. Granular soils are
materials that have 65-100% retained on the No. 200 sieve, while silt-clay soils have less
than 65% retained on the No. 200 sieve.
An example of the example can be illustrated by an unknown soil with 72% retained on
the No. 200 sieve. Dry density is 1.86 gm/cc at 8% moisture content. This point is
plotted on granular series of curves and a curve is drawn parallel with the nearest
granular curves. A close approximation of maximum density and optimum moisture
content may be read from the peak of the new curve as approximately 1.88 gm/cc at
10.5% moisture content.
The same procedure can be used for a silt-clay soil with less than 65% retained on the
No. 200 sieve. Dry density obtained from a compaction test is 1.60 gm/cc at 19.0%
moisture content. Plotting parallel to the nearest silt-clay curve will yield a new curve
with a maximum density of about 1.62 gm/cc at 20.8% OMC.
Selective placement notes are commonly associated with the construction of flexible
pavement and are normally shown on the plan profile sheets. Selective handling and
placement of soils may be required to create subgrade, base and/or surface courses of
adequate capacity and thickness to support the layer(s) of flexible pavement. Experience
has shown that cohesive soil placed over granular soil and then topped by pavement is
detrimental to flexible pavement longevity. Selective placement is used to ensure that the
upper part of the embankment is constructed of material similar to that in the lower part
of the embankment or to place granular materials in the upper part of the embankment
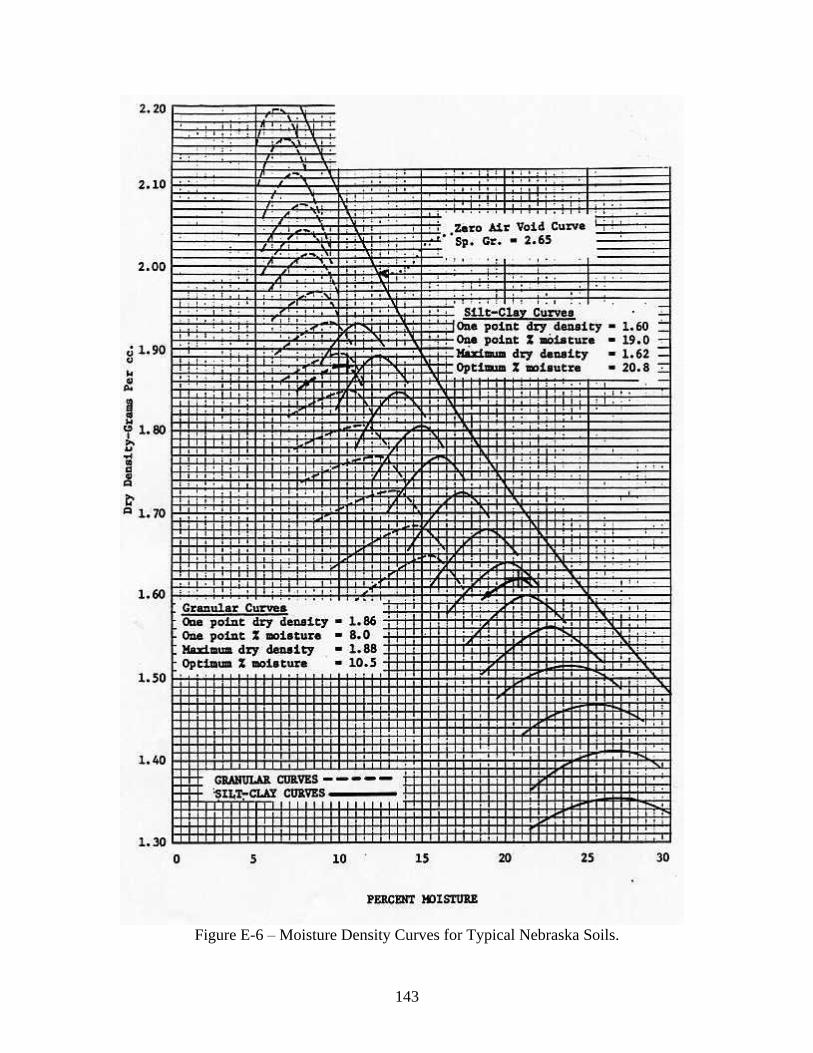
143
Figure E-6 – Moisture Density Curves for Typical Nebraska Soils.
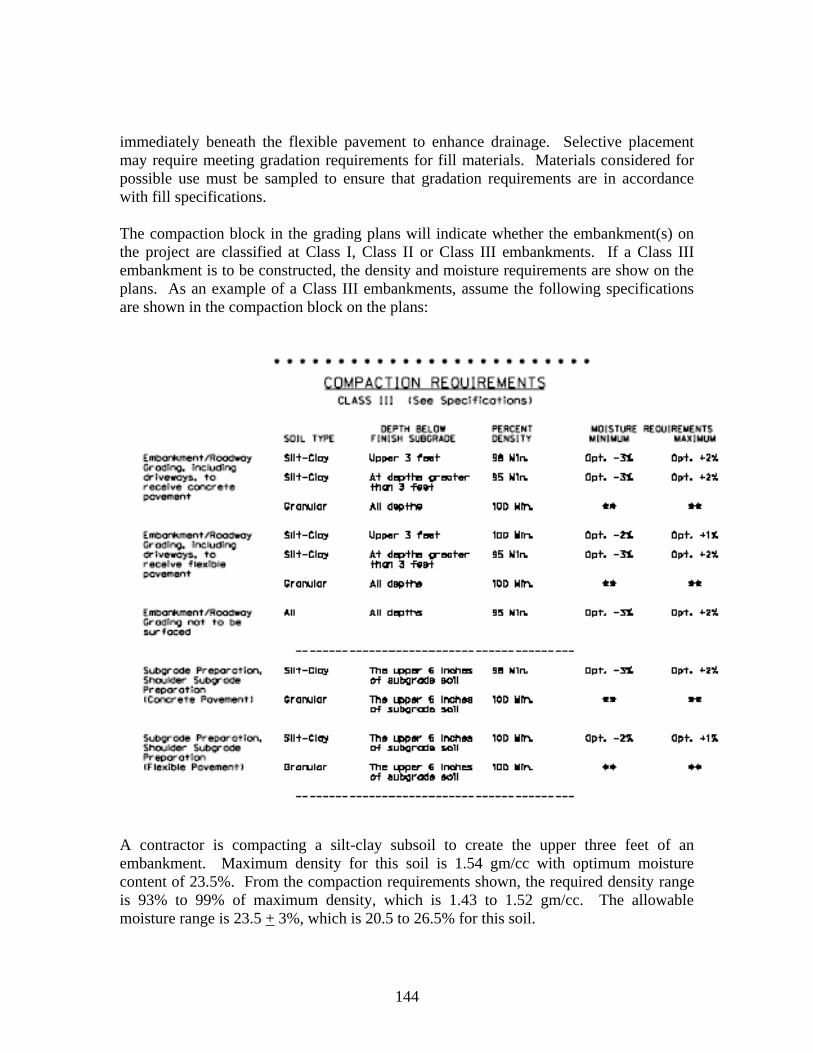
144
immediately beneath the flexible pavement to enhance drainage. Selective placement
may require meeting gradation requirements for fill materials. Materials considered for
possible use must be sampled to ensure that gradation requirements are in accordance
with fill specifications.
The compaction block in the grading plans will indicate whether the embankment(s) on
the project are classified at Class I, Class II or Class III embankments. If a Class III
embankment is to be constructed, the density and moisture requirements are show on the
plans. As an example of a Class III embankments, assume the following specifications
are shown in the compaction block on the plans:
A contractor is compacting a silt-clay subsoil to create the upper three feet of an
embankment. Maximum density for this soil is 1.54 gm/cc with optimum moisture
content of 23.5%. From the compaction requirements shown, the required density range
is 93% to 99% of maximum density, which is 1.43 to 1.52 gm/cc. The allowable
moisture range is 23.5 + 3%, which is 20.5 to 26.5% for this soil.

145
Before a contractor opens a borrow pit or a cut section, the moisture content of each soil
layer should be analyzed to determine if the soil in that layer will have to be wetted or
dried to bring its moisture content within the specified limits. If the natural moisture
content is within specifications, the soil can sometimes be used with no modification.
Sometimes a small amount of water must be added to replace moisture lost by
evaporation during construction operations. Preliminary moisture determinations are
commonly made several days to a week ahead of actual excavation so that proper
equipment can be available for wetting or drying of the soil prior to final grading
operations.
If the natural soil moisture content is greater than that allowed by specifications, the
moisture content must be reduced. Drying may be accomplished by disking the soil and
allowing water vapor to evaporate naturally. When insufficient time for natural drying is
available, the use of chemical additives may be appropriate. Frequency of sampling
should satisfy always meet or exceed project specifications.
Field moisture density sampling is now frequently done using a nuclear moisture density
gauge. ASTM D 2292 details standards for determination of soil density using nuclear
equipment while D 3017 covers determination of moisture content using nuclear gauges.
Nuclear moisture density equipment is accurate and provides both moisture and density
data with a minimum of time and effort.
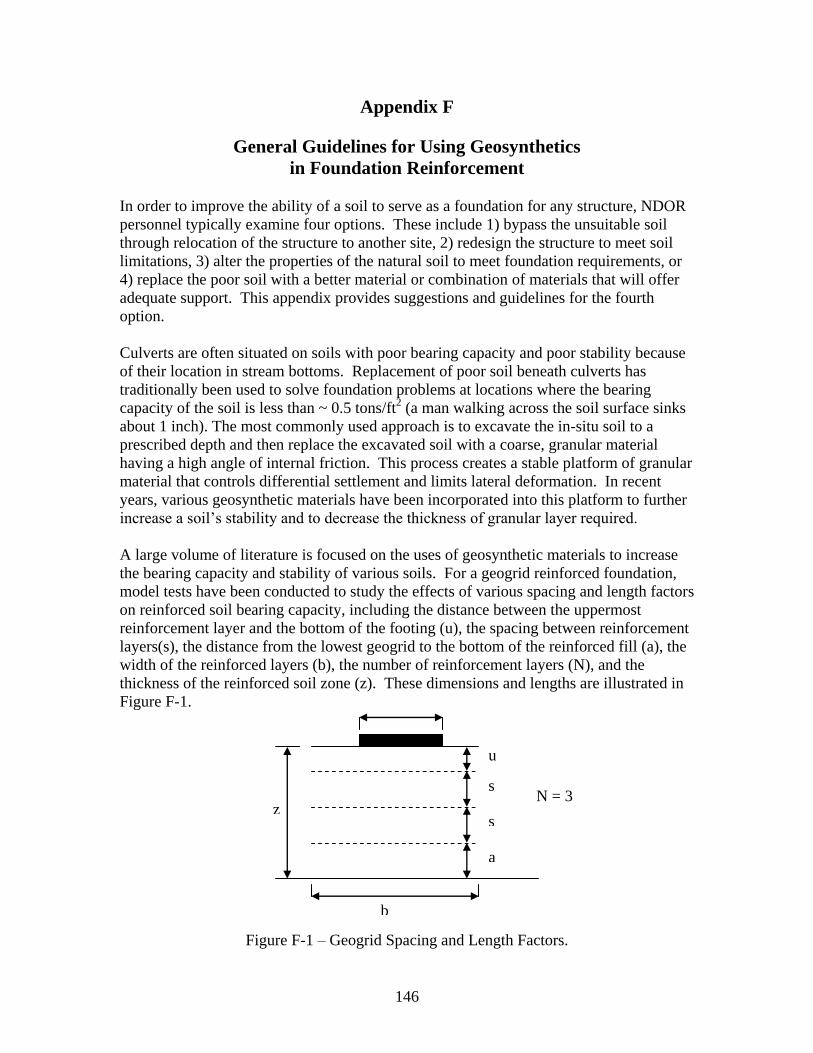
146
Appendix F
General Guidelines for Using Geosynthetics
in Foundation Reinforcement
In order to improve the ability of a soil to serve as a foundation for any structure, NDOR
personnel typically examine four options. These include 1) bypass the unsuitable soil
through relocation of the structure to another site, 2) redesign the structure to meet soil
limitations, 3) alter the properties of the natural soil to meet foundation requirements, or
4) replace the poor soil with a better material or combination of materials that will offer
adequate support. This appendix provides suggestions and guidelines for the fourth
option.
Culverts are often situated on soils with poor bearing capacity and poor stability because
of their location in stream bottoms. Replacement of poor soil beneath culverts has
traditionally been used to solve foundation problems at locations where the bearing
capacity of the soil is less than ~ 0.5 tons/ft2 (a man walking across the soil surface sinks
about 1 inch). The most commonly used approach is to excavate the in-situ soil to a
prescribed depth and then replace the excavated soil with a coarse, granular material
having a high angle of internal friction. This process creates a stable platform of granular
material that controls differential settlement and limits lateral deformation. In recent
years, various geosynthetic materials have been incorporated into this platform to further
increase a soil’s stability and to decrease the thickness of granular layer required.
A large volume of literature is focused on the uses of geosynthetic materials to increase
the bearing capacity and stability of various soils. For a geogrid reinforced foundation,
model tests have been conducted to study the effects of various spacing and length factors
on reinforced soil bearing capacity, including the distance between the uppermost
reinforcement layer and the bottom of the footing (u), the spacing between reinforcement
layers(s), the distance from the lowest geogrid to the bottom of the reinforced fill (a), the
width of the reinforced layers (b), the number of reinforcement layers (N), and the
thickness of the reinforced soil zone (z). These dimensions and lengths are illustrated in
Figure F-1.
Figure F-1 – Geogrid Spacing and Length Factors.
b
u
s
s
a
z N = 3
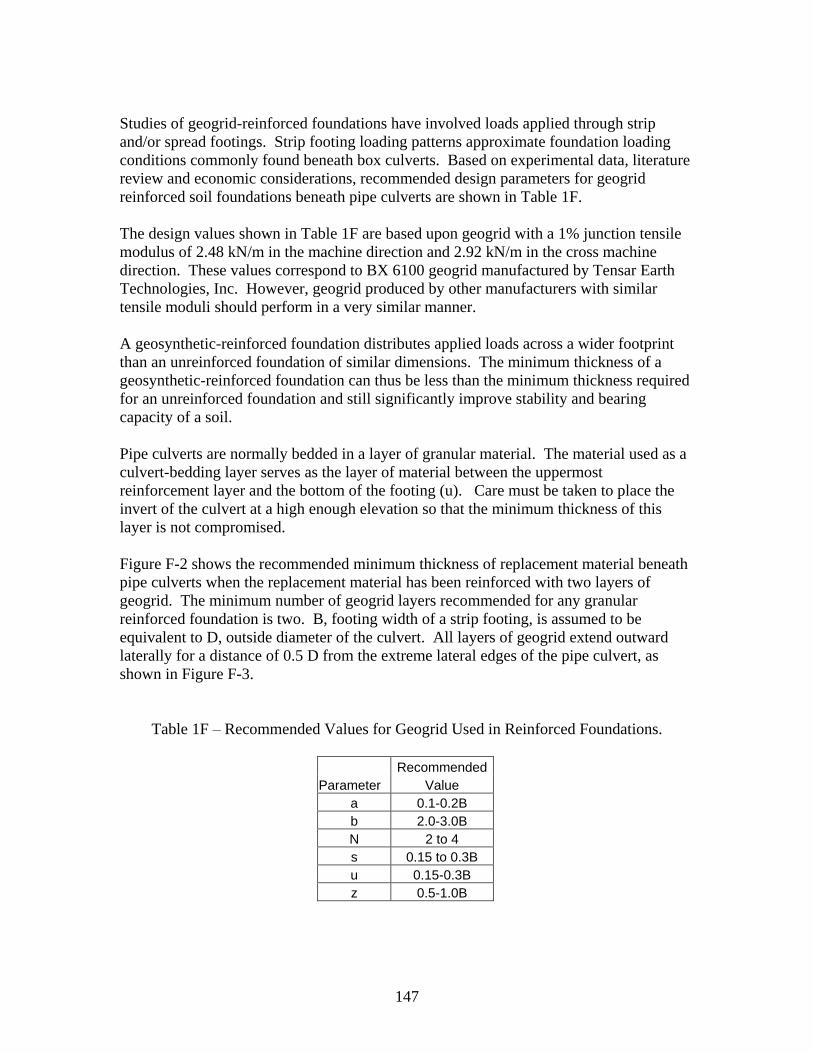
147
Studies of geogrid-reinforced foundations have involved loads applied through strip
and/or spread footings. Strip footing loading patterns approximate foundation loading
conditions commonly found beneath box culverts. Based on experimental data, literature
review and economic considerations, recommended design parameters for geogrid
reinforced soil foundations beneath pipe culverts are shown in Table 1F.
The design values shown in Table 1F are based upon geogrid with a 1% junction tensile
modulus of 2.48 kN/m in the machine direction and 2.92 kN/m in the cross machine
direction. These values correspond to BX 6100 geogrid manufactured by Tensar Earth
Technologies, Inc. However, geogrid produced by other manufacturers with similar
tensile moduli should perform in a very similar manner.
A geosynthetic-reinforced foundation distributes applied loads across a wider footprint
than an unreinforced foundation of similar dimensions. The minimum thickness of a
geosynthetic-reinforced foundation can thus be less than the minimum thickness required
for an unreinforced foundation and still significantly improve stability and bearing
capacity of a soil.
Pipe culverts are normally bedded in a layer of granular material. The material used as a
culvert-bedding layer serves as the layer of material between the uppermost
reinforcement layer and the bottom of the footing (u). Care must be taken to place the
invert of the culvert at a high enough elevation so that the minimum thickness of this
layer is not compromised.
Figure F-2 shows the recommended minimum thickness of replacement material beneath
pipe culverts when the replacement material has been reinforced with two layers of
geogrid. The minimum number of geogrid layers recommended for any granular
reinforced foundation is two. B, footing width of a strip footing, is assumed to be
equivalent to D, outside diameter of the culvert. All layers of geogrid extend outward
laterally for a distance of 0.5 D from the extreme lateral edges of the pipe culvert, as
shown in Figure F-3.
Table 1F – Recommended Values for Geogrid Used in Reinforced Foundations.
Recommended
Parameter Value
a 0.1-0.2B
b 2.0-3.0B
N 2 to 4
s 0.15 to 0.3B
u 0.15-0.3B
z 0.5-1.0B
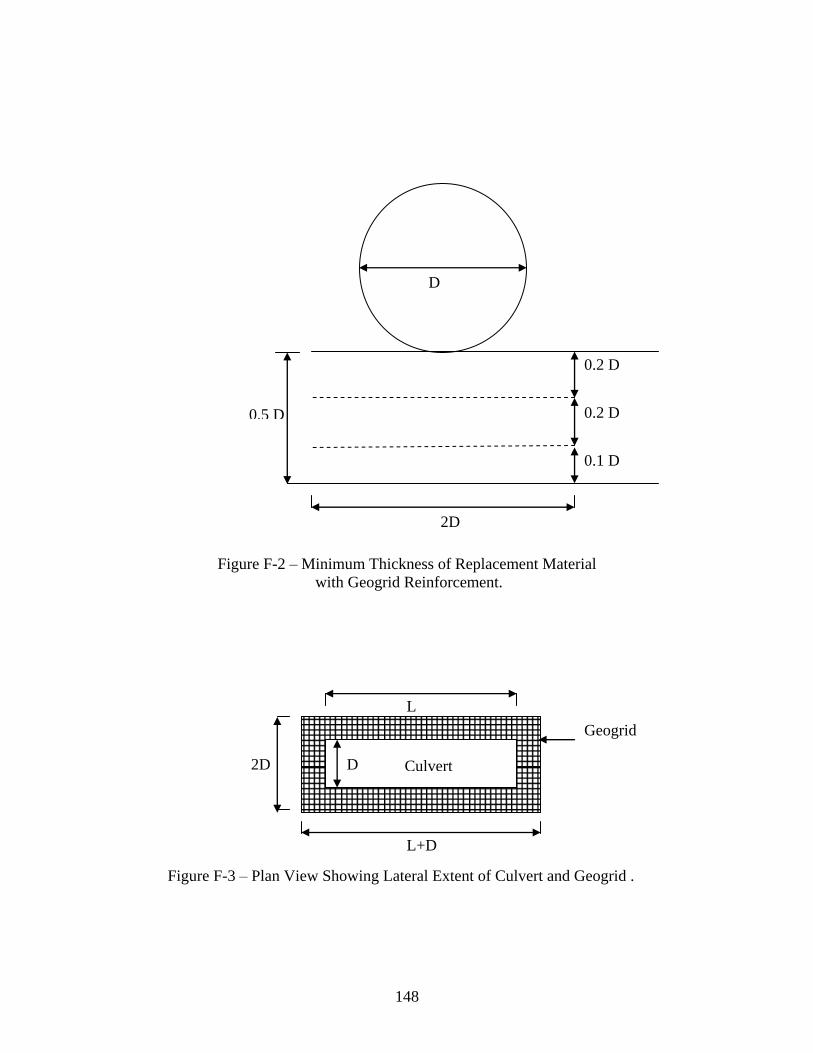
148
Figure F-2 – Minimum Thickness of Replacement Material
with Geogrid Reinforcement.
Figure F-3 – Plan View Showing Lateral Extent of Culvert and Geogrid .
0.2 D
0.2 D
0.1 D
0.5 D
D
2D
D 2D
L
L+D
Culvert
Geogrid

149
Box culvert foundations that will be constructed in locations with poor soil can be
stabilized in a similar manner. Once the box culvert location has been cut to
approximately finished grade (bottom of the box), the area should be inspected for soft or
very soft soils. Very soft soils are defined as materials with a compressive strength
between 0 – 0.125 tons/ft2. A person will experience difficulty while walking across a
very soft soil, as with each step they will sink to a depth of three inches or greater. Soft
soils are defined as materials with a compressive strength between 0.125 – 0.25 tons/ft2.
A person walking across soft soil will also experience difficulty walking but will sink
only 1-3 inches. Neither soft nor very soft soils have the capacity to support construction
equipment.
Soft and very soft soils are commonly removed from beneath a box culvert foundation to
a depth where the soil will support foot traffic with one inch of deformation or less or to a
depth of five feet (1.5 m), whichever is less. When excavating soft material from beneath
a proposed box culvert location, the NDOR geotechnical engineer should be consulted if
any of the following conditions are encountered a) the side slopes of the excavation
appear unstable, b) excavation must proceed more than five feet (1.5 m) below the
bottom of finished grade, c) excavation must proceed more than 3 feet (1 m) below the
groundwater table, or d) other unusual conditions are encountered at the site. The
resulting excavation is commonly backfilled immediately after completion of excavation
operations. Near simultaneous excavation and placement operations may be required
when groundwater is rapidly filling the excavation. An excavation is normally filled with
granular material to finished grade and the box culvert is subsequently constructed
directly on top at grade level.
Geogrid reinforced box culvert foundations will normally be designed for each specific
location, as both the soil properties and culvert loads vary considerably from site to site.
General guidelines suggest that if a geogrid reinforced foundation is to be constructed for
a box culvert, soft or very soft soil should be removed to a minimum depth of
approximately two feet (0.6 m). The area of excavation should extend one-quarter of the
culvert width to either side of the culvert and for a distance of one-tenth of the culvert
width at each end. Geogrid should be placed across the top of the natural soil and pulled
tight before being covered with approximately two feet (0.6 m) of aggregate meeting the
requirements of coarse aggregate used in NDOR 47B concrete.
The ground surface may consist of soft to very soft soil for a considerable distance in all
directions around some culvert sites, requiring construction of a working platform for
equipment. Design of the working platform is unique to each situation, as soil bearing
capacity and shear strength will vary with soil type, moisture content and drainage.
Loads imposed on the working platform by construction equipment will also vary.
Lightest loads are normally associated with equipment that pushes soil, heavier loads
with equipment that transports soil, and highest loads with cranes and other lifting
equipment. Loads from wheeled equipment are more concentrated and generally heavier
than loads associated with tracked equipment of the same capacity.

150
General guidelines suggest that if a geogrid reinforced foundation is to be constructed for
an equipment platform, very soft soil should be removed to a minimum depth of
approximately two feet (0.6 m). Geogrid should be placed across the top of the natural
soil and pulled tight before being covered with approximately two feet (0.6 m) of
aggregate meeting the requirements of coarse aggregate used in NDOR 47B concrete.
With soft soil, the same guidelines should be followed except depth of excavation can be
limited to one foot (0.3m). Geogrid should be placed across the top of the natural soil
and pulled tight before being covered with approximately one foot (0.3 m) of aggregate
meeting the requirements of coarse aggregate.
Geogrid reinforced foundations can improve the bearing capacity and stability of most
soils under all loading patterns while limiting total and differential settlement and
significantly reducing the quantity of fill material that must be purchased and transported
to the site. In situations where fill is moderately expensive or where fill must be
transported long distances to the project site, geogrid reinforcement may offer an
economically attractive alternative.