George Washington University Prepared for The EU-OECD ... · Burt S. Barnow . George Washington...
24
Burt S. Barnow George Washington University Prepared for The EU-OECD Dialogue on International Migration and Mobility : Matching Economic Migration with Labour Market Needs Brussels, Belgium February 24-25, 2014 1
Transcript of George Washington University Prepared for The EU-OECD ... · Burt S. Barnow . George Washington...

Burt S. Barnow George Washington University
Prepared for The EU-OECD Dialogue on International Migration and Mobility : Matching Economic Migration with Labour Market Needs
Brussels, Belgium February 24-25, 2014
1
No universal definition Economists generally view a shortage as a
situation where D>S at prevailing wage for a sustained period ◦ This implies “excess” vacancies, but how many? ◦ How long must the disequilibrium go on before
considered a shortage? ◦ Should time to fill vacancies be a criterion? ◦ When is a market tight v. having a shortage?
The dividing line between a tight labor market and a shortage is somewhat arbitrary
2
Presenter
Presentation Notes
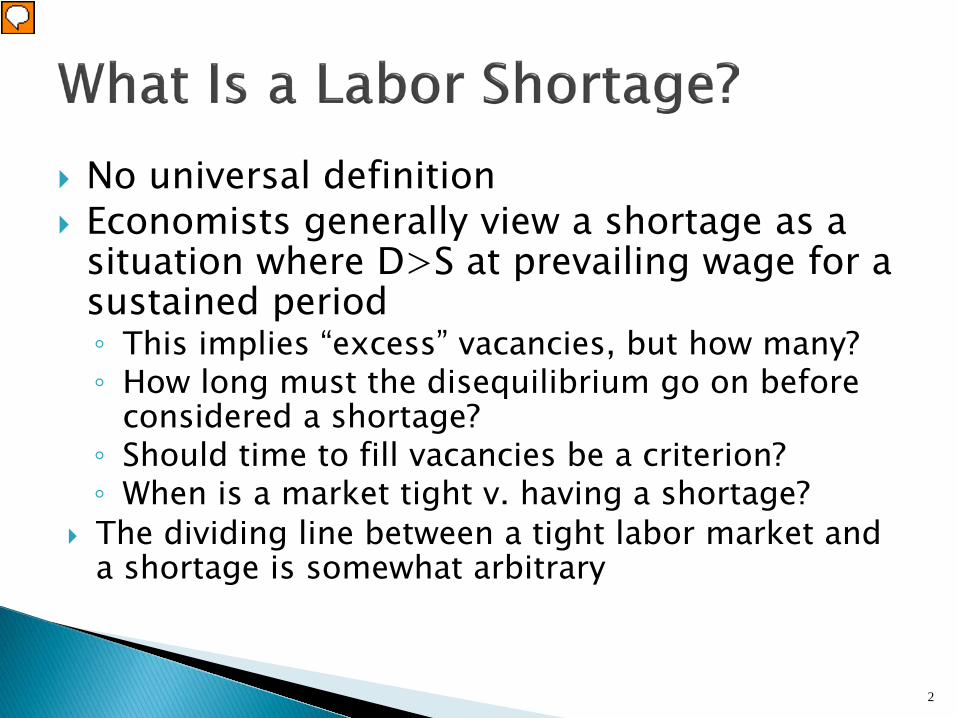
Social demand model definition proposed by Arrow and Capron HHs Commission on Nursing said that shortage of nurses could be defined in terms of insufficient supply to meet requirements for RNs
3
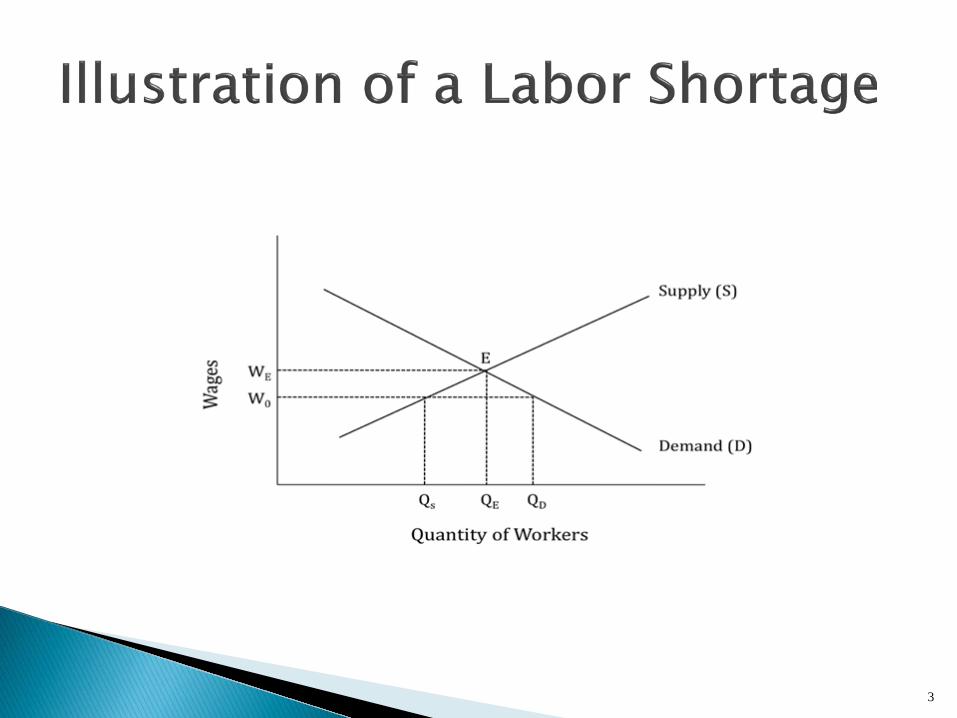
“Social demand shortage”: less than we would like to have, but market clears; not a shortage in economic sense
Social demand shortages are important for assessing social policy, but the solutions may be different from policies to deal with an economic shortage
Social demand shortages are relevant for immigration policy
4

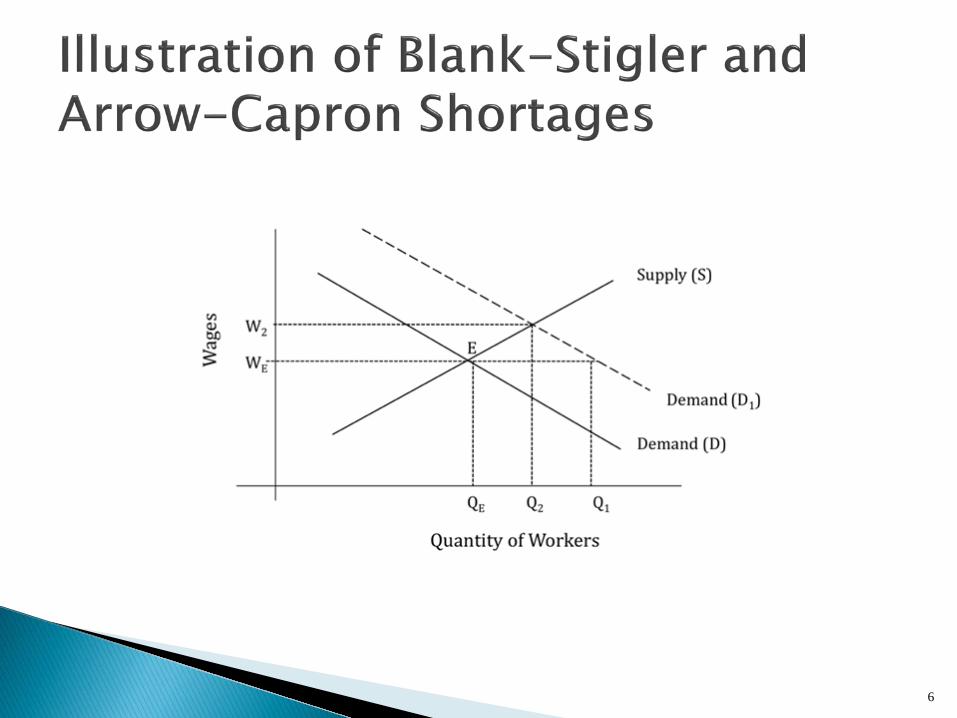
Increase in demand for labor with inability for supply to increase sufficiently or quickly enough (Blank-Stigler and Arrow-Capron models illustrated next slide)
Decrease in supply of labor, perhaps due to retirement or movement to a similar occupation that pays better (shipfitters to oil pipelines)
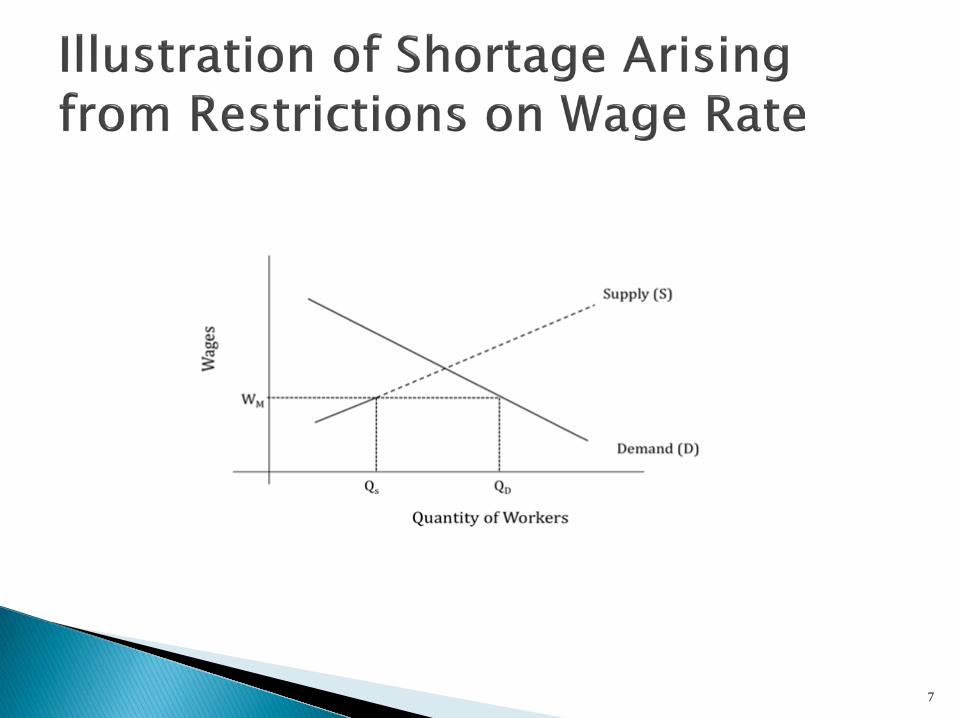
Restrictions in prices (health care) Restrictions on entry of workers due to limitations of training
institutions or behavior of unions or employee associations Time lags that cause adjustments to take place too slowly to alleviate
the shortage Reason for shortage should be taken into account in developing
policies
5
6
7

Increase recruiting efforts ◦ increase advertising in usual outlets ◦ advertise in other media ◦ expand the recruiting area, possibly to other
countries ◦ use public or private employment agencies ◦ pay bonuses to employees who bring in workers
8

Increase use of overtime Reduce minimum qualifications for the job Restructure work to use less of “shortage”
occupations Substitute machinery and equipment for labor Train workers for the jobs
9

Improve working conditions Offer bonuses to new workers Offer stock options to workers Improve pay and fringe benefits Contract out work Turn down work
If you do not see one or more of these
actions, can there really be a shortage?
10
Look for an increase in the number and duration of vacancies--if you can find the data
Ask employers, but also ask workers Look for evidence of the adjustments described
above--if missing, ask employers why Look at changes in wages, especially relative
wages for similar occupations
11

With support from the Sloan Foundation, we studied 4 occupations that have often been cited as having shortages ◦ Home care workers ◦ Pharmacists ◦ Physical therapists ◦ Special education teachers
General approach to the study ◦ Analyze government data from BLS and other agencies ◦ Interviews with trade associations, employers, worker
organizations, and academics ◦ Literature review
12

None of the four occupations appear to be currently experiencing shortages using the economics definition, but study was done during the Great Recession
All the occupations may have had shortages in the past ◦ Pharmacists experienced a shortage when the length of
education was increased by one year ◦ Prior studies indicated past shortages in home care due to
price restrictions ◦ Our previous study of special education teachers found a
shortage ◦ Interviews indicated that there have been shortages of
physical therapists in the past
13

Measuring occupational shortages is difficult ◦ Occupational vacancy data are needed but not available in US ◦ Even with such data, it is difficult to differentiate between a
shortage and a tight labor market ◦ The SOC occupational system is too aggregate to identify
shortages ◦ Interviews have problems because employers, unions, and trade
associations have incentives to misreport the situation There was no evidence of shortages in the occupations studied ◦ Employers frequently reported shortages, but in the “social
demand” sense, not the economic definition ◦ These occupations do have tight labor markets, but the severe
recession precluded shortages
14
For policy purposes, it is important to go beyond the economic definition of a shortage ◦ In the cases where employment is highly regulated by the
public sector, the social demand considerations raised by Arrow and Capron are important
Some occupations with tight labor markets have recently raised or are considering increasing educational requirements ◦ Examples include physical therapists, pharmacists, and
registered nurses ◦ Although reasons are advanced for these changes, are the
changes worth doing when it is already hard to get enough people in the occupation?
Because of the importance of gathering good information on shortages, consideration should be given to improving data on job vacancies and the detail of occupational measurement
15

Permanent visa system is mostly family-based: only 14% based on employment (144,000 of 1,000,000 total)
Permanent visas include four categories of workers, with caps for each category
Permanent visas are also capped by country
16
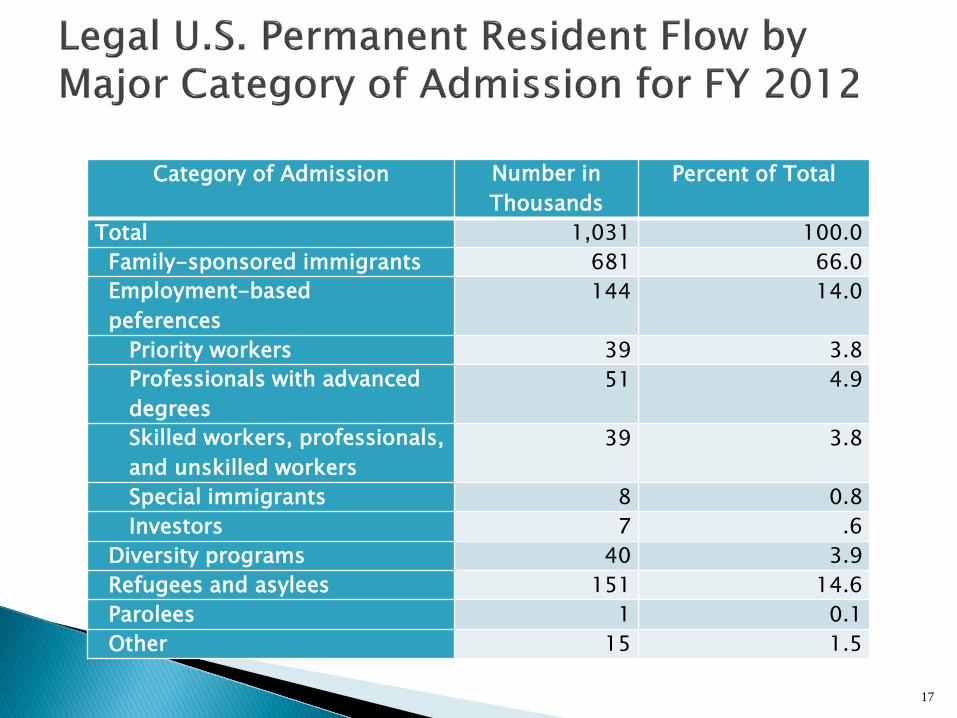
Category of Admission Number in Thousands
Percent of Total
Total 1,031 100.0 Family-sponsored immigrants 681 66.0 Employment-based peferences
144 14.0
Priority workers 39 3.8 Professionals with advanced degrees
51 4.9
Skilled workers, professionals, and unskilled workers
39 3.8
Special immigrants 8 0.8 Investors 7 .6 Diversity programs 40 3.9 Refugees and asylees 151 14.6 Parolees 1 0.1 Other 15 1.5
17
The major program for temporary visas is the H-1B program for skilled workers, which currently admits about 65,000 workers annually for 3 years, with possible renewal
Temporary agricultural workers are admitted on H-2A visas, and low-skill non-agricultural workers admitted under H-2B program
18

Occupation Number of Positions Certified
Landscaping and groundskeeping workers 31,287 Forest and conservation workers 9,573 Amusement and recreation attendants 5,788 Maids and housekeeping cleaners 5,626 Meat, poultry, and fish cutters and trimmers
3,051
Construction laborers 2,106 Nonfarm animal caretakers 1,639 Waiters and waitresses 1,566 Coaches and scouts 1,553 Fishers and related fishing workers 1,282
19
20
The employer sends the request to Citizenship and Immigration Services in the Department of Homeland Security
If approved by CIS, the Department of State issues the visa
Bottlenecks are created by limits in employment visa categories and limit of 7% per country ◦ Skilled workers from countries like China and India
often must wait many years for visa ◦ Workers already in the US on H-1B visas can have
the visas extended while awaiting permanent visa
21

Malcolm Cohen proposed an index using 7 measures: ◦ Employment change in the recent past ◦ Occupational unemployment rate in the recent past ◦ Wage change in the recent past ◦ Training required for the occupation ◦ Replacement demand ◦ Projected increase in occupational demand ◦ Immigrants certified in the recent past
22

Employer-Based Indicators ◦ Skill shortage vacancies as a percentage of employment by occupation ◦ Skill shortage vacancies as a percentage of all vacancies ◦ Skill shortage vacancies as a percentage of hard to fill vacancies
Price-Based Indicators ◦ Percentage change in median hourly pay for all employees ◦ Percentage change in mean hourly pay for all employees ◦ Relative premium to an occupation, given [skill level], controlling for region
and age Volume-Based Indicators ◦ Percentage change in unemployed by sought occupation ◦ Percentage change in hours worked for full-time employees ◦ Percentage change in employment ◦ Absolute change in proportion of workers in occupation less than one year
Indicators of Imbalance Based on Administrative Data ◦ Absolute change in median vacancy duration ◦ Stock of vacancies/claimant count by sought occupation.
23
The approach should depend on the goal Indicators or the UK system are useful for dealing
with shortages for immigration Auctions or fees will result in admission of migrants
of most value to employers Quotas based on skills or education are useful if
goal is to increase human capital of the country How to decide? Determine the objectives first, and
that should point to the best approach
24