Gene Expression Alterations in the Cerebellum and Granule ...
12
Gene Expression Alterations in the Cerebellum and Granule Neurons of Cstb 2/2 Mouse Are Associated with Early Synaptic Changes and Inflammation Tarja Joensuu 1,2,3 * . , Saara Tegelberg 1,2,3. , Eva Reinmaa 1¤ , Mikael Segerstra ˚le 3,4,5 , Paula Hakala 1,2,3 , Heidi Pehkonen 6 , Esa R. Korpi 6 , Jaana Tyynela ¨ 7 , Tomi Taira 3,5 , Iiris Hovatta 4,8 , Outi Kopra 1,2,3 , Anna-Elina Lehesjoki 1,2,3 1 Folkha ¨ lsan Institute of Genetics, Helsinki, Finland, 2 Department of Medical Genetics, Haartman Institute and Research Programs Unit, Molecular Neurology, University of Helsinki, Helsinki, Finland, 3 Neuroscience Center, University of Helsinki, Helsinki, Finland, 4 Department of Biosciences, Faculty of Biological and Environmental Sciences, University of Helsinki, Helsinki, Finland, 5 Department of Veterinary Biosciences, Faculty of Veterinary Medicine, University of Helsinki, Helsinki, Finland, 6 Institute of Biomedicine, Pharmacology, University of Helsinki, Helsinki, Finland, 7 Institute of Biomedicine, Biochemistry and Developmental Biology, University of Helsinki, Helsinki, Finland, 8 Mental Health and Substance Abuse Services, National Institute for Health and Welfare, Helsinki, Finland Abstract Progressive myoclonus epilepsy of Unverricht-Lundborg type (EPM1) is an autosomal recessively inherited neurodegen- erative disease, manifesting with myoclonus, seizures and ataxia, caused by mutations in the cystatin B (CSTB) gene. With the aim of understanding the molecular basis of pathogenetic events in EPM1 we characterized gene expression changes in the cerebella of pre-symptomatic postnatal day 7 (P7) and symptomatic P30 cystatin B -deficient (Cstb 2/2 ) mice, a model for the disease, and in cultured Cstb 2/2 cerebellar granule cells using a pathway-based approach. Differentially expressed genes in P7 cerebella were connected to synaptic function and plasticity, and in cultured cerebellar granule cells, to cell cycle, cytoskeleton, and intracellular transport. In particular, the gene expression data pinpointed alterations in GABAergic pathway. Electrophysiological recordings from Cstb 2/2 cerebellar Purkinje cells revealed a shift of the balance towards decreased inhibition, yet the amount of inhibitory interneurons was not declined in young animals. Instead, we found diminished number of GABAergic terminals and reduced ligand binding to GABA A receptors in Cstb 2/2 cerebellum. These results suggest that alterations in GABAergic signaling could result in reduced inhibition in Cstb 2/2 cerebellum leading to the hyperexcitable phenotype of Cstb 2/2 mice. At P30, the microarray data revealed a marked upregulation of immune and defense response genes, compatible with the previously reported early glial activation that precedes neuronal degeneration. This further implies the role of early-onset neuroinflammation in the pathogenesis of EPM1. Citation: Joensuu T, Tegelberg S, Reinmaa E, Segerstra ˚le M, Hakala P, et al. (2014) Gene Expression Alterations in the Cerebellum and Granule Neurons of Cstb 2/2 Mouse Are Associated with Early Synaptic Changes and Inflammation. PLoS ONE 9(2): e89321. doi:10.1371/journal.pone.0089321 Editor: Pedro Gonzalez-Alegre, University of Iowa Carver College of Medicine, United States of America Received October 9, 2013; Accepted January 17, 2014; Published February 26, 2014 Copyright: ß 2014 Joensuu et al. This is an open-access article distributed under the terms of the Creative Commons Attribution License, which permits unrestricted use, distribution, and reproduction in any medium, provided the original author and source are credited. Funding: This study was funded by the Folkha ¨lsan Research Foundation, the Sigrid Juse ´ lius Foundation (http://www.sigridjuselius.fi/foundation) and the Academy of Finland (grant # 137950) (http://www.aka.fi/en-GB/A/). The funders had no role in study design, data collection and analysis, decision to publish, or preparation of the manuscript. Competing Interests: The authors have declared that no competing interests exist. * E-mail: [email protected] . These authors contributed equally to this work. ¤ Current address: Department of Biotechnology, Institute of Molecular and Cell Biology and Estonian Genome Center, University of Tartu, Tartu, Estonia Introduction Progressive myoclonus epilepsy of Unverricht-Lundborg type (EPM1, OMIM 254800) is an autosomal recessively inherited neurodegenerative disease characterized by stimulus-sensitive myoclonus, tonic-clonic seizures and ataxia with the disease onset at 6–16 years of age [1]. While epileptic seizures are usually well controlled with medication, myoclonus is resistant to treatment and severely incapacitating. EPM1 is caused by loss-of-function mutations in the cystatin B gene (CSTB), the most common of which is an expansion of a dodecamer repeat in the promoter region of the gene [2,3]. A mouse model for the disease, the Cstb- deficient (Cstb 2/2 ) mouse, presents with many of the clinical features of EPM1, especially myoclonus starting at the age of 1 month and progressive ataxia manifesting around 6 months of age [4]. One of the major neuropathological phenotypes in Cstb 2/2 mice is a severe loss of cerebellar granule neurons due to apoptotic death. Cerebella of Cstb 2/2 mice also show oxidative damage, reflected by depletion of antioxidants and increased lipid peroxidation [5]. Moreover, we recently reported striking, early microglial activation in Cstb 2/2 brain, which precedes the emergence of myoclonus and is followed by widespread astroglial activation and selective neuronal loss [6]. CSTB is a cysteine protease inhibitor that controls the activity of lysosomal cysteine cathepsins. Cathepsin activity has been found to be increased in EPM1 patient lymphoblastoid cells [7]. In Cstb 2/2 mice, cathepsin B has been shown to mediate the increased sensitivity to oxidative stress -induced cell death [5] and cathepsin removal or inhibition by other means to ameliorate the neurodegenerative phenotype of Cstb 2/2 mice [8,9]. Yet, the PLOS ONE | www.plosone.org 1 February 2014 | Volume 9 | Issue 2 | e89321
Transcript of Gene Expression Alterations in the Cerebellum and Granule ...

Gene Expression Alterations in the Cerebellum andGranule Neurons of Cstb2/2 Mouse Are Associated withEarly Synaptic Changes and InflammationTarja Joensuu1,2,3*., Saara Tegelberg1,2,3., Eva Reinmaa1¤, Mikael Segerstrale3,4,5, Paula Hakala1,2,3,
Heidi Pehkonen6, Esa R. Korpi6, Jaana Tyynela7, Tomi Taira3,5, Iiris Hovatta4,8, Outi Kopra1,2,3,
Anna-Elina Lehesjoki1,2,3
1 Folkhalsan Institute of Genetics, Helsinki, Finland, 2 Department of Medical Genetics, Haartman Institute and Research Programs Unit, Molecular Neurology, University of
Helsinki, Helsinki, Finland, 3 Neuroscience Center, University of Helsinki, Helsinki, Finland, 4 Department of Biosciences, Faculty of Biological and Environmental Sciences,
University of Helsinki, Helsinki, Finland, 5 Department of Veterinary Biosciences, Faculty of Veterinary Medicine, University of Helsinki, Helsinki, Finland, 6 Institute of
Biomedicine, Pharmacology, University of Helsinki, Helsinki, Finland, 7 Institute of Biomedicine, Biochemistry and Developmental Biology, University of Helsinki, Helsinki,
Finland, 8 Mental Health and Substance Abuse Services, National Institute for Health and Welfare, Helsinki, Finland
Abstract
Progressive myoclonus epilepsy of Unverricht-Lundborg type (EPM1) is an autosomal recessively inherited neurodegen-erative disease, manifesting with myoclonus, seizures and ataxia, caused by mutations in the cystatin B (CSTB) gene. Withthe aim of understanding the molecular basis of pathogenetic events in EPM1 we characterized gene expression changes inthe cerebella of pre-symptomatic postnatal day 7 (P7) and symptomatic P30 cystatin B -deficient (Cstb2/2) mice, a model forthe disease, and in cultured Cstb2/2 cerebellar granule cells using a pathway-based approach. Differentially expressed genesin P7 cerebella were connected to synaptic function and plasticity, and in cultured cerebellar granule cells, to cell cycle,cytoskeleton, and intracellular transport. In particular, the gene expression data pinpointed alterations in GABAergicpathway. Electrophysiological recordings from Cstb2/2 cerebellar Purkinje cells revealed a shift of the balance towardsdecreased inhibition, yet the amount of inhibitory interneurons was not declined in young animals. Instead, we founddiminished number of GABAergic terminals and reduced ligand binding to GABAA receptors in Cstb2/2 cerebellum. Theseresults suggest that alterations in GABAergic signaling could result in reduced inhibition in Cstb2/2 cerebellum leading tothe hyperexcitable phenotype of Cstb2/2 mice. At P30, the microarray data revealed a marked upregulation of immune anddefense response genes, compatible with the previously reported early glial activation that precedes neuronaldegeneration. This further implies the role of early-onset neuroinflammation in the pathogenesis of EPM1.
Citation: Joensuu T, Tegelberg S, Reinmaa E, Segerstrale M, Hakala P, et al. (2014) Gene Expression Alterations in the Cerebellum and Granule Neurons of Cstb2/2
Mouse Are Associated with Early Synaptic Changes and Inflammation. PLoS ONE 9(2): e89321. doi:10.1371/journal.pone.0089321
Editor: Pedro Gonzalez-Alegre, University of Iowa Carver College of Medicine, United States of America
Received October 9, 2013; Accepted January 17, 2014; Published February 26, 2014
Copyright: � 2014 Joensuu et al. This is an open-access article distributed under the terms of the Creative Commons Attribution License, which permitsunrestricted use, distribution, and reproduction in any medium, provided the original author and source are credited.
Funding: This study was funded by the Folkhalsan Research Foundation, the Sigrid Juselius Foundation (http://www.sigridjuselius.fi/foundation) and theAcademy of Finland (grant # 137950) (http://www.aka.fi/en-GB/A/). The funders had no role in study design, data collection and analysis, decision to publish, orpreparation of the manuscript.
Competing Interests: The authors have declared that no competing interests exist.
* E-mail: [email protected]
. These authors contributed equally to this work.
¤ Current address: Department of Biotechnology, Institute of Molecular and Cell Biology and Estonian Genome Center, University of Tartu, Tartu, Estonia
Introduction
Progressive myoclonus epilepsy of Unverricht-Lundborg type
(EPM1, OMIM 254800) is an autosomal recessively inherited
neurodegenerative disease characterized by stimulus-sensitive
myoclonus, tonic-clonic seizures and ataxia with the disease onset
at 6–16 years of age [1]. While epileptic seizures are usually well
controlled with medication, myoclonus is resistant to treatment
and severely incapacitating. EPM1 is caused by loss-of-function
mutations in the cystatin B gene (CSTB), the most common of
which is an expansion of a dodecamer repeat in the promoter
region of the gene [2,3]. A mouse model for the disease, the Cstb-
deficient (Cstb2/2) mouse, presents with many of the clinical
features of EPM1, especially myoclonus starting at the age of 1
month and progressive ataxia manifesting around 6 months of age
[4]. One of the major neuropathological phenotypes in Cstb2/2
mice is a severe loss of cerebellar granule neurons due to apoptotic
death. Cerebella of Cstb2/2 mice also show oxidative damage,
reflected by depletion of antioxidants and increased lipid
peroxidation [5]. Moreover, we recently reported striking, early
microglial activation in Cstb2/2 brain, which precedes the
emergence of myoclonus and is followed by widespread astroglial
activation and selective neuronal loss [6].
CSTB is a cysteine protease inhibitor that controls the activity of
lysosomal cysteine cathepsins. Cathepsin activity has been found to
be increased in EPM1 patient lymphoblastoid cells [7]. In Cstb2/2
mice, cathepsin B has been shown to mediate the increased
sensitivity to oxidative stress -induced cell death [5] and cathepsin
removal or inhibition by other means to ameliorate the
neurodegenerative phenotype of Cstb2/2 mice [8,9]. Yet, the
PLOS ONE | www.plosone.org 1 February 2014 | Volume 9 | Issue 2 | e89321
molecular mechanisms leading to EPM1 are still largely unknown
and it is possible that CSTB has functions independent of
cathepsins.
The changes in gene expression patterns may reveal dysregu-
lated pathways and functional cascades causative for pathological
processes. A previous array-based approach to study differentially
expressed genes in aged, fully symptomatic 8-month-old Cstb2/2
mice revealed changes in genes related to glial activation and
immunological pathways, reflecting the advanced pathological
state of Cstb2/2 brain at that age [10]. However, we recently
reported pathological changes in Cstb2/2 mice that begin with
intense microglial activation already at 2 weeks of age, prior to the
appearance of the first clinical symptom, myoclonus [6]. To
further understand the molecular processes involved in EPM1, we
used cerebellum as a model system and generated microarray-
based gene expression patterns from immature pre-symptomatic
and young symptomatic cerebella and cultured cerebellar granule
cells of Cstb2/2 mice. Gene Ontology (GO) analysis of expression
changes in presymptomatic mice highlighted disruption in
synaptogenesis and in synaptic function and maintenance, and
in symptomatic mice, in immune and defense response genes.
Consequences in synaptic function were characterized using
electrophysiological and ligand-binding analyses along with
immunohistological studies in neurons and cerebellar tissue of
Cstb2/2 and control mice. Conclusively, these experiments suggest
that alterations in GABAergic signaling accompanied with early-
onset neuroinflammation in Cstb2/2 mice are essential contribu-
tors in the pathogenesis of EPM1.
Methods
Ethics statementThe Animal Ethics Committee of the State Provincial Office of
Southern Finland approved all animal research protocols (deci-
sions ESLH-2005-00507/Ym-23, ESLH-2007-05788/Ym-23,
ESAVI-2010-07744/Ym-23).
AnimalsCstb2/2 mice were obtained from The Jackson Laboratory (Bar
Harbor, ME; 129-Cstbtm1Rm/SvJ; stock #003486) [4]. Wild type
littermates were used as controls.
RNA isolation and microarray hybridizationRNA isolation for microarray hybridization and real-time
quantitative PCR (qPCR) were done from cerebella of P7 (n = 5
per genotype for hybridization, n = 10 per genotype for qPCR,
males and females) and P30 (n = 3 per genotype for hybridization,
all males) Cstb2/2 and control mice, as well as from cultured
cerebellar granule neurons dissected from P5 Cstb2/2 and control
mice (n = 5 per genotype for hybridization, males and females).
Mice were anesthetized with CO2 and sacrificed by decapitation.
The dissected cerebella were homogenized using Lysing Matrix D
tubes (Qbiogene, Carlsbad, CA, USA) and FastPrepH FP120
Instrument (Qbiogene, Carlsbad, CA, USA) with Proteinase K
digestion (20 mg/ml, .30 U/mg, Finnzymes, Espoo, Finland)
according to the manufacturer’s instructions. Cerebellar granule
cell cultures were prepared as described [11] and cultured for two
days in vitro (2 DIV). Proliferation of glial cells was prevented by
addition of 10 mM cytosine 1-b-d-arabinofuranoside (Sigma, St.
Louis, MO, USA) 16–20 h after plating. Cultures were controlled
for neuron health and morphology as well as for glial content.
Total RNA was extracted using the ABI Prism 6100 Nucleic Acid
PrepStation (Applied Biosystems, Foster City, CA, USA) from
cerebella and PerfectPure RNA Cultured Cell kit (5 PRIME
GmbH, Hamburg, Germany) from cerebellar granule cells
according to the manufacturer’s instructions. RNA purity was
confirmed by spectrophotometer and integrity by Agilent 2100
Bioanalyzer (Agilent Technologies, Palo Alto, CA, USA). The
subsequent sample preparation and hybridization of each cRNAs
on GeneChipH Mouse Genome 430 2.0 arrays (Affymetrix, Santa
Clara, CA, USA) were performed in Helsinki Biomedicum
Biochip Center (Finland).
Microarray data analysisThe quality control of each microarray was carried out by the
Affymetrix GeneChipH Operating Software (GCOS) v1.4 (Affy-
metrix Inc., Santa Clara, CA, USA), and the raw data were
imported to GeneSpring GX software (Silicon Genetics, Incorpo-
rated, Redwood City, CA, USA). Expression signal values were
generated using the RMA (Robust Multiarray Average) algorithm
[12] for background adjustment, quantile-normalization and
summarization. For the normalization, the median expression
level of a given gene across all samples (per gene normalization)
was used. The data were interpreted from groups of replicate
samples from the same experimental condition, and viewed in the
log-of-ratio mode. Principal component analysis was performed as
a second quality control at the sample level to evaluate grouping of
the samples within the same genotype close to each other. All
samples, except two from P7 mice (one from both genotypes) and
one from P5 + 2 DIV Cstb2/2 cerebellar granule cells, were used
for the final data analysis. Filtering of the probe sets was based on
the expression with lower and upper cutoff 20 and 100 percentile
and on the fold-change (FC) with cutoff 1.3. In overall statistics of
differentially expressed genes, t-test unpaired equal variance with
corrected p,0.05 (cerebella) and p,0.01 (cerebellar granule cells)
with Benjamini-Hochberg multiple testing correction was used.
Hierarchical clustering analysis based on gender and genotype was
performed for the differentially expressed genes of P7 Cstb2/2
mice and P5 + 2 DIV Cstb2/2 cerebellar granule cells. The
genotype was the most descriptive, and the samples did not cluster
according to gender (data not shown).
Web-based tool WebGestalt [13] (http://bioinfo.vanderbilt.
edu/webgestalt/) and Ingenuity Systems Pathway Analysis (IPA)
(Ingenuity System Incorporated, Redwood City, CA, USA;
http://www.ingenuity.com/) were used in parallel to interpret
the differentially expressed genes in the context of biological,
molecular and cellular functions. Only gene ontology (GO)
categories with at least two terms were considered and the
significance of enrichment of genes in each category (p-value) was
calculated using hypergeometric test adjusted for multiple testing
using the Benjamini-Hochberg method. The microarray data are
available in the Gene Expression Omnibus (GEO) database http://
www.ncbi.nlm.nih.gov/geo/query/acc.cgi?acc = GSE47516.
Real-time quantitative PCRDNase (TURBOTM; AmbionH, Austin, TX, USA) treated total
RNA was reverse transcribed to cDNA (iScript cDNA Synthesis
Kit; BioRad Laboratories, Berkeley, CA, USA) and quantified by
qPCR on the ABI Prism 7000 Sequence Detection System
(Applied Biosystems, Foster City, CA, USA) using TaqmanH Gene
Expression Assays (GABAA receptor d (Gabrd), Mm01227754_m1,
and GABAA receptor a6 (Gabra6), Mm01266203_g1) with
TaqmanH PCR master mix (Applied Biosystems, Foster City,
CA, USA). TATA-box binding protein (Tbp, Mm00446973_m1)
was used as an endogenous control. All reactions were prepared in
duplicate and three separate runs were prepared for each sample.
The mean expression level of samples was compared to mean
expression level of control mice and calculated as FC of the
Gene Expression Alterations in Cstb2/2 Mouse
PLOS ONE | www.plosone.org 2 February 2014 | Volume 9 | Issue 2 | e89321

controls (6 SE). The data were calculated by standard-curve
method with DataAssist software Version 3.01 (Applied Biosys-
tems, Foster City, CA, USA) and Student’s t-test with p,0.05
considered as statistically significant.
Western blot analysesCerebella of P7 and P30 Cstb2/2 and control mice (n = 3 per
genotype) were lysed with 50 mM Tris (pH 8.0), 0.5% Nonidet P-
40, 10% glycerol, 0.1 mM EDTA, 250 mM NaCl, 0.1 mM
Na3VO4, 50 mM NaF, 4 mM dithiothreitol (DTT), 16 Protein
inhibitor cocktail (Roche, Basel, Switzerland) using Lysing Matrix
D tubes (Qbiogene, Carlsbad, CA, USA) and FastPrepH FP120
Instrument (Qbiogene, Carlsbad, CA, USA). Lysed proteins
(15 mg) were separated with Protean TGX precast gels (Bio-Rad
Laboratories, Hercules, CA, USA) and transferred on the
nitrocellulose membrane. The primary antibodies used were
rabbit anti-rat GABRA6 (1:1000) (Synaptic Systems, Gottingen,
Germany) and mouse anti-rat b-tubulin (1:10 000) (Sigma, St.
Louis, MO, USA), and the secondary antibodies used were anti-
rabbit-IRDye 800CW (1:10 000) (LI-COR Biosciences, Lincoln,
NE, USA) and anti-mouse-Alexa Fluor 680 (1:10 000) (Invitro-
genH, Life Technologies, Carlsbad, CA, USA). The bands were
detected with Odyssey infrared reader (LI-COR Biosciences,
Lincoln, NE, USA). Signal intensities were detected with Image
Studio 3.1 (LI-COR Biosciences, Lincoln, NE, USA) and
normalized to the intensity of b-tubulin.
ElectrophysiologyBrains from P7 Cstb2/2 and control mice (n = 7-10 per
genotype) were dissected in ice-cold 124 mM NaCl, 3 mM KCl,
1.25 mM NaH2PO4, 10 mM MgSO4, 26 mM NaHCO3,
10–15 mM D-glucose, 1 mM CaCl2, saturated with 5% CO2/
95% O2. Cerebellar slices (350 mm) were cut horizontally with a
vibratome (Vibratome Co., St. Louis, MO, USA) in the above
solution and stored at room temperature in 124 mM NaCl, 3 mM
KCl, 1.25 mM NaH2PO4, 4 mM MgSO4, 26 mM NaHCO3,
10–15 mM D-glucose, 1 mM CaCl2, saturated with 5% CO2/
95% O2. The slices were used 1–4 h after cutting.
For electrophysiological recordings the slices were placed in a
submerged chamber and superfused with artificial cerebrospinal
fluid (ACSF): 124 mM NaCl, 3 mM KCl, 1.25 mM NaH2PO4,
1 mM MgSO4, 26 mM NaHCO3, 15 mM D-glucose, 2 mM
CaCl2, saturated with 5% CO2/95% O2, at a rate of 2–3 ml/min
(32uC). Whole-cell recordings were obtained from Purkinje cells
using the Multiclamp 700B amplifier (Molecular Devices,
Sunnyvale, CA, USA). Cells were voltage-clamped at 0 mV with
4–5 MV pipettes filled with 135 mM CsMeSO4, 10 mM Hepes,
0.5 mM EGTA, 4 mM Mg-ATP, 0.3 mM Na-GTP and 2 mM
NaCl (285 mOsm), pH 7.2. At 0 mV GABAergic currents were
seen as outward and glutamatergic currents as inward. Recordings
where access resistance was higher than 25 MV were discarded.
Axoscope 10.2 (Molecular Devices, Sunnyvale, CA, USA) was
used for data acquisition. Offline analysis was done using
MiniAnalysis 6.0.7 program (Synaptosoft, GA, USA). Spontane-
ous events were detected using peak detector algorithm, and all
events were confirmed visually. The chi-square test and two-tailed
Student’s t-test were used for statistical analysis (GraphPad Prism
5.0c; GraphPad Software, La Jolla, CA, USA) with p,0.05
considered as statistically significant.
ImmunohistochemistryUnder terminal anesthesia induced with pentobarbital
(80–150 mg/kg, Mebunat Vet, Orion, Finland) the mice (P7,
P14, P20 and P30, n = 4–5 per genotype) were immersiofixed (P7)
or intracardially perfusion fixed (P14, P20, P30) with 4%
paraformaldehyde. Brains were dissected and postfixed with 4%
paraformaldehyde for one week. Paraffin sections (8 mm) were
dewaxed with xylene and descending series of alcohol. Antigen
retrieval was performed by lightly boiling sections in 10 mM
sodium citrate, 0.05% Tween-20, pH 6.0 for 20 min, followed by
cooling at RT for 30 min. Sections were blocked with 5% FCS,
0.1% Triton X-100 in PBS and primary antibody diluted to 1%
FCS in PBS was incubated overnight.
Cultured cerebellar granule cells growing on coverslips were
fixed with 4% paraformaldehyde for 15 min and permeabilized
with 0.1% Triton X-100 in PBS for 10 min. Coverslips were
blocked with 10% FCS in PBS and primary antibody diluted to
1% FCS in PBS was incubated overnight.
Secondary antibodies were diluted to 1% FCS in PBS and
incubated for 30 min. Nuclei were counter stained with 1 ng/ml
Hoechst 33258 (Molecular ProbesH, Life Technologies, Carlsbad,
CA, USA).
For stereological analysis of interneurons, mice were euthanized
at P14 (n = 3 per genotype) and P30 (n = 6 per genotype). Brains
were removed, bisected along the midline and immersion fixed in
4% paraformaldehyde for one week before cryoprotection in 30%
sucrose in TBS containing 0.05% sodium azide. Frozen sagittal
sections of 40 mm were cut through the brains and collected as
series in cryoprotectant solution (30% ethylene glycol, 15%
sucrose, 0.05% sodium azide in TBS). One-in-six series of free-
floating sections were immunostained with anti-parvalbumin (P14)
or Nissl stained (P30) as described previously [14].
The specificity of all immunostainings was verified by controls
in which the primary antibody was omitted.
Antibodies for immunohistochemistryMouse anti-carp parvalbumin (1:5000) (Swant, Marly, Switzer-
land); rabbit-anti-GABA (1:250) (Sigma, St. Louis, MO, USA);
rabbit anti-human synapsin 1 (1:200) (Cell Signaling Technology,
Danvers, MA, USA); mouse anti-rat vesicular GABA transporter
(VGAT, 1:500), rabbit anti-rat gephyrin (1:500), rabbit anti-rat
GABRA6 (1:500), rabbit anti-rat vesicular glutamate transporters
1 (VGLUT1, 1:250) and 2 (VGLUT2, 1:250) (Synaptic Systems,
Gottingen, Germany).
Secondary antibodies were as follows: anti-mouse-Alexa Fluor
564, anti-rabbit-Alexa Fluor 564, anti-mouse-Alexa Fluor 488,
anti-rabbit-Alexa Fluor 488 (1:200) (InvitrogenH, Life Technolo-
gies, Carlsbad, CA, USA).
Counts of interneuron numberStereoInvestigator software (Microbrightfield, Inc, Williston,
VT, USA) was used to obtain unbiased optical fractionator
estimates of interneuron number in molecular layer of cerebellum
from parvalbumin (P14) and Nissl (P30) stained 40 mm sections.
Parvalbumin was used for P14 as at this age molecular layer still
contains migrating granule cells that are difficult to reliably
differentiate from interneurons in Nissl stain. All neuronal cell
bodies on molecular layer of P30 mice were considered to be
interneurons in Nissl stained sections. Measurements were
performed as described previously [15]. The cut section thickness
was nominally 40 mm, but after mounting and dehydration the
actual thickness of sections was 15 mm. The optical fractionator
was run using a guard height of 0.5 mm at both the top and bottom
of the section, meaning that the actual depth of the fractionator
was 14 mm. The following sampling scheme was used: grid area 30
625 mm2, frame area 2 400 mm2. The data were expressed as
mean neuron number 6 standard error (SE). The unpaired
Student’s t-test was used for statistical analysis (GraphPad Prism
Gene Expression Alterations in Cstb2/2 Mouse
PLOS ONE | www.plosone.org 3 February 2014 | Volume 9 | Issue 2 | e89321

5.0c; GraphPad Software, La Jolla, CA, USA)) with p,0.05
considered as statistically significant. The mean coefficient of error
for all individual optical fractionator estimates was calculated
according to the method of Gundersen and Jensen [16] and was
less than 0.07 in all of the analyses.
Analysis of synapses by puncta analyzerSynapses were analyzed with Puncta analyser plug-in for
ImageJ (1.28u; NIH, Bethesda, MD, USA) as described [17].
Maximum intensity projections of confocal microscopy images
(Zeiss LSM 510 Meta/LSM 780, Oberkochen, Germany) from 5
areas per cerebellum, 4–5 animals per group were quantified for
the number of synaptic puncta using markers VGAT, VGLUT1,
VGLUT2, GABRA6, synapsin 1 and gephyrin. Colocalization of
these puncta was also analyzed. The areas analyzed covered
different lobules of the cerebellum and were the same in all
analyses and animals. The data were expressed as mean puncta
number compared to control 6 SE. The unpaired Student’s t-test
was used for statistical analysis (GraphPad Prism 5.0c; GraphPad
Software, La Jolla, CA, USA)) with p,0.05 considered as
statistically significant.
Autoradiography of GABAA receptor ligand binding sitesBrains from P7 and P30 Cstb2/2 and control mice (n = 3-4 per
genotype) were dissected and frozen in ethanol-isopentane-bath.
Sagittal 14 mm thick cryostat sections were mounted on gelatin-
chrome alum coated slides. Autoradiographic procedures have
been described previously in detail [18,19].
For [3H]muscimol binding to GABA agonist sites, sections were
preincubated for 15 min in an ice–water bath in 0.17 M Tris-HCl
(pH 7.4). The final incubation in the same buffer was performed
with 15 nM [3H]muscimol (Perkin-Elmer, Waltham, MA, USA) at
4uC for 30 min. Nonspecific binding was determined with 100 mM
GABA (Sigma, St. Louis, MO, USA). After incubation, the
sections were washed in ice-cold incubation buffer twice for 30 s,
dipped in distilled water and dried in airflow at room temperature.
For [3H]Ro15-4513 binding to benzodiazepine sites of the
GABAA receptors, sections were preincubated for 15 min in an
ice-water bath in 50 mM Tris–HCl, 120 mM NaCl (pH 7.4). The
final incubation in the same buffer was performed with 15 nM
[3H]Ro15-4513 (Perkin-Elmer, Waltham, MA, USA) at 4uC for
60 min. Nonspecific binding was determined with 10 mM Ro15-
1788 (flumazenil; Tocris, Bristol, UK). To detect a-6 subunit
containing GABAA receptors [20], other GABAA receptor
subtypes were blocked with 10 mM diazepam (Sigma, St. Louis,
MO, USA). After incubation, the sections were washed with ice-
cold incubation buffer for 2660 s, dipped in distilled water and
dried in airflow at room temperature.
The sections were exposed with [3H]-plastic standards (GE
Healthcare, Little Chalfont, UK) to Kodak Biomax MR films
(Eastman Kodak, Rochester, NY, USA) for 2 months. For
quantification of binding densities, the imaging plates were
analyzed with ImageJ (1.44; NIH, Bethesda, MD, USA) and the
data were expressed as mean radioactivity levels (nCi/mg) 6 SE
with reference to [3H]-standards. The unpaired Student’s t-test
was used for statistical analysis (GraphPad Prism 5.0c; GraphPad
Software, La Jolla, CA, USA)) with p,0.05 considered as
statistically significant.
Results
Altered expression of synaptic genes in Cstb2/2 mousecerebellum at postnatal day 7
The genomewide microarray analysis of P7 cerebella from
Cstb2/2 mice revealed 82 differentially expressed probe sets within
61 genes, of which 30 probe sets were upregulated and 52 were
downregulated (Table S1 in File S1). The over-represented GO
categories are summarized in Table 1 (see also Table S2 in File S1
for complete gene lists within the GO categories). The analyses of
molecular and biological function revealed altered expression of
genes associated with ion homeostasis, neural networks, neural
system development, synaptic function and plasticity, of which
GABAA receptor subunits Gabrd and Gabra6 were upregulated.
The GO analyses also indicated subtle expression changes of other
synaptic genes, such as downregulation of the axon guidance
receptor, EPH receptor A7 (Epha7), and the cue, slit homolog 2
(Drosophila) (Slit2). Furthermore, categories within biological
processes indicated decreased expression of calcium-dependent
synaptic protocadherin beta cluster genes (Pcdhb22, Pcdhb16,
Pcdhb17). In GO classification of cellular components, the products
of the differentially expressed genes encoded components of ion
channel complexes at cell membranes, but also proteins localized
to cellular projections and to transport vesicles.
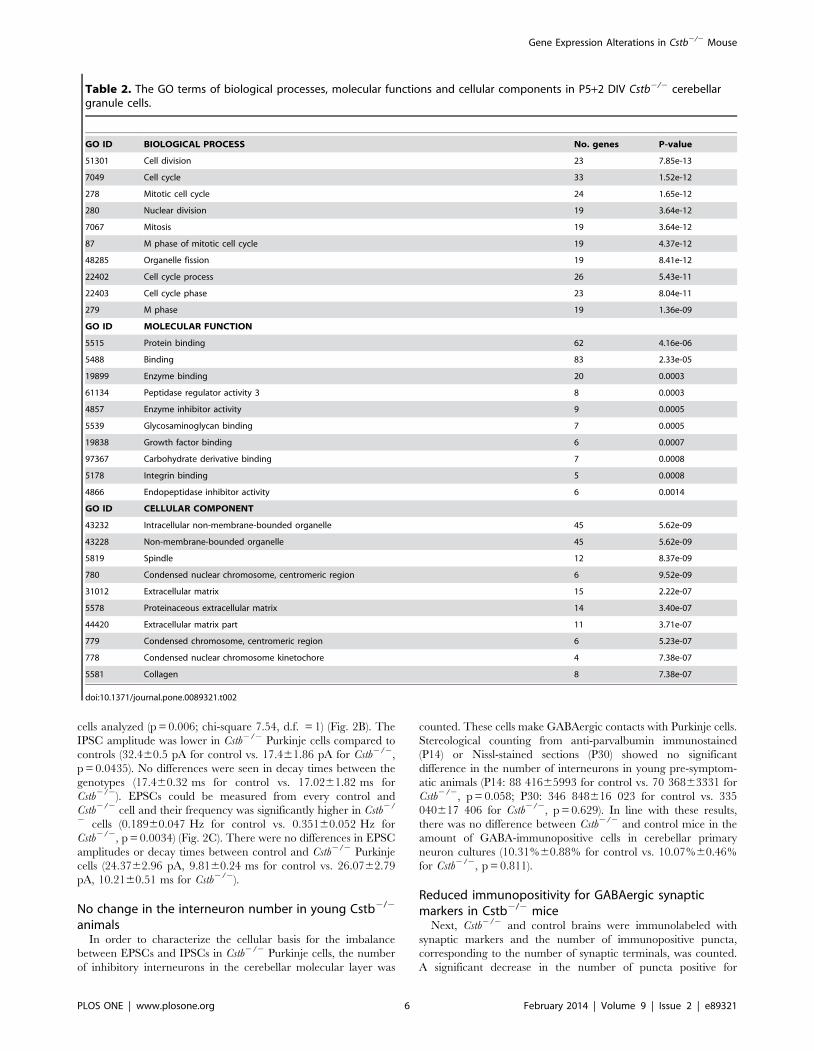
Altered expression of genes involved in cellularbiogenesis in Cstb2/2 mouse cerebellar granule cells
To get insight into the gene expression changes in neurons, GO
categories of 140 differentially expressed probe sets which
correspond to 114 known genes were investigated from Cstb2/2
cerebellar granule cells (Table 2, see also Table S3 in File S1 for
complete gene lists within the GO categories). Of these, 128 probe
sets were upregulated and 12 downregulated (Table S4 in File S1).
Biological processes comprised a number of upregulated genes
involved in cell cycle, division and growth, e.g. cell division cycle
protein 20 homolog (Cdc20) and its post-translational modifier,
mitotic checkpoint serine/threonine-protein kinase (Bub1). Differ-
entially expressed genes linked to cellular architecture, such as
genes of kinesin-like protein family (Kif2c, Kif8a, Kif22, Kif11) were
also detected. Categories of molecular function further indicated
an increased expression of growth factors of the CCN family
proteins (Cyr61/CCN1, Ctgf/CCN2, Wisp1/CCN4), calcium-depen-
dent annexins (Anxa1, Anxa2, Anxa5) and protease inhibitors
(Timp3, Serpine1, Serpinh1), as well as upregulation of several
collagen type genes (Col1a2, Col3a1, Col4a2, Col6a3). In concor-
dance with the gene function, protein products of majority of the
differentially expressed genes localized into nucleus, although gene
products associated with cytoskeleton and extracellular matrix
were also revealed.
Altered expression of immune and defense system genesin Cstb2/2 mouse cerebellum at postnatal day 30
In P30 cerebella, a total of 82 probe sets corresponding to 67
known genes showed altered expression in Cstb2/2 mice. Of these
the majority, 77 probe sets were upregulated, and only five probe
sets were downregulated (Table S5 in File S1). Functionally related
genes belonging to over-represented GO categories are outlined in
Table 3 (see also Table S6 in File S1 for complete gene lists within
the GO categories). According to biological processes and
molecular function, some of the gene expression patterns predicted
changes that were proapoptotic, while others seemed to predict
cell survival. Most of the upregulated genes were present in
complement pathway and were related to immune and defense
Gene Expression Alterations in Cstb2/2 Mouse
PLOS ONE | www.plosone.org 4 February 2014 | Volume 9 | Issue 2 | e89321

response, antigen processing and presentation, cellular stress,
cytokine biosynthesis, cell-to-cell signaling and immune cell
trafficking, as well as to receptor activity through polysaccharide-
, lipid-, immunoglobulin- or protein complex binding. Examples of
such genes are complement components and their receptors (C1qa,
C1qb, C1qc, C4b, C3ar1), MHC class 1 molecule, b2-microglobulin
(B2m), glial fibrillary acidic protein (Gfap), chemokine ligands
(Cxcl13, Ccl6), immunoglobulin receptors (Fcgr3, Fcer1g), and cluster
of differentiation antigens (CD14, CD44, CD48, CD52). Several
proteins coded by the dysregulated genes resided in the integral
part of the plasma membrane or were extracellular, while some of
the upregulated gene products were prominent to lytic vacuoles,
such as hexosaminidase B (Hexb), cathepsin D (Ctsd), cathepsin H
(Ctsh), CD68 antigen (Cd68), and glucuronidase beta (Gusb).
Validation of gene expression changes by real-timequantitative PCR
As gene expression profiling from P7 Cstb2/2 cerebellum
implied changes in neuronal functions that could be related to the
hyperexcitability and the motor symptoms characteristic for
EPM1, the altered GABAergic signaling pathway was selected
for further characterization. The differential expression of Gabra6
and Gabrd observed in P7 Cstb2/2 cerebellum was first validated
by qPCR. Concordant with the microarray data, increase in
expression of Gabrd (FC = 1.7060.2505, p = 0.0144) and Gabra6
(FC = 1.72260.2664, p = 0.0174) compared to the control mice
was detected (Fig. 1).
Reduced GABAergic inhibition in Cstb2/2 cerebellumNext, to study the balance between excitation and inhibition in
Cstb2/2 mouse cerebellum, the occurrence of spontaneous
excitatory and inhibitory post-synaptic currents (EPSCs and
IPSCs) was measured in the somatic area of Cstb2/2 and control
Purkinje cells, the output neurons from the cerebellar cortex
(Fig. 2A). IPSCs could be recorded in seven out of nine control
cells, whereas IPSCs were seen only in three out of ten Cstb2/2
cells (p = 0.037; chi-square 4.34, d.f. = 1) (Fig. 2B). Further,
the IPSC frequency in Cstb2/2 cells was lower than in control
cells although this did not reach statistical significance
(0.23860.125 Hz for control vs. 0.05460.0204 Hz for Cstb2/2,
p = 0.397). Moreover, bursts of synchronous IPSCs seen in five out
of nine control cells, were not observed in any of the ten Cstb2/2
Table 1. The GO terms of biological processes, molecular functions and cellular components in P7 Cstb2/2 cerebellum.
GO ID BIOLOGICAL PROCESS No. genes P-value
50919 Negative chemotaxis 2 0.0706
10763 Positive regulation of fibroblast migration 2 0.0706
10762 Regulation of fibroblast migration 2 0.0706
21954 Central nervous system neuron development 3 0.0706
22610 Biological adhesion 9 0.0706
21884 Forebrain neuron development 2 0.0706
7155 Cell adhesion 9 0.0706
31290 Retinal ganglion cell axon guidance 2 0.0755
16572 Histone phosphorylation 2 0.0769
42325 Regulation of phosphorylation 8 0.0769
GO ID MOLECULAR FUNCTION
45499 Chemorepellent activity 2 0.0067
16917 GABA receptor activity 2 0.0555
15662 ATPase activity, coupled to transmembrane movement of ions, phosphorylative mechanism 2 0.1391
4175 Endopeptidase activity 4 0.1391
15108 Chloride transmembrane transporter activity 2 0.1391
15399 Primary active transmembrane transporter activity 2 0.1391
4222 Metalloendopeptidase activity 2 0.1391
5254 Chloride channel activity 2 0.1391
GO ID CELLULAR COMPONENT
44297 Cell body 7 0.0279
42995 Cell projection 11 0.0341
30133 Transport vesicle 3 0.0341
71944 Cell periphery 19 0.0341
43005 Neuron projection 8 0.0341
5886 Plasma membrane 19 0.0341
97060 Synaptic membrane 4 0.0478
5657 Replication fork 2 0.0686
43025 Neuronal cell body 5 0.0734
42734 Presynaptic membrane 2 0.0760
doi:10.1371/journal.pone.0089321.t001
Gene Expression Alterations in Cstb2/2 Mouse
PLOS ONE | www.plosone.org 5 February 2014 | Volume 9 | Issue 2 | e89321
cells analyzed (p = 0.006; chi-square 7.54, d.f. = 1) (Fig. 2B). The
IPSC amplitude was lower in Cstb2/2 Purkinje cells compared to
controls (32.460.5 pA for control vs. 17.461.86 pA for Cstb2/2,
p = 0.0435). No differences were seen in decay times between the
genotypes (17.460.32 ms for control vs. 17.0261.82 ms for
Cstb2/2). EPSCs could be measured from every control and
Cstb2/2 cell and their frequency was significantly higher in Cstb2/
2 cells (0.18960.047 Hz for control vs. 0.35160.052 Hz for
Cstb2/2, p = 0.0034) (Fig. 2C). There were no differences in EPSC
amplitudes or decay times between control and Cstb2/2 Purkinje
cells (24.3762.96 pA, 9.8160.24 ms for control vs. 26.0762.79
pA, 10.2160.51 ms for Cstb2/2).
No change in the interneuron number in young Cstb2/2
animalsIn order to characterize the cellular basis for the imbalance
between EPSCs and IPSCs in Cstb2/2 Purkinje cells, the number
of inhibitory interneurons in the cerebellar molecular layer was
counted. These cells make GABAergic contacts with Purkinje cells.
Stereological counting from anti-parvalbumin immunostained
(P14) or Nissl-stained sections (P30) showed no significant
difference in the number of interneurons in young pre-symptom-
atic animals (P14: 88 41665993 for control vs. 70 36863331 for
Cstb2/2, p = 0.058; P30: 346 848616 023 for control vs. 335
040617 406 for Cstb2/2, p = 0.629). In line with these results,
there was no difference between Cstb2/2 and control mice in the
amount of GABA-immunopositive cells in cerebellar primary
neuron cultures (10.31%60.88% for control vs. 10.07%60.46%
for Cstb2/2, p = 0.811).
Reduced immunopositivity for GABAergic synapticmarkers in Cstb2/2 mice
Next, Cstb2/2 and control brains were immunolabeled with
synaptic markers and the number of immunopositive puncta,
corresponding to the number of synaptic terminals, was counted.
A significant decrease in the number of puncta positive for
Table 2. The GO terms of biological processes, molecular functions and cellular components in P5+2 DIV Cstb2/2 cerebellargranule cells.
GO ID BIOLOGICAL PROCESS No. genes P-value
51301 Cell division 23 7.85e-13
7049 Cell cycle 33 1.52e-12
278 Mitotic cell cycle 24 1.65e-12
280 Nuclear division 19 3.64e-12
7067 Mitosis 19 3.64e-12
87 M phase of mitotic cell cycle 19 4.37e-12
48285 Organelle fission 19 8.41e-12
22402 Cell cycle process 26 5.43e-11
22403 Cell cycle phase 23 8.04e-11
279 M phase 19 1.36e-09
GO ID MOLECULAR FUNCTION
5515 Protein binding 62 4.16e-06
5488 Binding 83 2.33e-05
19899 Enzyme binding 20 0.0003
61134 Peptidase regulator activity 3 8 0.0003
4857 Enzyme inhibitor activity 9 0.0005
5539 Glycosaminoglycan binding 7 0.0005
19838 Growth factor binding 6 0.0007
97367 Carbohydrate derivative binding 7 0.0008
5178 Integrin binding 5 0.0008
4866 Endopeptidase inhibitor activity 6 0.0014
GO ID CELLULAR COMPONENT
43232 Intracellular non-membrane-bounded organelle 45 5.62e-09
43228 Non-membrane-bounded organelle 45 5.62e-09
5819 Spindle 12 8.37e-09
780 Condensed nuclear chromosome, centromeric region 6 9.52e-09
31012 Extracellular matrix 15 2.22e-07
5578 Proteinaceous extracellular matrix 14 3.40e-07
44420 Extracellular matrix part 11 3.71e-07
779 Condensed chromosome, centromeric region 6 5.23e-07
778 Condensed nuclear chromosome kinetochore 4 7.38e-07
5581 Collagen 8 7.38e-07
doi:10.1371/journal.pone.0089321.t002
Gene Expression Alterations in Cstb2/2 Mouse
PLOS ONE | www.plosone.org 6 February 2014 | Volume 9 | Issue 2 | e89321

synapsin 1, a universal pre-synaptic marker, was observed in P14
and P20 Cstb2/2 cerebellum (Fig. 3A, B). The number of puncta
immunoreactive for VGAT, a marker for GABAergic pre-synaptic
terminals, was significantly decreased in P14 Cstb2/2 cerebellum
(Fig. 3C, D), and gephyrin, a marker for GABAergic post-synaptic
terminals, showed decrease in P20 and P30 Cstb2/2 cerebellum
(Fig. 3E, F). No differences were seen in GABAA receptor a6
subunit immunopositivity by immunohistochemical or Western
blot analyses in P7 or P30 Cstb2/2 cerebellum (data not shown).
Since there was an increase in EPSCs in Cstb2/2 Purkinje cells,
excitatory synapses in the cerebellar molecular layer were also
counted using markers for vesicular glutamate transporter 1 and 2
(VGLUT1, VGLUT2). No significant differences were detected
between Cstb2/2 and control mice, however (data not shown).
Table 3. The GO terms of biological processes, molecular functions and cellular components in P30 Cstb2/2 cerebellum.
GO ID BIOLOGICAL PROCESS No. genes P-value
2376 Immune system process 28 2.72e-12
6955 Immune response 21 5.63e-12
2250 Adaptive immune response 12 3.61e-10
6952 Defense response 20 3.61e-10
50896 Response to stimulus 48 3.61e-10
2460 Adaptive immune response based on somatic recombination of immune receptors built from immunoglobulin11 2.97e-09
2684 Positive regulation of immune system process 15 5.23e-09
50778 Positive regulation of immune response 12 1.98e-08
2449 Lymphocyte mediated immunity 10 1.98e-08
2682 Regulation of immune system process 17 2.30e-08
GO ID MOLECULAR FUNCTION
32403 Protein complex binding 10 7.12e-05
5515 Protein binding 35 0.0009
4872 Receptor activity 12 0.0009
5102 Receptor binding 13 0.0010
4888 Transmembrane signaling receptor activity 10 0.0010
19864 IgG binding 2 0.0011
38023 Signaling receptor activity 10 0.0011
19763 Immunoglobulin receptor activity 2 0.0011
5178 Integrin binding 4 0.0011
5025 Transforming growth factor beta receptor activity, type I 2 0.0011
GO ID CELLULAR COMPONENT
9986 Cell surface 15 7.03e-08
44425 Membrane part 38 7.31e-06
9897 External side of plasma membrane 9 7.92e-06
44421 Extracellular region part 16 7.92e-06
44459 Plasma membrane part 18 1.45e-05
31224 Intrinsic to membrane 34 1.90e-05
5615 Extracellular space 13 2.46e-05
16020 Membrane 43 2.53e-05
5886 Plasma membrane 28 3.31e-05
71944 Cell periphery 28 5.23e-05
doi:10.1371/journal.pone.0089321.t003
Figure 1. Differential expression of Gabra6 and Gabrd. qPCRshows increased expression of Gabra6 and Gabrd in P7 Cstb2/2
cerebellum compared to the control mice. The data are expressed as afold change relative to controls 6 SE. *, p,0.05.doi:10.1371/journal.pone.0089321.g001
Gene Expression Alterations in Cstb2/2 Mouse
PLOS ONE | www.plosone.org 7 February 2014 | Volume 9 | Issue 2 | e89321

Reduced binding of GABAA receptor ligands to GABAA
receptors in Cstb2/2 miceResults from the electrophysiological, interneuron number and
immunolabeling studies suggest that the lack of IPSCs in P7 Cstb2/2
cerebellar slices is not due to the reduced number of inhibitory
interneurons but alterations in inhibitory synapses per se. In order to
study this in more detail and to see if the binding of specific ligands
to GABAA receptors is affected in Cstb2/2 cerebellum, autoradi-
ography with the GABAA agonist-site ligand [3H]muscimol and the
benzodiazepine-site ligand [3H]Ro15-4513 was performed in P7
and P30 Cstb2/2 and control mice. The autoradiography exper-
iments revealed a slight but significant decrease in [3H]muscimol
binding (70.2260.377 nCi/mg for control vs. 53.3065.051 nCi/
mg for Cstb2/2, p = 0.037) in P30 Cstb2/2 mouse cerebellum
(Fig. 4A, C), but not in [3H]Ro15-4513 binding (Fig. 4B, D). When
[3H]Ro15-4513 was incubated together with diazepam at the
concentration that blocks the benzodiazepine-sites of all other
GABAA receptor subtypes except the a6 subunit-containing ones in
the cerebellum, there was a decreased in [3H]Ro15-4513 binding
to the remaining a6 subunit-containing GABAA receptors
(17.0160.485 nCi/mg for control vs. 14.2460.409 nCi/mg for
Cstb2/2, p = 0.012) (Fig. 4B, E).
Discussion
This study is based on the hypothesis that the pathogenetic
mechanisms of EPM1 are reflected in altered gene expression
patterns. To identify molecular defects associated with CSTB
deficiency, we used cerebellum as a model which shows striking
pathology in Cstb2/2 mice [4,6], and is also affected in human
EPM1 patients [21]. Global gene expression profiling from
cerebella and cultured cerebellar granule cells revealed multiple
affected biological pathways that could have a role in the
pathogenesis of EPM1 not limited to cerebellum.
Several modest changes in gene expression related to synapse
maturation, development and function during postnatal matura-
tion of the brain were detected already in P7 Cstb2/2 cerebellum.
GABAergic signaling emerged as a pathway that showed most
prominent changes manifesting, for example, as overexpression of
GABAA receptor subunits Gabrd and Gabra6. GABA plays a central
role in controlling neuronal development and connectivity, and
defective GABAergic signaling in the cerebellum of Cstb2/2
mouse provides biological mechanisms for ataxia in these mice
[22]. However, when extrapolated to other brain regions affected
in EPM1, alterations in GABAergic signaling could also contribute
to hyperexcitability, manifested as severe myoclonus and seizures.
In the cerebral cortex, alterations in GABA signaling may cause
seizures, and vice versa, seizures can alter GABA signaling [23,24].
Many GABA-related mutations are known to cause epilepsy in
early life, and for example the analysis of a conditional mutant
with disrupted GABAA signaling has implied a developmental
period when disrupted GABA signaling may be critical for later
ictogenesis and epileptogenesis in addition to having developmen-
tal consequences [25].
Figure 2. Spontaneous postsynaptic currents in Purkinje cells. (A) Representative traces of spontaneous EPSCs and IPSCs in control andCstb2/2 Purkinje cells. EPSCs are seen as inward currents (downward deflections) and IPSCs are seen as outward currents (upward deflections). Insetsshow single IPSCs and EPSCs taken from the time points indicated by asterisks. An arrow indicates a synchronous burst of IPSCs seen in control butnot in Cstb2/2 Purkinje cells. (B) The occurrence of IPSCs and synchronous burst of IPSCs on control and Cstb2/2 Purkinje cells. Individual cellsmeasured are shown as spheres. (C) The frequency of EPSCs was significantly higher in Cstb2/2 cells compared to controls (p = 0.034). The data areexpressed as mean frequency (Hz) 6 SE. *, p,0.05; **, p,0.01.doi:10.1371/journal.pone.0089321.g002
Gene Expression Alterations in Cstb2/2 Mouse
PLOS ONE | www.plosone.org 8 February 2014 | Volume 9 | Issue 2 | e89321

Another example of a synapse-related gene showing altered
expression in Cstb2/2 cerebellum was the downregulated Epha7
that belongs to the ephrin receptor subfamily of the protein-
tyrosine kinases, which through their surface associated ligands,
ephrins, play a role in the initiation of new synaptic contacts, in
dendritic spine morphology and in modulation of the mature
Figure 3. The expression of synapsin 1, VGAT and gephyrin positive synaptic puncta. (A) The number of synapsin 1 positive puncta in themolecular layer of Cstb2/2 cerebellum was significantly lower compared to controls at P14 (p = 0.0035) and P20 (p = 0.0447). P7 and P30 animals didnot show significant difference. (B) Molecular layer of P14 and P20 Cstb2/2 cerebellum shows less synapsin 1 positive puncta compared to control.(C) The number of VGAT positive puncta in the molecular layer of Cstb2/2 cerebellum was significantly lower compared to controls at P14(p = 0.0115). P7, P20 and P30 animals did not show significant difference. (D) Molecular layer of P14 Cstb2/2 cerebellum shows less VGAT positivepuncta compared to control. (E) The number of gephyrin positive puncta in the molecular layer of Cstb2/2 cerebellum was significantly lowercompared to controls at P20 (p = 0.0448) and P30 (p = 0.0131). P7 and P14 animals did not show significant difference. (F) Molecular layer of P20 andP30 Cstb2/2 cerebellum shows less gephyrin positive puncta compared to control. The data are expressed as mean amount of positive punctarelative to control 6 SE. *, p,0.05; **, p,0.01.doi:10.1371/journal.pone.0089321.g003
Gene Expression Alterations in Cstb2/2 Mouse
PLOS ONE | www.plosone.org 9 February 2014 | Volume 9 | Issue 2 | e89321

synapses [26]. The target recognition and axon guidance factor
Slit2, which also showed reduced expression, is known to stimulate
axonal elongation and branching, and to modulate neurogenesis in
developing brain and may regulate axon-axon adhesion mediated
by cadherins [27-29]. Moreover, several genes encoding proto-
cadherins were downregulated at P7. Synaptic protocadherins are
central molecules in Ca2+-regulated cell-adhesion and they are
expressed especially during neural development being implicated
in synaptic recognition and stabilization [30].
While the microarray data in Cstb2/2 cerebellum at P7
pinpointed defects in processes related to synaptogenesis and
synaptic maturation with alterations in the GABAergic signaling
highlighted, Cstb2/2 neurons exposed upregulation of several cell
cycle-related genes. Re-entry of neurons to cell cycle after
differentiation would lead to apoptotic cell death and neurode-
generation, rather than cell division [31]. We did not, however,
detect elevated cell death in Cstb2/2 granule cell cultures, at least
when the neurons were cultured for two days. We cannot, though,
exclude the possibility that an activation of cell cycle related genes
in Cstb2/2 granule cells reflects their dysfunction eventually
leading to cell death. Postmitotic neurons express also cell cycle
proteins, which are involved in neuronal morphogenesis and in the
regulation of pre-synaptic differentiation, such as CDC20
(upregulated in our data) through interaction with a multiprotein
anaphase-promoting complex [32-34]. Upregulation of cell cycle
genes in Cstb2/2 granule neurons may also imply to functions of
CSTB in the nucleus. CSTB localizes to the cytoplasm, where it
associates with lysosomes, but it has also been detected in the
nucleus of dividing cells [35,36]. In the nucleus, CSTB has been
shown to interact with histones and cathepsin L and to regulate
cell cycle progression into the S phase [37]. It is tempting to
speculate that the synaptic changes may, at least partly, be
mediated by cathepsins in the cells, including the synaptic sites and
the nucleus. Imbalance of cathepsin regulation in the synapses
could lead to morphological and functional changes [38]. On the
other hand, disturbed nuclear function of CSTB, which is at least
partially mediated by cathepsin regulation, could result in
consequent alterations in the transcriptional regulation of synaptic
proteins [37,39]. Synaptic functions are highly dependent on
functional cytoskeleton that regulates intracellular transport and
protein turnover in the synapses. Cstb2/2 granule neurons
revealed also significant overexpression of several genes encoding
kinesins, CCN family of proteins and annexins, that have been
associated in axonal transport, nuclear division, mitosis, extracel-
lular matrix production, apoptosis and GABAergic signaling
[40–44]. Taken together, the data from Cstb2/2 granule cells
propose neuron specific alterations in processes central to neuronal
function and architecture and emphasizes nuclear functions of
CSTB.
As the gene expression data from P7 Cstb2/2 cerebellum and
neurons alluded to alterations in synaptic functions, which could
contribute to the neuronal hyperexcitability and characteristic
motor symptoms seen in EPM1 patients (see above), we selected
GABAergic signaling for more detailed characterization. At P7,
mRNA levels of granule cell specific GABAA receptor subtypes a6
and d were elevated, although not highly enough to be able to
detect at protein level. However, electrophysiological analyses of
Cstb2/2 mouse cerebellar slices showed a shift of balance towards
Figure 4. Autoradiography of GABAA receptors. (A) Binding of [3H]muscimol was significantly reduced in P30 Cstb2/2 cerebellum (p = 0.037).No change was seen at P7. (B) Binding of [3H]Ro15-4513 did not show significant changes at P7 or at P30. However, when diazepam (DZ) was addedto reveal the diazepam-insensitive a6 subunit-dependent GABAA receptor subtype, decreased binding for [3H]Ro15-4513 (p = 0.012) was seen. Thedata are expressed as mean radioactivity levels (nCi/mg) 6 SE. *, p,0.05. (C) Representative images of [3H]muscimol binding to P30 Cstb2/2 andcontrol brain. (D) Representative images of [3H]Ro15-4513 binding to P30 Cstb2/2 and control brain without and (E) in presence of diazepam.doi:10.1371/journal.pone.0089321.g004
Gene Expression Alterations in Cstb2/2 Mouse
PLOS ONE | www.plosone.org 10 February 2014 | Volume 9 | Issue 2 | e89321
decreased inhibition and increased excitation in the Purkinje cells.
Thus, the detected upregulation of GABAA receptor subunit
mRNAs at P7 Cstb2/2 mouse could reflect a compensatory change
in gene expression to decrease the excitatory neurotransmission
from granule cells to Purkinje cells, especially as the GABAA
receptor subunit mRNAs, which were upregulated, were those for
the a6 and d subunits that mostly form extrasynaptic receptors
responsible for tonic inhibition [45]. On the other hand, at P30,
we found reduced ligand binding to a6 and d subunit-containing
GABAA receptors [18,46] indicating alterations in functional post-
synaptic and extrasynaptic receptors in Cstb2/2 mouse cerebellum
at this age. Whether the changes in GABAA receptor function
could be due to e.g. availability of different receptor subtypes in
the membrane needs to be investigated.
A decrease in the number of GABAergic terminals leading to
reduced GABA inhibition has previously been reported in cerebral
cortex of aged Cstb2/2 mice [47]. The loss of interneurons in aged
mice can further reduce the GABA inhibition (our unpublished
observation and [47]). Consistent with the mouse data, a loss of
pre-synaptic GABAergic marker VGAT was also detected in the
brain of a fully symptomatic EPM1 patient [47]. Our data in
young mice show a significant decrease in VGAT immunoreac-
tivity along with the reduction of synapsin 1 positive pre-synaptic
as well as gephyrin positive post-synaptic terminals, indicating that
there are defects in GABAergic synapses in Cstb2/2 cerebellum
already at the pre-symptomatic stage, before the loss of
GABAergic interneurons is detectable.
In contrast to the findings at P7, changes in the expression of
genes reflecting synaptic functions by GO analysis are no longer
observed at P30, or they may be hidden by significant enrichment
for genes and pathways which pinpoint activation of inflammatory
processes. Earlier reports from Cstb2/2 mice cerebella have shown
microglial activation in presymptomatic mice followed by neuro-
nal death and volume loss from two months of age onward [4,6].
Therefore, elevated expression of inflammatory genes at P30 most
likely reflect response to activated glial cells and neuroinflamma-
tion, which together with neuronal dysfunction and death has an
important role in progression of the disease. Glial activation and
oxidative stress [5,6] might further promote the hyperexcitability
in Cstb2/2 mice, as glial derived proinflammatory chemokines and
cytokines, highly expressed also in P30 Cstb2/2 mice, have been
found to reduce the seizure threshold and may thus contribute to
recurrent excitation in epilepsy [48].
In conclusion, we provide the first evidence of gene expression
changes in pre-symptomatic and young symptomatic Cstb2/2
mice. Although there is no significant overlap with the differen-
tially expresses genes at P7 and P30, GO analyses revealed
alterations in several functional categories, which may contribute
to EPM1. Our data indicate that pre- and post-synaptic changes in
inhibitory GABAergic synapses could result in imbalance between
excitation and inhibition in Cstb2/2 mouse cerebellum already
before the disease symptoms occur, which may be augmented by
inflammatory processes in the symptomatic phase.
Supporting Information
File S1 Table S1. The gene expression changes in P7 Cstb2/2
cerebellum. Fold change with cutoff 1.3 and p,0.05 was used.
Table S2. The GO terms of biological process, molecular
function and cellular component in P7 Cstb2/2 cerebellum. N
indicates the number of genes and P the adjusted p-value for the
enrichment. Table S3. The GO terms of biological process,
molecular function and cellular component in Cstb2/2 P5+2
cerebellar granule cells. N indicates the number of genes and P the
adjusted p-value for the enrichment. Table S4. The gene
expression changes in Cstb2/2 P5+2 cerebellar granule cells. Fold
change with cutoff 1.3 and p,0.01 was used. Table S5. The gene
expression changes in P30 Cstb2/2 cerebellum. Fold change with
cutoff 1.3 and p,0.05 was used. Table S6. The GO terms of
biological process, molecular function and cellular component in
P30 Cstb2/2 cerebellum. N indicates the number of genes and P is
the adjusted p-value for the enrichment.
(PDF)
Acknowledgments
We like to thank Dr. Per Harald Jonson for assistance with the analysis of
the microarrays.
Author Contributions
Conceived and designed the experiments: TJ ST ERK TT OK A-EL.
Performed the experiments: TJ ST ER MS PH HP OK. Analyzed the
data: TJ ST ER MS ERK JT TT IH OK. Contributed reagents/
materials/analysis tools: ERK JT TT A-EL. Wrote the paper: TJ ST MS
ERK JT TT IH OK A-EL.
References
1. Kalviainen R, Khyuppenen J, Koskenkorva P, Eriksson K, Vanninen R, et al.
(2008) Clinical picture of EPM1-Unverricht-Lundborg disease. Epilepsia 49:
549–556.
2. Lalioti MD, Scott HS, Buresi C, Rossier C, Bottani A, et al. (1997) Dodecamer
repeat expansion in cystatin B gene in progressive myoclonus epilepsy. Nature
386: 847–851.
3. Pennacchio LA, Lehesjoki AE, Stone NE, Willour VL, Virtaneva K, et al. (1996)
Mutations in the gene encoding cystatin B in progressive myoclonus epilepsy
(EPM1). Science 271: 1731–1734.
4. Pennacchio LA, Bouley DM, Higgins KM, Scott MP, Noebels JL, et al. (1998)
Progressive ataxia, myoclonic epilepsy and cerebellar apoptosis in cystatin
B-deficient mice. Nat Genet 20: 251–258.
5. Lehtinen MK, Tegelberg S, Schipper H, Su H, Zukor H, et al. (2009) Cystatin B
deficiency sensitizes neurons to oxidative stress in progressive myoclonus
epilepsy, EPM1. J Neurosci 29: 5910–5915.
6. Tegelberg S, Kopra O, Joensuu T, Cooper JD, Lehesjoki AE (2012) Early
microglial activation precedes neuronal loss in the brain of the Cstb2/2 mouse
model of progressive myoclonus epilepsy, EPM1. J Neuropathol Exp Neurol 71:
40–53.
7. Rinne R, Saukko P, Jarvinen M, Lehesjoki AE (2002) Reduced cystatin B
activity correlates with enhanced cathepsin activity in progressive myoclonus
epilepsy. Ann Med 34: 380–385.
8. Houseweart MK, Pennacchio LA, Vilaythong A, Peters C, Noebels JL, et al.
(2003) Cathepsin B but not cathepsins L or S contributes to the pathogenesis of
Unverricht-Lundborg progressive myoclonus epilepsy (EPM1). J Neurobiol 56:
315–327.
9. Kaur G, Mohan P, Pawlik M, DeRosa S, Fajiculay J, et al. (2010) Cystatin C
rescues degenerating neurons in a cystatin B-knockout mouse model of
progressive myoclonus epilepsy. Am J Pathol 177: 2256–2267.
10. Lieuallen K, Pennacchio LA, Park M, Myers RM, Lennon GG (2001) Cystatin
B-deficient mice have increased expression of apoptosis and glial activation
genes. Hum Mol Genet 10: 1867–1871.
11. Dudek H, Datta SR, Franke TF, Birnbaum MJ, Yao R, et al. (1997) Regulation
of neuronal survival by the serine-threonine protein kinase Akt. Science 275:
661–665.
12. Irizarry RA, Hobbs B, Collin F, Beazer-Barclay YD, Antonellis KJ, et al. (2003)
Exploration, normalization, and summaries of high density oligonucleotide array
probe level data. Biostatistics 4: 249–264.
13. Zhang B, Kirov S, Snoddy J (2005) WebGestalt: an integrated system for
exploring gene sets in various biological contexts. Nucleic Acids Res 33: W741–
748.
14. Bible E, Gupta P, Hofmann SL, Cooper JD (2004) Regional and cellular
neuropathology in the palmitoyl protein thioesterase-1 null mutant mouse model
of infantile neuronal ceroid lipofuscinosis. Neurobiol Dis 16: 346–359.
15. Kielar C, Maddox L, Bible E, Pontikis CC, Macauley SL, et al. (2007)
Successive neuron loss in the thalamus and cortex in a mouse model of infantile
neuronal ceroid lipofuscinosis. Neurobiol Dis 25: 150–162.
Gene Expression Alterations in Cstb2/2 Mouse
PLOS ONE | www.plosone.org 11 February 2014 | Volume 9 | Issue 2 | e89321

16. Gundersen HJ, Jensen EB (1987) The efficiency of systematic sampling in
stereology and its prediction. J Microsc 147: 229–263.17. Ippolito DM, Eroglu C (2010) Quantifying synapses: an immunocytochemistry-
based assay to quantify synapse number. J Vis Exp.
18. Makela R, Uusi-Oukari M, Homanics GE, Quinlan JJ, Firestone LL, et al.(1997) Cerebellar gamma-aminobutyric acid type A receptors: pharmacological
subtypes revealed by mutant mouse lines. Mol Pharmacol 52: 380–388.19. Uusi-Oukari M, Heikkila J, Sinkkonen ST, Makela R, Hauer B, et al. (2000)
Long-range interactions in neuronal gene expression: evidence from gene
targeting in the GABA(A) receptor beta2-alpha6-alpha1-gamma2 subunit genecluster. Mol Cell Neurosci 16: 34–41.
20. Korpi ER, Kleingoor C, Kettenmann H, Seeburg PH (1993) Benzodiazepine-induced motor impairment linked to point mutation in cerebellar GABAA
receptor. Nature 361: 356–359.21. Manninen O, Koskenkorva P, Lehtimaki KK, Hypponen J, Kononen M, et al.
(2013) White matter degeneration with Unverricht-Lundborg progressive
myoclonus epilepsy: a translational diffusion-tensor imaging study in patientsand cystatin B-deficient mice. Radiology 269: 232–239.
22. Grusser-Cornehls U, Baurle J (2001) Mutant mice as a model for cerebellarataxia. Prog Neurobiol 63: 489–540.
23. Ben-Ari Y (2006) Seizures beget seizures: the quest for GABA as a key player.
Crit Rev Neurobiol 18: 135–144.24. Briggs SW, Galanopoulou AS (2011) Altered GABA signaling in early life
epilepsies. Neural Plast 2011: 527605.25. Chiu C, Reid CA, Tan HO, Davies PJ, Single FN, et al. (2008) Developmental
impact of a familial GABAA receptor epilepsy mutation. Ann Neurol 64: 284–293.
26. Hruska M, Dalva MB (2012) Ephrin regulation of synapse formation, function
and plasticity. Mol Cell Neurosci 50: 35–44.27. Jaworski A, Tessier-Lavigne M (2012) Autocrine/juxtaparacrine regulation of
axon fasciculation by Slit-Robo signaling. Nat Neurosci 15: 367–369.28. Borrell V, Cardenas A, Ciceri G, Galceran J, Flames N, et al. (2012) Slit/Robo
signaling modulates the proliferation of central nervous system progenitors.
Neuron 76: 338–352.29. Marillat V, Cases O, Nguyen-Ba-Charvet KT, Tessier-Lavigne M, Sotelo C, et
al. (2002) Spatiotemporal expression patterns of slit and robo genes in the ratbrain. J Comp Neurol 442: 130–155.
30. Yagi T, Takeichi M (2000) Cadherin superfamily genes: functions, genomicorganization, and neurologic diversity. Genes Dev 14: 1169–1180.
31. Herrup K, Busser JC (1995) The induction of multiple cell cycle events precedes
target-related neuronal death. Development 121: 2385–2395.32. Kim AH, Puram SV, Bilimoria PM, Ikeuchi Y, Keough S, et al. (2009) A
centrosomal Cdc20-APC pathway controls dendrite morphogenesis in postmi-totic neurons. Cell 136: 322–336.
33. Yang Y, Kim AH, Yamada T, Wu B, Bilimoria PM, et al. (2009) A Cdc20-APC
ubiquitin signaling pathway regulates presynaptic differentiation. Science 326:
575–578.
34. Becker EB, Bonni A (2005) Beyond proliferation-cell cycle control of neuronal
survival and differentiation in the developing mammalian brain. Semin Cell Dev
Biol 16: 439–448.
35. Alakurtti K, Weber E, Rinne R, Theil G, de Haan GJ, et al. (2005) Loss of
lysosomal association of cystatin B proteins representing progressive myoclonus
epilepsy, EPM1, mutations. Eur J Hum Genet 13: 208–215.
36. Riccio M, Di Giaimo R, Pianetti S, Palmieri PP, Melli M, et al. (2001) Nuclear
localization of cystatin B, the cathepsin inhibitor implicated in myoclonus
epilepsy (EPM1). Exp Cell Res 262: 84–94.
37. Ceru S, Konjar S, Maher K, Repnik U, Krizaj I, et al. (2010) Stefin B interacts
with histones and cathepsin L in the nucleus. J Biol Chem 285: 10078–10086.
38. Graber S, Maiti S, Halpain S (2004) Cathepsin B-like proteolysis and MARCKS
degradation in sub-lethal NMDA-induced collapse of dendritic spines.
Neuropharmacology 47: 706–713.
39. Ludwig A, Li H, Saarma M, Kaila K, Rivera C (2003) Developmental up-
regulation of KCC2 in the absence of GABAergic and glutamatergic
transmission. Eur J Neurosci 18: 3199–3206.
40. Hirokawa N, Niwa S, Tanaka Y (2010) Molecular motors in neurons: transport
mechanisms and roles in brain function, development, and disease. Neuron 68:
610–638.
41. Chen Y, Du XY (2007) Functional properties and intracellular signaling of
CCN1/Cyr61. J Cell Biochem 100: 1337–1345.
42. Gerke V, Creutz CE, Moss SE (2005) Annexins: linking Ca2+ signalling to
membrane dynamics. Nat Rev Mol Cell Biol 6: 449–461.
43. Twelvetrees AE, Yuen EY, Arancibia-Carcamo IL, MacAskill AF, Rostaing P,
et al. (2010) Delivery of GABAARs to synapses is mediated by HAP1-KIF5 and
disrupted by mutant huntingtin. Neuron 65: 53–65.
44. Yeger H, Perbal B (2007) The CCN family of genes: a perspective on CCN
biology and therapeutic potential. J Cell Commun Signal 1: 159–164.
45. Farrant M, Nusser Z (2005) Variations on an inhibitory theme: phasic and tonic
activation of GABA(A) receptors. Nat Rev Neurosci 6: 215–229.
46. Chandra D, Halonen LM, Linden AM, Procaccini C, Hellsten K, et al. (2010)
Prototypic GABA(A) receptor agonist muscimol acts preferentially through
forebrain high-affinity binding sites. Neuropsychopharmacology 35: 999–1007.
47. Buzzi A, Chikhladze M, Falcicchia C, Paradiso B, Lanza G, et al. (2012) Loss of
cortical GABA terminals in Unverricht-Lundborg disease. Neurobiol Dis 47:
216–224.
48. Devinsky O, Vezzani A, Najjar S, De Lanerolle NC, Rogawski MA (2013) Glia
and epilepsy: excitability and inflammation. Trends Neurosci 36: 174–184.
Gene Expression Alterations in Cstb2/2 Mouse
PLOS ONE | www.plosone.org 12 February 2014 | Volume 9 | Issue 2 | e89321