FY2017 Financial Results - toyota-global.com · laws, regulations and government policies in the...
25
レビンハイブリッド Toyota Camry Hybrid (デトロイトモーターショー出展車両) Toyota Camry (デトロイトモーターショー出展車両) トヨタ自動車株式会社 2017年5月10日 LEXUS LS500 FY2017 Financial Results Toyota Motor Corporation May 10, 2017 LEXUS LS500 (North American International Auto Show 2017 exhibition car)
Transcript of FY2017 Financial Results - toyota-global.com · laws, regulations and government policies in the...
レビンハイブリッド
Toyota Camry Hybrid(デトロイトモーターショー出展車両)
Toyota Camry(デトロイトモーターショー出展車両)トヨタ自動車株式会社
2017年5月10日
LEXUS LS500
FY2017 Financial Results
Toyota Motor CorporationMay 10, 2017
LEXUS LS500(North American International Auto Show 2017 exhibition car)
2
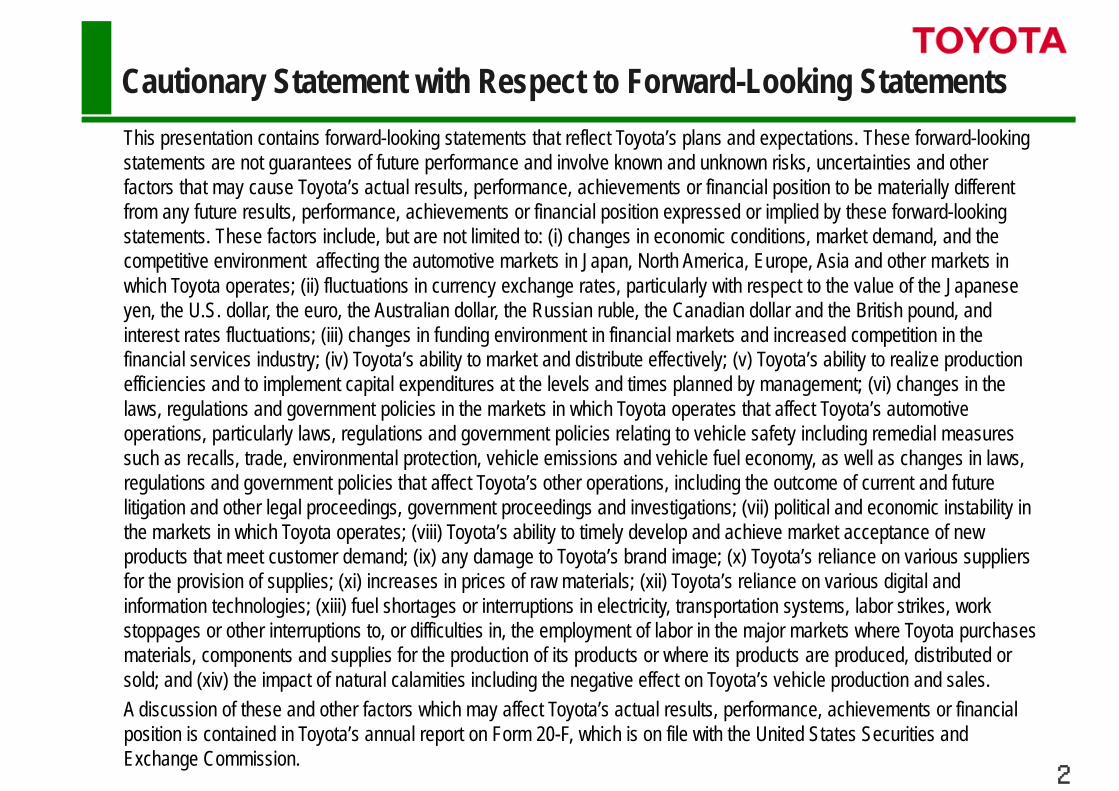
Cautionary Statement with Respect to Forward-Looking StatementsThis presentation contains forward-looking statements that reflect Toyota’s plans and expectations. These forward-looking statements are not guarantees of future performance and involve known and unknown risks, uncertainties and other factors that may cause Toyota’s actual results, performance, achievements or financial position to be materially different from any future results, performance, achievements or financial position expressed or implied by these forward-looking statements. These factors include, but are not limited to: (i) changes in economic conditions, market demand, and the competitive environment affecting the automotive markets in Japan, North America, Europe, Asia and other markets inwhich Toyota operates; (ii) fluctuations in currency exchange rates, particularly with respect to the value of the Japanese yen, the U.S. dollar, the euro, the Australian dollar, the Russian ruble, the Canadian dollar and the British pound, and interest rates fluctuations; (iii) changes in funding environment in financial markets and increased competition in the financial services industry; (iv) Toyota’s ability to market and distribute effectively; (v) Toyota’s ability to realize production efficiencies and to implement capital expenditures at the levels and times planned by management; (vi) changes in the laws, regulations and government policies in the markets in which Toyota operates that affect Toyota’s automotive operations, particularly laws, regulations and government policies relating to vehicle safety including remedial measures such as recalls, trade, environmental protection, vehicle emissions and vehicle fuel economy, as well as changes in laws, regulations and government policies that affect Toyota’s other operations, including the outcome of current and future litigation and other legal proceedings, government proceedings and investigations; (vii) political and economic instability in the markets in which Toyota operates; (viii) Toyota’s ability to timely develop and achieve market acceptance of new products that meet customer demand; (ix) any damage to Toyota’s brand image; (x) Toyota’s reliance on various suppliers for the provision of supplies; (xi) increases in prices of raw materials; (xii) Toyota’s reliance on various digital and information technologies; (xiii) fuel shortages or interruptions in electricity, transportation systems, labor strikes, work stoppages or other interruptions to, or difficulties in, the employment of labor in the major markets where Toyota purchases materials, components and supplies for the production of its products or where its products are produced, distributed orsold; and (xiv) the impact of natural calamities including the negative effect on Toyota’s vehicle production and sales.A discussion of these and other factors which may affect Toyota’s actual results, performance, achievements or financial position is contained in Toyota’s annual report on Form 20-F, which is on file with the United States Securities and Exchange Commission.
3
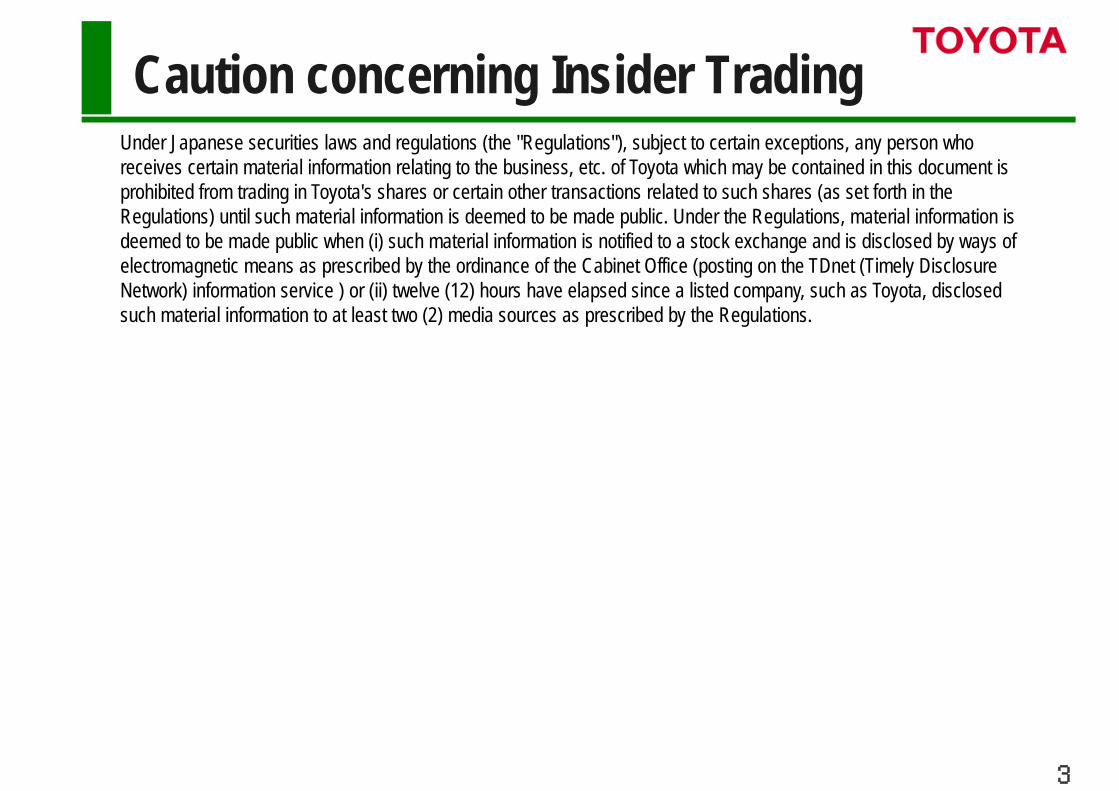
Caution concerning Insider TradingUnder Japanese securities laws and regulations (the "Regulations"), subject to certain exceptions, any person who receives certain material information relating to the business, etc. of Toyota which may be contained in this document is prohibited from trading in Toyota's shares or certain other transactions related to such shares (as set forth in the Regulations) until such material information is deemed to be made public. Under the Regulations, material information is deemed to be made public when (i) such material information is notified to a stock exchange and is disclosed by ways of electromagnetic means as prescribed by the ordinance of the Cabinet Office (posting on the TDnet (Timely Disclosure Network) information service ) or (ii) twelve (12) hours have elapsed since a listed company, such as Toyota, disclosed such material information to at least two (2) media sources as prescribed by the Regulations.
FY2017 Financial Performance
FY2018 Financial Forecasts
4
FY2017 Financial Results
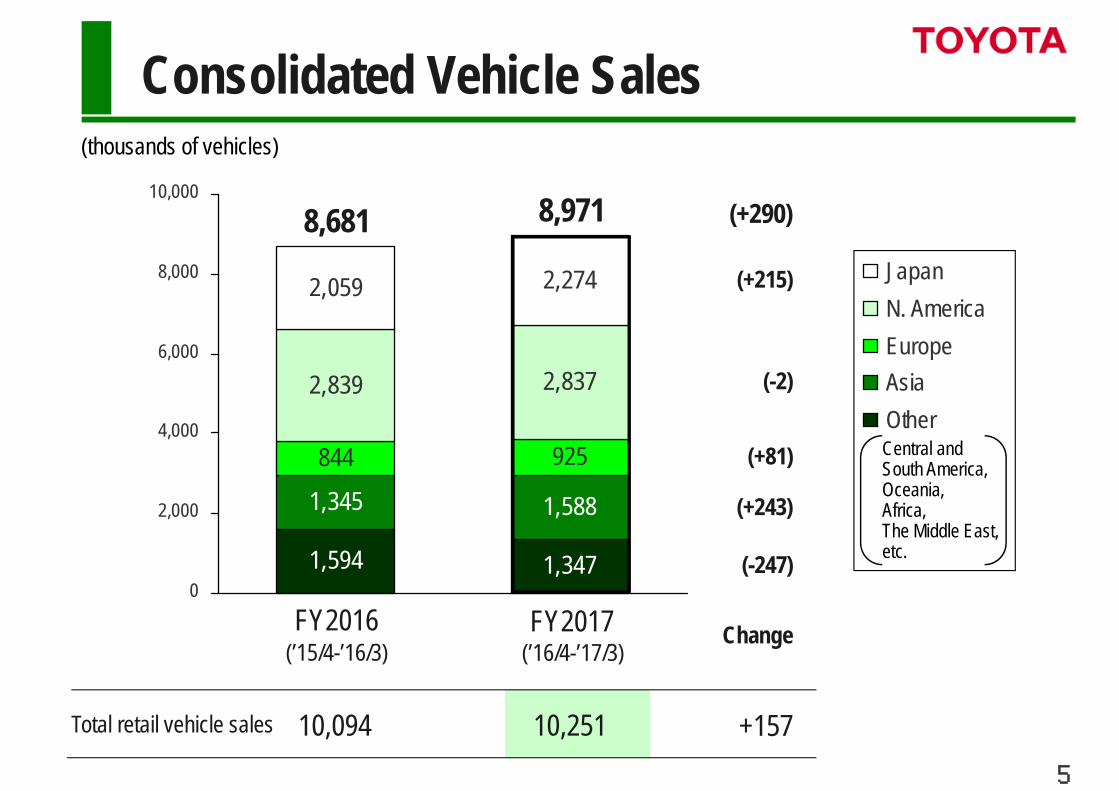
1,594 1,347
1,345 1,588
844 925
2,839 2,837
2,059 2,274
0
2,000
4,000
6,000
8,000
10,000
JapanN. AmericaEuropeAsiaOther
8,681 8,971
(-2)
(’15/4-’16/3)Change
(’16/4-’17/3)
(+215)
(-247)
(+243)
(+81)
10,25110,094 +157
(+290)
5
FY2016 FY2017
Consolidated Vehicle Sales(thousands of vehicles)
Total retail vehicle sales
Central and South America,Oceania,Africa,The Middle East, etc.
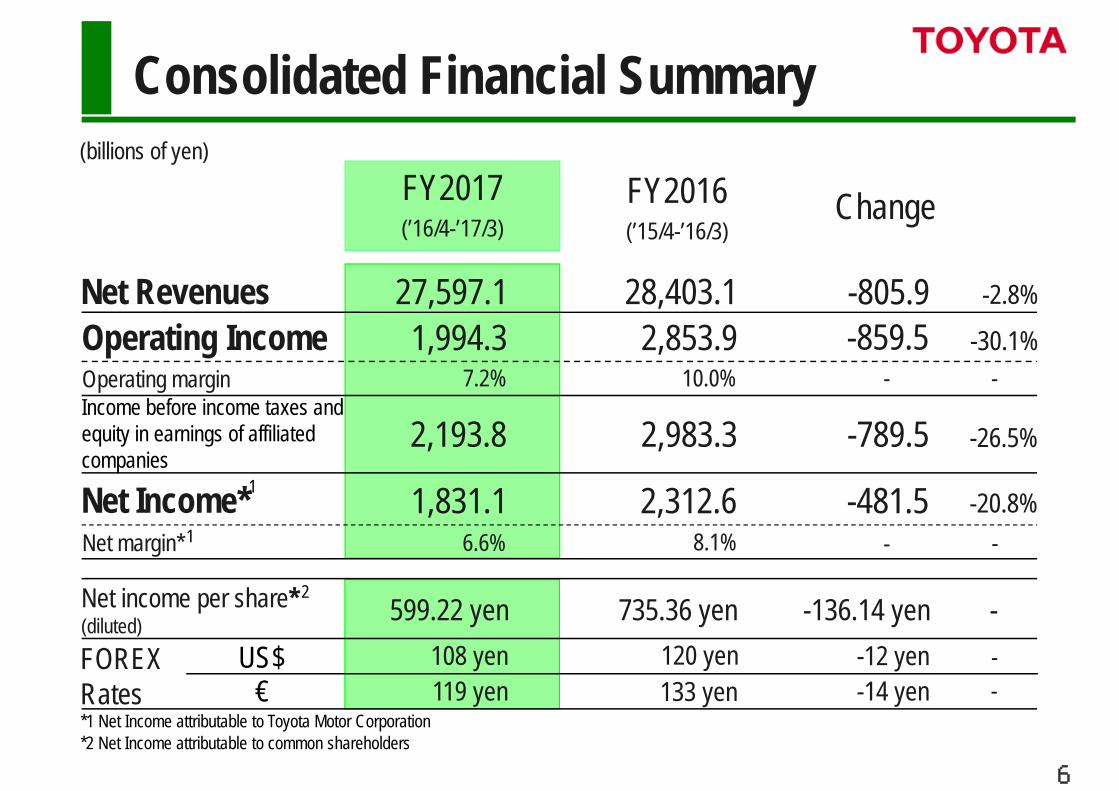
--136.14 yen735.36 yen599.22 yen-12 yen120 yen108 yen-14 yen133 yen119 yen
--20.8%
-26.5%
-
-2.8%
-6.6%-481.51,831.1
-7.2%
-789.52,193.8
-859.51,994.3-805.927,597.1Net Revenues
FY2016(’15/4-’16/3)
-30.1%
--
Operating Income
FY2017(’16/4-’17/3)
Change
8.1%2,312.6
10.0%
2,983.3
2,853.928,403.1
6
Consolidated Financial Summary (billions of yen)
Operating marginIncome before income taxes and equity in earnings of affiliated companies
Net Income*1
Net margin* 1
Net income per share*(diluted)
2
FOREX Rates
US$€
*1 Net Income attributable to Toyota Motor Corporation*2 Net Income attributable to common shareholders
7
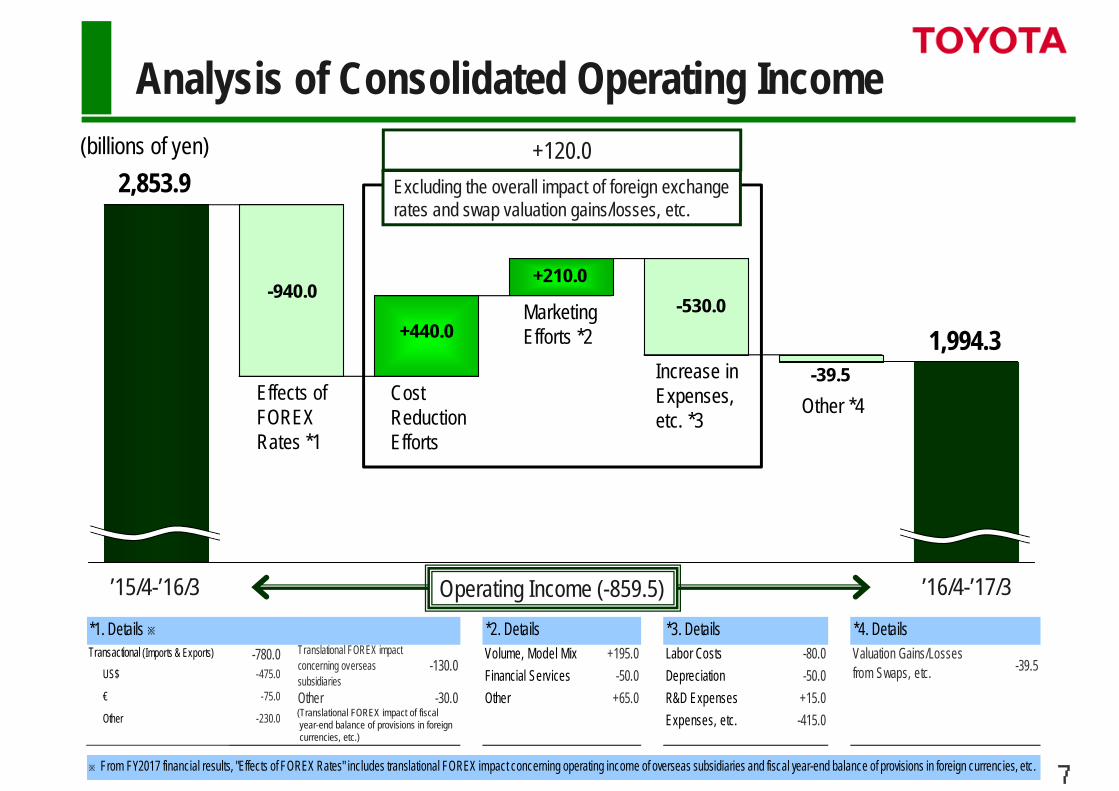
+440.0-530.0
-39.5
+210.0-940.0
2,853.9
’15/4-’16/3 ’16/4-’17/3
1,994.3
Transactional (Imports & Exports) -780.0 Volume, Model Mix +195.0 Labor Costs -80.0 US$ -475.0 Financial Services -50.0 Depreciation -50.0 € -75.0 Other -30.0 Other +65.0 R&D Expenses +15.0 Other -230.0 Expenses, etc. -415.0
※From FY2017 financial results, "Effects of FOREX Rates" includes translational FOREX impact concerning operating income of overseas subsidiaries and fiscal year-end balance of provisions in foreign currencies, etc.
*1. Details ※ *4. Details*3. Details
-130.0Translational FOREX impactconcerning overseassubsidiaries
*2. DetailsValuation Gains/Lossesfrom Swaps, etc. -39.5
+120.0
Analysis of Consolidated Operating Income(billions of yen)
Excluding the overall impact of foreign exchange rates and swap valuation gains/losses, etc.
Effects of FOREX Rates *1
Cost Reduction Efforts
Marketing Efforts *2
Increase in Expenses, etc. *3
Other *4
Operating Income (-859.5)
(Translational FOREX impact of fiscal year-end balance of provisions in foreign currencies, etc.)
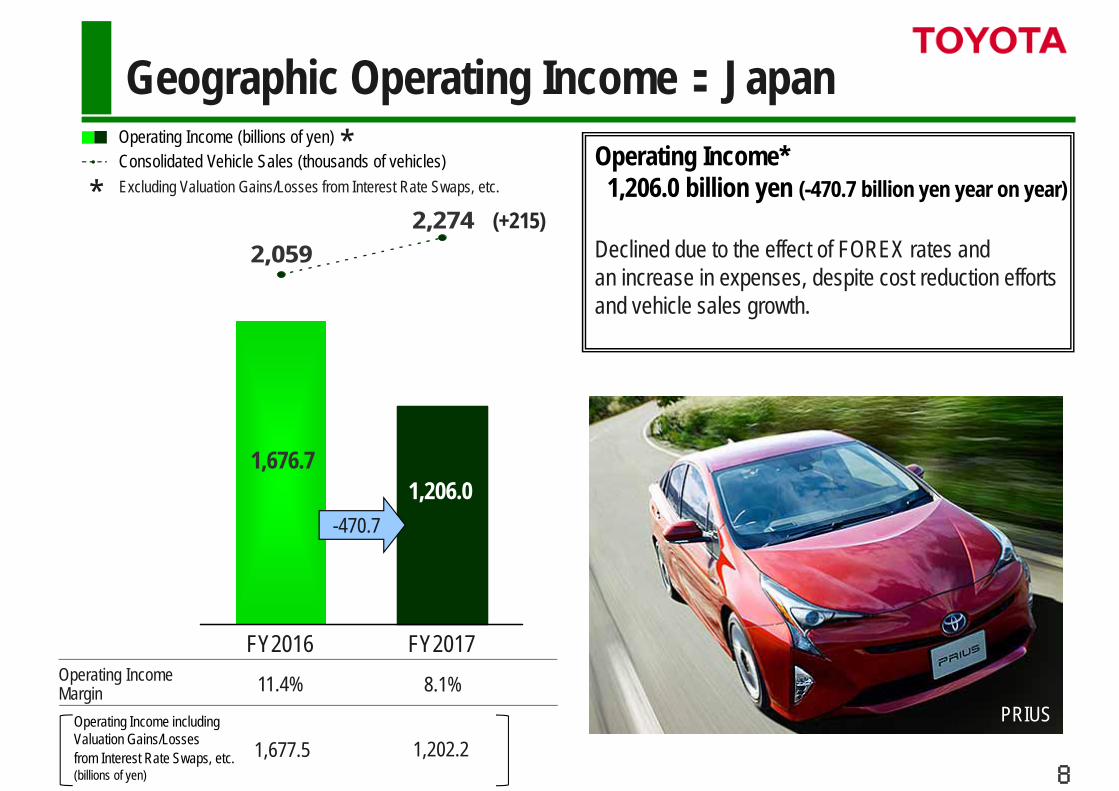
2,2742,059
11.4% 8.1%
●
(+215)
-470.7
1,676.71,206.0
1,677.5 1,202.2
FY2016 FY2017
PRIUS
8
Operating Income*1,206.0 billion yen (-470.7 billion yen year on year)
Declined due to the effect of FOREX rates and an increase in expenses, despite cost reduction effortsand vehicle sales growth.
Geographic Operating Income:JapanOperating Income (billions of yen) Consolidated Vehicle Sales (thousands of vehicles)Excluding Valuation Gains/Losses from Interest Rate Swaps, etc.
**
Operating IncomeMargin
Operating Income including Valuation Gains/Lossesfrom Interest Rate Swaps, etc.(billions of yen)
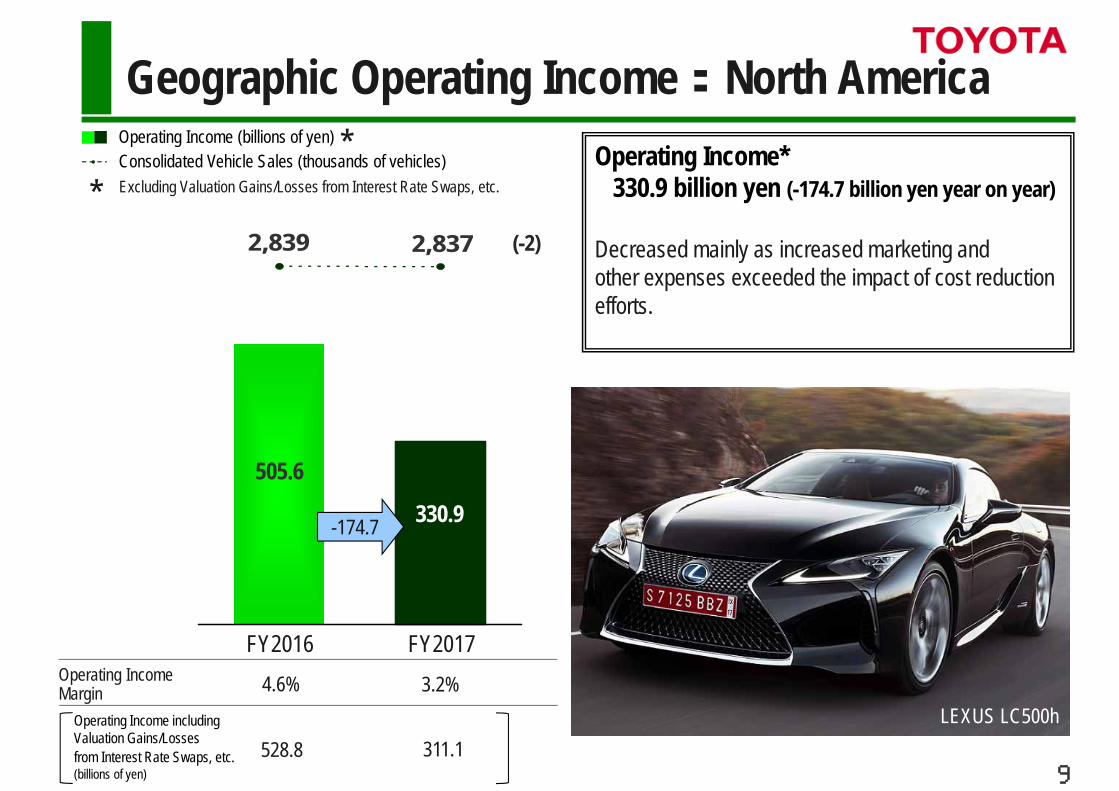
4.6% 3.2%
●
2,8372,839 (-2)
-174.7
505.6
330.9
528.8 311.1
FY2016 FY2017
LEXUS LC500h
Operating Income*330.9 billion yen (-174.7 billion yen year on year)
Decreased mainly as increased marketing and other expenses exceeded the impact of cost reductionefforts.
9
Geographic Operating Income:North AmericaOperating Income (billions of yen) Consolidated Vehicle Sales (thousands of vehicles)Excluding Valuation Gains/Losses from Interest Rate Swaps, etc. *
*
Operating IncomeMargin
Operating Income including Valuation Gains/Lossesfrom Interest Rate Swaps, etc.(billions of yen)
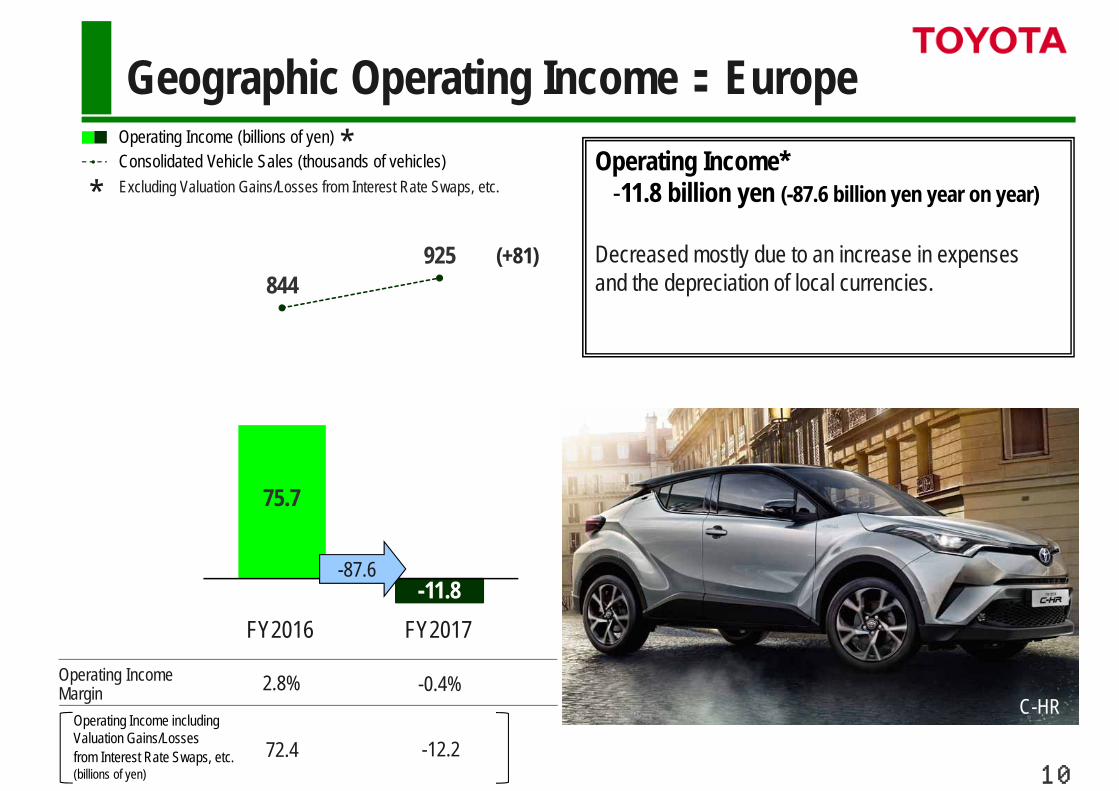
2.8% -0.4%
844925 (+81)
-87.6
75.7
-11.8
72.4 -12.2
FY2016 FY2017
C-HR
●
10
Geographic Operating Income:EuropeOperating Income (billions of yen) Consolidated Vehicle Sales (thousands of vehicles)Excluding Valuation Gains/Losses from Interest Rate Swaps, etc.
**
Operating IncomeMargin
Operating Income including Valuation Gains/Lossesfrom Interest Rate Swaps, etc.(billions of yen)
Operating Income*-11.8 billion yen (-87.6 billion yen year on year)
Decreased mostly due to an increase in expenses and the depreciation of local currencies.
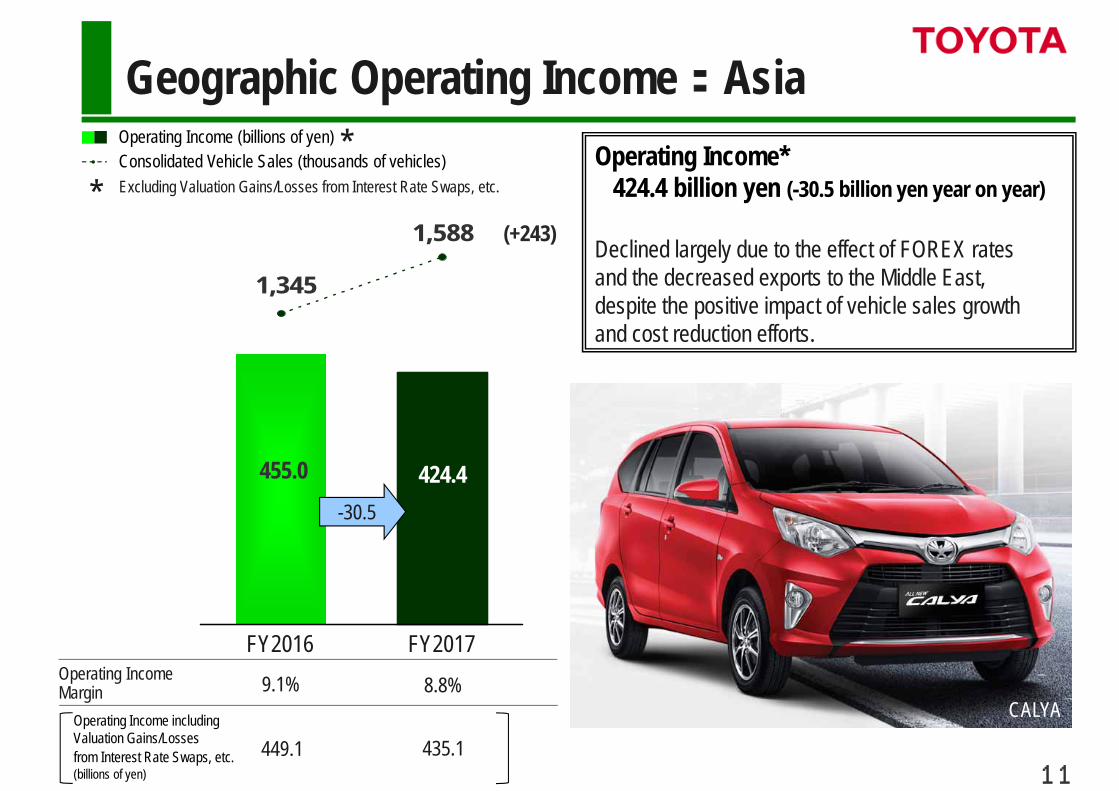
9.1% 8.8%
1,588
1,345
(+243)
-30.5
455.0 424.4
449.1 435.1
FY2016 FY2017
●
CALYA
Operating Income*424.4 billion yen (-30.5 billion yen year on year)
Declined largely due to the effect of FOREX rates and the decreased exports to the Middle East,despite the positive impact of vehicle sales growthand cost reduction efforts.
11
Geographic Operating Income:AsiaOperating Income (billions of yen) Consolidated Vehicle Sales (thousands of vehicles)Excluding Valuation Gains/Losses from Interest Rate Swaps, etc. *
*
Operating IncomeMargin
Operating Income including Valuation Gains/Lossesfrom Interest Rate Swaps, etc.(billions of yen)
12
FY2016
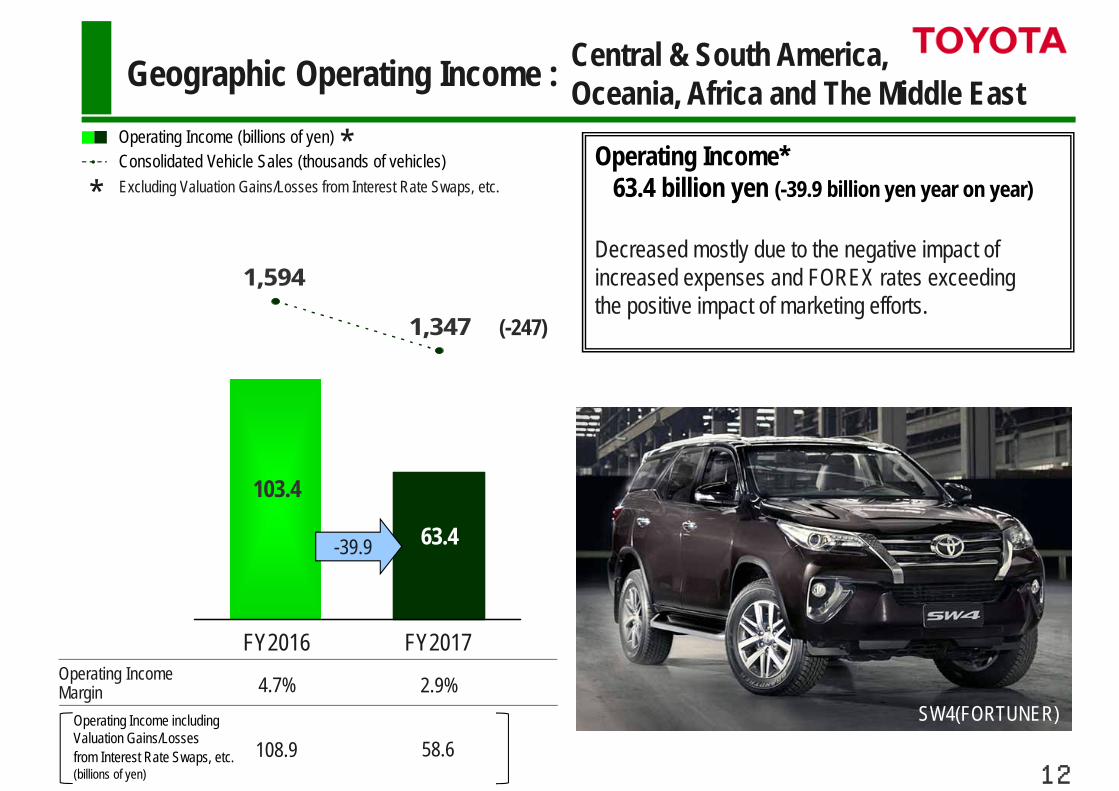
4.7% 2.9%
●
FY2017
(-247)
1,034
Operating Income*63.4 billion yen (-39.9 billion yen year on year)
Decreased mostly due to the negative impact of increased expenses and FOREX rates exceeding the positive impact of marketing efforts.
1,347
1,594
63.4
103.4
-39.9
108.9 58.6SW4(FORTUNER)
Geographic Operating Income : Central & South America, Oceania, Africa and The Middle East
Operating Income (billions of yen) Consolidated Vehicle Sales (thousands of vehicles)Excluding Valuation Gains/Losses from Interest Rate Swaps, etc.
**
Operating IncomeMargin
Operating Income including Valuation Gains/Lossesfrom Interest Rate Swaps, etc.(billions of yen)
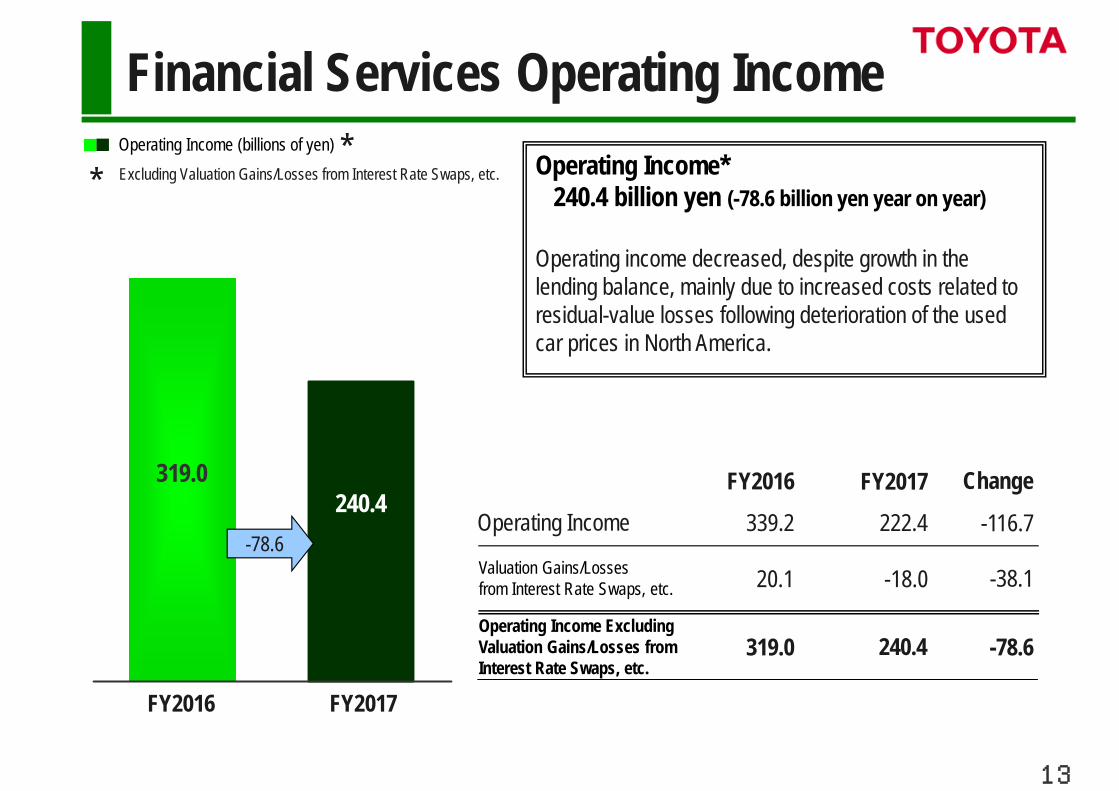
-116.7
-38.120.1
319.0 240.4 -78.6
-18.0
339.2 222.4
319.0240.4
-78.6
FY2016 FY2017
13
Operating Income*240.4 billion yen (-78.6 billion yen year on year)
Operating income decreased, despite growth in the lending balance, mainly due to increased costs related to residual-value losses following deterioration of the usedcar prices in North America.
Financial Services Operating IncomeOperating Income (billions of yen) Excluding Valuation Gains/Losses from Interest Rate Swaps, etc.
**
ChangeFY2016 FY2017Operating Income
Valuation Gains/Lossesfrom Interest Rate Swaps, etc.
Operating Income ExcludingValuation Gains/Losses fromInterest Rate Swaps, etc.
14
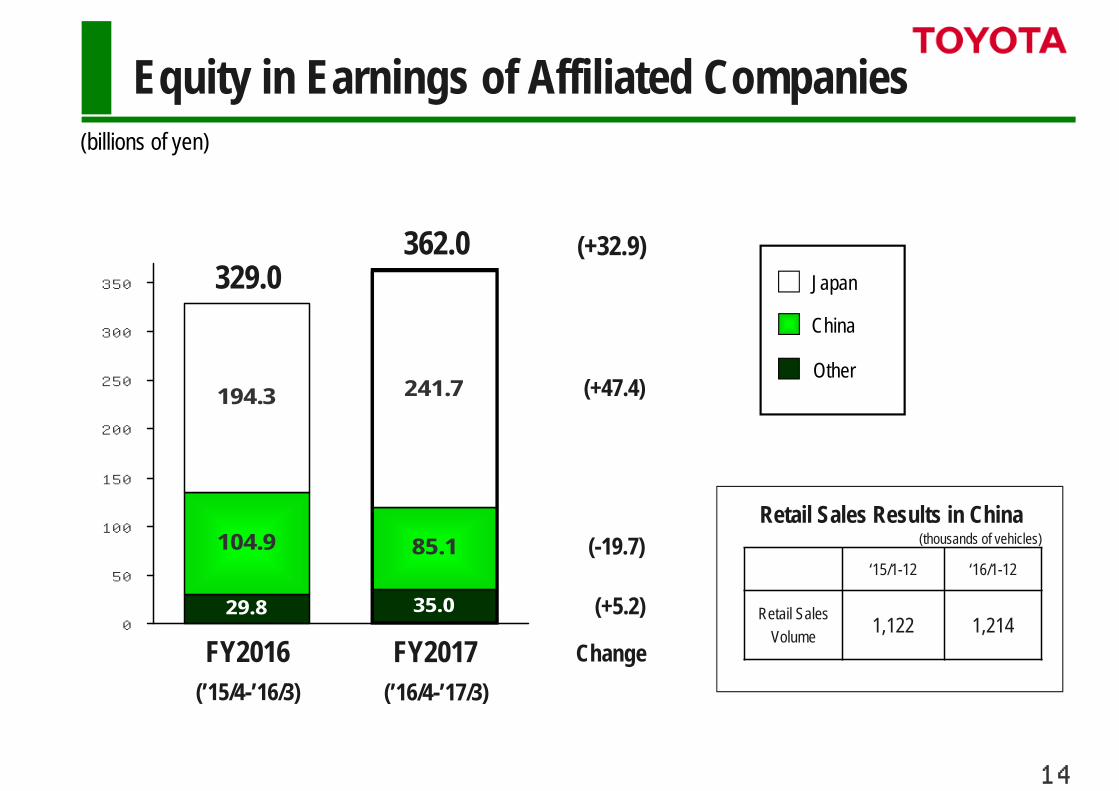
29.8 35.0
85.1104.9
241.7194.3
0
50
100
150
200
250
300
350
Change
China
Japan
Other
329.0362.0
(-19.7)
(+5.2)
(+47.4)
(+32.9)
76‘15/1-12 ‘16/1-12
Retail SalesVolume 1,122 1,214
FY2016(’16/4-’17/3)FY2017
(’15/4-’16/3)
Equity in Earnings of Affiliated Companies(billions of yen)
Retail Sales Results in China(thousands of vehicles)
15
75100 100
75
35
125
110
30
65
20
6565
20 20
25 30
110
30
100
60
0
50
100
150
200
Net Income (Right axis)
’17/3’15/3’14/3’13/3’12/3’11/3’10/3’09/3’08/3
210200
165
90
505045
100
140
’16/3
210
-5,000
0
5,000
10,000
15,000
20,000
25,000
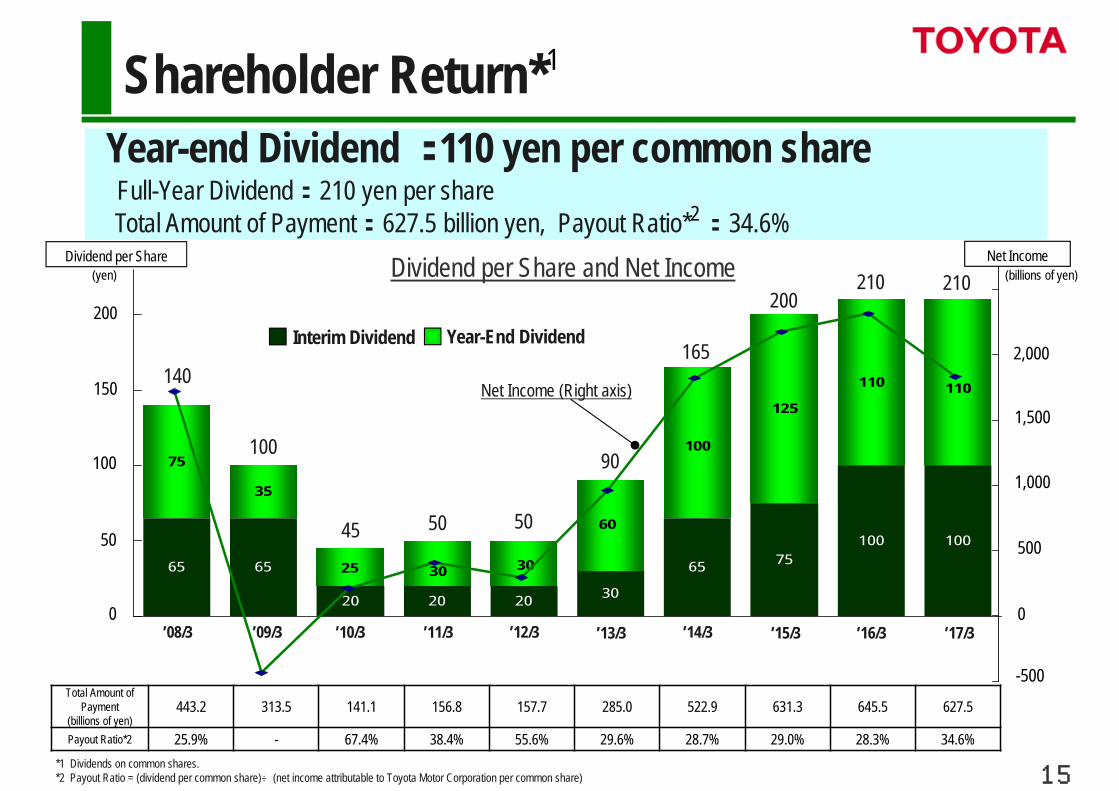
Shareholder Return*1
Year-end Dividend : 110 yen per common shareFull-Year Dividend:210 yen per shareTotal Amount of Payment:627.5 billion yen, Payout Ratio* :34.6%2
Dividend per Share(yen)
200
150
100
50
0
Net IncomeDividend per Share and Net Income
Interim Dividend Year-End Dividend2,000
2,500(billions of yen)
1,500
1,000
500
-500
0
Total Amount of Payment
(billions of yen)443.2 313.5 141.1 156.8 157.7 285.0 522.9 631.3 645.5 627.5
Payout Ratio*2 25.9% - 67.4% 38.4% 55.6% 29.6% 28.7% 29.0% 28.3% 34.6% *1 Dividends on common shares.*2 Payout Ratio = (dividend per common share)÷(net income attributable to Toyota Motor Corporation per common share)
0
100
200
300
400
500
600
700
800
900
1,000
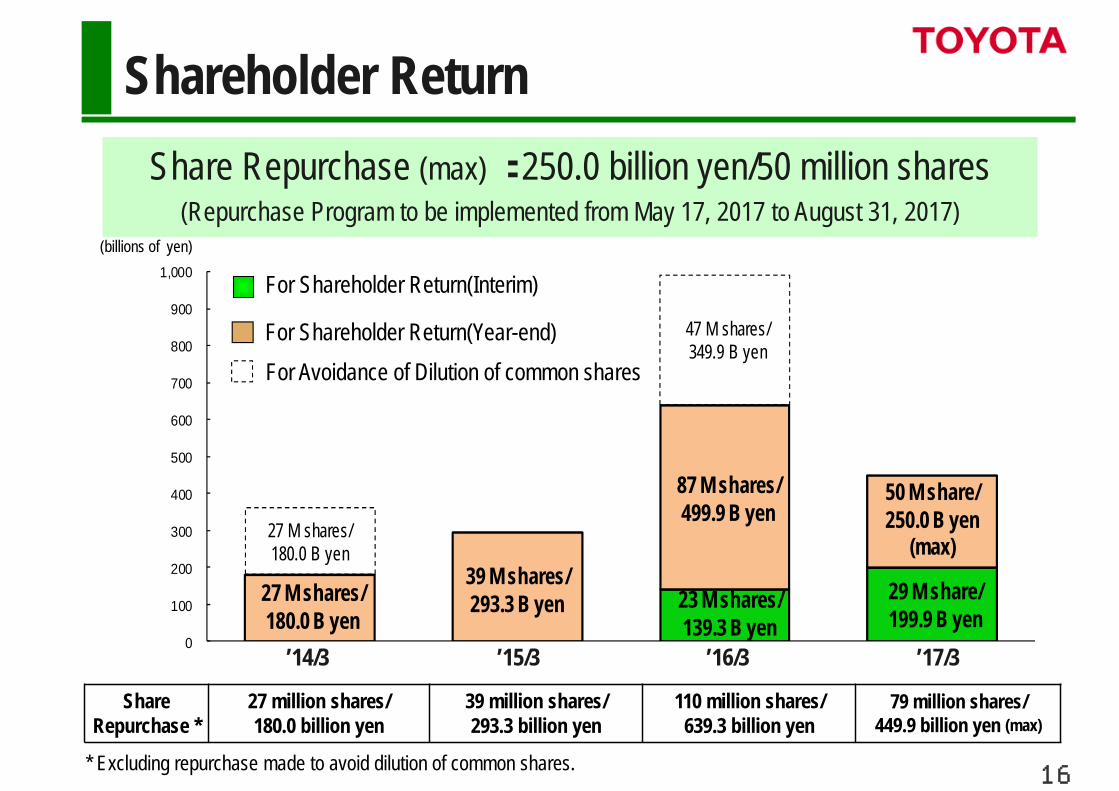
39 M shares/293.3 B yen
87 M shares/499.9 B yen
23 M shares/139.3 B yen
29 M share/199.9 B yen
27 M shares/180.0 B yen
47 M shares/349.9 B yen
27 M shares/180.0 B yen
50 M share/250.0 B yen
(max)
’14/3 ’15/3 ’16/3 ’17/3
16
Shareholder ReturnShare Repurchase (max) : 250.0 billion yen/50 million shares
(Repurchase Program to be implemented from May 17, 2017 to August 31, 2017)Share Repurchase (max) : 250.0 billion yen/50 million shares
(Repurchase Program to be implemented from May 17, 2017 to August 31, 2017)
For Shareholder Return(Interim)
For Shareholder Return(Year-end)For Avoidance of Dilution of common shares
* Excluding repurchase made to avoid dilution of common shares.
Share Repurchase *
27 million shares/180.0 billion yen
39 million shares/293.3 billion yen
110 million shares/639.3 billion yen
79 million shares/449.9 billion yen (max)
(billions of yen)
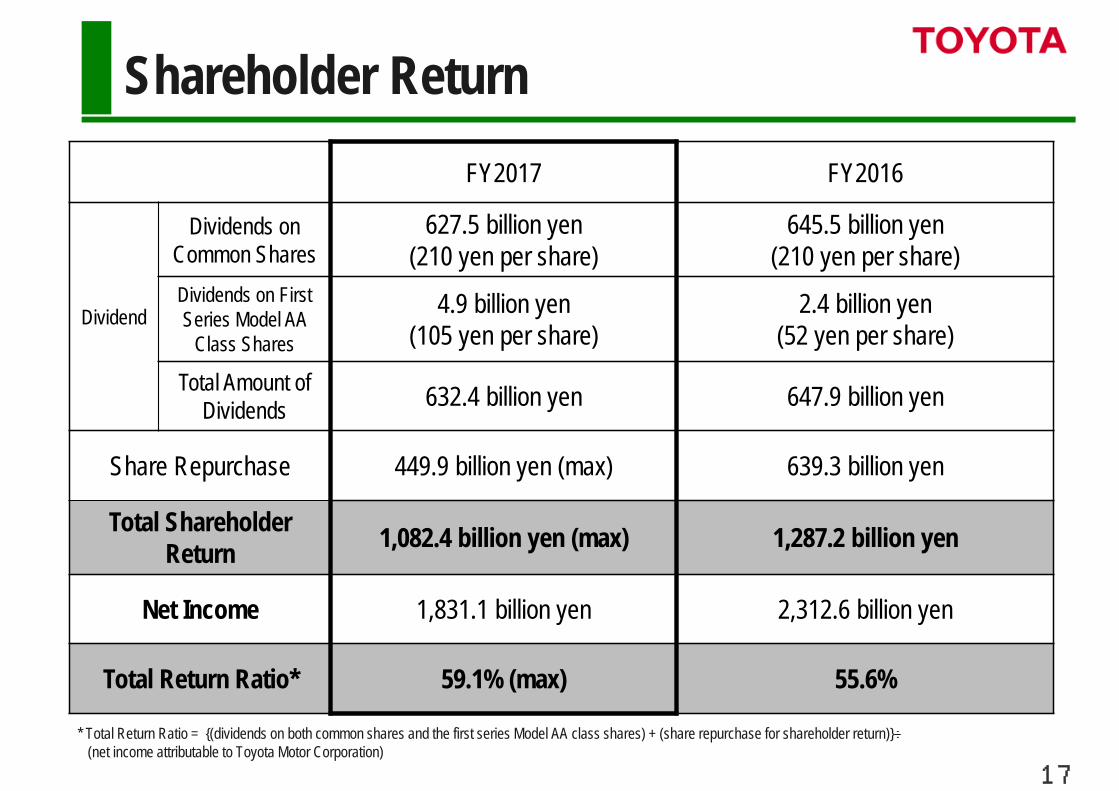
FY2017 FY2016
Dividend
Dividends on Common Shares
627.5 billion yen(210 yen per share)
645.5 billion yen(210 yen per share)
Dividends on First Series Model AA
Class Shares
4.9 billion yen(105 yen per share)
2.4 billion yen(52 yen per share)
Total Amount ofDividends 632.4 billion yen 647.9 billion yen
Share Repurchase 449.9 billion yen (max) 639.3 billion yen
Total Shareholder Return 1,082.4 billion yen (max) 1,287.2 billion yen
Net Income 1,831.1 billion yen 2,312.6 billion yen
Total Return Ratio* 59.1% (max) 55.6%
17
Shareholder Return
* Total Return Ratio = {(dividends on both common shares and the first series Model AA class shares) + (share repurchase for shareholder return)}÷(net income attributable to Toyota Motor Corporation)
FY2017 Financial Performance
FY2018 Financial Forecasts
18
FY2017 Financial Results
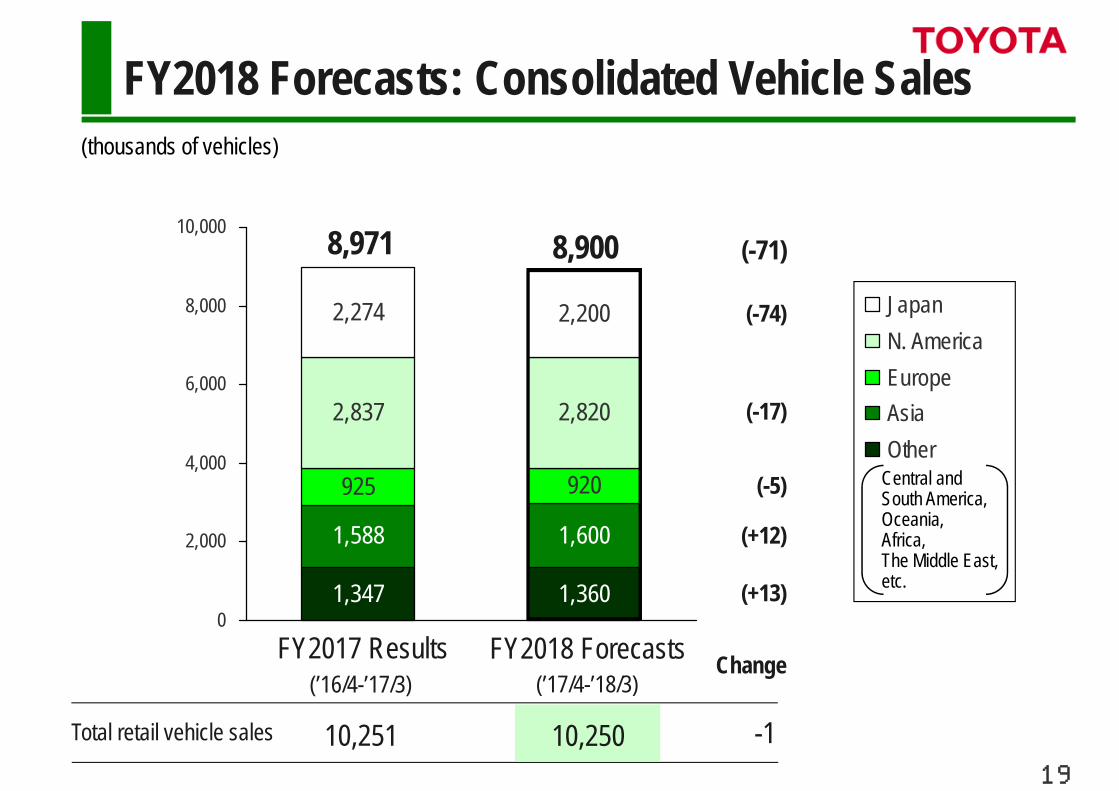
10,251 -1
1,347 1,360
1,588 1,600
925 920
2,837 2,820
2,274 2,200
0
2,000
4,000
6,000
8,000
10,000
JapanN. AmericaEuropeAsiaOther
8,971 8,900 (-71)
(-17)
(’16/4-’17/3)ChangeFY2017 Results FY2018 Forecasts
(’17/4-’18/3)
(-74)
(+13)
(+12)
(-5)
19
10,250
FY2018 Forecasts: Consolidated Vehicle Sales(thousands of vehicles)
Total retail vehicle sales
Central and South America,Oceania,Africa,The Middle East, etc.
FY2017 Results(’16/4-’17/3)
20
FY2018 Forecasts(’17/4-’18/3)
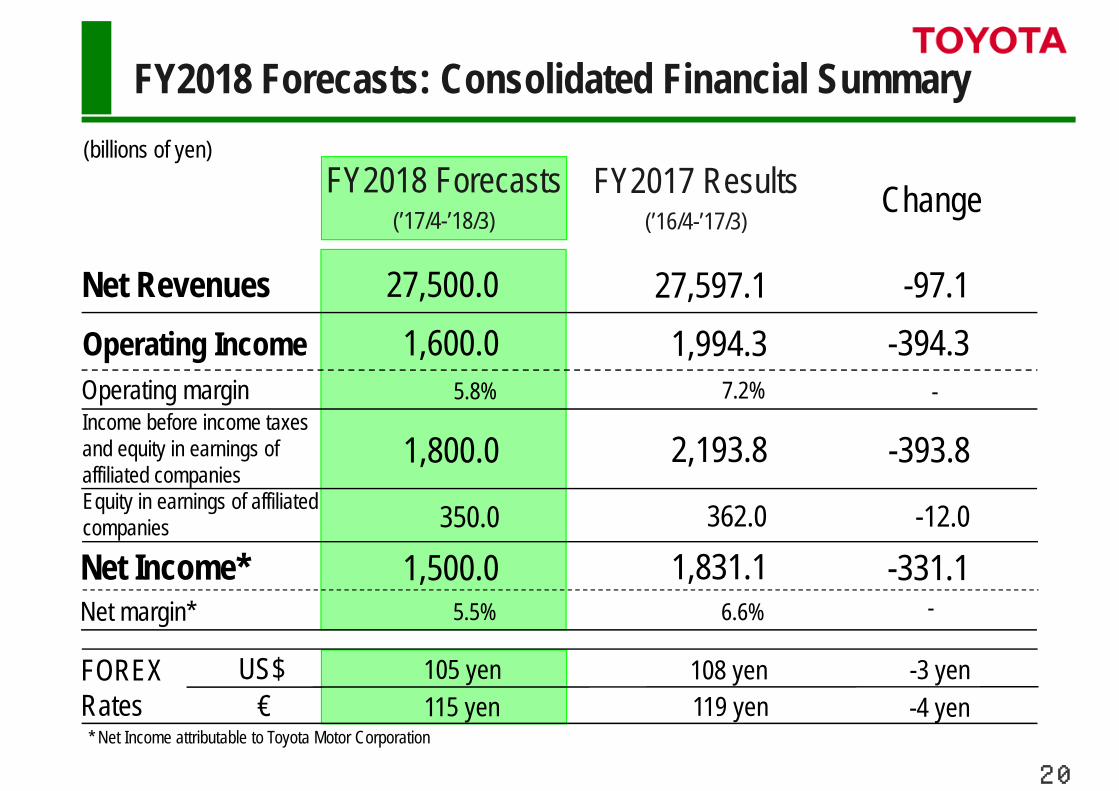
-3 yen-4 yen
6.6%5.5%-331.11,831.11,500.0
-7.2%5.8%
-393.82,193.81,800.0
-394.31,994.31,600.0-97.127,597.127,500.0
Change
-12.0362.0350.0
-
108 yen119 yen
105 yen115 yen
FY2018 Forecasts: Consolidated Financial Summary(billions of yen)
Net RevenuesOperating IncomeOperating marginIncome before income taxes and equity in earnings of affiliated companiesEquity in earnings of affiliated companies
Net Income*Net margin*
FOREX Rates
US$€
* Net Income attributable to Toyota Motor Corporation
21
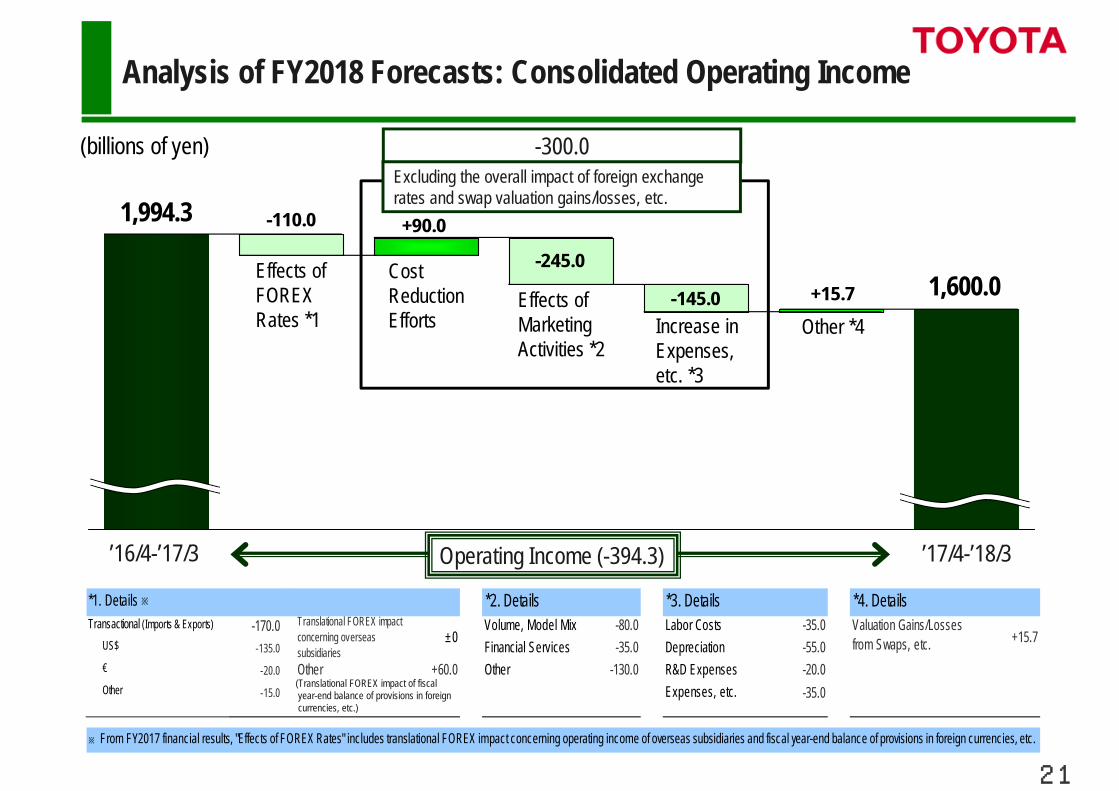
+90.0
-145.0 +15.7
-245.0
-110.01,994.3
1,600.0
’16/4-’17/3 ’17/4-’18/3
Analysis of FY2018 Forecasts: Consolidated Operating Income
(billions of yen) -300.0Excluding the overall impact of foreign exchange rates and swap valuation gains/losses, etc.
Effects of FOREX Rates *1
Cost Reduction Efforts
Effects of Marketing Activities *2
Increase in Expenses, etc. *3
Other *4
Operating Income (-394.3)
Transactional (Imports & Exports) -170.0 Volume, Model Mix -80.0 Labor Costs -35.0 US$ -135.0 Financial Services -35.0 Depreciation -55.0 € -20.0 Other +60.0 Other -130.0 R&D Expenses -20.0 Other -15.0 Expenses, etc. -35.0
※From FY2017 financial results, "Effects of FOREX Rates" includes translational FOREX impact concerning operating income of overseas subsidiaries and fiscal year-end balance of provisions in foreign currencies, etc.
*1. Details ※ *4. Details*3. Details
±0Translational FOREX impactconcerning overseassubsidiaries
*2. DetailsValuation Gains/Lossesfrom Swaps, etc. +15.7
(Translational FOREX impact of fiscal year-end balance of provisions in foreign currencies, etc.)
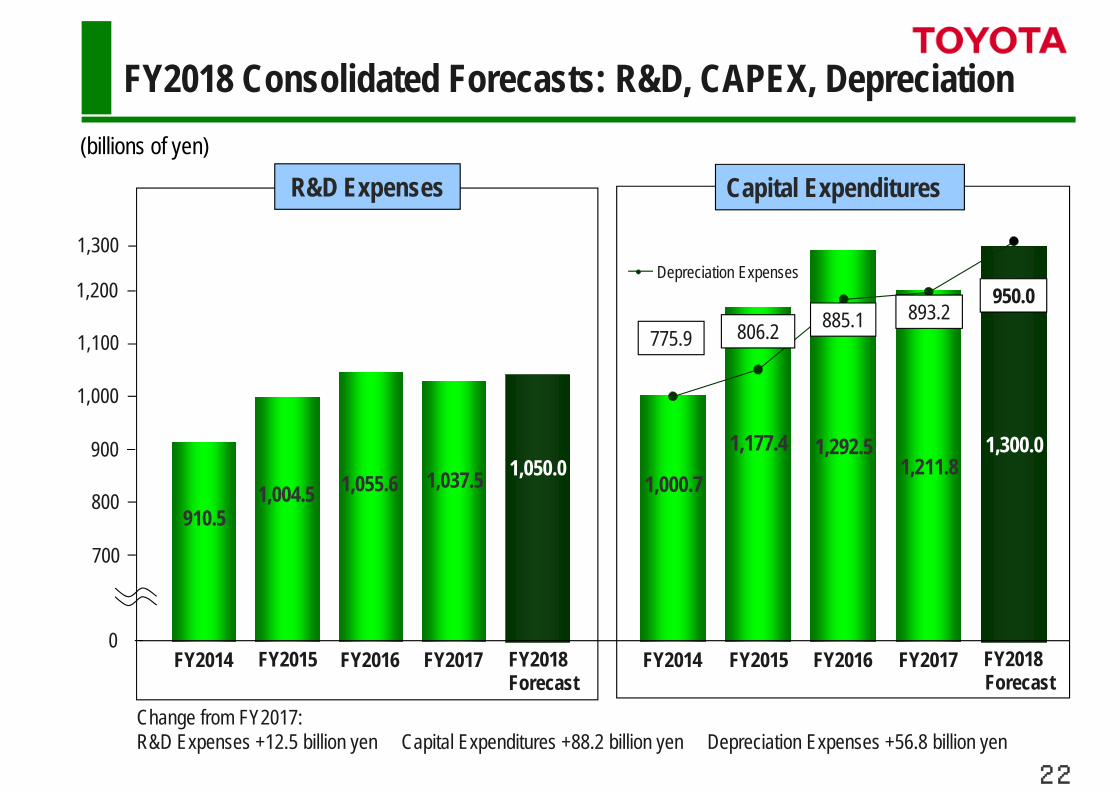
1,000
1,050.01,004.5
910.51,055.6 1,037.5
1,300.01,177.4
1,000.71,292.5
1,211.8
885.1775.9 806.2
950.0
FY2014 FY2015 FY2016 FY2017 FY2018Forecast
FY2014 FY2015 FY2016 FY2017 FY2018Forecast
800
900
700
0
●
1,100
1,200
1,300
893.2
22
FY2018 Consolidated Forecasts: R&D, CAPEX, Depreciation(billions of yen)
R&D Expenses Capital Expenditures
Depreciation Expenses
Change from FY2017:R&D Expenses +12.5 billion yen Capital Expenditures +88.2 billion yen Depreciation Expenses +56.8 billion yen

TOYOTA C-HR
Toyota Motor CorporationMay 10, 2017
FY2017 Financial Results
Toyota Camry(North American InternationalAuto Show 2017 exhibition car)
24
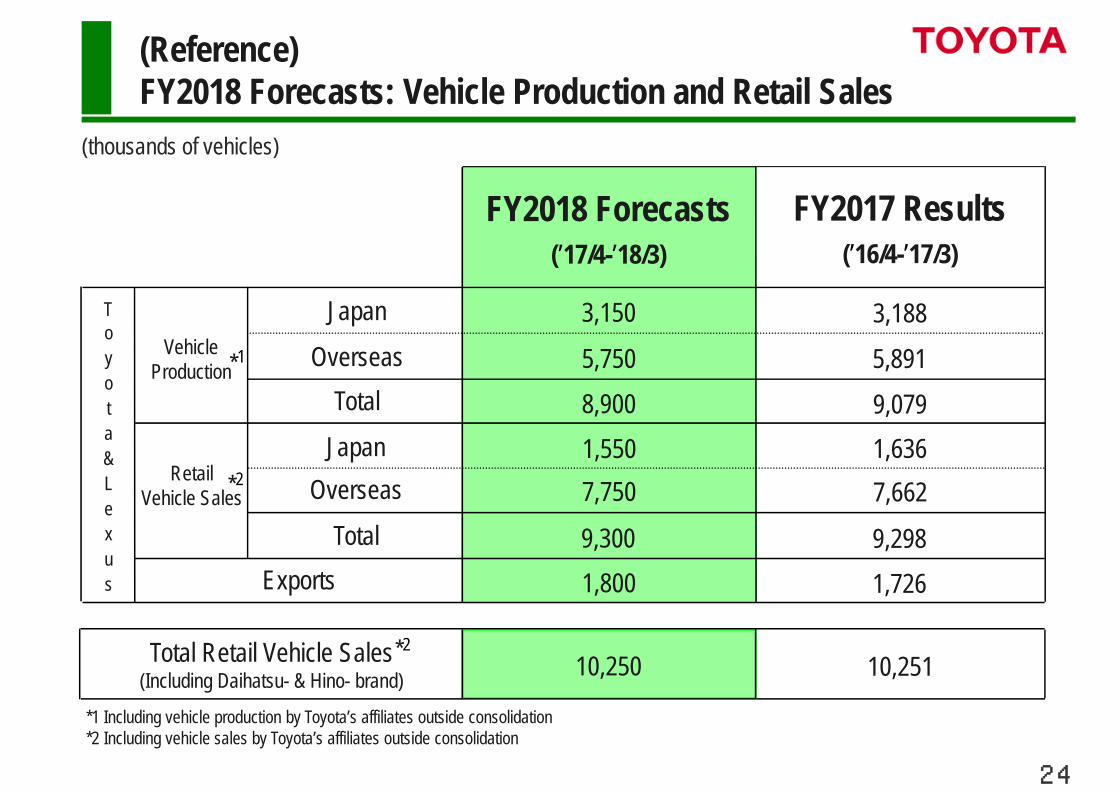
5,891
10,251
1,726 9,298
7,6621,6369,079
3,188
FY2017 Results(’16/4-’17/3)
10,250
1,800 9,300
7,7501,5508,900 5,750
3,150Toyota&Lexus
FY2018 Forecasts(’17/4-’18/3)
(Reference) FY2018 Forecasts: Vehicle Production and Retail Sales
(thousands of vehicles)
Vehicle Production
Retail Vehicle Sales
1
2*
*
Japan
TotalJapan
OverseasTotal
Overseas
Exports
Total Retail Vehicle Sales(Including Daihatsu- & Hino- brand)
*2
*1 Including vehicle production by Toyota’s affiliates outside consolidation*2 Including vehicle sales by Toyota’s affiliates outside consolidation
25
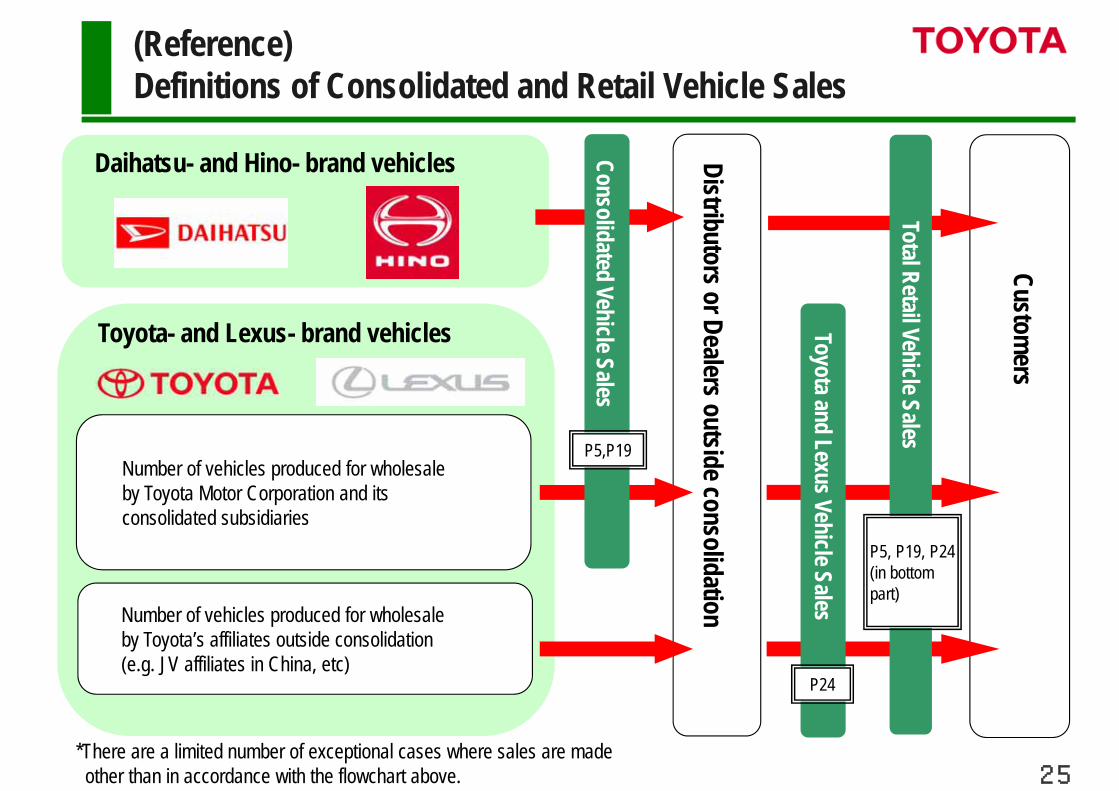
(Reference)Definitions of Consolidated and Retail Vehicle Sales
Daihatsu- and Hino- brand vehicles
Toyota- and Lexus- brand vehicles
Number of vehicles produced for wholesale by Toyota Motor Corporation and its consolidated subsidiaries
Number of vehicles produced for wholesale by Toyota’s affiliates outside consolidation (e.g. JV affiliates in China, etc)
Distributors or Dealers outside consolidation
Customers
Total Retail Vehicle Sales
Toyota and Lexus Vehicle Sales
*There are a limited number of exceptional cases where sales are made other than in accordance with the flowchart above.
P24
P5, P19, P24(in bottom part)
P5,P19
Consolidated Vehicle Sales


![Toyota Innova Brochure [toyota-solo.com]](https://static.fdocument.pub/doc/165x107/552a55904a7959286e8b45c5/toyota-innova-brochure-toyota-solocom.jpg)