
Full Text
201
Title [125I] iodomelatonin binding sites in the avian brain and retina Author(s) Yuan, He.; 袁和 Citation Issued Date 1993 URL http://hdl.handle.net/10722/34852 Rights The author retains all proprietary rights, (such as patent rights) and the right to use in future works.
description
thesis
Transcript of Full Text
Title [125I] iodomelatonin binding sites in the avian brain and retina
Author(s) Yuan, He.; 袁和
Citation
Issued Date 1993
URL http://hdl.handle.net/10722/34852
Rights The author retains all proprietary rights, (such as patent rights)and the right to use in future works.

THESIS ENTITLED: "[! 251]IODOMELATONIN BINDING SITES IN THE AVIAN BRAIN AND RETINA"
SUBMITTED BY: HE YUAN
FOR THE DEGREE OF: Ph. D
A T THE UNIVERSITY OF HONG KONG IN SEPTEMBER 1993
ACKNOWLEDGMENTS
This thesis is dedicated to my loving wife, L i Ning and my son, Xiao Hu.
I would like to express my deepest and lasting appreciation to my supervisor. Dr. S. F.
Pang for his supervision, encouragements and help in making this achievement possible. I would
like to thank all my colleagues and friends, Mr. Peter Lee. Mrs. Elizabeth Ayre, Miss Kimmy
Tsang, Mr. T.K. Yung, Ms L u Yan and Mrs Celia Pang for their enthusiastic support and
dependable friendship. I am indebted to Dr. A. E. Allen, Miss Cathi Brown and Miss Catherine
Tenn for their thoughtful suggestions for my thesis. Thanks is also extended to Dr. G. M . Brown
for providing me the opportunity to work in the Clarke Institute of Psychiatry during the last year
of my Ph. D program.

ABSTRACT
The radioreceptor binding assay set up in the present studies is a sensitive, stable and
reliable assay. The successful melatonin iodination, using iodogen and the effective separation
of iodomelatonin by HPLC, provides a ligand with high specific activity and purity. These
characteristics are supported by the binding results of high affinity, high specificity and low
non-specific binding from avian brain membrane preparations.
Our results confirmed and extended the findings of [125I]iodomelatomn binding sites in
the brain tissue of birds. The binding characteristics satisfied all the criteria for a hormone
binding site. Regional distribution studies showed that the high affinity [125I]iodomelatonin
binding was found in all brain regions examined. The order of binding density in those regions
was hypothalamus > midbrain > pons-medulla > telencephalon > cerebellum. Subcellular
distribution studies demonstrated that the binding sites localize in the crude membrane
fractions. The [125I]iodomelatonin binding characteristics that were demonstrated in the present
studies are similar in the brains of different avian species including; chickens, pigeons,quails and ducks. Compared to the binding sites in the brain tissue of mammals, the high affinity [125I]iodomelatonin binding sites are widely distributed throughout the whole brain suggesting differences in the activity and/or functions of pineal melatonin between birds and mammals.
The development of [125I]iodomelatonin binding sites in chicken embryo brain tissues begins earlier than in mammals. The developmental pattern and the effect of Guanosine S'-ty-thio]triphosphate (GTPyS) on the binding density suggest that functional melatonin receptors
may be expressed in the early development of the chicken embryo brain. The diumal variation of [125I]iodomelatonin binding sites in the chicken brain was
inversely related to the rhythm of serum melatonin. Melatonin administration decreased and pinealectomy increased the binding capacity suggesting that the circulating melatonin concentration can regulate the density of [125I]iodomelatomn binding sites in chicken brains.
The physiological significance of the high affinity [ 125I]icxiomelatonin binding sites in the avian brain was demonstrated in the present studies by: 1) The affinity of the binding sites in the brain was of the same order of magnitude as the melatonin concentration in the circulation; 2) The uneven regional distribution of the binding sites was parallel with that of endogenous melatonin; 3) Melatonin and related indoles had the same order of potency in the inhibition of [125I]iodomelatomn binding in the chicken brain membrane preparations and in the inhibition of p H ] dopamine release from the chicken retina; 4) GTP analogues decreased

the binding capacity, both in embryo and chicken brains indicating that the chicken brain
[125I]iodomelatonin binding sites belong to the family of G-protein-linked receptors.
The [125I]iodomelatonin binding sites demonstrated in chicken retina have similar
binding characteristics, diumal variation and developmental pattern to the binding sites in the
chicken brain. It is speculated that the binding sites in the chicken brain and retina belong to a
similar group of high-affinity binding sites which reside in different tissues.
CONTENT
I. INTRODUCTION 1
A . PHYLOGENY OF THE PINEALOCYTE 1
1. Pineal photoreceptor cells in lower vertebrates
2. Pineal photoreceptor cells in birds
3. Pinealocytes in mammals
B . MELATONIN RECEPTORS IN BRAIN AND RETINA 8
1. The speculation of melatonin receptors in brain and retina
1). Pharmacological study - the structure-activity relationships of melatonin
2). Physiological study - localization of melatonin receptors in the brain and retina
3). Biochemical study - The uneven distribution of exogenous and endogenous
melatonin in the brain
2. Identification of melatonin receptors in the brain and retina by receptor binding studies
1). The radioligands: Tritiated and iodinated melatonin in receptor identification
2). Affinity and density of pH]-melatonin binding sites in the brain and retina
3). Affinity and density of [ ^I]Icxlomelatomn binding sites in the brain and retina 3. Multiple [•'•^IJIodomelatomn binding sites in the brain and retina 4. Receptor agonists and antagonists 5. Receptor regulation 6. The mechanism of melatonin receptor actions
1) Guanine nucleotide-binding proteins (G-protein) related signal transduction systems 2) Melatonin receptors and G protein related signal transduction systems
IL MATERIALS AND METHODS A. MATERIALS:
2 5 2 5
1 • Chemicals 2 . Animals

B. METHODS 27
1 • Sample collection 2 . Tissue preparation 3 . Binding assay
1) Iodination of melatonin 2) Saturation study 3) Kinetic study 4) Specificity 5) Cytosol binding assay 6) Data analysis of binding study
4 . Protein determination 5 . Radioimmunoassay of melatonin 6 . Pinealectomy 7 • Melatonin administration 8 . Statistics
III. RESULTS 4 1
A . METHODOLOGY 4 1
1 • Iodination of melatonin 1) • Separation of the radioligand 1)• [125j;]iodomelatoniii purification and stability
2 . Conditions for the binding assay 1). Effects of p H and ions on [^^Ijiodomelatonin binding to chicken brain
membrane preparations 2). The effect of temperature on the [^^I]iodomelatomn binding to chicken brain
membrane preparations 3 • Tissue concentrations 4 . Sample stability
B. [1 2 5I]IODOMELATONIN BINDING SITES IN BRAIN TISSUE OF BIRDS: G E N E R A L BINDING CHARACTERIZATION AND REGIONAL DISTRIBUTION 47
1 • Kinetic Studies 2 . Saturation Studies 3 . Specificity 4 . Regional Distribution 5 . Subcellular Distribution 6 . Effects of GTP analogues on chicken brain [^^Ijiodomelatomn binding sites
C. D I U R N A L V A R I A T I O N A N D E F F E C T S O F M E L A T O N I N MANIPULATIONS O N [ 1 2 5 I ]IODOMELATONIN BINDING SITES IN THE CHICKEN BRAIN 5 1
1. Diumal rhythms of serum melatonin levels and binding capacities of [^^IJiodomelatonin binding sites
2 . Effects of melatonin administration on serum melatonin levels and [^^I]iodomelatonin binding capacities
3 . Effects of pinealectomy on serum melatonin levels and [^^I]iodomelatonin binding in the brain
D . DEVELOPMENT OF [ 1 2 5 I]IODOMELATONIN BINDING SITES IN THE CHICKEN BRAIN 5 4
1. Comparison of [^^I]iodomelatomn binding characteristics between the 17-day-old embryo and young chicken brain membrane preparations 1). Kinetic study 2). Saturation Study 3). Specificity
2 . Development of chicken brain [ i o d o m e l a t o n i n binding sites 1). Development of chicken brain weight and the protein content 2). Development of chicken brain [^^jiodomelatomn binding sites

3 • Development of the diumal rhythm of [ 1 2 5 I ] iodomelatonin binding sites in the chicken brain
4 . The effect of GTPyS on the [^^1]iodomelatonin binding sites in embryonic chicken brain
E . BINDING CHARACTERISTICS AND DIURNAL VARIATION OF [ 1 2 5 I ] -IODOMELATONIN BINDING SITES IN THE CHICKEN RETINA 59
1. Kinetic study 2 . Specificity 3 • Saturation study 4 . Diumal variation
F . DEVELOPMENT OF [ 1 2 5 I]IODOMELATONIN BINDING SITES IN THE CHICKEN RETINA 6 2
1 • The binding characteristics of [^^1]iodomelatonin binding sites in embryonic chick retina 1). Kinetic studies 2). Specificity 3). Saturation study 4). Diumal variation of [^^I]icKiomelatonin binding
2 . The development of [^^I]iodomelatomn binding sites in chicken retinas
IV. DISCUSSION 6 5
A . CHARACTERIZATION OF [1 2 5I]IODOMELATONIN BINDING SITES IN THE AVIAN BRAIN 6 5
1 • The radioligand - [•'•^Ilxodomelatomn 2 . The identification and characterization of [ 1 ] iodomelatonin binding sites in avian brain 3 • The physiological significance of the [^^]iodomelatonin binding sites in chicken brain
B . C I R C A D I A N R H Y T H M AND E F F E C T S O F M E L A T O N I N MANIPULATIONS ON THE [125I]IODOMELATONIN BINDING SITES IN T H E CHICKEN BRAIN 73
1 • Diumal rhythms of serum melatonin levels and [^^jiodomelatonin binding capacities 2 . Effect of melatonin administration on serum melatonin levels and [ ] i o d o m e l a t o n i n
binding capacities 3 • Effect of pinealectomy on serum melatonin levels and [^^I]iodomelatonin binding in the
brain
C . THE DEVELOPMENT OF [1 2 5I]IODOMELATONIN BINDING SITES IN THE CHICKEN BRAIN 7 9
1. Characteristics of [^^I]iodomelatonin binding sites in the embryonic chicken brain 2 . The early appearance of [^*^1]iodomelatonin binding sites in the embryonic chicken brain 3 • The developmental pattern of [^^I]iodomelatonin binding sites in the perinatal chicken
brain 4 . The development of the diumal rhythm of iodomelatonin binding sites in the chicken
brain 5 . The significance of [^^]icxiomelatonin binding sites in the embryonic chicken brain
D. BINDING CHARACTERISTICS, PHARMACOLOGICAL PROFILE A N D DEVELOPMENT O F [ 1 2 S I ] IODOMELATONIN BINDING SITES IN THE CHICKEN RETINA 8 5
1. Characteristics of [^^1] icxiomelatonin binding sites in the embryo and chicken retina 2 . 丁he development of the [^I]iodomelatonin binding sites in "the chicken retina 3. The diumal variation of [125jjiodomelatonin binding sites in the chicken retina
V. REFERENCES 91
V L FIGURES 106
VII. TABLES 134

L INTRODUCTION
A . PHYLOGENY O F T H E PINEALOCYTES
The pineal organ (pineal gland or epiphysis) of most vertebrates plays a pivotal role in
the conversion of photoperiodic information to a rhythmic hormonal signal which affects major
physiological and behavioural adjustments to daily as well as seasonal fluctuations in the
environment (Cassone, 1990).
Vertebrate pineal systems manifest considerable morphological variation of
organization during the phylogenetic development at both cellular and whole-organ levels, (see
the reviews by Collin, 1971; Oskshe, 1971; Collin and Oksche, 1981; Collin et al., 1987;
Oksche, 1986). Embryologically, the pineal gland and lateral eyes both develop as evagination
of the diencephalon (Flight,1979). In mammals,the pineal gland develops into an indirectly
photosensitive secretory endocrine organ,whereas in lower vertebrates (fish,amphibians and
reptiles), the pineal develops into a photoendocrine transducer containing cellular elements that
are directly photosensitive. The structural and functional transfomation from a well developed
sensory pineal organ in lower vertebrates into the secretory pineal organ of mammals has been
demonstrated in avian pineal photoreceptor cells (Wurtman et al.,1968; Collin et al., 1987;
Pang et al.,1989).
1 . PINEAL PHOTORECEPTOR CELLS IN LOWER VERTEBRATES
The most prominent anatomical feature of pineal systems in lower vertebrates is the
presence of a two-component system consisting of both the highly differentiated eye-like
extracranial photosensory structures generally termed the parapineal component (third eye),
including the parapineal organ in fish, frontal organ in amphibian and the parietal eye in reptile,
and an intracranial pineal organ proper portion (epiphysis cerebri) (Dodt, 1987; Underwood,
1982). In the fish (e.g. Agnatha) the eye-like parapineal organ is represented by a vesicle
consisting of two "retinas", a dorsal one, and a ventral one. The "retina" consists of an internal
epithelial layer and an external layer of ganglion cells and nerve fibres. In the reptile (e.g.
Anguis fragilis) the "retina" in the parietal eye contains synaptic junctions of photoreceptors
with ganglion cells very similar to the lateral eye synaptic zones. The axons of the ganglion
cells form the pineal nerve. Most of the pinealocytes in pineal organs of lower vertebrates are
also, in ultrastructural and functional terms,similar to the cone-like photoreceptor of the retina.
They are endowed with regularly lamellate outer segments (photoreceptor poles, receptive
poles). The basal processes (synaptic pedicles, transmission poles or effective poles) of the
photoreceptor cells are established by a basal pedicle containing clear synaptic vesicles and
synaptic ribbons. By means of these basal processes, typical pineal photoreceptor cells form
synapses with afferent, second-order neurons (ganglion cells) whose axons extend through the
pineal stalks. This afferent pineal tract (pineal nerve) projects to defined regions of the brain
(Collin and Oksche, 1981).
The functional response of the pineal photoreceptor to light stimulation was first
reported by Dodt and Heerd (1962) using electrophysiological records in the anuran frontal
organ and the lizard parietal eye. During the past 30 years electrical recordings from pineal
photoreceptors in lower vertebrates have demonstrated that the mode of action of pineal and
parietal photoreception resembles that of ocular photoreception in that the onset and offset of
light are followed by inhibitory and excitatory changes in neuronal activity respectively (Dodt,
1987). Dodt (1987),Meissi (1986) and Underwood (1982) summarized these
electrophysiological studies and concluded that an intracranially located pineal was mainly a
luminance detector which encoded the quantity of light and functioned as an indicator of
daylength and dosimeter of solar radiation, and that an extracmnially located pineal principally
had chromatic (wavelength) response which encoded information about its quality.

Morphologically, the pineal photoreceptor cells of lower vertebrates have also given
ample evidence of secretory activity (Oskche et al.,1987). Thus, pinealocytes of lower
vertebrates can directly transduce the photoperiodic information both into neural impulses and
hormonal signals (Pang et al., 1989). Whether pineal of lower vertebrates have the ability to
generate circadian oscillations at the cellular levels is still an open question (Collin et al.,
1987).
2 . PINEAL PHOTORECEPTOR CELLS IN BIRDS
The avian pineal gland is superficially located beneath the skull. Photoreceptor cells in
the avian pineal gland are modified photoreceptor cells (rudimentary photoreceptor cells).
These cells morphologically resemble both typical sensory cells in lower vertebrates and the
endocrine cells in mammals (Collin and Oksche,1981).
Avian pinealocytes resemble pineal photoreceptors of poikilotherms in their basic
segmental zonation. These cells display a remarkable variety in the appearance of their outer
segments and basal pedicles. The outer segments of avian pinealocytes are less regularly
organized. Although the modified photoreceptor cells are not connected with afferent neurons
they still establish synaptic contacts with intrapineal neurons by "synaptic" ribbons, which
suggest the presence of intercellular communication by these organelles (Collin and Oksche,
1981; Collin et al.,1987). Parallel to these changes in the ultrastructure of the outer segments
there are an abundance of dense-core vesicles elaborated in the Golgi-complex (Collin, 1979;
Oksche, 1983) suggesting the secretory function of the pinealocytes.
Attempts to detect avian pineal electrical responses to direct stimulation with light have
failed (Morita 1966; Dodt 1987), although in some avian pineal parenchyma,the presence of
ganglion cells and a well-developed pineal tract have been demonstrated (See Ueck, 1979).
The possible direct photosensitivity of the bird pineal has been demonstrated by both in
vitro and in vivo studies. In vitro studies of NAT levels in the chicken pineal gland (Binkley et
al.,1978a; Deguchi,1979,Deguchi, 1981; Kasal et al” 1979; Kasal and Perez-polo, 1980;
Takahashi et al., 1980) have shown that the avian pineal is capable of responding to changes
in the L:D stimulus indicating direct photoreceptivity. In vivo,the chicken pineal melatonin
synthesis appears not to depend on an intact sympathetic innervation, as is the case in mammals
(Ralph et al., 1975; Binkley, 1981). It has been speculated that this direct response of chicken
pinealocytes to light is dependent on the presence of rhodopsin (Deguchi, 1981). Thus, the
chicken pineal gland can be considered to be a photoendocrine transducer (Zatz et al.,1988;
Pang et al., 1989).
In recent years, the concept of direct sensori-hormonal transduction in melatonin
secreting cells has been introduced (Pang et al., 1989). The criteria for the direct sensori-
hormonal transduction cells are: 1) It has to be a sensory receptor with characteristics of a
transducer and encoder to the adequate stimulus; 2) It has the ability to secrete a hormone; and
3) The secretory activity of the cell varies with changes in the quantity and/or quality of the
adequate stimulus (Pang et al., 1989). According to the above criteria, photoreceptors in the
retinas of fish and alligator and pinealocytes of the avian pineal gland are suggested to be
examples of sensori-hormonal cells with the adequate stimulus involved being light and the
hormone secreted,melatonin (Pang and Woo, 1987).
There is considerable evidence that the pineal gland of, at least, some birds contains a
circadian pacemaker which plays a major role in the overall temporal organization of the bird.
The control of circadian rhythms in avian locomotor activity by pineal melatonin has been well
established with the house sparrow where pinealectomy abolished and melatonin implantation
induced the rhythmic locomotor activity (Caston and Menaker,1968; Turek et al” 1976). The
presence of an endogenous pacemaker in the bird pineal gland was demonstrated
unambiguously by transplantation experiments (Pang 1974; Zimmerman and Menaker, 1979).

A series of arrhythmic, pinealectomized birds kept in the dark served as hosts for pineal glands
removed from donor birds, which had been kept under two different cycles of illumination.
Glands from the donors were transplanted into the anterior eye chamber of the hosts and the
latter were then returned to constant darkness. The hosts developed circadian rhythms in
locomotor activity with times of onset of activity corresponding closely to those previously
entrained in the donor. Moreover, the phase-response curve of the acquired rhythm of the host
birds when exposed to 6 hour pulses of light was indistinguishable from that of normal birds
(Zimmerman and Menaker, 1979).
The most extensive studies of control of N A T activity in avian pineal gland,both in
vitro and in vivo,have been made with domestic chicken,which suggest that the chick pineal
gland contains an endogenous oscillator (Binkley,1981).
In vivo, the chick pineal gland exhibits a marked diumal rhythm of NAT activity which
persists in constant darkness, is entrained by illumination and manifests a phase shift in
response to a phase-shift stimulus (Binkley, 1981; Binkley et a l , 1981), In vitro, chick pineal
gland explants continued to display daily rhythms in NAT activity under the normal light: dark
cycle or under constant darkness. When the photoperiod was reversed by 180® the shifted
NAT activity rhythm was in line with the new light:dark cycle (Deguchi, 1979; 1981). This
confirmed the photoreceptivity of chicken pineal and suggested that the chick pineal organ
contains an endogenous oscillator which controls the activity of the enzyme (Kasal and Perez-
Polo, 1980). Deguchi (1979), and Zatz et al. (1988) showed that dispersed cell cultures of
chick pineal expressed circadian rhythms of NAT activity and melatonin release as well as the
phase-shifting effect of single light pulses on the melatonin rhythm. These experiments
demonstrate that the dispersed pineal cells are photoreceptive in culture and that the melatonin
rhythm in dispersed pineal cell cultures can be entrained by light cycles in vitro. Thus,the
isolated pineal contains all of the components of a circadian system: a pacemaker or oscillator.
photoreceptive input,and an overt rhythmic output-melatonin. The key question remains: are
circadian oscillators contained in pinealocytes? Using microculture containing only one
pinealocyte,it has been demonstrated that the melatonin rhythm was still expressed (Takahashi
et al., 1989). This suggests that all three functions (photoreception, circadian oscillation, and
melatonin synthesis) might be a cellular property of chicken pinealocytes (Takahashi et a l ,
1989).
PINEALOCYTES IN MAMMALS
The last step in the evolution of pinealocytes is demonstrated in mammals. Mammalian
pinealocytes lack outer segments as well as typical inner segments. They contain dense-core
vesicles that are frequently concentrated in the processes of these cells. Their synaptic ribbons
are located close to the cell membrane and face adjacent pinealocytes (See Oksche et al” 1987;
Collin and Oksche 1981).
Pinealocytes of mammals are considered to be entirely secretory cells that are indirectly
influenced by photoperiodic stimuli (Wurtman et al., 1968). In adult mammals, pineal nerve
cells and their central projections are absent. However,its efferent innervation is well
developed. Light stimuli appear to be exclusively perceived by the retina of the lateral eyes and
conveyed to the pineal organ via a complex neuronal chain involving the retinohypothalamic
pathway (Moore,1987). The retinohypothalamic projection, probably originating in the
ganglion layer of the retina,terminates in the suprachiasmatic nucleus. The neural route by
which stimulatory signals from the suprachiasmatic nucleus reach the pineal gland starts with
efferent projections directed caudalward to the periventricular and ventral tuberal areas of the
hypothalamus, and then via the medial forebrain bundle and the midbrain reticular formation,
to the upper thoracic intermediolateral cell column. Cells in the thoracic intermediolateral cell
column provide preganglionic input to the superior cervical ganglia of the sympathetic nervous
system. Postganglionic sympathetic fibres from the superior cervical ganglion form the nervi
conari reaching the pineal organ with blood vessels (Moore, 1987). Noradrenaline from the
sympathetic fibres cause a receptor-mediated increase in the production of c A M P in
pinealocytes leading to a 70-100-fold increase in the activity of N A T within a few hours (see
Ueck,1979).
In mammals, neither the pacemaker nor photosensitivity reside in the gland itself (Pang
et al., 1989). Present evidence indicates that the pacemaker is in the suprachiasmatic nuclei of
the hypothalamus and the photoreceptors are in the retina. The mammalian pineal gland
produces melatonin in response to the neurotransmitter norepinephrine which is released by the
sympathetic nerves that innervate it. It is thus a "neuroendocrine transducer" driven by the
hypothalamic pacemaker through a multisynaptic neural pathway (Axelrod, 1974; Wurtman et
al•,1968). However,some mammalian pinealocytes undergo a photoreceptor-like
differentiation during a transient neonatal period (Clabough, 1973; Zimmerman and Tso,
1975),and the presence of proteins in the pineal (Takahash et al., 1989) which are normally
involved in phototransduction in the retina, raises the possibility that direct photic events may
occur in the neonatal mammalian pineal gland This possibility awaits further studies.
MELATONIN RECEPTORS IN BRAIN AND RETINA
Melatonin was isolated and identified by Lemer and coworkers in the late fifties (1958,
1959). During the last three decades, pineal and retinal melatonin has been extensively studied
in vertebrates including fishes, amphibian, reptiles, birds and mammals. (Wiechmann 1986;
Pang 1985). The secretion of melatonin, influenced by the daily and seasonal environmental
light-dark cycle, has been implicated in the control of rhythmic adaptations to daily and
seasonal biological rhythms and neuroendocrine functions (Cassone, 1990). However, the
search for melatonin receptors in brain and retina has had limited success during this period.
1 . THE SPECULATION OF PUTATIVE MELATONIN RECEPTORS IN
BRAIN AND RETINA
1). Pharmacological study - the structure垂activity relationships of melatonin
The existence of putative melatonin receptors has been speculated long before it was
demonstrated by binding studies in recent years. Reward and Hankey (1975), using frog skin
bioassay, demonstrated that the physiological concentration of melatonin (10"^ M) could
lighten the skin of frogs. B y comparing the effects of melatonin and melatonin related
indoles, it was demonstrated that the presence of 汪 methoxy group on the 5th carbon atom was
essential for the biological activity (skin lightening activity) of the active compounds and that
the N-acetyl group on the 3rd carbon atom played an important role in the putative melatonin
receptor binding (Heward and Hankey, 1975). The data indicate that the intrinsic activity of
indole compounds on the melatonin receptor was determined primarily by the moiety
substituted on the 5th carbon atom whereas, the affinity for the binding site is determined
primarily by the moiety substituted on the 3rd carbon atom of the indole nucleus. The structure
and stereospecificity of melatonin in the bioassay strongly suggest the existence of melatonin
receptors in the target organ (Quay, 1986). Dubocovich (1985) demonstrated that melatonin at
picomolar concentrations (40 pmol/I) inhibited the calcium-dependent [3H]dopamine release
elicited by electrical stimulation from the rabbit and chicken retina through activation of a site
possessing the pharmacological and functional characteristics of a receptor. The results of the
structure-activity analysis of melatonin in rabbit and chicken retina correlated well with that of
the frog skin bioassay. These findings suggest that the efficacy of melatonin is determined by
the moiety substituted on carbon 5 (5-methoxy group), whereas the affinity for the receptor is
determined primarily by the moiety substituted on carbon 3 (i.e., ethyl N-acetyl group) of the
indole nucleus (Dubocovich, 1985).
2). Physiological study - localization of melatonin receptors in the brain and retina
It has been postulated that the brain is the target of the pineal hormone, melatonin.
Twenty years ago, Fraschini (1968a,b) observed that the implantation of micro amounts of
melatonin into the median eminence or into the reticular substance of the midbrain significantly
reduced plasma concentrations and pituitary levels of lutenizing hormone (LH) in castrated
male rats. Recently, it was shown that minute amounts of melatonin implanted into the
suprachiasmatic or the rostral tuberal areas of the hypothalamus significantly decreased the
weight and activity of the genital tract of the white-footed mice (Lynch, 1977). Thus, the
presence of melatonin receptors in these areas was implicated.
3). Biochemical study - The uneven distribution of exogenous and endogenous melatonin
in the brain
10
Anton-Tay (1971) and coworkers (Anton-Tay and Wurtman, 1969) demonstrated a
significant accumulation of [^H]melatonin in the hypothalamus and midbrain after intravenous
or intraventricular injection of the labelled compound. It is worth noting that these two brain
areas,with high accumulations of [^Hlmelatonin, correspond with those regions where
melatonin implantation inhibited the castration rise of L H release (Fraschini, 1968a,b). Not
only was the accumulation of exogenous melatonin by brain regions observed. Endogenous
melatonin was also described to have an uneven distribution in different brain areas of many
species (Pang and Brown,1983; Pang et al.,1974). The concentrations of immunoreactive
melatonin in different brain areas in the rat and chicken showed high levels in the
hypothalamus, intermediate levels in the mid-brain, cerebellum and pons-medulla and low
levels in the telencephalon (Pang and Brown, 1983; Pang et al.,1974). The immunoreactive
melatonin in the brain could reflect a local synthesis, or uptake of melatonin from blood or
cerebrospinal fluid (Sallanon et al., 1982). The findings that pinealectomy significaxitly reduced
melatonin in the rat and chicken brain (Pang et al., 1974; 1982) and that no measurable
HIOMT activity could be shown in the human brain (Kopp et al., 1980) favours the former
hypothesis. The above reports strongly suggest that the melatonin might act on some
structures of the central nervous system.
All the physiological, pharmacological and biochemical studies mentioned in this
section strongly suggest the existence of functional melatonin receptors in the brain and retina
2 . IDENTIFICATION O F MELATONIN RECEPTORS IN THE BRAIN
AND RETINA BY RECEPTOR BINDING STUDIES
1). The radioligands: Tritiated and iodinated melatonin in receptor identification

11
The choice of radioligand is of crucial importance in melatonin receptor binding
studies. Ideally, the radioligand should have high affinity for the binding site and exhibit a
high degree of pharmacological selectivity for this site. Specific activity is another important
consideration in the choice of a radioligand. Since a very small amount of radioligand is bound
to the biologically relevant site,only the radioligand with high specific activity can demonstrate
the high affinity and low capacity binding sites in the tissue studied. Another factor to be
considered in the choice of radioligand is its metabolic stability.
The tritium-labelled ligands are practically identical in molecular structure to their
unlabelled counterparts and are therefore pharmacologically indistinguishable. In contrast, the
substitution of a bulky iodine atom into a small molecule may significantly affect the
pharmacological properties of radioiodinated drugs. Thus,in many cases, radioiodination
decreases the affinity of the ligand for the site of interest and renders it less useful as a
radioreceptor probe (Miler,1988). However, in some cases, substitution of an iodine atom can
greatly increase the specific activity and even increase the specificity and affinity of a
radioligand for the site of interest (Miler, 1988). The 2-[-''^I]icxiomelatonin which was
synthesized (Vakkuri et al 1984a,b) with high specific activity (more than 2000 Ci/mmol) and
which retained a high specificity and affinity to the melatonin binding sites (Dubocovich et al.,
1988a) is one example. By studying the effect of melatonin and its analogs in the inhibition of
[^H]dopamine release f rom chicken and rabbit retina,Dubocovich et al. (1988a,b)
demonstrated that both 2-icxiomelatomn and 6,7-dichloro-2-methylmelatonin were more potent
than melatonin. Thus, the agonist activity on the melatonin receptors appears to be enhanced
when the melatonin molecule is substituted at position 2 by an iodine or methyl group.
2). Affinity and density of [3H]melatonin binding sites in the brain and retina.
12
In the late 1970s, several articles appeared which described [^H]melatonin binding sites
in membrane and/or cytosolic preparations from the rat brain (Niles et al., 1979; Vacas and
Cardinali, 1979), bovine brain (Cardinali et al.,1978; 1979) trout retina (Gem et al.,1981)
and frog retina (Weichmmann et al., 1986) (Table 1). These sites had low affinity binding and
did not agree in terms of the tissue distribution or biological effects of melatonin and related
indoles of the presumptive melatonin receptors. In part, the relatively low specific activity of
[^H]melatonin (50-80 Ci/mmol) might have hindered the detection of high-affinity binding
sites with low receptor density in tissues (Cardinali,1981; Dubocovich,1988a).
3). Affinity and density of [^^Ijiodomelatonin binding sites in the brain and retina
In 1984, Vakkuri synthesized 2-[^^I]iodomeIatonin which was used as a tracer in
melatonin radioimmunoassays. In 1987,2-[^^I]Iiodomelatomn was used as a radioligand for
biochemical (Dubocovich and Takahashi, 1987; Niles et al., 1987) as well as autoradiographic
(Vanecek et al., 1987) binding studies of melatonin receptors. 2-[-''^I]Iodomelatonin has
proven to be a selective and high affinity ligand with high specific activity. In vitro, 2-
[l2^I]iodomelatonin has also shown biological activity as it was a potent inhibitor of dopamine
release in the retina (Dubocovich and Takahashi,1987). In addition, 2-iodomelatonin
mimicked the inhibitory action of melatonin on testicular development and body weight gain
(Weaver et al., 1988; Sugden, 1989a). Thus, [125I]icxiomelatonin is a good radioligand for the
characterization and localization of the putative melatonin receptor in the nervous system
(Stankor and Reiter,1990).
3 . MULTIPLE [ 1 2 5I]IODOMELATONIN BINDING SITES IN THE BRAIN
AND RETINA
13
Based on kinetic studies revealing varying affinities and specificities of
[125j]iodomelatomn binding sites, the concept of multiple melatonin receptors, that is, the
high (picomolar) affinity binding sites (ML-1) and low (nanomolar) affinity binding sites (ML-
2) was first proposed by Dubocovich (1988a). Picomolar affinity (ML-1) binding sites for
[^^^1]icxiomelatonin have now been demonstrated in the whole brain tissue of lizard (Rivkees
et al 1989a) chicken (Dubocovich et al.,1989; Dubocovich, 1990; Rivkess et al•,1989b;
Stehle, 1990; Y ing and Niles, 1991; Yuan et al., 1990),quail (Yuan and Pang, 1990) and
pigeon (Yuan and Pang, 1991). In mammals (rat,hamster, mouse, ovine and human),
picomolar affinity binding sites for [^^I]iodomelatomn have been localized to a relatively few
morphologically and functionally discrete brain areas including the hypothalamic
suprachiasmatic nuclei (SCN) of rat (Laitinen et al.,1989),mouse (Fang et al.,1990) and
human (Reppert et al., 1988a), as well as the pars tuberalis/median eminence region of sheep
(Morgan et al.,1989),rat (Vanecek et al., 1987) and hamster (Carlson et al., 1989; Duncan et
ai.,1989; Vanecek and Jansky, 1989). In addition [^^1]iodomelatonin binding has been
reported in the brain of the human fetus (Yuan et al., 1991) and the retina of chicken,rabbit
(Dubocovich, 1988a) and tree shrew (Lu et al., 1991) (Table 2).
The picomolar affinity [•'•^Iliodomelatonin binding sites are physiologically relevant to
the range of melatonin levels that are normally found in blood and brain (see Pang, 1985). The
pharmacological characterization of the high affinity [ iodomelatonin binding sites showed
that melatonin and related indoles inhibited binding with the same order of potency as that
found fo r the inhibition of [^H]dopamine release from chicken and rabbit retinas. The
pharmacological order of affinities is as follows: 2-iodomelatoniii > 6-chloromelatonin >
melatonin > N-acetyltryptamine. The reported antagonists for these binding sites are Luzindole
(N-0774; 2-benzyl-N-acetyltryptamine) (Dubocovich, 1988b) and N- [2,4-dinitrophenyl] -5-
methoxytryptamine (ML-23) (Zisapel and Laudon, 1987). The fact that GTP and GTP
analogues inhibited the high affinity melatonin receptor binding suggests that the melatonin
14
receptor belongs to the superfamily of G-protein linked receptors. However,it should be
noted that recent studies suggest that the high affinity melatonin receptors might exist in two
affinity states (Morgan et al” 1989; Latininen et al.,1990b; Dubocovich et a l , 1990),a high
affinity form exhibiting an average Kd of about 4 5 pmol/1 and a second state with about a 10-
fold lower affinity (average K d of 400 pmol/1) (Krause and Duvocovich, 1991). The
significance of this remains to be determined.
Nanomolar affinity (ML-2) binding sites of [^^]icxlomelatonin were located in whole
brain tissues of hamster (Duncan et al., 1988; Niles et al.,1987) and rat (Zisapel and Anis,
1988) as well as in discrete brain regions of hamster (Pickering and Niles, 1989; Anis et al.,
1989) and rat (Laudon and Zisapel, 1986; Zisapel et al” 1988) (Table 3). These sites had rates
of association and dissociation higher than those found in high affinity binding sites (Duncan et
al., 1988,1989). The pharmacological profile of [12^I]iodomelatonin binding sites in the
hamster brain homogenate was different from that described for the ML-1 sites. The most
striking difference was the high potencies of N-acetyl-5-hydroxytryptamine and 6 -
methoxymelatonin in competing for [^^IJiodomelatonin binding in hamster brain membranes
(Duncan et al., 1988; 1989). It was reported that the two affinity binding states for
[•'•^Iliodomelatonin are present in the hamster cerebral cortex (Niles et al” 1987). The
curvilinear Scatchard plots yielded high affinity binding sites with Kd 0 3 2 土 0.14 nmol/1,
Bmax 5.6 土 1.7 fmol/mg protein, and low affinity binding sites with K d 10.5 土 3.2 nmol/1,
Bmax 123 土 33 fmol/mg protein. This study also suggests the coexistence of the two receptor
subtypes in the same tissue (Niles et al., 1987).
4. RECEPTOR AGONISTS AND ANTAGONISTS
15
Agonists: The agonists that are most effective in lightening the skin of frogs (Heward
and Hankey, 1975) and mimicking the inhibitory effect of melatonin on dopamine release
(Dubocovich, 1983; 1985) are compounds possessing a 5-methoxy group on carbon 5 of the
indole nucleus and an N-acetyl group in the same position as melatonin (Figure 1). The most
potent agonists tested in both the rabbit and chicken retina (Dubocovich,1985; Dubocovich,
1988a) were 2-iodomelatonin and 2-methyl-6>7-dichloromelatonin. 6»Chloromelatonin was
equipotent with melatonin in inhibiting dopamine release. In contrast, inhibitory potencies were
about 1000-fold less fo r N-acetylserotonin which lacks the 5-methoxy group and 5 -
methoxytryptamine which lacks the N-acetyl group (Dubocovich, 1983; Dubocovich, 1985).
Antagonists: Structure-activity relationship studies of the melatonin receptors on the
frog skin (Heward and Hankey,1975) and chicken retina (Dubocovich, 1985) showed that N-
acetyltryptamines lacking the 5-methoxy group were potential melatonin receptor antagonists
(Dubocovich,1988a). The development of melatonin receptor antagonists contributed greatly
to the study of the biological effects of melatonin. These antagonists, including the synthetic
derivatives of tryptaxnine, have been demonstrated to inhibit various effects of melatonin either
in vitro o r in vivo (Zisapel and Laudon, 1987; Dubocovich, 1988b; Laudon et al., 1988;
Nordio et al.,1989). Dubocovich (1988a,b) showed that one of these compounds, Luzindole,
an N-acetyltryptamine lacking the 5-methoxy group and possessing a 2-benzyl substitution,
was a competitive melatonin receptor antagonist (Dubocovich, 1988b). In vitro,Luzindole (1
mmol/1) completely antagonized the inhibition of the calcium-dependent release of
[^Hjdopamine elicited by melatonin. Luzindole also blocked the activation of melatonin
receptors in vivo,as shown by its reversal of the decrease in norepinephrine turnover in the
C3H/HeN mouse hypothalamus induced by endogenous melatonin or administration of the
melatonin agonist, 6-chloromelatonin (Fang and Dubocovich, 1990). In the Siberian hamster,
melatonin-induced inhibition of testicular weight and body weight could be antagonized by
luzindole. (Duncan et al., 1990). Further evidence for selectivity of Luzindole was provided
16
by binding studies, in which Luzindole did not affect the binding of specific radioligand to 04
and « 2 adrenergic, p j and P2 adrenergic, D j and D2 dopaminergic, 5-HT-l and 5-HT-2
serotonergic, muscarinic, adenosine-1 or bezodiazepine receptors (Dubocovich, 1988b). It was
therefore concluded that Luzindole was a novel competitive melatonin receptor antagonist with
high potency and selectivity that provides a new experimental tool to further investigate the
functional role of endogenous melatonin in mammals (Duvocovich, 1988b). Zisapel and
Laudon (1987) reported that ML-23 was also able to antagonize the inhibitory effects of
melatonin on [^Hjdopamine release in vitro and to prevent the melatonin mediated retardation
of postnatal development in immature male rats in vivo (Zisapel and Laudon, 1987). Prazosin,
an a^-adrenergic antagonist, was another potent inhibitor of binding in hamster cerebral cortex
membrane, which suggested that prazosin might be a potent antagonist at a unique binding site
for melatonin (Niles et al 1987). Structures of the melatonin receptor agonists and antagonists
are summarized in Figure 1.
5 . RECEPTOR REGULATION
Melatonin secretion in mammals has a very pronounced circadian rhythmicity which
has been observed in all species examined. The secretory pattern of melatonin changes with the
sex, age, and different environmental conditions (Pang, 1985). These changes are important
for the adaptation of neuroendocrine and behavioural functions. On the other hand, changes in
the affinity and/or density of melatonin receptors could also be crucial for these functions.
Recent studies have shown light-dark variations in I]iodomelatonin or
[3H]melatomn binding sites in the whole brain of rats (Vacas and Cardinali, 1979), hamster
(Vacas and Cardinali, 1979), quail (Yuan and Pang, 1990), chicken (Yuan et al” 1990) and in
discrete brain areas of rats (Zisapel et al” 1988; Laudon et al” 1988; Laitinen et al” 1989) and
17
hamsters (Anis et al.,1989). It was suggested that such changes in the density of binding sites
might be the result of receptor down regulation by melatonin (Pang et a l , 1990). Conversely,
the diumal rhythmicity of the [^^]icxiomelatonin binding sites might be endogenous in nature
(Stankov and Reiter,1990).
The circadian rhythmicities of [^^I]iodomelatonin binding sites in the various animal
brains reported was consistent with the diumal rhythms of biological responses to melatonin in
the hamster (Tamarkin et al., 1976), white-footed mouse (Glass and Luncy, 1982), rat (Reiter
et al.,1980),and sheep (Karsch et al•,1984). Thus, it was suggested that the changed
sensitivity to melatonin might be related to alterations in the response of the melatonin
receptors (Reiter et a l , 1980).
Sex hormones are another important factor affecting melatonin receptors in the central
nervous system (CNS). In long-term ovariectomized (OVX) female rats, the in vitro inhibitory
effect of melatonin on dopamine release from the hypothalamus was abolished. After
implantation of estradiol capsules to O V X rats,the ability of melatonin to inhibit dopamine
release from the hypothalamus was reinstated. These estradiol-reversible changes in the ability
of melatonin to inhibit hypothalamic dopamine release were accompanied by estradiol-regulated
changes in melatonin receptors in the hypothalamus. In OVX rats, the density of
[12^I]iodomelatonin binding sites in hypothalamus was markedly reduced (Zisapel et al.,
1987). This finding suggests that the melatonin receptor could be regulated not only by its
homologous ligand-melatomn,but also by a heterologous ligand-estradiol. It was tempting to
speculate that a reciprocal interaction exists between estradiol and melatonin and their receptors
in the brain (Zisapel et al” 1987).
The biological significance of the ontogenesis of the melatonin receptor has not been
studied systematically. Martin and Sattler (1979) studied the effects of melatonin on the
pituitary L H and FSH responses to LHRH in culture with pituitary cells from female rats 5,
10,15, 20 and 3 0 days of age and from adult male and female rats. The results showed that
18
melatonin significantly inhibited LHRH-induced L H and FSH release by pituitary cells from S
,10- and 15-day-old animals. By contrast, pituitary cells from 20- and 30-day-old animals
showed no detectable response to melatonin even at micromolar concentrations. These findings
revealed that the inhibitory effect of melatonin on the pituitary response to L H R H was lost
during development in the rat between 15-20 days of age (Martin and Sattler, 1979). Vanecek
(1988a) reported that the specific binding of [^^Ijiodomelatonin in the pituitaries was highest
in 20-day-old fetuses (Bmax 31 fmol/mg protein) and it gradually decreased in the course of
postnatal development, until it reached 10% of that value in 29-day-old males. In contrast, the
density of melatonin receptors in the median eminence did not change markedly in the course of
development The marked decrease in the density of melatonin receptors in the pituitary might
account for the reported developmental loss of the melatonin inhibitory effect on LHRH-
induced L H release from the anterior pituitary (Vanecek, 1988a). Unlike the rat pituitary,
Carlson et al. (1991) demonstrated that the sites of high affinity [^^Ijiodomelatonin binding in
Siberian hamster brain was generally similar throughout the perinatal period. GTP inhibited
[•'"^Iliodomelatomn binding at each age suggesting that the melatonin receptor was associated
with the G protein during development (Carlson et al•,1991).
Furthermore, both the circulating melatonin levels and the melatonin receptor in the
brain were modified by aging. The pineal and circulating melatonin are reduced in aged animals
(Pang and Tang, 1983). Zisapel studied the distribution of melatonin receptors in 6 discrete
brain areas of mature and aged male rats. In the mature animals, the density of nanomolar
affinity binding sites in the hypothalamus, medulla, pons and hippocampus exhibited a clear
diurnal rhythm with a peak in the late photophase. In the aged rats,the density of these
melatonin binding sites in the hypothalamus was very similar throughout the 24h period. In
addition, the maximal binding capacities in the parietal cortex,hippocampus and medulla-pons
areas of aged rats were significantly lower than those in the mature rats (Zisapel et al.,1989).
19
T H E MECHANISM OF MELATONIN RECEPTOR ACTIONS
Hormones fall into two general chemical classes: lipid soluble hormones (steroids and
thyroxin) and water soluble hormones (catecholamines, peptides, and protein hormones). The
receptor localization and mechanism of action of hormones can also be categorized into two
classes. The l ipid soluble hormones act on intracellular receptors and change the gene
transcription and protein translation. 丁he receptors for water soluble homones are found in or
on the cell surface membrane. Three receptor-effector coupling systems have been
demonstrated for water soluble hormones. One class, typified by the nicotinic cholinergic
receptor, functions as a ligand-gated ion channel. Binding of agonist ligands alters
transmembrane ion flux by opening the channel. A second class of cell surface receptor
combines the signal detection function with the effector function in one macromolecule
(tyrosine kinase activity). The third type of cell surface receptor is coupled to a distinct effector
entity by a G-protein. Receptors in this category are activated by a diverse array of first
messengers including neurotransmitters, prostaglandins, polypeptides and photons of light
(Benidge, 1985),
Melatonin is a small and highly lipophilic molecule which easily passes through the cell
membrane. It may act on intracellular receptors. However, most studies demonstrate the
highly specific binding of [125I]iodomelatomn on crude membrane preparations (see review of
Stankov and Reiter, 1990; Pang et al, 1990). This suggests that the melatonin receptors may
have the same mechanism of action as water soluble hormone receptors. In addition,
accumulating experiments suggest that melatonin receptors are G protein linked receptors (See
Krause and Dubocovich,1991; Morgan, 1991).
1). Guanine nucleotide-binding proteins (G protein) related signal transduction systems.
20
G proteins function as intermediaries in transmembrane signalling pathways from the
receptor on the outer cell surface to the effectors (second-messenger systems) within cells
(Dohlman et al., 1987). Receptors that participate in such reactions are receptors of biogenic
amines, proteins, polypeptide hormones as well as neurotransmitters. The adenylyl cyclase
(AC) is the best known molecule that is controlled by G proteins. The regulation of
phosphoinositide phosphodiesterase (phospholipase C) activity and the function of ion
channels by G proteins are also strongly suspected (Oilman, 1987). Members of the G protein
family include Gs, Gi , Gt,Go and Gk which share certain common functional and structural
features. All function as receptor-effector couplers; bind guanine nucleotides with high affinity
and specificity; possess intrinsic GTPase activity; are substrates for covalent modification by
bacterial toxins; and share a common heterotrimeric structure (Spiegel et al., 1988).
Criteria for G protein action in signal transduction.
Several criteria have been employed to determine whether a G protein participates in
the transduction process: (a) GTP and hydrolysis-resistant analogues of GTP weaken the
binding of hormones to receptors coupled to G proteins; (b) Binding of GTP analogues and
GTP hydrolysis are stimulated by the hormone; (c) The activity of the putative effector is
altered upon the addition of hormone and GTP; (d) The effect of the hormone is altered by
cholera toxin or pertussis toxin; (e). The effects of the hormone are mimicked by the
introduction of GTPyS ; and (f) Functional reconstitution provides the most direct evidence for
the participation of a G protein in a transduction process (Stryer,1986).
Functions regulated by G proteins.
G proteins are a family of signal-coupling proteins that play key roles in many
hormonal and sensory transduction processes including: 1) Activation or inhibition of adenylyl
cyclase (AC): A C is reciprocally controlled by a stimulatory G protein (Gs) stimulating the AC
21
activity and an inhibitory G protein (Gi) inhibiting the AC activity in the regulation of cAMP
production (Stryer,1986) ; 2) Control of the phosphoinositide cascade: The hydrolysis of
phosphatidylinositol 4,5-bisphosphate (PIP2) by a specific membrane-bound
phosphodiesterase (phospholipase C,polyphosphoinositide phosphodiesterase) generates two
intracellular signal molecules, diacylglycerol and inositol 1,4,5-trisphosphate (IPS).
Diacylglycerol activates protein kinase C, whereas IP3 triggers the release of intracellular
calcium into the cytosol. G proteins control calcium-sensitive processes such as secretion and
chemotaxis (Berridge and Irvine, 1984); 3). Gating of potassium channels: Potassium
channels in cardiac pacemaker cells are opened by a G protein that is activated by the
muscarinic acetylcholine receptor. The change in K+ permeability slows the firing rate of
pacemaker cells. (Pfaffinger et al., 1985).
2). Melatonin receptors and G protein related signal transduction system
Radioreceptor binding studies have shown that the putative melatonin receptors reside
in the membranes (Stankov and Reiter, 1990) of lizard (Rivkees et al” 1989a) and chick brain
(Ying and Niles, 1991),rat suprachiasmatic nuclei (Laitinen and Saavedra, 1990b), area
postrema (Laitinen et al” 1990), ovine pars tuberalis (Morgan et al., 1989), chicken retina
(Laitinen and Saavedra, 1990a) hamster brain (Niles et al” 1988) and hamster median
eminence/pars tuberalis (ME/PT) (Carlson et al., 1989). Treatment of crude membranes with
the nonhydrolyzable GTP analogue guanosine 5'-[y-thio]triphosphate (GTPyS), significantly
reduced the number of high-affinity receptors and/or increased the dissociation rate of
[^^1]iodomelatonin from its receptor. Thus, coupling of the melatonin receptor to G-proteins
across the species might be a rule rather than an exception.
22
In ovine pars tuberalis, dose-dependent inhibition of [ 125I]iodomelatonin binding by
GTP and hydrolysis-resistant analogues of GTP was observed, with an order of potency of
GTPys > GTP =GDP. GMP and ATP had negligible effects (Morgan et al” 1989). Analysis of
saturable binding revealed that GTPyS (1 |imol/l) promoted an apparent reduction in receptor
density of about 50%, without a concomitant change in receptor affinity. These results were
consistent with a melatonin receptor existing in equilibrium between high- and low-affinity
states, with GTP and related analogues able to cause a shift in the equilibrium in favour of the
lower-affinity form. The sensitivity of [^^1]iodomelatonin binding to guanine nucleotide
implied the action of the melatonin receptor on the ovine pars tuberalis was mediated via a G
protein (Morgan et al., 1989).
In the lizard brain (Rivkees et al•,1989a) GTPyS treatment led to a rapid dissociation
of iodomelatonin from solubilized ligand-receptor complexes. Gel filtration
chromatography of solubilized ligand-receptor complexes revealed two major peaks of
radioactivity corresponding to molecular weights of > 400 and 110 kDa. This elution profile
was markedly altered by pretreatment with GTPyS before solubilization as only the 110 kDa
peak was present in GTPYS-pretreated membranes. The results suggested that the
[^^Ijiodomelatonin binding sites in lizard brain were melatonin receptors, with agonist-
promoted G protein coupling and that the apparent molecular size of receptors uncoupled from
G proteins was about 110,000 kDa (Rivkees et al 1989b) • The size estimate of the free
melatonin receptor (110,000 kDa) compares favourably with size estimates for the well-
characterized G protein-coupled receptors (e.g. a-adrenergic and muscarinic acetylcholine) by
gel filtration (Caron and Lefkowitz 1976).
Laitinen et al.(1990b) demonstrated that the GTP-induced uncoupling of the melatonin
receptor from the G-protein was temperature dependent. Agonist binding decreased in the
presence of guanine nucleotide at 22° C. Similarly, decreased 2- [ 1 2 5I] iodomelatonin binding
at 250C as well as an increased dissociation rate for bound agonist was found in lizard brain
23
membranes in the presence of GTPyS (Rivkees et al.,1989b). On the contrary,studies
conducted at 0®C failed to show any effects of GTP on 2- [^^1]iodomelatonin binding in
chick and hamster brain or in chick retinal membranes (Dubocovich and Takahachi, 1987,
Dubocovich et al.,1989. Duncan et al” 1989). Thus, the uncoupling of the melatonin-G
protein complex was more readily detected at 22®C than at 0®C (Laitinen and Saavedra 1990b;
Laitinen et al” 1990). The negative heterotropic effect of guanine nucleotide on [ •'•^Iliodomelatonin binding
does not provide enough insight to determine the nature of the G protein transduction
mechanism linked to the melatonin receptor. However, one of the fundamental differences
which has been described for the regulation of the receptor by a stimulatory (Gs) and an
inhibitory (Gi) G protein is that GTP and GDP are equipotent in promoting the high- to low-
affinity shift for a receptor regulated by Gi, whereas GDP is more potent than GTP for a Gs-
regulated receptor (Bimbaumer et aL, 1985). If this generalization can be extrapolated to the
melatonin receptor then the equipotence of GTP and GDP at inhibiting [^%]iodomelatomn
binding implies that the melatonin receptor is linked to its second messenger system through a
Gi protein (Morgan et al 1989). This hypothesis was supported by experiments showing that
melatonin decreased cyclic AMP and increased cyclic GMP synthesis in rat hypothalamus in
vitro (Vacas et al” 1981). Vanecek and Vollrath (1989) reported that melatonin specifically
inhibited the cyclic AMP accumulation in the rat pituitary. Moreover, melatonin impaired the
p-adrenoceptor-induced activation of cAMP synthesis in rat astroglial cell cultures (Vacas et
al., 1987). In amphibian skin, melatonin reversed the melanocyte stimulating hormone induced
dispersion of melanosomes by preventing the formation of cAMP (Subgen, 1989b). In a
Xenopus dermal melanophore bioassay, melatonin reversed the pigment dispersion-induced by
forskolin, which was known to increase cAMP formation by activating adenylate cyclase. In
the latter preparation, melatonin appeared to cause pigment aggregation via activation of a
receptor negatively coupled to adenylate cyclase because pertussis toxin blocked the melatonin-

24
induced aggregation (White et al.,1987). Melatonin has been reported to decrease forskolin
stimulated cAMP accumulation in hamster median eminence/pars tuberalis explants (Carlson et
al., 1989). All together, the available evidence suggests that melatonin might exert its effect by
decreasing the formation of cAMP. The described inhibitory effect of melatonin on cyclic
nucleotides might be the key to understanding the mechanism of melatonin action on the
cellular level
It should also be noted that melatonin caused a dose-dependent relaxation of
precontracted vascular smooth muscle. However, pretreatment of vascular rings with low-
dose lithium sulfate (0.1 mmol/1) completely blocked the relaxation response to melatonin
suggesting that the inositol phosphate pathway might be involved in the relaxation effect of
melatonin (Weekley, 1991).
25
IL MATERIALS AND METHODS
A. MATERIALS
1. CHEMICALS
1). CHEMICALS FOR [ 125I]IODOMELATONIN BINDING ASSAY
Melatonin,N-acetylserotomn,3-acetylindole, l-acetylindole-3-carboxaldehyde,
acetylcholine chloride, harmaline, 5-hydroxyindole各acetic acid,5-hydroxytryptamine, 6-
hydroxymelatonin, 5-methoxytryptophol, 5-methoxytryptamine, S-methoxytrypothan,
tryptamine, norepinephrine, bovine albumin, Guanosine 5'- [r-thio]triphosphate (GTPyS) were
purchased from Sigma (St. Louis,MO); 6-chloromelatonin from Eli-Lily (Indianapolis, IN);
Na[12^I] (3-7 GBq/ml,100 mCi/ml in NaOH solution with pH 7-11) from Amersham
(Buckinghamshire, England), [^%]iodomelatonin from Amersham and NEN (Mississauga,
Canada) with specific activity 2200 Ci/mmol. Iodogen (1,374y6-tetrachloro-3a, 6a-
diphenylglycoiluril) from Pierce Chemical Co” (Rockford, II” USA); and silica gel sheets
from Brinkmann Instruments (Palo Alto, CA). A l l other chemicals were from commercial
sources.
2) CHEMICALS FOR MELATONIN RADIOIMMUNOASSAY
H]melatonin were purchased from Amersham, (Buckinghamshire, England).
Melatonin antiserum was kindly donated by CIDtech Research Inc., (Hamilton, Canada).
ANIMALS
26
In these studies the brain tissues were obtained from male and female birds of different
species including chicken (4-12 weeks old and specified age as described in developmental
studies), pigeon (mature), duck (mature) and quail (mature). The development of
[125l]iodomelatonm binding sites in chicken brains was studied using different ages of
chickens from 6-day-old embryo to 1 year-old-chicken, (embryo: 6-day-old (E 6),10-day-old
(E10),13-day-old (E 13),17-day-old (E 17), 18-day-old (E 18); newly hatched chick: 1-day-
old (H 1),7-day-old (H 7); young chick: 20-day-old (H 20),40-day-old (H 40); and adult
chicken: 6-month-old (M 6),and 12-month-old (M 12), Retinas were obtained from chickens
of 4-8 weeks old and specified age as described in development studies. The development of
[^^I]iodomelatonin binding sites of the chicken retinas were studied using different ages of
embryo (10-day-old (E 10); 15- day-old (E 15); 18-day-old (E 18) and 2p-day-old (E 20); and
young chick of 21 day old (H21).
Chickens: The hybrid strain of "mini WM White Leghorn chickens {Gallus domesticuc)
both males and females of different ages were supplied by the Laboratory Animal Unit,
University of Hong Kong. They were housed three to five per cage in a temperature controlled
animal room (23 土 0.50 C) and fed chick feed twice a day. The lighting schedule was L:D
12h:12h. (lights on 0300h and off 1500h), unless otherwise stated. A l l animals were adapted
to the photoperiodic cycle of 12 h light and 12 h dark (light on 0300) for at least two weeks
prior to any experimental procedures, unless otherwise stated. Lighting was controlled
automatically. The intensity of illumination was approximately 200 Lux/cm at the centre of the
room during the light period. The middle of the light period (ML) was 0900 h and the middle
of the dark period (MD) was 2100 h.
Eggs of the hybrid strain of "mini W,r White Leghorn chickens {Gallus domesticuc)
were incubated at 38 ± J ) ^ C under a lighting regimen of 12 h light: 12 h dark with a light
intensity of 200 Lux/cm2 (lights on (B:(X)h and off 15:00h). The light source was a fluorescent
tube located inside the thermostatically controlled incubator with an automatic egg turner. After
27
hatching, the chicks remained in the incubator for 3-16 h and were then moved to a heated
brooder and maintained under the same light-dark cycle until they were two weeks old. During
this period the temperature decreased from 30oC to 230C gradually. They were then
transferred to a temperature controlled animal room (23 土 0.5oC).
Mature male and female quails (Halics sp) were purchased from a local market in Hong
Kong. They were housed 8 to 10 per cage and fed twice a day in a temperature controlled room
(23 土 O . f C). The lighting schedule was the same as that for the chickens, and the M L and
MD were 0900h and 21(X)h respectively.
Mature male and female Ducks (Anas Platyrhynchos) and pigeons {Columbia livid)
obtained from the market in Hong Kong were kept under a natural photoperiod (sunrise at
0700h and sunset at 17.30h). Water and food were available ad libitum. The middle of the
light period (ML) was 12.00-13.00h and the middle of the dark period (MD) was 2400-
OlOOh.
B. METHODS
L SAMPLE COLLECTION
The brains and/or retinas of birds were collected immediately after the animals were
decapitated. To obtain the brain, the skull was dissected by cutting bilaterally on the left and
right side of the skull through the interparietal bones, parietal bones and half way through the
frontal bones. Gripping the occipital bone above the foramen magnum with a rongeur,the cut
part could be lifted up easily to expose the brain, which was removed by a pair of hooked-end
forceps into a plastic vial and frozen, on dry ice prior to storage at -70oC. For the regional

28
distribution study of bird brain [ I]icxiomelatomn binding sites,the brains were dissected on
ice and divided into five regions: telencephalon, cerebellum, mid-brain, hypothalamus and
pons-medulla (Pang et al., 1974). To ensure a detectable number of melatonin-binding sites,
three to five pieces of the same region of brain tissue were pooled together in each of the five
samples. The samples were placed in plastic vials, frozen on dry ice and then stored at -7(PC
until assayed. Chickens were decapitated and the eyes were removed and hemidissected immediately
on ice. The retinas, including the pigment epithelial layer free from choroid,optic nerve and
ora serrata, were frozen on dry ice and stored at -70oC.
2 . TISSUE PREPARATION
1). REAGENT PREPARATION
Tris-HCL buffer (0.05 mol/1,with pH 7.4): Tris (M.W. 121.14) 12.114 g and 840 ml
of 0.1 N HC1 were added to 1 litre of distilled water. The pH was adjusted to 7.4 at room
temperature and made up to a total volume of 2 litres with distilled water.
Sucrose solution of 0 3 2 mol/1 (M,W. 342.2) was made by dissolving 54.75 g of
sucrose in 400 ml of 0.05 mol/1 Tris-HCl buffer ( pH 7.4) and made up to a total volume of
500 ml.
2). CRUDE BRAIN MEMBRANE PREPARATION
Brain: Fresh or thawed brain tissues of birds (chicken,pigeon,duck, quail) were
homogenized in 10 volumes (W/V) of ice cold Tris-HCL buffer (0.05 mol/1, pH 7.4) using a
glass homogenizer. The homogenate was centrifuged at 44,000g for 25 min at 40C. The

29
pellet was washed once by resuspension in the buffer and centrifuged a second time. The
crude membrane pellet was resuspended in Tris-HCl buffer (pH 7.4). Protein content was
determined (Lowry et al,1951) using bovine serum albumin as standard.
Retina: To prepare the crude retina membrane preparations, the retinal tissues were
homogenized in 10 volumes (W/V) of ice cold Tris-HCL buffer (0.05 mol/1, pH 7.4) using
a Kinematic Polytron (Lucerne, Switzerland) 3 x 5 second pulses at #6 setting. The samples
were centrifuged at 44,000 X g for 25 minutes at 4 0C and the supernatant decanted. The
pellet was then resuspended and recentrifuged. Prior to the assays,the crude membrane
pellets were resuspended in Tris-HCl buffer (pH 7.4, 40C) and homogenized at Polytron
setting #6 for 2 X 5 seconds. The protein content of the sample was determined as noted
earlier.
To study the intracellular distribution of melatonin binding,brain tissues of birds
(chicken, pigeon, quail) were homogenized in Tris-HCl buffer (pH 7.4, 40C) containing
032 mol/1 sucrose. The resulting homogenates were fractionated in refrigerated centrifuges
to yield a crude nuclear pellet (l,000g for 10 min), a crude mitochondrial pellet (27,000g for
10 min), a crude microsomal pellet (100,000g for 60 min), and a cytosol supernatant
(100,000g for 60 min) (Duncan et al., 1988). The pellets were resuspended in 2-8 volumes
of Tris-HCl buffer. The protein content of membrane and cytosol preparations were
determined as previously stated.
3. BINDING ASSAY
1). IODINATION OF MELATONIN
a). REAGENT PREPARATION
30
Phosphate Buffer (0.1 mol/1, pH 6.0): 44.0 ml of 0.2 mol/1 NaH2P04 and 6.2 ml
of 0.2 mol/1 Na2HP〇4 were mixed together and made up to 100 ml with distilled water.
The pH was adjusted to 6.0.
Melatonin (0.1 % W/V): 10 mg melatonin was dissolved in 0.5 ml absolute ethanol
and then made up to 10 ml in 0.1 mol/1 of Phosphate Buffer (pH 6.0).
Iodogen (0.01% W/V): 2 mg iodogen was dissolved in 20 ml chloroform. 20 yd
of this mixture was added into a 6 X 50 mm glass tube and allowed to evaporate under
nitrogen gas. It was then stored at 4 0C •
Iodine: 400 iCi Na1 2 5I (3-7 GBq/ml, 100 mCi/ml,in NaOH solution, pH 7-11) in
2-3 yil was diluted by 20 \i\ of 0.1 mol/1 Phosphate buffer (pH 6.0) in an Eppendorf tube.
Double distilled water,5% propanol in double distilled water and propanol were
prepared for use in the HPLC by filtering each through a 0.2 pore size nylon filter
paper by vacuum filtration • They were then degassed by blowing helium through each
liquid for 15 minutes.
b). RADIOIODINATION OF MELATONIN
[^^I]Iodomelatonin was prepared by modifing the method of Vakkuri et al. (1984a).
Iodogen (2 jxg in 20 yd of chloroform) in a 6 x 50 mm glass tube was dried under nitrogen.
Melatonin (20 \ig in 20 \il of 0.1 mol/1 Phosphate buffer, pH 6.0) was first added into the
iodogen tube (containing 2 iig of iodogen) and Na[^^I] (400 ixCi in 20 \i\ 0.1 mmol/1
Phosphate buffer, pH 6.0) was added immediately afterwards. The reaction was allowed to
proceed while vortexiiig for 1 min at room temperature and was then extracted twice in
chloroform (100 yd), and purified by TLC or HPLC.
c). PURIFICATION OF [1 2 5I]IODOMELATONIN BY THIN LAYER
CHROMOTOGRAPHY

31
Following extraction, the chloroform phase was subjected to TLC using silica gel
sheet (20x20) cm with fluorescent indicator and run for 3-4 hours to 18 cm distance using
30 ml of ethyl acetate as the solvent. Following TLC, the sheet was sectioned into 1 cm
segments and eluted with 10 ml of 2-propanol. The eluted sections were then counted in a
gamma counter to determine their radioactivity levels. To validate the separation of
[^5i]iodomelatonin from the melatonin, 10 ng of melatonin was run on the same TLC plate
and monitored by UV light. The Rf values of [^^I]icdomelatonin and melatonin were
calculated.
d). PURIFICATION OF [125I]IODOMELATONIN BY HPLC
The iodination product was dried under nitrogen and dissolved in 100 jxl of
methanoLThe mixture was injected into a HPLC (Bio-Rad 700 HPLC System) equipped
with a reverse-phase column (Bio-Rad Laboratories 250 x 4 mm Bio-Sil ODR-5S) and eluted
with a 2-propanol gradient from 5 to 45% during 90 min at a flow rate of 0.5 ml/min.
Elution of melatonin was monitored by a UV spectrophotometer at a wavelength of 220 nm.
Under these conditions, the retention times for melatonin and [•'•^Iliodomelatonin were
approximately 10 and 29 minutes respectively. Radioactivity levels of the fractions collected
were then counted on a gamma counter. To improve the syntheses, iodogen in amounts of 1-
20 jig was also used with different exposure times (1-10 min). The radioligand had a
specific activity of about 2200 Ci/mmol which remained stable for at least 60 days. The
iodination efficiency was 45-66%.
2). SATURATION STUDY.
Saturation binding assays were carried out by incubating 100 \x\ aliquots of the crude
brain or retina membrane preparations (protein contents were about 300-600 jig for the bird
brain membrane preparations and 150-300 pig for the chicken retina membrane preparations)
32
with 50 [xl of [125i]i0domelatonin (specific activity : 2200 Ci/mmol) in concentrations
ranging from 5-320 pmol/1 for the brain binding studies and 15-650 pmol/1 for the retina
binding studies. Non-specific binding was determined by adding 100 yd melatonin to
produce a final concentration of melatonin in the assay tube of either 1 or 10 imol/l. The
total assay volume was made up to 350 \x\ with Tris-HCl buffer. The binding of
[l^Ijiodomelatonin was measured routinely in duplicates or triplicates. The incubation
temperature was at 4 0C for 5 h or 370C for 1 h for the bird brain preparations and 370C for
1 h for the chicken retina preparations. To study the effect of GTP analogues on the
[^^I]iodomelatonin binding, the incubation was conducted at 250C for 1 h. Binding assays
were terminated by the addition of 3 ml of cold Tris-HCl buffer. The samples were then
immediately vacuum filtered through Whatman GF/B glass fibre filters (pore size 1.0 pm)
using a M24R Cell Harvester (Biomedical Research and Development Laboratories, Inc.,
Gaithersburg, Maryland) and washed with 2 X 3 ml aliquots of cold buffer. The filtration
was completed within 5 seconds. The filters containing bound [^^I]iodomelatonin were
measured for radioactivity by a LKB 1270 Bachgamma Gamma Counter (Turku, Finland)
with an efficiency of 70%.
3). KINETIC STUDY
Kinetic studies involved incubating 100 \il of either brain or retinal crude membrane
preparations with 10-30 pmol/1 or 40-60 pmol/1 of radioligand respectively. Non-specific
binding was determined by adding 100 yd melatonin to produce a final concentration of
melatonin in the assay tube of either 1 or 10 fxmol/1. The time course of [125I]iodomelatonin
binding association to the membrane preparations was conducted at designated times (5, 10,
15,20,30, 40, 60, 80, 210 minutes at incubation or 5, 10,30 minutes and 1,2,4,6,
8,10,12,14 h at 4 0 C incubation). Dissociation was initiated by the addition of 10 35 or
33
350 limol/l melatonin (to make the melatonin final concentration of 1 or 10 \xmolll) after a 60
minute incubation period at or 5 h incubation period at 40C.
4). SPECIHCITY STUDY
To determine the specificity of the [ 12^I]iodomelatonin binding sites, 100 (xl
membrane preparations were incubated with radioligand concentrations of 10-30 pmol/1 for
the chicken brain membrane preparations and 40-60 pmol/1 for the chicken retina membrane
preparations with or without varying concentrations of different indole analogues of
melatonin and neurotransmitters, including melatonin, 6-chloromelatonin and N-acetyl-5-
hydroxytiyptamine. The concentrations of these indole analogues ranged from 10" mol/1 to
10,13 mol/L IC5Q values were obtained from the analysis of the competition curves and the
inhibition constant (Ki) was calculated
5). CYTOSOL BINDING ASSAY
Bird brain cytosol fractions were used for the subcellular distribution study with the
same procedure as the membrane binding assay except for the separation of bound (B) and
free (F) radioligand. After incubation of 100 JA! of cytosol preparation (with protein 200-300
(xg), the binding assays were terminated by the addition of 3 ml of cold Tris-HCl buffer and
immediate vacuum filtration through HA filters (pore size 0.45 (xm. Micro Filtration
Systems,Dublin, CA). The filters were washed with 3 X 2 ml cold buffer. The filters
containing bound [ i o d o m e l a t o n i n were determined for radioactivity by a gamma
counter.
6). DATA ANALYSIS OF BINDING STUDIES
a). SCATCHARD ANALYSIS

34
The raw data from saturation studies was evaluated by Scatchard analysis
(Scatchard, 1949). Conventional linear regression techniques was used to calculate the line
of best fit which was computer generated. The equilibrium dissociation constant (Kd) was
estimated as the negative reciprocal of the slope of the line of best fit,and the apparent
maximum number of binding sites (Bmax) was estimated by the abscissa intercept. The
main calculation steps were as follows:
Specific binding (cpm) (SB) = total binding (cpm) (TB) - nonspecific binding (cpm)
(NSB)
The calculation of the bound (B), B (fmol/mg. protein)
CPM of SB X 1000
0.7 X 2220 X 2200 X Protein (mg)
The calculation of the free (F),F (pmol/1):
CPM of total count X 1000
0.7 X 2220 X 2200 X 0.35
Where 70% was the efficiency of the y-counter; 2220 (dpm) was the decay constant
of 1 nCi radioactivity; 2200 was the specific activity of Ipmol [125I]iodomelatonin = 2200
nCi; 0.35 was the incubation volume (ml).
b). DETERMINATION OF HILL COEFFICIENT
The saturation data was used to fit into the Hill equation using logarithmic form:
LOG10(B/Bmax-B)=LOG10[L].
Where the Bmax (fmol/mg protein) was obtained from the Scatchard analysis; [L]
was the concentration of ligand; B was the bound (fmol/mg protein) under different
35
concentration of [125I]iodomelatonin. Conventional linear regression techniques were used
to calculate the slope of the line - the Hill coefficient
c). KINETIC STUDY
Data from kinetic experiments were analyzed using pseudo-first-order equations to
estimate the association rate constant (Kj) and first-order equation to estimate the
dissociation rate constant (Kq). The Kd value was calculated from the ratio of K
(Weiland and Molinoff, 1981).
丁he i q and was calculated by the following formula.
K i = In (LR)e/[(LR)e-(LR)a] = [K^t (L) (R)T] /(LR)e
K ^ I n ( L R h / a J ^ K h t
Where (L)x: The total concentration of ligand. (R)T; 丁he total concentration of
binding sites which was determined from the Bmax value of Scatchard analysis. (LR)e:
The concentration of the ligand-receptor complex at equilibrium. (LR)a: The concentration
of the ligand-receptor complex at time L (LR)0: The concentration of the ligand-receptor
complex just prior to the addition of the competing ligand. (LR)d: The concentration of the
complex at time t after initiation of dissociation.
d). SPECIHCITY STUDY
The inhibition constant (Ki) was calculated from the IC50 values as follows (Leslie, 1987):
1C50
1+ [L]/Kd
Where (L): The concentration of ligand. Kd: The equilibrium dissociation constant
determined from Scachard analysis.
4. PROTEIN DETERMINATION
1). REAGENT PREPARATION
Reagent 1: Mix 4% Na2C03 (in distilled water) and 0.2 N NaOH (in distilled
water) in equal volumes.
Reagent 2: Mix 1% CUSO4 (in distilled water) and 2% potassium sodium tartrate
(in distilled water) in equal volumes.
Reagent A was freshly prepared by mixing the reagents 1 and 2 in a volume ratio
50:1.
Dilute Folin's reagent with distilled water in a 1:1 ratio prior to the assay. Label as
reagent B.
Prepare the protein standard solution: 25 mg bovine serum albumin (BSA) was
dissolved in 100 ml distilled water (25 jxg protein /100 1). The standard tubes with the
following concentrations of protein (50, 100,150,200,250 jxg/1000 yd) were prepared
and stored at -20oC.
2). Procedure for protein determination: (all volumes in microlitres)
; blank standard sample
buffer 1000 一 980
standards 一 1000 _
sample 一 — 20
reagent A 5000 5000 5000
vortex and stand for 10 min in room temperature.
reagentB 500 500 500
vortex and stand for 30 min read in spectrophotometer at 650 nM.
37
The standard solutions were used to plot the standard curve from which the unknown
protein values were extrapolated.
5. RADIOIMMUNOASSAY OF MELATONIN
1). EXTRACTION OF MELATONIN
Serum melatonin was extracted with dichloromethane. 1-2 ml of serum was added
to 5 ml of dichloromethane,which was vortexed for 20 s then centrifuged at 20,000 X g
for 10 min. The serum layer was removed by aspiration to allow collection of the organic
phase. The organic phase was dried under nitrogen gas at room temperature and used in the
assay.
2). STANDARD SOLUTIONS
Standard solutions containing a known amount of melatonin (0 pg x 4 tubes, 5,10,
25,50, 100, 250,500 and 1000 pg x 2 tubes) in gelatin-phosphate buffer (NaaHPO#,
L42g; NaCl, 8.76 g; EDTA,9.3 g; merthiolate, 0.1 g; gelatin, 1 g; made up to 1 L with
distilled water) were prepared. The standard solutions were used to create a standard curve
from which unknown melatonin values could be determined. Two tubes containing 500 \i\
of the gelatin-phosphate buffer were designated for non-specific binding and two tubes
containing 50 \il [^H]melatomn only, were designated for total counts.
3). THE ASSAY
The radioimmunoassay for melatonin followed the procedure designed by Brown et
al. (1985). On the day of assay, 1 or 2 ml of gelatin-phosphate buffer was added to a dried
extracted sample in a glass tube. The mixture was vortexed for 20 s. According to the
predicted concentration of the melatonin, 100-400 pi of the sample was removed to a
plastic assay tube for assay. Tritiated melatonin (50 yd, about 2,000 c.p.m.) was added to
all the assay tubes. Melatonin antiserum was added to all but the non-specific and total
tubes. The samples to be assayed were made up to a total volume of 500 \x\ with the
gelatin-phosphate buffer. The tubes were then vortexed for 20 s before incubation at 40C
for 20 to 24 hours. Incubation was terminated by the addition of saturated ammonium
sulphate solution (0.65 ml, pH 7) and normal rabbit serum (50 fxl 1:20) to all tubes except
the totals. A further incubation period of 1 hour at 40C occurred which was terminated by
centrifugation at 4,000 g for 25 min. The supernatant was discarded and the remaining
pellet resuspended in 325 \xl distilled water (300 \il distilled water being added to the
totals). 300 fxl samples were removed from the assay tubes to plastic scintillation vials with
the addition of 100 fxl of distilled water used to flush out the unipump tubing between each
sample to avoid sample cross contamination. Four ml of scintillation cocktail (POPOP, 0.8
g; PPO, 11 g; triton-X, 455 ml; and toluene 1 L) was added and the vials capped and
handshaken prior to counting. The vials were counted for 10 min each in a liquid
scintillation counter (Beckman, model number 5801), and a computer was used to
determine the melatonin concentrations in the unknown samples.

39
PINEALECTOMY
Removal of the pineal was carried out on two days old chicks under ether
anaesthesia. Head feathers were clipped and the chick's head was placed in a head holder. A
mid line incision was made to expose the skull. The skull was cut open just anterior to the
position of the pineal using a pair of iridectomy scissors to allow a small inverted "U" shaped
flap to be lifted. A micropipette attached to a suction pump held at an angle to the skull was
used to suck away the pineal and its stalk. The skull flap was released and the skin wound
sutured closed. Control chicks (sham operation) were also anaesthetized with ether. The
head feathers were removed and the skin was cut. The wound was sutured closed (Pang et
al., 1974). A l l chicks were decapitated six weeks after pinealectomy.
7. MELATONIN ADMINISTRATION
Four weeks old chicks were kept under a 12h : 12 h light-dark cycle (lights on at
0900h and off at 21(X)h). 0.9% Saline (control) or melatonin (1 mg per kg of body weight)
was injected intraperitoneally two times a day, shortly after light onset and shortly before
light offset. After three weeks of injection the chicks were decapitated at midlight (1500h)
and middark (0300h).
8 • STATISTICS
All data is represented as mean 土 standard error of the mean (S. E. M). Statistical
significance between the two groups was tested by the one-way analysis of variance
(AVOVA) and/or Students t-test. Statistical significance between the various groups was
40
tested by the one-way analysis of variance (ANOVA), and followed by a Student-
Hewman-Keurs (NK) multiple range test. The level of significance was set at p<0.05.
Linear regression was employed to determine the correlation coefficient between two
variables.

41
III. RESULTS
A. METHODOLOGY
1 IODINATION OF MELATONIN
1). SEPARATION OF THE RADIOLIGAND
Separation of [ ^I]iodomelatonin by TLC and HPLC was studied. Figure 2 shows the
profile of purification of [ I]iodomelatonin by TLC. The first radioactivity peak was that of
[^^I]iodomelatonin which was demonstrated by its immunoreactivity with melatonin
antiserum and binding properties to chicken brain membrane preparations (Table 4). The
second radioactive peak was free iodide. The Rf values of melatonin and [^^I]icxiomelatonin
were 0.29 and 0.41 respectively. Figure 3 shows the purification profile of
[^I]iodomelatonin by HPLC. The radioactive and UV absorbency peaks were observed. The
first radioactive peak was demonstrated to be the free iodide. The main radioactive peak was
the second one which could bind both to the melatonin antiserum and chicken brain membrane
preparations (Table 4). The binding results of [125jjiodomelatonin separated by the TLC and
HPLC suggest that the effective separation of the [ ^1]iodomelatonin from the melatonin and
the free iodide is very important. The incomplete separation of [ 125jjiodomelatonin from the
free iodide by TLC was shown by the low signal to noise ratio (about 6:1, Figure 2)) and the
high nonspecific binding of the radioligand to both the antiserum and the membrane
preparations (Table 4). On the other hand, the incomplete separation of melatonin and
[125I]iodomelatonin by TLC revealed that the peak of [125I]iodomelatonin was close to the
peak of melatonin (Figure 2), indicating that a higher specific activity of [125I]iodomelatonin
could not be achieved by the TLC. This explains the poor binding of radioligand to the

42
antiserum and membrane preparations when purified by TLC. However, the
[125I]iodomelatonin separated by the HPLC had a high signal to noise ratio (more than 60:1,
Figure 3), and the peak of [^^jiodomelatonin was distinct from that of melatonin and free
iodide (Figure 3). Thus, the [^¾]iodomelatonin separated by HPLC had low nonspecific
binding and high specific binding compared with the binding results produced by the
radioligand purified by TLC (Table 4).,
2). [125]IODOMELATONIN STABILITY
The stability of [^^I]iodomelatonin synthesized in our laboratory was tested. The
binding properties of the [125jjiodomelatonin both to the antiserum and membrane
preparations showed no significant changes after one month of storage in -20^0.
We found that the reaction time and amount of iodogen used in the iodination procedure
was crucial for the quality of [ ^^iodomelatonin. Longer reaction time (more than 10 min)
and large amount of iodogen (> 40 fxg) tend to damage the melatonin molecule and postpone
the elution of [-‘-]iodomelatonin from the HPLC. Damaged [^^liodomelatonin does not
bind to either the melatonin antiserum or the chicken brain membrane preparations.
2 CONDITIONS FOR THE BINDING ASSAY
1). EFFECTS OF pH AND IONS ON [125I]IODOMELATONIN BINDING TO
CHICKEN BRAIN MEMBRANE PREPARATIONS
Effects of buffer pH, or addition of ions, on specific [125I]iodomelatonin binding in 4-
6 weeks old chicken brain membrane preparations were examined (Table 5). Under a 40C
43
incubation for 5 h,specific binding of [125I]iodomelatonin (26.2-3 L5 pmol/1) was 0.51-0.74
fmol/mg protein at pH 7 A Changes in the pH of the incubation buffer from 6.4 to 8.2 did not
significantly alter the amount of specific binding of [125I]iodomelatonin to chicken brain
membrane preparations. Lowering the pH below 6.0 resulted in a decrease in binding. Binding
dropped to only 5% of the maximum binding below a pH of 5.0. Addition of NaCl (100
mmol/1) to the incubation buffer slightly inhibited (about 20% 土 7.2 %) the specific binding of
[12^]iodomelatonin. In contrast, additions of CaCl2 (5 mmol/1), KC1 (100 mmol/1) and
MgCl2 (5 mmol/1) had almost no effect on the binding.
2). THE EFFECT OF TEMPERATURE ON [125I]IODOMELATOMN
BINDING TO CHICKEN BRAIN MEMBRANE PREPARATIONS
a). KINETIC STUDIES OF [125I]IODOMELATONIN BINDING AT 370C AND 40C
The effect of incubation temperature on the binding of [ I]iodomelatomn with respect
to association to and dissociation from the chicken membrane preparations was studied at 4° C
and 37° C. Figures 4 and 5 show the binding time courses of [125I]iodomelatonin with the
chicken brain membrane preparations at 37°。and 40C respectively. At 37° C the specific
binding increased during the first 30 minutes and equilibrated after approximately 50 minutes
with the association rate constant of (Kj) of 9.5 X 10 min 'K (Figure 4A). After the
equilibrium with 10 pmol/1 [-'•^^iodomelatonin for 60 min. at 370C, 10 \il of 35 [Jtmol/l of
melatonin was added to the assay (to make the melatonin final concentration of 1 fxmol/1).
Displacement of most of the specific binding of [125I]iodomelatonin occurred within 30 min
and nearly complete displacement occurred by 60 minutes, with the dissociation rate constant
(K^) of 6.7 X ICT2 min"1 (Fig.4B). The kinetically derived Kd value was 70.5 pmol/1 which
44
was obtained from the ratio of rate constants (K^/Kj). This was in good agreement with that
determined from equilibrium experiments (68.5 士 4.1 pmol/1) (Table 6).
The time course of 15.5 pmol/l [^^I]iodomelatonin binding with the chicken brain
membrane preparations conducted at 40C (Figure 5A and B) showed that the process of
[125i]iodomelatonin association to and dissociation from the brain membrane preparations
was slower than at (Figure 5A and B). The association of the specific binding of
[•'•^^iodomelatonin to the membrane preparations equilibrated after 5 hours of incubation.
Two hours after the initiation of the dissociation by addition of 10 \x\ of 350 pmol/l of
melatonin (to make the melatonin final concentration of 10 ^mol/1), only half of the bound
[125i]iodomelatonin was displaced. Total displacement was not achieved until 5 hours later
(Figure 5B). The K j and K- j at 40C was calculated to be 7.1 X 10⁷ min “1. NT1 and 2.66 X
10" min"* respectively. Kinetic derivation of the dissociation constant from K j and K-^ give
Kd value of 37.5 pmol/1 which is consistent with that determined from equilibrium experiments
(42. 6 土 2.94). The results suggest that the binding affinity of [^^IJiodomelatonin with the
membrane preparations at 40C is higher than that at 370C.
b). SATURABILITY AND AFFINITY OF [125I]IODOMELATONIN BINDING AT
S^C, 25°。AND 40C
The effect of temperature on the binding capacity of [ iodomelatonin to the 10- to
12-week-old chicken brain membriie preparations was investigated by the saturation study and
the Scatchard analysis at 3 7 ° ^ 250C and 40C. At 370C the total and non-specific binding of
[125I]iodomelatomn increased over a range of 5320 pmol/1 [125I]iodomelatonin. Non-specific
binding was determined in the presence of 1 [imol/l melatonin. Specific binding of
[125I]iodomelatonin increased with increasing concentration of the radioligand (Figure 6A).
Scatchard analysis of the specific binding data yielded linear plots which gave a Bmax of 13.1

45
fmol/mg protein and a K d of 65.5 pmol/1 (Figure 6B). The Hill coefficient was 0.93. Figure 7
and Figure 8 show the saturation curves and the Scatchard plots at 4 0C and 25°C
respectively. A Bmax of 3.87 fmol/mg protein and Kd of 40 pmol/1 diminished at 4 0 C
(Figure 7B). These values increased to 8.8 fmol/mg protein (Bmax) and 57.2 pmol/1 (Kd) at
250C. The Hill coefficients were close to 1 in all cases. This demonstrates that
[125i]iodomelatonin binding with chicken brain membrane preparations at the 370C, 250C
and 4 0C were reversible and that they bound to a single class of sites under these incubation
conditions. Scatchard analyses showed that the Bmax and Kd values determined at 37°。and
were significantly higher than those at 40C (Table 6). Our results suggest that as the
incubation temperature decreases from 370C and 250C to 40C, the binding capacity decreases
and the affinity to the chicken brain membrane preparations increases.
3 • TISSUE CONCENTRATIONS
The linear regression between the specific binding of [ ^^I]iodonielatonin (11,250
cpm, 9.4 pmol/1) to pigeon brain membrane preparations with different protein concentrations
(70-820 mg) gave a straight line and the coefficient of correlation was 0.995 (Figure 9). In this
study, the NSB ranged from 221-279 cpm between protein concentrations of 70 jxg to 820
jxg. Subtracting the 丫-counter background counts (150 cpm) and the filter paper NSB (50 cpm)
results in a tissue NSB between 20 and 40 cpm at protein concentration ranging from 70 pg to
820 卩g. This clearly demonstrates that the specific binding of [125I]iodomelatomn to pigeon
brain membrane preparations is tissue dependent and suggests that within a certain range, the
contribution of tissue to the NSB is negligible especially when the radioligand is used at lower
concentrations.
T H E SAMPLE STABILITY
46
To study the tissue stability, quails were killed and the bodies were put in a 40C cold
room. The brains were collected after different post-mortem times (from 5 min to 14 hours).
The brain tissues were then kept in -70oC for 1 day. Binding studies was then conducted. The
binding results shown in Table 7 demonstrate that maintaining brain tissues at 40C for 14 h
does not significantly change [^ I]i(xiomelatomn binding. Avian brain tissues kept at -70oC
for 1-2 months were also stable as tested by binding assays.
47
B. [125I]IODOMELATONIN BINDING SITES IN THE BRAIN TISSUE
OF BIRDS: A GENERAL BINDING CHARACTERIZATION AND REGIONAL
DISTRIBUTION.
1. KINETIC STUDY
The time course of [^¾]icxiomelatonin binding to the membrane preparations
of the chicken (Figure 5),quail (Figure 10),pigeon (Figure 11) and duck (Figure
12) were studied at 40C. In all the animals studied, association of the radioligand
(concentration between 18-30 pmol/1) to crude brain membrane preparations at 40C
showed a gradually increase in specific binding during the first 3 hours and
equilibrated after approximately 5 hours.
After equilibrium was obtained at 5 hours, 10 yd of 350 [xmol/1 melatonin
was added (to make the melatonin final concentration of 10 |xmol/l) to initiate
dissociation. Most displacement of specific binding of [^^Ijiodomelatonin
occurred within 4-5 hours, indicating that specific binding of [^^I]icxiomelatonin
to bird brain membrane preparations is reversible. The data of the kinetic studies
from the different species of birds were very similar. The and the
kinetically derived Kd values are shown in Table 8.
2 . SATURATION STUDY
Saturation studies were conducted using the brain membrane preparations of
the birds collected at ML. Total and nonspecific binding of [125I]iodomelatonin
with the brain membrane preparations increased over the range of 5-120 pmol/1
[125j]i(xionielatonin. Nonspecific binding was determined in the presence of 10

pmol/l melatonin. Specific binding was determined as the total binding minus
nonspecific binding. Specific binding of [ ]iodomelatonin increased with
increasing concentrations of the radioligand and approached saturation at higher
radioligand concentrations. The saturability of the [125I]iodomelatonin binding
sites was shown by the representative experiments with the membrane preparations
from the brain of chicken (Figure 7),pigeon (Figure 13),duck (Figure 14) and
quail (Figure 15). The linearity of Scatchard plots of specific binding data from the
saturation studies in all the birds studied suggests that each brain has a single class
of binding sites for [^^I]iodomelatonin (Figure 7 and 13-15). The values of
Bmax and Kd from the Scatchard analysis demonstrates that [ ^1]iodomelatonin
binding sites are of high affinity and low capacity. The density of
[^^I]iodomelatonin binding in the brain of birds is as follows: duck > pigeon >
quail > chicken (Table 9).
3. SPECIFICITY
To ascertain the specificity of [12^]iodomelatonin binding to the membrane
preparation of the various avian brains, binding assays were carried out by adding
varying concentrations of unlabelled melatonin analoges and neurotransmitters, and
a constant amount of [^^I]iodoinelatonin (20-30 pmol/1) to membrane
preparations. The inhibition constant (Ki) values were calculated from 50%
inhibition concentration (IC5Q) values (Table 10). Both melatonin and 6-
chloromelatonin were found to be potent inhibitors of [125I]iodomelatoiiin binding
in bird brain membrane preparations, while N-acetylserotonin only showed minor
inhibition and the other compounds tested showed no significant inhibition of
[125I]iodomelatonin binding sites. The various concentrations of melatonin from
ICT to 10 ^ mol/1 in all the birds tested resulted in similar monophasic
competition curves (figure 16),suggesting a single class of binding sites for
[12^I]icxiomelatonin in the birds brain membrane preparations.
4 . REGIONAL DISTRIBUTION
The regional distribution of [125I]iodomelatonin binding sites in the brain
membrane preparations of chicken and pigeon were studied. The Scatchard analysis
in the chicken and a one point analysis (using a [12^I]icxiomelatonin concentration
of 39.5 pmol/1 for the binding study) in the pigeon showed an uneven distribution
of binding sites. Specific binding was found in all brain regions examined with the
following order of densities in both the chicken and pigeon brain regions:
hypothalamus > midbrain > pons-medulla > telencephalon and cerebellum (Table
11). No significant changes of Kd values were recorded in the chicken brain
regional binding studies (Table 11).
5 . SUBCELLULAR DISTRIBUTION
Brain tissue homogenates of the chicken and pigeon were fractionated by
differential centrifugation. The subcellular distribution of [12^I]iodomelatonin
binding sites in the brain tissue of the birds is shown in Table 12.
[l^I]iodomelatonin binding was maximal in mitochondrial fractions followed by
the nuclear fractions (Table 12),which were included in the crude membrane
preparations.
6. THE EFFECT OF GTP ANALOGUES ON THE CHICKEN
BRAIN [125I]IODOMELATONIN BINDING SITES
The addition of 10" mol/1 GTPyS significantly reduced the binding capacity
of [ ]iodomelatonin binding sites in 12 weeks old chicken brain membrane
preparations, without affecting the K d value (Table 13). The fact that GTPyS
exerted an inhibitory effect on [^]icxiomelatonin binding indicated that the
recognition sites of [^^jiodomelatonin are coupled to guanine nucleotide-binding
proteins.
C. DIURNAL VARIATION AND EFFECTS OF MELATONIN
MANIPULATIONS ON [125I]IODOMELATONIN BINDING SITES
IN THE CHICKEN BRAIN.
In this experiment, all the animals were sacrificed at the age of five to eight
weeks old. Animals were decapitated at midlight (0900-1000h) or middark (2100-
2200h), or at 4 h intervals throughout a 24 hour period (OlOOh,0500h,0900h,
1300h,ITOOh, 2100h).
1 . DIURNAL RHYTHMS OF SERUM MELATONIN LEVELS AND
BINDING CAPACITY OF [^^IJIODOMELATONIN BINDING
SITES
Serum melatonin levels and the iodomelatonin binding site capacities
of chicken brain membrane preparations measured at 4 h intervals throughout a 24
h L:D cycle showed clear light-dark variations (F = 3.18; df = 23/5; p < 0.05). The
well-established nocturnal peak of serum melatonin followed by an abrupt fall after
light onset was observed. The mean serum level of melatonin was lower in the
light period (39.9 士 6.9 pmol/1) compared to that in the dark period (764.0 土 226.7
pmol/1) (p < 0.05, Table 14).
Scatchard analyses of [ ^I]iodomelatomn binding sites in the chicken
brain membrane preparations revealed the presence of a single population of
binding sites at each time point of the 24 h cycle (Figure 17). The
[125I]iodomeIatonin binding capacities in the chicken brain membrane preparations
presented a light-dark variation (F = 9.35; df = 23/5; p < 0.05) with low levels

from middark (2100 h, 12.8 ± 0.82 fmol/mg protein) until the end of the dark
period (0100 h, 11.8 土 1.8 fmol/mg protein). The [ 125jjiodomelatonin binding
remained higher from the early light period to the early dark period with the
highest level recorded at the end of the light period (1300 h, 19.7 士 0.45 fmol/mg
protein) (Table 14). The mean values of the binding densities were 183 土 0.8
fmol/mg protein and 14.2 士 1.4 fmol/mg protein during the light and dark period
respectively (p<0.05). The binding was 48.4% higher at midlight than that at
middark (pcO.Ol). Values obtained at 2100 h and 0100 h were significantly lower
(p < 0.05) than those at 0500 h, 0900 h,and 1300 h.
Linear regression showed a significant inverse relationship between
[^^I]iodomelatonin binding capacities and serum levels of melatonin (correlation
coefficient = 0.823; p < 0.05). There were no significant changes (F = 0.63; df =
23/5; p >0.05) in the Kd values throughout the 24 h period studied (Table 14).
2 . EFFECTS OF MELATONIN ADMINISTRATION ON SERUM
MELATONIN LEVELS AND [1 2 SI]IODOMELATONIN BINDING
CAPACITIES
Four weeks old chicks were used. Saline (control) or melatonin (1 mg/kg;
i.p.) was injected intraperitoneally twice a day, shortly after the light onset and
shortly before the light offset . After three weeks of injection, the chicks were
decapitated at ML and MD. Melatonin injection greatly increased serum melatonin
levels at both midlight and middark, and abolished the rhythm of melatonin in the
serum (Table 15). Melatonin injection also abolished the light-dark difference of
the [125I]iodomelatonin binding to the membrane preparation of chicken brain by
53
decreasing the binding at mid-light (P < 0.01). There was no effect on the binding
at mid-dark nor effect on the Kd values at both mid-light and mid-dark (Table 15).
3, EFFECTS OF PINEALECTOMY ON SERUM MELATONIN
LEVELS AND [125I]IODOMELATONIN BINDING IN THE BRAIN
Pinealectomy almost eliminated the serum melatonin content and abolished
the daily rhythm of melatonin levels in the circulation (Table 16). It also increased
the [^^I]icdomelatomn binding capacities both at mid-light and mid-dark by 52.3
and 53.8% (p < 0.05) than their respective control groups (Table 16). There was,
however, no significant change in the Kd values (Table 16). The light-dark
variation of [^^I]iodomelatomn binding in the pinealectomized animals remained
significant (p <0.05) with a higher value at mid-light.

54
D. DEVELOPMENT OF [125I]IODOMELATONIN BINDING
SITES IN T H E CHICKEN BRAIN
1. COMPARISON OF [125I]IODOMELATONIN BINDING
CHARACTERISTICS BETWEEN THE 17-DAY-OLD EMBRYO AND
YOUNG CHICKEN BRAIN MEMBRANE PREPARATIONS
1). KINETIC STUDY
The time course of the [^^]icxlomelatonin binding to the 17-day-old
chicken embryo (Figure 18) and 10-week-old (Figure 4) chicken brain membrane
preparations were studied at 370C. Association of 10 pmol/1 of the radioligand to
the 17-day-old chicken embryo brain membrane preparations showed a rapid
increase in specific binding within 20 minutes and reached equilibrium after 40
minutes (Figure 18A),with an association rate constant (Kj) of 5.1 X 10® min"
M-l (Figure 18A). Once equilibrium was reached, 10 |xl of 35 fxmol/1 melatonin
was added (to make the melatonin final concentration of 1 |Jimol/l) at 40 min to
induce the dissociation. Dissociation was complete within 60 minutes (Figure 18B),
with the dissociation rate constant ( K . j ) of 2.3 X 10" m i n ( F i g u r e 18B )• The
kinetically derived Kd value (K. j /k j ) was 45 pmol/1. A similar time course of
[^^I]iodomelatonin association with and dissociation from the 10-week-old
chicken brain membrane preparations at 370C was recorded (Figure 4). The Kd
value calculated from the kinetic study in 10-week-old chicken brain membrane
preparation was 70 pmol/1 from the ratio of K p 9 . 5 X 10^ min"-'". and K . j =
6,7 X 10"2 min"1- The kinetic studies demonstrated that the 17-day-old chicken
embryo and 10-week-old chicken brain membrane preparations had similar binding
time courses.
2) SATURATION STUDY
The brain membrane preparations of 17 days old embryo and 10 weeks
old chicken were incubated with [125I]iodomelatonin (concentrations of 10-320
pmol/1) at 37° C for 1 h. The saturation curves showed that the specific binding of
[^^I]iodomelatonin to both the 17 days old embryo (Figure 19) and 10 weeks old
chicken (Figtire 6) brain tissues were concentration dependent and reached
saturation towards the higher range of radioligand concentrations. The Scatchard
analysis of the specific binding data resulted in linear plots suggesting binding to a
single class of binding sites (Figure 19 and 6)
3). SPECIHCITY
The specificity of melatonin binding sites was studied using brain
membrane preparations of 17-day-old embryos and 10-week-old chickens. Figure
20 shows the representative competitive inhibition curves of melatonin, 6-
chloromelatonin and N-acetylserotonin, Table 17 shows the inhibition constant (Ki)
values which were calculated from 50% inhibition concentration (IC5Q) values. The
data demonstrate that the [•'•^Iliodomelatonin binding sites in the embryo and
young chick brain membrane preparations share the common pharmacological
profile.
D E V E L O P M E N T O F C H I C K E N B R A I N
[1 2 SI]IODOMELATONIN BINDING SITES
To study the development of chicken brain [125I]iodomelatonin binding
sites brains of chicken embryos (6 days; E6,10 days; E10,13 days; E13 and 17
days; E17), newly hatched chickens (1 day; HI , 7 days; H7), young chicken (20
days; H20, 40 days; H40) and adult chickens (6 months; M6, 12 months; M12)
collected at mid-light were used.
1). DEVELOPMENT OF CHICKEN BRAIN WEIGHT AND THE
PROTEIN CONTENT
The brain weight and protein content per gram brain wet tissue of the
embryo (E 10-17),newly hatched (H 1-7), young (H 20-40) and adult (M 6-12)
chickens are shown in Table 18. A progressive increase in brain weight was noted
from the E 13 to newly hatched chicken. This increase in brain weight was
accompanied by a gradual increase in the brain protein content from E 17 to H 7 as
expressed by the protein content mg/g brain weight From the young to the mature
chicken,the brain weight increased continually and the protein content of brain
tissue was slightly higher in the adult animals (p< 0.01) compared to the embryo,
newly hatched and 20-day-old chicken (Table 18).
2). DEVELOPMENT OF CHICKEN BRAIN [125I]I〇DOMELATONIN
BINDING SITES
The specific binding of [125I]iodomelatomn with chicken brain
membrane preparations was not detectable before embryonic day 6. By embryonic
day 10, [ ^Iliodomelatonin binding could be repeatably measured but non-
specific binding was high and it was difficult to obtain acceptable Scatchard plots.
After embryonic day 13 the specific binding was clearly identifiable and Scatchard
analysis was performed to measure Kd values and the binding capacities of the
[125I]iodomelatonin binding sites during the development Table 19 and Figure 21
show the binding capacities as expressed in fmol/mg protein,fmol/g brain tissue
and fmol/brain. Between embryonic day 13 and posthatch day 7,there was a 14-
fold increase in [125i]iodomelatonin binding as expressed per whole brain (from
56.1 to 779.3 fmol/brain) and about 2.4-fold increase when expressed per
mg/protein (from 5.89 to 14.25 fmol/mg protein) (Figure 21). The
[l^I]iodomelatomn binding capacity reached its highest level in the 40 day-old
chicken as expressed by the fmol/mg protein (16.4 fmol/mg protein). The density
of the [•'•^Iliodomelatonin binding sites was slightly lower in the adult animals (M
6 and M 12) than in the 40-day-old chicken (P < 0.05) (Figure 21). The Scatchard
analysis showed that [ iodomelatonin binding sites in the chicken brain during
the development had high affinity. The apparent Kd values ranged between 46.9 -
89.2 pmol/1. Although the density of binding sites varied considerably during
development, Kd values did not change significantly from E 17 to adult (Table 19,
Figure 22). Only the embryonic 13 day group with the Kd value of 46.9 土 15.5
pmol/1 was slightly lower than the Kd values of 40-day-old chicken and 12-month-
old chicken (p< 0.05). The presence of high affinity [125I]iodomelatonin binding
sites in the early embryonic chicken brain suggest that melatonin might have a
central action in the early stages of development
The [125I]iodomelatonin binding capacity reached its highest level in
young chickens (H 40 with Bmax of 16.4 土 0.42 fmol/mg protein) and decreased
in the adult chicken ( M 12 with Bmax 12.2 ± 0.2 fmol/mg protein) (p<0.05)
suggesting that the binding capacity may be age-related (Table 19).

58
3- DEVELOPMENT OF THE DIURNAL RHYTHM OF
[125I]IODOMELATONIN BINDING SITES IN THE CHICKEN
BRAIN
The light-dark variation of [^^Iliodomelatonin binding sites in the
chicken brain membrane preparations was studied using the brains of 13 and 17
days old embryos; 1 and 7 days old posthatched chicks and the chickens of 20,40
days old and 6,12 months old. The light-dark variation of [•'•^Iliodomelatonin
binding sites was found in young chickens (20 and 40 day-old chicks) with high
binding at M L and low binding at MD. There was no significant change in Kd
values (Table 20,Figure 23).
4. THE EFFECT OF OTPYS ON THE [ 1 2 5]IODOMELATONIN
BINDING SITES IN EMBRYONIC CHICKEN BRAIN
Figure 24 shows typical saturation and Scatchard plot analysis of
iodomelatonin binding to brain membrane preparations at E 18. The data -C
demonstrates a single class of receptors with high affinity. The addition of 10"J
mol/1 GTPYS markedly reduced the maximal number of binding sites (from 10.6 to
5.7 fmol/mg protein) without affecting the Kd value (Table 21).
59
E . BINDING CHARACTERISTICS AND DIURNAL
VARIATION OF [125I]IODOMELATONIN BINDING SITES IN
CHICKEN RETINAS
To study the binding characteristics and light-dark variation of
[12^I] iodomel atonin binding sites in chicken retinas, 4- to 8-week-old chickens
were used. Chickens were killed at M L except in the diumal variation study where
chickens were killed at MD.
! • KINETIC STUDY
The time courses of [^^]icxlomelatonin association with and dissociation
from the binding sites on retina membrane preparations were studied. Eight-week-O
old chicken retina membrane preparations (140 jxg protein) were incubated at 37 C
with [^^I]iodomelatomn (60 pmol/1) in Tris-HCl buffer for the indicated times (5,
10,15,20,30,40,60,80 minutes) and the amount of specifically bound
[^^1] icxiomelatonin was determined following rapid filtration. Nonspecifically
bound [ 125jjjodomelatonin was defined as [ ^I]iodomelatonin bound in the
presence of 1 pmol/l melatonin. The association of the specific binding of
[125I]icxiomelatonin to the membrane preparation was rapid during the first 30 min
of incubation, reached equilibrium after 40 minutes and then decreased after 60
minutes (Figure 25 A). The association rate constant ( K ^ calculated from the
pseudo-first order equation was K j = 1.78 X 10^ min"^ M**-'- (Figure 25A). After
equilibrium was reached (at 50 min), 10 [il of 35 fxmol/l melatonin was added to
initiate dissociation and the amount of specifically bound [125I]iodomelatomn was
determined at the indicated times (5,10,15,20, 30,40,60,120 minutes). Rapid
displacement occurred during the first 20 minutes of incubation and complete

displacement occurred after 60 minutes of incubation (Figure 25B). The
dissociation rate constant (K.^) calculated from the first-order equation was =
4.46 X 10"2. min"1 (Figure 25B). The Kd value derived from the ratio of K^/K j
was 256 pmol/1.
2 • SPECIFICITY
The pharmacological profile of [125I]iodomelatonin binding sites was
determined by competition experiments. Ten chicken retinas were pooled and
membrane preparation aliquots with 100-150 \ig of protein were used for the
competition experiment in the presence of 10"13 to 10" mol/1 of various melatonin
analogues and neurotransmitters. Thirty pmol/1 [^^Ijiodomelatonin was used. The
Ki values are shown in Table 22. Comparison of Ki values for the inhibition of
binding by melatonin analogues and neurotransmitters showed that melatonin was
the most potent displacing agent (Ki 1 nmol/1), followed by 6-chloromelatonin with
an Ki value of 11.2 nmol/1. HAS was a weak displacing agent with Ki value of 50
nmol/1. [ "'•^^]Iodomelatomn binding was not substantially affected by the other
compounds tested.
3 • SATURATION STUDY
The specific binding of [^^I]iodomelatonin to chicken retina membrane
preparations at 37 0 C was a saturable process using radioligand concentrations
ranging from 10-650 pmol/1. Nonspecific binding, defined in the presence of 1
[xmol/l of melatonin, increased linearly with [125I]iodomelatonin concentrations. A
representative saturation isotherm and the Scatchard plot of [ 1 2 5 I ] iodomelatonin
binding to the membrane preparations of chicken retina is shown in Figure 26. The

Kd and Bmax values for iodomelatonin binding were 366.5 土 96.5 pmol/1
and 47.2 +. 1.26 fmol/mg protein respectively (Table 23).
4. DIURNAL VARIATION OF [ 1 2 5 I]IODOMELATONIN
BINDING
The [^iodomelaton in binding capacity and affinity to the retina
membrane preparations of 4-week-old chicken killed at M L and MD were studied
by the Scatchard analysis. The Bmax of [1 ^1]iodomelatonin binding sites was
47.1% higher at M L (47.2 土 1.26 fmol/mg protein) than at M D (32.1 土 4.55
fmol/mg protein). There was no significant change in the affinity (Table 23)

F . DEVELOPMENT OF [125I]IODOMELATONIN BINDING
SITES IN THE CHICKEN RETINA
1. T H E BINDING C H A R A C T E R I S T I C S O F
[125I]IODOMELATONIN BINDING SITES IN EMBRYONIC
CHICK RETINA
1). KINETIC STUDY
Fifteen-day-old embryonic retinas of 6 animals were pooled to perform
the kinetic studies. The membrane preparations (120 |xg protein) were incubated at
370C with 60 pmol/L of [^^I]icxlomelatonin in Tris-HCl buffer. The experiment
was conducted at the same time as the chicken retina kinetic studies and the same
procedure was used. The association of the specific binding of [必I]iodomelatonin
to the membrane preparation was rapid during the first 20 minutes of incubation and
reached equilibrium after 60 minutes (Figure 27A). K j calculated from the pseudo-
first order equation was 0.15 X 10 m i n " ( F i g u r e 27A). After equilibrium
was reached at 60 minutes, dissociation was initiated. Displacement occurred
rapidly at the first 40 minutes and complete displacement occurred after 60 minutes
(Figure 27B). The was 1.78 X 10"2 min"1 (Figure 27B). The K d value
derived from the ratio of K^ /K j was 118.6 pmol/L
2). SPECIFICITY
Fifteen-day-old embryonic retinas from 14 animals were pooled. Aliquots
of the membrane preparations with protein (110 \ig) were used for the competition
experiment in the presence of 30 pmol/1 [125I]iodomelatonin as well as various
melatonin analogues and neurotransmitters. The results showed the similar order of
pharmacological affinity of the compounds tested as that of the chicken retina
(Table 22).
3). SATURATION STUDY
The non-specific binding for [125I]iodomelatonin at embryonic day 10
was about 75%, therefore saturation curves and linear Scatchard plots were not
obtained from animals younger than this age. After embryonic day 15,the ratio of
specific binding to non-specific binding increased gradually. The Bmax values were
9.2 土 2.4 fmol/mg protein at embryonic day 15 (n=3), 15.2 fmol/mg protein at
embryonic day 18 (n=l) and 21.86 fmol/mg protein at day 20 (n=l). The K d
values were 102 土 21.3 pmol/1 at embryonic day 15 (n=3),126.2 pmol/1 at
embryonic day 18 (n=l) and 181 pmol/1 at embryonic day 20 (n=l). Figure 28
shows the representative saturation and Scatchard plots of [ ^1 ] iodomelatonin
binding to the retina at embryonic day 15.
2 . THE DEVELOPMENT OF [ 1 2 5 I ] I O D O M E L A T O N I N
BINDING SITES IN CHICKEN RETINAS
The development of [ 12^I]iodomelatonin binding sites in chicken retinas
was studied by using embryonic chicks (7,10,15, 20 days old) and posthatched
chicks (four weeks old). Embryo and 4 week-old chicken retina weights, protein
contents, binding capacity expressed per milligram protein and the ratio of specific
binding are shown in Table 24. A progressive increase in the pair of retina weight
was noted from 1L7 mg from 10-day-old embryos to 1103 mg of posthatched 28-
day-old chicks. The protein content remained constant during this period. (Table
24). The binding study was performed by one-point analysis using 46.8 pmol/1
[125i]i0d0inelatomn. Specific binding was undetectable in animals less then
embryonic 10 days old. Even in 10 day old embryos non-specific binding
represented over 75% of the total binding. After embryonic day 15,the specific
binding increased greatly (Table 24). The results demonstrate the existence of
[1^1] iodomelatonin binding sites in the early development of chicken embryonic
retinas.
65
IV, DISCUSSION
A. CHARACTERIZATION OF [125I]IODOMELATONIN BINDING SITES
IN AVIAN BRAIN.
1 • THE RADIOLIGAND • [1 2 5I]IODOMELATONIN
The radioligands used in the melatonin receptor binding assay were either the iodinated
or tritiated form. Tritiated ligands have the same molecular structure, binding affinity,
biological activity and metabolic rate as melatonin. The principle disadvantage of the tritiated
radioligand is that it has a lower specific activity than the iodinated form. This disadvantage has
hindered the detection of melatonin receptors with very high affinity and low binding capacity
(Dubocovich, 1988a). On the contrary, iodinated melatonin has a much higher specific
activity than the tritiated compound. Unfortunately, the iodination of melatonin,a derivative
of tryptophan, has proven to be difficult Little progress had been made until 1984 when
Vakkkuri et al. (1984) successfully synthesized 2 - [^ iodomela ton in by using the mild
oxidase,iodo-gen. It has been demonstrated that 2- [^^jiodomelatonin has a high specific
activity (about 2200 Ci/mmol) and retains the high specificity and affinity for melatonin binding
sites (Dubocovich 1988a). According to the structure and activity relationship studies, 2-
[^^^1]iodomelatonin is a potent melatonin receptor agonist (Dubocovich 1988a). 2-
Iodomelatonin is more potent than melatonin in the reduction of dopamine release in the
chicken retina in vitro (Dubocovich and Takahashi, 1987),and the inhibition of gonad
development in Djungarian hamsters in vivo (Weaver et al 1988; Sugden, 1989). The
development of [ 125I]icxiomelatonin has greatly facilitated the studies of melatonin receptor in
the last few years.
66
While our studies were in progress, [125I]iodomelatonin binding sites in homogenized
brain and retina tissues had also been studied in many species by radio-receptor assay (see
review of Stankov and Reiter 1990; Krause and Dubocovich 1991; Section IB2-3). The Bmax
and K d values determined by the Scatchard analysis varied greatly between species (see
review of Stankov and Reiter 1990; Krause and Dubocovich 1991; 丁able 2,3). Comparison of
the [ 1 1 ] iodomelatonin binding data in chicken brain shows there were some deviations
between laboratories (Dubocovich et al.,1989; Stehle, 1990; Rivkees et al.,1989b; Shankar
and Dubocovich, 1989; Yuan et al., 1990; Ying and Niles, 1991; Table 25). Apart from
different factors in the binding studies including the incubation temperature and time, tissue
preparations and methods of separating bound and free ligand,the specific activity and purity
of the 2 - i o d o m e l a t o n i n might be important factors. Thus, the iodomelatonin
prepared by different laboratories might have different specific activity and purity which might
result in the discrepancy of the binding data. It was demonstrated in our laboratory that the
separation of [•'•^Ijiodomelatomn by TLC and HPLC gave different binding results (Table 4).
In addition, the quality of commercially obtained [ ^I]iodomelatonin varied from one batch to
another. Taking these factors into consideration, it is not surprising that there were
discrepancies in the binding data reported from different laboratories. However,the
characteristics (time course, Kd and Bmax values calculated from Scatchard analysis and
specificity) of [125I]iodomelatomn binding sites reported within our laboratory is consistent in
the brain tissue of birds including chicken,quail,pigeon, duck (Table 8-10) and human fetus
(Yuan et al., 1991); in the spleen (Yu et al., 1991) and gonad (Ayres et al., 1992) of chicken,
in the gut of duck (Lee et al” 1992); as well as in the retina of chicken (Figure 25,26) and tree
shrew (Lu et al” 1991).
2. THE IDENTIFICATION AND BINDING CHARACTERIZATION OF
[1 2 S I]IODOMELATONIN BINDING SITES IN AVIAN BRAIN.
67
The identification and characterization of [125I]iodomelatomn binding sites in the brain
tissue of chicken has been reported since 1989 by several groups during the course of our
studies (Dubocovich et al., 1989; Rivkees et al.,1989b; Stehle, 1990). Comparable data for
the [ 125I]iodomelatonin binding studies in the chicken brain between our laboratory and the
other groups are shown in Table 25. Our results confirmed and extended the findings of
[123i]i0domelatonin binding sites in the brain tissue of birds. It showed that
[125I]iodomelatonin specifically bound to chicken, duck, pigeon and quail brain membrane
preparations. These sites satisfy all the criteria for hormone binding sites: They are saturable,
reversible, specific and of high affinity. The linearity of the Scatchard plot and the unity Hill
coefficient suggest that [1 2 5I] iodomelatonin binds to a single class of sites in membrane
preparations of the avian brain. The circulating levels of melatonin reported were 100-1000
pmol/1 in the chicken (Pelham et al, 1972), 300-700 pmol/1 in the pigeon (Pang et al” 1983)
and 100-1000 pmol/1 in the quail (Pang et al•,1983; Underwood et aL, 1984). The high
affinity of [ 125I]iodomelatonin binding sites in avian brain as was demonstrated by the K d
value calculated from Scatchard analysis (30-50.6 pmol/1. Table 9) and kinetic analysis (26.9-
72.2 pmol/1. Table 8) indicates that these binding sites are physiologically relevant (Pang et al”
1990). The present results demonstrated that the binding characteristics were similar in the
brains of different avian species (chicken, pigeon, quail and duck). The Kd and Bmax values
for the [125I]iodomelatonin binding sites in chicken brain membrane preparations obtained in
our laboratory were consistent with those reported by other groups (Table 25). In addition, the
observed order of potencies for inhibiting [^ ] iodomela ton in binding with various
indoleamines and monoamines in avian brain was also similar to that observed by other groups
in chicken brains (Table 25),chick retinas (Dubocovich and Takahashi., 1987; Table 22) and
the other high affinity binding sites in neural tissues (Section IB2-3,Table 2). Some minor
68
differences could be due to differences in methodologies used such as the preparation of the
[12¾]iodomelatonin,incubation, time and temperature as well as the age and species of animals.
Our present studies demonstrated that the [125I]iodomelatonin binding sites were
similar in the brain of different avian species (Table 8-10). Dubocovich (1988a) suggested that
[^^1]iodomelatonin binding sites in the nervous system could be classified into two different
subtypes, the ML-1 (picomolar affinity binding sites) and ML-2 receptors (nanomolar affinity
binding sites) (see introduction section Table 2 and 3). The ML-1 binding sites were found in
the whole brain tissue of reptile and birds as well as in the discrete brain areas of birds. The Kd
and Bmax of high affinity [125I]iodomelatonin binding sites were less than 350 pmol/1 and 100
fmol/mg protein respectively. The phannacological order of affinities was 2-iodomelatoiiin > 6-
chloromelatonin > melatonin > N-acetyl-5-hydroxytryptamine > 5-methoxytryptamine > 5-
hydroxytryptamine (Dubocovich, 1988a). Our results demonstrated that the
[125I]iodomelatonin binding in the membrane preparations of chicken, quail, pigeon and duck
(Table 8-10),possessed similar binding characteristics with the ML-1 [^^I]iodomelatonin
binding sites proposed by Dubocovich (1988a).
Present studies showed that the icxiomelatonin binding sites in the membrane
preparations were found in all brain regions of chicken and pigeon examined: The order of
density of specific binding in those region was: hypothalamus > midbrain > pons-medulla >
telencephalon > cerebellum (Table 11). Similar findings in chicken brain regions were
recorded by other groups using autoradiography (Rivkees et al., 1989b; Stehle 1990) or
receptor binding studies (Dubocovich et al” 1989). These data were, in part,consistent with
the regional distribution of endogenous melatonin levels in the chicken (Pang et al” 1974) and
rat brain (Pang and Brown, 1983), and the uptake of exogenous [3H]melatonin in the rat brain
(Anton-Tay and Wurtman, 1969). Earlier studies have suggested the involvement of the
hypothalamus in the melatonin action. Implantation of melatonin in the hypothalamus reduced
pituitary and plasma LH in castrated rats (Fraschini et al” 1968a), as well as the weight and
69
activity of the genital tract in white-footed mice (Glass and Lynch, 1982). Melatonin treatment
increased hypothalamic 5-hydroxyindole acetic acid and serotonin levels in the chicken
(Cassone et al” 1983),and hypothalamic norepinephrine levels in the mouse (Fang and
Dubocovich, 1988). Furthermore, pinealectomy decreased 5-hydroxyindole acetic acid in the
hypothalamus and midbrain in rats (Niles et al•,1983). In vitro, melatonin decreased cyclic
AMP, prostaglandins, and E2 synthesis (Vacas et al., 1981),but increased somatostatin release
(Richardson et al.,1981),and cyclic GMP synthesis (Vacas et al., 1981) in the rat
hypothalamus. The above findings together with the melatonin binding studies are in line with
the suggestion that the hypothalamus is an important site of pineal melatonin action.
In birds, the high affinity [^^I]iodomelatonin binding sites are widely distributed
throughout the whole brain. This is in marked contrast to the very restricted distribution of
melatonin receptors in mammalian brains (Table 2). Autoradiography revealed that
[125I]iodomelatonin binding sites only occurred in the suprachiasmatic nuclei and the median
eminence of the hypothalamus from rats (Vanecek et al.,1988b; Williams,1989),
suprachiasmatic nuclei from human adults and fetuses (Reppert et aL, 1988), and the median
eminence and anterior pituitary from hamsters (Vanecek and Jansky, 1989). Rivkees et aL,
(1989b) reported a 125-fold difference in the [125I]iodomelatonin binding sites in whole brain
of chicks as compared to rats using the same binding assay conditions. Similarly melatonin
concentrations in tissues of birds were higher than in mammals (Pang, 1985). The distribution
of [125i]i0domelatonin binding sites in spleens of birds were also higher than those in
mammals (Yu et al” 1991). These seemingly well correlated phenomena suggest differences in
the activities and/or functions of pineal melatonin between birds and mammals. In this study, the distribution of [125I]iodomelatonin binding sites among subcellular
fractions of chicken and pigeon brain was demonstrated (Table 12). Our results showed that
binding was higher in the mitochondrial pellet (P2) than in the nuclear pellet (PI) (Table 12).
This is consistent with the subcellular distribution of [^^Iliodomelatonin binding in the
70
chicken brain (Dubocovich et al” 1989), hamster hypothalamus (Duncan et al” 1988) and
bovine brain (Cardinali ct al” 1979). It should be noted that specific iodomelatonin
binding sites were reported in the nucleus of a tumour cell line (Stankor and Reiter,1990).
Stankov and Reiter (1990) suggested the possible existence of intracellular melatonin
receptors, since melatonin is a small and highly lipophilic molecule which passes through the
cell membrane easily. Pang et al., (1991) also speculated that the radioligand-binding site
complex might undergo internalization for its physiological action and/or degradation.
However, the subcellular fractions prepared by the differential centrifugation had a tendency to
be cross-contaminated and the above data has to be treated with caution. Further studies with
more precisely refined subcellular fractionation is needed for the better understanding of the
sites and mechanism of melatonin action.
In the present study GTPyS of 10"^ mol/1 significantly decreased the
[^^Ijiodomelatonin binding to chicken brain membrane preparations (Table 13),suggesting
that these receptors are linked to a G-protein. This is in line with previous studies (Dubocovich
et al., 1990; Ying et al., 1991; Niles et aL, 1991) which demonstrated that
[^^1]iodomelatonin binding sites in chicken brain were G-protein related binding sites. Niles
et al. (1991) further suggested that the G-protein linked melatonin receptor was a pertussis
toxin-sensitive Gi-protein.
The [125I]iodomelatomn binding capacity and affinity was affected by the assay
conditions including the presence of ions, guanine nucleotide and incubation temperature. In
the present study, it was demonstrated that Na+ (100 mmol/1) decreased the binding density by
20% while neither Mg+ + nor Ca++ had any effects on the binding in chicken brain membrane
preparations (Table 5). These results were consistent with those obtained from chicken brain
and retina (Dubocovich and Takahashi•,1987; Dubocovich et al., 1989),and rat brain
(Laitinen and Saavedra, 1990b; Laitinen et al.,1990). The mechanism by which sodium

71
modulaties [125I]iodomelatomn binding is still unclear but it is suggested that NaCl may affect
the conformation of the receptor molecule ((Laitinen and Saavedra, 1990b).
In the present study, neither binding density nor affinity had any significant changes
between 370C and 250C incubation temperature. However, binding density was significantly
decreased while the affinity increased as incubation temperature decreased from 370C or 250C
to 40C (Table 6). The kinetic studies showed that both association and dissociation of
[^^I]iodomelatonin from the chicken brain membrane preparations were slower at 40C than
that at 370C (Figure 4 and 5) and that binding to the membrane preparations was temperature
dependent. Dubocovich et al. (1990) also reported that binding to chicken brain membrane
preparations showed no significant difference between 370C and 250C. However they found
that the binding affinity but not density of [ ^]iodomelatonin binding sites studied at 40C
decreased when compared to the affinity at 370C. The discrepancy of these results needs to be
studied further.
3. T H E P H Y S I O L O G I C A L SIGNIFICANCE O F T H E
[125I]IODOMELATONIN BINDING SITES IN CHICKEN BRAIN
The possible physiological significance of the high affinity [•'•^Ijiodomelatonin
binding sites in the chicken brain is supported by: 1) the Kd values of [^^1] iodomelatonin
binding sites in the chicken brain had the same order of magnitude as melatonin concentrations
in the chicken circulation; 2) the regional distribution pattern of endogenous melatonin
paralleled that of [125I]iodomelatomn binding sites in the chicken brain (Pang et al” 1990);
3) melatonin and related indoles had the same order of potency in the inhibition of
[125I]iodomelatonin binding in the chicken brain membrane preparations and in the inhibition
of H] dopamine release from the chicken retina (Dubocovich, 1988a); 4).
72
[125i]iodomelatonin binding was inversely related to the rhythm of serum melatonin levels
(Table 14) and melatonin manipulations changed the binding capacity ((Table 15,16); 5). GTP
and its analogues decreased the binding capacity of [^^Ijicxiomelatonin in the chicken brain
(Dubocovich et al” 1990a; Table 13) and in solubilized chicken brain membrane preparations
(Ying and Niles, 1991) indicating that these binding sites belong to a family of G-protein
linked receptors. The functional significance of chicken brain melatonin receptor remains to be
established.
73
B. CIRCADIAN RHYTHM AND THE EFFECT OF MELATONIN
MANIPULATION ON THE [ 125I]IODOMELATONIN BINDING SITES
IN THE CHICKEN BRAIN.
Diumal variations of both high affinity binding sites in the brain of chickens (Yuan
et al., 1990), pars tuberalis area of rams (Pelletier et al,1990), suprachiasmatic nuclei
of rats (Laitinen et al” 1989) and low affinity binding sites in discrete brain areas of
hamsters (Anis et al., 1989) and rats (Zisapel et al., 1988) have been reported. It should
be noted that the high and low affinity binding sites had a difference in their respective
Kd of about 100 to 1,000 fold. Thus they may have different mechanisms and functions
in the diumal variation and regulation of these receptors.
In the present study, we tried to explore the possible explanation for the diumal
variation of the [125j]iodomelatonin binding sites in chicken brain by observing the
changes of melatonin binding sites under light and dark photoperiod and following
manipulations of circulating melatonin levels by melatonin injections and pinealectomy.
1 , DIURNAL RHYTHMS OF SERUM MELATONIN LEVELS AND
[125I]IODOMELATONIN BINDING CAPACITIES
Our results showed that the rhythm (the wave-form, phase, and amplitude) of
[^^1] iodomelatonin binding sites in the brain was inversely related to the rhythm of
semm melatonin levels (Table 14). It was demonstrated that melatonin concentrations in
the chicken brain had similar diumal variations as that of melatonin concentrations in the
blood both in the bird (Pang et al” 1983) and the rat (Cardinali et aL,1991). It is
74
suggested that the density of [125I]iodomelatonin binding site in the brain tissue was
saturated by the endogenous melatonin when the melatonin levels in blood and brain are
high during the night time.
Barsano and Baumann (1989) suggested that hormone receptor saturation could be
calculated by the receptor Bmax, K d value and hormone concentration. Brain melatonin
receptor saturation calculated by [^^I]iodomelatomn binding capacity (Bmax), apparent
affinity (Kd),and brain melatonin concentration (Pang et al” 1991) showed that
[125I]iodomelatonin binding sites were about half (57%) saturated at midlight and close
to completely saturated at middark (Table 26). This may partly explain why there was
about 50 % higher [^^Ijiodomelatonin binding capacity at ML and during the late light
period than that at the MD period, assuming that the 50% decrease of
[1 ^1] iodomelatonin binding at the MD was due to the saturation of the melatonin
receptors by endogenous melatonin.
It is still unknown whether this receptor saturation can initiate the receptor down-
regulation, and/or receptor desensitization. The hypothesis of receptor down regulation
by endogenous melatonin (Reiter, 1981) is consistent with the diumal rhythms of
biological responses to melatonin during certain periods of the day in hamsters (Tamakin
et aL, 1976),white-footed mice (Glass and Lynch,1982),rats (Reiter et al., 1980) and
sheep (Karsh,1984). In vitro study showed that the concentrations of melatonin need to
decrease the elicited Ca"1"4" influx by hypothalamic synaptosomes fractions of rats
killed in the morning were higher (1 fxmol/1) than that in the late evening (0.01-1 pmol/l)
(Cardinali et al., 1991). It is probable that the decrease of [125I]iodomelatomn binding
during the dark period was the result of receptor down-regulation by endogenous
melatonin levels.
The physiological implication of the density change in [•'•^liodomelatonin binding
sites is still an open question. Weaver et al., (1990) showed that both the melatonin
75
sensitive and non-sensitive mice had the same density of [125I]iodomdatomn binding
sites in brain tissue. Such a condition was found in rats and hamsters which had a
similar number of [125I]iodomelatomn binding sites but different sensitivity to melatonin
(Vanecek and Jansky, 1989). These findings suggest that increased sensitivity to
melatonin in animals is probably due to a difference in a post-receptor mechanism
(second messenger transduction system) rather than to a difference in the density or
location of the receptors (Vanecek and Jansky, 1989). Measurement of the cellular
effects of melatonin receptors is required before definite conclusions can be drawn.
A similar change in high affinity [•'•^]iodomelatonin binding density was reported
in pars tuberalis/median eminence of ram (Pelletier et aL, 1990). When the animal was
exposed to light throughout the night prior to slaughter there was a significant increase in
the apparent number of [^^1]iodomelatonin binding sites in comparison to animals
maintained under darkness, while the Kd values were similar in both groups (Pelletier et
al., 1990). The authors suggested that the number of binding sites was light-dependent.
An opposite variation was reported by (Laitinen et al., 1989). In the rat suprachiasmatic
nucleus the binding density increased towards the end of the dark period and decreased at
the end of light period. The authors suggested that this rhythm might be due to a shift of
the putative melatonin receptor from a high affinity (40 pmol/) to a low affinity state (50.8
nmol/1) (Laitinen et al., 1989). As this low affinity was in a concentration range outside
the range of [ 12^I]icdomelatonin used in our assays, this lower affinity form could not
be measured in the present study. In order to demonstrate the possible change of the
high affinity (picomolar) to low affinity [^^liodomelatonin binding sites (nanomolar) in
chicken brain at different times in the photoperiod, higher concentrations of the
radioligand would be necessary for further studies.
76
2. EFFECTS OF MELATONIN ADMINISTRATION ON SERUM
MELATONIN LEVELS AND [125I]IODOMELATONIN BINDING
CAPACITIES
Following the administration of exogenous melatonin, serum melatonin levels
increased greatly with the abolition of the diurnal variation. In these animals,
[125I]icxiomelatomn binding capacities decreased 68% during midlight, with no change
during middark (Table 15). This suggests that during midlight the high concentration of
exogenous melatonin could saturate the brain melatonin receptors and reduce the binding
densities.
3 • EFFECTS OF PINEALECTOMY ON SERUM MELATONIN LEVELS
AND [1 2 5I]IODOMELATONIN BINDING IN THE BRAIN
Six weeks following pinealectomy, serum melatonin levels were significantly lower
during the dark period without any significant change during the light period (Table 16).
There was a 523% and 53.8% increase of [^^I]icxiomelatomn binding capacities in the
pinealectomized animal killed at midlight and middark respectively. This could be due to
the removal of the main source of circulating melatonin. The fact that pinealectomy did
not abolish the rhythm of brain [ ^IJiodomelatonin binding sites suggests that the brain
melatonin receptor rhythm is not only dependent on pineal melatonin. The importance of
melatonin secretion from extra-pineal sources such as the retina, Haderian gland, gut
and lacrimal gland (Pang and Allen, 1985) in regulating binding sites in the brain should
also be investigated.
It is speculated from our studies that [^^IJiodomelatonin binding sites in the
chicken brain might have an endogenous rhythm with the peak occurring in the light
77
period and the nadir in the dark period,which is independent of pineal melatonin
secretion. However,the binding capacities are thought to be regulated by endogenous
and exogenous melatonin. The possibility of re-establishment of the [125I]icdomelatomn
binding rhythm a few weeks after pinealectomy needs to be studied.
The hypothesis that the melatonin receptors have an endogenous rhythm correlates
well with studies of diumal variation of the low affinity (60-230 nmol/1)
[125I]Iodomelatonin binding sites in discrete brain areas of hamster (Anis et al., 1989)
and rat (Zisapel et aL, 1988). It has been demonstrated that diurnal variation of low
affinity [^^Hlcxiomelatonin binding sites was unlikely to be merely the consequence of
changes in content of the hormone or of down-regulation by elevated nocturnal melatonin
(Anis et a l , 1989). This speculation is supported by 1). The Kd value of the low affinity
binding sites (Zisapel et al., 1988; Anis et al•,1989) was several hundred folds higher
than the circulatory and brain melatonin concentration (Pang and Brown, 1983); 2). The
distribution of the binding site in the brain of rats (Zisapel et al., 1988) was not parallel to
that of the distribution of endogenous brain melatonin (Pang et al., 1983) nor the brain
uptake of exogenous [^H]melatomn as reported by Anton-Tay (1971); 3). The profile of
24 h rhythms of the Iodomelatonin binding sites in discrete brain areas of the
hamster or the rat was shown to be regionally specific, with different patterns and phases
in the hypothalamus, hippocampus, medulla-pons and midbrain, but no variation in the
parietal cortex throughout a 24 h period (Anis et al” 1989; Zisapel et al” 1988); 4) The
timed daily melatonin injection for four weeks had no effect on the density and diumal
variation of the [^^I]iodomelatonin binding in most of the discrete brain area of the rats
(Zisapel et al.,1991) and hamsters (Anis et al” 1989) despite prolonged duration of
elevated melatonin (the exception being the hippocampus); 5). In young male rats,
pinealectomy did not affect the amplitude or shape of daily variations of
[^^I]iodomelatonin binding in the hypothalamus and hippocampus (Zisapel et al.,

78
1991). A l l these studies demonstrated that the fluctuation of melatonin levels during day
and night or the manipulation of melatonin levels by exogenous melatonin injections and
pinealectomy had no key effect on the melatonin binding- This suggests strongly that the
density of low affinity binding sites have their own endogenous rhythm and are not
related to either the circulatory or brain melatonin levels.
It should be noted that in the experiment conducted by Anis and coworkers (1989)
the dosage of melatonin administrated only raised the semm melatonin concentration to
>8 nmol/1 in the hamster which was far lower than the Kd value of [ iodomelatonin
binding sites in the hamster brain synaptsome preparations (60-230 nmol/1). Under this
condition of melatonin administration, the extent of receptor saturation might not have
changed enough to affect the low affinity binding sites. To demonstrate the effect of
melatonin on the nanomolar affinity site,higher dosages of melatonin administration may
be needed.
The other possible explanation for the diumal variation of low affinity binding sites
may be due to a change in affinity. The diumal variations both in melatonin binding
capacities and apparent affinities in synaptosomal preparations of discrete brain areas of
the hamster (Anis et a l , 1989),and in discrete brain areas of ovariectomized and
oestradiol-treated female rats (Zisapel et al” 1987) have been reported. Anis et al. (1989)
proposed the existence of two types of [^^1]icxiomelatonin binding sites in the hamster
brain: low affinity1 (i.e. Kd value of 230 nmol/1) and 丨high affinity' (i.e. Kd value of 60
nmol/1), with diumal variations in the density of the "low affinity"sites only. Further
insight into the mechanism of diumal variation of melatonin receptor is necessary to
understand the rhythmicity of melatonin actions.
79
C. THE DEVELOPMENT OF [125I]IODOMELATONIN BINDING
SITES IN THE CHICKEN BRAIN
As the degree of biological response from melatonin stimulation can be influenced
by the number and affinity of their receptors along with postreceptor events (Pang et al”
1991; Laitinen et al., 1989; Weaver et al” 1990; Zisapel et al” 1989; Stankov and Reiter,
1990), we studied the characteristics of [125I]iodomelatonin binding sites at the chicken
embryonic stage. To assess further the possible physiological significance of the
melatonin receptor, the developmental pattern and the ontogeny of diumal variation of
[^^Ijiodomelatonin binding sites were also investigated.
1 . CHARACTERISTIC OF [125I]IODOMELATONIN BINDING
SITES IN EMBRYONIC CHICKEN BRAIN
Our studies provide the first detailed characterization of [^^1]iodomelatonin
binding sites in the brain of the chicken during development. Binding of
[^^Ijiodomelatonin to membrane preparations of chicken embryonic brain was
saturable, reversible, specific and of high affinity. At embryonic day 17,the Kd value
obtained by Scatchard analysis was 57.5 土 5.26 pmol/1 (Table 19) which was comparable
to the K d value of 45.1 pmol/1 calculated by the kinetic studies (Figure 18). In addition,
within the range of [^^I]iodomelatonin concentrations used, Scatchard analysis and Hill
plots of saturation data suggest a single class of binding sites in the embryonic chicken
brain (Figure 19). Of all the indoles tested,only melatonin, 6-chloromelatonin, and N-
acetylserotonin showed significant inhibition on the [^^I]iodomelatoniii binding (Table
17). No other indoles showed any significant affinity for these binding sites. Thus, the
binding characteristics of [125I]iodomelatomn in the brain of embryonic day 17 chicken
80
were similar to that of the young chicken. The fact that GTPyS exerts an inhibitory effect
on [125I]iodomelatonin binding at embryonic day 18 indicates that these sites are coupled
to a nucleotide binding protein as early as E 18. These results strongly suggest that
functional melatonin receptors appear early in the embryonic life.
2. T H E EARLY APPEARANCE OF [ 1 2 5 I ] IODOMELATONIN
BINDING SITES IN EMBRYONIC CHICKEN BRAIN
The present results demonstrated clearly the appearance of specific binding of
[125I]iodomelatomn at an early embryonic stage (detectable at embryonic day 10 and with
Kd 46.9 + 15.5 pmol/1 and Bmax 5.89 + 0.52 fmol/mg protein at embryonic day 13,
(Table 19). The data of binding studies were comparable with the development of
chicken pineal gland (Collin et al., 1987), pineal HIOMT (Bernard et al” 1991),NAT
activity,and melatonin production (Binkley and Geller, 1975; Zeman, 1990). In the
chicken pineal, photoreceptor like cells (rudimentary photoreceptor cells) display an
inner segment at embryonic day 10. By day 14,most of cytological characteristics of the
photoreceptor like cell compartments are acquired (Collin et al” 1987). Sympathetic
nerve fibres appear in the pineal gland of the chicken during the final stages of embryonic
development (17 days) (Collin et al.,1987). Bernard et al. (1991) reported that HIOMT
in the chicken pineal first appeared 4 days before hatching and rose linearly until the 7th
day posthatch. Immunocytochemistry reveals a growing number of HIOMT-positive cells
during the period of 2 days before hatching and 15 days posthatch. The NAT activity
was first detectable at embryonic day 14 (Fraser and Wainwright, 1976; Tanabe et al.,
1983) and increased progressively, then rising rapidly after the time of hatching. NAT
activity reached adult levels around the 20th day after hatching (Binkley and Geller,
81
1975; Zeman, 1990). The earliest detectable level of melatonin in the pineal was reported
in 18-days-old chick embryos with concentration of 85 土 8 pg/mg tissue which was
much lower than in adult chickens (Zeman, 1990).
The early appearance of the [125I]iodomelatonin binding sites at E 10 to E 13 in
the chicken brain was also comparable with the [125I]iodomelatomn binding sites in
mammalian and human brains studied by autoradiography (Weaver et al” 1991) or
receptor binding assays ( Weaver et al” 1988; Williams et al.,1991; Vanecek, 1988a;
Carlson et al.,1991; Reppert at al.,1988a; Yuan et al., 1991). In vitro autoradiography
revealed that the earliest appearance of [ -‘- I]iodomelatomn binding sites in pituitary and
paraventricular nucleus of the thalamus were in the fetal rat from day 17 of gestation
(Williams et aL, 1991). The present study showed that the appearance of
j-125jjjocjomejatonjn binding sites in chicken brain was earlier than the melatonin
production in embryonic chicken pineal. These binding sites also appeared earlier than
[^^Ijiodomelatonin binding sites in rats (Williams et al., 1991) and hamster (Carlson et
al.,1991). The physiological significance of the early development of the
[^^I]iodomelatonin binding sites in the chicken brain should be considered
3 . THE DEVELOPMENTAL PATTERN OF [125I]IODOMELATONIN
BINDING SITES IN PERINATAL CHICKEN
The varying patterns of ontogenetic changes in the concentration of hormone and
neurotransmitter receptors among the different species during the perinatal period have
been well demonstrated (See Scaba, 1987). It was our hypothesis that if the melatonin
receptor represents a physiological binding site, then, as has been shown for other
neurotransmitter receptors, it should also display a distinct developmental profile* Our

82
binding studies revealed that major modification in the number of melatonin binding sites
occur during ontogenesis. An overall increase in the number of melatonin receptors was
observed from embryonic day 13 to posthatch day 7. During this period, there was a 14-
fold increase in the [ AZ^I]iodomelatonin binding numbers as expressed per whole brain
(from 56.1 to 779.3 fmol/brain) and about a 2.4-fold increase when expressed per mg
protein (from 5.89 to 14.25 fmol/mg protein) (Table 19).
Species or tissue differences in the pattern of [125I]iodomelatonin binding site
development have been demonstrated. In the rats, the existence of [^^I]iodomelatonin
binding sites in the anterior pituitary was reported in the 21st day of gestation and then
gradually declined to about 10% by the 29th day (Vanecek, 1988a). The decrease in
density of pituitary melatonin receptors correlated closely with the developmental loss of
the melatonin inhibitory effect on pituitary L H release induced by LHRH in neonatal rats
(Martin and Sattler, 1979). It has been suggested that the marked decrease in the number
of the pituitary melatonin receptors might be the cause of the reported developmental loss
of the melatonin inhibitory effect on LHRH-induced L H release from the anterior
pituitary (Vanecek, 1988a).
In Siberian hamsters, melatonin (10 nmol/1) inhibited forskolin-stimulated cAMP
accumulation in median eminence/pars tuberalis (ME/PT) explants 4 days before birth,
but was ineffective in explants collected on the day of birth. Thus,physiological
sensitivity to melatonin appears to be depressed around the day of birth (Weaver et al.,
1987). However, [125I]iodomelatonin binding sites remained constant throughout the
perinatal period (Carlson et al” 1991). This suggested that the alteration of sensitivity to
melatonin resulted from the altered responsiveness of cAMP regulatory system during
the perinatal period (Carlson et al” 1991).
The different patterns of development of [125I]iodomelatonin binding sites were
also demonstrated in different brain areas. In rats, the concentration of melatonin

83
receptors in pituitary gradually decreased while the concentration of melatonin receptors
in median eminence did not change greatly during the course of postnatal development
(Vanecek, 1988a).
4. T H E DEVELOPMENT OF THE DIURNAL RHYTHM OF
[125I]IODOMELATONIN BINDING SITES IN CHICKEN BRAIN
In all animals studied so far,a diurnal rhythm of melatonin secretion has been
shown (Pang, 1985). The diumal variation of [^2^I]icxiomelatomn binding sites has been
reported in the brains of rats (Zisapel et al., 1988; Laudon et al., 1988; Laitinen et al•,
1989),hamsters (Anis et al” 1989) and birds (Yuan et al,1990). The mechanism of the
diumal variation of [ ] iodomelatonin binding site in the nervous system is yet to be
revealed. To assess further the possible physiological significance of the melatonin
receptor, we have examined the ontogeny of diumal variation of [^2^]iodomelatonin
binding sites in the chicken brain. Our results showed that a light-dark difference in
[^^]i(xiomelatomn binding was first recorded in 20-days-old chick brain (Table 20).
The development of a diumal variation of [ ^I]iodomelatonin binding sites in chicken
brain correlates well with the diumal variation of pineal NAT activity and melatonin
content reported elsewhere (Binkley and Geller, 1975; Zeman, 1990). During embryonic
development of the chicken, a significant light-dark difference of N-acetyltransferase
(NAT) activity in chicks was observed by the second day after hatching and increased to
a maximum amplitude of over 20-fbId after posthatch day 15 up to adult (Binkley and
Geller, 1975). A significant light-dark difference in pineal melatonin content was
recorded only 10 days posthatching, with an increase in dark-time melatonin content
(Binkley and Geller, 1975).
84
The profile of [^iodomelatonin binding sites during development showed
that there was a tendency toward a reduction in [^^I]iodomelatomii binding sites with
aging (Table 19),this being associated with a diminishing of the difference of light-dark
binding in adult chicken brain (Table 20). The age-associated reduction in pineal and/or
serum melatonin levels in rats (Pang et al., 1984; Reiter et al” 1981) and hamsters (Pang
and Tang, 1983) have already been demonstrated. Zisapel et aL (1989) reported age-
related decrease in melatonin receptor densities in discrete rat brain areas. The age-
associated decreases of both serum melatonin and brain [^^]iodomelatonin binding
sites might have significant effects on the animals.
5 . THE SIGNIFICANCE OF [125I]IODOMELATONIN BINDING
SITES IN EMBRYONIC CHICKEN BRAIN
The functional significance of [125I]iodomelatonin binding sites in chicken brain
has been well studied (see Discussion A-3)). The functional significance of
I* 125j]iodomelatonin in the early stage of development needs to be demonstrated.
However,the similarity of [^^Ijiodomelatonin binding characteristics between the
embryo and young chicken and the similarity between the developmental pattern of
[•'•^IJiodomelatomii binding sites and that of the pineal NAT activity and melatonin
content suggest that the [^^^I]iodomelatonin binding sites in the early stage of
development may have physiological significance. Putative melatonin receptors in the
early stage of development was also demonstrated in hamster brains by the high binding
affinity and the existence of a functional receptor-G-protein-cffector pathway as early as 4
days before birth (Carlson et aL, 1991).
A major difference between melatonin production in chicken embryo and
mammals is that in avian embryos, the maternal melatonin effects are excluded.
85
In rats, no pineal melatonin is produced during the fetal stage. Rhythmic melatonin
production in the pup appears only two weeks after birth (Tang and Pang, 1984). A
large body of evidence exists which reports that in mammals there is a maternal-fetal
communication of circadian phase (Reppert et al., 1988b). The maternal transfer of
circadian rhythmicity and photoperiodic infoimation to the fetus and pup has been clearly
demonstrated in several species (see review of Reppert et al, 1988b). Perhaps the
melatonin receptor during the mammalian fetal development is necessary to accept the
maternal melatonin signal.
The early appearance of melatonin and melatonin synthesis enzyme in chicken
embiyos at E 14 to E 18 (Zeman, 1990), and [ ]iodomelatonin binding sites at E 10 to
E 13 showed that the expression of the binding sites in the chicken embryonic brain was
earlier than that reported in brains of hamsters (Carlson et al.,1991), and rats (Williams
et al., 1991). The appearance of iodomelatonin binding sites at E 10 to E 13 also
preceded that of NAT activity and pineal melatonin which were detected at embryonic day
14 and 18 respectively (Zeman, 1990), suggesting that the development of melatonin
receptor is earlier than that of the hormone. Further study of the melatonin receptor
functions and the possible effects of melatonin imprinting on its receptors during the early
embryonic stages is needed.
D. BINDING CHARACTERISTICS, PHARMACOLOGICAL PROFILE
AND DEVELOPMENT OF [125I]IODOMELATONIN BINDING SITES IN
THE CHICKEN RETINA
The precursors and synthesizing enzymes in the melatonin biosynthetic pathway
have been demonstrated in the retina of vertebrates, hence substantiating the postulation

86
that melatonin may be synthesized in situ (Wiechmann, 1986; Wiechmann et al., 1988).
In birds and mamnials, retinal melatonin may function as a paracrine secretion and
regulate photomechanical changes, disk shedding of the photoreceptor, retinal dopamine
release, and intraocular pressure (see review of Pang and Allen, 1986). In some lower
vertebrates, in addition to the paracrine action, retinal melatonin may also be released into
the circulation and be responsible for endocrine functions (Pang et al., 1989). The
melatonin effects mentioned above suggest that the retina, whilst a site for melatonin
synthesis and release, is also a target organ for melatonin. The presence of melatonin
receptors in the retina has been speculated by the pharmacological study of Dubocovich
(1985). Picomolar concentrations of melatonin were shown to selectively inhibit Ca++
dependent release of dopamine from rabbit and chicken retina in vitro through the
activation of a site possessing functional and pharmacological characteristics of a receptor
for the indole (Dubocovich,1983). Melatonin receptors (labelled by [3H]melatonin) have
been reported in the retinal tissue of trout (Gern et al” 1981) and frog (Wiechmann,
1986). Up until now, the melatonin binding sites labelled by [^^I]iodomelatonin in
retinal tissue have only been reported in chick (Dubocovich, 1987; Laitinen and
Saavedra, 1990a),rabbit (Blazynski et al., 1989) and tree shrew (Lu et al.,1991). In the
present study, we identified the binding characteristics of [^%]icxiomelatomn binding
sites in the chicken retina. The diurnal variation of the binding capacity and the
development of [ ^Ijiodomelatonin binding sites from embiyonic 10 day to posthatch 4
weeks were also studied.
1 • CHARACTERISTICS OF [12SI]IODOMELATONIN BINDING
SITES IN CHICK EMBRYO AND CHICK RETINA
87
The [l Sfjjodomelatonin binding characteristics both in embryo and young chick
are comparable. The results showed that the specific binding of [125I]iodomelatomn to
both the embryo and young chick retinal membrane preparations belonged to an identical
binding site and satisfied all the criteria for a hormone binding site: i.e. it was saturable,
reversible, specific and of high affinity. Both in the embryo and young chick, the
linearity of the Scatchard plot and Hill coefficient suggest that [^^Jicxiomelatomn binds
to a single class of sites under the present experimental conditions (Figure 26 and 28).
Kinetic studies showed that they had a similar time course of association and dissociation
of the binding (Figure 25 and 27),The pharmacological affinity of [ ^Ijiodomelatonin
binding sites in chicken retina (both embryo and young chicken) was in a similar order to
that of chicken brain: melatonin > 6-chloromelatomn > N-acetylserotonin (Table 22).
The [^^Ijiodomelatonin binding affinity of the chick retina in the present study
(with Kd value of 366.5 土 96.5 Pmol/1) was consistent with that reported by Dubocovich
et al. (1987) (Table 27) The binding parameters from kinetic and competitive studies are
comparable to those reported by Dubocovich and Takahashi (1987).
Our results suggest that the chicken brain and retina [ I]iodomelatonin binding
sites belong to the same class of high affinity binding sites (ML-1 receptor, Dubocovich,
1988a). In addition, we demonstrated that binding sites in the brain and retina of
embryonic and young chicks showed similar binding association and dissociation
processes and the same order of pharmacological profile: melatonin > 6-chloronielatonin
> N-acetylserotonin. The main difference between the [125I]iodomelatonin binding
characteristics in the chick retina and brain was the binding affinity. The Kd value in
young chicken retina (350-450 pmol/1) reported by Dubocovich and Takahashi (1987)
and the present study (Table 27) was slightly higher than the Kd values in the chicken
brain (about 50-80 pmol/1) in the present study and other high affinity binding sites
reported including the brain of lizard (Rivkees et al” 1989a) and chicken (Rivkees et al”
88
1989b), the pars tuberalis of sheep (Morgan et al” 1989) and suprachiasmatic nuclei of
rat (Laitinen et al.,1990b). Whether these discrepancies reflect differences in
methodology or in receptor characteristics has not been addressed. In the present study,
the high Kd value obtained from the chicken retina could be partly explained by the
higher non-specific binding which was caused by the presence of the pigment epithelium
in the retina membrane preparations. Using in vitro autoradiographic techniques, Laitinen
and Saavedra (1990a) demonstrated two bands of radioactivity in 2-day-chick eyeball
section, one restricted to the retina (inner plexiform layer) with a single class of high
affinity binding site (Kd 19.8 pmol/1) and the other to the pigment epithelium. The retina
(inner plexiform layer) binding was displaceable with an excess of unlabelled melatonin
while binding to the pigment epithelium was not. The authors suggested that the binding
of [^I]iodomelatomn to the pigment epithelium was nonsaturable and with low affinity
(Laitinen and Saavedra, 1990a). It has been demonstrated that melanin bind non-
specifically to several small molecules in the pigment epithelium, e.g. the benzazapines
(Aqui et al.,1987). It is probable that there was high nonspecific binding to the pigment
epithelium which resulted in high binding capacity and low affinity.
2 . THE DEVELOPMENT OF THE [ 1 2 5 I ] IODOMEL ATONIN
BINDING SITES IN CHICKEN RETINA
Detectable [125I]iodomelatonin binding first appeared at embryonic day 10.
Specific binding increased quickly during the embryonic stage and thereafter gradually
throughout all the perinatal period (Table 24). The time sequence and developmental
pattern of [^^1]iodomelatonin binding sites in chicken retina was similar to that in the
brain. The development of [ ^^I]iodonielatoniii binding sites in chicken retina was

89
consistent with the ontogenic development of chicken retina NAT activity and melatonin
synthesis (luvone, 1990). During embryonic development, daytime NAT activity was
consistently detectable by embryonic day 6 when most retinal photoreceptor and neuron
precursors were postmitotic, and primitive photoreceptors were first observed (Gnm,
1982). NAT activity began to increase progressively on E 17,reaching a maximum
daytime value on E 20 and a maximum light time value on posthatch day 6 (luvone,
1990).
3 . THE DIURNAL VARIATION OF [ 1 2 5 I ] I O D O M E L A T O N I N
BINDING SITES IN CHICKEN RETINA
In the present study, the diumal variation of [ ^1] iodomelatonin binding sites in 4-
week-old chick retinal membrane preparations was determined. The binding density
during the light period was significantly higher than during the night time. There were no
significant changes in the Kd values (Table 23). Comparison with the binding amplitude
of the diumal variation in chick brain,showed a light time increase of [^^Ijiodomelatonin
in the chick retina of 47% which was in the same order of that in chick brains. The
developmental diumal variation of chick retina NAT activity was studied by luvone
(1990). During embryonic development, significant light-dark differences of retina NAT
activity were first observed on embryo day 20,and increased to 迁 maximum amplitude of
six-fold by posthatch day 3. Circadian rhythmicity of NAT activity appeared to develop at
or prior to hatching (luvone, 1990). In a two point investigation, Reppert and Sagar
(1983) studied the developmental pattern of the day:night melatonin variation in the
chicken retinal from 16 days of embryo to adulthood. A significantly higher retinal
melatonin level in the dark period was first detected in the 19-day-old embryo. Retinal

90
melatonin contents at mid-dark increased with age until adulthood. Whether the light-dark
binding difference represents a similar mechanism of the receptor saturation by
endogenous melatonin and/or down-regulation needs to be studied.
91
V. REFERENCES
Anis Y, N i r I,Zisapel N. (1989). Diumal variations in melatonin binding sites in the hamster
brain: impact of melatonin. Molecular and Cellular Endocrinology. 67: 121-129.
Anton-Tay F . (1971). Pineal brain relationship. In: The pineal gland. Eds. Wolstenholme
GEM,and Knight J. Churchill Livingston. Edinburgh London pp 213-227.
Anton-Tay F, Wurtman RT. (1969). Regional uptake of 3H-melatomn from blood or
cerebrospinal fluid by rat brain. Nature 221:474-475.
Aqui T, B r y a n t G,Kebabian JW, Larson S, Saavedra JM, Shigematsu K, Yamamoto T,
Yokoyama K. (1987). [^^I]icxiinated benzazepines bind to melanin: implications for the
noninversive localization of pigment melanomas. NucL Med Biol. 14: 133-141.
Ayre EA, Y u a n H,Pang SF. (1992). The identification of 125I-labelled icxiomelatonin binding
sites i n t h e testes and ovaries of the chicken {Gallus domesticus). J. Endocrinol. 133: S
11.
Axelrod J . (1974). The pineal gland: a neurochemical transducer. Science 184: 134-138
Barsano C P , Baumann G. (1989). Editorial: simple algebraic and graphic methods for the
apportionment of hormone (and receptor) into bound and free fractions in binding
equilibria; or how to calculate bound and free hormone? Endocrinol. 124: 1101-1106.
Bernard M,Voisin P,Guerlotte J,Collin JR (1991). Molecular and cellular aspects of
hydroxyindole-O-methyltransferase expression in the developing chick pineal gland.
Developmental Brain Res. 59: 75-8L
Berridge M,Irvine RF. (1984). Inositol triphosphate, a novel second messenger in cellular
signal transduction. Nature 312:315-21.
Berridge M . (1985). The molecular basis of communication within the cell. Sci. Am. 253:142-
152
92
Binkley S,Geller EB. (1975). Pineal enzymes in chickens: development of daily rhythmicity.
Gen. Comp. Endocrinol 27: 424-429.
Binkley S,Reibman J, Reilly K. (1978b). Pineal N-acetyltransferase activity: a rhythm in
vitro. Science 202: 1198-1201.
Binkley S,Riebman JB, Reilly K. (1978a). Regulation of pineal rhythms in chickens:
inhibition of dark-time N-actyltransferase activity. Comp. Biochem. Physiol 59: 165471.
Binkley S. (1981). Pineal biochemistry: comparative aspects and circadian rhythm, In: The
pineal gland, Vol 1. Ed Reiter RJ, CRC Press, Boca Raton pp 155-172.
Binkley S,Muller G,Hernandez T. (1981) Circadian rhythm in pineal N-acetyltransferase
activity: phase shifting by light pulses. J Neurochem 37: 798-800.
Bimbaumer L, Lcxiina J,Matteva R,Cerione RA, Hildebrandt JD, Iyengar R. (1985).
Regulation of hormone receptors and adenylyl cyclases by guanine nucleotide binding N
protein. Recent Progress In Hormone Research. 41: 41-99.
Blazynski C,Beaty CA, Chung KC,Jones ZJ, Woods C,Dubocovich ML. (1989).
Localization of 2-[^^I]iodomelatonin binding sites in mammalian retina. In: 19th Annual
Meeting of the Society for Neuroscience. Phoenix, AZ pl395.
Brown GM,Seggie J,Grota LJ. (1985). Serum melatonin response to melatonin
administration in the Syrian hamster. Endocrinology 41: 31-35.
Cardinali DP, Vacas MI,Boyer EE. (1978). High affinity binding of melatonin in bovine
medial basal hypothalamus. IRCS Med Sci 6: 357-362.
Cardinali DP, Vacas MI,Boyer EE. (1979). Specific binding of melatonin in bovine brain.
Endocrinology 105: 437-441.
Cardinali DP. (1981). Melatonin, a mammalian pineal hormone. Endocr Rev. 2: 327-346.
Cardinali DP, Rosenstein R,Golombek DA, Chuluyan HE,Kanterewicz,Vacas M. (1991).
Melatonin binding sites in brain: single or multiple? In: Advances in Pineal Res. Vol. 5.
Eds. Pevet JAP, and Reiter RJ. John Libbey and Co. LdL London, pp 159-166.

93
Carlson LL,Weaver DR,Reppert SM. (1989). Melatonin signal transduction in hamster
brain: inhibition of adenylyl cyclase by a pertussis toxin-sensitive G protein.
Endocrinology. 125(5): 2670-6.
Carlson LL,Weaver DR, Reppert SM. (1991). Melatonin receptors and signal transduction
during development in Siberian hamsters (Phodopus sungorus). Developmental Brain
Res. 59: 83-88.
Caron MG, Jefkowitz L. (1976). Solubilization and characterization of the p-adrenergic
receptor binding sites of frog erythrocytes. J. Biol Chem. 251: 2374-2384.
Cassone VM, Lane RF, Menaker M. (1983). Daily rhythms of serotonin metabolism in the
medial hypothalamus of the chicken: effects of pinealectomy and exogenous melatonin.
Brain Res. 289: 129-134.
Cassone VM. (1990). Effects of melatonin on vertebrate circadian systems. Trends in
Neurosci. 13 (11): 457-464.
Caston S,Menaker M. (1968). Pineal function: the biological clock in the sparrow? Science
160: 1125-1127.
Clabough JW. (1973). Cytological aspects of pineal development in rats and hamsters. Am. J.
Anat 137: 215-221
Collin JR (1971). Differentiation and regression of the cells of the sensory line in the
epiphysis cerebri. In: The pineal gland. Eds. Wolstenholme GEW, and Kinight J.
Churchill Livingstone, Edinburgh London PP 79-120.
Collin JP. (1979). Recent advances in pineal cytochemistry. Evidence of the production of
indoleamines and proteinaceous substances by rudimentary photoreceptor cells and
pinealocytes of amniota. Prog. Brain Res. 52: 271-296.
Collin JP,Oksche A. (1981). Structure and functional relationship in the nonmammalian pineal
gland. In: The pineal gland Vol L Anatomy and biochemistry. Ed. Reiter RJ.CRC
Press, Inc.pp 27-68.

94
Collin JP, Voisin P,Falcon J,Brisson P. (1987). Evolution and environmental control of
secretory processes in pineal transducers. In: Functional morphology of neuroendocrine
systems: evolutionary and environmental aspects. Eds. Scharrer B,Korf HW,Hartwig
HG. Berlin: Springer pp 105-122.
Deguchi T. (1981). Rhodopsin-1 ike photosensitivity of the isolated chicken pineal gland.
Nature 290. 706.
Deguchi T. (1979). A circadian oscillator in cultured cells of chicken pineal gland. Nature 282,
94-96.
Dodt E,Heerd E. (1962). Mode of action of pineal nerve fibers in frogs. J Neurophysiol. 25:
405-429.
Dodt E. (1987). Light sensitivity of the pineal organ in poikilothermic and homeothermic
vertebrates. In: Functional morphology of neuroendocrine systems: evolutionary and
environmental aspects. Ed: Scharrer B, Korf HW, Hartwig HG. Berlin: Springer pp 123-
132.
Dohlman HG, Caron MG,Lefkowitz RJ. (1987). A family of receptors coupled to guanine
nucleotide regulatory protein. Biochemistry 26: 2657-2664.
Dubocovich ML. (1983). Melatonin is a potent modulator of dopamine release in the retina.
Nature 306: 782-784.
Dubocovich ML. (1985). Characterization of a retinal melatonin receptors. J. Pharmacol Exp.
Then 234:395-401.
Dubocovich ML,Takahashi JS. (1987), Use of 2-[125I]iodomelatonin to characterize
melatonin binding sites in chicken retina Proc. Natl. Acad. Sci. USA. 84: 3916-3920
Dubocovich ML. (1988a). Pharmacology and function of melatonin receptors. FASEB J. 2:
2765-2773.
Dubocovich ML. (1988b) Luzindole (N-0774 ): a novel melatonin receptor antagonist. J.
Pharmacology Experimental Therap. 246: 902-910.

95
Dubocovich ML , Shankar G,Nickle M. (1989). 2-[125I]iodomelatonin labels sites with
identical pharmacological characteristics in chicken brain and chicken retina. Eur. J.
Pharmacol. 162: 289-299.
Dubocovich ML,Siuciak JA,Krause DN. (1990). Localization of high affinity melatonin
receptor sites in chicken brain: effect of temperature and guanine nucleotide. Eur. J.
Pharmacol. 183: 2180.
Dubocovich ML. (1990). Structure-activity relationship: pharmacology and function of
melatonin receptors. In: Trends in Drug Research Vol 13. Ed. Claassen V. Elsevier-North
Holland,Amsterdam pp. 23-35.
Duncan MJ,Takahashi JS, Dubocovich ML. (1989). Characteristics and autoradiographic
localization of 2- [ ^^1]iodomelatonin binding sites in Djugarian hamster brain.
Endocrinology. 125: 1011-1018
Duncan MJ, Takahashi JS,Dubocovich ML. (1988). 2-[^^I]Melatonin binding sites in
hamster brain membranes: Pharmacological characteristics and regional distribution.
Endocrinology 122: 182S1833.
Duncan MJ, Fang JM,Dubocovich ML- (1990). Effects of melatonin agonists and antagonists
on reproduction and body weight in the Siberian hamster. J. Pineal Res. 9: 231-242.
Fang JM,Dubocovich ML. (1990). Activation of melatonin receptor sites retarded the
depletion of norepinephrine following inhibition of synthesis in the C3H/HeN mouse
hypothalamus. J. Neurochemistry 55: 76-82
Fang JM, Dubocovich ML. (1988). Activation of melatonin receptor sites regulates
noradrenergic activity in the hypothalamus of C3H/HeN mouse. FASEB J, A1802
Fang JM, Siuciak JA,Krause DN, Dubocovich ML. (1990). Localization and phannacological
characterization of melatonin binding sites in C3H/Hen and C57B1/6J mice.
Pharmacologist 32: 144
96
Flight WFG. (1979). Morphological and functional comparison between the retina and the
pineal organ of lower vertebrates. In: Progress In Brain Research Vol 52. The pineal gland
of vertebrates including man. Eds. Kappers JP,Pevet P. North-Holland/Elsevier, pp:
111-139.
Fraser IH, Wainwright SD. (1976). The influence of lighting condition upon the level and
cause of increase in specific activity of serotonin-N-acetyltransferase in the developing
chick pineal gland. Can. J. Biochem. 54: 103-109.
Fraschini F,Mess B,Piva F, Martini L. (1968a). Brain receptors sensitive to indole
compounds: function in control of luteinizing hormone secretion. Science. 159: 1104-
1105.
Fraschini F, Mess B,Martini L. (1968b). Pineal gland, melatonin and the control of
luteinizing hormone, secretion. Endocrinology 82: 919—924
Gem WA,Gorell TA, Owens DW. (1981). Melatonin and pigment cell rhythmicity. In:
Melatonin- current status and perspectives: advances in the biosciences. Eds. Birau N, and
Schloot W. Vol 29. Oxford, Pergamon, pp: 95-115
Oilman AG. (1987). G proteins: transducers of receptor-generated signals. Ann Rev Biochem.
56: 615-49.
Glass JD,Lynch GR. (1982). Diumal rhythm of response to chronic introhypothalamic
melatonin injections in the white-footed mouse. Neuroendocrinology 35: 117-122
Grun (1982). The development of the vertebrate retina: a comparative survey. Adv. Anat.
Embryol Cell Biol 1982.78: 1-83.
Heward CB, Hankey ME. (1975). Structure-activity relationship of melatonin and related
indoleamines. Life Sci 17: 1167-1178.
luvone PM. (1990). Development of melatonin synthesis in chicken retina: regulation of
serotonin N-acetyltransferase activity by light, circadian oscillators, and cyclic AMP. J
Neurochemistry. 54: 1562-1568.

97
Karsch FJ,Bittman EL, Foster DL, Goodman RL,Legan SJ, Robinson JE. (1984).
Neuroendocrine basis of seasonal reproduction. Rec. Prog. Horm. Res. 40: 185-232.
Kasal CA,Menaker M, Perez-polo JR. (1979). Circadian clock in culture: N-acetyltransferase
activity of chicken pineal glands oscillates in vitro. Science 203: 656-658.
Kasal CA,Perez-polo JR. (1980) In vitro evidence of photoreception in the chick pineal gland
and its interaction with the circadian clock controlling N-acetyltransferase (NAT). J
Neurosci Res. 5: 579-585.
Kopp N,Claustrat B, Tappa ZM. (1980). Evidence for the presence of melatonin in the
human brain . Neurosci Lett. 19: 237-242.
Koslow SH,Green AR. (1973). Analysis of pineal and brain indole alkylamines by gas
chromatography and mass spectrometry. Adv, Biochem. Psychopharmacol. 7: 33-93.
Krause DN, Dubocovich ML. (1991). Melatonin receptors. Annu. Rev. Pharmacol. Toxicol.
31: 549-68.
Laitinen JT, Castren E, Vakkuri O, Saavedra JM. (1989). Diumal rhythm of melatonin binding
in the rat suprachiasmatic nucleus. Endocrinology 124: 15857.
Laitinen JT, Saavedra JM. (1990a). The chick retinal melatonin receptor revisited: localization
and modulation of agonist binding with guanine nucleotide. Brain Res. 528: 349-352.
Laitinen JT, Flugge G, Saavedra JM. (1990). Characterization of melatonin receptors in the rat
area postrema: modulation of affinity with cations and guanine nucleotide.
Neuroendocrinology. 51: 619-624.
Laitinen JT, Saavedra JM. (1990b). Characterization of melatonin receptors in the rat
suprachiasmatic nuclei: modulation of affinity with cations and guanine nucleotide.
Endocrinol. 126: 2110-2115. • 19S
Laudon M, Zisapel N. (1986). Characterization of central melatonin receptors using I-
melatonin. FEBS Letters 197: 9-12.
98
Laudon M, Yaron Z, Zisapel N. (1988b). N-(3,Sdinitrophenyl)-5-methoxytiyptamine9 这 novel
melatonin antagonist: effects on sexual maturation of the male and female rat and on
oestrous cycles of the female rat. J. Endocrinol. 116: 43-53.
Laudon M,Nir I,Zisapel N. (1988a). Melatonin receptors in discrete brain areas of the male
rat. impact of aging on density and on circadian rhythmicity. Neuroendocrinology 48:
577-583.
Lee PN, Pang SF. (1992). Identification and characterization of melatonin binding sites in the
gastrointestinal tract of ducks. Life Sci. 50: 117-125.
Lemer AB, Case JD, Takahashi Y,Lee TH, Mori W. (1958). Isolation of melatonin, the pineal
gland factor that lightens melanocytes. J. Am. Chem. Soc. 80: 2857-2858.
Lemer AB,Case JD, Heinzelman RV. (1959). Structure of melatonin J. Am. Chem. Soc. 81:
6084-6087.
Leslie FM. (1987). Methods used for the study of opioid receptors. Pharmacol Rev. 3: 197-
249.
Lowry O,Rossebrough N, Fan N, Randall R. (1951). Protein measurement with the Folin
phenol reagent. J. Biological Chemistry 193: 265-275.
Lu Y, Yuan H,Pang SF. (1991). Retinal [125I]iodomelatonin binding sites in the tree shrew
(Tupaiidae). Neuroscienc Lett. 130: 149-152.
Lynch GR,Epstein AL. (1977). Melatonin induced changes in gonad, pelage and thermogenic
characters in the white-footed mouse, Permycus leuopus. Comp. Biochem. Physiol. 53C:
67-68.
Martin JE,Sattler C. (1979). Developmental loss of the acute inhibitory effect of melatonin on
the in vitro pituitary luteinizing hormone and follicle-stimulating hormone responses to
luteinizing hormone-releasing hormone. Endocrinology 105:1007-1012.
Meissi H. (1986). Photoneurophysiology of pinealocytes. In: Pineal and retinal relationships.
Eds. O'Brien PJ, and klein DC. New York. Academic Press pp: 33-45.
99
Miles H. (1988). Receptor autoradiography: optimizing anatomical resolution. In: Receptor
localization ligand autoradiography. Eds. Leslie FM, and Altar CA. New York,Alan R.
Liss,Inc., pp37-48
Moore RY. (1987). Neural control of pineal function in mammals and birds J Neural Transm.
SuppL 13,47
Morgan PJ,Lawson W Davidson G, Howell HE. (1989). Guanine nucleotide regulate the
affinity of melatonin receptors on the ovine pars tuberalis. Neuroendocrinology. 50: 359-
362.
Morgan PJ. (1991). Molecular signalling via the melatonin receptor. In: Advances in pineal
research: 5. Ed. Arendt J and Pevet P. John Libbey and Co. Ltd. London pp 191-197.
Morita Y. (1966). Absence of electrical activity of the pigeon's pineal organ in response to
light Experimentia 22: 402
Niles LP, Wong YW, Mishra RK and Brown GM. (1979). Melatonin receptors in brain. Eur.
J. Pharmacol. 55: 219-220
Niles LP,Brown GM, Mishra RK. (1983). Effects of blinding and pinealectomy on regional
brain monoamine concentration. J. Neurosci. Res. 10: 53-60.
Niles LP. (1984). Effects of melatonin on adenylate cyclase activity in rat brain. Pineal and
Retina Abv. Biosci. 53: 283-287.
Niles LP,Pickering DS,Sayer BG. (1987). HPLC purified 2-[125I]iodomelatonin labels
multiple binding sites in hamster brain. Biochemical and Biophysical Research
Communications 147: 949-956.
Niles LP,Hashemi FS, Mason BJ. (1988). GTP modulates melatonin binding and its effects
on adenylate cyclase in hamster brain. 18th Annual Meeting of the Society for
Neuroscience, Toronto, Ontario, Canada p 105.
100
Niles LP,Ye M,Pickering DS, Ying SW. (1991). Pertuss toxin blocks melatonin-induced
inhibition of forsklin-stimulated adenylate cyclase activity in the chick brain. Biochem.
Biophys. Res. Comm. 178: 786-92
Nordio M, Vaughan MK,Zisapel N, Migliaccio S, van Jaarsveld A,Reiter RJ. (1989). A
novel melatonin antagonist, N-(2,4-dinitrophenyl)-S methoxytryptamine neutralizes some
effects of melatonin in the female Syrian hamster. Proc. Soc. Exp. Biol. Med. 191: 321-
325.
Oksche A. (1971). Sensory and glandular elements of the pineal organ. In: The pineal gland.
Ed. Wolstenholme GEW, Knight J. Churchill Livingstone. Edinburgh and London PP:
127-146.
Oksche A. (1983). Aspects of evolution of the pineal organ. In: The pineal gland and its
endocrine role. Ed. Axelrod J, Fraschini F,Velo GR New York: Plenum, pp 15-35.
Oksche A. (1986). Historical perspectives of photoneuroendocrine systems. In: Pineal and
retinal relationships. Eds. Brien PJ, and Klein DC. New York. Academic Press pp 1-14.
Oskche A,Korf HW, Rodriguez EM. (1987). Pinealocytes as photoneuroendocrine units of
neuronal origin: concepts and evidence. In: Advances in pineal research 2. Eds: Reiter RJ,
and Fraschini R John Libbey and Co Ltd. London pp 1-18.
Pang SF. (1974). Evidence for a central effect of pineal melatonin in the chicken. Callus
demesticuc. University of Pittsburgh, Ph D. Thesis
Pang SF,Ralph CL,Reilly DP. (1974). Melatonin in the chicken brain: its origin, diumal
variation, and regional distribution. General Comparative Endocrinology 22: 499-506.
Pang SF, Tang PL,Yu HS, Yip MK. (1982). The level of N-acetylserotonin and melatonin in
the brain of male rats: diumal variations and effects of pinealectomy. J. Exp. Zool. 219:
271-276.
Pang SF, Tang PL. (1983). Decreased serum and pineal concentration of melatonin and N-
acetyiserotonin in aged male hamsters. Hormone. Res. 17: 228-234

101
Pang SF, Brown GM. (1983). Regional concentrations of melatonin in the rat brain in the
light and dark period Life Sciences 33: 1199-1204.
Pang SF, Chow PH, Wong TM,Tso ECT. (1983). Diumal variations of melatonin and N—
acetylserotonin in the tissues of quails (Coturnix sp.), pigeons ( Columba livid), and
chickens {Gallus domesticus). General and Comparative Endocrinology 51: 1-7.
Pang SF, Tang F,Tang PL. (1984). Negative correlation of age and the levels of pineal
melatonin, pineal N-acetylserotonin, and serum melatonin in male rats J. Exp. Zool. 229:
41-47.
Pang SF. (1985) Melatonin concentration in blood and pineal gland. Pineal Res. Rev. 3: 115-
159.
Pang SF,Allen AE. (1986). Extra-pineal melatonin in the retina: its regulation and
physiological function. Pineal Res. Rev. 4: 55-96.
Pang SF, Woo NYS. (1987). Evidence for a photoneuroendocrine role for the retina of marine
fish. Neurosci. Letter. Suppl 28 S14.
Pang SF, Liu L,Lee PPN, Allen AE,Woo NTS. (1989). The concept of direct sensori-
hormonal transduction and melatonin secreting cells In: Advances in Pineal Res. Vol 3.
Eds. Reiter RJ, and Pang SR John Libbey, London pp 67-76.
Pang SF, Yuan H, Wang XL, Chan YS,Lee PPN. (1990). Melatonin and melatonin receptors
in the brain In: Advances in Pineal Research Vol. 4 Eds. Reiter RJ- John Libbey, London,
pp 129-136
Pang SF, Yuan H, Yu ZH, Wang XL, Tang PL, Yau M. (1991) Melatonin binding sites in the
nervous and immune systems. In: Role of melatonin and pineal peptides in
Neuroimmunomodulation. Eds. F. Fraschini F, and Reiter RJ. Plenum, New York, pp
107-116.
Pelham R W, Ralph CL, Campbell LM. (1972). Mass spectral identification of melatonin m
blood Biochem. Biophys. Res. Commun. 46: 1236-1241.
102
Pelletier J,Castro B,Roblot G, Wylde R,Reviers MMD. (1990). Characterization of
melatonin receptors in the ram pars tuberalis: influence of light. Acta Endocrinol. 123:
557-562.
Pfaffinger PJ, Martin JM,Hunter DD,Nathanson NM, Hille B, (1985). GTP-Binding
proteins couple cardiac muscarinic receptors to a K + channel. Nature 317: 536-38.
Pickering DS, Niles LP. (1989). 2-[^^^1]icxiomelatonin binding sites in hamster and chick
exhibit differential sensitivity to prazosin. J. Pharmacy Pharm. 41: 356-357.
Preslock JP. (1977). Gonadal steriod regulation of pineal melatonin synthesis. Life Sci. 20:
1299-1304.
Quay WB. (1986). Specificity and structure activity relationship in the Xenopus larval
melanophore assay for melatonin. Gen. Comp. Endocrinol. 11: 253-254
Ralph CL,Binckly S, Macbride SE,Klein DC. (1975). Regulation of pineal rhythms in
chickens: effects of blinding, constant light,constant darkness, and superior cervical
ganglionectomy. Endocrinology 97: 1373-1378.
Reiter RJ. (1981). The melatonin message: duration versus coincidence hypotheses. Life
Sciences. 40:2119-2131.
Reiter RJ, Petterborg LJ, Trakulrungsi C,Trakulrungsi WK. (1980). Surgical removal of the
olfactory bulbs increases sensitivity of the reproductive system of female rats to the
inhibitory effects of late afternoon melatonin injection. J. Experimental Zoology 212: 47-
52.
Reiter RJ, Craft CM,Johnson JE, King TS, Richardson BA,Vaughan GM, Vaughan MK.
(1981). Age-associated reduction in nocturnal pineal melatonin levels in female rats.
Endocrinology. 109: 1295-1297.
Reppert SM, Weaver DR, Rivkees SA,Stopa EG. (1988b). Maternal communication of
circadian phase to the developing mammal. Psychoneuroendcxjrinology. 13: 63-78.
103
Reppert SM, Weaver DR,Rivkees SA,Stopa EG. (1988a). Putative melatonin receptor in a
human biological dock. Science 242: 78-81.
Reppert SM, Sagar SM. (1983). Characterization of the day-night variation of retinal melatonin
content in the chick. Invest Ophthalmol. Vis. Sci. 24: 294-300.
Richardson SB,Hollander CS,Prasad JA,Hirooka Y. (1981). Somatostatin release from rat
hypothalamus in vitro: effects of melatonin and serotonin. Endocrinology 109: 602-606.
Rivkees SA,Carlson LL,Reppert SM. (1989a). Guanine nucleotide-binding protein
regulation of melatonin receptors in lizard brain. Proc. Natl. Acad. Sci. USA. 86:3882-
3886.
Rivkees SA, Cassone VM,Weaver DR,Reppert SM. (1989b). Melatonin receptors in chick
brain: characterization and localization. Endocrinology 125:363-368.
Rosenstein RE, Cardinali DP. (1986). Melatonin increases in vivo GABA accumulation in rat
hypothalamus, cerebellum, cerebral cortex and pineal gland. Brain Res. 398:403-406.
Sallanon M,Claustrat B,Touret M. (1982). Present of Melatonin in various cat brain stem
nuclei determined by radioimmunoassay. Acta Endocrinol. 101: 161-165.
Scaba G. (1987). Receptor ontogeny and hormonal imprinting. In: Developments of hormone
receptor. Ed. Scaba G. Basel, pp 79-102.
Scatchard G. (1949). The attraction of proteins for small molecules and ions. Ann. NY. Acad.
Sci. 51: 660-672.
Shankar G, Dubocovich ML. (1989). 24125I]Melatonin labels the same type of melatonin
binding site in the chicken brain and retina. FASEB J. 2: A620;
Splege A,Carter A, Brann M, Collins R,Goldsmith P, Simonds W,Vinitsky R,Hide B,
Rossiter K,Weinstein L, Woodard C. (1988). Signal transduction by guanine nucleotide-
binding protein. Recent Prog. Honnone Res. 44: 337-375.
Stankov B, Reiter RJ. (1990). Melatonin receptors: current status, facts, and hypotheses. Life
Science 46: 971-982.
104
Stehle J. (1990). Melatonin binding sites in brain of the 2-day-old chicken: an autoradiographic
localization. J. Neural Transm. 81: 83-89.
Stryer L. (1986). G proteins: A family of signal transducers. Ann. Rev. Cell Biol. 2: 391-419.
Sudgen D. (1989a). Antigonadal activity of the melatonin analogues 2-iodomelatomn and 2-
chloromelatonin in the juvenile Djungarian hamster. J. Pineal Res. 7: 20S209.
Sudgen D. (1989b). Melatonin analogues induce pigment granule condensation in isolated
Xenopus laevis melanophores in tissue culture J. Endocrinology 120: Rl-3.
Takahashi JS,Murakani N, Nikaido SS, Pratt BL,Robertson LM. (1989). The avian pineal, a
vertebrate model system of the circadian oscillator; cellular regulation of circadian rhythms
by light, second messengers, and macromolecular synthesis. Recent Progress in Hormone
Research 45: 279-351.
Takahachi JS, Hamm H,Menaker M. (1980). Circadian rhythm of melatonin release from
individual superfused pineal glands in vitro. Proc. Natl. Acad. Sci. USA 77: 2319-2322.
Tamarkin K, Westrom WK,Hamill AL,Goldman DB. (1976). Effect of melatonin on the
reproductive systems of the male and female Syrian hamsters: a diumal rhythm in
sensitivity to melatonin. Endocrinology 99: 1534-1541.
Tanabe Y,Doi O, Nakamura T. (1983). Ontogenesis and photoperiodic regulation of the pineal
hormone synthesis in the chicken (Gullus demesticus). In; Avian Endocrinol. Ed. Mikami
S. Japan Sci. Soc. Press. Tokyo/springer, Berlin, pp 217-227.
Tang PL,Pang SF. (1988). The ontogeny of pineal and serum melatonin in male rats at mid-
light and mid-dark. J. Neurol. Trans. 72: 43-53.
Turek FW, McMillan JP and Menaker M. (1976). Melatonin: effects on the circadian
locomotor rhythm of sparrows. Science 194: 1441-1443.
Ueck M. (1979). Innervation of the vertebrate pineal. In: Progress in brain research Vol 52.
Eds. Kappers JA,and Pevet P. Elscvier/North-Holland Biomedical Press, pp. 45-88
105
Underwood H. (1982). The pineal and circadian organization in fish,amphibians and reptiles.
In: The Pineal Gland Vol 3. Extra-reproductive effects. Ed. Reiter RJ. CRC Press,Inc.
Boca Raton, Florida, pp: 1-26
Underwood H, Binkley S, Slopes T,Mosher K. (1984). Melatonin rhythms in the eyes,pineal
bodies, and blood of Japanese quail (Coturnix coturnix Japonica). Gen. Comp.
Endocrinol. 56: 70-81.
Vacas MI, Cardinali DP. (1979). Diumal changes in melatonin binding sites of hamster and rat
brains. Correlation with neuroendocrine responsiveness to melatonin. Neurosciences
Letters 15: 259-263.
Vacas MI,Cardinali DP. (1980). Binding sites for melatonin in bovine pineal gland. Hormone
Res. 13: 121-131.
Vacas MI,Keller SMI, Cardinali DP. (1981). Melatonin increases cGMP and decreases cAMP
levels in rat medial basal hypothalamus in vitro. Brain Res. 225: 207-21L
Vacas MI, Berria MI, Cardinali DP, Lascano EF. (1987). Melatonin inhibits p-
adrenoreceptor-stimulated cyclic AMP accumulation in rat astroglial cell cultures.
Neuroendocrinology 38:176-181.
Vakkuri O, Leppaluoto J,Vuolteenaho O. (1984a). Development and validation of a melatonin
radioimmunoassy using radioiodinated melatonin as tracer. Acta. Endocrinol 106: 152-157
Vakkuri O,Lamsa E,Rahkamaa E,Ruotsalainen H, Leppaluoto J. (1984b). Iodinated
melatonin: preparation and characterization of the molecular structure by mass and
NMR spectroscopy. Analytical Biochemistry 142: 284—289.
Vanecek J, Pavlik A, Illnerova H. (1987). Hypothalamic melatonin receptor sites revealed by
autoradiography. Brain Res. 435: 359-362.
Vanecek J. (1988a). The melatonin receptors in rat ontogenesis. Neuroendocrinology 48: 201-
203.
Vanecek J. (1988b). Melatonin binding sites. J. Neurochemistry 51: 1436—1440.
106
Vanecek J,Jansky L. (1989). Short days induce changes in specific melatonin binding in
hamster median eminence and anterior pituitary. Brain Res. 477: 387—390.
Vanecek J, Vollrath L. (1989). Melatonin inhibits cyclic AMP and cyclic GMP accumulation
in the rat pituitary. Brain Res. 505: 157-159.
Weaver DR,Keohan JT, Reppert SM. (1987). Definition of a prenatal sensitive period for
maternal-fetal communication of daylength. Am. J. Physiol 253: E701-704.
Weaver DR, Namboodiri MAA, Reppert SM. (1988). Iodinated melatonin mimics melatonin
action and reveals discrete binding sites in fetal brain. FEBS Letters 228: 123-7.
Weaver DR,Carlson LL, Reppert S. (1990). Melatonin receptors and signal transduction in
melatonin-sensitive and melatonin-insensitive populations of white-footed mice
{peromyscus leucopus). Brain Res. 506: 353-357.
Weaver DR. Provencio L Carlson LL. Reppert SM. (1991). Melatonin receptors and signal
transduction in photorefractory Siberian hamsters (Phodopus sungorus). Endocrinology.
128(2): 1086-92,
Weekley LB. (1991). Melatonin impairs alpha but not beta adrenergic responses of vascular
smooth muscle. J. Pineal Res 11: 28-34.
Weiland GA,Molinoff PB. (1981). Quantitative analysis of drug-receptor interactions:
Determination of kinetic and equilibrium properties. Life Sci. 29: 313-330.
White BH, Sekura RD, Rollag MD. (1987). Pertusis toxin blocks melatonin-induced pigment
aggregation in Xenopus dermal melanophors. J. Comp. Physiol. 157: 153-159.
Wiechmann AR (1986). Melatonin: parallels in pineal gland and retina. Exp. Eye Res. 42:
507-527
Wiechmann AF, Yang XL, Wu SM, Hollyfield JG, (1988). Melatonin enhances horizontal cell
sensitivity in salamander retina. Brain Res. 453:377-380
Wiechmann AF, Bok D, Horwitz J. (1986). Melatonin-binding in the frog retina:
autoradiographic and biochemical analysis. Invest. Ophthalmol. Vis. Sci. 27: 153-163.

107
Williams LM. (1989). Melatonin-binding sites in the rat brain and pituitary mapped by in-vitro
autoradiography. J. Molecular Endocrinol 3: 71-75.
Williams LM,Martinoli MG,Titchener LT, Pelletier G. (1991). The ontogeny of central
melatonin binding sites in the rat Endocrinology. 128(4):2083-90.
Wurtman RJ, Axelrod J,Kelly DR (1968). Pineal anatomy. In: The Pineal. Eds. Wurtman
RJ, Axelrod J, and Kelly DE. New York. Academic Press pp 2-47.
Yu ZH, Yuan H, Pang SH. (1991). [^^I]iodomelatoiiin binding sites in spleens of birds and
mammals. Neuroscience Lett. 125: 175-178.
Yuan H, Pang SF. (1990). [^^Ijmelatonin binding sites in membrane preparations of quail
brain: characteristics and diumal variations. Acta Endocrinol. 122: 633—639.
Yuan H,Tang F, Pang SF. (1990). Binding characteristics, regional distribution and diumal
variation of [•'•^Ijmelatonin binding sites in the chicken brain. J. Pineal Res. 9: 179-191.
Yuan H,Pang S R (1991). [^^1]iodomelatonin binding sites in the pigeon brain: binding
characteristics, regional distribution and diumal variation. J. Endocrinol. 128: 47S482.
Yuan H, Yan L,Pang SF. (1991). Binding characteristics and regional distribution of
[^^I]icxiomelatonin binding sites in the brain of the human fetus. Neuroscience Lett 130:
229-232.
Ying SW, Niles LP. (1991). 3-[3-Cholamidopropyl)dimethylammomo]-l-propane sulfonate-
solubilized binding sites for 2- [ ^1]icxiomelatonin in chick brain retain sensitivity to
guanine nucleotide. J. Neurochemistry. 56: 580-586.
Zatz M, Mullen DA,Moskal JR. (1988). Photoendocrine transduction in cultured chick pineal
cells. Effects of light, dark,and potassium on the melatonin rhythm. Brain Res. 438: 199-
215.
Zeman M,Illnerova H. (1990). Ontogeny of N-acetyltransferase activity rhythm in pineal
gland of chick embryo. Comp. Biochem. Physiol. 97A: 175-178.
108
Zisapel N, Laudon M . (1987). A novel melatonin antagonist affects melatonin mediated
processes in vitro and in vivo. Eur. J. Pharmacol. 136: 259-260.
Zisapel N,Shaharabani M,Laudon M. (1987). Regulation of melatonin activity in the female
rat brain by oestradiol: effects on neurotransmitter release and on iodomelatonin binding
sites. Neuroendocrinology 46: 207-21.
Zisapel N. (1988). Melatonin receptors revisited. J. Neural. Transm. 73: 1-5.
Zisapel N, Anis Y. (1988). Impact of circulating testosterone on icxiomelatonin binding sites in
the male rat brain. Mol. Cell Endocrinol. 60: 119-126.
Zisapel N, Nir I,Moshe L . (1988). Circadian variations in melatonin-binding sites in discrete
areas of the male rat brain. FEBS Letters 232 (1): 172-176.
Zisapel N, Laudon M . Nir L (1989). Melatonin receptors in discrete brain regions of the male
rat: Age-associated decrease in receptor density and in circadian rhythmicity. In: Advances
in Pineal Research Volume 3, Eds. Reiter RJ, and Pang SF, John Libbey & Company
Ltd. London, pp. 189-194.
Zisapel N, Oaknin S,Anis Y,Nir L (1991). Melatonin receptors in discrete areas of the rat and
Syrian hamster brain: modulation by melatonin,pinealectomy, testosterone and the
photoperiod. In: Advances in Pineal Res. Vol. 5. Eds. Pevet JAP, and Reiter RJ. John
Libbey & Company Lid. London, pp 175-182.
Zimmerman BL, Tso MOM. (1975). Morphologic evidence of photoreceptor differentiation of
pinealocytes in the neonatal rat. J. Cell Biol. 66: 60-75
Zimmerman NH, Menaker M. (1979). The pineal gland: a pacemaker within the circadian
system of the house sparrow. Proc. Natl. Acad. Sci. USA. 76: 999-1003.

Agonists and antagonists of putative melatonin receptors
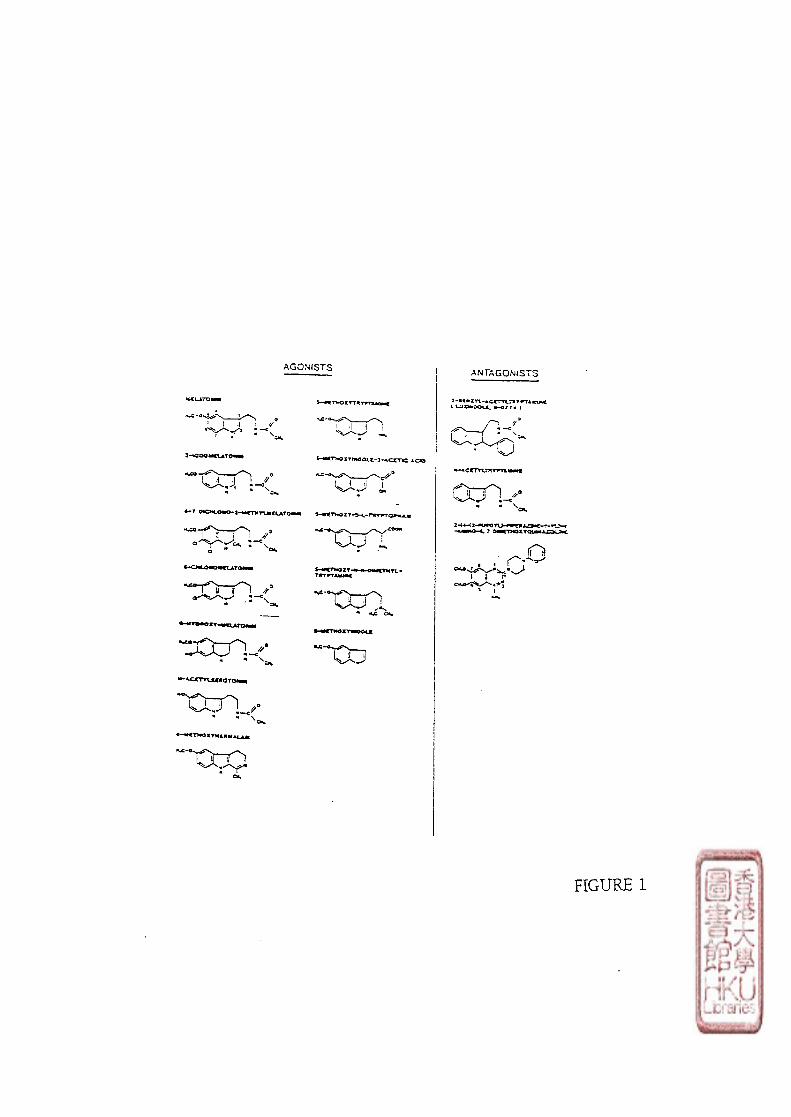
AGON(STS ANTAGONISTS
FIGURE 1
107
Figure 2. A representative experiment of melatonin iodination showing the T L C
separation profile. Iodogen (2 (xg in 20 jil of chloroform) in a 6 x 50 mm glass tube was dried
down under nitrogen. Melatonin (20 ig in 20 of 0.1 mol/1 phosphate buffer, pH 6.0) was
first added to the Iodogen tube (containing 2 jxg of Iodogen) and Na[125I] (400 jxCi in 20 fxl
0.1 mol/1 phosphate buffer,pH 6.0) was added immediately afterwards. The reaction was
allowed to proceed for 1 min at room temperature while vortexing. The reaction product was
then extracted twice in chloroform (100 pi) and subjected to TLC using silica gel sheet 20x20
cm (with fluorescent indicator) and 30 ml of ethyl acetate was used as solvent One cm sections
of silica gel were cut and extracted in 2-propanol. Radioactivity levels were measured with a
gamma counter. Rf values for melatonin and [ 125 j j iodomelatonin were 0.29 and 0.41
respectively. M,melatonin; 1 2 5I-M,f1 2 51]iodomelatonin; 1251,free N a f ^ ^ I ]
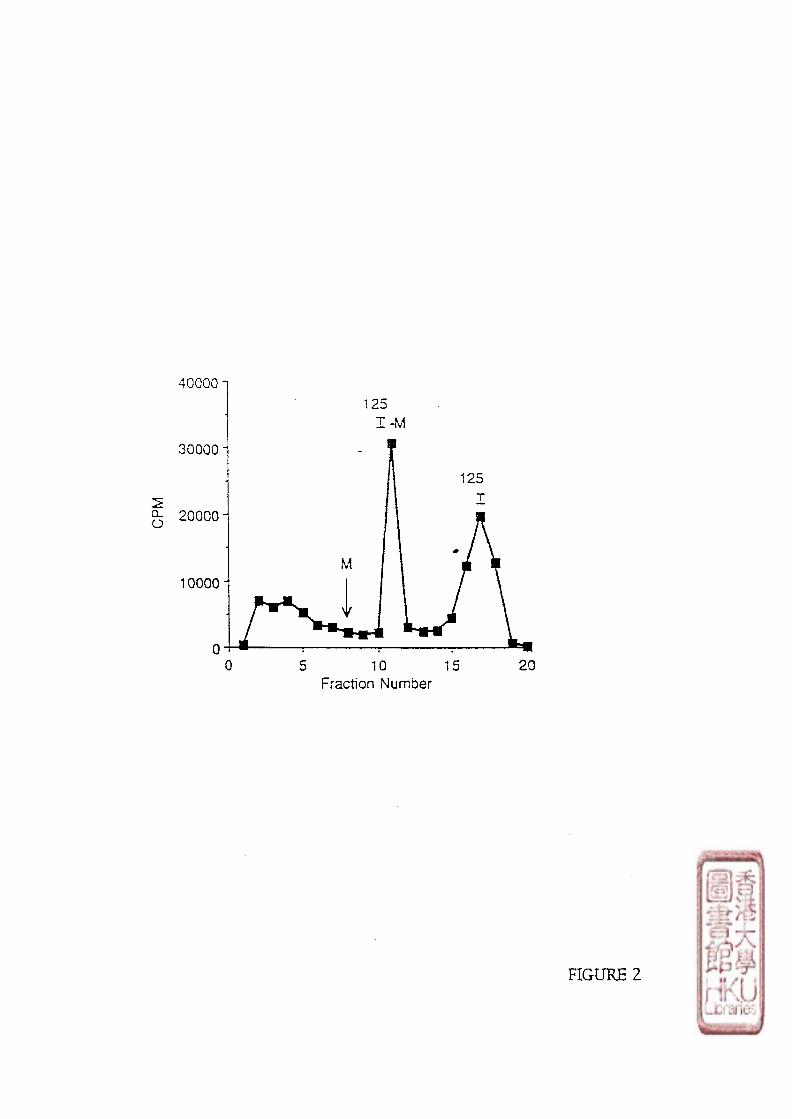
o
40000 1
30000
20000
10000
125
125
10 15 20 Fraction Number
FIGURE 2
108
Figure 3. A representative experiment of melatonin iodination showing the H P L C
separation profile. Iodogen (2 \ig in 20 \il of chloroform) in a 6 x 50 mm glass tube was dried
down under nitrogen. Melatonin (20 \xg in 20 \i\ of 0.1 mol/1 phosphate buffer, pH 6.0) was
first added to the Iodogen tube (containing 2 jxg of Iodogen) and Na[125I] (400 [id in 20 il
0.1 mol/1 phosphate buffer, pH 6.0) was added immediately afterwards. The reaction was
allowed to proceed for 1 min at room temperature while vortexing. 丁he reaction product was
then extracted twice in chloroform (100 \i\) and blown to dryness under nitrogen gas,
dissolved in 100 \il methanol and subjected to HPLC (Bio-Rad 700 HPLC system) using
revers-phase column (Bio-Rad Laboratories 250 X 4 mm Bio-Sil ODR-5S) and eluted with a
2-propanal gradient from 5-45 % in 90 min at a flow rate of 0.5 ml/min. Elution of melatonin
was monitored by U V spectrophotometrically (220 nm). Radioactivity of the fractions collected
were counted. The retention times was 10 min for melatonin, 29 min for [125I]iodomelatomn
(fraction 28-30), and 3 min for free Na[125i] (fraction 2-3). M, melatonin;
[125I]iodomelatonin; 125I, free Na[^^I]

10 20 30 40 50 60 70 Fraction number
FIGURE 3
o X
G L o

109
Figure 4. Time courses of [ ^]icxiomelatonin (A) association to and (B) dissociation from
brain membrane preparations of 10-week-old chicken incubated at 370C for 5,10,15,20,30,
40 60 and 80 min. (A) Inset, pseudo-first-order plot of the association data with an association
rate constant ( k i ) 9 .5 X 10 8 (LR)e, the concentration of specific
[125i]iodomelatonin binding at equilibrium; (LR)a, the concentration of [125I]iodomelatonin
binding at time t Dissociation was initiated by addition of melatonin 1 iimolll and incubated
for the indicated time (5,10, 15,20,30,40,60,80 minutes). (B) Inset, first-order plot of the
dissociation data with an dissociation rate constant (k-i) 6.7 X 10 -2 min - 1 • (LR)o, the
concentration of specific [ i o d o m e l s i t o n i i i binding just before the addition of competing
melatonin; (LR)d,the concentration of specific [125I]iodomelatonin binding at time t after
initiation of dissociation. The kinetically derived Kd value (K4/K1) was 70.5 pmol/L Data
shown are from one experiment done in duplicate.

10 20 30 40
Time (min.)
20 40 60 Time (min.)
10 20 30 40 5C Time (min.)
On 5 ‘1" ? -2-E -3' d. -4-5 -5--
CZ 主
|
A
2 -
1 -
3 5 .g-e •§ o CtJ i— "5 ^ = o o E E g 二至 CO C\i
T3 C ZD 5 C ^ § 1 芘 2 o ^ E窆 o E "§ 1 E:!
in OJ
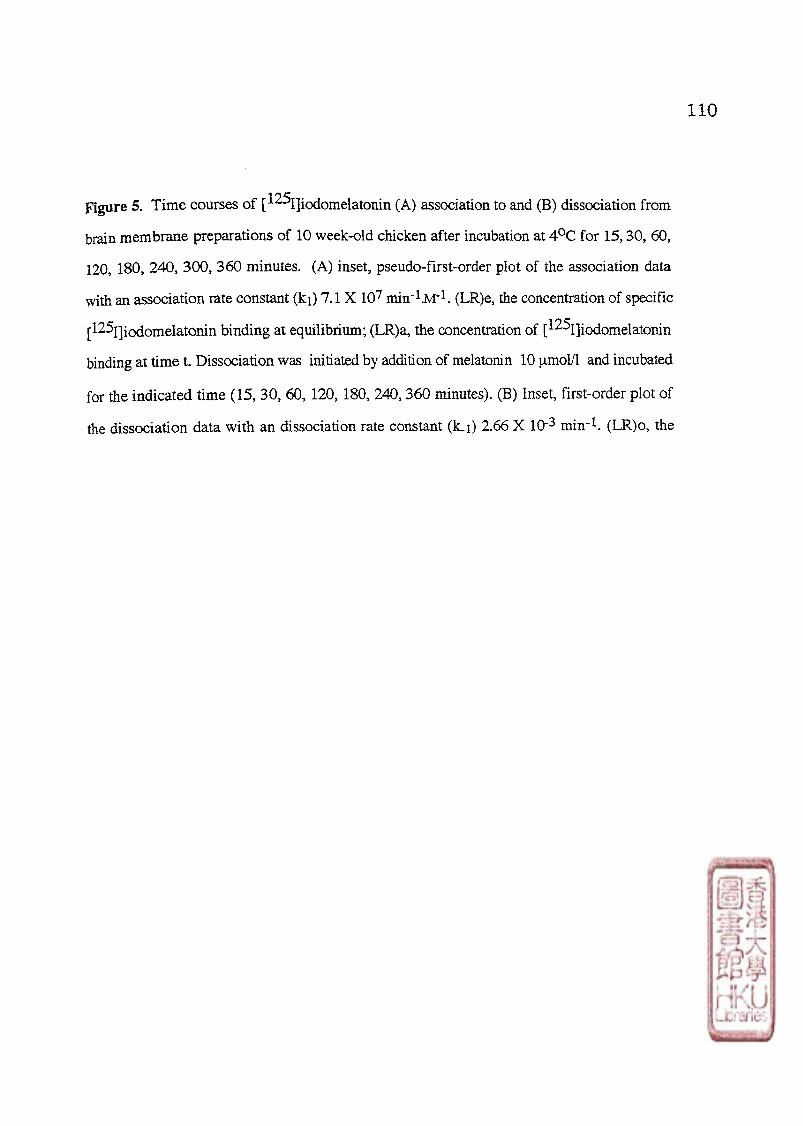
110
Figure 5. Time courses of [ ^I]iodomelatonin (A) association to and (B) dissociation from
brain membrane preparations of 10 week-old chicken after incubation at 4 0 C for 15,30,60,
120,180,240,300, 360 minutes. (A) inset,pseudo-first-order plot of the association data
with an association rate constant (ki) 7.1 X 10⁷ milri.M"1. (LR)e, the concentration of specific
[l^ijiodomelatonin binding at equilibrium; (LR)a,the concentration of [^^I]iodomelatonin
binding at time t Dissociation was initiated by addition of melatonin 10 and incubated
for the indicated time (15, 30,60, 120, 180,240,360 minutes). (B) Inset, first-order plot of
the dissociation data with an dissociation rate constant ( L i ) 2.66 X lO'3 min-1. (LR)o, the
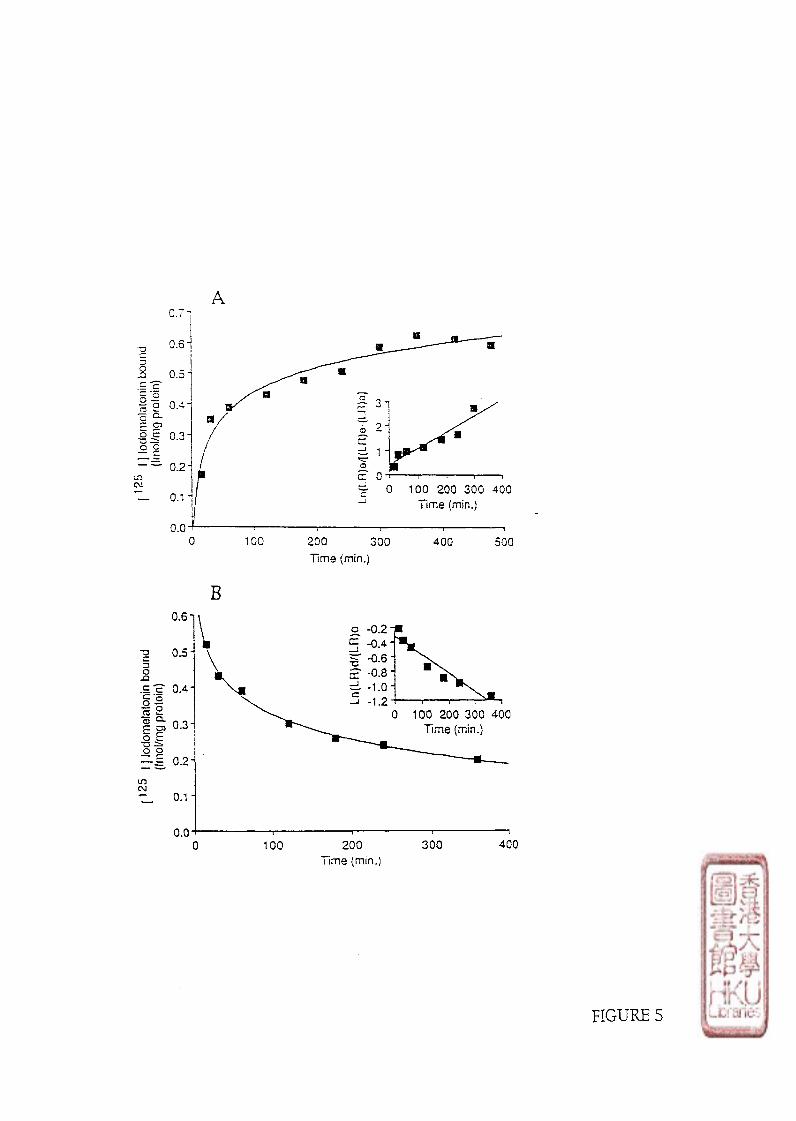
0.7,
100 200 300 400 Time (min.)
u.u 0 100 200 300 400
Time (min.)
FIGURE 5
100 200 300 400
Time (min.)
c
\
l.
4
c
q
.
8q
.
2
公-0.-0.
9-1.
T*
otyJJ/pcJcJ
{clojd
邙
e/oeo
-acnoq ucolea5luoF>
ol
=:
Sln
).0(y
1)l/0
(ylc
l
u.
o.
o.
o.
a 〔
(u
lOJd
6E/10Ej) punoq
uluoalouo'oo
一 1
1
goaf
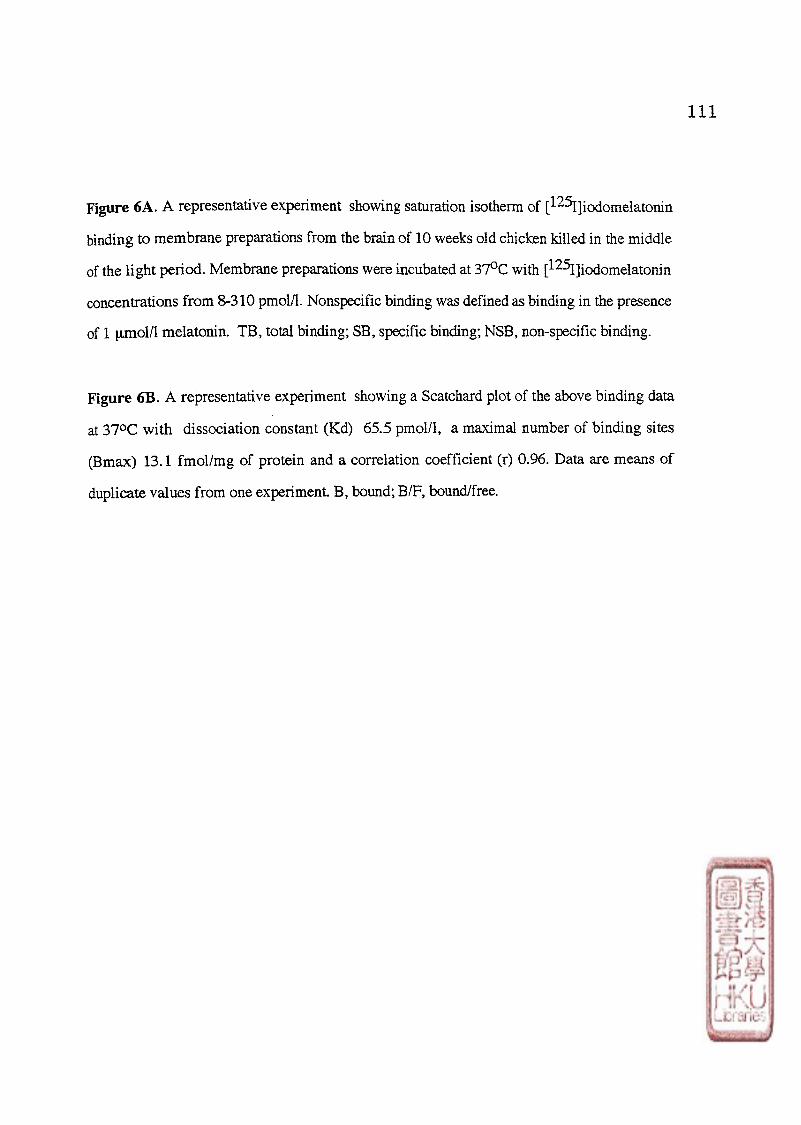
I l l
Figure 6A. A representative experiment showing saturation isotherm of [^^Ijiodomelatonin
binding to membrane preparations from the brain of 10 weeks old chicken killed in the middle
of the light period. Membrane preparations were incubated at S ^ C with [^^I]iodomelatonin
concentrations from 8-310 pmol/L Nonspecific binding was defined as binding in the presence
of 1 |xmol/l melatonin. TB,total binding; SB, specific binding; NSB, non-specific binding.
Figure 6B. A representative experiment showing a Scatchard plot of the above binding data
at 37 0 C with dissociation constant (Kd) 65.5 pmol/1, a maximal number of binding sites
(Bmax) 13.1 fmol/mg of protein and a correlation coefficient (r) 0.96. Data are means of
duplicate values from one experiment B, bound; B/F, bound/free.
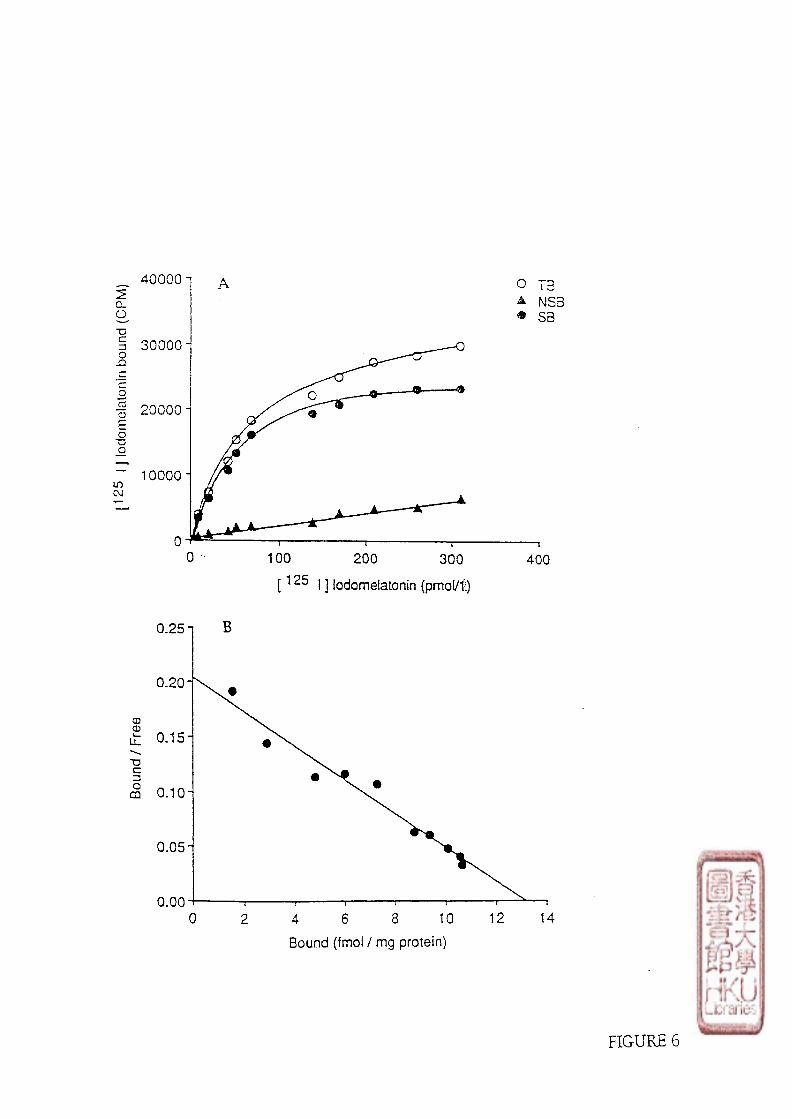
40000 丁 3
NSB SB
30000
20000
10000
0 100 200 300
[ 1 25 j j iodomelatonin (pmol/ll)
4 0 0
4 6 8 10
Bound (fmol / mg protein)
12 1 4
FIGURE (5
2 CL o "D C =3 O
JD a *c o 互 o E o ID _g
in OJ
<D 0 UL 、 T3 C 3 O m
Figure 7A . A representative experiment showing the saturation isotherm of
f l^Sj^odomelatonin binding to membrane preparations from the brain of 10 weeks old chicken
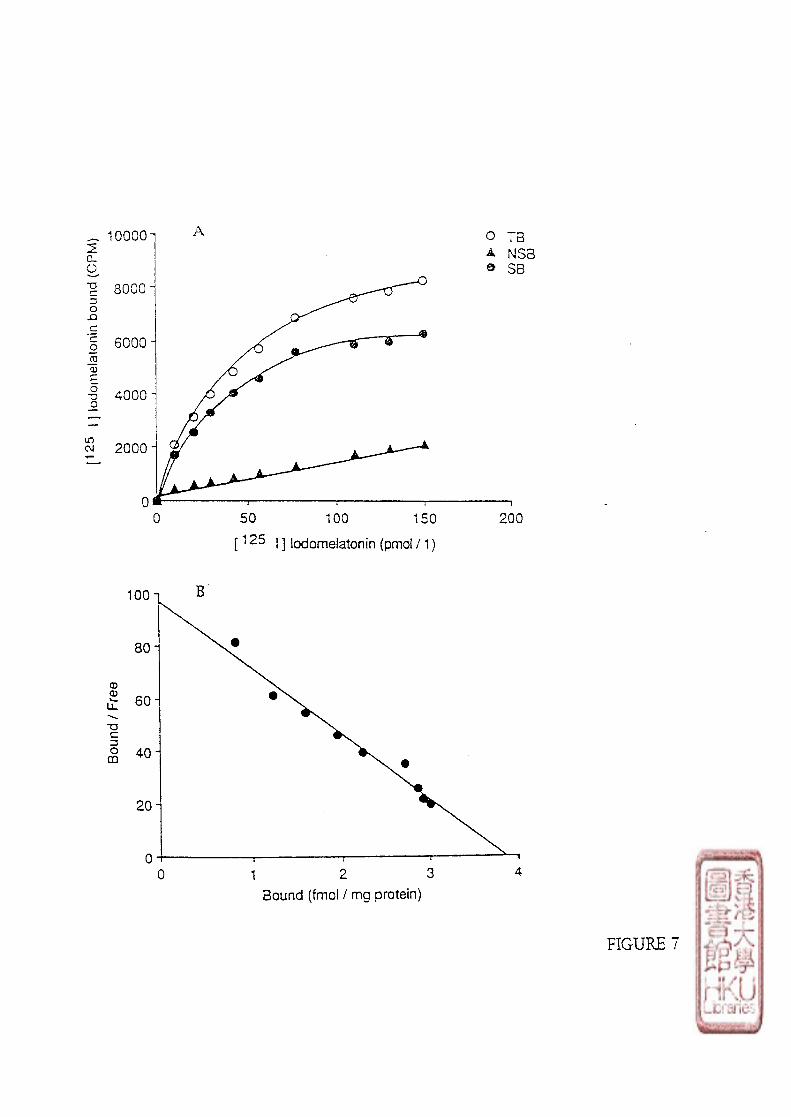
100001
8000
6000
4000
2000
50 100 150
[ 1 25 i 】iodomelatonin (pmol / 1 )
200
Bound (fmol / mg protein)
FTCrURE 7
2 Q. O -a [ 5 o JD C
"c o ca "a5 E o "D
LO C\J T—
① o iL T3 C 3 O CD
113
Figure 8A. A representative experiment showing the saturation isotherm of
[125i]iodomelatonin binding to membrane preparations from the brain of 10 weeks old chicken
killed in the middle of the light period. Membrane preparations were incubated at 250C with
[125i]iodomdatomn concentrations from 9-120 pmol/1. Nonspecific binding was defined as
binding in the presence of 1 |xmol/l melatonin. TB, total binding; SB, specific binding; NSB,
non-specific binding.
Figure 8B. A representative experiment showing Scatchard plot of the above binding data at
250C with dissociation constant (Kd) 88.4 pmol/1,a maximal number of binding sites
(Bmax) 8.2 fmol/mg of protein and a correlation coefficient (r) 0.973. Data are means of
duplicate values from one experiment B, bound; B/F, bound/free.
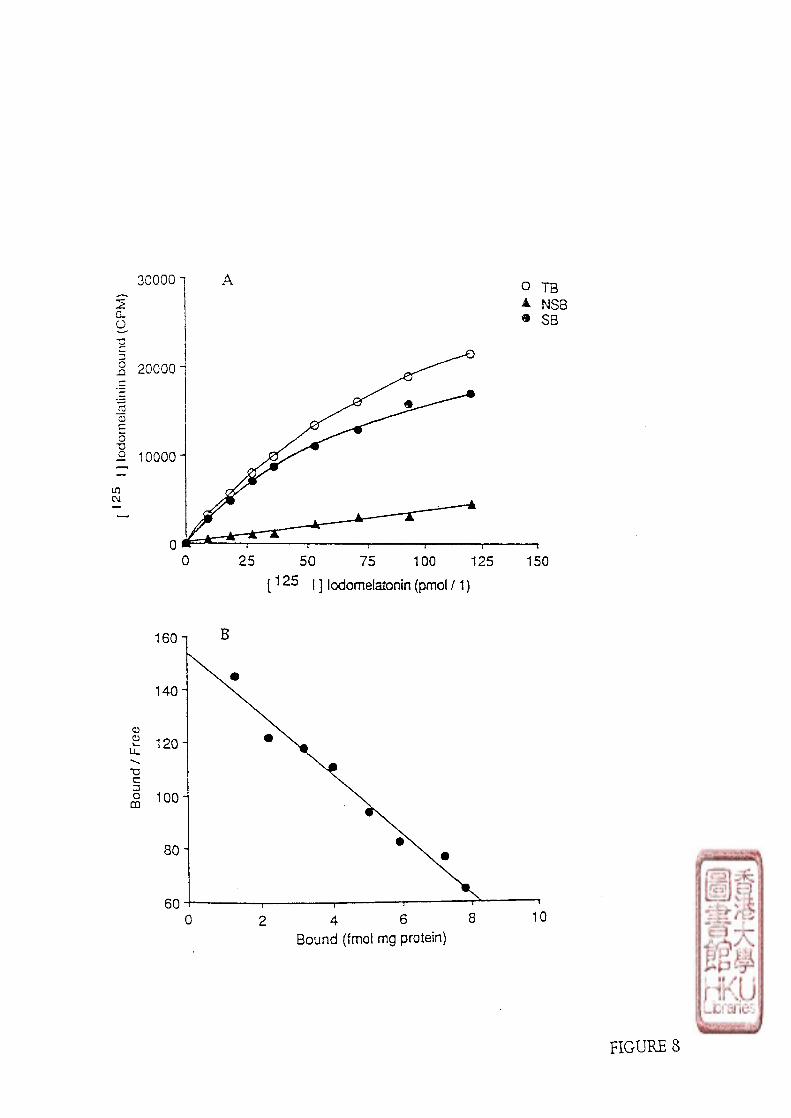
25 50 75 100 125 150 [ 1 2 5 | ] iodomelatonin (pmol /1)
Bound (fmol mg protein)
10
FIGURE 8
TB NSB SB
① £ ul
T 5 C D O m
2 Q-o "O 5 0
JD C
1 CD £ O
T 3 O
in CM

Figure 9. Relationship between specific binding of [^^I]iodomelatonin to pigeon brain
membrane preparations and protein concentration in the membrane preparations. The linear
regression between the specific binding of [^^I]iodomelatx)nin (9.4 pmol/1) to the membrane
preparations with protein concentrations from 70 \ig to 820 \ig gave a straight line, the
coefficient of correlation being 0.995.
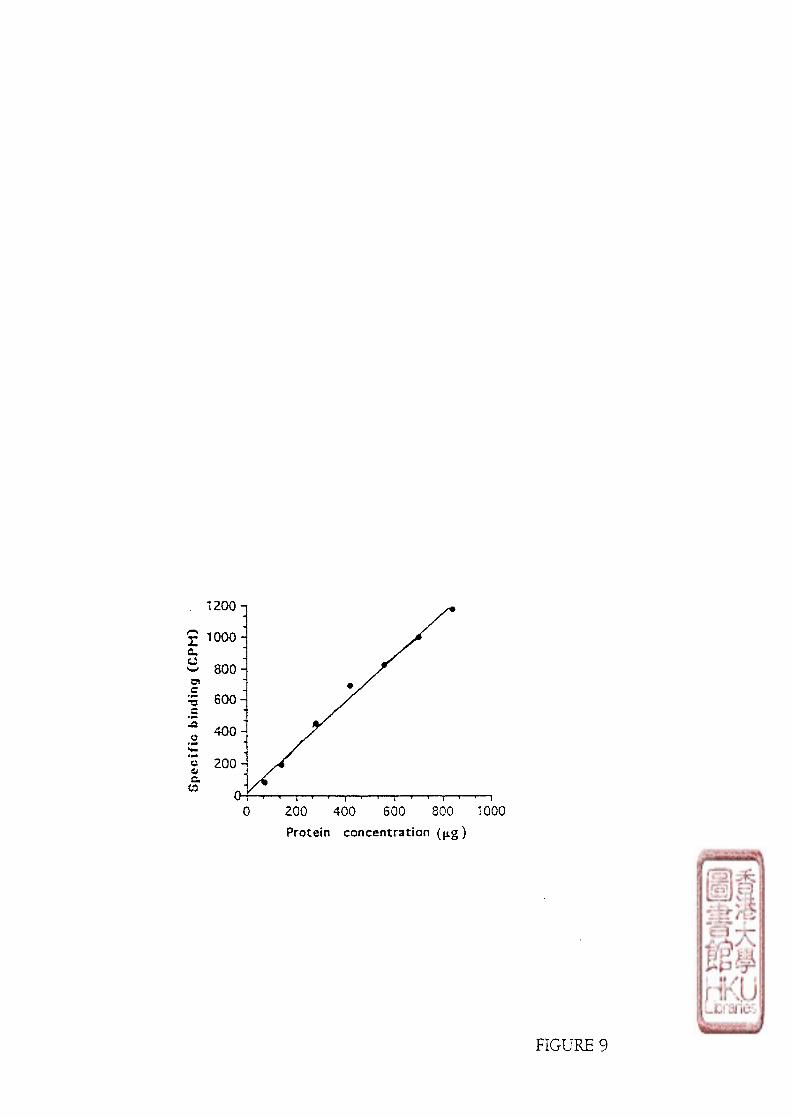
1200
200 400 600 800 1000 Protein concentration (jtg)
FIGUTRTR q
2 1000-sX 3 800-m
•! 600-s • pa t • • • pii
o 2 0 0 • o a W A
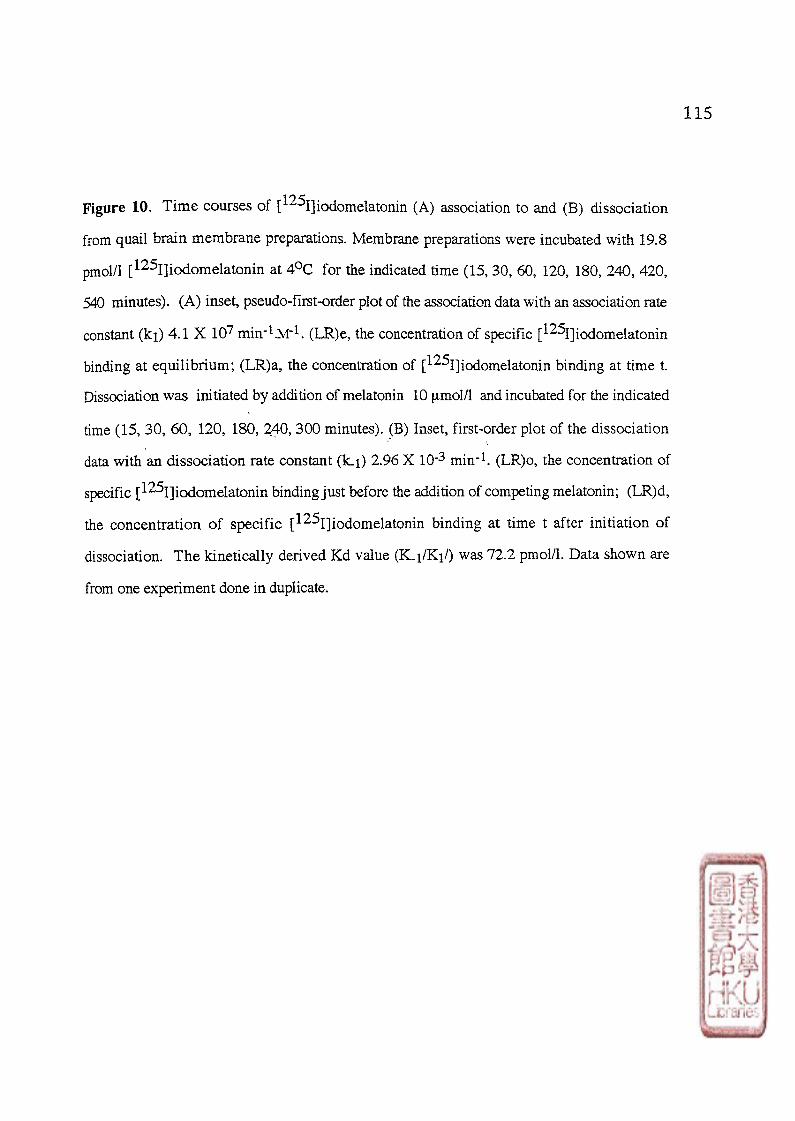
115
Figure 10. Time courses of iodomelatonin (A) association to and (B) dissociation
from quail brain membrane preparations. Membrane preparations were incubated with 19.8
pmol/1 [125I]iodomelatonin at 4 0 C for the indicated time (15,30,60, 120,180,240, 420,
540 minutes). (A) inset, pseudofirst-order plot of the association data with an association rate
constant (ki) 4 1 X 10⁷ mirr iM - 1 . (LR)e, the concentration of specific [l^I]iodomelatomn
binding at equilibrium; (LR)a, the concentration of iodomelatonin binding at time t.
Dissociation was initiated by addition of melatonin 10 jxmol/1 and incubated for the indicated
time (15,30,60, 120,180,240, 300 minutes). (B) Inset, first-order plot of the dissociation
data with an dissociation rate constant (k_i) 2.96 X 10*3 min"1. (LR)o, the concentration of
specific [ i c x i o m e l a t o n i n binding just before the addition of competing melatonin; (LR)d,
the concentration of specific [^^I]iodomelatonin binding at time t after imtiation of
dissociation. The kinetically derived Kd value (K-i/Ki/) was 72.2 pmol/1. Data shown are
from one experiment done in duplicate.
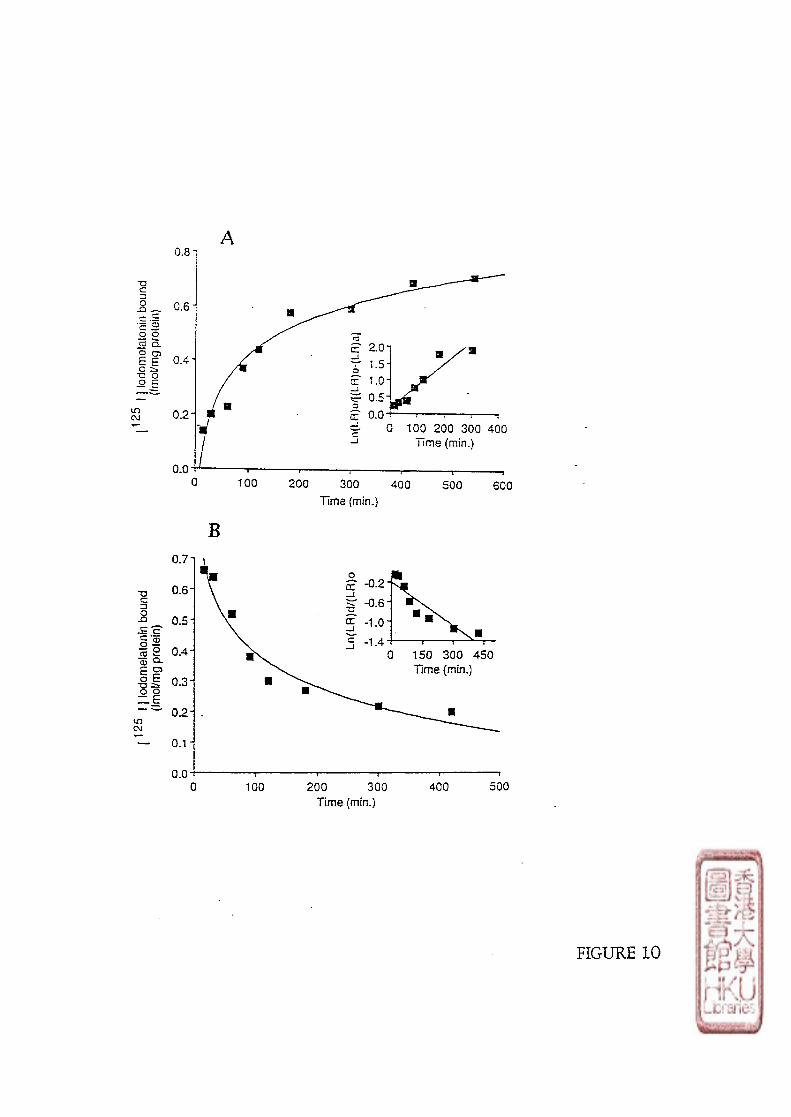
0.81
100 200 300 Time (min.)
400 500 600
0 150 300 450 Time (min.)
100 200 300 400 Time (min.)
u.u* 0 100 200 300 400 500
Time (min.)
FIGURE 10
£ -0-2
t "0.6 5 -1.0 5 -1.4
0.7
^ 0.6
0.5 c" § 2 a 4 . O CL
If 0 .3 '
——0.2. un CM
: 0.1 •
a* E 2.0
f ^ £ 1.0 豸 a s o £ 0.0
"O
c .三 c ® o o l— Q. "o 03 £ E o么 "a o O至
m CM

Figure 11. Time courses of [125I]iodomelatonin (A) association to and (B) dissociation
from pigeon brain membrane preparations. Membrane preparations were incubated with 18.2
pmol/1 [125I]iodomelatonin at 4 0 C for the indicated time (15,30,60,120,180,240,300,
420, 540 minutes). (A) inset, pseudo-first-order plot of the association data with an
association rate constant (ki) 1.1 X 10⁸ (LR)e, the concentration of specific
[12^I]icxiomelatonin binding at equilibrium; (LR)a, the concentration of [12^I]iodomelatonin
binding at time t. Dissociation was initiated by addition of melatonin 10 iimoVl and incubated
for the indicated time (30,60» 120,180,240, 300,420 540 minutes). (B) Inset, first-order
plot of the dissociation data with an dissociation rate constant (lei) 2.9 X 10-3 min*1. (LR)o,
the concentration of specific [^^]iodomelatonin binding just before the addition of competing
melatonin; (LR)d, the concentration of specific [125I]iodomelatonin binding at time t after
initiation of dissociation. The kinetically derived Kd value (K4/K1/) was 26.9 pmol/L Data
shown are from one experiment done in duplicate.
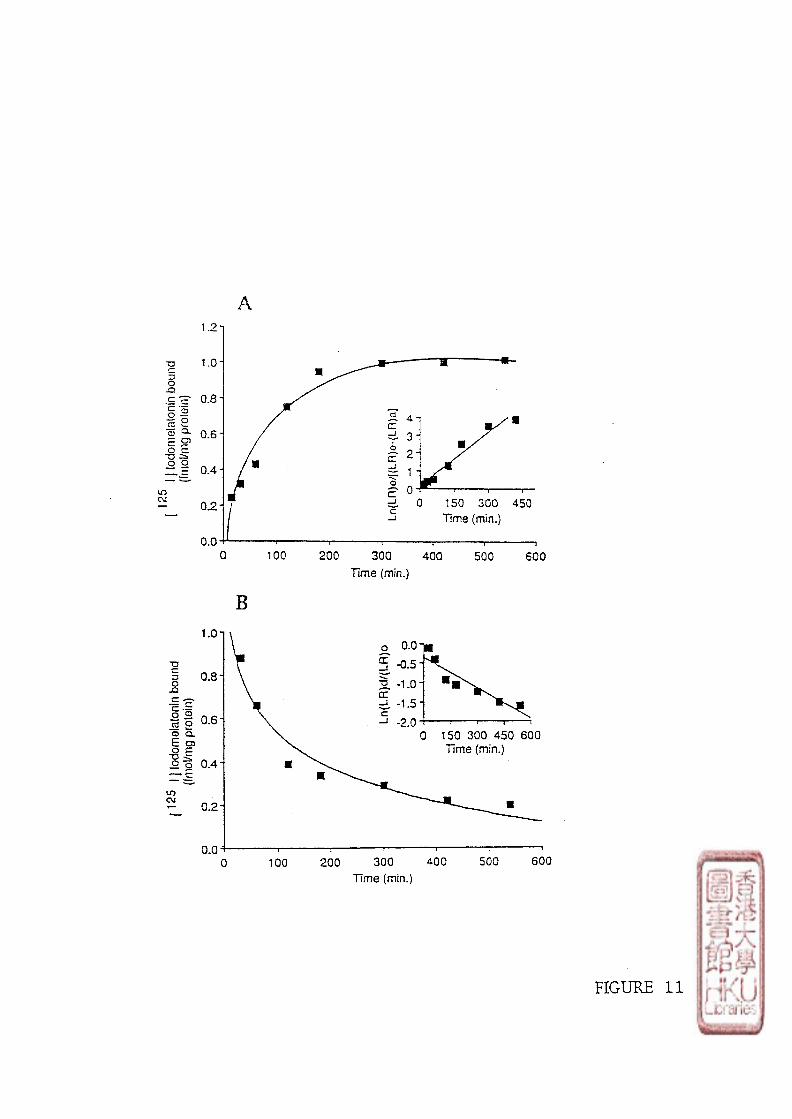
150 300 450 Time (min.)
0.0J
0 100 200 300 400 500 600 Time (min.)
FTG imE 11
G 主
I 'c' 」
1.0
0.8
0.6
0 .4 .
0:2,
"O r-5 o c 三 §1 ra 2 a5 CX E朵 o c *n 今 £ g
tn CM
in CM
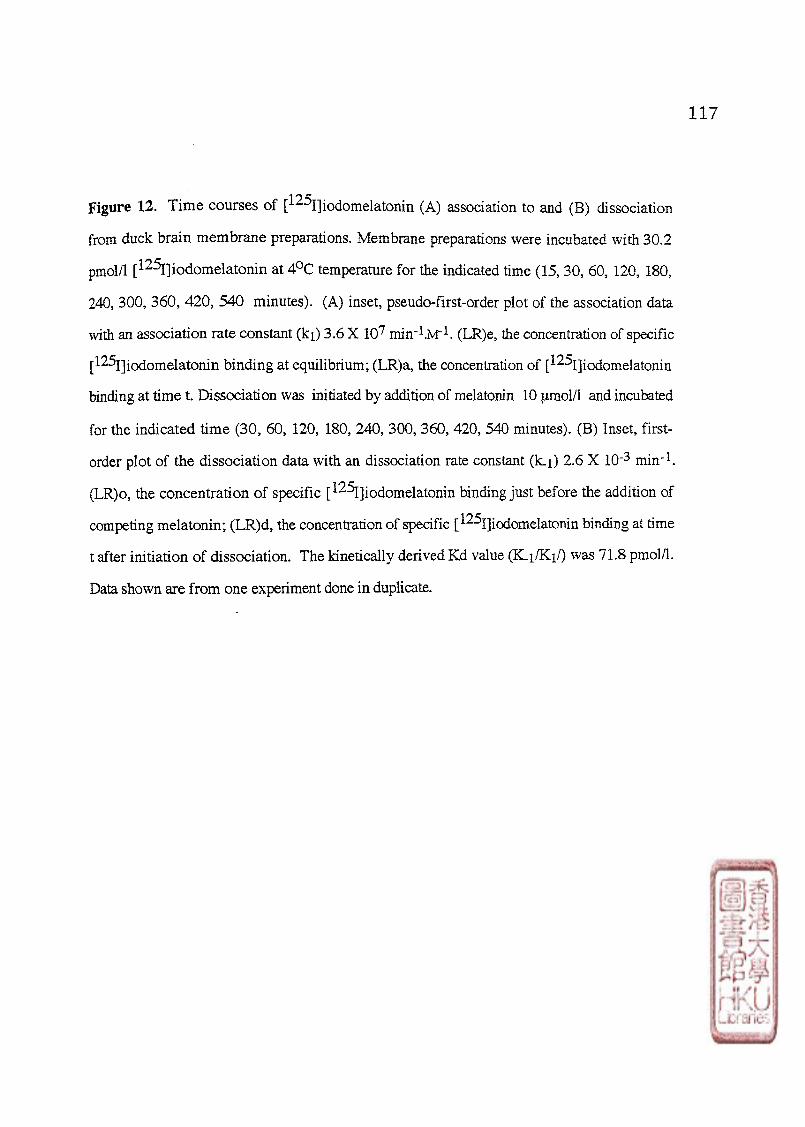
Figure 12. Time courses of [^^I]iodomelatonin (A) association to and (B) dissociation
from duck brain membrane preparations. Membrane preparations were incubated with 30.2
pmol/1 [12^]iodomelatonin at 4 0C temperature for the indicated time (15,30,60, 120, 180,
240, 300,360, 420,540 minutes). (A) inset, pseudo-first-order plot of the association data
with an association rate constant (ki) 3.6 X 10⁷ (LR)e, the concentration of specific
[125i]io(iomelatonin binding at equilibrium; (LR)a,the concentration of [^^I]iodomelatomn
binding at time t. Dissociation was initiated by addition of melatonin 10 pmol/l and incubated
for the indicated time (30,60, 120,180, 240, 300,360, 420,540 minutes). (B) Inset, first-
order plot of the dissociation data with an dissociation rate constant (k-i) 2.6 X 10"3 min"1.
(LR)o, the concentration of specific [^^]iodomelatonin binding just before the addition of
competing melatonin; (LR)d,the concentration of specific [ ^I]iodomelatonin binding at time
t after initiation of dissociation. The kinetically derived Kd value (Kli/Ki/) was 71.8 pmol/L
Data shown are from one experiment done in duplicate.
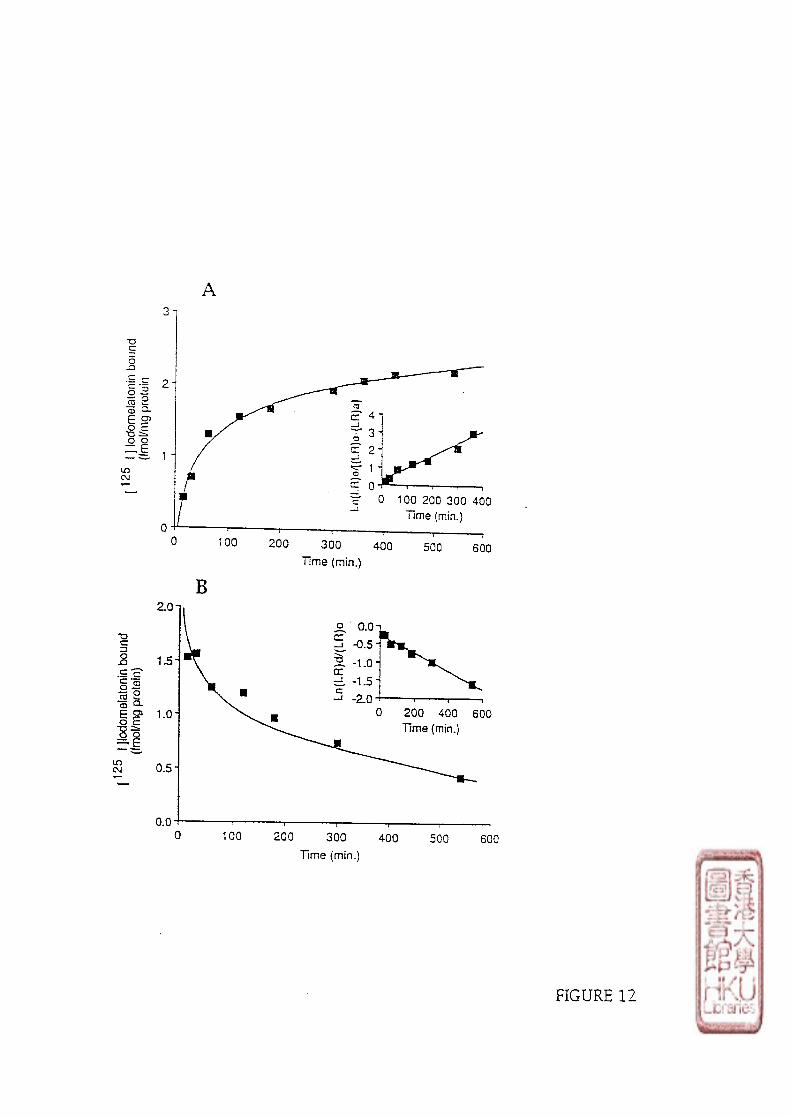
100 200 300 400 500 600
Time (min.)
FTGIJRF 1 7
100 200 300 400 Time (min.)
100 200 300 400 Time (min.)
500
旦 0.0-
5 -0.5-
I-1.0« a: zL -1.5. c 」-2.0-
X3 C 3 5 •s芎 § 3 1 1 号?
ZT兰 to 04
J - J
T35 C g JD C c § 1 ?5 2 O CL E o E -o ^ o o
CO C\i
118
Figure 13A. A representative experiment showing the saturation isotherm of
[l^ijicxiomelatonin binding to membrane preparations from the brain of pigeon killed in the
middle of the light period. The membrane preparations were incubated at 4 0 C with
[125i] iodomelatonin concentrations from 8-90 pmol/1. Nonspecific binding was defined as
binding in the presence of 10 fxmol/1 melatonin. TB, total binding; SB, specific binding; NSB,
non-specific binding.
Figure 13B* A representative experiment showing Scatchard plot of the above binding data
with a dissociation constant (Kd) 25.9 pmol/1, a maximal number of binding sites (Bmax)
5.65 fmol/mg of protein and 汪 correlation coefficient (r) 0.986. Data are means of duplicate
values from one experiment. B, bound; B/F, bound/free.
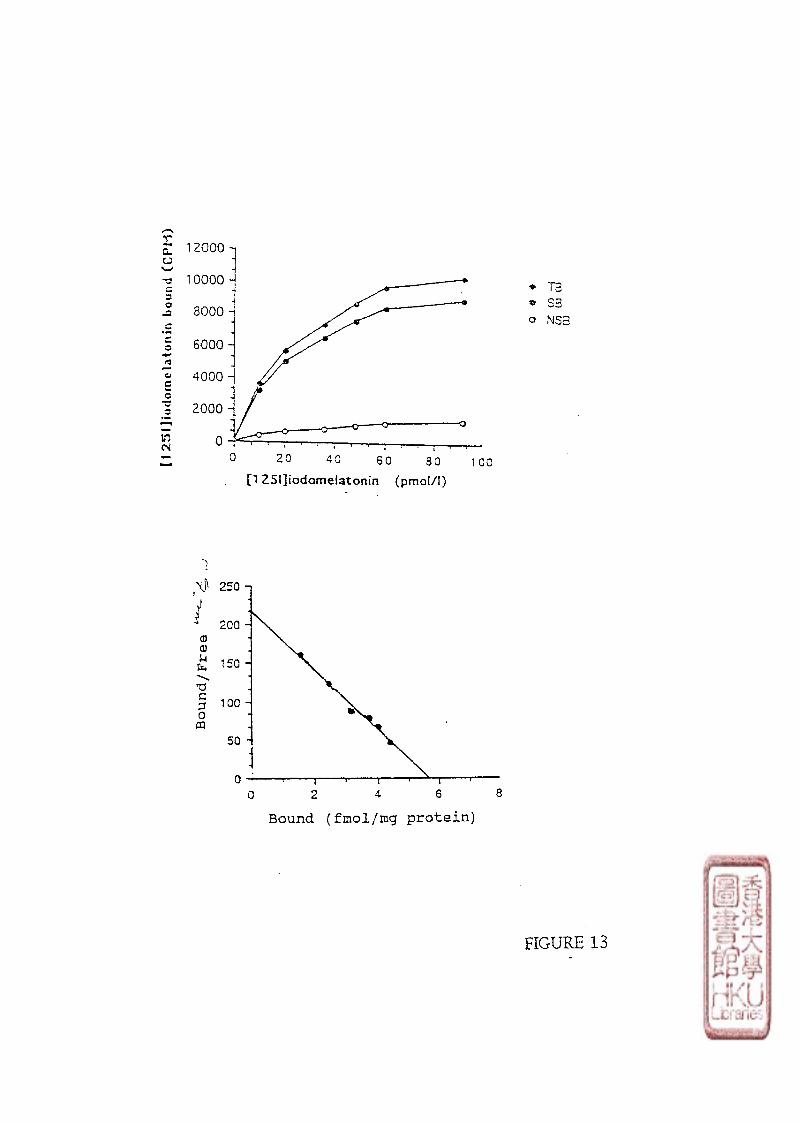
12000
10000
8000
6000
4000
Z000
0 20 40 SO 80 1 cc [125I]iodome!atonin (pmol/I)
Bound (fmol/mg prote in)
ao^h/TJcnoal
(
rd8iotl.£JJ2iop.2
【
JS<N二
s
BBS
rSN
FIGURE 13

Figure 14A. A representative experiment showing the saturation isotherm of
[125i]iodomelatonin binding to membrane preparations from the brain of duck killed in the
middle of the light period. The membrane preparations were incubated at 4 0 C with
[^^Ijiodomelatonin concentrations from 15-114 pmol/1. Nonspecific binding was defined as
binding in the presence of 10 fxmol/l melatonin. TB,total binding; SB, specific binding; NSB,
non-specific binding.
Figure 14B. A representative experiment showing Scatchard plot of the above binding data
with a dissociation constant (Kd) 28.6 pmol/1, a maximal number of binding sites (Bmax)
11.8 fmol/mg of protein and a correlation coefficient (r) 0.995. Data are means of duplicate
values from one experiment. B, bound; B/F, bound/free.
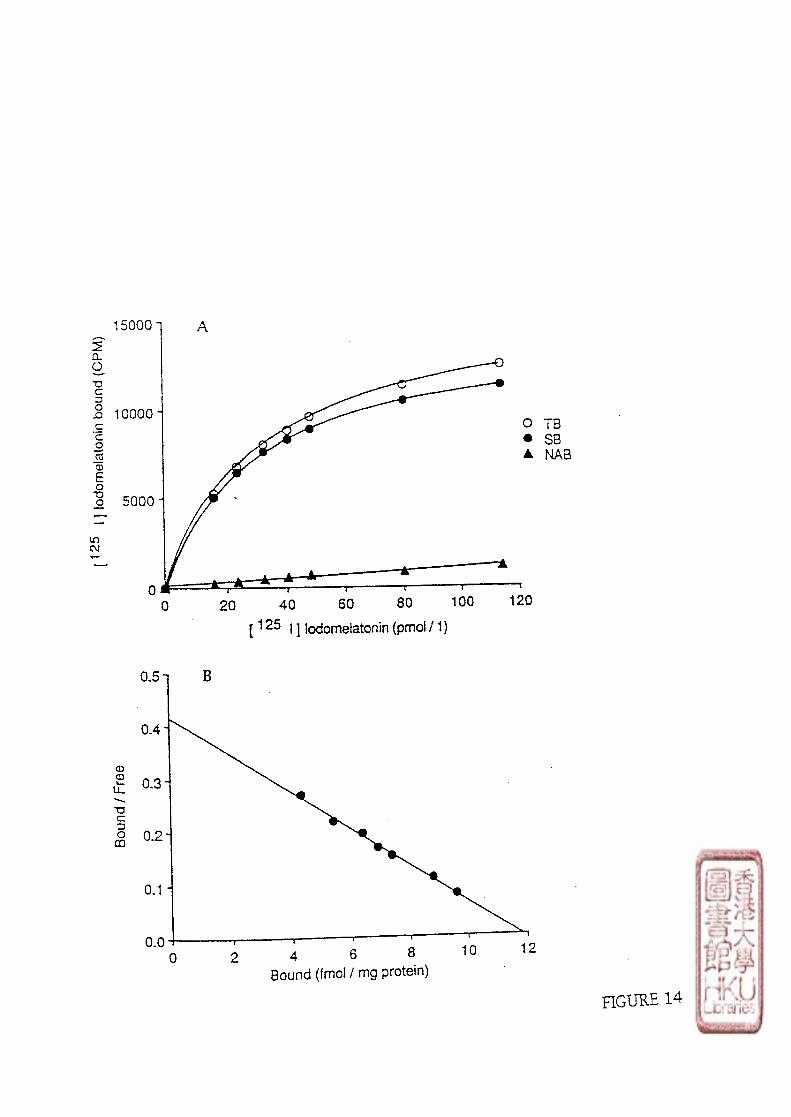
15000
10000-
5000
〇 T B SB
20 40 60 80 100 120 [ 1 2 5 | ] iodomelatonin (pmol / 1 )
Bound (fmol / mg protein)
HGUUE14

120
figure ISA. A representative experiment showing the saturation isotherm o f
[125i]iodomelatonin binding to membrane preparations from the brain of quail killed in the
middle of the light period. The membrane preparations were incubated at 4®C with
[^^Ijicxiomelatonin concentrations from 10-125 pmol/L Nonspecific binding was defined as
binding in the presence of 10 \xmo\ll melatonin. TB,total binding; SB, specific binding; NSB,
non-specific binding.
Figure 15B. A representative experiment showing Scatchard plot of the above binding data
with a dissociation constant (Kd) 24.4 pmol/1, a maximal number of binding sites (Bmax)
5.86 fmol/mg of protein and a correlation coefficient (r) 0.977. Data are means of duplicate
values from one experiment. B, bound; B/F,bound/free.

12000
10000
2 8000 -
6000
4000
2000
• NSB o SB
50 100 150 [1251]iodomelatonin (pmol/I)
Bound (fmol/mg protein)
FIGURE 15
121
Figure 16. Representative experiments showing competition curves for iaMbition of
[125i]i0<iomelatomn binding by various melatonin agonists ( ICfU .moj/i 動 10* md/l) ia
chicken (A), duck (B), pigeon (C) and quail (D) brain membrai« prejaratioim The mcinh^ne
preparations were incubated with 25.2 pmol/1 [125I3iodomelatooiii aiKl various coiKrcntrations
of melatonin (curve a , ) , 6-chioromelatonin (curve b , ) and N-acetyl-Shydroxytrypiamific
(curves c, )• Values are means of duplicates.
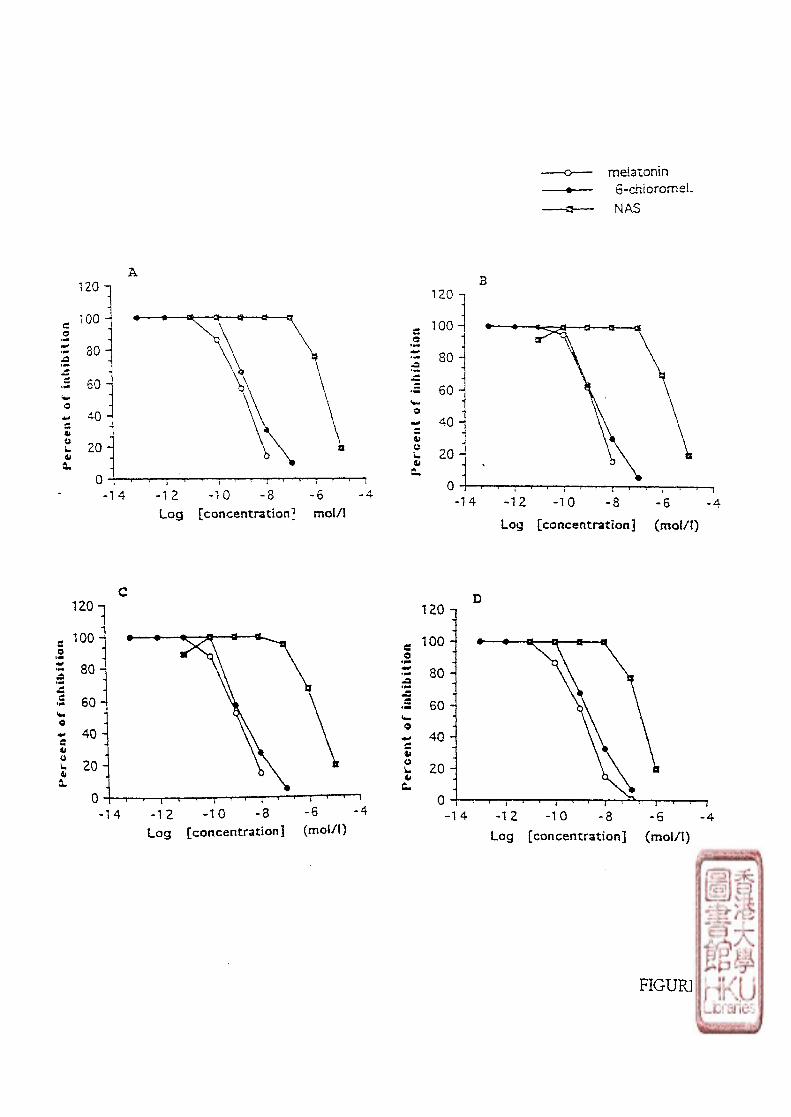
o — melatonin m 6-chioromeL a NAS
14 -12 -10 - 8 -6 - 4 ^ Log [concentration^ mol/1
-12 -10 -8 -6 Log [concentration] (moi/l)
120
1 0 0 -
60
4 0
20
-12 •10 -14 8 - 4 Log [concentration] (mol/1)
FIGURE If i
4 2 -10 - 8 - 6 Log [concentration] (moi/l)
c o • _
• M X: c Vi o c 44 o u 知 a.
c o tm
c O 4*# c 4i 0 w 由 a.
c a • _ •M* <«•* c
« * • — 0 c 4t O U <b a.

Figure 17. The representative Scatchard isotherms of [125I]iodomelatonin binding to brain
membrane preparations of chicken killed at lh,5h,9h, 13h,17h and 21h. The animals were
kept under a 12h: 12h light-dark cycle (lights on at 03(X)h). Note the lower binding capacities
of chickens killed at 2100h and OlOOh in the dark period Data are means of duplicate values
from one experiment. The dissociation constant (Kd), maximal number of binding sites
(Bmax), and 汪 correlation coefficient (r) of the above Scatchard isotherms are as following:
1 h: Kd 94.0 pmol/1, Bmax 9.8 fmol/mg protein, r 0,948.
5 h: Kd 79.9 pmol/1, Bmax 15.4 fmol/mg protein, r 0.962
9 h: Kd 70 pmol/1,Bmax 18.8 fmol/mg protein, r 0.931.
13 h: Kd 69.9 pmol/1, Bmax 2 L 0 fmol/mg protein, r 0.991
17 h: Kd 54.7 pmol/1,Bmax 18.9 fmol/mg protein, r 0.996.
21 h: Kd 90.9 pmol/1, Bmax 1 0 3 fmol/mg protein, r 0.977

OSOOh 090011 1300h
8 12 18 Bound (fmol/mg protein)
Dark Time 1700h 2 1 0 0 h OlOOh
B 12 16 Bound (fmol/mg protein)
2C/TCI90Q.
OE woloEj) osJ/TDunog
350
o
o
0
5
1
《
T2C/T uooJd 6
uj/
s9
oe
o
ealLL/
pu
no
Q
3 0 0
2 5 0
2 0 0
1 5 0
FIGURE 17
Figure 18. Time courses of [ ^I]icxlomelatonin (A) association to and (B) dissociation from
17 days old chicken embryo brain membrane preparations. Membrane preparations were
incubated with 10 pmol/1 [^2%]iodomelatonin at 37° C for the indicated time (5,10,15,20,
30,40,60,80 minutes). (A) inset,pseudo-first-order plot of the association data with an
association rate constant (ki) 5.1 X 10⁸ (LR)e,the concentration of specific
[l^Ijiodomelatonin binding at equilibrium; (LR)a, the concentration of [^^Ijiodomelatonin
binding at time t. Dissociation was initiated by addition of melatonin 1 (imol/1 and incubated
for the indicated time (5,10,15,20,30,40,60, 80 minutes). (B) inset, first-order plot of the
dissociation data with an dissociation rate constant (k_i) 2.3 X 10 -2 min - 1 . (LR)o, the
concentration of specific [^^]iodomelatomn binding just before the addition of competing
melatonin; (LR)d, the concentration of specific [125I]iodomelatomn binding at time t after
initiation of dissociation. The kinetically derived Kd value (K.1/K1/) was 45 pmol/L Data
shown are from one experiment done in duplicate.
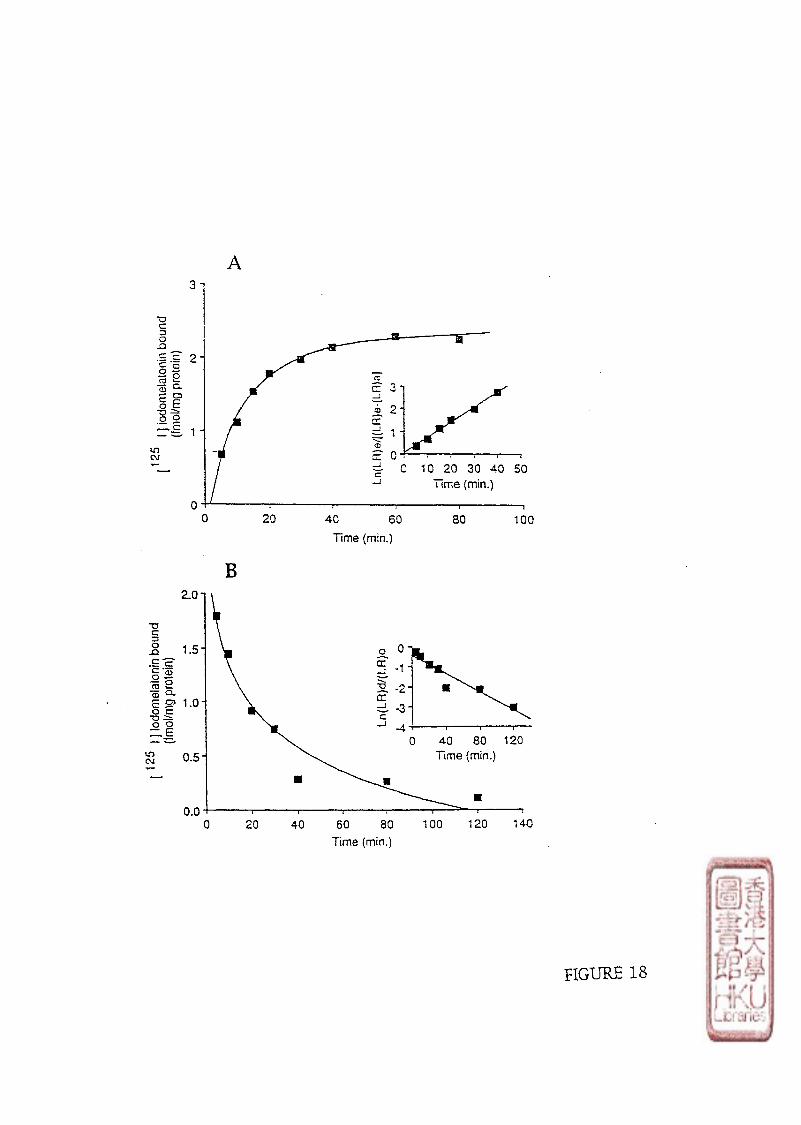
in CM "T-*
to OJ
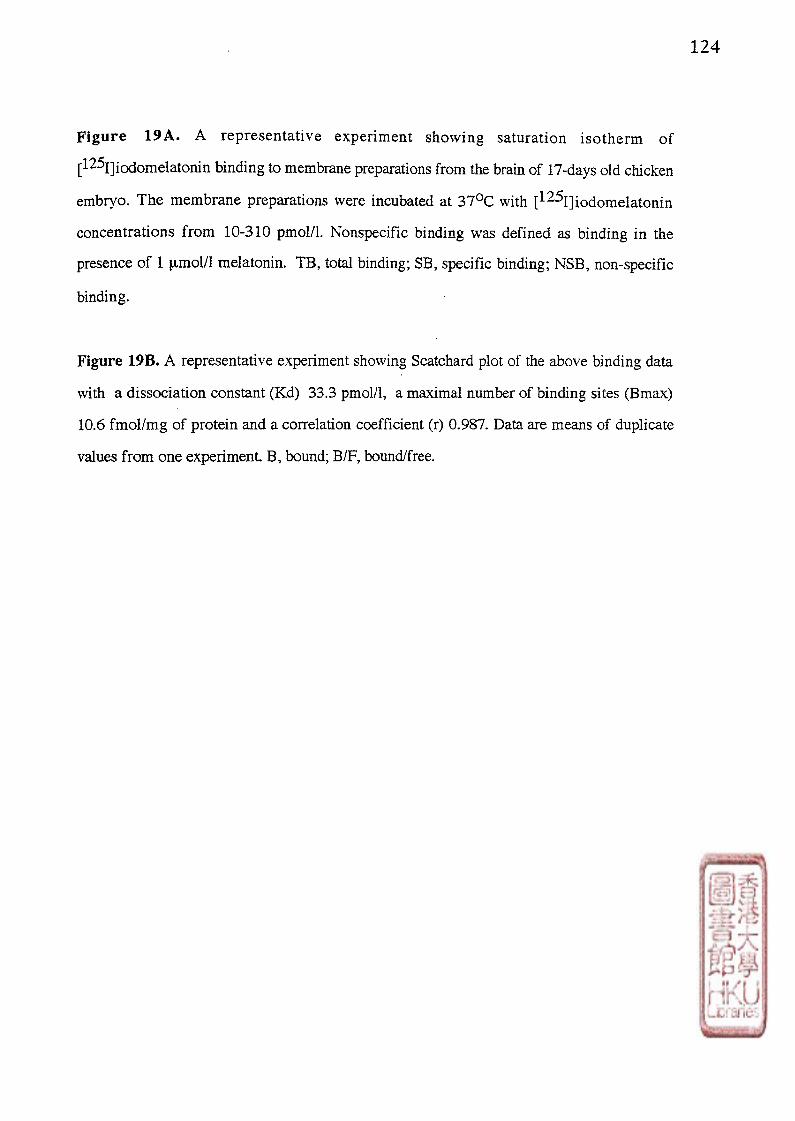
Figure 19A. A representative experiment showing saturation isotherm of
[125I]iodomelatonin binding to membrane preparations from the brain of 17-days old chicken
embryo. The membrane preparations were incubated at 37 0C with [125I]iodomelatonin
concentrations from 10-310 pmol/1. Nonspecific binding was defined as binding in the
presence of 1 [imol/1 melatonin. TB, total binding; SB, specific binding; NSB, non-specific
binding.
Figure 19B. A representative experiment showing Scatchard plot of the above binding data
with a dissociation constant (Kd) 33.3 pmol/1, a maximal number of binding sites (Bmax)
10.6 fmol/mg of protein and a correlation coefficient (r) 0.987. Data are means of duplicate
values from one experiment. B,bound; B/F,bound/free.

30000
20000
10000
100 200 300 40C
I ' 2 5 I ] Iodomelatonin (pmol/1}
u.u* 0 2 4 • 6
Bound (fmoi/mq protein)
2 OL o CO c E c
•E 〇 "c5 "a5 E o "O «9
LO OJ
CD CD v— U--a c o
CQ
• NS 〇 T B
鑤SB
FIGURE 19

125
Figure 20. Competitive inhibition curves of [125I]iodomelatonin binding in 17 days old
chicken embryo brain membrane preparations by various melatonin analogues (ICT12 mol/1 to
10"5 mol/1). The membrane preparations were incubated with 15.2 pmol/1 [ 125I]iodomelatonin
and various concentrations of melatonin, 6-chloromelatonin (6-chloromeL) and N-acetyl-5-
hydroxytryptamine (NAS). Values are means of duplicates.

120 n
c 100 -o “
| 80 : •i* • j S -
•S 6 0 -v* o -•v 4 0 攀 c 由 0 “ 1 20 _ 由 •
^ 0:_ . 1
FIGURE 20

126
Figure 21. Development of [125I]iodomelatonin binding sites (expressed fmol/mg protein)
in chicken brain at the ages of embryonic day 13,17; posthatch day 1,7,20, 40; and 6
months old, 12 irionths old chicken. Data are means of S.E.M of 4 animals. The statistics are
shown in Table 19.
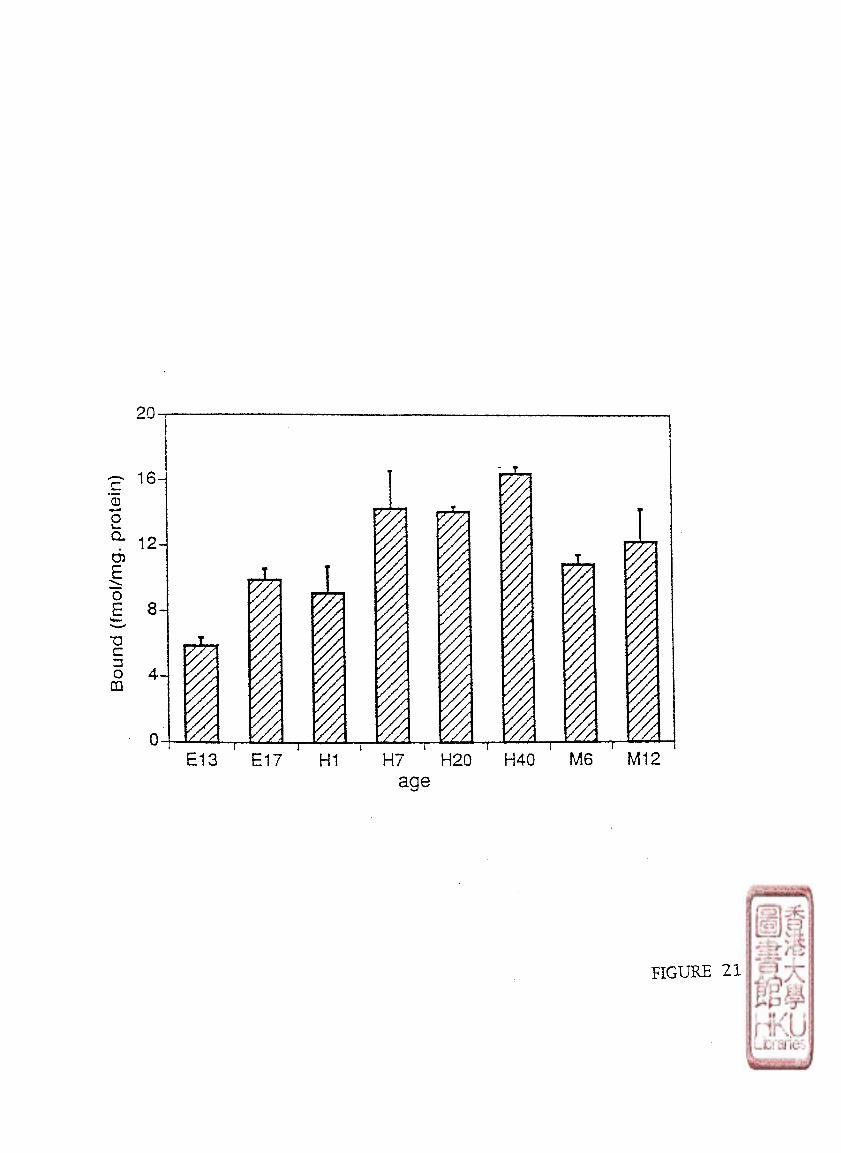
FIGURE 21

127
Figure 22. Development of the affinity of [125I]iodomelatomn binding sites in the chicken
brain at the ages of embryonic day 13,17; posthatch day 1,7,20,40; and 6 months old,12
months old chicken. Kd (pmol/l) values are means (土 S.E.M) of 4 animals. The statistics are
shown in Table 19.
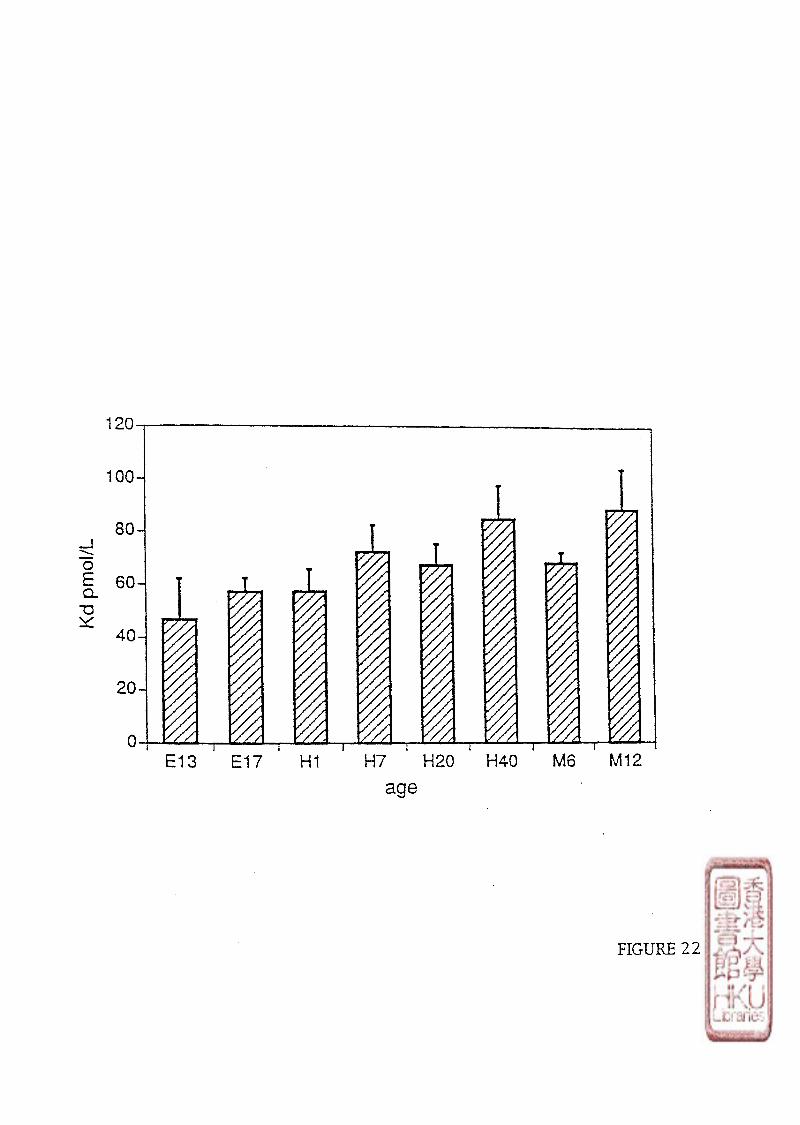
20.
00.
8 0
6 0
4 0
20 J/IO
Ed
§
FIGURE 22

128
Figure 23. Ontogeny of the diumal variation of [^^I]iodomelatonin binding capacity in the
chicken brains of indicated ages measured by Scatchard analysis. Values are means (± S.E.M)
of 4 animals. The differences of ML vs MD binding within the same age group were analysized
by one way analysis of variance and student's t-test. *p<0.05.
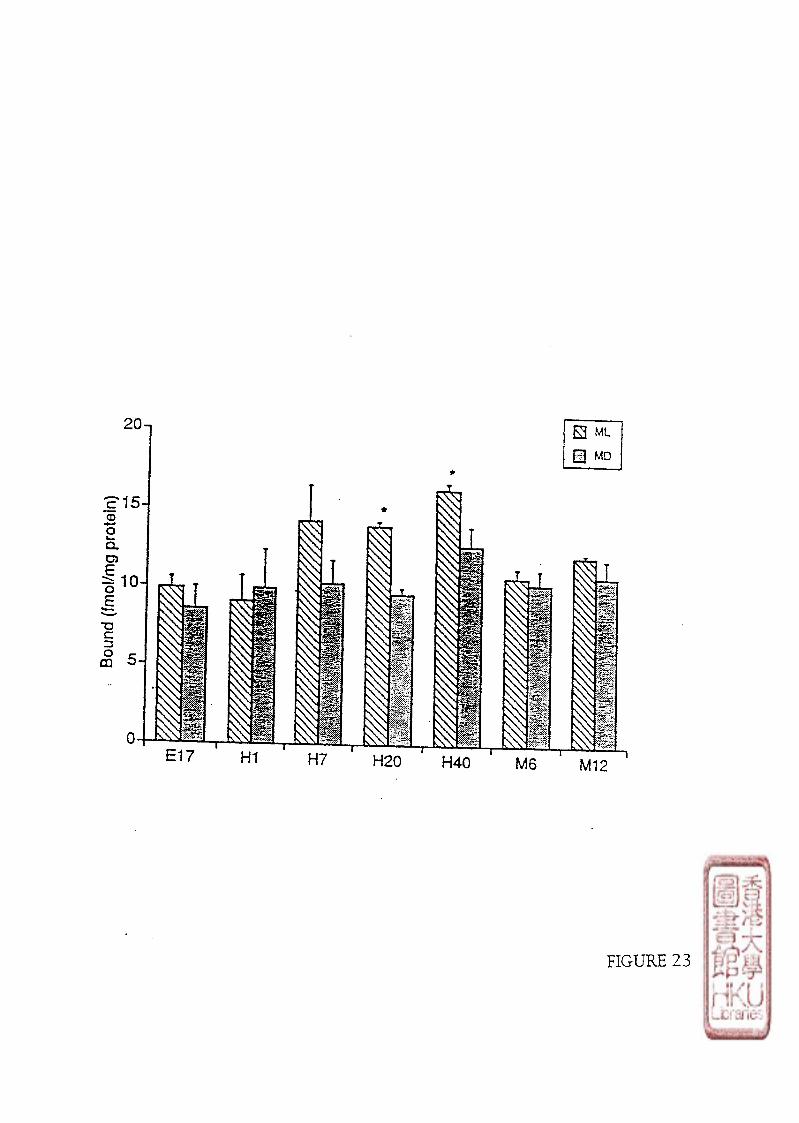
爾
1
1
cjeoJdD5JJ)
pu
no
m
FIGURE 23

129
Figure 24. A representative experiment showing the effect of GTPyS (ICT5 mol/1) on the
[125I]iodomelatonm binding to membrane preparations from the brain of 18-days old chicken
embryos. The membrane preparations were incubated at 25° C for 1 h with
[12^I]iodomelatonin concentrations ranging from 10-310 pmol/L Nonspecific binding was
defined as binding in the presence of 1 [xmol/1 melatonin. Scatchard plots of the binding data
was linear. It was demonstrated that the GTPyS (10"5 mol/1) decreased the Bmax from 10.7
fmol/mg protein to 5.9 fmol/mg protein without changing the Kd values. Data are means of
duplicate values from one experiment
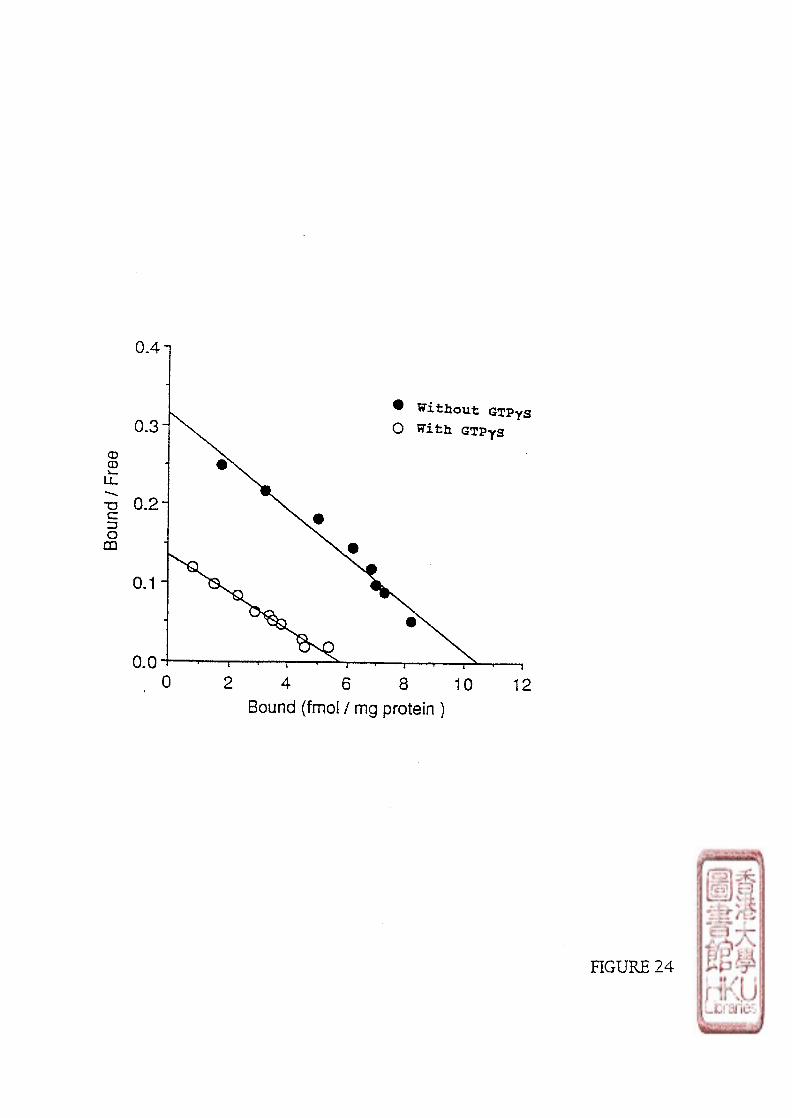
0.4-1
Without GTPyS GTPyS
iLJL/
pu
no
m
ao
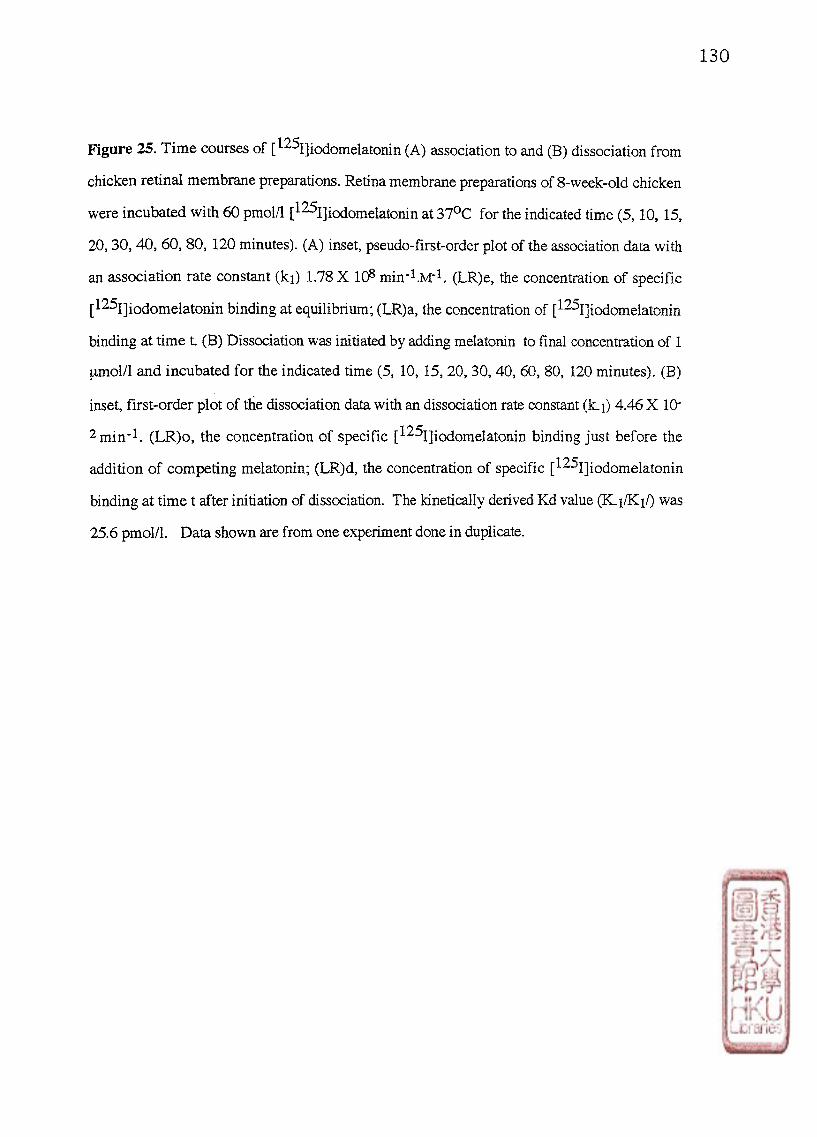
130
Figure 25, Time courses of [ i o d o m e l a t o n i n (A) association to and (B) dissociation from
chicken retinal membrane preparations. Retina membrane preparations of 8-week-old chicken
were incubated with 60 pmol/1 [ ^1] iodomelatonin at 370C for the indicated time (5,10,15,
20, 30, 40,60,80,120 minutes). (A) inset, pseudo-first-order plot of the association data with
an association rate constant (ki) 1.78 X 10⁸ (LR)e,the concentration of specific
[12^I]iodomelatonin binding at equilibrium; (LR)a, the concentration of [125I]icxiomelatomn
binding at time t (B) Dissociation was initiated by adding melatonin to final concentration of 1
pmol/l and incubated for the indicated time (5,10,15,20,30,40,60, 80,120 minutes). (B)
inset, first-order plot of the dissociation data with an dissociation rate constant (k-i) 4.46 X l O
2 min"1. (LR)o, the concentration of specific [^^^1]iodomelatonin binding just before the
addition of competing melatonin; (LR)d,the concentration of specific [^^1]iodomelatonin
binding at time t after initiation of dissociation. The kinetically derived Kd value (Ki/Ki/) was
25.6 pmol/L Data shown are from one experiment done in duplicate.

20 40 60 Time (min.)
8 0 10C
80 120 (min.)
20 40 60 Time (min.)
80 100 120
旦o-| -2*
-4-
5 -6-
*a
L c © B o
i f o •go 一 c
t n CM
£* - j 主 cc j §
cc ci
5 -cooaa J oue
XJunoq
UC-0«I91U0T30I
一
一
gca产
FIGURE 25

131
F i gu re 26A . A representative experiment showing saturation isotherm of
j-^SjjjiQdomelatonin binding to membrane preparations from the retina of B-week-old chicken
killed in the middle of the light period. Membrane preparations were incubated at 31°。with
[125i]i0do melatomn concentrations ranging from 16-607 pmol/L Nonspecific binding was
defined as binding in the presence of 1 jxmol/1 melatonin. TB,total binding; SB, specific
binding; MSB, non-specific binding.
j r jgure 26B. A representative experiment showing Scatchard plot of the above binding data
with a dissociation constant (Kd) 421.9 pmol/1, a maximal number of binding sites (Bmax)
6 L 9 f m o l / m g of protein and a correlation coefficient (r) 0.972. Data are means of duplicate
values from one experiment B,bound; B/F, bound/free.

80000 1
200 r 125
4 0 0 6 0 0
1 ] Iodomelatonin (pmol /1)
60000
40000
20000
SB TB NSB
800
• < -—i i— »—* 1 1 0
2 0 3 0 4 0 5 0 6 0
Bound (fmol / mg protein)
P IGUiyE26
<D £ i t T3 C ZJ o QQ
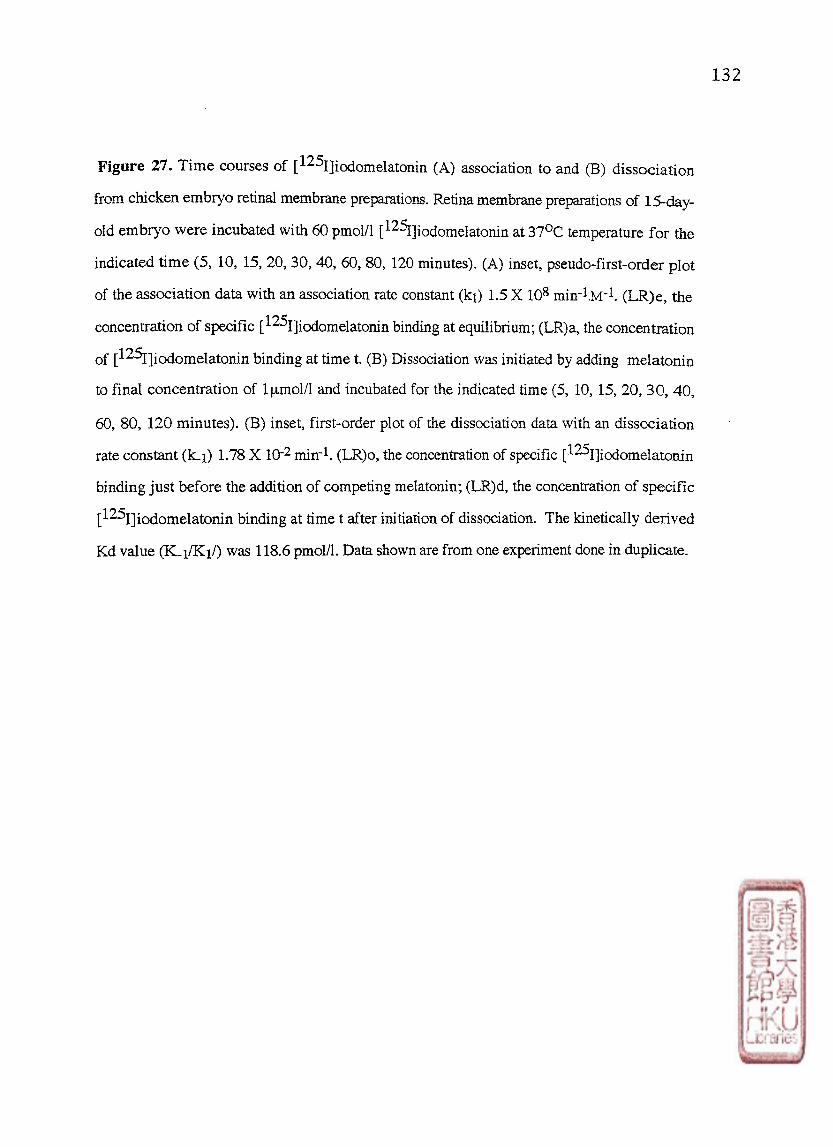
Figure 27. Time courses of [125I]iodomelatonin (A) association to and (B) dissociation
from chicken embryo retinal membrane preparations. Retina membrane preparations of ISday-
old embryo were incubated with 60 pmol/1 [125I]iodomelatonin at 370C temperature for the
indicated time (5,10,15,20,30,40,60, 80,120 minutes). (A) inset, pseudo-first-order plot
of the association data with an association rate constant (ki) 1.5 X 10⁸ (LR)e, the
concentration of specific [^^I]iodomelatonin binding at equilibrium; (LR)a, the concentration
of [•'•^Iliodomelatomn binding at time t. (B) Dissociation was initiated by adding melatonin
to final concentration of l|imol/l and incubated for the indicated time (5,10, 15,20,30,40,
60,80,120 minutes). (B) inset, first-order plot of the dissociation data with an dissociation
rate constant (k-i) 1.78 X 10⁻² min"1. (LR)o, the concentration of specific [-'•^^icxiomelatomn
binding just before the addition of competing melatonin; (LR)d, the concentration of specific
[ i o d o m e l a t o n i n binding at time t after initiation of dissociation. The kinetically derived
Kd value (K.i/Ki/) was 118.6 pmol/L Data shown are from one experiment done in duplicate.

Z4 i
20 40 60 80 100 Time (min.)
0 10 20 30 40 50 Time (min.)
U.U 0 20 40 60 80 100 120 140
Time (min.)
FIGURE 27
£ * •
5 ‘
"D =3
-S
O® 3 2 CD Q .
231 Jc to 04
s 主 s
^
8'
6'
4;
2 CvJ
1
1
1
《U
j0ojd B
JOEJ)
punoqcco
一iseEOPO
二 I
gOJ-1

133
Figure 28A. A representative experiment showing saturation isotherm o f
[l^Sijiodomelatonin binding to membrane preparations from the retina of 15-day-old embryos.
The membrane preparations were incubated at370C with [^^Ijicxiomelatoiiin concentrations
ranging from 16-620 pmol/L Nonspecific binding was defined as binding in the presence of 1
melatonin. TB,total binding; SB, specific binding; NSB, non-specific binding.
Figure 28B. A representative experiment showing Scatchard plot of the above binding data
with a dissociation constant (Kd) 77.7 pmd/1,a maximal number of binding sites (Bmax)
10.94 fmol/mg of protein and a correlation coefficient (r) 0.918. Data are means of duplicate
values from one experiment. B,bound; B/F, bound/free.
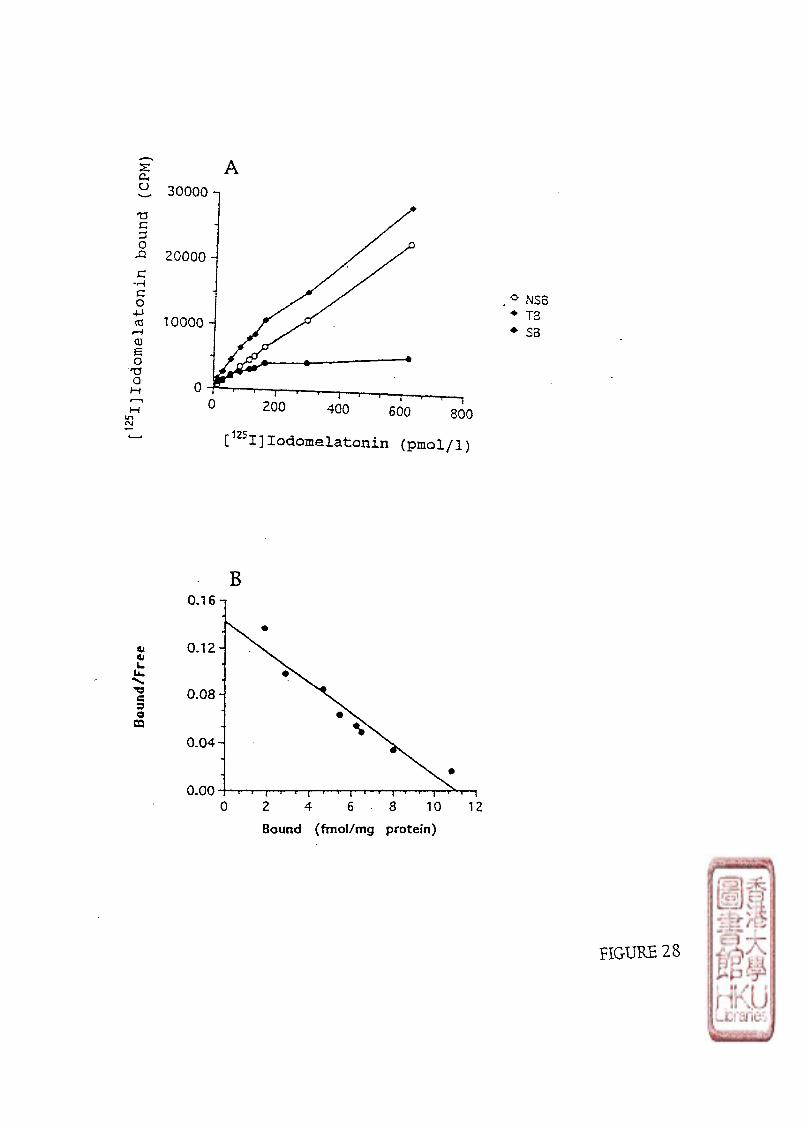
20000
10000
NSB 丁 B SB
200 400 600 800
[ 1 2 S I ] I o d o m e l a t o n i n ( pmo l /1 )
0,16-r
0,12
0.08
0 .04
0.00 10 12
Bound (fmol/mg protein)
FIGURE 28
XI c *H c o 4J OS rH 0) H O TS O M r-™i M
t A CM
««1
44 由 L. U. "S. Tf C s> o
CQ
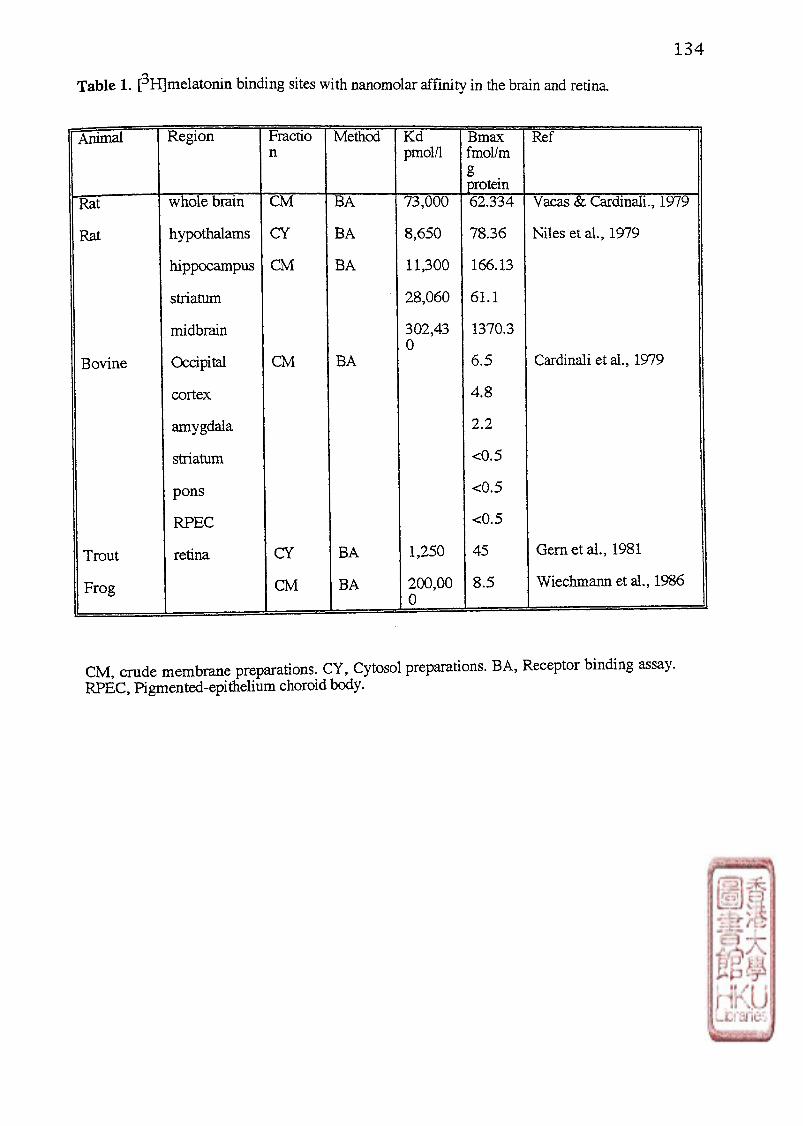
134
Table 1. [3H]melatonin binding sites with nanomolar affinity in the brain and retina.
Animal Region Fractio n
Method K d pmol/1
Bmax fmol/m g protein
Ref
Rat whole brain C M B A 73,000 62.334 Vacas & Cardinali., 1979
Rat hypothalams CY B A 8,650 78.36 Niles et al.,1979
hippocampus CM BA 11,300 166.13
striatum 28,060 61.1
midbrain 302,43 1370.3
Bovine Occipital CM BA u
6.5 Cardinali et al., 1979
cortex 4 .8
amygdala 2.2
striatum <0.5
pons <0.5
RPEC <0.5
Trout retina CY BA 1,250 45 Gem et al., 1981
Frog CM BA 200,00 0
8 .5 Wiechmann et al” 1986
CM, crude membrane preparations. CY,Cytosol preparations. BA, Receptor binding assay. RPEC, Rgmented-epithelium choroid body.
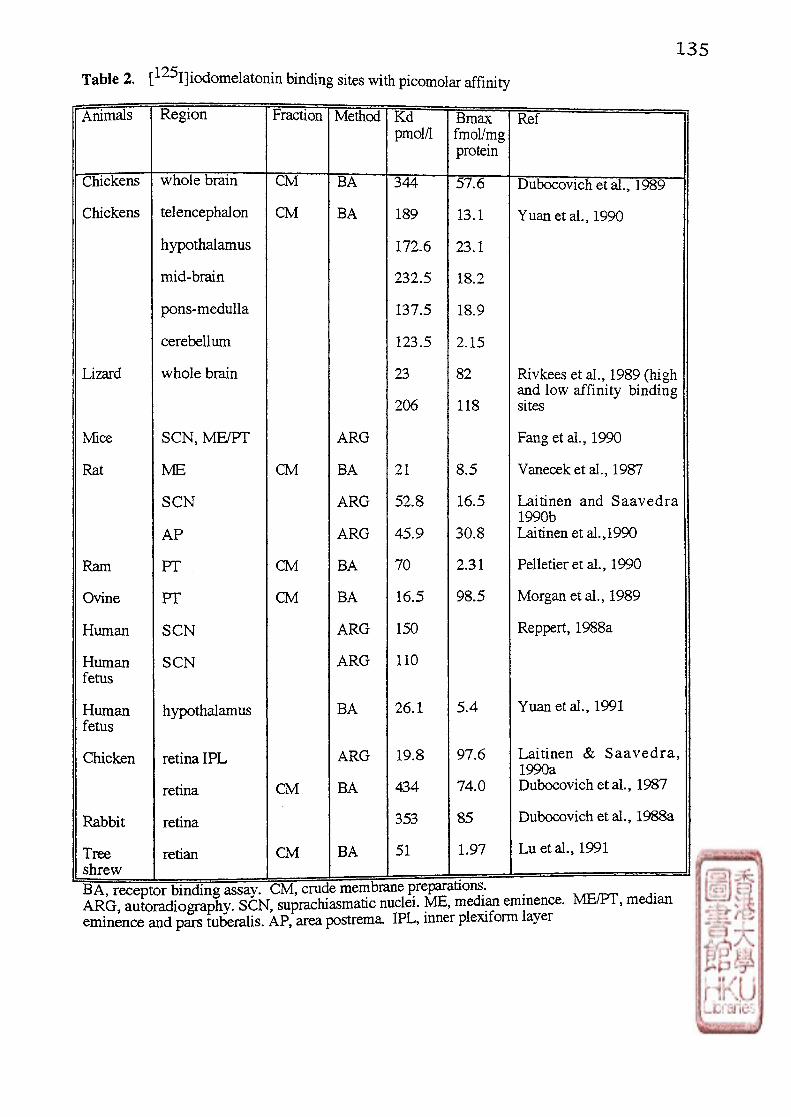
135
Animals Region Fraction Method Kd pmol/1
Bmax fmol/mg protein
Ref
Chickens whole brain CM BA 344 57.6 Dubocovich et al.,1989
Chickens telencephalon
hypothalamus
mid-brain
pons-medulla
cerebellum
CM BA 189
172.6
232.5
137.5
123.5
13.1
23.1
18.2
18.9
2.15
Yuan etal., 1990
Lizard whole brain 23
206
82
118
Rivkees et aL, 1989 (high and low affinity binding sites
Mice SCN, ME/PT ARG Fang et al,1990
Rat ME CM BA 21 8.5 Vanecek et al., 1987
SCN
A P
ARG
ARG
52.8
45.9
16.5
30.8
Laitinen and Saavedra 1990b Laitinen et al.J990
Ram PT CM BA 70 2.31 Pelletier et al” 1990
Ovine PT CM BA 16.5 98.5 Morgan et al., 1989
Human SCN ARG 150 Reppert, 1988a
Human fetus
SCN ARG 110
Human fetus
hypothalamus BA 26.1 5.4 Yuan etal.,1991
Chicken retina IPL ARG 19.8 97.6 Laitinen & Saaved r a , IQOOa
retina CM BA 434 74.0 Dubocovich et al.,1987
Rabbit retina 353 85 Dubocovich et al., 1988a
Tree shrew
retian CM BA 51 1.97 Lu et al., 1991
Ovine
Human
Human fetus
Human fetus
Chicken
Rabbit
Tree shrew
SCN
A P
SCN
SCN
hypothalamus
retina IPL
retina
retina
retian
Method
BA
ARG
ARG
BA
BA
ARG
ARG
BA
ARG
BA
BA
Kd pmol/1
344
189
172.6
232.5
137.5
123.5
23
206
21
52.8
45.9
70
16.5
150
110
26.1
19.8
434
353
51
Bmax fmol/mg protein
57.6
13.1
23.1
18.2
18.9
2.15
82
118
8.5
16.5
30.8
2.31
98.5
5.4
97.6
74.0
85
1.97
Ref
Dubocovich et al.,1989
Yuan etal.,1990
Rivkees et aL, 1989 (high and low affinity binding sites
Fang et al,1990
Vanecek et al., 1987
Laitinen and Saavedra 1990b Laitinen et al.J990
Pelletier et al” 1990
Morgan et al., 1989
Reppert, 1988a
Yuan etal.,1991
Laitinen & Saavedra . 1990a Dubocovich et al.,1987
Dubocovich et al., 1988a
Lu et al., 1991
BA, receptor binding assay. CM, crude membrane preparatioi^i. A . ARG, autoradiography. SCN,supmchiasmatic nuclei. ME, median eminence. ME/PT,median eminence and pars tuberalis. AP, area postrema. IPL, inner plexiform layer
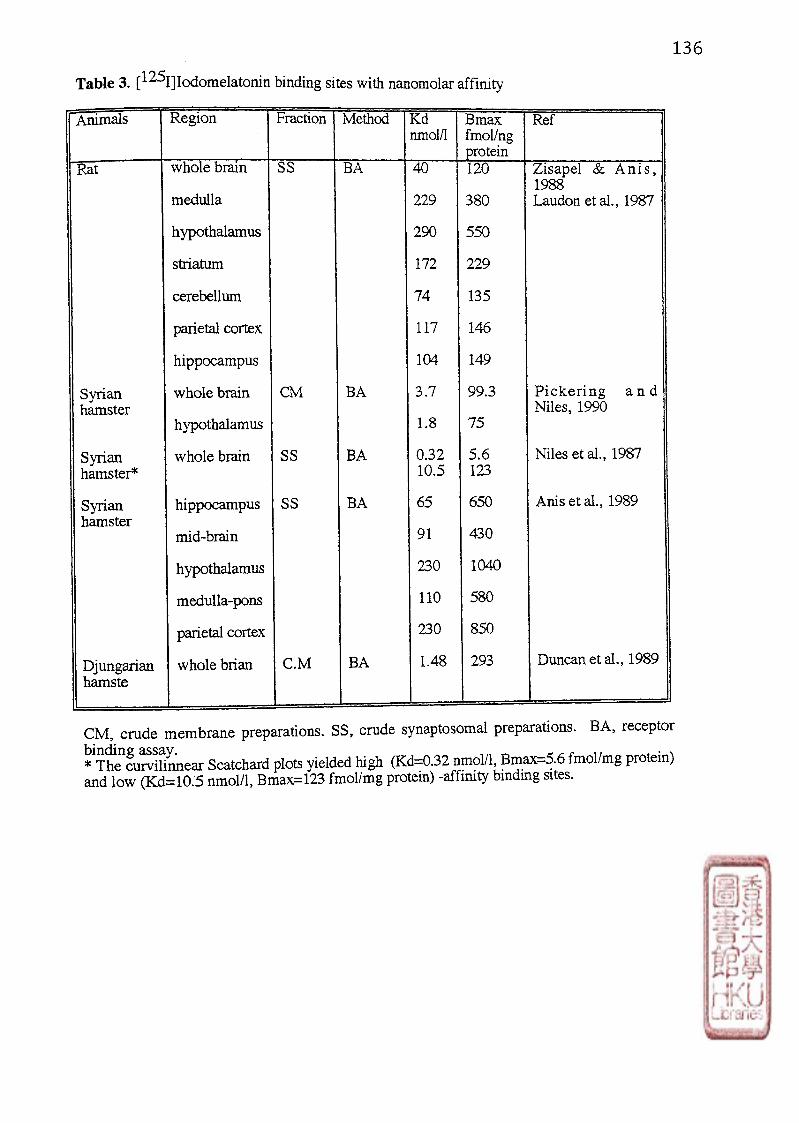
Table 3. ^1]Iodomelatonin binding sites with nanomolar affinity
136
Animals Region Fraction Method Kd nmol/l
Bmax {moling protein
Ref
Rat whole brain
medulla
SS BA 40
229
120
380
Zisapel & A n i s , 1988 Laudon et al., 1987
hypothalamus 290 550
striatum 172 229
cerebellum 74 135
parietal cortex 117 146
hippocampus 104 149
Syrian hamster
whole brain
hypothalamus
CM BA 3.7
1.8
99.3
7 5
P icke r ing a n d Niles, 1990
Syrian hamster*
whole brain SS BA 0.32 10.5
5.6 123
Niles etal., 1987
Syrian hamster
hippocampus
mid-brain
hypothalamus
medulla-pons
SS BA 65
91
230
110
650
430
1040
580
Anis et al., 1989
Djungarian hamste
parietal cortex
whole brian C.M BA
230
1.48
850
293 Duncan et al., 1989
CM,crude membrane preparations. SS, crude synaptosomal preparations. BA,receptor
* T h ^ L ^ i l i n n e a r Scatchard plots yielded high (Kd=0.32 nmol/1, Bmax=5.6 fmol/mg protein) and low (Kd=10.5 nmol/1,Bmax=123 fmol/mg protein) -affinity binding sites.

137
Table 4. The comparison of the binding property of [ ^]icxiomelatonin separated by TLC
and HPLC
TLC
HPLC
Binding with antiserum
(1: 3000 dilution)
T NSB SB B%
5009 309 1047 20.9
4260 108 2569 60.3
Binding with chick brain membrane
preparations (protein 300 [ig/tube)
T NSB SB B%
5009 20 513 10.2
4260 52 1418 33.3
The binding studies were carried out at 40C incubation for 5 hours. Melatonin antiserum
(1:3000 dilution) o r chicken brain membrane preparations 300 \ig/tube) were incubated with
[1 巧I]iodomelatonin . The data show the means of duplicate (cpm). T, total count. NSB,
nonspecific binding. SB, specific binding. B%9 percent of specific binding/total count
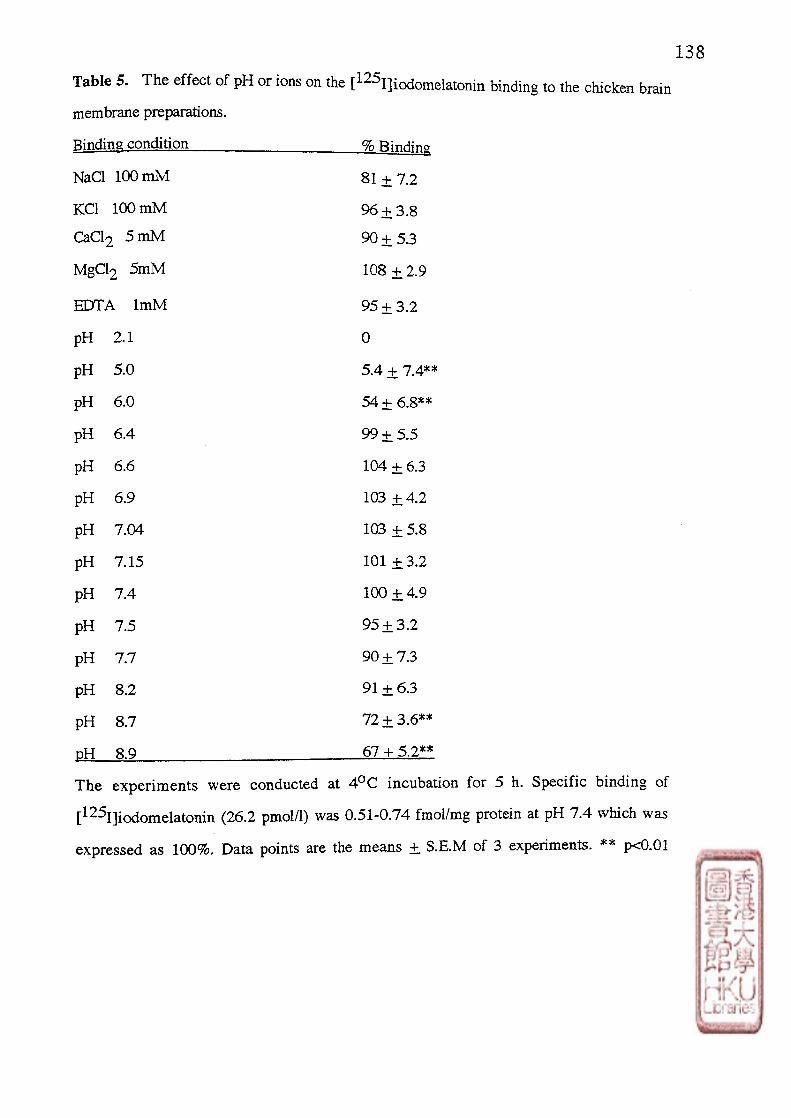
Table 5 . The effect of pH or ions on the [1 2 5
I] iodomelatonin binding to the chicken brain
membrane preparations.
Rinding condition
NaCl 100 m M
KC1 100 m M
CaCl2 5 m M
MgCl 2 5 m M
EDTA I m M
pH 2.1
pH 5.0
pH 6.0
pH 6.4
pH 6.6
pH 6.9
pH 7.04
pH 7.15
p H 7 .4
pH 7 .5
pH 7.7
pH 8.2
pH 8.7
PH 8.9
% Binding
8 1 土 7 . 2
9 6 + 3 .8
9 0 + 5 3
1 0 8 土 2 . 9
9 5 + 3 .2
0
5.4 土 7 . 4 ”
5 4 土 6.8**
9 9 + 5 . 5
104 + 6.3
103 ± 4 . 2
103 土 5.8
101 ± 3 . 2
100 + 4 9
9 5 ± 3 . 2
9 0 ± 7 3
91 ± 6.3
72 土 3 . 6 #
67 + 5.2**
T h e experiments were conducted at 40C incubation for 5 h. Specific binding of
[1 2 5
I ] iodomela tonin (26.2 pmol/1) was 0.51-0.74 fmol/mg protein at pH 7 . 4 which was
expressed a s 100%. Data points are the means + S.E.M of 3 experiments. ** pcO.Ol
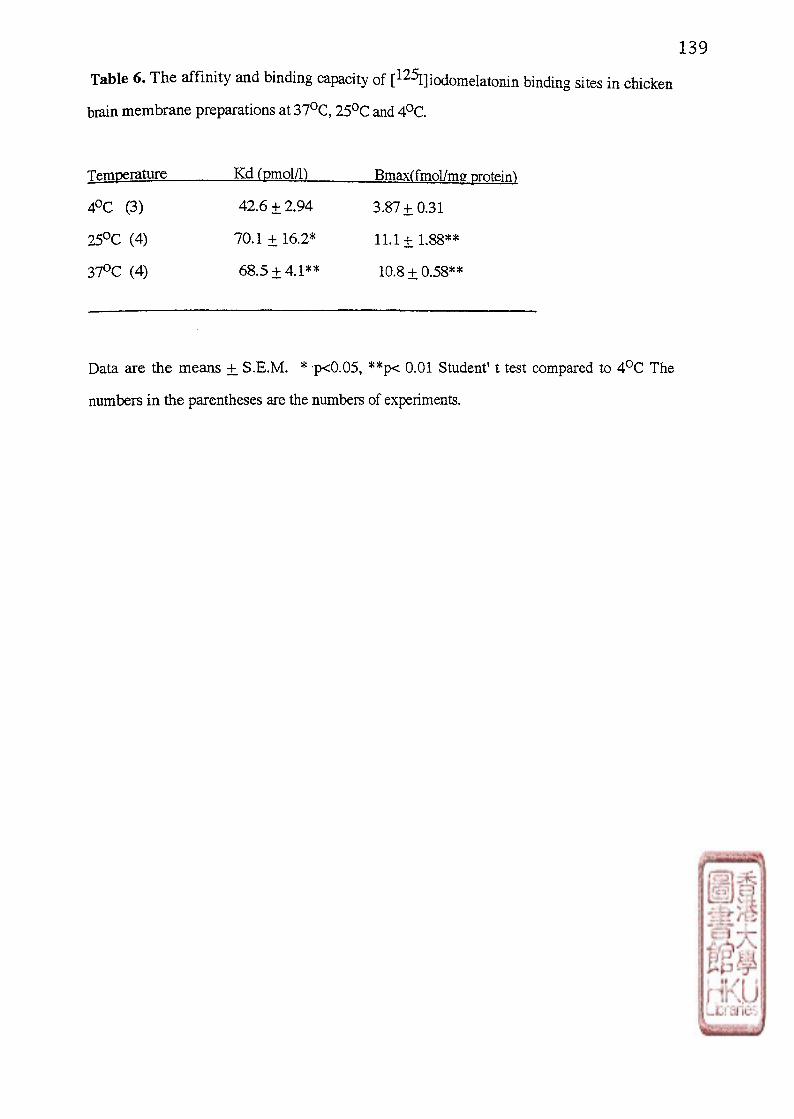
139
Table 6. The affinity and binding capacity of [1 2 5
I]iodomelatonin binding sites in chicken
brain membrane preparations at 370C, 25
0C and 4
0C.
Temperature Kd (pmol/D Bmax(fmol/mg protein、
40C (3) 42.6 土 2.94 3.87 土 0 3 1
250C (4) 70.1 土 16.2* 11.1 土 1.88**
370C (4) 68.5 土 41** 10.8 土 0.58朱*
Data are the means 土 S.E.M. * ’p<0,05,**p< 0.01 Student't test compared to 40C The
numbers in the parentheses are the numbers of experiments.
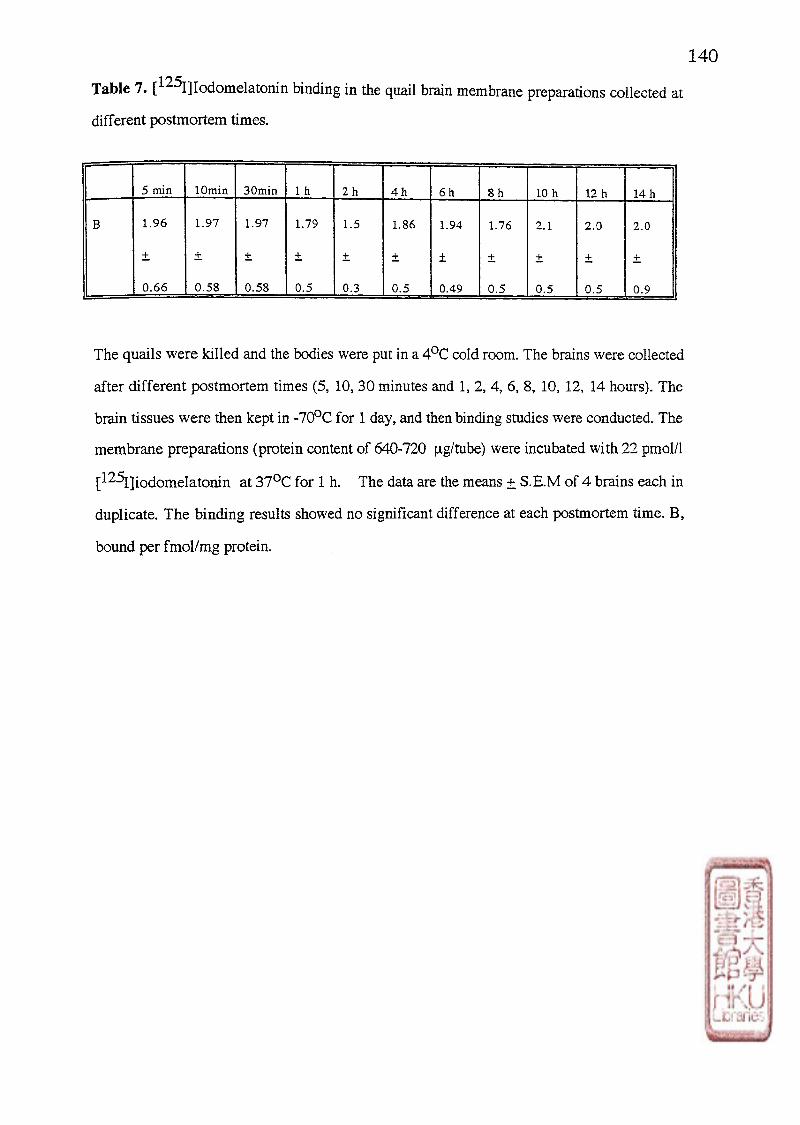
140
Table 7 . [-‘-Iodomelatonin binding in the quail brain membrane preparations collected at
different postmortem times.
5 min lOmin 30min 1 h 2 h 4 h 6 h 8 h 10 h 12 h 14 h
B 1.96
+
1.97
+
1.97
+
1.79
+
1.5
u.
1.86
丄
1.94
i
1.76 2.1 2.0 2.0
0.66 0.58 0.58 0.5
iT
0.3
十
0.5 0.49 0.5 0.5 0.5
+
0.9
The quails were killed and the bodies were put in a 40C cold room. The brains were collected
after different postmortem times (5,10,30 minutes and 1,2, 4,6,8,10,12,14 hours). The
brain tissues were then kept in -70oC for 1 day, and then binding studies were conducted. The
membrane preparations (protein content of 640-720 |ig/tube) were incubated with 22 pmol/1
[125i]iodomelatonin at 3 70C for 1 h. The data are the means + S.E.M of 4 brains each in
duplicate. The binding results showed no significant difference at each postmortem time. B,
bound per fmol/mg protein.
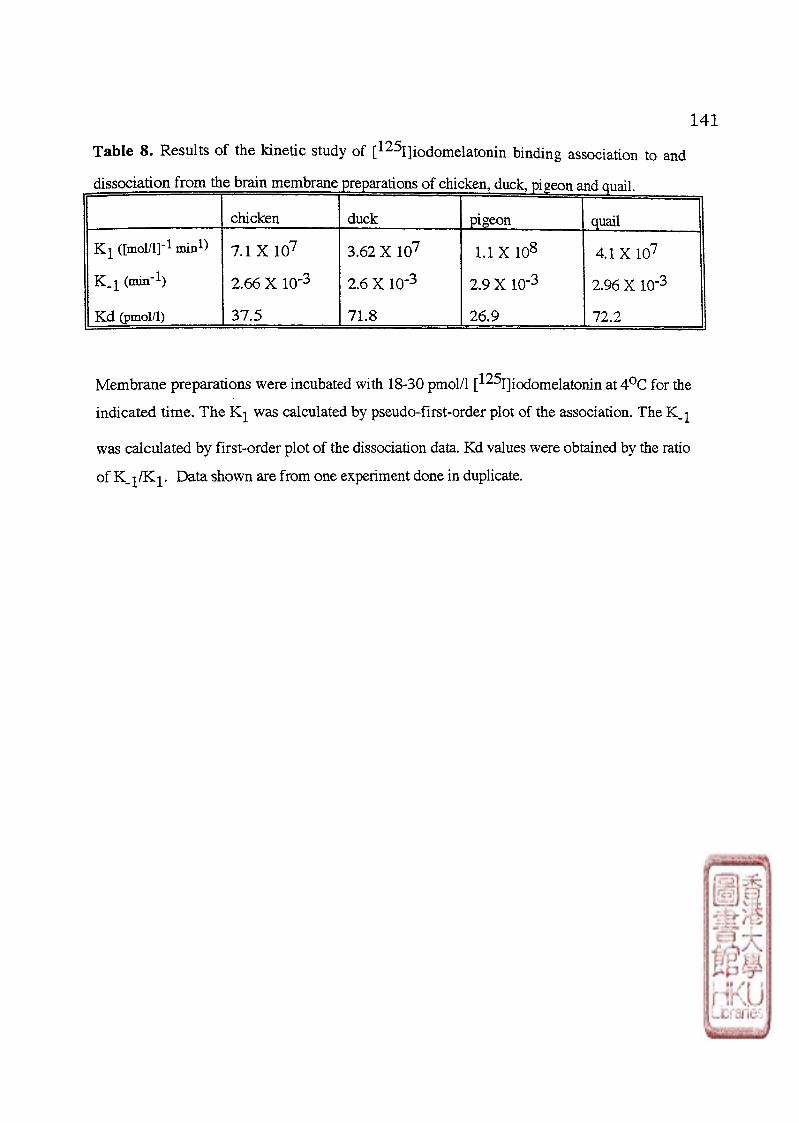
141
Table 8. Results of the kinetic study of [1 2 5
I] iodomelatonin binding association to and
dissociation from the brain membrane preparations of chicken,duck,pigeon and quail
chicken duck pigeon
JilXJL
quail
K | ([mol/1]"1 min
1)
K _ i (min"1)
K d (pmol/1)
7.1 X 1 07
2.66 X 10"3
37 .5
3.62 X 1 07
2.6 X 10⁻³
71.8
1.1 X 10⁸
2.9 X 10 '3
26.9
4.1 X 10⁷
2.96 X lO"3
72.2
Membrane preparations were incubated with 18-30 pmol/1 [l^I]iodomelatonin at 40C for the
indicated time. The was calculated by pseudofirst-order plot of the association. The
was calculated by first-order plot of the dissociation data. Kd values were obtained by the ratio
of Data shown are from one experiment done in duplicate.

142
Table 9. [ 1 2 5I ] iodomela tonin binding capacity and affinity in chicken, duck, pigeon,quail
brain membrane preparations.
chicken quail pigeon duck
Bmax (fmol/mg
protein)
Kd (pmol/1)
3 .87 + 0.13
42.6 ± 2.95
5,6 土 0.34
42.2 土 16
6.65 ± 0.54
50.6 ± 15
10 .4+1 .8
30 ± 2 3
Data are the means 土 S.E.M of 4 animals killed in the middle of the light period. Membrane
preparations were incubated at 40C with [ ^Ijiodomelatonin concentrations from 5-120
pmol/1 fo r 5 h . Nonspecific binding was defined as binding in the presence of 10 ixmol/l
melatonin.
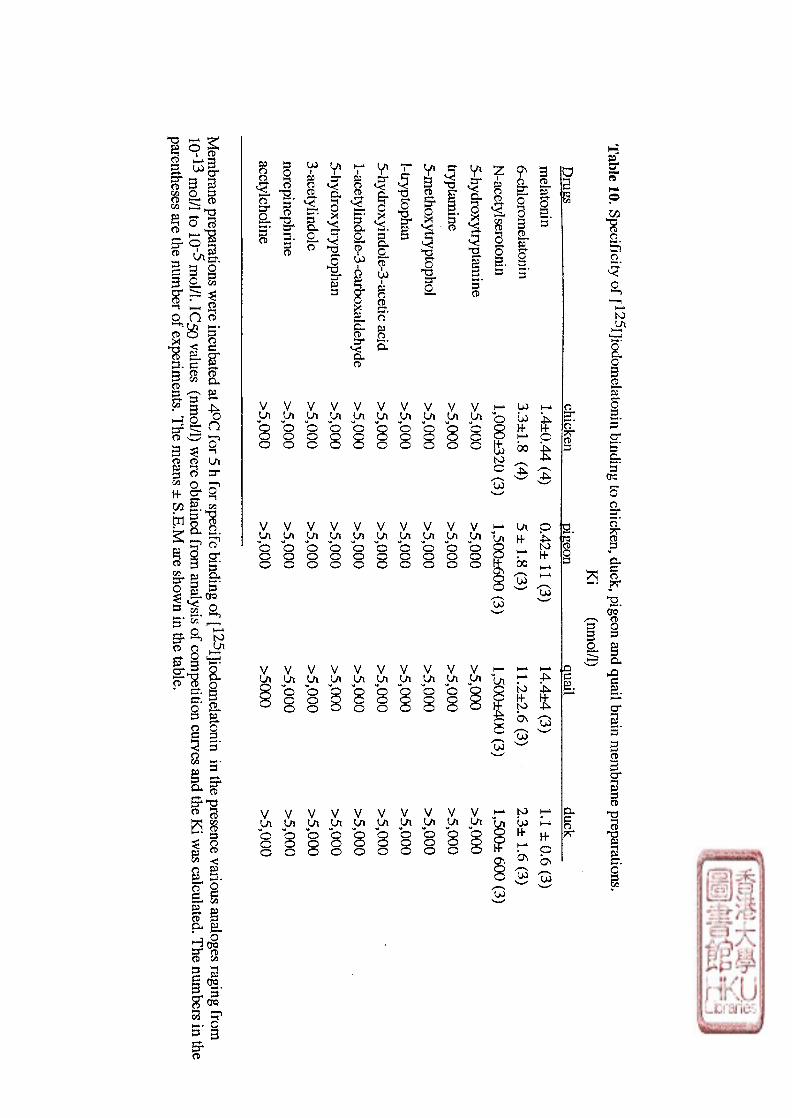
Table 10.
Specificity
of【lboutIJiodom
elatonin binding
to chicken, duck, pig
eon and
quail b
rain m
embran
e preparations.
Ki
(nm
oi/1)
Drugs
chicken
pigeon
quail
duck
selatonin
6-chloromelatoB
.n
N-acetylserotonin
5-hydroxytryptamine
tryptam
ine
5-3
ethoxytry
pto
phol
1
丨 tryptophan
5-h
ydro
xyin
dole
丨3la
cetic
acid
1
丨 acetyJindole-3-carboxaldehyde 5-hydroxytryptophan
3-acetylindole
norep
inep
hrin
e
acetylcholine
L4±0.4
4 (4
)
33
±1
00
(4
)
looo±320 (3
)
V5000
V5000
V5000
V5000
V5000
>5,0
00
>5,0
00
V5000
>5000
V5000
P42±
11 (3
)
5±
L8 (3
)
1,5
00±§
(3)
V5000
V5000
V5000
>5,0
00
V5000
V5000
>5000
>5,0
00
>5,0
00
>5,0
00
14.4
±4
(3)
1L
2±2.6
s
1,5
00±400
(3)
V5,§
V5000
>5,0
00
V5000
>5,0
00
V5000
V5,§
>5,0
00
V5000
V5§
LI
±
P6
(3)
2.3
± L
6 (3
)
1,500±
§ s
V5000
>5,0
00
>5,0
00
V5000
>5,0
00
V5000
V5000
>5,0
00
V5000
V5000
Mem
bran
e preparations w
ere incubated at
40c fo
r 5 h
for
specifc bindinOQ
o『【
1255Romelaonin in
the presence
various
目E-oges raginoo
^33
10—
G30S&s.u 301/1.
IC50
values (nm
oyl) w
ere obtained from
analysis of co
mpetitio
n curves and the K
i was
calculated. T
he num
bers in the
parentheses are
the n
um
ber
of experim
ents. T
he
meanDQ.
屮 gmse.0 show
n in
the
table.

143 Table 11. Regional distribution of [
1 2 5I]iodomelatonin binding in the brain of chicken and
pigeon.
chicken** pigeon*
Bmax Kd B
Resion ffmol/ms protein) Cpmol/D Cfmol/ms protein)
Telencephalon 2.5 土 0.42 52.4 土 18 1.04 + 0.1
Hypothalamus 6.65 土 1.8 38.4 ± 3 3.1 土 0.11
Mid-brain 5.15 ± 0 . 95 59.6 土 0.1 1.78 土0.11
Pons-medulla 4.89 ±0 . 01 56.1 ±11 .4 1.56 ± 0 . 1
Cerebellum 0.39 + 0.035 31 .4+16 0.59 + 0.013
"Regiona l distribution of [^^I]iodomelatomn binding in membrane preparations from brain
of chicken. Values are means 土 S.E.M of Maximal number of binding sites (Bmax) and
dissociation constants (Kd) in Scatchard analysis in each chicken brain region. n= 3 groups of
animals.
木 Regional distribution of [125
I]iodomelatonin binding in membrane preparations from brain
of pigeons. Values are means 土 S.E.M of the binding sites in one-point analysis using
[1 2 5
I ] iodomela tonin concentrations of 39.5 pmol/1 in each brain region. n=3 groups of
animals.
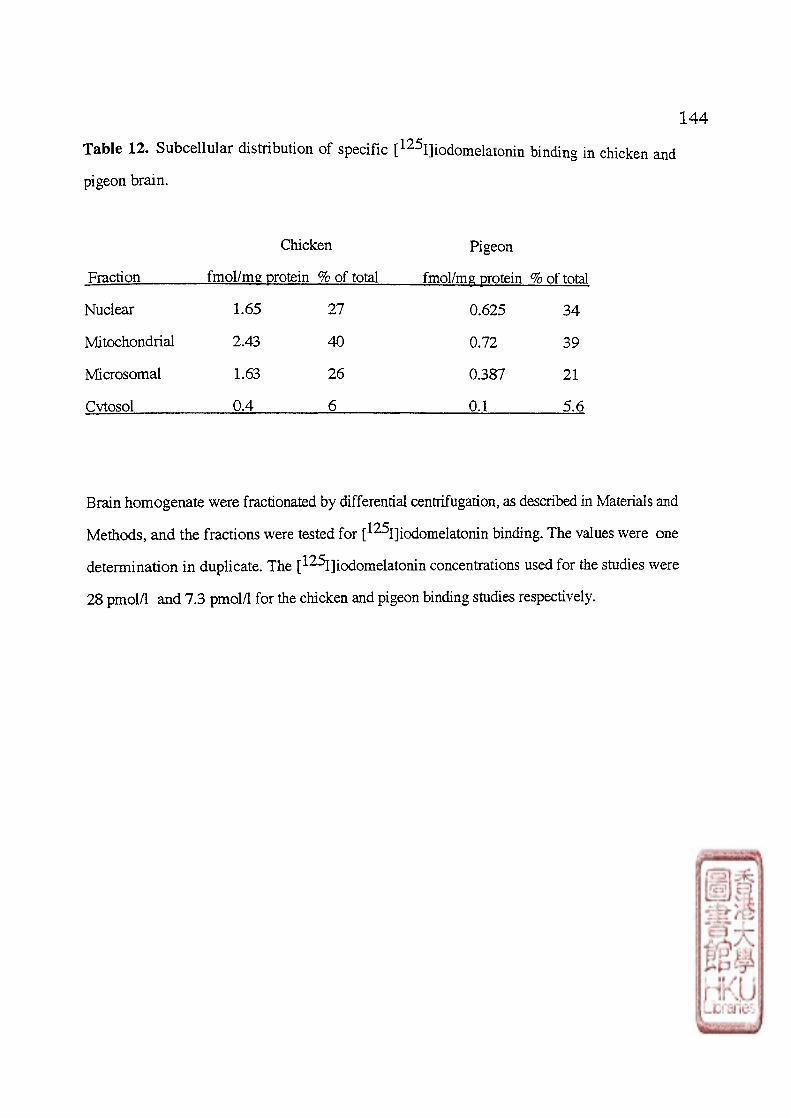
144
Table 12. Subcellular distribution of specific [1 2 5
I]iodomelatonin binding in chicken and
pigeon brain.
Chicken Pigeon
Fraction fmol/mg protein % of total fmol/mg protein % of total
Nuclear 1.65 2 7 0.625 34
Mitochondrial 2.43 40 0.72 39
Microsomal 1.63 26 0.387 21
Cytosol OA 6 OJ 5.6
Brain homogenate were fractionated by differential centrifugation, as described in Materials and
Methods, and the fractions were tested for [125
I]iodomelatonin binding. 丁he values were one
determination in duplicate. The [^^I]iodomelatonin concentrations used for the studies were
28 pmol/1 and 7 3 pmol/1 for the chicken and pigeon binding studies respectively.

145
Table 13. The effect of GTPyS on [1 2 5
I]iodomelatomn binding in the chicken brain.
Control With GTPyS
Bmax (4) 11.8 土 0.88* 8.0 土 0.55
Kd(4) 70.1 + 16.2 77.9 + 7.6
* p< 0.05
Chicken bra in membrane preparations were incubated a t 2 5 ° C for 60 minutes with
[ l^ IJ iodomela tonin ranging from 8-150 pmol/1 with or without GTPyS (10"^ mol/1). The
parentheses show the numbers of animals. Data are the means 土 S.E.M Significant
d i f f e r ence s b e t w e e n each groups were determined b y Student 's t- test .

146 Table 14. Twenty- four hour variation of serum melatonin level, density of brain
[1 2 5 I
] iodomela ton in binding sites (Bmax), and affinity [1 2 5 I
]iodomelatonin binding sites
(Kd) in the chicken brain.
Light period Dark period
time OSOOh 0900h 1300h 1700h 2100h OlOOh
serum
melatonin.
fpmol/1)
30.7±5.6 32.2+21.1 56.8±18.5 398.1土51.6 585.4+159.2 1310.6+68.9
Bmax
(fmol/mg
protein)
16.0±1.1 19.0+0.28 19.7+0.45 18.0+0.82 12.8土 0,82 1L8±1.8
Kd
Jpmol/I)
77 .8+53 91.5+8.2 73.1 土 5,2 68.4±5.8 82.4+5.3 84.6±6.5
Data points a re the means 士 S .E .M of 4 animals. The lighting schedule was L:D 12h:12h
(lights o n OSOOh off 1500h). The data were analyzed by analyses of variance. There were
significant t ime effects in serum melatonin and Bmax, and pair comparisons by student-
Newman-Kuhlfs multiple range tests were conducted. Serum melatonin: (1700h,21(X)h,
OlOOh) v s (OSOOh,0900h, 13(X)h); Bmax of [125
I]iodomelatonin binding: (21(X)h, OlOOh) vs
(OSOOh, OSOOh, 1300h); The above groups within single parentheses are not significantly
different (p>0.05) from each other; groups in separate parentheses are significantly different
(p<0.05) f rom each other.
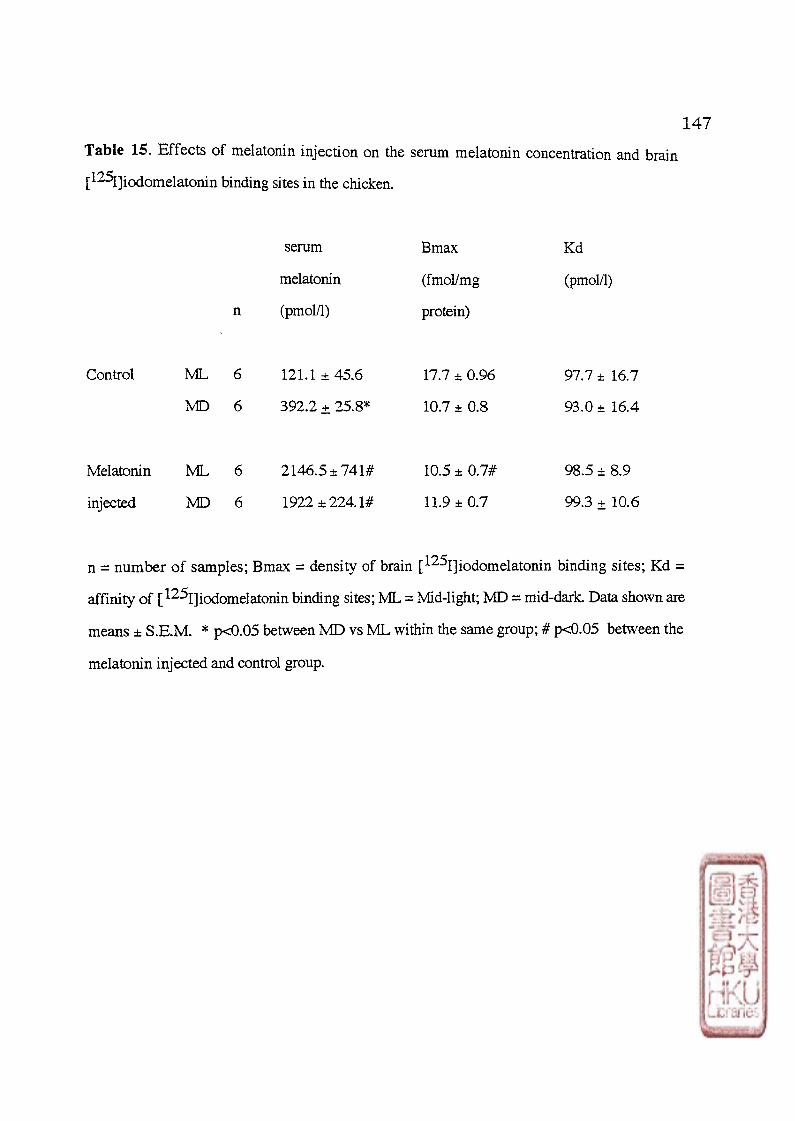
147 Table 15. Effects o f melatonin injection on the serum melatonin concentration and brain
[1 2 5
I]icxiomelatonin binding sites in the chicken.
serum
melatonin
(pmol/1)
Bmax
(fmol/mg
protein)
Kd
(pmol/1)
Control ML 121.1 ± 45.6
392.2 ± 25.8*
17.7 ± 0.96
10.7 ± 0.8
97.7 ± 16.7
93.0 ± 16.4
Melatonin
injected
2146.5 ±741#
1922 ± 224.1#
10.5 ± 0.7#
11.9 ± 0 . 7
98.5 ± 8.9
99.3 ± 10.6
n = number o f samples; Bmax = density of brain [^2 5
I]iodomelatomn binding sites; Kd =
affinity of [ iodomelatonin binding sites; ML = Mid-light; MD = mid-dark. Data shown are
means 土 S . E . M * p<0.05 between M D vs ML within the same group; # p<0.05 between the
melatonin injected and control group.
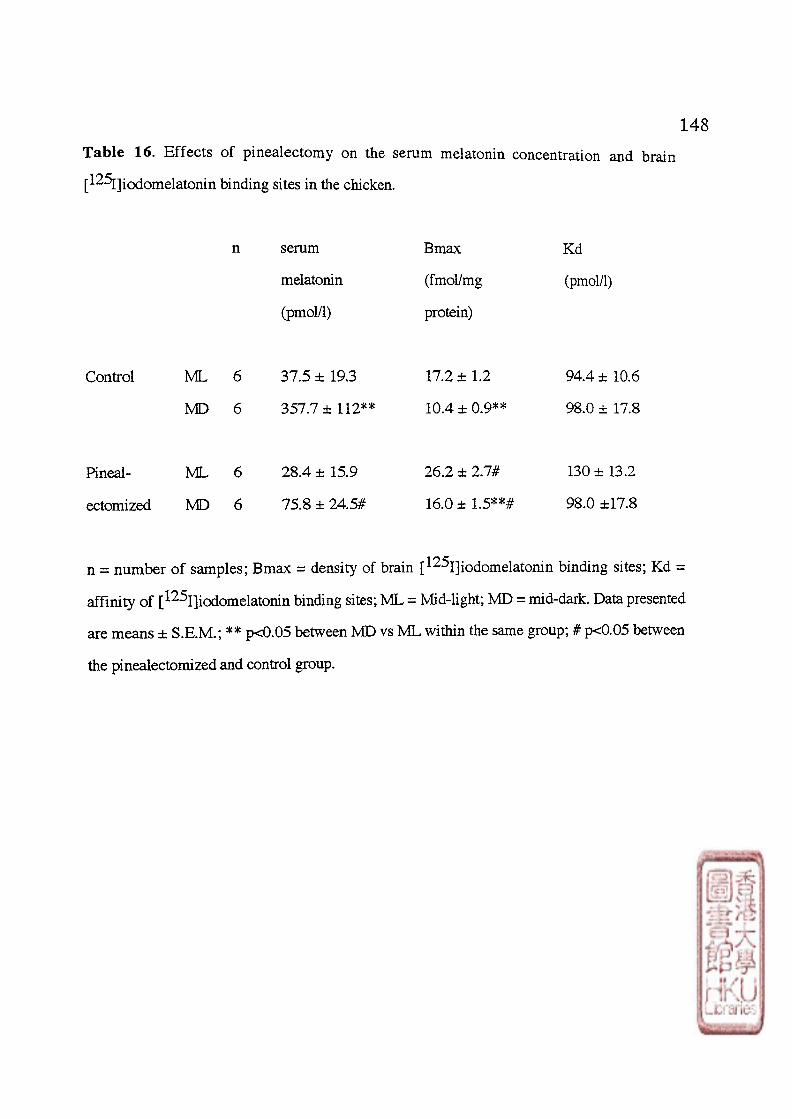
148 Table 16. Effects of pinealectomy on the serum melatonin concentration and brain
[125i]iodomelatonin binding sites in the chicken.
serum
melatonin
(pmol/1)
Bmax
(fmol/mg
protein)
Kd
(pmol/1)
Control ML
MD
37.5 士 193
357.7 土 112术*
17.2 士 1.2
10.4 土 0.9**
94.4 土 10.6
98.0 土 17.8
Pineal-
ectomized
28.4 土 15.9
75.8 ± 24.5#
26.2 土 2.7#
16.0 ± 1.5*宋#
130 ± 13.2
98.0 ±17.8
n = number o f samples; Bmax = density of brain [1 2
^I]iodomelatonin binding sites; Kd =
affinity of [1 2 5
I]icxiomelatonin binding sites; ML = Mid-light; MD = mid-dark. Data presented
are means 土 S.E.M.; ** p<0.05 between MD vs M L within the same group; # p<0.05 between
the pinealectomized and control group.
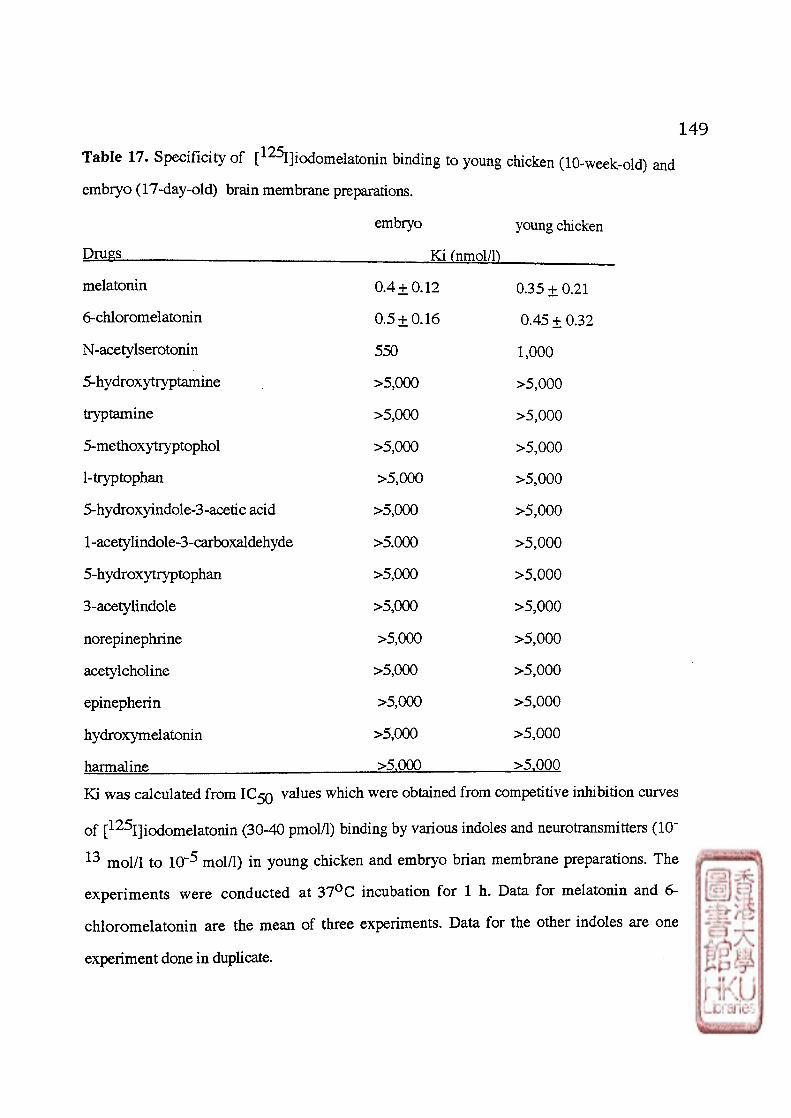
149 Table 17. Specificity of [
1 2 5I]iodomelatonin binding to young chicken (10-week-old) and
embryo (17-day-old) brain membrane preparations.
embryo young chicken
Drugs Ki (nmoVY)
melatonin 0.4 土 0.12 0 3 5 ± 0.21
6-chloromelatonin 0.5 + 0.16 0.45 土 0.32
N-acetylserotonin 550 1,000
5-hydroxytryptamine >5,000 >5,000
tryptamine >5,000 >5,000
5-methoxytryptophol >5,000 >5,000
1-tryptophan >5,000 >5,000
5-hydroxyindole-3-acetic acid >5,000 >5,000
l-acetylindole-3-carboxaldehyde >5.000 >5,000
5-hydroxytryptDphan >5,000 >5,000
3-acetylindole >5,000 >5,000
norepinephrine >5,000 >5,000
acetylcholine >5,000 >5,000
epinepherin >5,000 >5,000
hydroxymelatonin >5,000 >5,000
harmaline >5.000 >5,000
Ki was calculated from IC50 values which were obtained from competitive inhibition curves
of [1 2 5
I] iodomelatonin (30-40 pmol/1) binding by various indoles and neurotransmitters (10"
13 mol/1 t o 10"5 mol/1) in young chicken and embryo brian membrane preparations. The
experiments were conducted a t 3 7 ° C incubation for 1 h. Data for melatonin and 6-
chloromelatonin are the mean of three experiments. Data for the other indoles are one
experiment done in duplicate.

g i HA
!=r Q CL Q < o*
3 0 53 r-t-0
r-n — bO Ol •—4 ImmmA
1 3 o
5 . » 2: J3 O-3 *
00 «5
B CO
D 0 Sf o"
1 I p
s
3 2 -
| | 1 1 l i 5
1 1 | 4
1 31 f v S ^ ^ ^ 8: 、- CTQ
戋 2
i+ — Ui In
^ g § h-* ^
^ J ^ f t o^ P s ^ ^
u t m
0 i < H-Ui 0\
i— U> vo 00 VO 00
^ 00 o ^ w OS H- KV 00
S S On hh 00
U> 各 vo g s “ U On i+ I t l l
^ ^ S — '\o
00 H-t- p
S t o CO o H-00
<1 00 ^ 、 i ON 谷 ^ !0 to U) <1 Ot 屮 i+ 十
H-4 二 to d ^
= 8 8 S
^ l i g H- <1 ^ oo bo Ux
00 X
to o H-H-k bO On
in !t"
H-4 ^
萃 g Os to H-h-* tn In
^ 5 5; 汊 8S ‘
H- H- ^ \o P
5$ O s » ^ ^ t o
t o 05 5 -H-* "-"J O 92 H bo J 0 0 H-rr l l a s r: P ^ N U\
^ vo
to K 00 P *N>
^ s ^ 5n J : p g s "
All
data are
represented as
Sean
dt S
.E.M
. of
4- anim
als. Statistical significance betw
een the
varioujscrQroups
was
tested by the one
丨 way
analysis
。『
variance (A
Z6V
A)
and sc
ltiple
comparisons tested by the
New
2an
丨Ksrs
analysis. *
and
**
within
single parentheses
P3 sig
nifican
tly d
ifferent
at p<
pow
目Q-ool
J.。gpoJ=r.<。
The sig
nifican
t differen
ce o
f【R
ulso
dom
elatonin
bin
din
g capacity
expressed p
er gram
brain
tissue in
the chicken brain mem
brane preparations
E
F
n 10.76; df
n 7/2
4;
p
A P
ol,
(E13
vs E
17,
35, H
20=^
H40S-
M6,
M12**);
(E17
vs H
7
J H20**,
H40**,
M6, M
12**); (H
I vs H7**,
moj
i*,Mltoy
(
Mchvs M
40
錾)
The sig
nifican
t differen
ce o
f【lto
5so
dom
elatonin
bin
din
g sp
acity
expressed per
mOQP32.
3&Qchicken
brain mem
brane preparations
had F
n
30.8
9;
df =
7/2
4;
p <
0.0
1, (E
13 vs
H7**,
mon,
H40=,
M6**,
M12**);
(HI vs
H7, H
40**); (E
17 vs H
7, H
40**); (M
6 v
s H40**);
(M12
vs H
40*)
The sig
nifican
t differen
ce o
f【1255odom
elatonin
bin
din
g capacity
expressed in
per
brain
in the chicken brain m
embrane preparations had
F =
30009; d
f =
7/2
4;
j?
A
Pol,
(E13
s, H
20**,
H40**, M
6**, M
12**); (E
17
vs H
7,
H20**,
u M
6**,
M12**);
(HI vs
H20,
u
I.AM12 j; (H
7 V
SH
4C
M6**M
12J;
(H20 v
s H40**,
M6JM
12
J
The sig
nifican
t differen
ce of【125J】
iRom
elatonin bindinoo
p32.
^expressed in K
d values in
the chicken brain mem
brane
pspiions had
F
“
2.5
9;
df
N 7
/24;
p <
005, (E
13 v
s M
12*, H
40*)

——OO QO 7 O JO On 00 VO t o ON t o 1+1+1+1+ — O VO 广
I p
a c 3 £L < ?S3 a . B. 疔 t3 S, r-«n —
•—4 Ummmi a
i £L p 1
o 5. S3 a 4
5* o -5*
00 c«
m £3 & O O c r
| 0 !=J
1
衾 2 VO ^
00 >—* t o
W W 3 3
in bo vo H-o In t o
oo ,, a \ u 1+ 0 H- H-H-* W Ul
U M ON H- : 1 + 1+
s 云 如 5 U k> bo H- ^1+ H-
《 0 0 “
s 啡 s …j+ o o o o o ^ OH- H-O ^ P 0 ? 0
00
— H oo m t o a \ ^ y t S bo t o o + + + + !T™4 o ^ —
^ t o Ul On *
h-* H-* ON tA 1
O O 00 ’
00 00 1+ Ul ^1+ h-H-i + o 》 P l r t
0 0
沒VO
P 2 . ^ w 2. o 5.
t 2¾ D . o 目 % o o
2 I l § | + B w
• * § •
3 八gL p 平 0 H
g & p jri
- 3 ^ 口 | 8 2 , w 3 ? r
a o 穸 ^ o | §
1 2
CL ^
l i o c r S S ' “ a .
5* 00
h**.* g » 0 CO 1 o
00 §
"O
3 0
1 £ CO
5* n> CL
l l
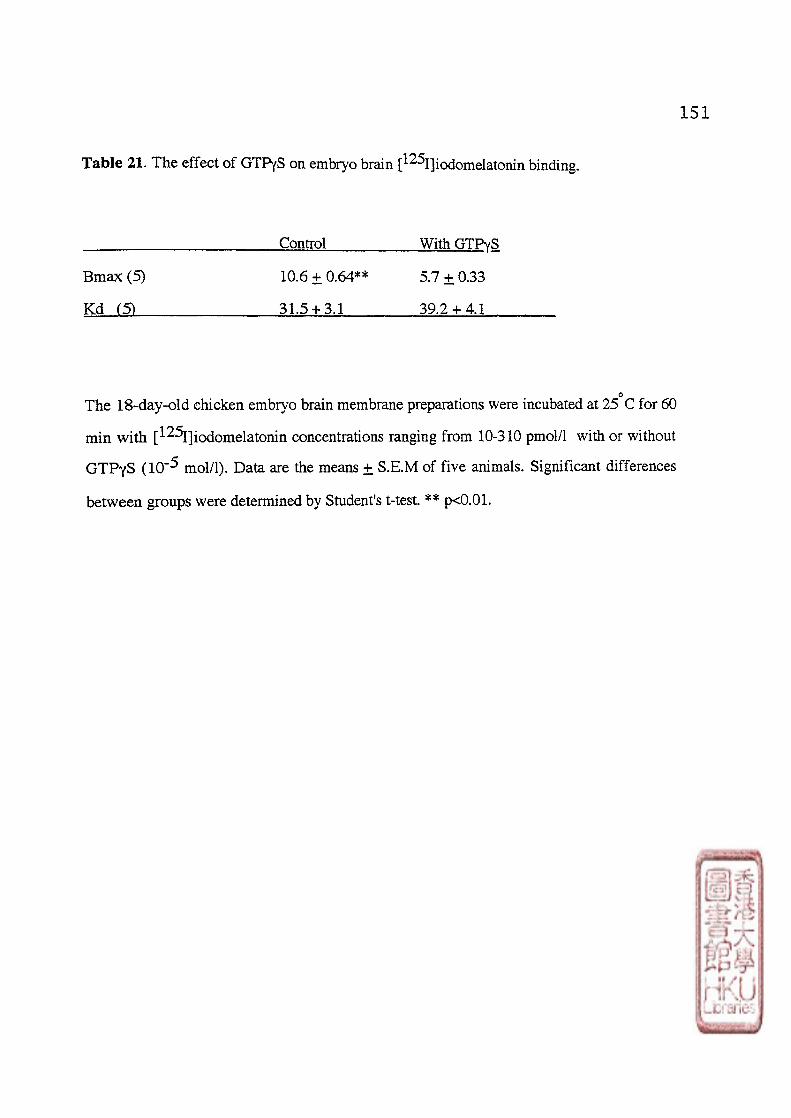
151
Table 21. The effect of GTPyS on embryo brain [^^I]iodomelatonin binding.
Control With GTPyS
Bmax (5) 10.6 土 0.64** 5.7 土 0.33
K d (5) 31.5 + 3.1 39.2 + 4.1
O The 18-day-old chicken embryo brain membrane preparations were incubated at 25 C for 60
min with [ -‘- iodomelatonin concentrations ranging from 10-310 pmol/1 with or without
GTPyS (10"5 mol/1). Data are the means 土 S.E.M of five animals. Significant differences
between groups were determined by Student's t-test. ** p<0.01.
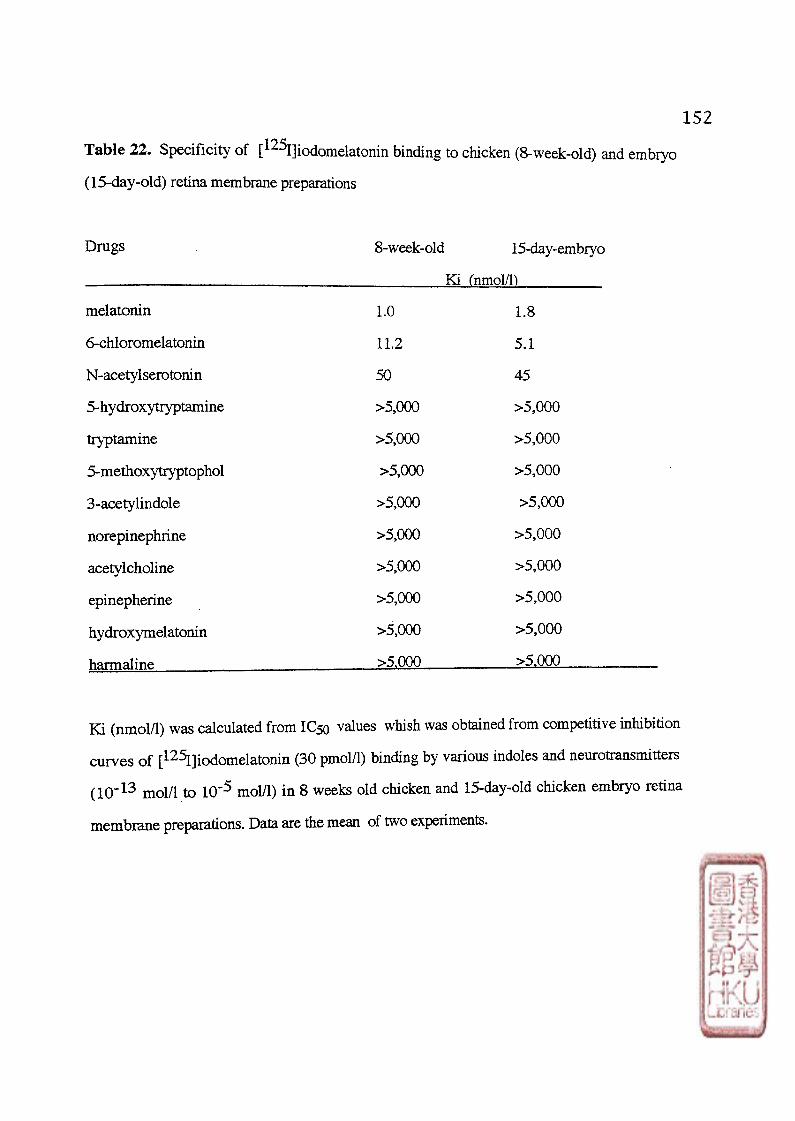
152
Table 22 . Specificity of [1 2 5
I]iodomelatonin binding to chicken (8-week-old) and embryo
(15-day-old) retina membrane preparations
Drugs 8-week-old 15-day-embryo
Ki (nmol/l)
melatonin LO 1.8
6-chloromelatonin 11.2 5.1
N-acetylserotonin 50 45
5-hydroxytryptamine >5,000 >5,000
tryptamine >5,000 >5,000
Smethoxytryptophol >5,000 >5,000
3-acetylindole >5,000 >5,000
norepinephrine >5,000 >5,000
acetylcholine >5,000 >5,000
epinepherine >5,000 >5,000
hydroxymelatonin >5,000 >5,000
harmaline >5,000 >5,000
Ki (nmol/1) was calculated from IC50 values whish was obtained from competitive inhibition
curves of [1 2 5
I] iodomelatomn (30 pmol/1) binding by various indoles and neurotransmitters
( ICT1 3
mol/1 to ICT5 mol/1) in 8 weeks old chicken and 15-day-old chicken embryo retina
membrane preparations. Data are the mean of two experiments.

153
Table 2 3 . Diumal variation of [^^I]icxiomelatonin binding to chicken retina membrane
preparations.
Bmax (fmol/mg protein) Kd (pM)
M L (n=5) 47.2 土 1.26* 366.5 ± 96.5
MD(n=4) 3 2 . 1 + 4 5 5 498.3 + 112.5
0.05.
Four-week-old chickens were used for binding affinity determinations, n = the number of the
experiments. Data are the means 土 S,EM. Significant differences between each groups were
determined b y student11 test.

154
Table 24. [ 125j j iodomelatonin binding in the development of chicken retina.
age weight o f protein (mg/g B (fmol/mg r a t i o o f
retina (mg) retina protein) SB/TB
E 10 (4) 1 L 7 + 2.5 28.5 + 4 3 0.28 + 0.19 2 3 . 2 + 1 . 8
E 1 5 (6) 14.2 + 2.4 23.7 + 2.8 2 . 4 + 0 3 6 48 + 2.2
E 2 0 ( 5 ) 56.4 + 4.9 2 8 . 2 + 1 . 9 3.92 ± 0.62 4 8 ± 2 . 8
H 2 8 ( 8 ) 110.3 ± 1 6 33.1 ± 12.5 5.77 土 0.6 59.5 土 2.8
The parenthesis show the numbers of the animals used. Data are the means 土 S.E.M. The
b ind ing s tudies were performed by one-point analysis using of 46 .8 pmol/l
[1 2 5
I] iodomelatomn SB,specific binding; TB, total binding.

Tab?r
泛 cosp
ariso
n of【
口olIjiodomelatonin
binding
一口
chicken
brain
.
§
Tissu
e M
embrane
Incu
batio
n
Dubocovich et al
(1990)
35-42
丨 day
丨
OE
whole
brain
44,0
00
g p
ellet
40P 2h.
Stehle
Rivkocs ct
al Y
c
目sE-
(1989b)
(1990
and
piessudy)
2
丨 day-old
12
丨 day
丨。Id
tectum opticum
w
hole brain 5a§
pellet
280P 40
min.
250P30
min
6-1
2l
-week
-oQ
: w
hole brian
44,0
00
pellet
%c, 5h
目
d
370P lh
.
Ions
Sodium
K+M
gt, c
at,
GT1P
inhib
ition
no effect no effect
inhib
ition
no effect in
hib
ition
Affm
it、
Saturation K
d K
inetics
s
344 pM
407
pM
Density of
sites w
max
fmol/m
g p
rotein
57.6
Specificity m
elatonin 20
nM
-¾)
6-c
hlo
roila
to3.n
9
nM (
扭) N
AS
in
8H2 p
M
16」
Regional d
istributio
n
hypothalamus
pons-midbrain
med
ulk
oblonOQ
ata cortex cerebellum
Subcellular d
istributin
nuclear (P
I) m
itochondrial (P2)
microsom
al
Bin
din
g study
A
RG
4.8
8 fmol/m
OQ『
offs-
4.5
2
3.1
8
443
33払
1.87 fmol/m
cro
^offs-
2.2
3
47.2
pM
37.8
3.7
I (K
i) 7.3
nM
(Ki)
840nM
(Ki)
AR
G
nuclei of visual, au
dito
ry and lim
bic
system
42.6
(40c),
68.5
(370c)
pM
12.4
(4。
c),70
(37。
c)
呈
3007 (40c),
1000Qs)
035
1 (Ki)
P45
i (K
i) r§nM
(K
i)
tdindincroMHcuy
6.6
5
f30y3g protein
5.1
5
489
2.5
(telencephalon) 039
1.65
fmol/3cro
oa
口
2.4
5
L63
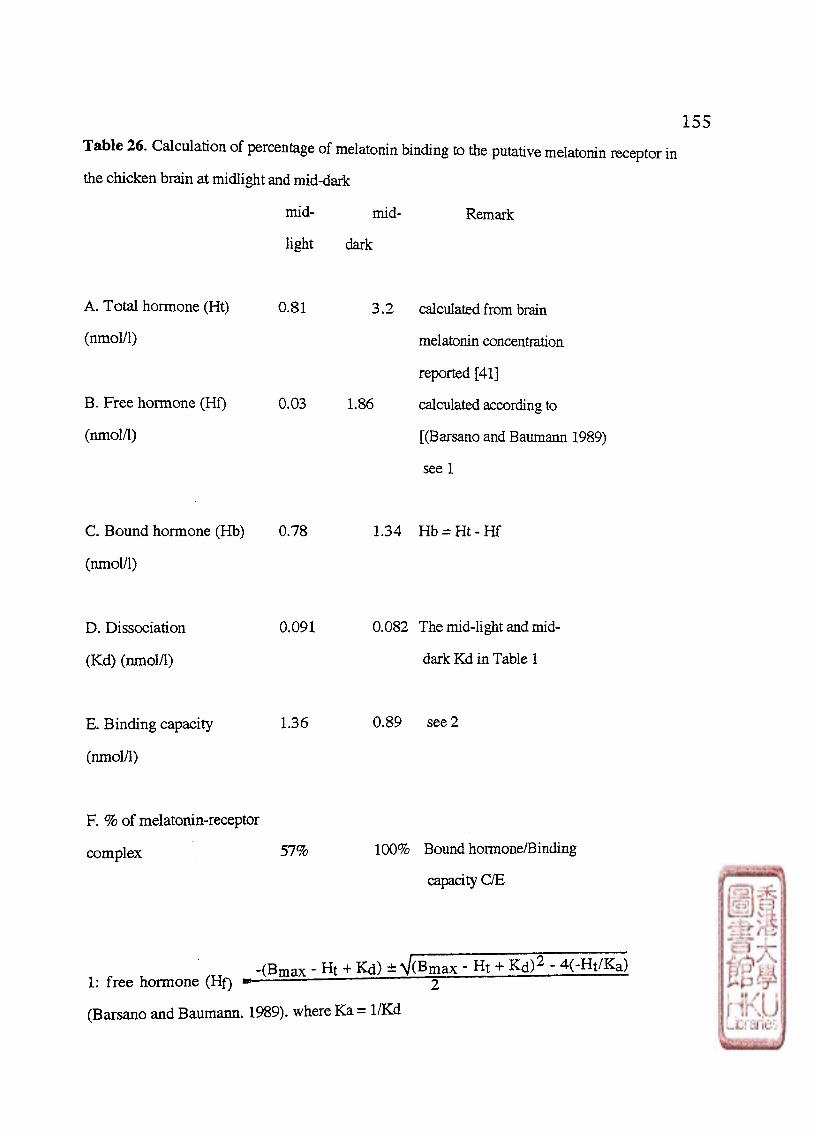
Table 26. Calculation of percentage of melatonin binding to the putative melatonin receptor
the chicken brain at midlight and mid-dark
mid- mid- Remark
light dark
A. Total hormone (Ht)
(nmol/1)
B. Free hormone (Hf)
(nmol/1)
0.81 3 .2
0.03 1.86
calculated from brain
melatonin concentration
reported [41]
calculated according to
[(Barsano and Baumann 1989)
see 1
C. Bound hormone (Hb) 0.78
(nmol/1)
1.34 Hb = H t -
D. Dissociation
(Kd) (nmol/1)
0.091 0.082 The mid-light and mid-
dark Kd in Table 1
E. Binding capacity
(nmol/1)
136 0.89 see 2
F. % of melatonin-receptor
complex 57% 100% Bound hormone/Binding
capacity C/E
- Ht + Kd) 士 V(Bmax - Ht + K d )2 - 4(-Ht/Ka)
1: f ree hormone (Hf) 2 一
(Barsano and Baumann. 1989). where Ka = 1/Kd

156
2: In our laboratory, one gram of wet brain tissue had 50 mg of protein in the crude
membrane preparations and the crude membrane preparations have about 70% of the brain total
binding (Yuan et al 1991). Assuming that 1 g of wet brain tissue is 1 ml in volume, then
Binding capacity (fmol/1): Bmax (fmol/mg protein) x 50 mg x lCX)%/70% x 1000 ml
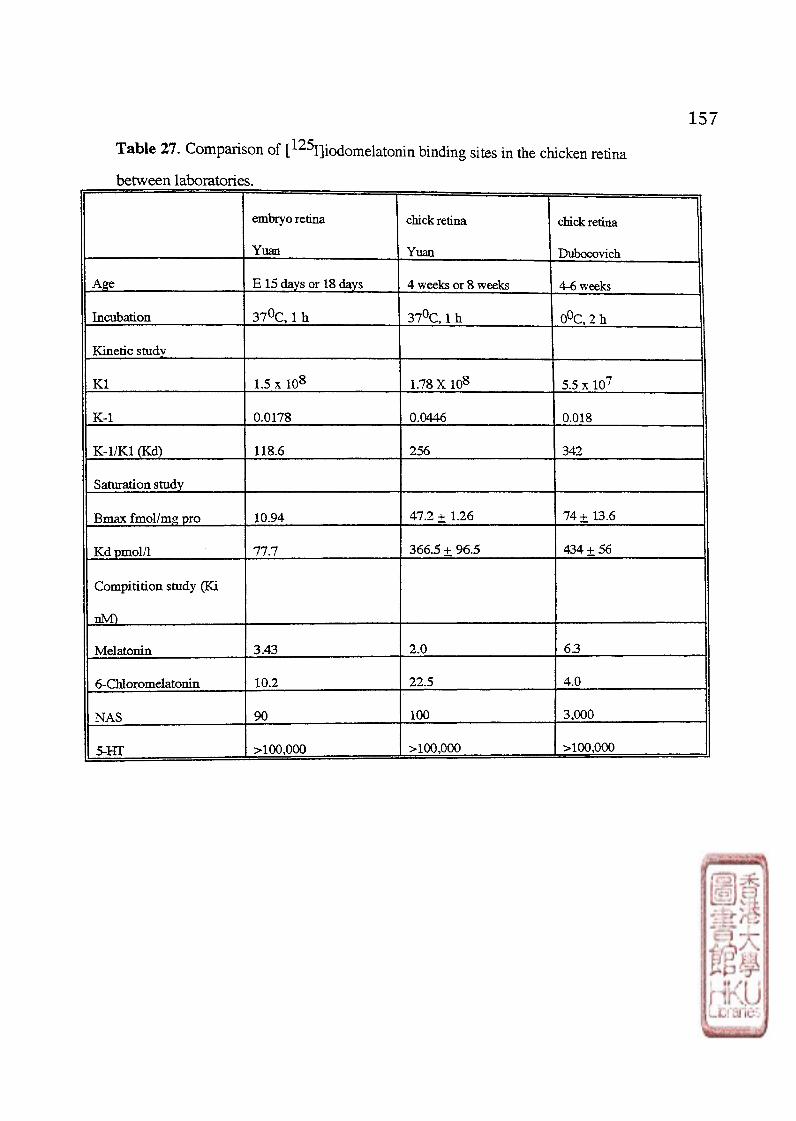
157
Table 27. Comparison of [ ^I]iodomelatonin binding sites in the chicken retina
between laboratories.
embryo retina
Yuan
chick retina
Yuan
chick retina
Dubocovich
Age E 15 days or 18 days 4 weeks or 8 weeks 4-6 weeks
Incubation 370C,1 h 370C, 1 h 0
0C,2 h
Kinetic study
K I 1.5 x 1 08
1.78 X 10⁸
5.5 x 10⁷
K 4 0.0178 0.0446 0.018
KAIK1 (Kd) 118.6 256 342
Saturation study
Bmax fmol/mg pro 10.94 47.2 ± 1.26 74+13 . 6
Kd pmol/1 77.7 366.5 + 96.5 434 ± 5 6
Compitition study (Ki
dM)
Melatonin 3.43 2.0 6.3
6-Chloromelatomn 10.2 22.5 4.0
NAS 90 100 3,000
sm >100,000 >100,000 >100,000