Freezing of bentonite - SKB · Möjligheten för islinsbildning i denna komponent har uppskattats...
45
Svensk Kärnbränslehantering AB Swedish Nuclear Fuel and Waste Management Co Box 250, SE-101 24 Stockholm Phone +46 8 459 84 00 Technical Report TR-10-40 Freezing of bentonite Experimental studies and theoretical considerations Martin Birgersson, Ola Karnland, Ulf Nilsson Clay Technology AB January 2010
Transcript of Freezing of bentonite - SKB · Möjligheten för islinsbildning i denna komponent har uppskattats...
Svensk Kärnbränslehantering ABSwedish Nuclear Fueland Waste Management Co
Box 250, SE-101 24 Stockholm Phone +46 8 459 84 00
Technical Report
TR-10-40
ISSN 1404-0344CM Gruppen AB, Bromma, 2010
Freezing of bentonite
Experimental studies and theoretical considerations
Martin Birgersson, Ola Karnland, Ulf Nilsson
Clay Technology AB
January 2010
Tänd ett lager:
P, R eller TR.
Freezing of bentonite
Experimental studies and theoretical considerations
Martin Birgersson, Ola Karnland, Ulf Nilsson
Clay Technology AB
January 2010
This report concerns a study which was conducted for SKB. The conclusions and viewpoints presented in the report are those of the authors. SKB may draw modified conclusions, based on additional literature sources and/or expert opinions.
A pdf version of this document can be downloaded from www.skb.se.
TR-10-40 3
Abstract
During its lifetime, a KBS-3 repository will be subject to various ambient temperatures. Backfilled tunnels, shafts and investigation bore holes closest to ground level will experience periods of tempera-ture below 0°C. From a safety assessment perspective, it is therefore essential to understand the behavior of compacted bentonite below 0°C.
A theoretical framework for predicting the pressure response in compacted water saturated bentonite due to temperature changes has been developed based on thermodynamics and a single pore-type. This model predicts an approximately linear temperature dependence of swelling pressure
where ΔT denotes a temperature difference from 0°C , Δs(w) is the difference in partial molar entropy between clay water and bulk water, vclay (w) is the partial molar volume of the clay water and w denotes the water/solid mass ratio of the clay. As bulk water changes phase at 0°C, Δs(w) has a different value dependent on whether ΔT is negative or positive.
Above 0°C Δs(w) is a small value for all relevant densities which means that the pressure response due to temperature changes is small. A further consequence of this fact is that Δs(w) is a large positive number below 0°C when the external water phase is transformed to ice. Consequently, the model predicts a large drop of swelling pressure with temperature below 0°C, in the order of 1.2 MPa/°C. Specifically, the swelling pressure is zero at a certain (negative) temperature Tc. Tc also quantifies the freezing point of the bentonite sample under consideration, as ice formation in the bentonite does not occur until swelling pressure is lost.
A large set of laboratory tests have been performed where fully water saturated samples of bentonites have been exposed to temperatures in the range –10°C to +25°C. The swelling pressure response has been recorded continuously. The samples have been varied with respect to bentonite type (e.g. calcium or sodium dominated), smectite content and density.
The experimental results basically confirm all predictions of the developed theory. In particular:
• A weak swelling pressure response above 0°C.
• A strong and positive swelling pressure response below the freezing point of the external aqueous reservoir, in the order of 1.2 MPa/°C.
• The swelling pressure is completely lost at a specific temperature Tc. The value of Tc is determined solely by the value of the swelling pressure at 0°C.
• Ice formation (i.e. freezing) occurs in the bentonite only below Tc.
• The freezing/thawing is completely reversible.
The success of the single pore-type model to describe the process together with the observation that no pressure peaks was observed as the 0°C level was passed suggests that water saturated bentonite do contain a negligible amount of larger pores (> 50 nm) since these should freeze at temperatures close to 0°C with a resulting pressure increase.
From a safety assessment point of view it can be concluded that freezing of the buffer will not occur during the repository lifetime as the reference density corresponds to a Tc below –5°C and the lowest predicted temperature at repository depth is approximately –2°C.
The possibility that the backfilled parts of the repository will freeze during its lifetime cannot be excluded as the backfill has a higher freezing temperature and will also be exposed to lower temperatures in vertically extended structures (ramps and shafts). The possible freezing of the backfill will not impose a problem however as freezing/thawing has been shown to be a reversible process.
( ) ( ) ( )( ) TwvwsCwPTwP s ∆⋅∆+°=∆
clays 0,,
4 TR-10-40
Part of the bentonite in the borehole seals will also freeze because of its location closer to ground level. The possibility of forming ice lenses by transporting water from lower unfrozen parts of the surrounding rock via the bentonite in the seal has been estimated and found negligible due to very low hydraulic conductivity.
A further general conclusion from the outcome of the present work, is that measurements of the swelling pressure response to temperature changes is a convenient way to quantify the partial molar entropy of water in the clay which is fundamental for general understanding of the swelling process.
TR-10-40 5
Sammanfattning
Ett KBS-3-förvar kommer att utsättas för varierande temperatur under sin livstid. Återfyllda tunnlar, schakt och undersökningsborrhål närmast ytnivån kommer att i perioder ha temperatur under 0°C. Ur ett säkerhetsanalysperspektiv är det därför väsentligt att förstå hur kompakterad bentonit uppför sig vid temperaturer under 0°C.
Ett teoretiskt ramverk för att förutsäga tryckrespons orsakad av temperaturförändringar i kompakterad vattenmättad bentonit har utvecklats, baserat på termodynamik och en en-portyps-modell för bentonit. Denna modell förutsäger ett approximativt linjärt beroende av svälltryck på temperatur
där ΔT betecknar temperaturskillnad från 0°C, Δs(w) är skillnaden i partiell molentropi mellan vatten i bentoniten och bulkvatten, vclay(w) är den partiella molvolymen hos vattnet i leran och w betecknar vatten/solid-masskvoten i bentoniten. Då bulkvatten genomgår en fasövergång vid 0°C har Δs(w) olika värde beroende på om ΔT är positiv eller negativ.
Över 0°C är Δs(w) litet för alla relevanta densiteter, vilket innebär att tryckresponsen pga. temperatur-förändringar är liten. Ytterligare en konsekvens av detta är att Δs(w) är stort och positivt under 0°C, då det externa vattnet övergått i isfas. Följaktligen förutsäger modellen ett stort svälltryckstapp med temperatur under 0°C, av storleksordningen 1.2 MPa/°C. Specifikt blir svälltrycket noll vid en särskild (negativ) temperatur Tc. Tc kvantifierar även fryspunkten hos bentonitprovet, då isbildning inte sker innan svälltrycket är förlorat.
Ett stort antal laboratorieförsök har genomförts, där fullt vattenmättade bentonitprov har utsatts för temperaturer i intervallet –10°C to +25°C. Svälltrycksrepsonsen har mätts kontinuerligt. Proverna har varierats med avseende på bentonittyp (t.ex. kalcium- eller natriumdominerad), smektitinnehåll och densitet.
De experimentella resultaten har i princip bekräftat alla förutsägelser från den utvecklade teorin. Speciellt har påvisats:
• En svag svälltrycksrespons över 0°C.
• En stark och positiv respons under den externa vattenreservoarens fryspunkt, i storleksordningen 1.2 MPa/°C.
• Förlorat svälltryck vid en specifik temperatur Tc. Värdet på Tc bestäms uteslutande av svälltrycket vid 0°C.
• Isbildning (d.v.s. frysning) i bentoniten endast under Tc.
• Frysnings/tinings-processen är helt reversibel.
Förmågan hos en-portyps-modellen att fullständigt beskriva frysprocessen tillsammans med observatio-nen att inga tryckökningar observerats då 0°C-nivån passeras, indikerar att kompakterad vattenmättad bentonit innehåller en försumbar andel större porer (>50 nm) eftersom dessa fryser vid temperaturer nära 0°C vilket skulle resultera i en observerbar tryckökning.
Ur ett säkerhetsanalysperspektiv kan slutsatsen dras att bufferten inte kommer att frysa under KBS-3-förvarets livstid då referensmaterialet har ett Tc under –5°C och då den lägsta predikterade temperaturen på förvarsdjup är ca –2°C.
Möjligheten att tunnelåterfyllda delar av förvaret kan komma att frysa under dess livstid kan inte ute-slutas då återfyllnadsbentoniten har en högre fryspunkt och kommer att utsättas för lägre temperaturer i vertikalt utsträckta delar (ramp och schakt). En möjlig frysning av återfyllnaden är dock inget problem då frysnings/tinings-processen har visat sig vara helt reversibel.
( ) ( ) ( )( ) TwvwsCwPTwP s ∆⋅∆+°=∆
clays 0,,

6 TR-10-40
Även delar av bentoniten i borrhålsförseglingarna kommer att frysa då dessa befinner sig betydligt närmare marknivån. Möjligheten för islinsbildning i denna komponent har uppskattats och funnits försumbar pga. den låga hydrauliska konduktiviteten.
En ytterligare generell slutsats från arbetet är att mätningar av svälltrycksrespons pga. temperatur-förändringar är en givande metod för att kvantifiera partiella molentropin hos vattnet i bentonit. Kunskap om denna kvantitet är grundläggande för ökad generell förståelse av svällprocessen.
TR-10-40 7
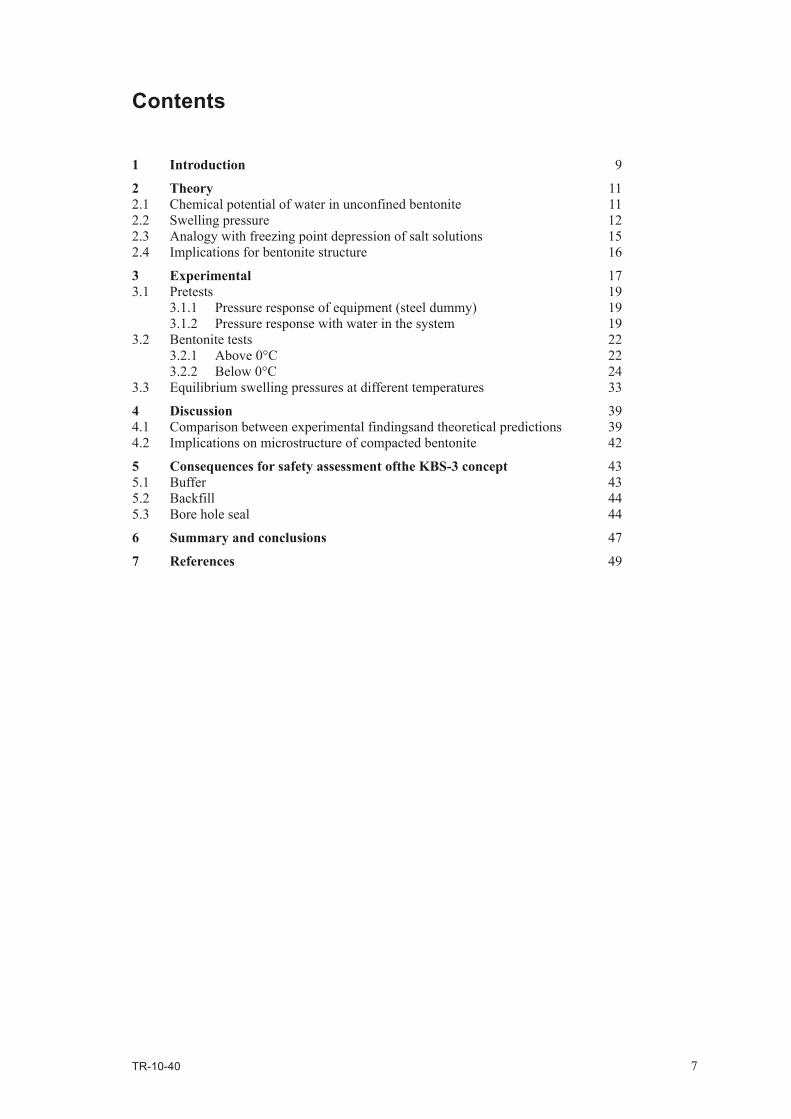
Contents
1 Introduction 9
2 Theory 112.1 Chemical potential of water in unconfined bentonite 112.2 Swelling pressure 122.3 Analogy with freezing point depression of salt solutions 152.4 Implications for bentonite structure 16
3 Experimental 173.1 Pretests 19
3.1.1 Pressure response of equipment (steel dummy) 193.1.2 Pressure response with water in the system 19
3.2 Bentonite tests 223.2.1 Above 0°C 223.2.2 Below 0°C 24
3.3 Equilibrium swelling pressures at different temperatures 33
4 Discussion 394.1 Comparison between experimental findingsand theoretical predictions 394.2 Implications on microstructure of compacted bentonite 42
5 Consequences for safety assessment ofthe KBS-3 concept 435.1 Buffer 435.2 Backfill 445.3 Bore hole seal 44
6 Summary and conclusions 47
7 References 49
TR-10-40 9
1 Introduction
The KBS-3 repository for high level radioactive waste should stay functional for >100,000 years. During this amount of time the repository will most likely experience glacial cycles with associated periods of permafrost. The ground temperature consequently does vary, not only with depth, but also with time and will at times be below 0°C / SKB 2006a/. Several KBS-3 repository components include bentonite: buffer, tunnel backfill, tunnel plugs and investigation borehole seals. The main function of bentonite is to provide a sealing swelling pressure and low hydraulic conductivity – two properties which are strongly coupled.
The following report investigates the behavior of compacted bentonite below 0°C. It is investigated how swelling pressure (i.e. sealing properties) changes with temperature and under what conditions bentonite freezes. The freezing point of a soil sample is defined as the temperature where ice starts to form in the material. When ice formation occurs in confined bentonite a substantial pressure increase is expected due to volume expansion of water. Isostatic loads above 90 MPa could cause a canister failure / SKB 2006b/.
Bentonite is a swelling material, which makes it rather unique as a soil in the sense that some of its properties are dependent on external conditions. The process of swelling, specifically, only occurs when bentonite is in contact with an external aqueous reservoir, and the concept of swelling pressure can consequently only be defined under such conditions.
This means, in particular, that a bentonite component within the KBS-3 repository will be affected by freezing as soon as the groundwater in the surrounding rock freezes even though the component itself may remain unfrozen. The process of freezing bentonite in the following context therefore also includes the temperature range between the freezing point of the aqueous reservoir and the actual freezing point of the bentonite, in order to provide a full description of bentonite as temperature is lowered.
The report is outlined as follows. In chapter 2, a theoretical framework for swelling pressure response due to temperature changes is presented. chapter 3 presents experimental studies of pressure response made on several types of frozen (and unfrozen) bentonite. The experimental findings are compared with the theoretical predictions in chapter 4 and the consequences of the results for the KBS-3 concept are addressed in chapter 5.
TR-10-40 11
2 Theory
This chapter presents a thermodynamic approach for swelling pressure response in bentonite due to temperature changes. It is in part also found in / Birgersson et al. 2008/.
2.1 Chemical potential of water in unconfined bentoniteThe chemical potential of water in an unconfined, i.e. non-pressurized, bentonite sample of water/solid mass ratio w (water ratio, for short) and absolute temperature T is usually quantified by measuring Pv(w,T), the equilibrium vapor pressure over the sample. The chemical potential is then related to a reference state as / Atkins 1986/
2-1
where μref. (T) and Pv, ref. (T) are the chemical potential and the equilibrium vapor pressure of the reference state respectively, and R is the universal gas constant. Commonly, the chemical potential is measured at some constant temperature above 0°C and the natural choice of reference state is non-pressurized liquid bulk water. In this case the vapor pressure ratio in the last term of Equation 2-1 equals relative humidity. In the present work, where we are interested in evaluating bentonite properties at temperatures below 0°C it is sometimes convenient to change the reference state to that of non-pressurized ice. It should be noticed that Equation 2-1 is valid for any reference state of choice as long as the vapor can be described by the ideal gas law.
Introducing the variable
2-2
where v(T) is the molar volume of bulk water, Equation 2-1 can be written
2-3
It is seen that Ψ(w,T) directly quantifies a chemical potential difference, and by scaling with v it gets the unit of pressure. When the reference state is non-pressurized liquid bulk water, Ψ(w,T) is referred to as suction. Suction as a function of w (or some other variable quantifying the amount of water in the system) at constant temperature is referred to as the water retention curve / Marshall et al. 1996/.
The temperature dependence of the molar volume can be written
v(T) = (1 + βΔT) · v(T0) 2-4
where β is the thermal expansion coefficient and ΔT = T – T0. For liquid bulk water, β ranges between –50∙10–6 °C–1 and 700∙10–6 °C–1 in the temperature interval 1–90°C / CRC 1973/ (note that bulk water shrinks with increasing temperature below +4°C). Since the present study only involves temperature changes in the order of 10°C it follows that the contribution to suction changes from volume expansion (or contraction) can safely be neglected, since even with the over estimation of β of 700∙10–6 °C–1 the volume change is still less than 1 %. In the following the temperature dependence of the molar volume will be neglected and it will be written simply v.
( ) ( ) ( )( )TPTwPRTTTw
v
v
.ref,ref.unconf.
,ln, += µµ
( ) ( )( )TPTwP
TvRTTw
v
v
ref.,
,ln)(
, −≡Ψ
( ) ( ) ( ))(
,, unconf.ref.
TvTwTTw µµ −=Ψ
12 TR-10-40
A chemical potential can be related to its value at a different temperature T0 by integrating the Gibbs-Duhem equation / Chandler 1987/
dμ = vdP – sdT 2-5
at constant pressure (dP = 0)
μ(T) = μ(T0) – s · ΔT 2-6
where s, the partial molar entropy, is approximated as independent of temperature and pressure. The assumption that s is independent of temperature can of course only be valid in a relatively short temperature interval (T0, T) in which no phase transitions are occurring. Combining Equations 2-3 and 2-6 gives
2-7
or
2-8
where
2-9
Hence, to the extent that entropy can be considered temperature independent, suction is a linear function of temperature.
2.2 Swelling pressureThe change in water chemical potential when an initially non-pressurized bentonite sample is pressurized with pressure P is given by integrating the Gibbs-Duhem equation (Equation 2-5) at constant temperature
μclay (w, T, P) = μunconf. (w,T) + vclay(w) · P
2-10
where the molar volume of water in the clay, vclay(w), has been assumed independent of pressure and
temperature and the notation μclay is used for the chemical potential of water in a pressurized bentonite sample.
Of special interest is the pressure developed in a volume restricted bentonite sample which is allowed to equilibrate with an external, non-pressurized aqueous phase with chemical potential μext (T) (e.g. via steel filters or a fractured crystalline rock matrix). This pressure, called the swelling pressure and denoted Ps(w,T), is calculated by combining the equilibrium condition μclay = μext and Equation 2-10.
2-11
The swelling pressure is thus a direct measurement of the difference in chemical potential of water of the external phase and the corresponding unconfined bentonite sample. Swelling pressure is therefore not only influenced by direct changes of the clay properties, but also by changes of the external phase. It is then expected that swelling pressure is influenced when there is a transition of the external phase due to freezing. A more complicated example of the same type of pressure response is when salt is added to the system. The salt changes the chemical potential of water in both the external phase and in the clay, but to an unequal amount, resulting in a swelling pressure response / Karnland et al. 2005/.
When the external phase is pure (liquid) bulk water, the swelling pressure is directly related to suction
2-12
( ) ( ) ( ) ( )v
TwsTwTsTTw
∆⋅+−∆⋅−=Ψ clay0unconf.ref0ref ,
,µµ
( ) ( ) ( )v
TwsTwTw ∆⋅∆+Ψ=Ψ 0,,
( ) ( ) refclay swsws −≡∆
( ) ( ) ( )( )wv
TwTTwPclay
unconf.exts
,, µµ −=
( ) ( ) ),(,clay
s TwwvvTwP Ψ=
TR-10-40 13
This relation has been verified many times (e.g. / Low and Anderson 1958, Karnland et al. 2005/.) Specifically it is seen from Equations 2-8 and 2-12 that the temperature dependence of the swelling pressure is
2-13
if it is assumed that the temperature interval (T0,T) is relatively short and does not contain any phase transitions. When discussing freezing it is convenient to choose the reference temperature T0 = 273 K (= 0°C). At this temperature the chemical potentials for liquid water and ice are the same, under non-pressurized conditions (it is exactly therefore this is the freezing point of bulk water, cf. Figure 2-3). Hence Equation 2-13 is valid for both positive and negative values of ΔT, if only different values of Δs(w) are used. The validity of Equation 2-13, however, is weakened the larger the absolute value of ΔT.
The notation Ps0(w) will be adopted for Ps(w,T = 273 K). Furthermore, the notations Δsl.w.(w) and Δsice(w) will be adopted for partial molar entropy differences between clay water and liquid bulk water, and
between clay water and ice, respectively. Δsl.w.(w) and Δsice(w) are related as
Δsice(w) – Δsl.w.(w) = sl.w. – sice ≈ 22 J/mol/°C 2-14
where 22 J/mol/°C is the approximate difference in molar entropy between liquid bulk water and ice at 0°C / CRC 1973/.
A convenient unit in this study for the slope of the function Ps (w, T) is MPa/°C. This is achieved if entropy is measured in units of J/mol/°C (ordinary SI-unit) and molar volume in cm3/mol. Thus, these units will be used throughout. Furthermore, the partial molar volume for clay water will usually be assumed equal to the value for liquid bulk water at 0°C, i.e. vclay (w) = v = 18.0 cm3/mol.
To sum up, the slope of the swelling pressure versus temperature curve is a direct measure of the entropy difference between water in the clay and in the external phase according to the presented theory. Particularly, the sign of the slope shows weather the molar entropy is larger (positive sign) or smaller (negative sign) as compared to the reference.
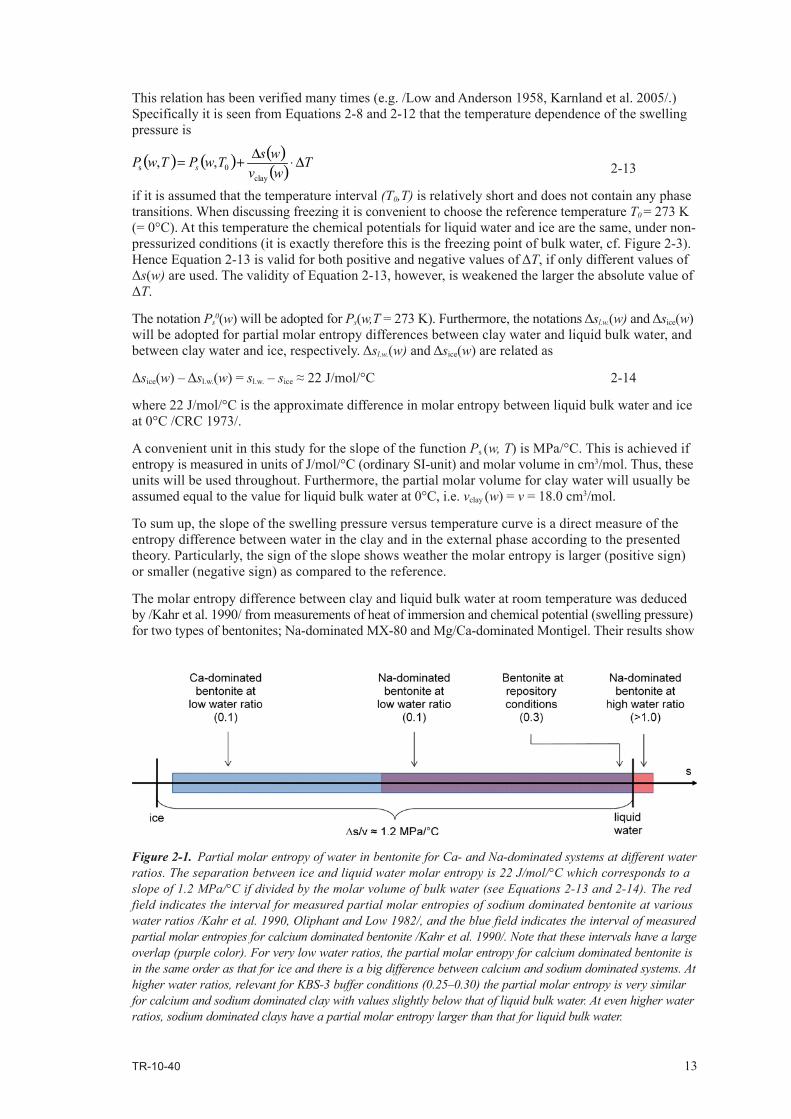
The molar entropy difference between clay and liquid bulk water at room temperature was deduced by / Kahr et al. 1990/ from measurements of heat of immersion and chemical potential (swelling pressure) for two types of bentonites; Na-dominated MX-80 and Mg/Ca-dominated Montigel. Their results show
( ) ( ) ( )( ) TwvwsTwPTwP s ∆⋅∆+=
clay0s ,,
Figure 2‑1. Partial molar entropy of water in bentonite for Ca- and Na-dominated systems at different water ratios. The separation between ice and liquid water molar entropy is 22 J/mol/°C which corresponds to a slope of 1.2 MPa/°C if divided by the molar volume of bulk water (see Equations 2-13 and 2-14). The red field indicates the interval for measured partial molar entropies of sodium dominated bentonite at various water ratios / Kahr et al. 1990, Oliphant and Low 1982/, and the blue field indicates the interval of measured partial molar entropies for calcium dominated bentonite / Kahr et al. 1990/. Note that these intervals have a large overlap (purple color). For very low water ratios, the partial molar entropy for calcium dominated bentonite is in the same order as that for ice and there is a big difference between calcium and sodium dominated systems. At higher water ratios, relevant for KBS-3 buffer conditions (0.25–0.30) the partial molar entropy is very similar for calcium and sodium dominated clay with values slightly below that of liquid bulk water. At even higher water ratios, sodium dominated clays have a partial molar entropy larger than that for liquid bulk water.
14 TR-10-40
that at water ratios relevant for repository conditions (0.25–0.3), Δsl.w. (w) is a small negative number both for calcium and sodium dominated bentonite. For lower values of the water ratio, Δsl.w. (w) continu-ously becomes more negative with a more pronounced entropy difference for the calcium/magnesium dominated clay. / Oliphant and Low 1982/ measured Δsl.w. (w) for pure Na-montmorillonite at higher water ratios (>1.0) where it was shown to be a small positive number. The measured values of partial molar entropies of water in bentonites are summarized in Figure 2-1.
From the experimental findings on Δsl.w. (w) and the theoretical considerations above, several predictions can be made regarding the temperature dependence on swelling pressure in bentonite
• At temperatures above 0°C, the swelling pressure dependence on temperature is weak for all relevant densities.
Measurement of temperature dependent water retention properties confirms that Δs (w) is a small negative value for clays with water ratios of 0.25–0.30 / Villar and Gòmez-Espina 2007/. Note that the retention curve not only shifts with changes in temperature – the shape changes because of the w-dependence of Δs (w).
• For both calcium and sodium dominated clays, the slope of the Ps-T curve should be negative for temperatures above 0°C at low enough water ratios.
• For sodium dominated clays (at least), the swelling pressure response should turn and be positive at temperatures above 0°C at some water ratio.
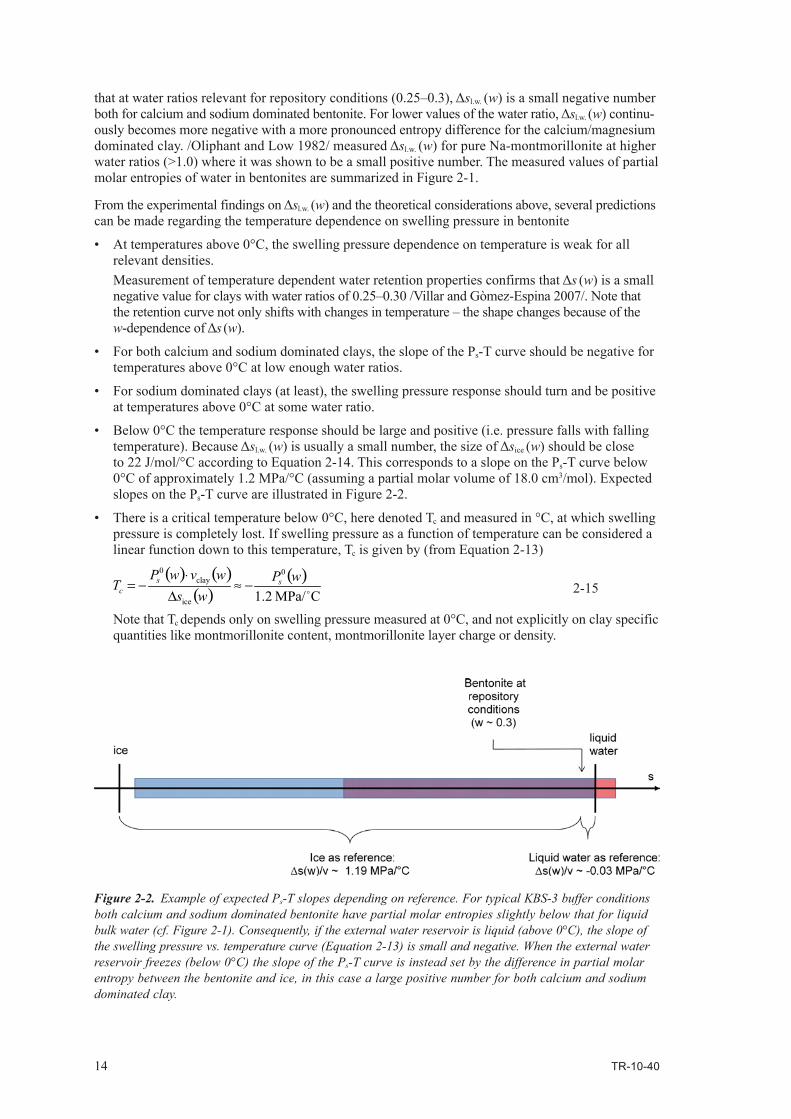
• Below 0°C the temperature response should be large and positive (i.e. pressure falls with falling temperature). Because Δsl.w. (w) is usually a small number, the size of Δsice (w) should be close to 22 J/mol/°C according to Equation 2-14. This corresponds to a slope on the Ps-T curve below 0°C of approximately 1.2 MPa/°C (assuming a partial molar volume of 18.0 cm3/mol). Expected slopes on the Ps-T curve are illustrated in Figure 2-2.
• There is a critical temperature below 0°C, here denoted Tc and measured in °C, at which swelling pressure is completely lost. If swelling pressure as a function of temperature can be considered a linear function down to this temperature, Tc is given by (from Equation 2-13)
2-15
Note that Tc depends only on swelling pressure measured at 0°C, and not explicitly on clay specific quantities like montmorillonite content, montmorillonite layer charge or density.
Figure 2‑2. Example of expected Ps-T slopes depending on reference. For typical KBS-3 buffer conditions both calcium and sodium dominated bentonite have partial molar entropies slightly below that for liquid bulk water (cf. Figure 2-1). Consequently, if the external water reservoir is liquid (above 0°C), the slope of the swelling pressure vs. temperature curve (Equation 2-13) is small and negative. When the external water reservoir freezes (below 0°C) the slope of the Ps-T curve is instead set by the difference in partial molar entropy between the bentonite and ice, in this case a large positive number for both calcium and sodium dominated clay.
( ) ( )( )
( )CMPa/2.1
0
ice
clay0
o
wPwswvwP
T ssc −≈
∆⋅
−=
TR-10-40 15
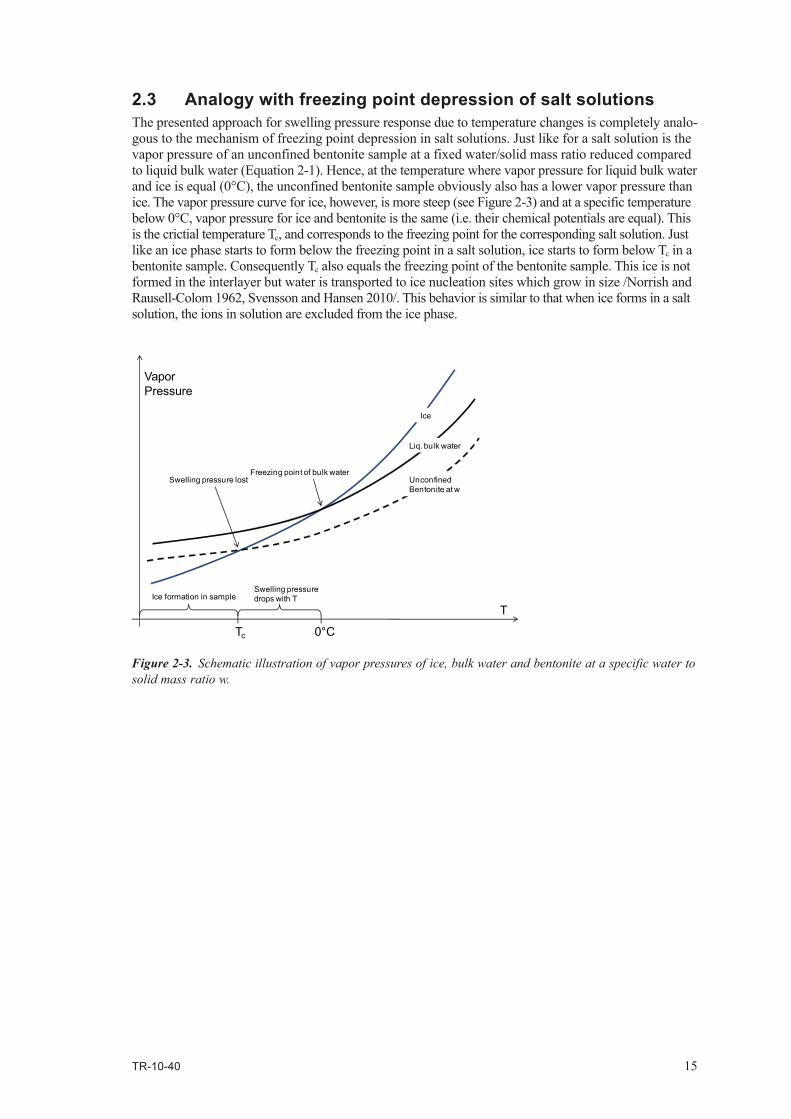
2.3 Analogy with freezing point depression of salt solutionsThe presented approach for swelling pressure response due to temperature changes is completely analo-gous to the mechanism of freezing point depression in salt solutions. Just like for a salt solution is the vapor pressure of an unconfined bentonite sample at a fixed water/solid mass ratio reduced compared to liquid bulk water (Equation 2-1). Hence, at the temperature where vapor pressure for liquid bulk water and ice is equal (0°C), the unconfined bentonite sample obviously also has a lower vapor pressure than ice. The vapor pressure curve for ice, however, is more steep (see Figure 2-3) and at a specific temperature below 0°C, vapor pressure for ice and bentonite is the same (i.e. their chemical potentials are equal). This is the crictial temperature Tc, and corresponds to the freezing point for the corresponding salt solution. Just like an ice phase starts to form below the freezing point in a salt solution, ice starts to form below Tc in a bentonite sample. Consequently Tc also equals the freezing point of the bentonite sample. This ice is not formed in the interlayer but water is transported to ice nucleation sites which grow in size / Norrish and Rausell-Colom 1962, Svensson and Hansen 2010/. This behavior is similar to that when ice forms in a salt solution, the ions in solution are excluded from the ice phase.
Figure 2‑3. Schematic illustration of vapor pressures of ice, bulk water and bentonite at a specific water to solid mass ratio w.
Ice
Liq. bulk water
UnconfinedBentonite at w
Freezing point of bulk water
0°CTc
Swelling pressure drops with T
Swelling pressure lost
Ice formation in sample
T
Vapor Pressure
16 TR-10-40
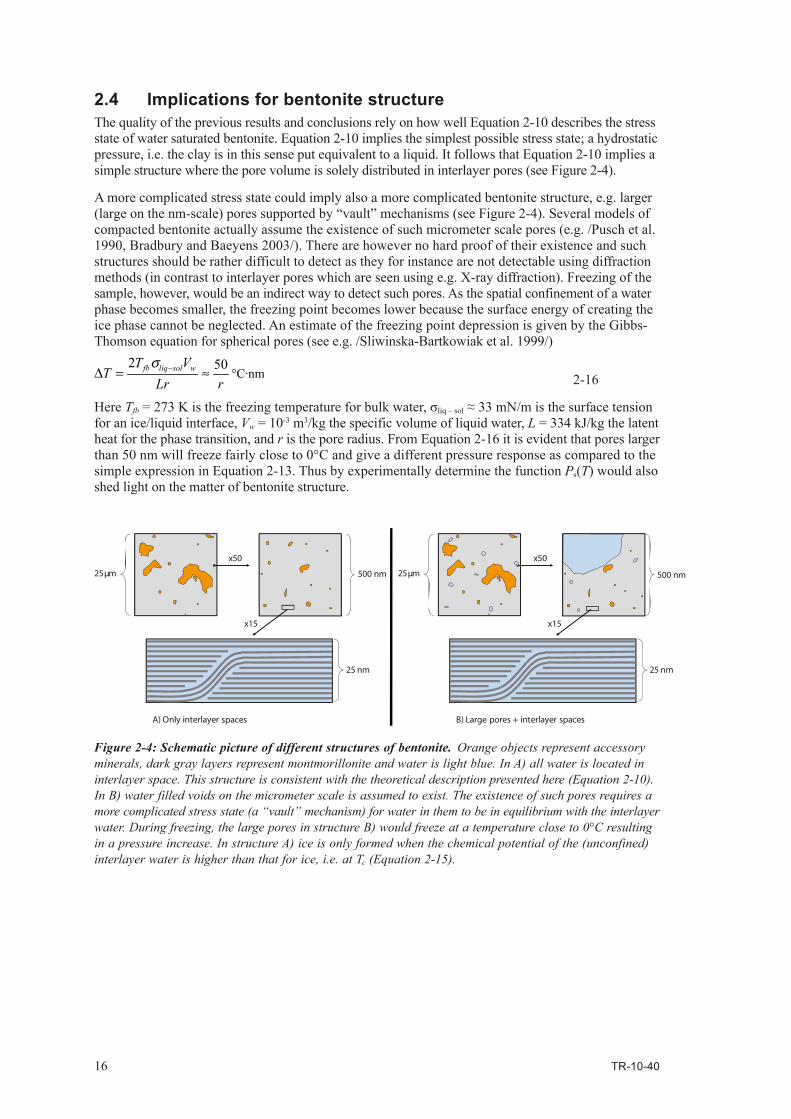
2.4 Implications for bentonite structureThe quality of the previous results and conclusions rely on how well Equation 2-10 describes the stress state of water saturated bentonite. Equation 2-10 implies the simplest possible stress state; a hydrostatic pressure, i.e. the clay is in this sense put equivalent to a liquid. It follows that Equation 2-10 implies a simple structure where the pore volume is solely distributed in interlayer pores (see Figure 2-4).
A more complicated stress state could imply also a more complicated bentonite structure, e.g. larger (large on the nm-scale) pores supported by “vault” mechanisms (see Figure 2-4). Several models of compacted bentonite actually assume the existence of such micrometer scale pores (e.g. / Pusch et al. 1990, Bradbury and Baeyens 2003/). There are however no hard proof of their existence and such structures should be rather difficult to detect as they for instance are not detectable using diffraction methods (in contrast to interlayer pores which are seen using e.g. X-ray diffraction). Freezing of the sample, however, would be an indirect way to detect such pores. As the spatial confinement of a water phase becomes smaller, the freezing point becomes lower because the surface energy of creating the ice phase cannot be neglected. An estimate of the freezing point depression is given by the Gibbs-Thomson equation for spherical pores (see e.g. / Sliwinska-Bartkowiak et al. 1999/)
2-16
Here Tfb = 273 K is the freezing temperature for bulk water, σliq – sol ≈ 33 mN/m is the surface tension for an ice/liquid interface, Vw = 10-3 m3/kg the specific volume of liquid water, L = 334 kJ/kg the latent heat for the phase transition, and r is the pore radius. From Equation 2-16 it is evident that pores larger than 50 nm will freeze fairly close to 0°C and give a different pressure response as compared to the simple expression in Equation 2-13. Thus by experimentally determine the function Ps(T) would also shed light on the matter of bentonite structure.
Figure 2‑4: Schematic picture of different structures of bentonite. Orange objects represent accessory minerals, dark gray layers represent montmorillonite and water is light blue. In A) all water is located in interlayer space. This structure is consistent with the theoretical description presented here (Equation 2-10). In B) water filled voids on the micrometer scale is assumed to exist. The existence of such pores requires a more complicated stress state (a “vault” mechanism) for water in them to be in equilibrium with the interlayer water. During freezing, the large pores in structure B) would freeze at a temperature close to 0°C resulting in a pressure increase. In structure A) ice is only formed when the chemical potential of the (unconfined) interlayer water is higher than that for ice, i.e. at Tc (Equation 2-15).
25 μm 500 nm
x50
x15
25 nm
A) Only interlayer spaces
500 nm25 μm
x50
x15
25 nm
B) Large pores + interlayer spaces
rLrVT
T wsolliqfb 502≈=∆ −σ
°C·nm
TR-10-40 17
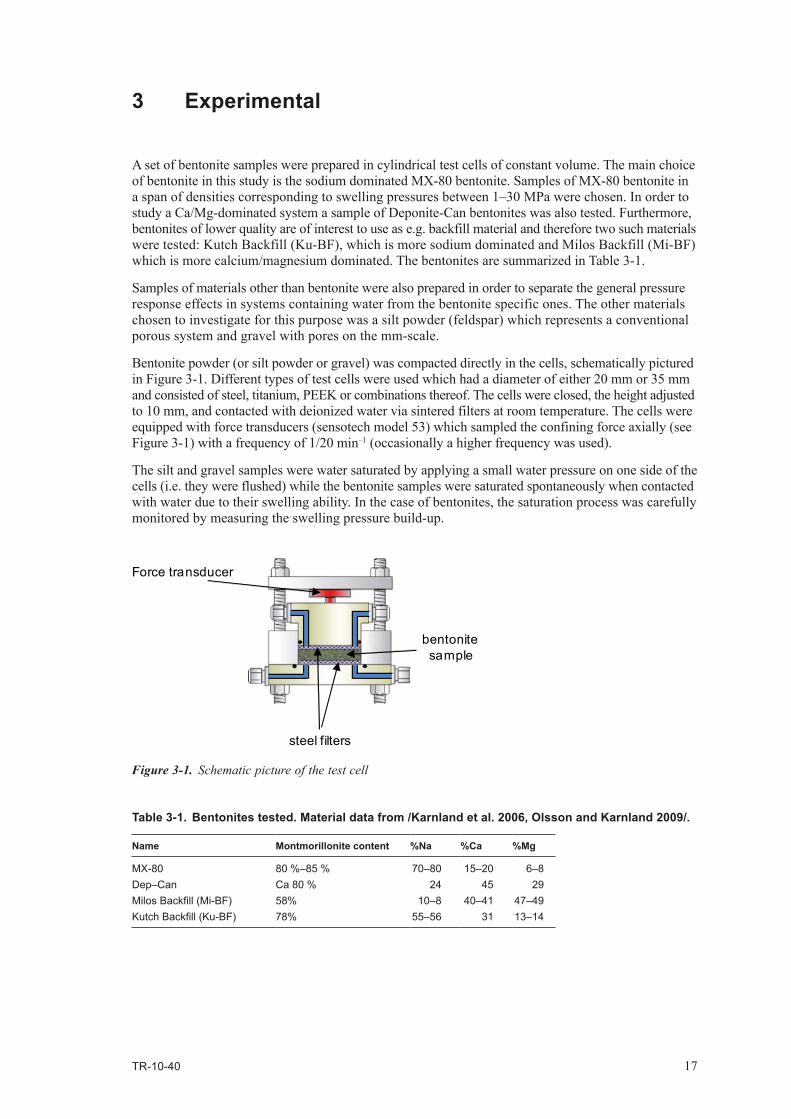
3 Experimental
A set of bentonite samples were prepared in cylindrical test cells of constant volume. The main choice of bentonite in this study is the sodium dominated MX-80 bentonite. Samples of MX-80 bentonite in a span of densities corresponding to swelling pressures between 1–30 MPa were chosen. In order to study a Ca/Mg-dominated system a sample of Deponite-Can bentonites was also tested. Furthermore, bentonites of lower quality are of interest to use as e.g. backfill material and therefore two such materials were tested: Kutch Backfill (Ku-BF), which is more sodium dominated and Milos Backfill (Mi-BF) which is more calcium/magnesium dominated. The bentonites are summarized in Table 3-1.
Samples of materials other than bentonite were also prepared in order to separate the general pressure response effects in systems containing water from the bentonite specific ones. The other materials chosen to investigate for this purpose was a silt powder (feldspar) which represents a conventional porous system and gravel with pores on the mm-scale.
Bentonite powder (or silt powder or gravel) was compacted directly in the cells, schematically pictured in Figure 3-1. Different types of test cells were used which had a diameter of either 20 mm or 35 mm and consisted of steel, titanium, PEEK or combinations thereof. The cells were closed, the height adjusted to 10 mm, and contacted with deionized water via sintered filters at room temperature. The cells were equipped with force transducers (sensotech model 53) which sampled the confining force axially (see Figure 3-1) with a frequency of 1/20 min–1 (occasionally a higher frequency was used).
The silt and gravel samples were water saturated by applying a small water pressure on one side of the cells (i.e. they were flushed) while the bentonite samples were saturated spontaneously when contacted with water due to their swelling ability. In the case of bentonites, the saturation process was carefully monitored by measuring the swelling pressure build-up.
Figure 3‑1. Schematic picture of the test cell
Table 3‑1. Bentonites tested. Material data from / Karnland et al. 2006, Olsson and Karnland 2009/.
Name Montmorillonite content %Na %Ca %Mg
MX-80 80 %–85 % 70–80 15–20 6–8Dep–Can Ca 80 % 24 45 29Milos Backfill (Mi-BF) 58% 10–8 40–41 47–49Kutch Backfill (Ku-BF) 78% 55–56 31 13–14
steel filters
bentonite sample
Force transducer
18 TR-10-40
The fully water saturated samples were disconnected from their external water supply and placed in a cooled incubator (Sanyo MIR-153) in which temperature could be kept constant in the interval –10°C to +50°C. The samples, however, where still in contact with external water because the channels and filters of the test cells still contained water. The temperature was measured separately by a sensor in the incubator. The pressure sensors, however, produce some heat. The measured incubator temperature thus does not exactly correspond to sample temperature. Furthermore, by the same reason it cannot be excluded that a weak temperature gradient is imposed over the sample.
The samples were exposed to different temperatures and their pressure response recorded. The testing was done in cycles of freezing and thawing. Some of these cycles had to be rather long (>100 days) in order to achieve pressure equilibrium. During this amount of time the incubator occasionally had to be defrosted to function properly. During the defrosting, the samples were stored in a cooled isolated box, in which temperature was not controlled. The bentonite test cells were flushed with water after a freezing/thawing cycle in order to maintain external water in the system. The freezing cycles are summarized in Table 3-2.
Table 3‑2. Freezing cycles. Indicated is number of performed defrosts and also if tests of pressure response of bentonite above 0°C were performed after the freezing period.
Cycle Start date End date Length (days)
Temp. range (°C)
No. of Defrosts
Tests above 0°C
1 2007-06-19 2007-06-28 9 –6 – 0 0 No2 2007-06-28 2007-07-19 21 –8 – 0 0 No3 2007-07-20 2007-09-24 66 –4 – 0 2 Yes4 2007-10-09 2008-03-03 146 –10 – 0 4 Yes5 2008-04-24 2008-09-11 140 –8 – 0 5 Yes6 2009-03-13 2009-03-30 17 –6 – 0 0 Yes7 2009-04-07 2009-05-14 37 –10 – 0 0 Yes
Table 3‑3. Samples tested. The samples are foremost characterized by their swelling pressure at 0°C, Ps
0. Listed is also the diameter, D, of the samples. All samples were of height 10 mm. After termination also water/solid mass ratio, w, was determined.
Sample ID Material Ps0 (MPa) D (mm) Started Ended Cycles w
Freezing01 MX-80 6–7 20 2007-06-19 2009-06-25 1,2,3,4,5,6,7 0.29Freezing02 MX-80 5 35 2007-06-19 2007-06-28 1 n.d.Freezing03 MX-80 5 20 2007-06-28 2008-04-08 2,3,4 0.33Freezing04 MX-80 4 20 2007-06-28 2008-04-08 2,3,4 0.32Freezing05 MX-80 1 20 2007-10-05 2008-06-05 4,5 (partly) 0.42Freezing06 MX-80 30 20 2007-10-05 2009-03-13 4,5 0.21Freezing07 Dep-Can 6 20 2008-04-23 2009-06-25 5,6,7 0.29Freezing08 Mi-BF 2 20 2008-04-23 2009-05-27 6,7 0.33Freezing09 Ku-BF 9 20 2009-04-23 2009-03-13 5 0.35Freezing11 Feldspar silt – 20 2007-06-19 2007-09-03 3 –Freezing12 Steel – 20 2007-06-19 2007-06-28 1,2,3 –Freezing13 Feldspar silt – 35 2007-06-19 2007-06-28 1 –Freezing14 Steel – 35 2007-06-19 2007-06-28 1 –Freezing15 Gravel – 20 2007-06-28 2007-09-03 1,2,3 –
TR-10-40 19
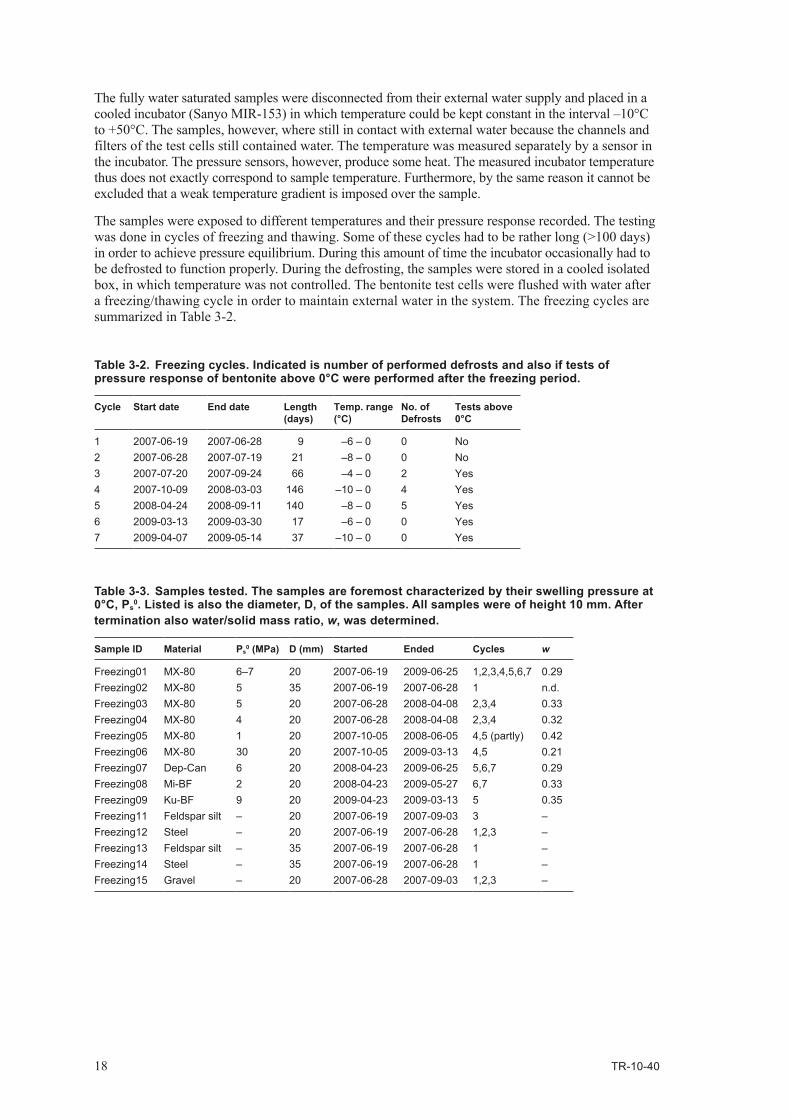
3.1 Pretests3.1.1 Pressure response of equipment (steel dummy)The pressure response due to temperature changes of the test cells alone containing a steel dummy sample is pictured in Figure 3-2. This figure also exemplifies the general way pressure- vs. time graphs are presented in this report; the measured incubator temperature is plotted together with the relevant sample pressure. Temperature is always read on the right-hand y-axis. Sample material and sample ID (see Table 3-3) is written in the legend.
Figure 3-2 shows that changing temperatures in the order of 5°C gives a pressure change of approxi-mately 0.1 MPa. This pressure response is due to different thermal expansion coefficients of the equip-ment (cell, bolts, filters, pressure sensor, dummy) but can be considered negligible when compared to pressure responses of bentonite samples (see below). Furthermore, from Figure 3-2 it is seen that the transient behavior, when temperature is changed, is such that an increase in temperature initially gives a pressure drop.
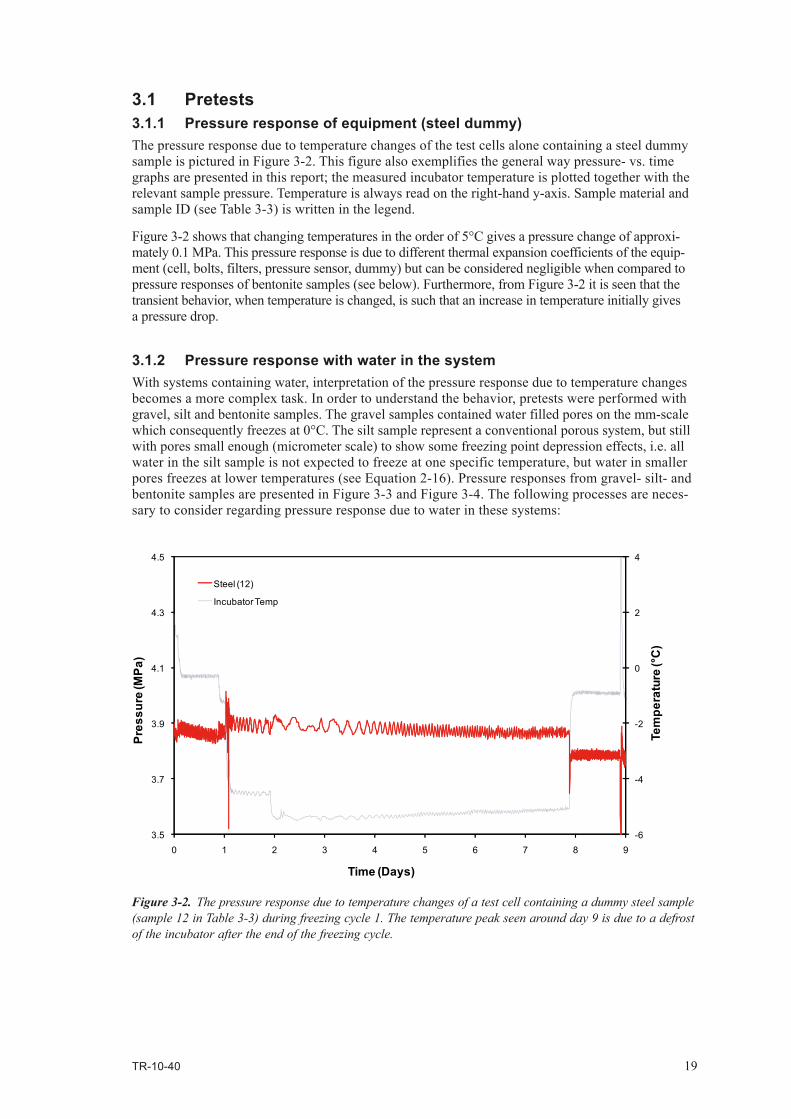
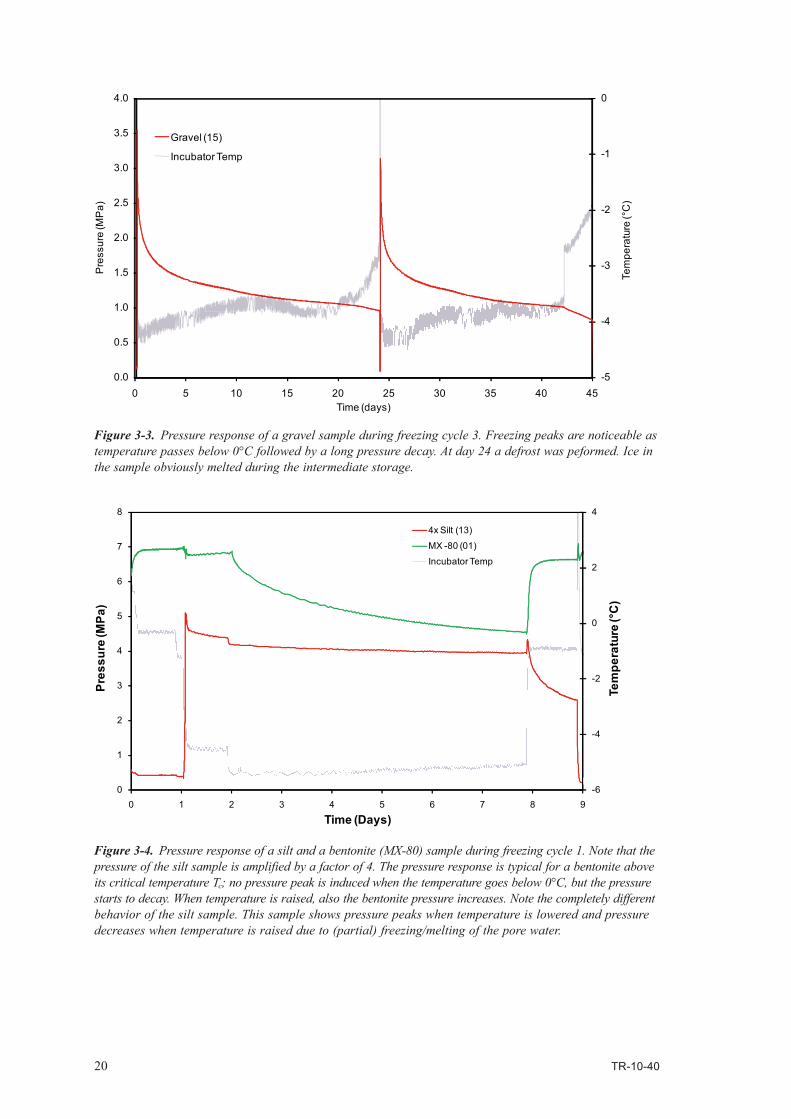
3.1.2 Pressure response with water in the systemWith systems containing water, interpretation of the pressure response due to temperature changes becomes a more complex task. In order to understand the behavior, pretests were performed with gravel, silt and bentonite samples. The gravel samples contained water filled pores on the mm-scale which consequently freezes at 0°C. The silt sample represent a conventional porous system, but still with pores small enough (micrometer scale) to show some freezing point depression effects, i.e. all water in the silt sample is not expected to freeze at one specific temperature, but water in smaller pores freezes at lower temperatures (see Equation 2-16). Pressure responses from gravel- silt- and bentonite samples are presented in Figure 3-3 and Figure 3-4. The following processes are neces-sary to consider regarding pressure response due to water in these systems:
Figure 3‑2. The pressure response due to temperature changes of a test cell containing a dummy steel sample (sample 12 in Table 3-3) during freezing cycle 1. The temperature peak seen around day 9 is due to a defrost of the incubator after the end of the freezing cycle.
-6
-4
-2
0
2
4
3.5
3.7
3.9
4.1
4.3
4.5
0 1 2 3 4 5 6 7 8 9
Pres
sure
(MPa
)
Time (Days)
Steel (12)
Incubator Temp
Tem
pera
ture
(°C
)
20 TR-10-40
Figure 3‑3. Pressure response of a gravel sample during freezing cycle 3. Freezing peaks are noticeable as temperature passes below 0°C followed by a long pressure decay. At day 24 a defrost was peformed. Ice in the sample obviously melted during the intermediate storage.
Figure 3‑4. Pressure response of a silt and a bentonite (MX-80) sample during freezing cycle 1. Note that the pressure of the silt sample is amplified by a factor of 4. The pressure response is typical for a bentonite above its critical temperature Tc; no pressure peak is induced when the temperature goes below 0°C, but the pressure starts to decay. When temperature is raised, also the bentonite pressure increases. Note the completely different behavior of the silt sample. This sample shows pressure peaks when temperature is lowered and pressure decreases when temperature is raised due to (partial) freezing/melting of the pore water.
-5
-4
-3
-2
-1
0
0.0
0.5
1.0
1.5
2.0
2.5
3.0
3.5
4.0
0 5 10 15 20 25 30 35 40 45
Pre
ssur
e (M
Pa)
Time (days)
Gravel (15)
Incubator Temp
Tem
pera
ture
(°C
)
-6
-4
-2
0
2
4
0
1
2
3
4
5
6
7
8
0 1 2 3 4 5 6 7 8 9
Pres
sure
(MPa
)
Time (Days)
4x Silt (13)
MX -80 (01)
Incubator Temp
Tem
pera
ture
(°C
)
TR-10-40 21
1) A pressure peak when ice is formed, in the following referred to as an ice formation peak. Because ice has ca 8% lower density than liquid water, a pressure increase is expected when ice is formed in the samples. Such peaks are seen both in the gravel sample in Figure 3-3 and in the silt sample in Figure 3-4. As seen the response can be on the order of several MPa. Since the way water is transported in and out of the cells is not completely controlled it can however not be predicted how large these peaks should be. If there are still open pathways out of the sample when ice is start-ing to form, the pressure response will be less because liquid water is simultaneously transported out, creating volume for the ice. The form of the pressure response when ice is formed is however very characteristic. Note that no such pressure peaks are present in the bentonite sample (Figure 3-4), indicating that no ice is formed at that temperature, i.e. that the sample is above its critical tempera-ture, Tc.
2) When a system is pressurized and not in equilibrium with the external water a pressure drop is seen. This is e.g. seen in the gravel samle (Figure 3-3), where a long pressure decay occurs after the initial freezing peak. The same behavior is seen in the silt sample but to a much lesser extent (Figure 3-4). Also in the bentonite sample is this pressure decay observed (Figure 3-4). From these observations it can be concluded that water is able to be transported out of the cells also when the surroundings are frozen.
The volume of the amount of water that is involved in this type of transport can be estimated by
3-1
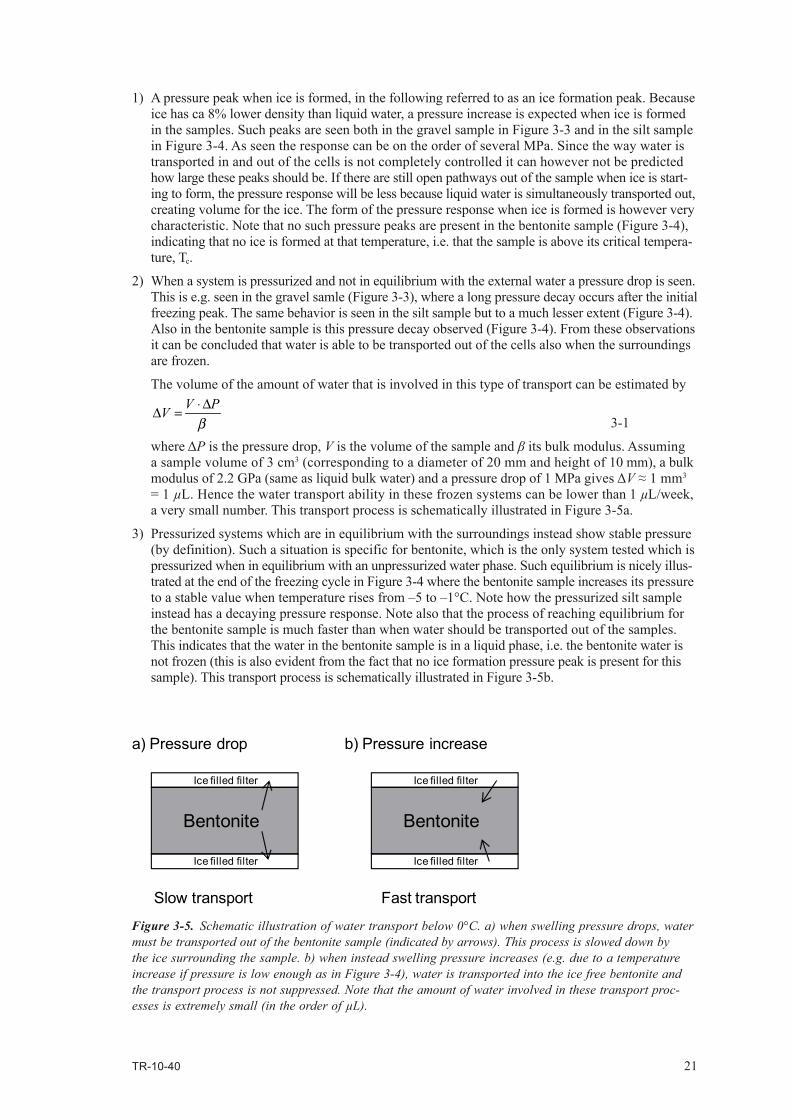
where ΔP is the pressure drop, V is the volume of the sample and β its bulk modulus. Assuming a sample volume of 3 cm3 (corresponding to a diameter of 20 mm and height of 10 mm), a bulk modulus of 2.2 GPa (same as liquid bulk water) and a pressure drop of 1 MPa gives ΔV ≈ 1 mm3 = 1 µL. Hence the water transport ability in these frozen systems can be lower than 1 µL/week, a very small number. This transport process is schematically illustrated in Figure 3-5a.
3) Pressurized systems which are in equilibrium with the surroundings instead show stable pressure (by definition). Such a situation is specific for bentonite, which is the only system tested which is pressurized when in equilibrium with an unpressurized water phase. Such equilibrium is nicely illus-trated at the end of the freezing cycle in Figure 3-4 where the bentonite sample increases its pressure to a stable value when temperature rises from –5 to –1°C. Note how the pressurized silt sample instead has a decaying pressure response. Note also that the process of reaching equilibrium for the bentonite sample is much faster than when water should be transported out of the samples. This indicates that the water in the bentonite sample is in a liquid phase, i.e. the bentonite water is not frozen (this is also evident from the fact that no ice formation pressure peak is present for this sample). This transport process is schematically illustrated in Figure 3-5b.
Figure 3‑5. Schematic illustration of water transport below 0°C. a) when swelling pressure drops, water must be transported out of the bentonite sample (indicated by arrows). This process is slowed down by the ice surrounding the sample. b) when instead swelling pressure increases (e.g. due to a temperature increase if pressure is low enough as in Figure 3-4), water is transported into the ice free bentonite and the transport process is not suppressed. Note that the amount of water involved in these transport proc-esses is extremely small (in the order of µL).
Ice filled filter
Ice filled filter
Bentonite
Ice filled filter
Ice filled filter
Bentonite
Slow transport Fast transport
a) Pressure drop b) Pressure increase
βPVV ∆⋅=∆
22 TR-10-40
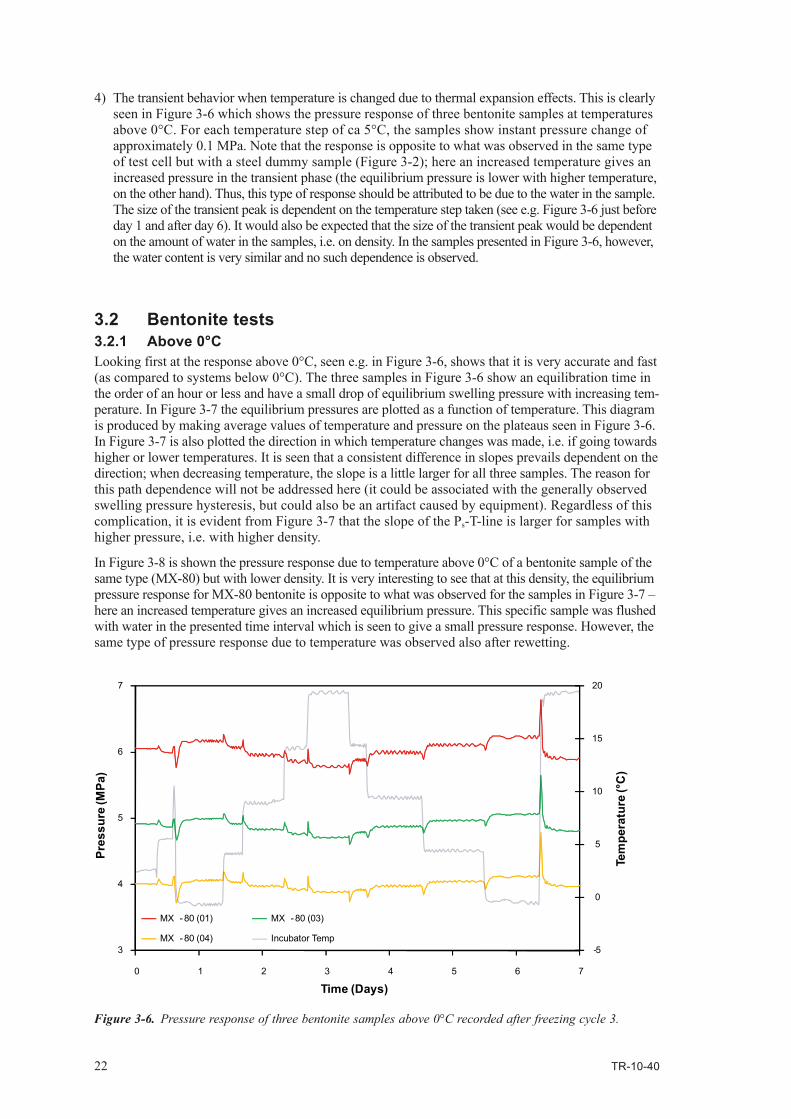
4) The transient behavior when temperature is changed due to thermal expansion effects. This is clearly seen in Figure 3-6 which shows the pressure response of three bentonite samples at temperatures above 0°C. For each temperature step of ca 5°C, the samples show instant pressure change of approximately 0.1 MPa. Note that the response is opposite to what was observed in the same type of test cell but with a steel dummy sample (Figure 3-2); here an increased temperature gives an increased pressure in the transient phase (the equilibrium pressure is lower with higher temperature, on the other hand). Thus, this type of response should be attributed to be due to the water in the sample. The size of the transient peak is dependent on the temperature step taken (see e.g. Figure 3-6 just before day 1 and after day 6). It would also be expected that the size of the transient peak would be dependent on the amount of water in the samples, i.e. on density. In the samples presented in Figure 3-6, however, the water content is very similar and no such dependence is observed.
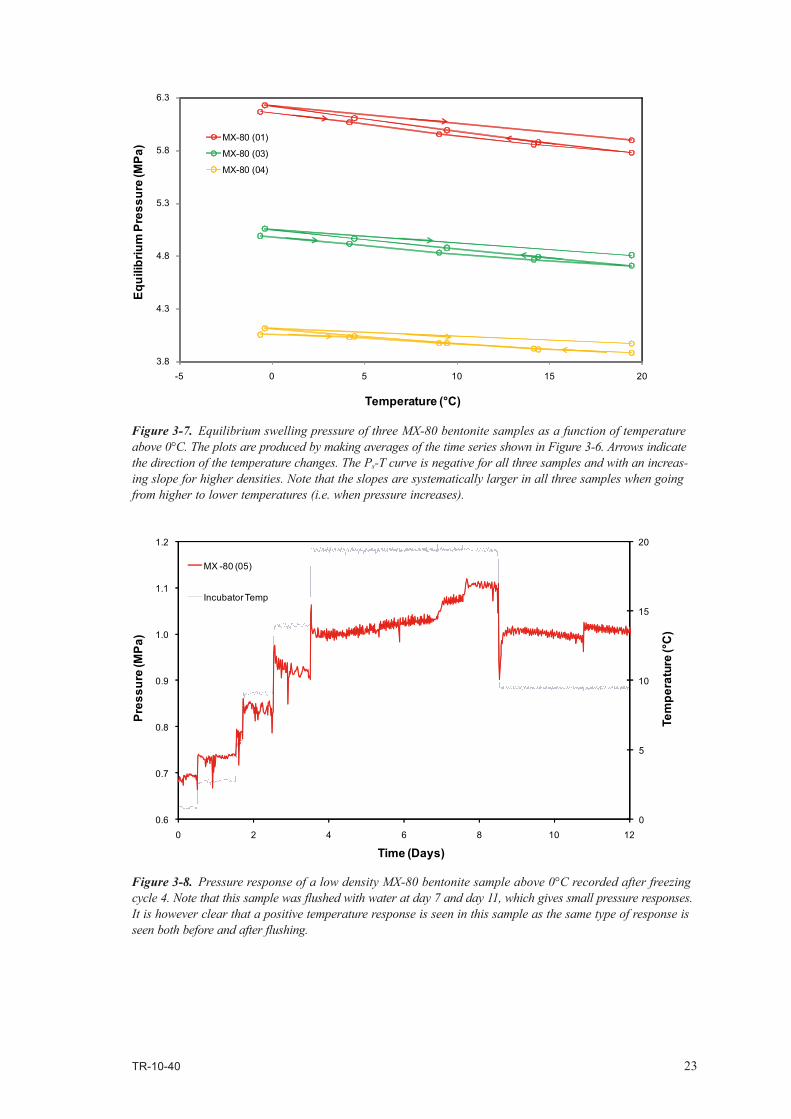
3.2 Bentonite tests3.2.1 Above 0°CLooking first at the response above 0°C, seen e.g. in Figure 3-6, shows that it is very accurate and fast (as compared to systems below 0°C). The three samples in Figure 3-6 show an equilibration time in the order of an hour or less and have a small drop of equilibrium swelling pressure with increasing tem-perature. In Figure 3-7 the equilibrium pressures are plotted as a function of temperature. This diagram is produced by making average values of temperature and pressure on the plateaus seen in Figure 3-6. In Figure 3-7 is also plotted the direction in which temperature changes was made, i.e. if going towards higher or lower temperatures. It is seen that a consistent difference in slopes prevails dependent on the direction; when decreasing temperature, the slope is a little larger for all three samples. The reason for this path dependence will not be addressed here (it could be associated with the generally observed swelling pressure hysteresis, but could also be an artifact caused by equipment). Regardless of this complication, it is evident from Figure 3-7 that the slope of the Ps-T-line is larger for samples with higher pressure, i.e. with higher density.
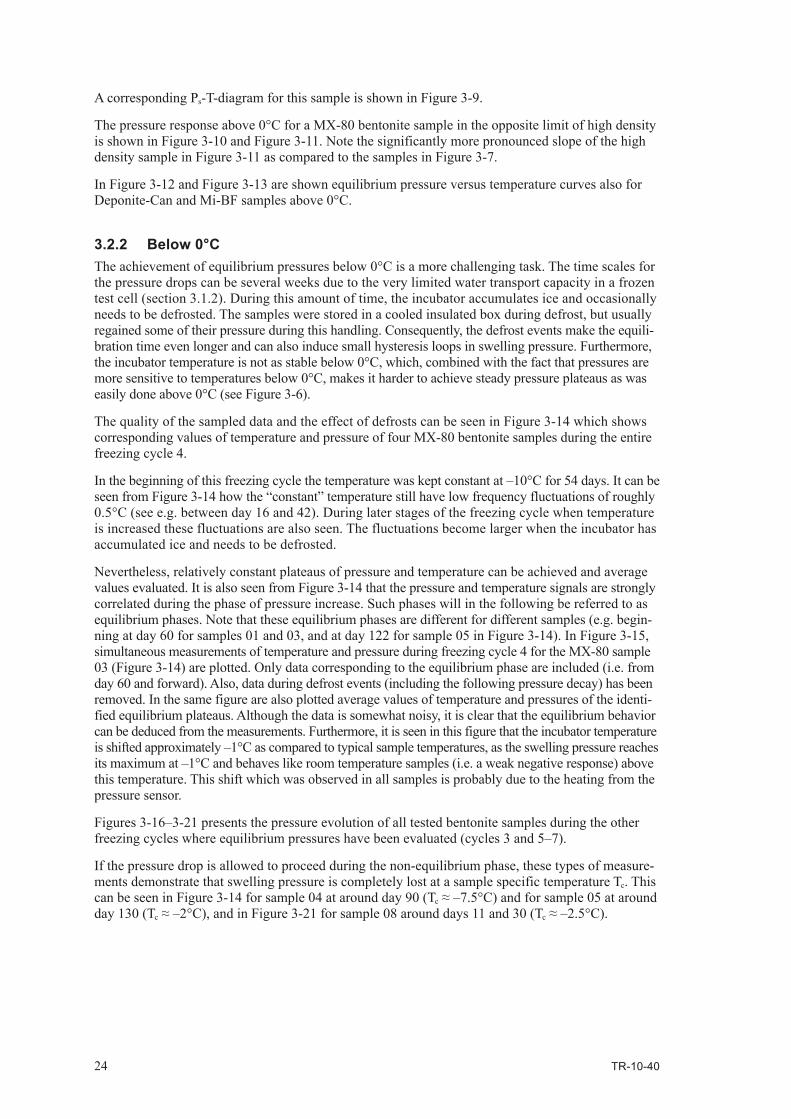
In Figure 3-8 is shown the pressure response due to temperature above 0°C of a bentonite sample of the same type (MX-80) but with lower density. It is very interesting to see that at this density, the equilibrium pressure response for MX-80 bentonite is opposite to what was observed for the samples in Figure 3-7 – here an increased temperature gives an increased equilibrium pressure. This specific sample was flushed with water in the presented time interval which is seen to give a small pressure response. However, the same type of pressure response due to temperature was observed also after rewetting.
Figure 3‑6. Pressure response of three bentonite samples above 0°C recorded after freezing cycle 3.
-5
0
5
10
15
20
3
4
5
6
7
0 1 2 3 4 5 6 7
Pres
sure
(MPa
)
Time (Days)
MX -80 (01) MX -80 (03)
MX -80 (04) Incubator Temp
Tem
pera
ture
(°C
)
TR-10-40 23
Figure 3‑7. Equilibrium swelling pressure of three MX-80 bentonite samples as a function of temperature above 0°C. The plots are produced by making averages of the time series shown in Figure 3-6. Arrows indicate the direction of the temperature changes. The Ps-T curve is negative for all three samples and with an increas-ing slope for higher densities. Note that the slopes are systematically larger in all three samples when going from higher to lower temperatures (i.e. when pressure increases).
Figure 3‑8. Pressure response of a low density MX-80 bentonite sample above 0°C recorded after freezing cycle 4. Note that this sample was flushed with water at day 7 and day 11, which gives small pressure responses. It is however clear that a positive temperature response is seen in this sample as the same type of response is seen both before and after flushing.
3.8
4.3
4.8
5.3
5.8
6.3
-5 0 5 10 15 20
Equi
libriu
m P
ress
ure
(MPa
) MX-80 (01)
MX-80 (03)
MX-80 (04)
Temperature (°C)
0
5
10
15
20
0.6
0.7
0.8
0.9
1.0
1.1
1.2
0 2 4 6 8 10 12
Pres
sure
(MPa
)
Time (Days)
MX -80 (05)
Incubator Temp
Tem
pera
ture
(°C
)
24 TR-10-40
A corresponding Ps-T-diagram for this sample is shown in Figure 3-9.
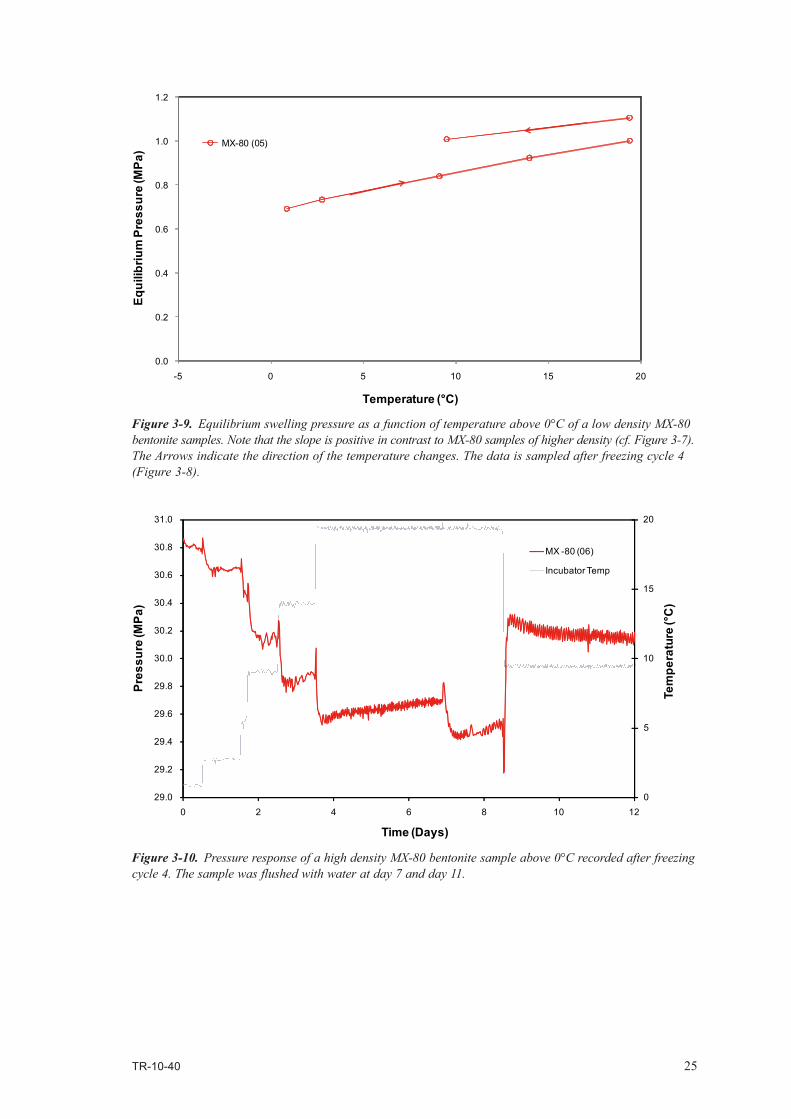
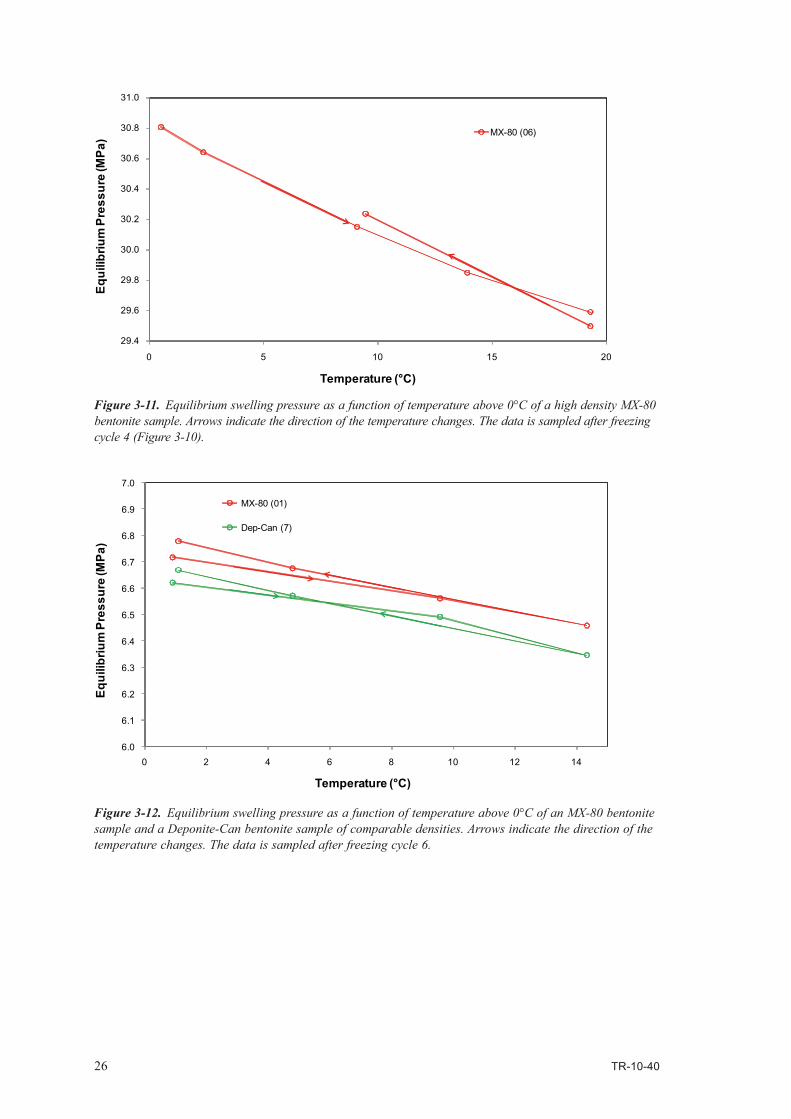
The pressure response above 0°C for a MX-80 bentonite sample in the opposite limit of high density is shown in Figure 3-10 and Figure 3-11. Note the significantly more pronounced slope of the high density sample in Figure 3-11 as compared to the samples in Figure 3-7.
In Figure 3-12 and Figure 3-13 are shown equilibrium pressure versus temperature curves also for Deponite-Can and Mi-BF samples above 0°C.
3.2.2 Below 0°CThe achievement of equilibrium pressures below 0°C is a more challenging task. The time scales for the pressure drops can be several weeks due to the very limited water transport capacity in a frozen test cell (section 3.1.2). During this amount of time, the incubator accumulates ice and occasionally needs to be defrosted. The samples were stored in a cooled insulated box during defrost, but usually regained some of their pressure during this handling. Consequently, the defrost events make the equili-bration time even longer and can also induce small hysteresis loops in swelling pressure. Furthermore, the incubator temperature is not as stable below 0°C, which, combined with the fact that pressures are more sensitive to temperatures below 0°C, makes it harder to achieve steady pressure plateaus as was easily done above 0°C (see Figure 3-6).
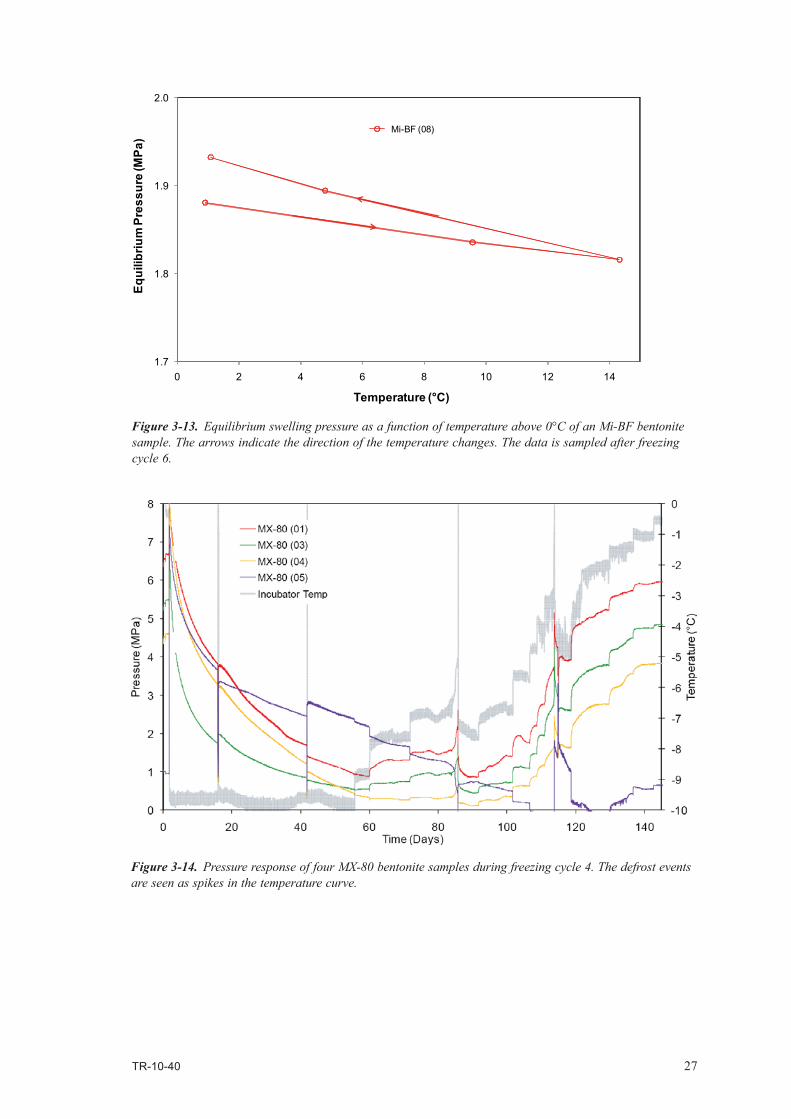
The quality of the sampled data and the effect of defrosts can be seen in Figure 3-14 which shows corresponding values of temperature and pressure of four MX-80 bentonite samples during the entire freezing cycle 4.
In the beginning of this freezing cycle the temperature was kept constant at –10°C for 54 days. It can be seen from Figure 3-14 how the “constant” temperature still have low frequency fluctuations of roughly 0.5°C (see e.g. between day 16 and 42). During later stages of the freezing cycle when temperature is increased these fluctuations are also seen. The fluctuations become larger when the incubator has accumulated ice and needs to be defrosted.
Nevertheless, relatively constant plateaus of pressure and temperature can be achieved and average values evaluated. It is also seen from Figure 3-14 that the pressure and temperature signals are strongly correlated during the phase of pressure increase. Such phases will in the following be referred to as equilibrium phases. Note that these equilibrium phases are different for different samples (e.g. begin-ning at day 60 for samples 01 and 03, and at day 122 for sample 05 in Figure 3-14). In Figure 3-15, simultaneous measurements of temperature and pressure during freezing cycle 4 for the MX-80 sample 03 (Figure 3-14) are plotted. Only data corresponding to the equilibrium phase are included (i.e. from day 60 and forward). Also, data during defrost events (including the following pressure decay) has been removed. In the same figure are also plotted average values of temperature and pressures of the identi-fied equilibrium plateaus. Although the data is somewhat noisy, it is clear that the equilibrium behavior can be deduced from the measurements. Furthermore, it is seen in this figure that the incubator temperature is shifted approximately –1°C as compared to typical sample temperatures, as the swelling pressure reaches its maximum at –1°C and behaves like room temperature samples (i.e. a weak negative response) above this temperature. This shift which was observed in all samples is probably due to the heating from the pressure sensor.
Figures 3-16–3-21 presents the pressure evolution of all tested bentonite samples during the other freezing cycles where equilibrium pressures have been evaluated (cycles 3 and 5–7).
If the pressure drop is allowed to proceed during the non-equilibrium phase, these types of measure-ments demonstrate that swelling pressure is completely lost at a sample specific temperature Tc. This can be seen in Figure 3-14 for sample 04 at around day 90 (Tc ≈ –7.5°C) and for sample 05 at around day 130 (Tc ≈ –2°C), and in Figure 3-21 for sample 08 around days 11 and 30 (Tc ≈ –2.5°C).
TR-10-40 25
Figure 3‑9. Equilibrium swelling pressure as a function of temperature above 0°C of a low density MX-80 bentonite samples. Note that the slope is positive in contrast to MX-80 samples of higher density (cf. Figure 3-7). The Arrows indicate the direction of the temperature changes. The data is sampled after freezing cycle 4 (Figure 3-8).
Figure 3‑10. Pressure response of a high density MX-80 bentonite sample above 0°C recorded after freezing cycle 4. The sample was flushed with water at day 7 and day 11.
0
5
10
15
20
29.0
29.2
29.4
29.6
29.8
30.0
30.2
30.4
30.6
30.8
31.0
0 2 4 6 8 10 12
Pres
sure
(MPa
)
Time (Days)
MX -80 (06)
Incubator Temp
Tem
pera
ture
(°C
)
0.0
0.2
0.4
0.6
0.8
1.0
1.2
-5 0 5 10 15 20
Equi
libriu
m P
ress
ure
(MPa
) MX-80 (05)
Temperature (°C)
26 TR-10-40
Figure 3‑12. Equilibrium swelling pressure as a function of temperature above 0°C of an MX-80 bentonite sample and a Deponite-Can bentonite sample of comparable densities. Arrows indicate the direction of the temperature changes. The data is sampled after freezing cycle 6.
6.0
6.1
6.2
6.3
6.4
6.5
6.6
6.7
6.8
6.9
7.0
0 2 4 6 8 10 12 14
Equi
libriu
m P
ress
ure
(MPa
)
MX-80 (01)
Dep-Can (7)
Temperature (°C)
Figure 3‑11. Equilibrium swelling pressure as a function of temperature above 0°C of a high density MX-80 bentonite sample. Arrows indicate the direction of the temperature changes. The data is sampled after freezing cycle 4 (Figure 3-10).
29.4
29.6
29.8
30.0
30.2
30.4
30.6
30.8
31.0
0 5 10 15 20
Equi
libriu
m P
ress
ure
(MPa
) MX-80 (06)
Temperature (°C)
TR-10-40 27
Figure 3‑13. Equilibrium swelling pressure as a function of temperature above 0°C of an Mi-BF bentonite sample. The arrows indicate the direction of the temperature changes. The data is sampled after freezing cycle 6.
Figure 3‑14. Pressure response of four MX-80 bentonite samples during freezing cycle 4. The defrost events are seen as spikes in the temperature curve.
1.7
1.8
1.9
2.0
0 2 4 6 8 10 12 14
Equi
libriu
m P
ress
ure
(MPa
)Mi-BF (08)
Temperature (°C)
28 TR-10-40
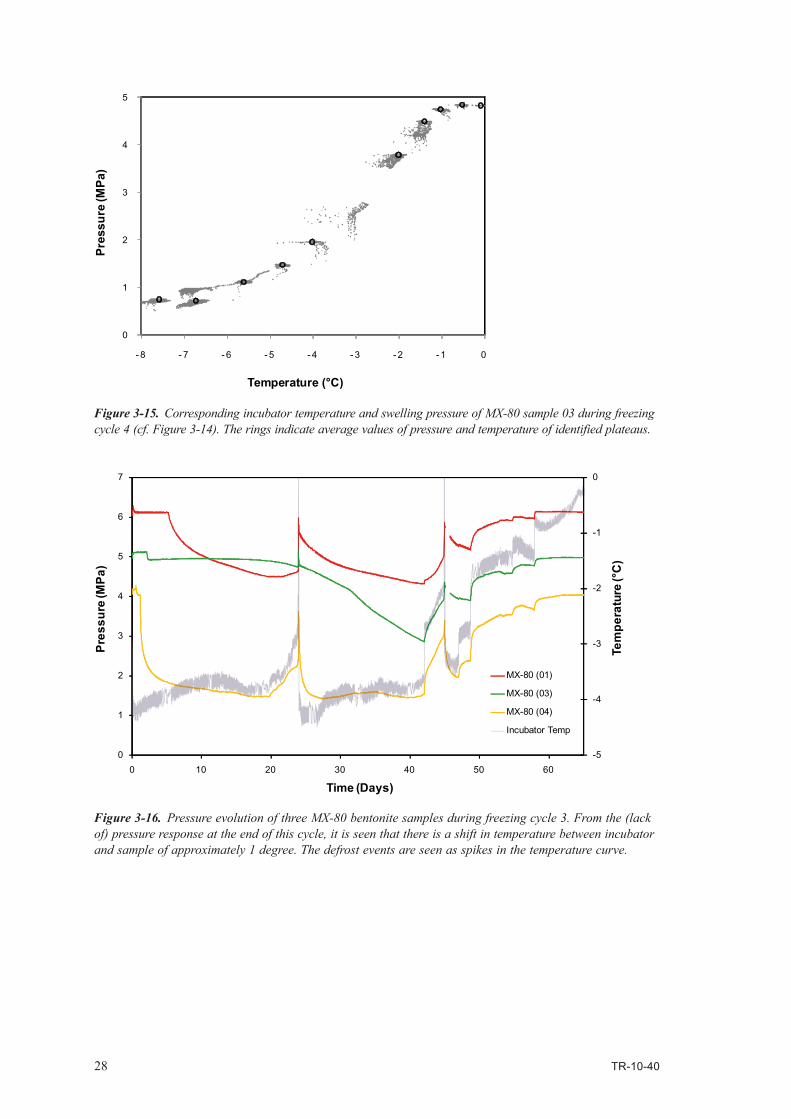
Figure 3‑16. Pressure evolution of three MX-80 bentonite samples during freezing cycle 3. From the (lack of) pressure response at the end of this cycle, it is seen that there is a shift in temperature between incubator and sample of approximately 1 degree. The defrost events are seen as spikes in the temperature curve.
-5
-4
-3
-2
-1
0
0
1
2
3
4
5
6
7
0 10 20 30 40 50 60
Pres
sure
(MPa
)
Time (Days)
MX-80 (01)
MX-80 (03)
MX-80 (04)
Incubator Temp
Tem
pera
ture
(°C
)
Figure 3‑15. Corresponding incubator temperature and swelling pressure of MX-80 sample 03 during freezing cycle 4 (cf. Figure 3-14). The rings indicate average values of pressure and temperature of identified plateaus.
0
1
2
3
4
5
- 8 - 7 - 6 - 5 - 4 - 3 - 2 - 1 0
Pres
sure
(MPa
)
Temperature (°C)
TR-10-40 29
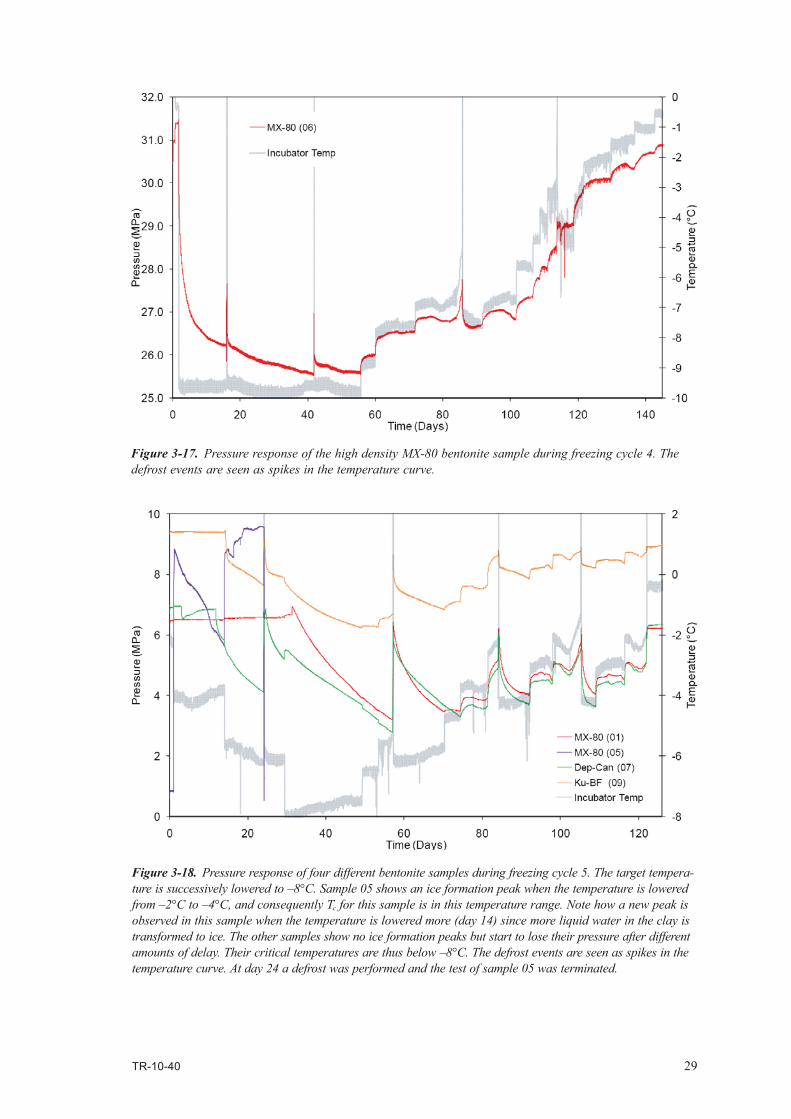
Figure 3‑17. Pressure response of the high density MX-80 bentonite sample during freezing cycle 4. The defrost events are seen as spikes in the temperature curve.
Figure 3‑18. Pressure response of four different bentonite samples during freezing cycle 5. The target tempera-ture is successively lowered to –8°C. Sample 05 shows an ice formation peak when the temperature is lowered from –2°C to –4°C, and consequently Tc for this sample is in this temperature range. Note how a new peak is observed in this sample when the temperature is lowered more (day 14) since more liquid water in the clay is transformed to ice. The other samples show no ice formation peaks but start to lose their pressure after different amounts of delay. Their critical temperatures are thus below –8°C. The defrost events are seen as spikes in the temperature curve. At day 24 a defrost was performed and the test of sample 05 was terminated.
30 TR-10-40
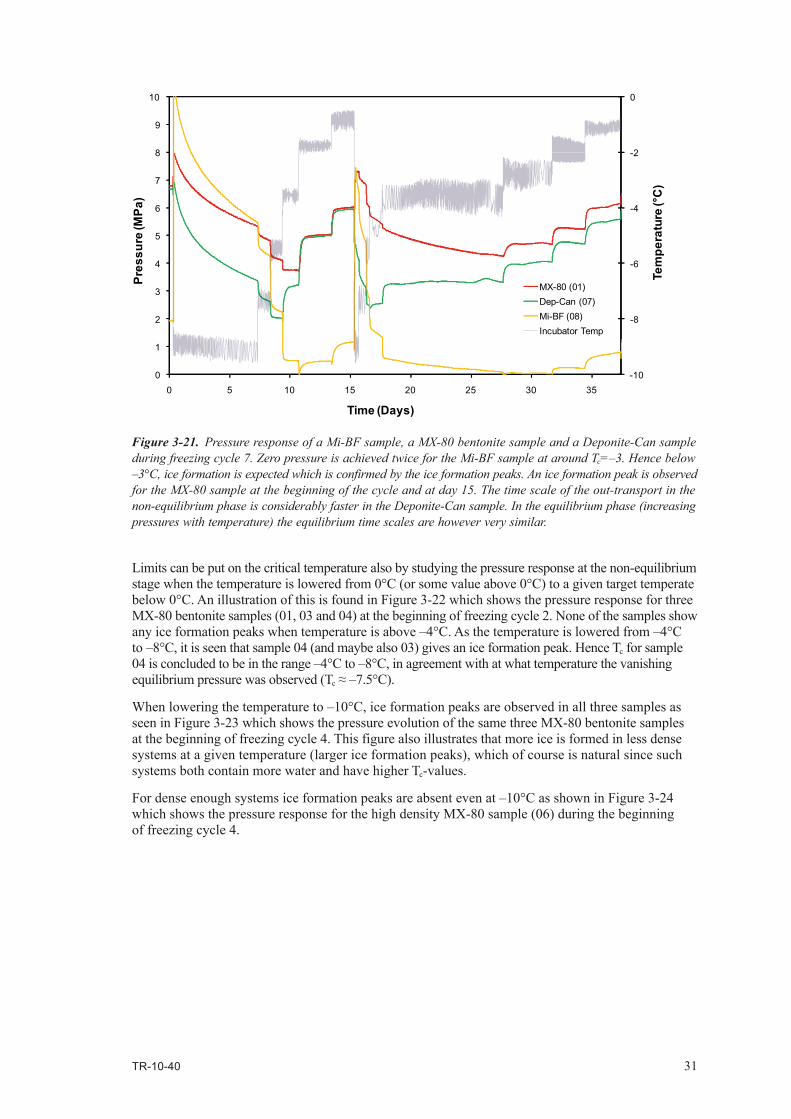
Figure 3‑20. Pressure response of three bentonite samples during freezing cycle 6. The MX-80 sample does not start to lose pressure. Consequently transport is very suppressed in this sample. The Mi-BF sample shows an ice formation peak at the beginning of the cycle when temperature is lowered to –5°C, consequently its critical temperature is higher. The Mi-BF sample also reaches (close to) zero pressure at day 11 at –3°C. Note how the pressure drops with increasing temperatures below Tc (similar to the silt sample in fig Figure 3-4), while it increases with temperature above Tc. The other samples show no ice formation peaks.
-6
-4
-2
0
0
1
2
3
4
5
6
7
8
0 2 4 6 8 10 12 14 16
Pres
sure
(MPa
)
Time (Days)
MX-80 (01)Dep-Can (07)Mi-BF (08)Incubator Temp
Tem
pera
ture
(°C
)
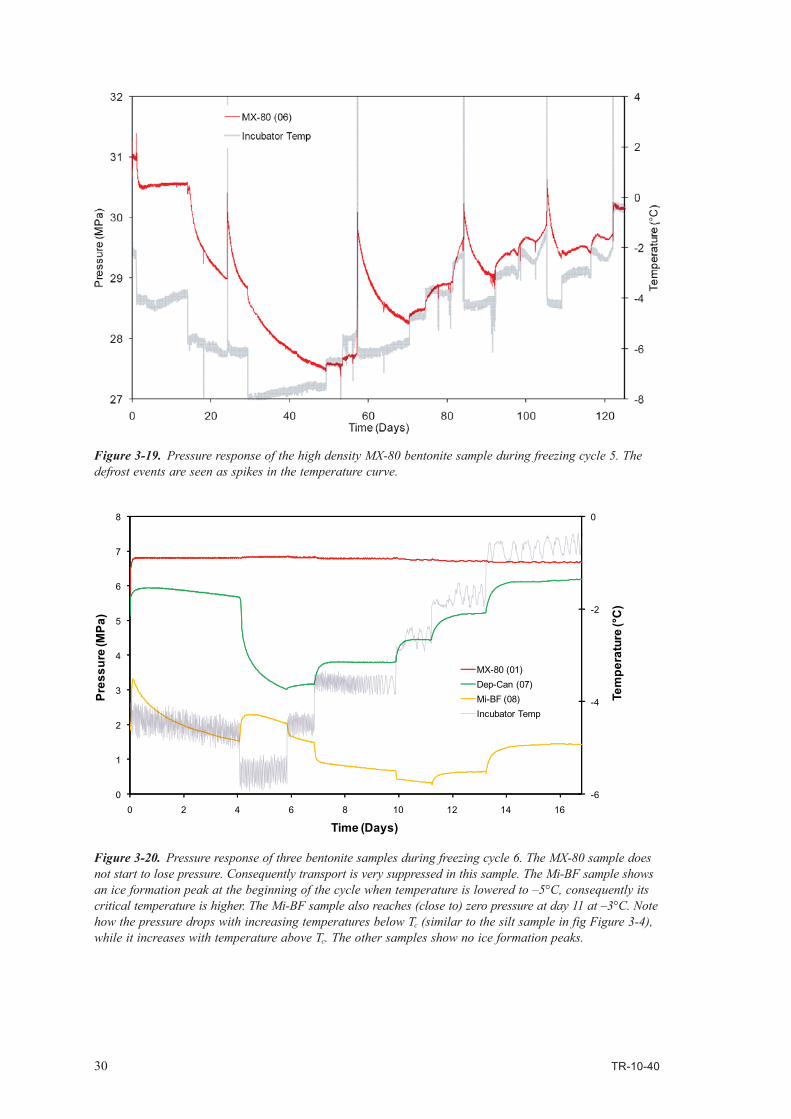
Figure 3‑19. Pressure response of the high density MX-80 bentonite sample during freezing cycle 5. The defrost events are seen as spikes in the temperature curve.
TR-10-40 31
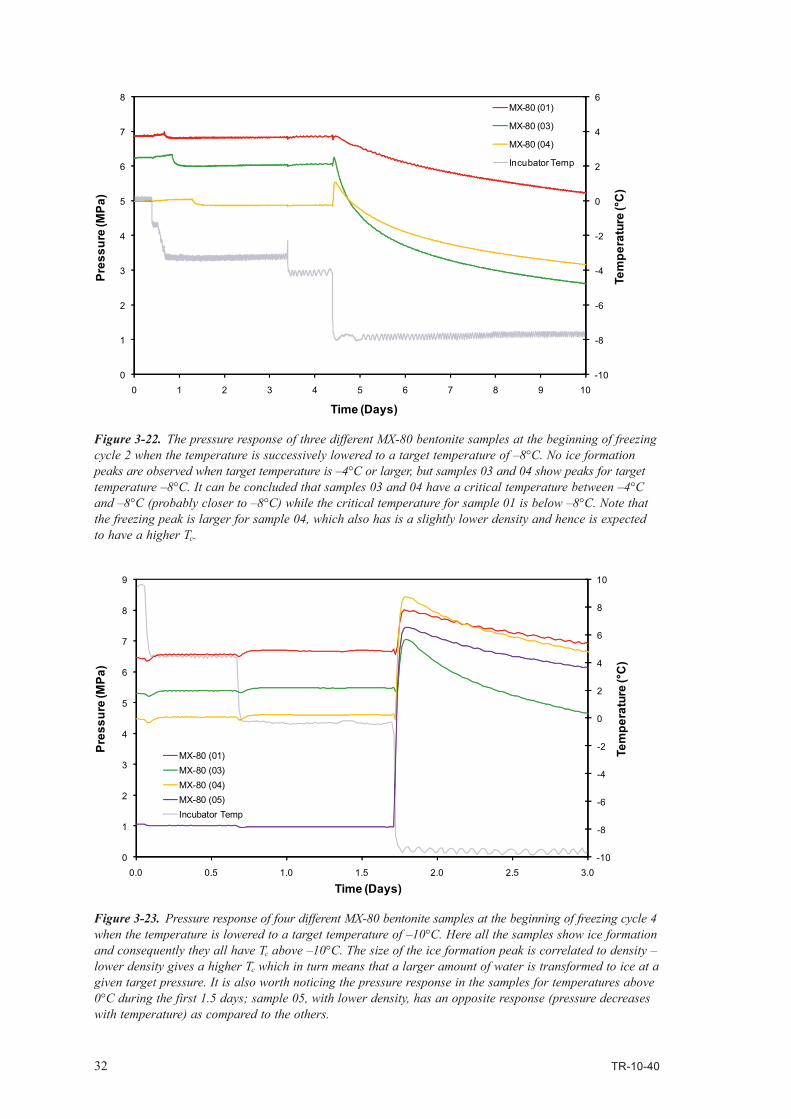
Figure 3‑21. Pressure response of a Mi-BF sample, a MX-80 bentonite sample and a Deponite-Can sample during freezing cycle 7. Zero pressure is achieved twice for the Mi-BF sample at around Tc=–3. Hence below –3°C, ice formation is expected which is confirmed by the ice formation peaks. An ice formation peak is observed for the MX-80 sample at the beginning of the cycle and at day 15. The time scale of the out-transport in the non-equilibrium phase is considerably faster in the Deponite-Can sample. In the equilibrium phase (increasing pressures with temperature) the equilibrium time scales are however very similar.
-10
-8
-6
-4
-2
0
0
1
2
3
4
5
6
7
8
9
10
0 5 10 15 20 25 30 35
Pres
sure
(MPa
)
Time (Days)
MX-80 (01)Dep-Can (07)Mi-BF (08)Incubator Temp
Tem
pera
ture
(°C
)
Limits can be put on the critical temperature also by studying the pressure response at the non-equilibrium stage when the temperature is lowered from 0°C (or some value above 0°C) to a given target temperate below 0°C. An illustration of this is found in Figure 3-22 which shows the pressure response for three MX-80 bentonite samples (01, 03 and 04) at the beginning of freezing cycle 2. None of the samples show any ice formation peaks when temperature is above –4°C. As the temperature is lowered from –4°C to –8°C, it is seen that sample 04 (and maybe also 03) gives an ice formation peak. Hence Tc for sample 04 is concluded to be in the range –4°C to –8°C, in agreement with at what temperature the vanishing equilibrium pressure was observed (Tc ≈ –7.5°C).
When lowering the temperature to –10°C, ice formation peaks are observed in all three samples as seen in Figure 3-23 which shows the pressure evolution of the same three MX-80 bentonite samples at the beginning of freezing cycle 4. This figure also illustrates that more ice is formed in less dense systems at a given temperature (larger ice formation peaks), which of course is natural since such systems both contain more water and have higher Tc-values.
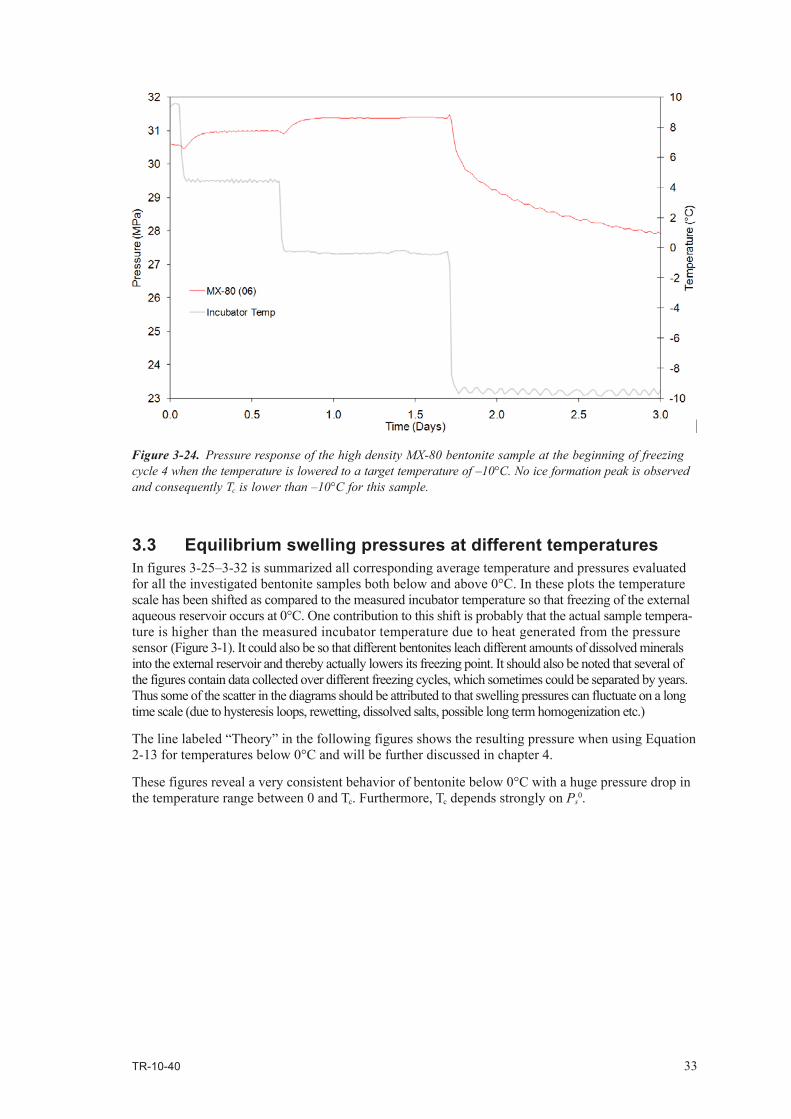
For dense enough systems ice formation peaks are absent even at –10°C as shown in Figure 3-24 which shows the pressure response for the high density MX-80 sample (06) during the beginning of freezing cycle 4.
32 TR-10-40
Figure 3‑23. Pressure response of four different MX-80 bentonite samples at the beginning of freezing cycle 4 when the temperature is lowered to a target temperature of –10°C. Here all the samples show ice formation and consequently they all have Tc above –10°C. The size of the ice formation peak is correlated to density – lower density gives a higher Tc which in turn means that a larger amount of water is transformed to ice at a given target pressure. It is also worth noticing the pressure response in the samples for temperatures above 0°C during the first 1.5 days; sample 05, with lower density, has an opposite response (pressure decreases with temperature) as compared to the others.
-10
-8
-6
-4
-2
0
2
4
6
8
10
0
1
2
3
4
5
6
7
8
9
0.0 0.5 1.0 1.5 2.0 2.5 3.0
Pres
sure
(MPa
)
Time (Days)
MX-80 (01)MX-80 (03)MX-80 (04)MX-80 (05)Incubator Temp
Tem
pera
ture
(°C
)
Figure 3‑22. The pressure response of three different MX-80 bentonite samples at the beginning of freezing cycle 2 when the temperature is successively lowered to a target temperature of –8°C. No ice formation peaks are observed when target temperature is –4°C or larger, but samples 03 and 04 show peaks for target temperature –8°C. It can be concluded that samples 03 and 04 have a critical temperature between –4°C and –8°C (probably closer to –8°C) while the critical temperature for sample 01 is below –8°C. Note that the freezing peak is larger for sample 04, which also has is a slightly lower density and hence is expected to have a higher Tc.
-10
-8
-6
-4
-2
0
2
4
6
0
1
2
3
4
5
6
7
8
0 1 2 3 4 5 6 7 8 9 10
Pres
sure
(MPa
)
Time (Days)
MX-80 (01)
MX-80 (03)
MX-80 (04)
Incubator Temp
Tem
pera
ture
(°C
)
TR-10-40 33
3.3 Equilibrium swelling pressures at different temperaturesIn figures 3-25–3-32 is summarized all corresponding average temperature and pressures evaluated for all the investigated bentonite samples both below and above 0°C. In these plots the temperature scale has been shifted as compared to the measured incubator temperature so that freezing of the external aqueous reservoir occurs at 0°C. One contribution to this shift is probably that the actual sample tempera-ture is higher than the measured incubator temperature due to heat generated from the pressure sensor (Figure 3-1). It could also be so that different bentonites leach different amounts of dissolved minerals into the external reservoir and thereby actually lowers its freezing point. It should also be noted that several of the figures contain data collected over different freezing cycles, which sometimes could be separated by years. Thus some of the scatter in the diagrams should be attributed to that swelling pressures can fluctuate on a long time scale (due to hysteresis loops, rewetting, dissolved salts, possible long term homogenization etc.)
The line labeled “Theory” in the following figures shows the resulting pressure when using Equation 2-13 for temperatures below 0°C and will be further discussed in chapter 4.
These figures reveal a very consistent behavior of bentonite below 0°C with a huge pressure drop in the temperature range between 0 and Tc. Furthermore, Tc depends strongly on Ps
0.
Figure 3‑24. Pressure response of the high density MX-80 bentonite sample at the beginning of freezing cycle 4 when the temperature is lowered to a target temperature of –10°C. No ice formation peak is observed and consequently Tc is lower than –10°C for this sample.
34 TR-10-40
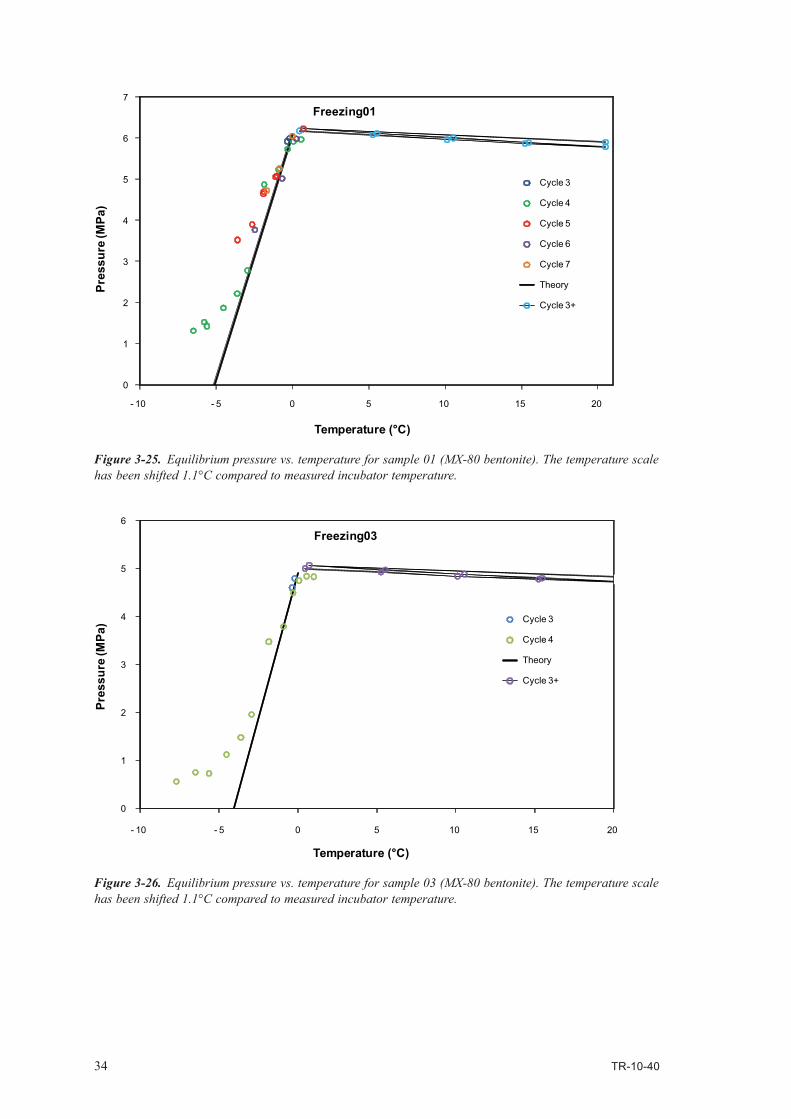
Figure 3‑26. Equilibrium pressure vs. temperature for sample 03 (MX-80 bentonite). The temperature scale has been shifted 1.1°C compared to measured incubator temperature.
0
1
2
3
4
5
6
- 10 - 5 0 5 10 15 20
Pres
sure
(MPa
)
Freezing03
Cycle 3
Cycle 4
Theory
Cycle 3+
Temperature (°C)
0
1
2
3
4
5
6
7
- 10 - 5 0 5 10 15 20
Pres
sure
(MPa
)Freezing01
Cycle 3
Cycle 4
Cycle 5
Cycle 6
Cycle 7
Theory
Cycle 3+
Temperature (°C)
Figure 3‑25. Equilibrium pressure vs. temperature for sample 01 (MX-80 bentonite). The temperature scale has been shifted 1.1°C compared to measured incubator temperature.
TR-10-40 35
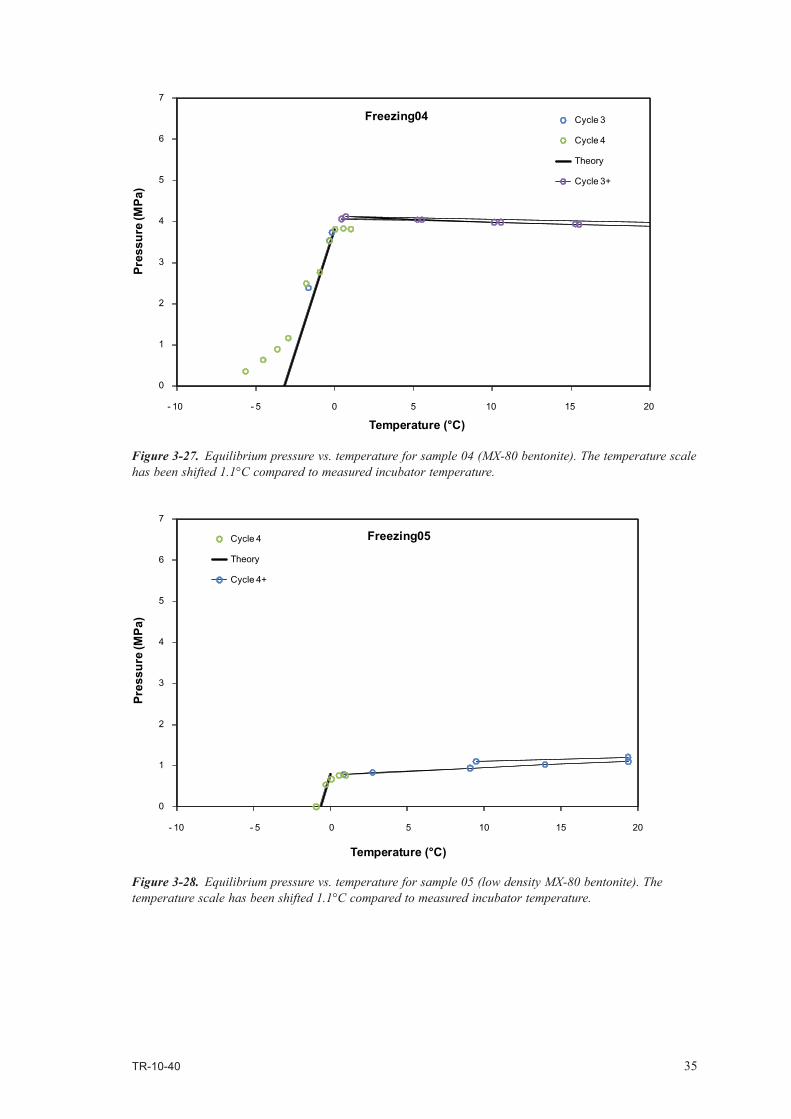
Figure 3‑27. Equilibrium pressure vs. temperature for sample 04 (MX-80 bentonite). The temperature scale has been shifted 1.1°C compared to measured incubator temperature.
Figure 3‑28. Equilibrium pressure vs. temperature for sample 05 (low density MX-80 bentonite). The temperature scale has been shifted 1.1°C compared to measured incubator temperature.
0
1
2
3
4
5
6
7
- 10 - 5 0 5 10 15 20
Pres
sure
(MPa
)Freezing04 Cycle 3
Cycle 4
Theory
Cycle 3+
Temperature (°C)
0
1
2
3
4
5
6
7
- 10 - 5 0 5 10 15 20
Pres
sure
(MPa
)
Freezing05Cycle 4
Theory
Cycle 4+
Temperature (°C)
36 TR-10-40
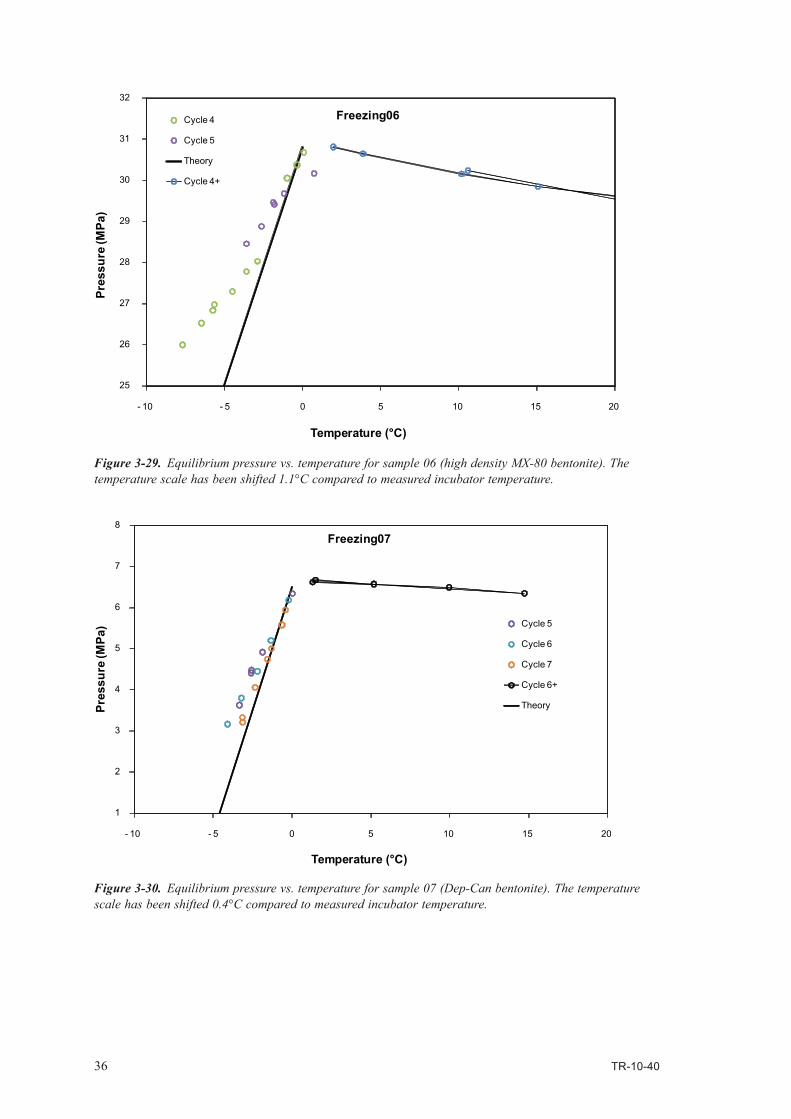
Figure 3‑30. Equilibrium pressure vs. temperature for sample 07 (Dep-Can bentonite). The temperature scale has been shifted 0.4°C compared to measured incubator temperature.
1
2
3
4
5
6
7
8
- 10 - 5 0 5 10 15 20
Pres
sure
(MPa
)
Freezing07
Cycle 5
Cycle 6
Cycle 7
Cycle 6+
Theory
Temperature (°C)
Figure 3‑29. Equilibrium pressure vs. temperature for sample 06 (high density MX-80 bentonite). The temperature scale has been shifted 1.1°C compared to measured incubator temperature.
25
26
27
28
29
30
31
32
- 10 - 5 0 5 10 15 20
Pres
sure
(MPa
)Freezing06Cycle 4
Cycle 5
Theory
Cycle 4+
Temperature (°C)
TR-10-40 37
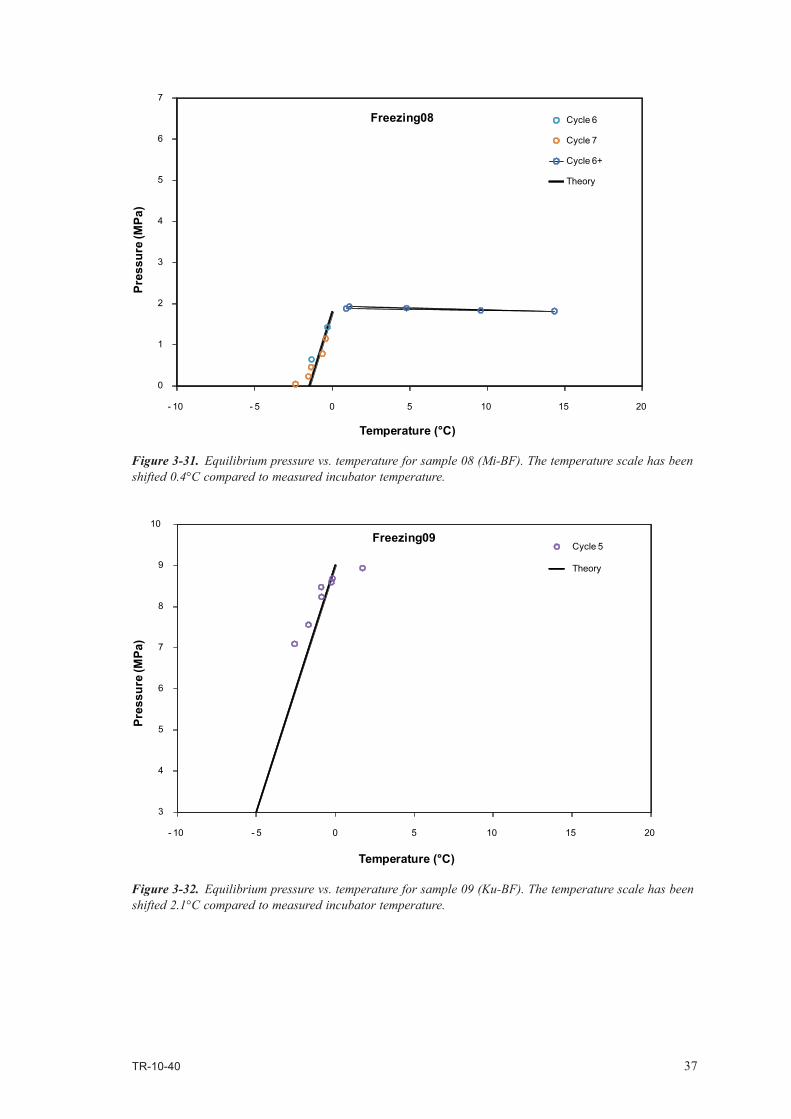
Figure 3‑31. Equilibrium pressure vs. temperature for sample 08 (Mi-BF). The temperature scale has been shifted 0.4°C compared to measured incubator temperature.
Figure 3‑32. Equilibrium pressure vs. temperature for sample 09 (Ku-BF). The temperature scale has been shifted 2.1°C compared to measured incubator temperature.
0
1
2
3
4
5
6
7
- 10 - 5 0 5 10 15 20
Pres
sure
(MPa
)Freezing08 Cycle 6
Cycle 7
Cycle 6+
Theory
Temperature (°C)
3
4
5
6
7
8
9
10
- 10 - 5 0 5 10 15 20
Pres
sure
(MPa
)
Freezing09Cycle 5
Theory
Temperature (°C)
TR-10-40 39
4 Discussion
4.1 Comparison between experimental findings and theoretical predictions
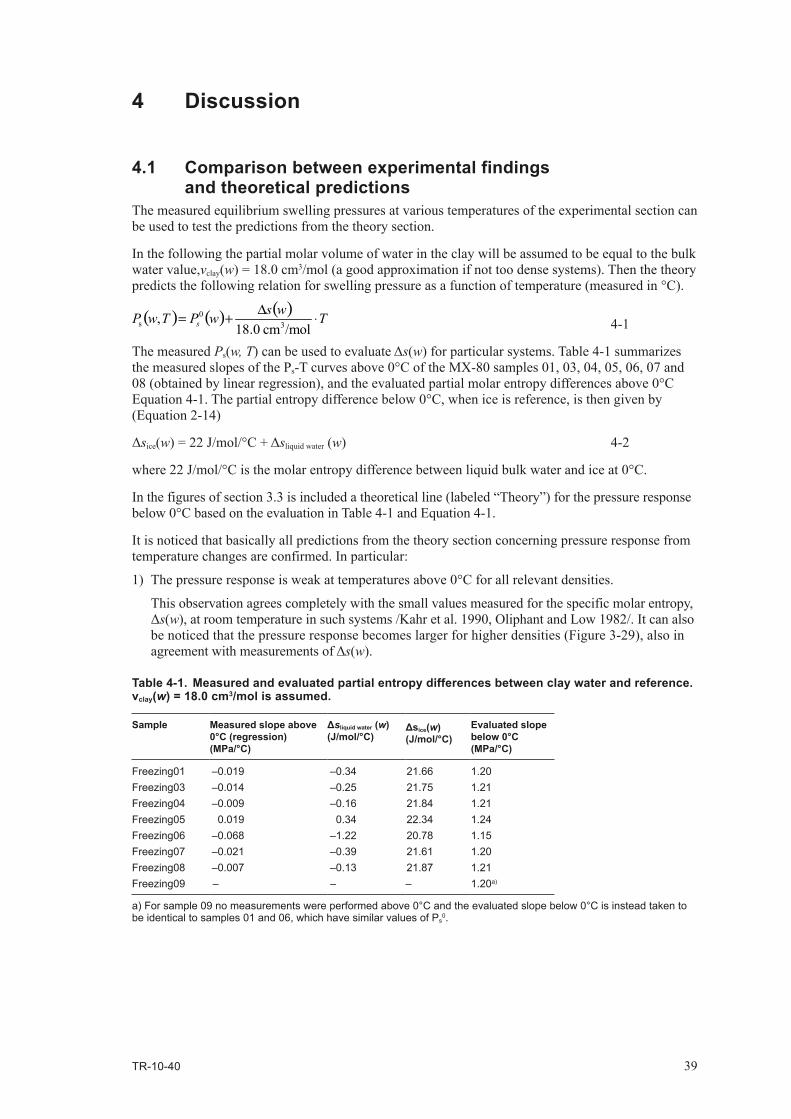
The measured equilibrium swelling pressures at various temperatures of the experimental section can be used to test the predictions from the theory section.
In the following the partial molar volume of water in the clay will be assumed to be equal to the bulk water value,vclay(w) = 18.0 cm3/mol (a good approximation if not too dense systems). Then the theory predicts the following relation for swelling pressure as a function of temperature (measured in °C).
4-1
The measured Ps(w, T) can be used to evaluate Δs(w) for particular systems. Table 4-1 summarizes the measured slopes of the Ps-T curves above 0°C of the MX-80 samples 01, 03, 04, 05, 06, 07 and 08 (obtained by linear regression), and the evaluated partial molar entropy differences above 0°C Equation 4-1. The partial entropy difference below 0°C, when ice is reference, is then given by (Equation 2-14)
Δsice(w) = 22 J/mol/°C + Δsliquid water (w)
4-2
where 22 J/mol/°C is the molar entropy difference between liquid bulk water and ice at 0°C.
In the figures of section 3.3 is included a theoretical line (labeled “Theory”) for the pressure response below 0°C based on the evaluation in Table 4-1 and Equation 4-1.
It is noticed that basically all predictions from the theory section concerning pressure response from temperature changes are confirmed. In particular:
1) The pressure response is weak at temperatures above 0°C for all relevant densities.
This observation agrees completely with the small values measured for the specific molar entropy, Δs(w), at room temperature in such systems / Kahr et al. 1990, Oliphant and Low 1982/. It can also be noticed that the pressure response becomes larger for higher densities (Figure 3-29), also in agreement with measurements of Δs(w).
( ) ( ) ( ) TwswPTwP s ⋅∆+=/molcm0.18
, 30
s
Table 4‑1. Measured and evaluated partial entropy differences between clay water and reference. vclay(w) = 18.0 cm3/mol is assumed.
Sample Measured slope above 0°C (regression) (MPa/°C)
Δsliquid water (w) (J/mol/°C)
Δsice(w) (J/mol/°C)
Evaluated slope below 0°C (MPa/°C)
Freezing01 –0.019 –0.34 21.66 1.20Freezing03 –0.014 –0.25 21.75 1.21Freezing04 –0.009 –0.16 21.84 1.21Freezing05 0.019 0.34 22.34 1.24Freezing06 –0.068 –1.22 20.78 1.15Freezing07 –0.021 –0.39 21.61 1.20Freezing08 –0.007 –0.13 21.87 1.21Freezing09 – – – 1.20a)
a) For sample 09 no measurements were performed above 0°C and the evaluated slope below 0°C is instead taken to be identical to samples 01 and 06, which have similar values of Ps
0.
40 TR-10-40
2) The pressure response is negative above 0°C at high enough densities. Also this observation is in agreement with measurements of Δs(w), which is negative for low enough
water/solid mass ratios / Kahr et al. 1990/. The negative values of Δs(w) shows that there is more than one component which contribute to swelling pressure in bentonite. If the bentonite systems functioned exactly like a salt solution, it would be expected that Δs(w) would be positive for any value of w because intercalating water in between interlayers would then be equivalent to dilute a salt solution which gives a positive contribution to entropy due to mixing. The fact that Δs(w) is negative at low enough water/solid mass ratio indicates that there must be a mechanism additional to mixing entropy which contributes negative to Δs(w). This additional mechanism is hydration of the interlayer space, i.e. chemical binding of water molecules to counter ions and surfaces when the water content is low / Newman 1987/.
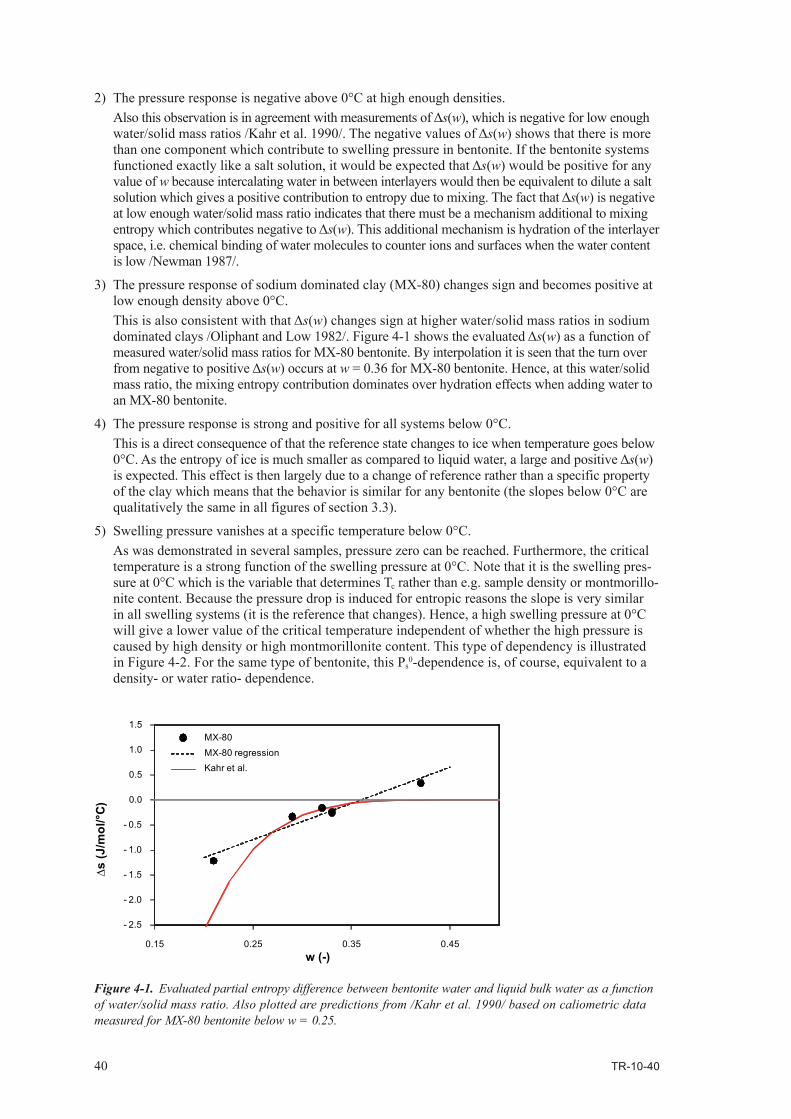
3) The pressure response of sodium dominated clay (MX-80) changes sign and becomes positive at low enough density above 0°C.
This is also consistent with that Δs(w) changes sign at higher water/solid mass ratios in sodium dominated clays / Oliphant and Low 1982/. Figure 4-1 shows the evaluated Δs(w) as a function of measured water/solid mass ratios for MX-80 bentonite. By interpolation it is seen that the turn over from negative to positive Δs(w) occurs at w = 0.36 for MX-80 bentonite. Hence, at this water/solid mass ratio, the mixing entropy contribution dominates over hydration effects when adding water to an MX-80 bentonite.
4) The pressure response is strong and positive for all systems below 0°C. This is a direct consequence of that the reference state changes to ice when temperature goes below
0°C. As the entropy of ice is much smaller as compared to liquid water, a large and positive Δs(w) is expected. This effect is then largely due to a change of reference rather than a specific property of the clay which means that the behavior is similar for any bentonite (the slopes below 0°C are qualitatively the same in all figures of section 3.3).
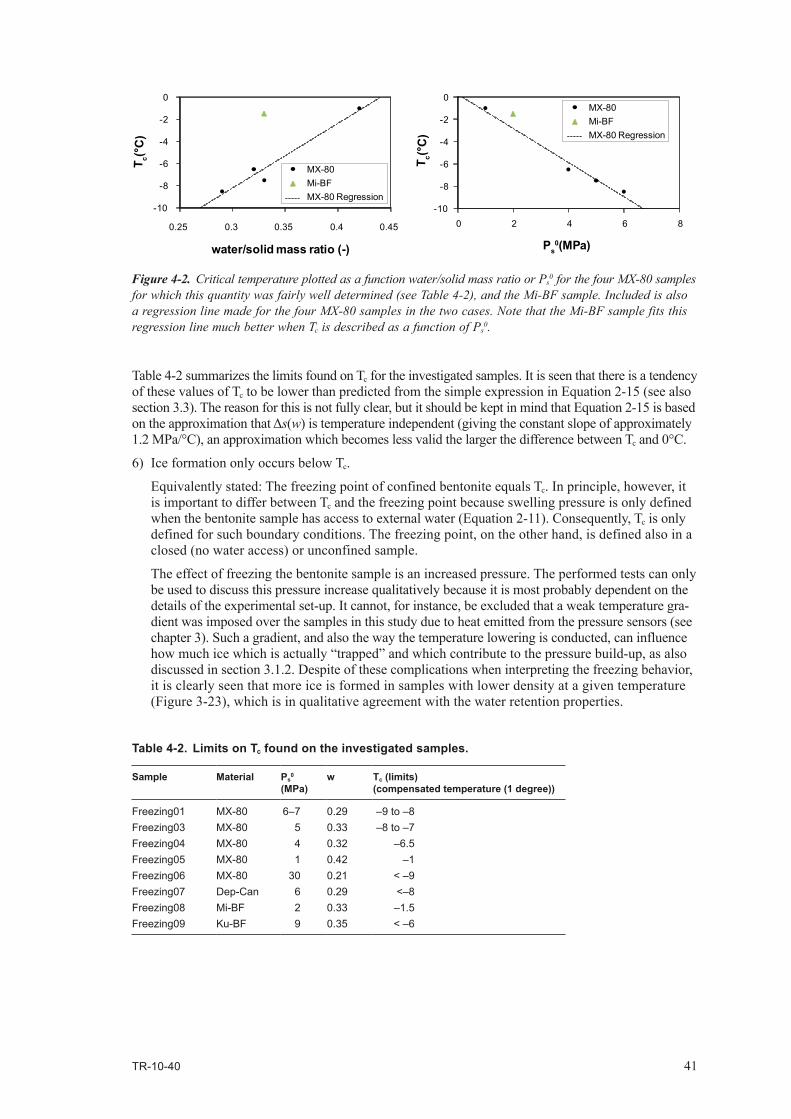
5) Swelling pressure vanishes at a specific temperature below 0°C. As was demonstrated in several samples, pressure zero can be reached. Furthermore, the critical
temperature is a strong function of the swelling pressure at 0°C. Note that it is the swelling pres-sure at 0°C which is the variable that determines Tc rather than e.g. sample density or montmorillo-nite content. Because the pressure drop is induced for entropic reasons the slope is very similar in all swelling systems (it is the reference that changes). Hence, a high swelling pressure at 0°C will give a lower value of the critical temperature independent of whether the high pressure is caused by high density or high montmorillonite content. This type of dependency is illustrated in Figure 4-2. For the same type of bentonite, this Ps
0-dependence is, of course, equivalent to a density- or water ratio- dependence.
Figure 4‑1. Evaluated partial entropy difference between bentonite water and liquid bulk water as a function of water/solid mass ratio. Also plotted are predictions from / Kahr et al. 1990/ based on caliometric data measured for MX-80 bentonite below w = 0.25.
- 2.5
- 2.0
- 1.5
- 1.0
- 0.5
0.0
0.5
1.0
1.5
0.15 0.25 0.35 0.45
Kahr et al.
w (-)
∆s (J
/mol
/°C
)
MX-80MX-80 regression
TR-10-40 41
Table 4-2 summarizes the limits found on Tc for the investigated samples. It is seen that there is a tendency of these values of Tc to be lower than predicted from the simple expression in Equation 2-15 (see also section 3.3). The reason for this is not fully clear, but it should be kept in mind that Equation 2-15 is based on the approximation that Δs(w) is temperature independent (giving the constant slope of approximately 1.2 MPa/°C), an approximation which becomes less valid the larger the difference between Tc and 0°C.
6) Ice formation only occurs below Tc.
Equivalently stated: The freezing point of confined bentonite equals Tc. In principle, however, it is important to differ between Tc and the freezing point because swelling pressure is only defined when the bentonite sample has access to external water (Equation 2-11). Consequently, Tc is only defined for such boundary conditions. The freezing point, on the other hand, is defined also in a closed (no water access) or unconfined sample.
The effect of freezing the bentonite sample is an increased pressure. The performed tests can only be used to discuss this pressure increase qualitatively because it is most probably dependent on the details of the experimental set-up. It cannot, for instance, be excluded that a weak temperature gra-dient was imposed over the samples in this study due to heat emitted from the pressure sensors (see chapter 3). Such a gradient, and also the way the temperature lowering is conducted, can influence how much ice which is actually “trapped” and which contribute to the pressure build-up, as also discussed in section 3.1.2. Despite of these complications when interpreting the freezing behavior, it is clearly seen that more ice is formed in samples with lower density at a given temperature (Figure 3-23), which is in qualitative agreement with the water retention properties.
Figure 4‑2. Critical temperature plotted as a function water/solid mass ratio or Ps0 for the four MX-80 samples
for which this quantity was fairly well determined (see Table 4-2), and the Mi-BF sample. Included is also a regression line made for the four MX-80 samples in the two cases. Note that the Mi-BF sample fits this regression line much better when Tc is described as a function of Ps
0.
-10
-8
-6
-4
-2
0
0 2 4 6 8
T c(°C
)
Ps0(MPa)
MX-80Mi-BFMX-80 Regression
-10
-8
-6
-4
-2
0
0.25 0.3 0.35 0.4 0.45
MX-80Mi-BFMX-80 Regression
T c(°C
)
water/solid mass ratio (-)
Table 4‑2. Limits on Tc found on the investigated samples.
Sample Material Ps0
(MPa)w Tc (limits)
(compensated temperature (1 degree))
Freezing01 MX-80 6–7 0.29 –9 to –8Freezing03 MX-80 5 0.33 –8 to –7Freezing04 MX-80 4 0.32 –6.5Freezing05 MX-80 1 0.42 –1Freezing06 MX-80 30 0.21 < –9Freezing07 Dep-Can 6 0.29 <–8Freezing08 Mi-BF 2 0.33 –1.5Freezing09 Ku-BF 9 0.35 < –6
42 TR-10-40
4.2 Implications on microstructure of compacted bentoniteThe fact that ice formation was observed only below Tc, and that this crictical temperature is a strong function of swelling pressure at 0°C in any of the samples under investigation, is a very strong indica-tion that water saturated compacted bentonite contains a negligible amount of pores on the micrometer scale. Also the qualitative agreement between observations and the theory presented in chapter 2 imply that the structure of compacted bentonite is completely dominated by montmorillonite interlayers (see Figure 2-4A).
TR-10-40 43
5 Consequences for safety assessment of the KBS‑3 concept
The present work has provided a basically complete theoretical description of the pressure response due to temperature in bentonite above Tc. From these results it can be concluded that any bentonite component of the KBS-3 repository – buffer, backfill or bore hole seals – will strive for lowering its pressure as the temperature drops below 0°C. The size of the equilibrium pressure drop depends, for all relevant bentonite densities, basically only on the difference in molar entropy between bulk water and ice, which at 0°C corresponds to 1.2 MPa/°C. Because the pressure drop is determined by prop-erties not related to the clay, the same behavior is expected independent of what specific bentonite is used. The dominating parameter which determines Tc is thus the equilibrium swelling pressure at 0°C (which of course in turn is determined by e.g. density, montmorillonite content, montmorillonite layer charge etc.).
This chapter discusses the various repository components with respect to freezing. The most pessimistic permafrost scenario for the KBS-3 repository predicts a minimum temperature at repository level of approximately –2°C / SKB 2006a/. In the following, this extreme scenario will be considered.
Confined bentonite in contact with saline ground water results in a lower swelling pressure above 0°C as compared to non-saline conditions. This effect, however, does not result in an increased freezing temperature as the freezing point of the external aqueous reservoir lowers. Actually, saline conditions lead to a lower freezing point of bentonite because salt enters the clay and contribute to lowering the chemical potential of the water. Therefore, in the following only non-saline conditions are considered.
Furthermore, it will be assumed in the following that the ground water in the rock freezes at 0°C, neglecting also e.g. freezing point depression due to hydrostatic pressure. Actually (and naturally), any mechanism which lowers the freezing point of the external aqueous reservoir will only contrib-ute to reduce the effects of freezing.
5.1 BufferA reference buffer material in the safety assessment SR-Can is MX-80 bentonite of bulk density 2,000 kg/m3 /SKB 2006b/. The corresponding swelling pressure of this material under non-saline conditions is 7–8 MPa, which, in turn, corresponds to a Tc of approximately –6°C (Equation 2-15). Considering also the accepted density range of 1,950–2,050 kg/m3, which gives a swelling pressure interval of 5–13 MPa (see e.g. / Karnland et al. 2006, Karnland et al. 2009/), the range for Tc is between –4°C and –11°C.
Consequently the buffer will not be frozen during the repository lifetime, and the canisters will not experience any potentially damaging pressure peaks.
At –2°C the pressure drop will be approximately 2.5 MPa and the resulting minimum swelling pressure range is thus 2.5–10.5 MPa. Note, that to achieve this equilibrium pressure, a small amount of water must be able to be transported out of the deposition hole. Should this not be possible, the initial swell-ing pressure prevails.
44 TR-10-40
5.2 BackfillThe swelling pressure of the backfill can be significantly lower than that in the buffer, and it cannot be excluded that it will be frozen in certain time intervals during periods of permafrost. Furthermore, the backfill is extended vertically in ramp and shafts and therefore parts of it will experience temperatures lower than those at repository level. Freezing of the backfill is not a problem per se, as the process has been demonstrated to be reversible. However, it could be imagined that freezing occurs in the backfill in a position closer to surface level while the rock surrounding the repository is frozen. This could lead to increasing pressures in the repository as liquid water is “trapped” in a frozen rock matrix. Such a scenario can only occur, however, when the temperature at repository level is below 0°C.
An estimation of the possible maximum pressure can be made by assuming the same freezing point depression due to pressure for bentonite as for liquid bulk water, i.e. 0.074°C/MPa / CRC 1973/. As the temperature at most will be lowered 2°C when the surrounding rock is frozen, this corresponds to an equilibrium pressure of 26 MPa. This pressure will add to the usual buffer swelling pressure and consequently result in a maximum pressure interval for the buffer of 31–39 MPa. Note that this is a hydrostatic pressure and will not be harmful to the canisters / SKB 2006b/.
5.3 Bore hole sealThe reference density of the bore hole is the same as for the buffer. The seals will however most likely be exposed to temperatures below Tc due to their vertical extension up to ca 100 m below surface (Figure 5-1). The bore hole seal component also experiences a thermal gradient due to its vertical extent. The average value of the geothermal gradient is 0.025°C/m and at the locations of Forsmark and Laxemar the measured geothermal gradients in the topmost 1,000 m is below 0.020°C/m / Sundberg et al. 2009/.
During periods of permafrost, the bore hole seal could connect parts of the crystalline rock in which the temperature is above 0°C to parts where ice formation occurs. Hence, this design could give frost heave effects as water is transported from liquid parts to build up an ice lens, as schematically pictured in Figure 5-1. The driving force for water transport in the bentonite is a gradient in suction (see section 2.1), and from the present study it is found that in the temperature range 0°C to Tc, this gradient is of the order 1.2 MPa/°C for a system of homogeneous density. Using the geothermal temperature gradient, the suction gradient is directly seen to be 0.03 MPa/m, or 3 m water column/m. The latter quantity can directly be put in the expression for the Darcy flow, assuming a hydraulic conductivity of Ch=10–13 m/s / Karnland et al. 2006/ gives a flow of
5-1
This flow puts an upper limit on the speed of a possible ice lens growth. It should be noted that with the assumptions made of a constant geothermal gradient, this limit is independent of the length that water must travel.
Because the problem at hand in principle is one dimensional, this evaluated flux can directly be converted to an ice lens length increase per year as
ice length increase = 1.09 ∙ 3 ∙ 10-13 m/s ∙ 3.15 ∙ 107 s/y ≈ 10 µm/y 5-2
where the factor 1.09 comes from the volume expansion when liquid water transforms into ice. From this estimate it is seen that ice lens formation will not cause a problem, as it at the most will give a build-up of 10 cm over a period of 10,000 years. Notice that since this water transport process is serial in character, it is the lowest value of hydraulic conductivity over the involved length which will determine q, i.e. the section with the lowest Ch which will be rate determining. Hence, the pre-diction of Equation 5-2 is quite robust. Furthermore, the process is only active when the temperature in the highest parts of the seal is below Tc, which will only occur during parts of a permafrost period.
m/s103 13−⋅=∇−= ψhCq
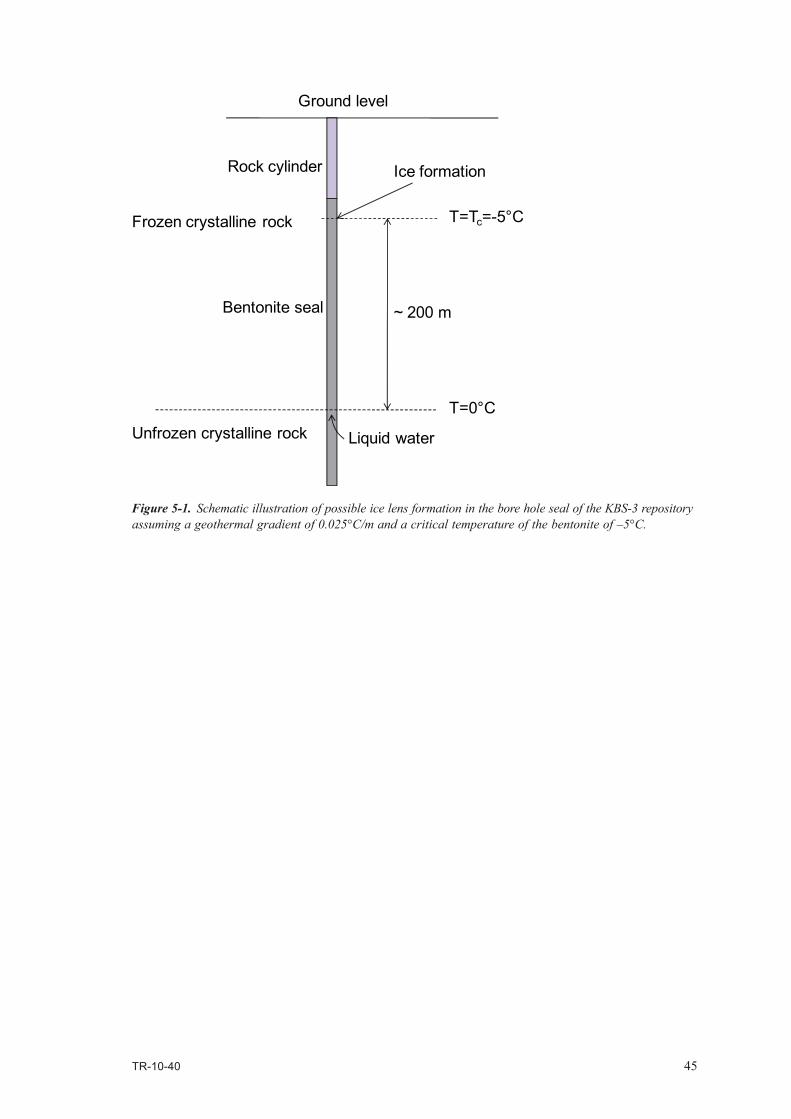
TR-10-40 45
Figure 5‑1. Schematic illustration of possible ice lens formation in the bore hole seal of the KBS-3 repository assuming a geothermal gradient of 0.025°C/m and a critical temperature of the bentonite of –5°C.
T=Tc=-5°C
T=0°C
~ 200 m
Liquid water
Ground level
Frozen crystalline rock
Unfrozen crystalline rock
Ice formation
Bentonite seal
Rock cylinder
TR-10-40 47
6 Summary and conclusions
A theoretical framework, based on simple thermodynamic arguing, has been presented for swelling pressure response of bentonite at any temperature above Tc. Tc is the critical temperature below 0°C where the chemical potential of unconfined clay water equals that of ice. Hence, by definition, Tc also quantifies the freezing point of the bentonite.
A large laboratory study was conducted, investigating the swelling pressure as a function of temperature both below and above 0°C on bentonite samples on the cm-scale.
It was found that the presented theory is able to predict the swelling pressure behavior quantitatively in the entire temperature range of its validity:
• The swelling pressure variation with temperature is determined by the difference in partial molar entropy between water in the bentonite and water in the external phase.
• At temperatures above 0°C, the external phase is liquid bulk water and the difference in partial molar entropy is small giving a small pressure response.
• At temperatures below 0°C, the external phase is ice and the difference in partial molar entropy is large and positive giving a large and positive pressure response. A positive pressure response means that swelling pressure lowers (significantly) when temperature does, with approximately 1.2 MPa/°C.
• At the critical temperature Tc swelling pressure is completely lost. Tc is a strong function of the swelling pressure measured at 0°C. The mechanism of losing swelling pressure is completely analogous to that of freezing point depression in salt solutions.
• No pressure peaks due to ice formation was observed in any bentonite sample when 0°C was passed. Not until temperature is below the critical temperature Tc will ice start to form in the system, i.e. Tc quantifies the freezing point of bentonite.
• Bentonite samples were tested in up to 7 freezing/thawing cycles. The mechanism of losing and gaining swelling pressure due to temperature changes was shown to be completely reversible.
• The behavior is only dependent on the swelling pressure of the system (above 0°C). Thus, it is not of significance if the swelling pressure is caused by high density or high bentonite quality. Backfill materials were tested and showed exactly the same behavior as high quality bentonites intended for buffer use.
• The findings indicate that compacted water saturated bentonite contains negligible amounts of large (micrometer scaled) pores.
From a safety assessment point of view, the findings indicate that possible freezing of bentonite compo-nents of a KBS-3 repository will not impose a problem. For a typical buffer swelling pressure of 7 MPa, the present results show that Tc is below –5°C. Thus, freezing will not occur and no high pressures are expected. Swelling pressure will only be lowered when the surrounding rock is already frozen and advective transport mechanisms are deactivated. The swelling pressure will also be regained before the surrounding rock is thawed.
TR-10-40 49
7 References
Atkins P W, 1986. Physical Chemistry, 3rd Edition, Oxford University Press.
Birgersson M, Karnland O, Nilsson U, 2008. Freezing in saturated bentonite – A thermodynamic approach. Phys. Chem. Earth., 33, S527–S530.
Bradbury M H, Baeyens B, 2003. Porewater chemistry in compacted re-saturated MX-80 bentonite. J. Contam. Hydrol., 61, 329–338.
Chandler D, 1987. Introduction to modern statistical mechanics, Oxford University Press.
CRC, 1973. Handbook of Chemistry and Physics. CRC Press, The Chemical Rubber Co. Cleveland, Ohio.
Kahr G, Kraehenbuehl F, Stoeckli H F, Müller-Vonmoos M, 1990. Study of the water-bentonite system by vapour adsorption, immersion calorimetry and X-ray techniques: II. Heats of immersion, Swelling pressures and Thermodynamic properties., Clay Minerals v.25, 499–506.
Karnland O, Muurinen A, Karlsson F, 2005. Bentonite swelling pressure in NaCl solutions – Experimentally determined data and model calculations in Advances in Understanding Engineered Clay Barriers – Alonso & Ledesma (eds.), Taylor & Francis Group, London.
Karnland O, Olsson S, Nilsson U, 2006. Mineralogy and sealing properties of various bentonites and smectite-rich clay material. SKB TR-06-30, Svensk Kärnbränslehantering AB.
Karnland O, Olsson S, Dueck A, Birgersson M, Nilsson U, Hernan-Håkansson T, Pedersen K, Nilsson S, Eriksen TE, Rosborg B, 2009. Long term test of buffer material at the Äspö Hard Rock Laboratory, LOT Project – Final report on the A2 test parcel. SKB TR-09-29, Svensk Kärn bränsle-hantering AB.
Low P F, Anderson D M, 1958. Osmotic pressure equations for determining thermodynamic proper-ties of soil water: Soil Sci., v. 86, pp. 251–253.
Marshall T J, Holmes J W, Rose C W, 1996. Soil Physics, 3rd edition, Cambridge University Press.
Newman A C D, 1987. The interaction of water with clay mineral surfaces in Chemistry of clays and clay minerals, Mineralogical Society Monograph No.6, ed. A.C.D. Newman, 1987.
Norrish K, Rausell-Colom J, 1962. Effect of freezing. on the swelling of clay minerals: Clay Miner. Bull. 5, 9–16.
Oliphant J L, Low P F, 1982. The relative partial specific enthalpy of water in montmorillonite –water systems and its relation to the swelling of these systems, Journal of colloid and interface science, 89, 366–373.
Olsson S, Karnland O, 2009. Characterisation of bentonites from Kutch, India, and Milos, Greece – some candidate tunnel backfill materials. SKB R-09-53, Svensk Kärnbränslehantering AB.
Pusch R, Hökmark H, Karnland O, 1990. Microstructural impact on the conductivity of smectite buffer clays. In Proc. 9th International Clay Conference. Sci. Geol., Mem., vol. 87. (eds. V. C. Farmer and Y. Tardy), CNRS, Strasbourg, France, Pp. 127–137.
SKB, 2006a. Climate and climate-related issues for the safety assessment SR-Can. SKB TR-06-23, Svensk Kärnbränslehantering AB, Stockholm.
SKB, 2006b. Long-term safety for KBS-3 repositories at Forsmark and Laxemar – a first evaluation. Main Report of the SR-Can. SKB TR-06-09, Svensk Kärnbränslehantering AB, Stockholm.
Sundberg J, Back P-E, Ländell M, Sundberg A, 2009. Modelling of temperature in deep boreholes and evaluation of geothermal heat flow at Forsmark and Laxemar. SKB TR-09-14, Svensk Kärnbränsle-hantering AB, Stockholm.
Sliwinska-Bartkowiak M, Gras J, Sikorski R, Radhakrishnan R, Gelb L, Gubbins K E, 1999. Phase Transtions in Pores: Experimental and Simulation Studies of Melting and Freezing, Langmuir 15, 6060–6069.

50 TR-10-40
Svensson P D, Hansen S, 2010. Freezing and thawing of montmorillonite – a time resolved X-ray diffraction study. Submitted to Applied Clay Science.
Villar M V, Gòmez-Espina R, 2007. Retention Curves of Two Bentonites at High Temperature in Experimental Unsaturated Soil Mechanics (Springer Proceedings Physics), Springer Berlin Heidelberg.