


Free ebooks download ! Edhole
38
Free Ebooks Download Mba Ebooks By Edhole Mba ebooks Free ebooks download http://ebooks.edhole.com
description
Here you will get ebooks
Transcript of Free ebooks download ! Edhole

Free Ebooks Download
Mba Ebooks
By Edhole
Mba ebooks
Free ebooks download
http://ebooks.edhole.com

Demand Forecasting:Time Series Models
Professor Stephen R. LawrenceCollege of Business and Administration
University of ColoradoBoulder, CO 80309-0419
http://ebooks.edhole.com

Forecasting Horizons
Long Term 5+ years into the future R&D, plant location, product planning Principally judgement-based
Medium Term 1 season to 2 years Aggregate planning, capacity planning, sales forecasts Mixture of quantitative methods and judgement
Short Term 1 day to 1 year, less than 1 season Demand forecasting, staffing levels, purchasing, inventory levels Quantitative methods
http://ebooks.edhole.com
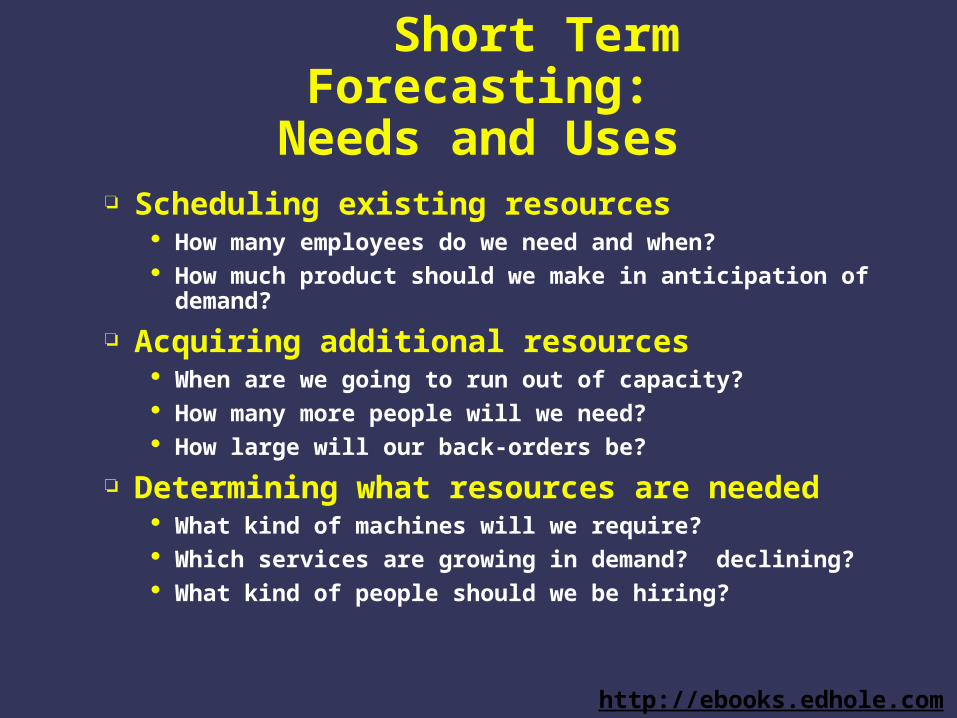
Short Term Forecasting:Needs and Uses
Scheduling existing resources How many employees do we need and when? How much product should we make in anticipation of demand?
Acquiring additional resources When are we going to run out of capacity? How many more people will we need? How large will our back-orders be?
Determining what resources are needed What kind of machines will we require? Which services are growing in demand? declining? What kind of people should we be hiring?
http://ebooks.edhole.com
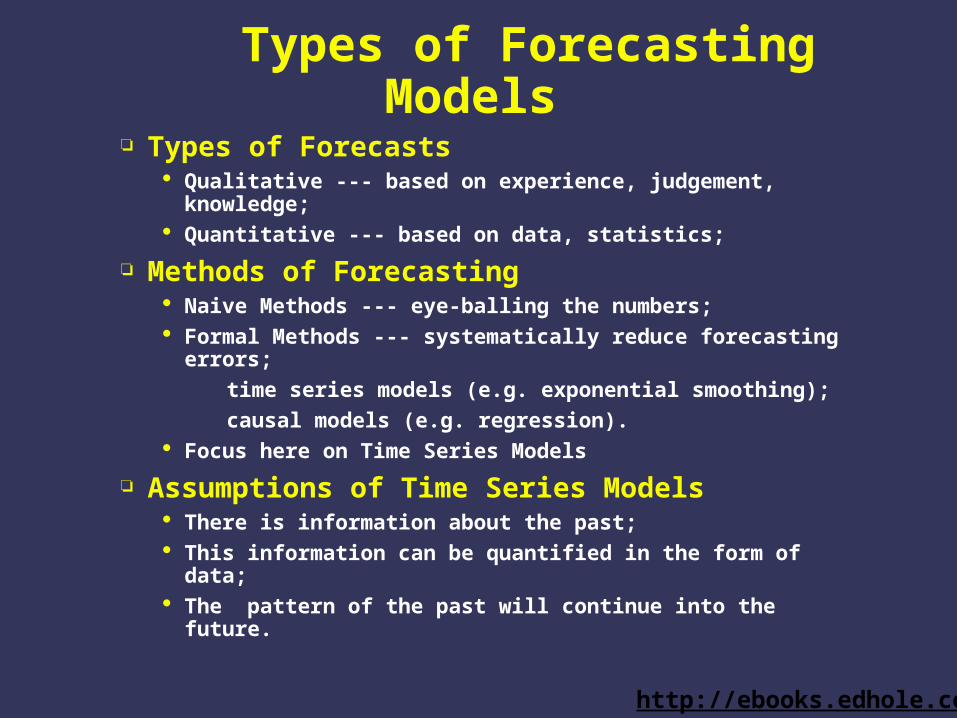
Types of Forecasting Models Types of Forecasts
Qualitative --- based on experience, judgement, knowledge; Quantitative --- based on data, statistics;
Methods of Forecasting Naive Methods --- eye-balling the numbers; Formal Methods --- systematically reduce forecasting errors;
� time series models (e.g. exponential smoothing);
� causal models (e.g. regression). Focus here on Time Series Models
Assumptions of Time Series Models There is information about the past; This information can be quantified in the form of data; The pattern of the past will continue into the future.
http://ebooks.edhole.com
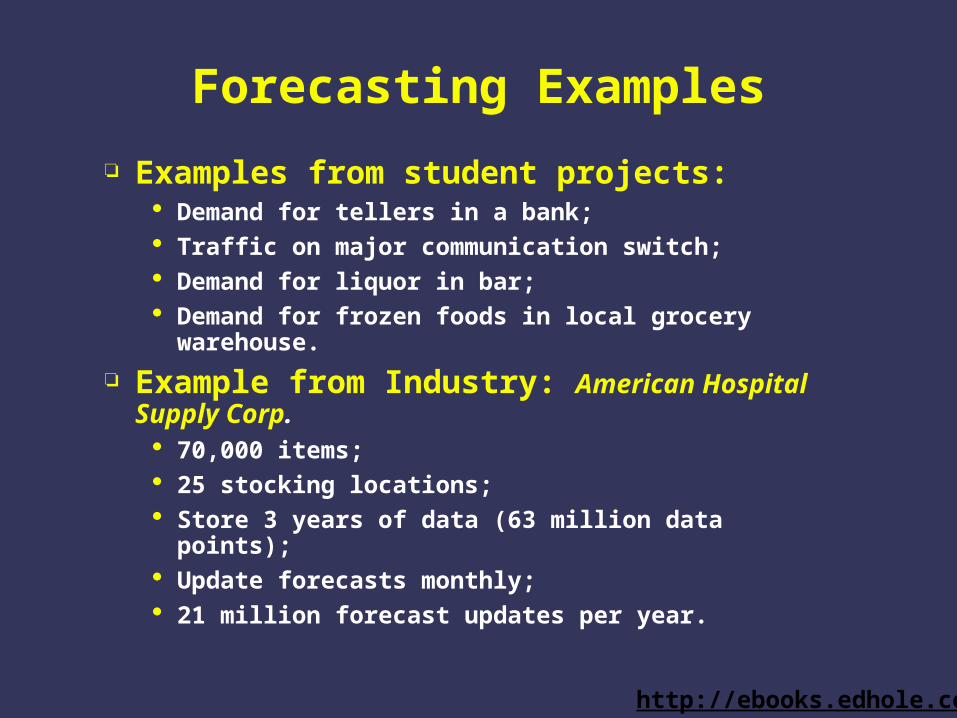
Forecasting Examples
Examples from student projects: Demand for tellers in a bank; Traffic on major communication switch; Demand for liquor in bar; Demand for frozen foods in local grocery warehouse.
Example from Industry: American Hospital Supply Corp. 70,000 items; 25 stocking locations; Store 3 years of data (63 million data points); Update forecasts monthly; 21 million forecast updates per year.
http://ebooks.edhole.com

Simple Moving Average Forecast Ft is average of n previous observations or
actuals Dt :
Note that the n past observations are equally weighted. Issues with moving average forecasts:
All n past observations treated equally; Observations older than n are not included at all; Requires that n past observations be retained; Problem when 1000's of items are being forecast.
t
ntiit
ntttt
Dn
F
DDDn
F
11
111
1
)(1
http://ebooks.edhole.com

Simple Moving Average
Include n most recent observations Weight equally Ignore older observations
weight
today123...n
1/n
http://ebooks.edhole.com

Moving Average
Internet Unicycle Sales
0
50
100
150
200
250
300
350
400
450
Apr-01 Sep-02 Jan-04 May-05 Oct-06 Feb-08 Jul-09 Nov-10 Apr-12 Aug-13
Month
Un
its
n = 3
http://ebooks.edhole.com

Exponential Smoothing I
Include all past observations Weight recent observations much more heavily
than very old observations:
weight
today
Decreasing weight given to older observations
http://ebooks.edhole.com

Exponential Smoothing I
Include all past observations Weight recent observations much more heavily
than very old observations:
weight
today
Decreasing weight given to older observations
0 1
http://ebooks.edhole.com
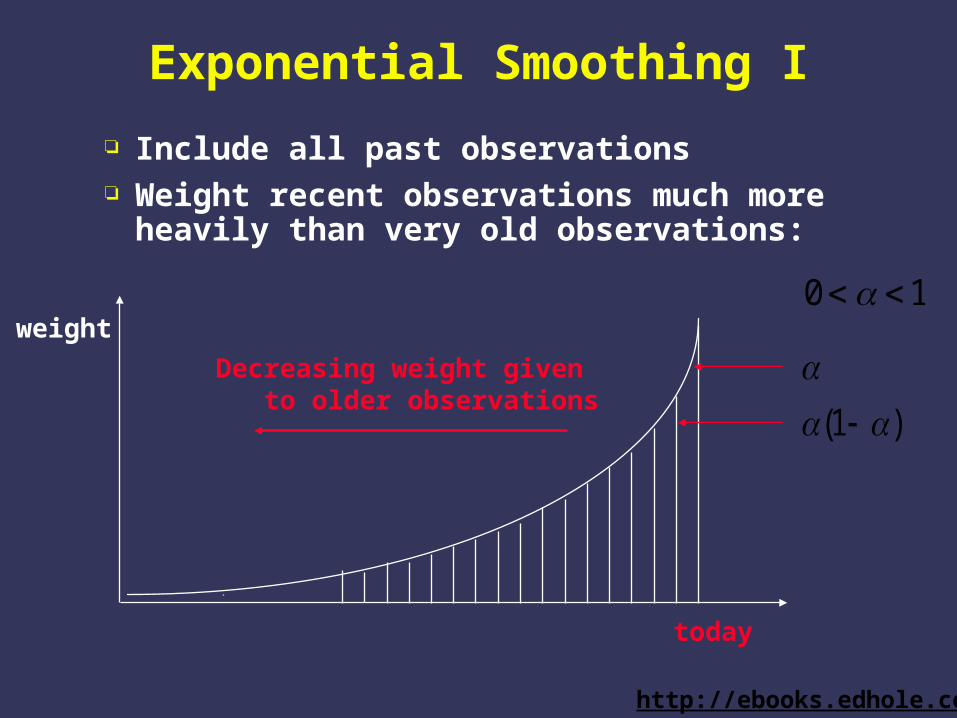
Exponential Smoothing I
Include all past observations Weight recent observations much more heavily
than very old observations:
weight
today
Decreasing weight given to older observations
0 1
( )1
http://ebooks.edhole.com

Exponential Smoothing I
Include all past observations Weight recent observations much more heavily
than very old observations:
weight
today
Decreasing weight given to older observations
0 1
( )
( )
1
1 2
http://ebooks.edhole.com

Exponential Smoothing: Concept
Include all past observations Weight recent observations much more heavily
than very old observations:
weight
today
Decreasing weight given to older observations
0 1
( )
( )
( )
1
1
1
2
3
http://ebooks.edhole.com

Exponential Smoothing: Math
21
22
1
)1()1(
)1()1(
tttt
tttt
DaDDF
DDDF
http://ebooks.edhole.com

Exponential Smoothing: Math
1)1( ttt FaaDF
21
22
1
)1()1(
)1()1(
tttt
tttt
DaDDF
DDDF
http://ebooks.edhole.com

Exponential Smoothing: Math
Thus, new forecast is weighted sum of old forecast and actual demand
Notes: Only 2 values (Dt and Ft-1 ) are required, compared with n for moving
average Parameter a determined empirically (whatever works best) Rule of thumb: < 0.5 Typically, = 0.2 or = 0.3 work well
Forecast for k periods into future is:
1
22
1
)1(
)1()1(
ttt
tttt
FaaDF
DaaDaaaDF
tkt FF http://ebooks.edhole.com

Exponential Smoothing
Internet Unicycle Sales (1000's)
0
50
100
150
200
250
300
350
400
450
Jan-03 May-04 Sep-05 Feb-07 Jun-08 Nov-09 Mar-11 Aug-12
Month
Un
its
= 0.2
http://ebooks.edhole.com

Complicating Factors
Simple Exponential Smoothing works well with data that is “moving sideways” (stationary)
Must be adapted for data series which exhibit a definite trend
Must be further adapted for data series which exhibit seasonal patterns
http://ebooks.edhole.com

Holt’s Method:Double Exponential Smoothing
What happens when there is a definite trend?
A trendy clothing boutique has had the following salesover the past 6 months:
1 2 3 4 5 6510 512 528 530 542 552
480490500510520530540550560
1 2 3 4 5 6 7 8 9 10
Month
Demand
Actual
Forecast
http://ebooks.edhole.com

Holt’s Method:Double Exponential Smoothing
Ideas behind smoothing with trend: ``De-trend'' time-series by separating base from trend effects Smooth base in usual manner using Smooth trend forecasts in usual manner using
Smooth the base forecast Bt
Smooth the trend forecast Tt
Forecast k periods into future Ft+k with base and trend
))(1( 11 tttt TBDB
11 )1()( tttt TBBT
ttkt kTBF
http://ebooks.edhole.com

ES with Trend
Internet Unicycle Sales (1000's)
0
50
100
150
200
250
300
350
400
450
Jan-03 May-04 Sep-05 Feb-07 Jun-08 Nov-09 Mar-11 Aug-12
Month
Un
its
= 0.2, = 0.4
http://ebooks.edhole.com

Winter’s Method: Exponential Smoothing w/ Trend and Seasonality
Ideas behind smoothing with trend and seasonality: “De-trend’: and “de-seasonalize”time-series by separating base from
trend and seasonality effects Smooth base in usual manner using Smooth trend forecasts in usual manner using Smooth seasonality forecasts using
Assume m seasons in a cycle 12 months in a year 4 quarters in a month 3 months in a quarter et cetera
http://ebooks.edhole.com

Winter’s Method: Exponential Smoothing w/ Trend and Seasonality
Smooth the base forecast Bt
Smooth the trend forecast Tt
Smooth the seasonality forecast St
))(1( 11
ttmt
tt TB
S
DB
11 )1()( tttt TBBT
mtt
tt S
B
DS )1(
http://ebooks.edhole.com
Winter’s Method: Exponential Smoothing w/ Trend and Seasonality
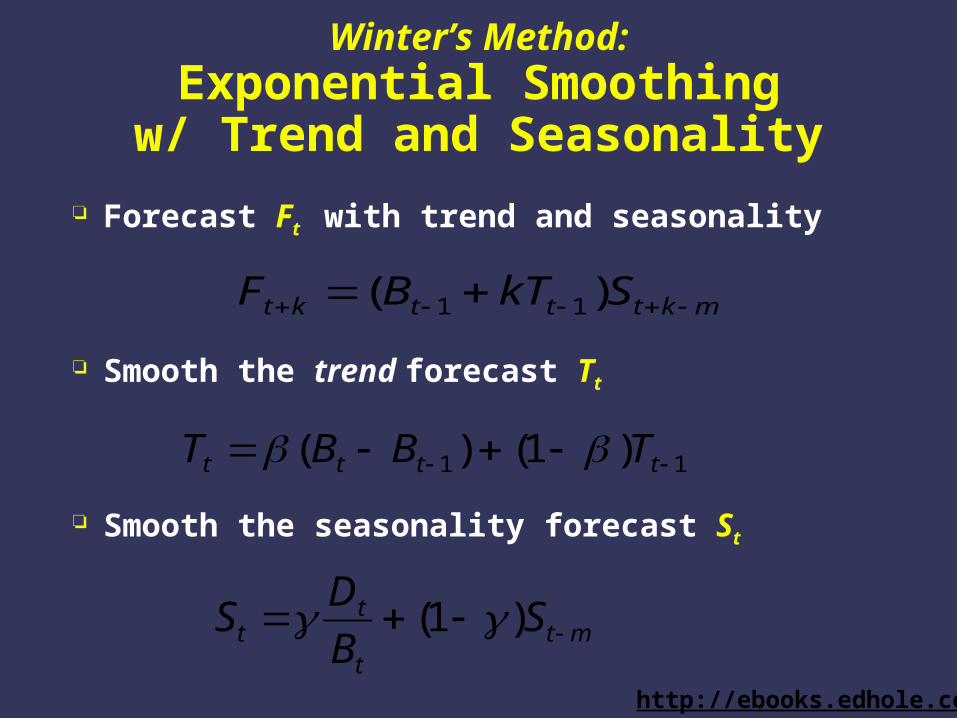
Forecast Ft with trend and seasonality
Smooth the trend forecast Tt
Smooth the seasonality forecast St
mktttkt SkTBF )( 11
11 )1()( tttt TBBT
mtt
tt S
B
DS )1(
http://ebooks.edhole.com

ES with Trend and Seasonality
Internet Unicycle Sales (1000's)
0
50
100
150
200
250
300
350
400
450
500
Jan-03 May-04 Sep-05 Feb-07 Jun-08 Nov-09 Mar-11 Aug-12
Month
Un
its
= 0.2, = 0.4, = 0.6
http://ebooks.edhole.com

Example:
Exponential Smoothing with
Trend and Seasonality
http://ebooks.edhole.com

Forecasting Performance
Mean Forecast Error (MFE or Bias): Measures average deviation of forecast from actuals.
Mean Absolute Deviation (MAD): Measures average absolute deviation of forecast from actuals.
Mean Absolute Percentage Error (MAPE): Measures absolute error as a percentage of the forecast.
Standard Squared Error (MSE): Measures variance of forecast error
How good is the forecast?
http://ebooks.edhole.com
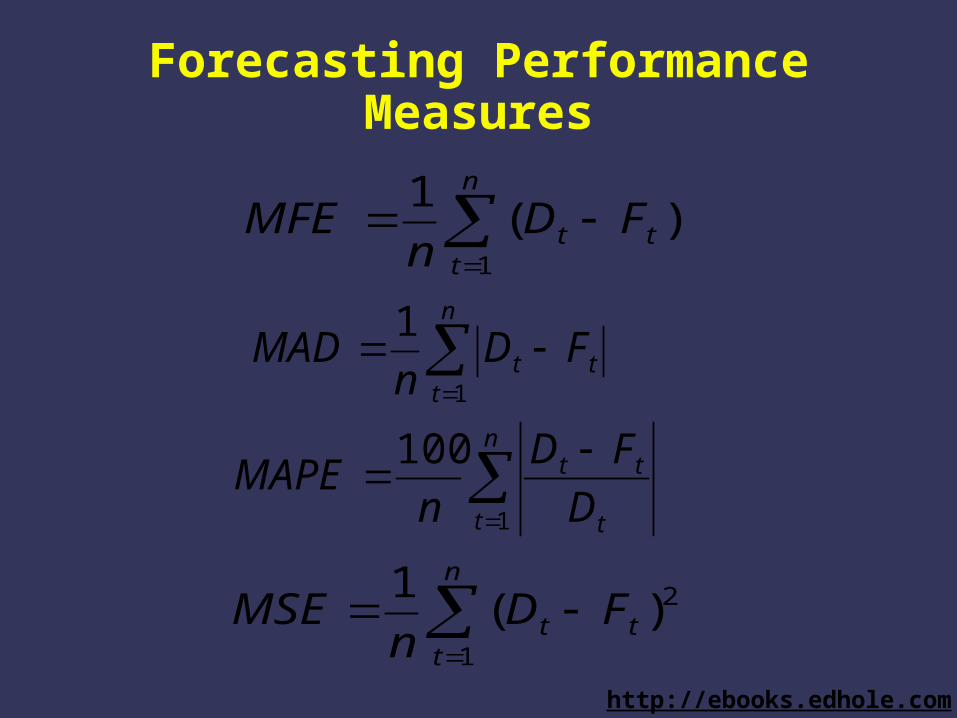
Forecasting Performance Measures
)(1
1t
n
tt FD
nMFE
n
ttt FD
nMAD
1
1
n
t t
tt
D
FD
nMAPE
1
100
2
1
)(1
t
n
tt FD
nMSE
http://ebooks.edhole.com

Want MFE to be as close to zero as possible -- minimum bias
A large positive (negative) MFE means that the forecast is undershooting (overshooting) the actual observations
Note that zero MFE does not imply that forecasts are perfect (no error) -- only that mean is “on target”
Also called forecast BIAS
Mean Forecast Error (MFE or Bias)
)(1
1t
n
tt FD
nMFE
http://ebooks.edhole.com

Mean Absolute Deviation (MAD)
Measures absolute error Positive and negative errors thus do not cancel out (as with
MFE) Want MAD to be as small as possible No way to know if MAD error is large or small in relation
to the actual data
n
ttt FD
nMAD
1
1
http://ebooks.edhole.com

Mean Absolute Percentage Error (MAPE)
Same as MAD, except ... Measures deviation as a percentage of actual data
n
t t
tt
D
FD
nMAPE
1
100
http://ebooks.edhole.com
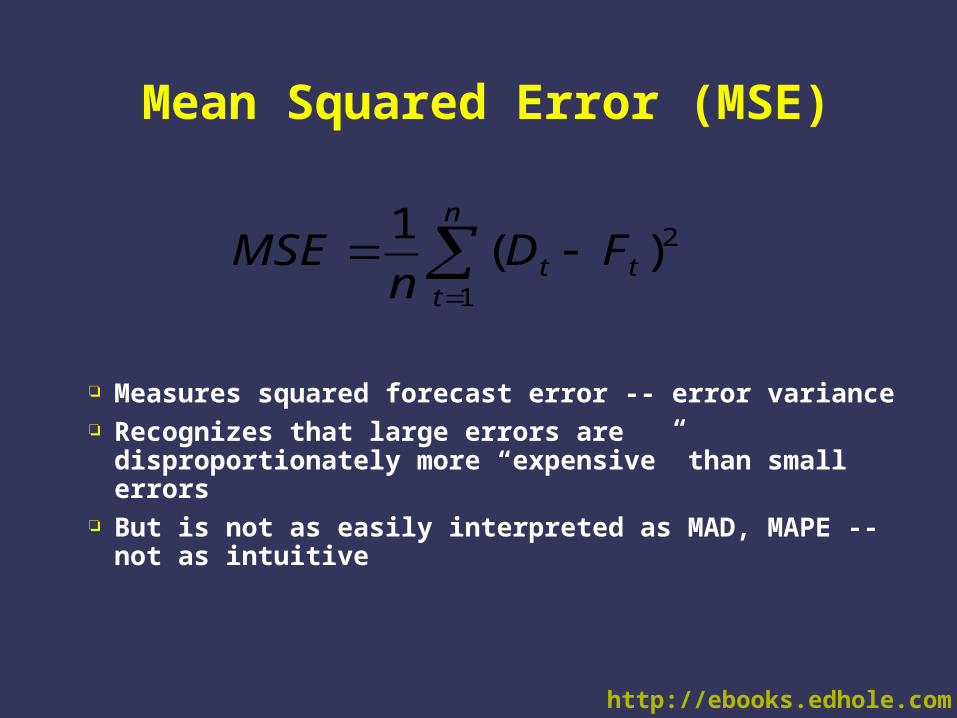
Mean Squared Error (MSE)
Measures squared forecast error -- error variance Recognizes that large errors are disproportionately more
“expensive” than small errors But is not as easily interpreted as MAD, MAPE -- not as
intuitive
2
1
)(1
t
n
tt FD
nMSE
http://ebooks.edhole.com

Fortunately, there is software...
http://ebooks.edhole.com

Free Ebooks Download
Mba Ebooks
By Edhole
Mba ebooks
Free ebooks download
http://ebooks.edhole.com