Fossil pressures of fluid inclusions in mantle xenoliths exhibiting rheology of mantle minerals:...
9
Fossil pressures of £uid inclusions in mantle xenoliths exhibiting rheology of mantle minerals : implications for the geobarometry of mantle minerals using micro-Raman spectroscopy Junji Yamamoto a;b; , Hiroyuki Kagi a , Ichiro Kaneoka b , Yong Lai b;c , Vladimir S. Prikhod’ko d , Shoji Arai e a Laboratory for Earthquake Chemistry, University of Tokyo, 7-3-1 Hongo, Bunkyo-ku, Tokyo 113-0033, Japan b Earthquake Research Institute, University of Tokyo, 1-1-1 Yayoi, Bunkyo-ku, Tokyo 113-0032, Japan c Department of Geosystem Engineering, University of Tokyo, 7-3-1 Hongo, Bunkyo-ku, Tokyo 113-8656, Japan d Institute of Tectonics and Geophysics (Far-Eastern Branch, Russian Academy of Sciences), 65 Kim Yu Chen Str., Khabarovsk 680063, Russia e Department of Earth Sciences, Faculty of Science, Kanazawa University, Kakuma, Kanazawa 920-1192, Japan Received 1 August 2001; received in revised form 14 January 2002; accepted 5 February 2002 Abstract Micro-Raman spectroscopic analysis allows us to estimate the internal pressure of small fluid inclusions. We applied this method to CO 2 -dominated fluid inclusions in mantle-derived xenoliths. The pressures estimated from the equilibration temperature and density of the fluid range from 0.96 to 1.04 GPa corresponding to depths of up to 30 km, which confirms that these rocks and fluids are of uppermost mantle origin. Furthermore, the inclusions show pressures specific to the individual host minerals (spinel v orthopyroxeneWclinopyroxeneEolivine). In particular, the densities of CO 2 in pyroxenes are 10% higher than in olivine. Such an enormous difference cannot be explained by elastic deformation of the minerals during ascent of the xenoliths, although the process may explain the slightly higher density of CO 2 in spinel. During the ascent, the strain rate of orthopyroxene calculated using the ‘constitutive equation’ is several orders of magnitude lower than that of olivine. The difference in densities of CO 2 among the host mineral species is therefore attributable to the rheological properties of the minerals. Present internal pressures of fluid inclusions can be a sensitive strength marker of mantle minerals. Conversely, the density of CO 2 inclusions in pyroxene (and spinel) may be a useful geobarometer. ß 2002 Elsevier Science B.V. All rights reserved. Keywords: geologic barometry; £uid inclusions; Raman spectroscopy; rheology; mantle; xenoliths 0012-821X / 02 / $ ^ see front matter ß 2002 Elsevier Science B.V. All rights reserved. PII:S0012-821X(02)00528-9 * Corresponding author. Tel.: +81-3-5841-5753; Fax: +81-3-5802-3391. E-mail addresses: [email protected] (J. Yamamoto), [email protected] (H. Kagi), [email protected] (I. Kaneoka), [email protected] (Y. Lai), [email protected] (V.S. Prikhod’ko), [email protected] (S. Arai). Earth and Planetary Science Letters 198 (2002) 511^519 www.elsevier.com/locate/epsl
-
Upload
junji-yamamoto -
Category
Documents
-
view
213 -
download
1
Transcript of Fossil pressures of fluid inclusions in mantle xenoliths exhibiting rheology of mantle minerals:...

Fossil pressures of £uid inclusions in mantle xenolithsexhibiting rheology of mantle minerals : implications for
the geobarometry of mantle minerals usingmicro-Raman spectroscopy
Junji Yamamoto a;b;�, Hiroyuki Kagi a, Ichiro Kaneoka b, Yong Lai b;c,Vladimir S. Prikhod’ko d, Shoji Arai e
a Laboratory for Earthquake Chemistry, University of Tokyo, 7-3-1 Hongo, Bunkyo-ku, Tokyo 113-0033, Japanb Earthquake Research Institute, University of Tokyo, 1-1-1 Yayoi, Bunkyo-ku, Tokyo 113-0032, Japan
c Department of Geosystem Engineering, University of Tokyo, 7-3-1 Hongo, Bunkyo-ku, Tokyo 113-8656, Japand Institute of Tectonics and Geophysics (Far-Eastern Branch, Russian Academy of Sciences), 65 Kim Yu Chen Str.,
Khabarovsk 680063, Russiae Department of Earth Sciences, Faculty of Science, Kanazawa University, Kakuma, Kanazawa 920-1192, Japan
Received 1 August 2001; received in revised form 14 January 2002; accepted 5 February 2002
Abstract
Micro-Raman spectroscopic analysis allows us to estimate the internal pressure of small fluid inclusions. Weapplied this method to CO2-dominated fluid inclusions in mantle-derived xenoliths. The pressures estimated from theequilibration temperature and density of the fluid range from 0.96 to 1.04 GPa corresponding to depths of up to 30km, which confirms that these rocks and fluids are of uppermost mantle origin. Furthermore, the inclusions showpressures specific to the individual host minerals (spinelvorthopyroxeneWclinopyroxeneEolivine). In particular, thedensities of CO2 in pyroxenes are 10% higher than in olivine. Such an enormous difference cannot be explained byelastic deformation of the minerals during ascent of the xenoliths, although the process may explain the slightly higherdensity of CO2 in spinel. During the ascent, the strain rate of orthopyroxene calculated using the ‘constitutiveequation’ is several orders of magnitude lower than that of olivine. The difference in densities of CO2 among the hostmineral species is therefore attributable to the rheological properties of the minerals. Present internal pressures of fluidinclusions can be a sensitive strength marker of mantle minerals. Conversely, the density of CO2 inclusions inpyroxene (and spinel) may be a useful geobarometer. ß 2002 Elsevier Science B.V. All rights reserved.
Keywords: geologic barometry; £uid inclusions; Raman spectroscopy; rheology; mantle; xenoliths
0012-821X / 02 / $ ^ see front matter ß 2002 Elsevier Science B.V. All rights reserved.PII: S 0 0 1 2 - 8 2 1 X ( 0 2 ) 0 0 5 2 8 - 9
* Corresponding author. Tel. : +81-3-5841-5753; Fax: +81-3-5802-3391.E-mail addresses: [email protected] (J. Yamamoto), [email protected] (H. Kagi),
[email protected] (I. Kaneoka), [email protected] (Y. Lai), [email protected] (V.S. Prikhod’ko),[email protected] (S. Arai).
EPSL 6164 26-4-02
Earth and Planetary Science Letters 198 (2002) 511^519
www.elsevier.com/locate/epsl
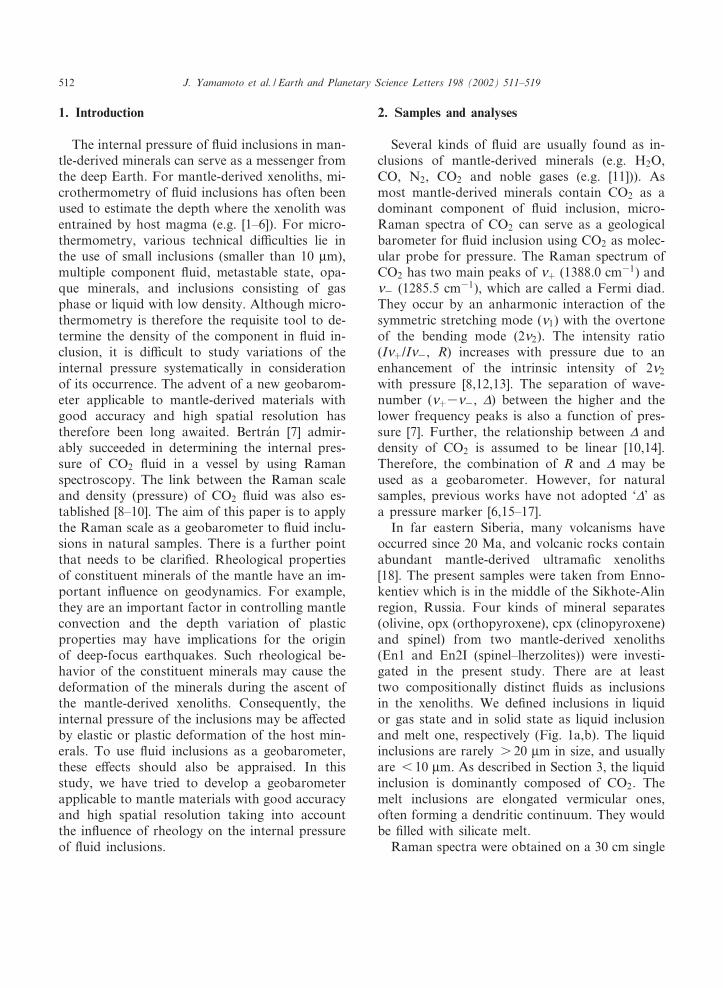
1. Introduction
The internal pressure of £uid inclusions in man-tle-derived minerals can serve as a messenger fromthe deep Earth. For mantle-derived xenoliths, mi-crothermometry of £uid inclusions has often beenused to estimate the depth where the xenolith wasentrained by host magma (e.g. [1^6]). For micro-thermometry, various technical di⁄culties lie inthe use of small inclusions (smaller than 10 Wm),multiple component £uid, metastable state, opa-que minerals, and inclusions consisting of gasphase or liquid with low density. Although micro-thermometry is therefore the requisite tool to de-termine the density of the component in £uid in-clusion, it is di⁄cult to study variations of theinternal pressure systematically in considerationof its occurrence. The advent of a new geobarom-eter applicable to mantle-derived materials withgood accuracy and high spatial resolution hastherefore been long awaited. Bertra¤n [7] admir-ably succeeded in determining the internal pres-sure of CO2 £uid in a vessel by using Ramanspectroscopy. The link between the Raman scaleand density (pressure) of CO2 £uid was also es-tablished [8^10]. The aim of this paper is to applythe Raman scale as a geobarometer to £uid inclu-sions in natural samples. There is a further pointthat needs to be clari¢ed. Rheological propertiesof constituent minerals of the mantle have an im-portant in£uence on geodynamics. For example,they are an important factor in controlling mantleconvection and the depth variation of plasticproperties may have implications for the originof deep-focus earthquakes. Such rheological be-havior of the constituent minerals may cause thedeformation of the minerals during the ascent ofthe mantle-derived xenoliths. Consequently, theinternal pressure of the inclusions may be a¡ectedby elastic or plastic deformation of the host min-erals. To use £uid inclusions as a geobarometer,these e¡ects should also be appraised. In thisstudy, we have tried to develop a geobarometerapplicable to mantle materials with good accuracyand high spatial resolution taking into accountthe in£uence of rheology on the internal pressureof £uid inclusions.
2. Samples and analyses
Several kinds of £uid are usually found as in-clusions of mantle-derived minerals (e.g. H2O,CO, N2, CO2 and noble gases (e.g. [11])). Asmost mantle-derived minerals contain CO2 as adominant component of £uid inclusion, micro-Raman spectra of CO2 can serve as a geologicalbarometer for £uid inclusion using CO2 as molec-ular probe for pressure. The Raman spectrum ofCO2 has two main peaks of Xþ (1388.0 cm31) andX3 (1285.5 cm31), which are called a Fermi diad.They occur by an anharmonic interaction of thesymmetric stretching mode (X1) with the overtoneof the bending mode (2X2). The intensity ratio(IXþ/IX3, R) increases with pressure due to anenhancement of the intrinsic intensity of 2X2
with pressure [8,12,13]. The separation of wave-number (Xþ3X3, v) between the higher and thelower frequency peaks is also a function of pres-sure [7]. Further, the relationship between v anddensity of CO2 is assumed to be linear [10,14].Therefore, the combination of R and v may beused as a geobarometer. However, for naturalsamples, previous works have not adopted ‘v’ asa pressure marker [6,15^17].
In far eastern Siberia, many volcanisms haveoccurred since 20 Ma, and volcanic rocks containabundant mantle-derived ultrama¢c xenoliths[18]. The present samples were taken from Enno-kentiev which is in the middle of the Sikhote-Alinregion, Russia. Four kinds of mineral separates(olivine, opx (orthopyroxene), cpx (clinopyroxene)and spinel) from two mantle-derived xenoliths(En1 and En2I (spinel^lherzolites)) were investi-gated in the present study. There are at leasttwo compositionally distinct £uids as inclusionsin the xenoliths. We de¢ned inclusions in liquidor gas state and in solid state as liquid inclusionand melt one, respectively (Fig. 1a,b). The liquidinclusions are rarely s 20 Wm in size, and usuallyare 6 10 Wm. As described in Section 3, the liquidinclusion is dominantly composed of CO2. Themelt inclusions are elongated vermicular ones,often forming a dendritic continuum. They wouldbe ¢lled with silicate melt.
Raman spectra were obtained on a 30 cm single
EPSL 6164 26-4-02
J. Yamamoto et al. / Earth and Planetary Science Letters 198 (2002) 511^519512

polychromator (Chromex, 250is), equipped withan optical microscope (Olympus, BX60), Arþ la-ser (514.5 nm; ion laser technology, 5500 A), aCCD camera with 1024U256 pixels (Andor,DU420-OE) installed at the Laboratory forEarthquake Chemistry, University of Tokyo.The Rayleigh line was removed by using a holo-graphic supernotch plus ¢lter (Kaiser, HSPF-514.5-1.0). The excitation laser beam was focusedon a spheroidal spot of approximately 1U1U5Wm in volume using an Olympus U100 objectivelens (NA = 0.95) with a confocal arrangement thatallows us to pick up signals exclusively from £uidinclusions. Though the spectral resolution of ourspectrometer is approximately 1.5 cm31 per pixelat the present experimental condition, more than20 data points are collected along the CO2 Ramanline, so the center of the ¢tted Lorentzian curvecould be determined with much higher precision,typically þ 0.15 cm31 [20]. Spectra were accumu-lated with an exposure time of 10^100 s per point
with laser power of 12^14 mW on the sample.There is a problem to be considered, which isthe rise in internal pressure of the inclusioncaused by the laser irradiation. This e¡ect is de-pendent on laser power and beam size. It must benoted that our data of v and R may di¡er fromthose of other groups’ experimental data, becausethe laser powers on samples di¡er from each oth-er. Another problem still exists. There is a possi-bility that the temperature (internal pressure) ininclusions varies among host mineral species bydi¡erences in thermal conductivity even applyinga constant laser power. However, this e¡ect isnegligible. This is because the v values remainedconstant within the experimental uncertainty of1 c level (V0.15 cm31) irrespective of the varia-tion of laser power on the sample ranging from 3to 14 mW for both olivine and opx. Within therange, also the intensity ratio of the summed in-tensities of the hot band diad to the summed in-tensities of the X1^2X2 Fermi diad bands, which is
Fig. 1. Photomicrographs of xenolith thin slab (V300 Wm) from far eastern Siberia. (a) Two generations of inclusions are visiblein opx. The one is vermicular melt inclusions within a plane of the section. The other is indicated by liquid inclusion arrays.(b) Liquid inclusions in opx are penetrated by vermicular melt inclusions, and contain a vapor bubble, which showed Brownianmotion. (c) Liquid inclusions in cpx. A central liquid inclusion, whose shape is negative crystal, is apparently penetrated by meltinclusions, which show a relatively low v value of approximately 105 cm31 relative to other pyroxenes. (d) Dislocation structuresin an olivine were observed with an optical microscope using the oxidation^decoration method [19]. High dislocation density isobserved around the CO2 inclusions.
EPSL 6164 26-4-02
J. Yamamoto et al. / Earth and Planetary Science Letters 198 (2002) 511^519 513
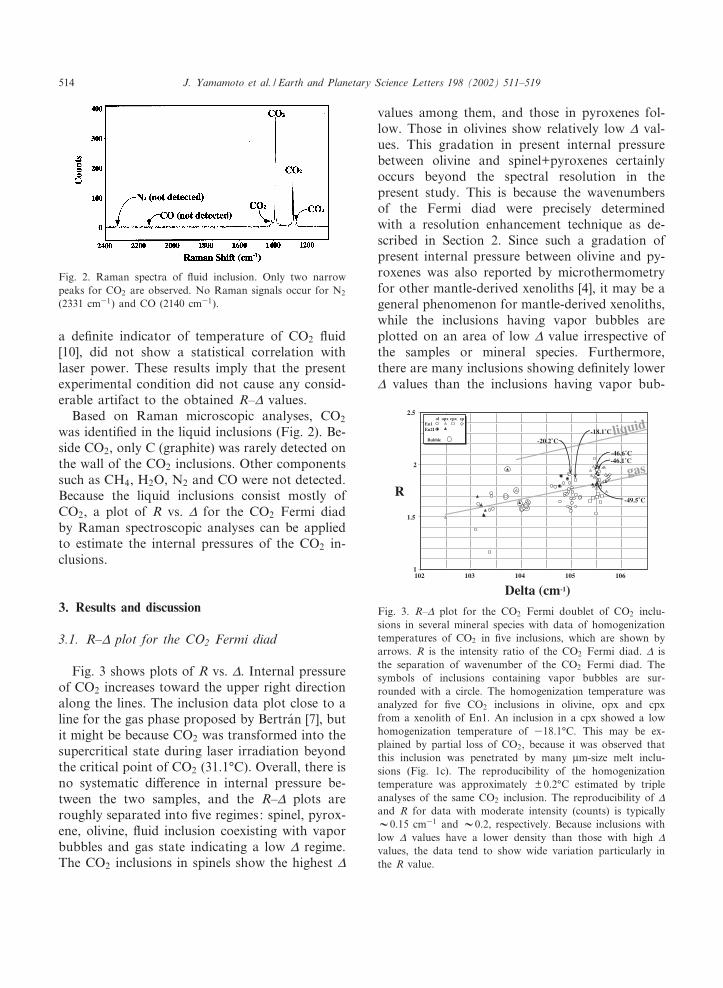
a de¢nite indicator of temperature of CO2 £uid[10], did not show a statistical correlation withlaser power. These results imply that the presentexperimental condition did not cause any consid-erable artifact to the obtained R^v values.
Based on Raman microscopic analyses, CO2
was identi¢ed in the liquid inclusions (Fig. 2). Be-side CO2, only C (graphite) was rarely detected onthe wall of the CO2 inclusions. Other componentssuch as CH4, H2O, N2 and CO were not detected.Because the liquid inclusions consist mostly ofCO2, a plot of R vs. v for the CO2 Fermi diadby Raman spectroscopic analyses can be appliedto estimate the internal pressures of the CO2 in-clusions.
3. Results and discussion
3.1. R^v plot for the CO2 Fermi diad
Fig. 3 shows plots of R vs. v. Internal pressureof CO2 increases toward the upper right directionalong the lines. The inclusion data plot close to aline for the gas phase proposed by Bertra¤n [7], butit might be because CO2 was transformed into thesupercritical state during laser irradiation beyondthe critical point of CO2 (31.1‡C). Overall, there isno systematic di¡erence in internal pressure be-tween the two samples, and the R^v plots areroughly separated into ¢ve regimes: spinel, pyrox-ene, olivine, £uid inclusion coexisting with vaporbubbles and gas state indicating a low v regime.The CO2 inclusions in spinels show the highest v
values among them, and those in pyroxenes fol-low. Those in olivines show relatively low v val-ues. This gradation in present internal pressurebetween olivine and spinel+pyroxenes certainlyoccurs beyond the spectral resolution in thepresent study. This is because the wavenumbersof the Fermi diad were precisely determinedwith a resolution enhancement technique as de-scribed in Section 2. Since such a gradation ofpresent internal pressure between olivine and py-roxenes was also reported by microthermometryfor other mantle-derived xenoliths [4], it may be ageneral phenomenon for mantle-derived xenoliths,while the inclusions having vapor bubbles areplotted on an area of low v value irrespective ofthe samples or mineral species. Furthermore,there are many inclusions showing de¢nitely lowerv values than the inclusions having vapor bub-
Fig. 2. Raman spectra of £uid inclusion. Only two narrowpeaks for CO2 are observed. No Raman signals occur for N2
(2331 cm31) and CO (2140 cm31).
Fig. 3. R^v plot for the CO2 Fermi doublet of CO2 inclu-sions in several mineral species with data of homogenizationtemperatures of CO2 in ¢ve inclusions, which are shown byarrows. R is the intensity ratio of the CO2 Fermi diad. v isthe separation of wavenumber of the CO2 Fermi diad. Thesymbols of inclusions containing vapor bubbles are sur-rounded with a circle. The homogenization temperature wasanalyzed for ¢ve CO2 inclusions in olivine, opx and cpxfrom a xenolith of En1. An inclusion in a cpx showed a lowhomogenization temperature of 318.1‡C. This may be ex-plained by partial loss of CO2, because it was observed thatthis inclusion was penetrated by many Wm-size melt inclu-sions (Fig. 1c). The reproducibility of the homogenizationtemperature was approximately þ 0.2‡C estimated by tripleanalyses of the same CO2 inclusion. The reproducibility of v
and R for data with moderate intensity (counts) is typicallyV0.15 cm31 and V0.2, respectively. Because inclusions withlow v values have a lower density than those with high v
values, the data tend to show wide variation particularly inthe R value.
EPSL 6164 26-4-02
J. Yamamoto et al. / Earth and Planetary Science Letters 198 (2002) 511^519514
bles. Observations under an optical microscopeindicate that inclusions that have v values irre-spective of mineral species were obviously decrep-itated or penetrated by melt inclusions. Therefore,such low v values would be attributed to partialloss of CO2 from the inclusion by decrepitation orintrusion of the melt inclusions, then the inclu-sions plotting on the lowest v regime would con-sist of vapor phase. For the CO2 inclusions pene-trated by melt inclusions, the di¡erence in v valuebetween the inclusions with visible gas bubblesand those ¢lled with CO2 in the gas state wouldbe attributed to the di¡erence in degree of disso-lution of CO2 into the melt, while the inclusionsshowing v values speci¢c to individual mineralspecies do not show such secondary e¡ects. Theseresults indicate that the original £uid trapped inthe mantle was mostly retained as liquid CO2
showing speci¢c v values, and it is certain thatthe results of the Raman spectroscopic analysesre£ect the di¡erence in internal pressure of theCO2 inclusions among mineral species.
3.2. Density of the CO2
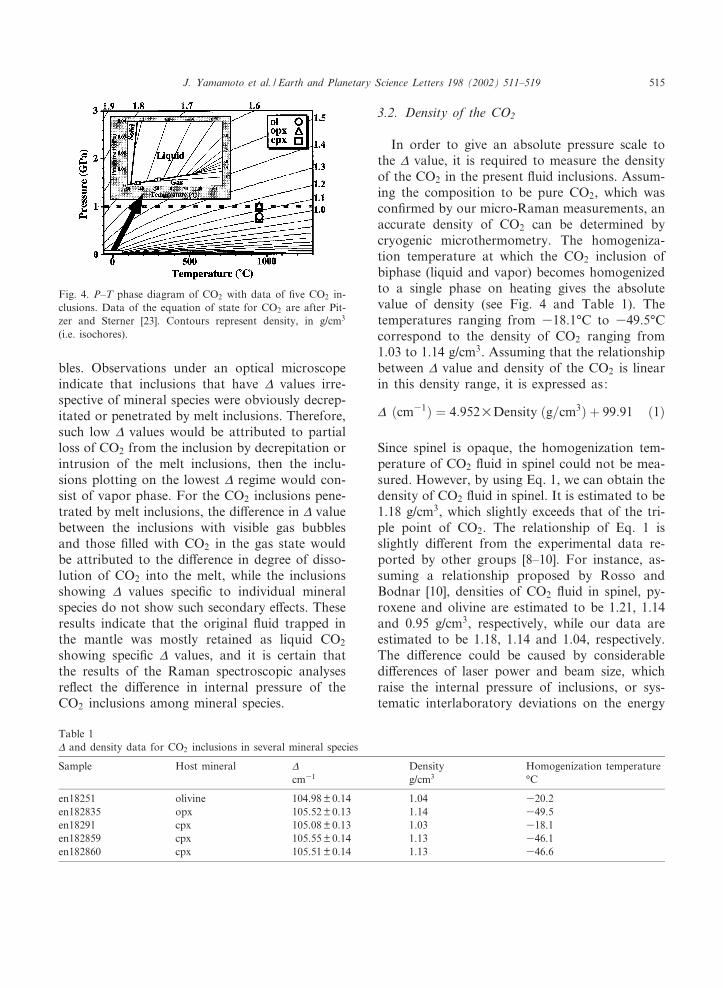
In order to give an absolute pressure scale tothe v value, it is required to measure the densityof the CO2 in the present £uid inclusions. Assum-ing the composition to be pure CO2, which wascon¢rmed by our micro-Raman measurements, anaccurate density of CO2 can be determined bycryogenic microthermometry. The homogeniza-tion temperature at which the CO2 inclusion ofbiphase (liquid and vapor) becomes homogenizedto a single phase on heating gives the absolutevalue of density (see Fig. 4 and Table 1). Thetemperatures ranging from 318.1‡C to 349.5‡Ccorrespond to the density of CO2 ranging from1.03 to 1.14 g/cm3. Assuming that the relationshipbetween v value and density of the CO2 is linearin this density range, it is expressed as:
v ðcm31Þ ¼ 4:952UDensity ðg=cm3Þ þ 99:91 ð1Þ
Since spinel is opaque, the homogenization tem-perature of CO2 £uid in spinel could not be mea-sured. However, by using Eq. 1, we can obtain thedensity of CO2 £uid in spinel. It is estimated to be1.18 g/cm3, which slightly exceeds that of the tri-ple point of CO2. The relationship of Eq. 1 isslightly di¡erent from the experimental data re-ported by other groups [8^10]. For instance, as-suming a relationship proposed by Rosso andBodnar [10], densities of CO2 £uid in spinel, py-roxene and olivine are estimated to be 1.21, 1.14and 0.95 g/cm3, respectively, while our data areestimated to be 1.18, 1.14 and 1.04, respectively.The di¡erence could be caused by considerabledi¡erences of laser power and beam size, whichraise the internal pressure of inclusions, or sys-tematic interlaboratory deviations on the energy
Fig. 4. P^T phase diagram of CO2 with data of ¢ve CO2 in-clusions. Data of the equation of state for CO2 are after Pit-zer and Sterner [23]. Contours represent density, in g/cm3
(i.e. isochores).
Table 1v and density data for CO2 inclusions in several mineral species
Sample Host mineral v Density Homogenization temperaturecm31 g/cm3 ‡C
en18251 olivine 104.98 þ 0.14 1.04 320.2en182835 opx 105.52 þ 0.13 1.14 349.5en18291 cpx 105.08 þ 0.13 1.03 318.1en182859 cpx 105.55 þ 0.14 1.13 346.1en182860 cpx 105.51 þ 0.14 1.13 346.6
EPSL 6164 26-4-02
J. Yamamoto et al. / Earth and Planetary Science Letters 198 (2002) 511^519 515

calibration of a detector. Trapping pressure of thexenoliths is given by the intersection of the iso-chore of CO2 and the equilibration temperatureof the xenoliths in the mantle. The equilibrationtemperature estimated from the two-pyroxenegeothermometer [21] is approximately 950‡C[22]. Hence, CO2 pressures at the temperaturecan be calculated using the equation of state forCO2 [23] at a temperature of 950‡C. Extrapola-tion of the density of 1.04 g/cm3 to higher temper-atures indicates that the internal pressure of in-clusions corresponds to about 0.8 GPa at 950‡C(Fig. 4). Furthermore, adopting the highest den-sity range of 1.13^1.14 g/cm3, the internal pres-sure is estimated to have ranged from 0.96 to1.04 GPa at 950‡C. Such a pressure correspondsto 30 km or more in depth. Geophysical estimatesindicate a relatively thin crustal thickness of V30km for far eastern Siberia [24] and V34 km forthe southern part of far eastern Siberia [25].Therefore, the xenoliths may have been derivedfrom the uppermost part of the mantle beneaththe Siberia.
3.3. Cause of di¡erence in v value among minerals
The liquid CO2 inclusions in each mineralshowed systematically di¡erent internal pressures(spinelvopxWcpxEolivine). The CO2 inclusionsin olivines have a density of CO2 lower than thoseof pyroxenes by about 10%. Thus, there is a pos-sibility that the inclusions, especially those in ol-ivine, do not re£ect the internal pressure of theoriginal £uid trapped at a depth in the mantle.These rocks are expected to have been crystallizedand settled in the mantle. Therefore, it is di⁄cultto explain the di¡erence in CO2 density amongminerals by the di¡erence in trapping depth ofthe £uid among minerals. The relatively low den-sity of CO2 in olivine may be attributed to itsselective deformation during ascent of the xeno-liths to the Earth’s surface. Fig. 5 illustrates twodeformation models for constituent minerals ofxenolith during the ascent. Firstly, we have simu-lated the volume change of minerals caused bydecompression and a decrease in temperature dur-ing the ascent based on di¡erences in thermal ex-pansivity and bulk modulus. The volume changeof minerals can be calculated using both ‘Birch^Murnaghan’s equation of state’ and ‘thermal ex-pansivities of minerals’. Thermal expansivity andbulk modulus are from Ahrens [26] and Saxena etal. [27]. During the ascent of xenoliths from thedepth of 1 GPa (V30 km), the constituent min-erals expand by approximately 1 vol%, and shrinkby a few percent with a decrease in temperaturedue to the thermal expansion. This indicates thatthe volumes of inclusions (or densities of CO2) arealmost constant within a few percent with thoseprior to entrainment of the xenoliths, though theprocess may explain slightly high density of CO2
£uid in spinel. The distinction is worth a mentionin passing, because it would be useful to estimatethe precise e¡ect of the bulk modulus and thermalexpansion. The above simulation indicates thatolivine is more shrinkable than the other constit-uent minerals during the ascent and cooling of thexenoliths. Thus the inclusions in olivine would becompressed more. Therefore, such a process alonemay not explain the di¡erence in the internal pres-sures among minerals.
Kirby and Green [28] have suggested that oliv-
Fig. 5. Schematic illustrating two deformation models forconstituent minerals of mantle xenolith. The xenolith is en-trained by host magma to the Earth’s surface in isothermalprocesses. On an elastic model, during the ascent of xenolithfrom a depth of 1 GPa (and 1000‡C), the constituent miner-als expand, and shrink with a decrease in temperature, while,when host basalt entrains the xenoliths to near the Earth’ssurface, CO2 inclusions can keep pressures as high as thoseat the time of trapping. Hence, on a plastic model, di¡eren-tial stress up to several hundreds of MPa would have oc-curred between the CO2 inclusion and surrounding crystallattice. Thus the CO2 inclusions may expand.
EPSL 6164 26-4-02
J. Yamamoto et al. / Earth and Planetary Science Letters 198 (2002) 511^519516
ine can easily deform plastically during eruption,because transmission electron micrographs ofsome inclusions of olivine show dislocation loopsindicating expansion. During the entrainment ofxenoliths to near the Earth’s surface, CO2 inclu-sions can keep internal pressures as high as thoseprior to the entrainment [11]. Thus, di¡erentialstress up to 100 MPa would have occurred be-tween the CO2 inclusion and surrounding crystallattice.
The CO2 inclusions in olivines have a density ofCO2 lower than those of opx by about 10%. If therelatively low density of CO2 in olivine was attrib-uted to its selective plastic deformation, it fol-lowed that the diameter of CO2 inclusions in ol-ivine has decreased by about 3%. Further, giventhat the deformation occurred for 10 days, thestrain rate is estimated to be about 3U1038 s31.The time scale of 10 days might be reasonable forannealing the xenoliths, because it corresponds to
the order of the time scales estimated by the rateof decrease in dislocation density of olivine [29].In order to con¢rm the plastic deformation mod-el, we have simulated the volume change of CO2
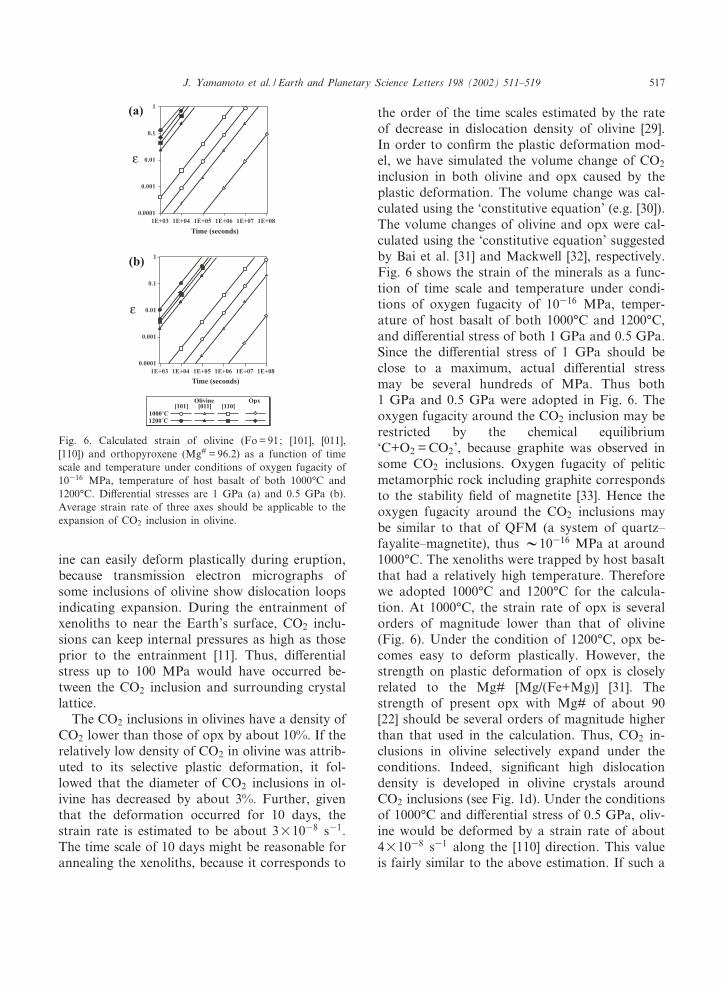
inclusion in both olivine and opx caused by theplastic deformation. The volume change was cal-culated using the ‘constitutive equation’ (e.g. [30]).The volume changes of olivine and opx were cal-culated using the ‘constitutive equation’ suggestedby Bai et al. [31] and Mackwell [32], respectively.Fig. 6 shows the strain of the minerals as a func-tion of time scale and temperature under condi-tions of oxygen fugacity of 10316 MPa, temper-ature of host basalt of both 1000‡C and 1200‡C,and di¡erential stress of both 1 GPa and 0.5 GPa.Since the di¡erential stress of 1 GPa should beclose to a maximum, actual di¡erential stressmay be several hundreds of MPa. Thus both1 GPa and 0.5 GPa were adopted in Fig. 6. Theoxygen fugacity around the CO2 inclusion may berestricted by the chemical equilibrium‘C+O2 = CO2’, because graphite was observed insome CO2 inclusions. Oxygen fugacity of peliticmetamorphic rock including graphite correspondsto the stability ¢eld of magnetite [33]. Hence theoxygen fugacity around the CO2 inclusions maybe similar to that of QFM (a system of quartz^fayalite^magnetite), thus V10316 MPa at around1000‡C. The xenoliths were trapped by host basaltthat had a relatively high temperature. Thereforewe adopted 1000‡C and 1200‡C for the calcula-tion. At 1000‡C, the strain rate of opx is severalorders of magnitude lower than that of olivine(Fig. 6). Under the condition of 1200‡C, opx be-comes easy to deform plastically. However, thestrength on plastic deformation of opx is closelyrelated to the Mg# [Mg/(Fe+Mg)] [31]. Thestrength of present opx with Mg# of about 90[22] should be several orders of magnitude higherthan that used in the calculation. Thus, CO2 in-clusions in olivine selectively expand under theconditions. Indeed, signi¢cant high dislocationdensity is developed in olivine crystals aroundCO2 inclusions (see Fig. 1d). Under the conditionsof 1000‡C and di¡erential stress of 0.5 GPa, oliv-ine would be deformed by a strain rate of about4U1038 s31 along the [110] direction. This valueis fairly similar to the above estimation. If such a
Fig. 6. Calculated strain of olivine (Fo = 91; [101], [011],[110]) and orthopyroxene (Mg# = 96.2) as a function of timescale and temperature under conditions of oxygen fugacity of10316 MPa, temperature of host basalt of both 1000‡C and1200‡C. Di¡erential stresses are 1 GPa (a) and 0.5 GPa (b).Average strain rate of three axes should be applicable to theexpansion of CO2 inclusion in olivine.
EPSL 6164 26-4-02
J. Yamamoto et al. / Earth and Planetary Science Letters 198 (2002) 511^519 517
condition could have been kept for 10 days, theCO2 inclusions in olivine would expand by 10% involume. Since it would be regarded as a conditionwith a minimum of plastic deformation, the de-formation of olivine occurred within 10 days. Themore detailed estimation may allow us to con-strain the time scale of ascent and cooling of thexenoliths. However, we have no de¢nite informa-tion on these conditions. For this purpose, it be-comes necessary to accumulate basic knowledgeparticularly on rheology of mantle minerals.
The density of CO2 in liquid inclusions in spinelwas the highest of all mineral species (Fig. 3),though the absolute density of CO2 £uid in spinelcould not be analyzed due to its opacity. Sincespinel has considerably higher creep strengththan olivine [34], the di¡erence in density ofCO2 between spinel and pyroxenes may not beexplained by the plastic deformation of these min-erals. As calculated above, the spinel (MgAl2O4)is more shrinkable than both opx (orthoenstatite)and cpx (clinodiopside) during the ascent andcooling of xenoliths. Thus the inclusions in spinelwould be compressed more, which is inconsistentwith our observation. Therefore, the relativelyhigher density of CO2 in liquid inclusions in spinelthan in pyroxenes may be attributed to the elasticdeformation of these minerals occurring duringthe ascent of the xenoliths.
In this study, it was shown that micro-Ramanspectroscopy can throw light on measuring inter-nal pressures of small £uid inclusions (s 1 Wm).As a possible geobarometer, Raman spectra ofCO2 £uid in inclusions in spinel, opx (and cpx)would be applicable for mantle-derived xenoliths.The di¡erence in rheological character amongmineral species is clearly revealed by the pressureof £uid inclusions obtained grain by grain.
4. Conclusions
From the R^v plot for the CO2 Fermi diad byRaman spectroscopic analyses, the v value of theCO2 inclusions decreases in the order: spinel,pyroxene, and olivine. From the lowest homoge-nization temperature of 349.5‡C, the densityof CO2 is estimated to be approximately 1.14
g/cm3. This indicates that the internal pressurewas at least 1 GPa at a temperature of 950‡C,which is lithostatically comparable to depths ofup to 30 km.
The inclusions show pressures speci¢c to theindividual host minerals (spinelvopxWcpxEoli-vine). In particular, the densities of CO2 in pyrox-enes are 10% higher than in olivine. From calcu-lation of both elastic and plastic deformation ofminerals, the relatively low density of CO2 in ol-ivine may be attributed to its plastic deformationduring ascent of the xenoliths to the Earth’s sur-face. The deformation of opx is several orders ofmagnitude smaller than that of olivine and thusthe e¡ect may be neglected. Also, spinel has high-er creep strength than olivine [34]. Therefore, thedensity of CO2 inclusions in pyroxene and spinel issuitable for a geobarometer. Conversely, presentinternal pressures of £uid inclusions can be a sen-sitive strength marker of mantle minerals.
Acknowledgements
We thank Professors Oded Navon, George R.Rossman and Masaaki Obata, who reviewed themanuscript and gave various useful comments onit. We would like to acknowledge Dr. K. Mibe forhis useful suggestions on the calculation of thethermodynamics. Prof. K. Ozawa, Prof. M.Toriumi, Dr. J. Ando, Dr. Y. Takei and Dr. T.Yoshino gave constructive comments for therheological calculation. We wish to express ourdeep appreciation to Prof. G.P. Glasby for hise¡ort to correct English. This research was sup-ported by a Grant-in-Aid (11304040, 13554018,12640476) from the Ministry of Education, Sci-ence and Culture of Japan.[AH]
References
[1] E. Roedder, Liquid CO2 inclusions in olivine-bearingnodules and phenocrysts from basalts, Am. Mineral. 50(1965) 1746^1782.
[2] E. Roedder, Geobarometry of ultrama¢c xenoliths fromLoihi Seamount, Hawaii, on the basis of CO2 inclusionsin olivine, Earth Planet. Sci. Lett. 66 (1983) 369^379.
[3] T. Andersen, S.Y. O’Reilly, W.L. Gri⁄n, The trapped
EPSL 6164 26-4-02
J. Yamamoto et al. / Earth and Planetary Science Letters 198 (2002) 511^519518
£uid phase in upper mantle xenoliths from Victoria, Aus-tralia: implications for mantle metasomatism, Contrib.Mineral. Petrol. 88 (1984) 72^85.
[4] R.G. Schwab, B. Freisleben, Fluid CO2 inclusions in ol-ivine and pyroxene and their behaviour under high pres-sure and temperature conditions, Bull. Mineral. 111(1988) 297^306.
[5] B. DeVivo, M.L. Frezzotti, A. Lima, R. Trigila, Spinellherzolite nodules from Oahu island (Hawaii): a £uid in-clusion study, Bull. Mineral. 111 (1988) 307^319.
[6] M.L. Frezzotti, E.A.J. Burke, B. DeVivo, B. Stefanini,I.M. Villa, Mantle £uids in pyroxenite nodules fromSalt Lake Crater (Oahu, Hawaii), Eur. J. Mineral. 4(1992) 1137^1153.
[7] J.F. Bertra¤n, Study of the Fermi doublet X1-2X2 in theRaman spectra of CO2 in di¡erent phases, Spectrochim.Acta 39A (1983) 119^121.
[8] Y. Garrabos, R. Tufeu, B.L. Neindre, G. Zalczer, D.Beysens, Rayleigh and Raman scattering near the criticalpoint of carbon dioxide, J. Chem. Phys. 72 (1980) 4637^4651.
[9] Y. Garrabos, V. Chandrasekharan, M.A. Echargui, F.Marsault-Herail, Density e¡ect on the Raman Fermi res-onance in the £uid phases of CO2, Chem. Phys. Lett. 160(1989) 250^256.
[10] K.M. Rosso, R.J. Bodnar, Microthermometric and Ram-an spectroscopic detection limits of CO2 in £uid inclu-sions and the Raman spectroscopic characterization ofCO2, Geochim. Cosmochim. Acta 59 (1995) 3961^3975.
[11] T. Andersen, E.-R. Neumann, Fluid inclusions in mantlexenoliths, Lithos 55 (2001) 301^320.
[12] R.B. Wright, C.H. Wang, Density e¡ect on the Fermiresonance in gaseous CO2 by Raman scattering,J. Chem. Phys. 58 (1973) 2893^2895.
[13] C.H. Wang, R.B. Wright, Raman studies of the e¡ect ofdensity on the Fermi resonance in CO2, Chem. Phys. Lett.23 (1973) 241^246.
[14] A. Hacura, A. Bro¤dka, L. Nikiel, F.G. Baglin, High pres-sure Raman study of Fermi resonance spectrum ingaseous carbon dioxide, J. Mol. Struct. 218 (1990) 297^302.
[15] J.D. Pasteris, B.J. Wanamaker, Laser Raman microprobeanalysis of experimentally re-equilibrated £uid inclusionsin olivine: some implications for mantle £uid, Am. Min-eral. 73 (1988) 1074^1088.
[16] A.M. van den Kerkhof, S.N. Olsen, A natural example ofsuperdense CO2 inclusions: microthermometry and Ram-an analysis, Geochim. Cosmochim. Acta 54 (1990) 895^901.
[17] J.C. Seitz, J.D. Pasteris, I.-M. Chou, Raman spectroscop-ic characterization of gas mixtures. II. Quantitative com-position and pressure determination of the CO2-CH4 sys-tem, Am. J. Sci. 296 (1996) 577^600.
[18] D.A. Ionov, V.S. Prikhod’ko, S.Y. O’Reilly, Peridotitexenoliths in alkali basalts from the Sikhote-Alin, south-eastern Siberia, Russia: trace-element signatures of man-tle beneath a convergent continental margin, Chem. Geol.120 (1995) 275^294.
[19] D.L. Kohlstedt, C. Goetze, W.B. Durham, J.B. Van derSande, A new technique for decorating dislocations inolivine, Science 191 (1975) 1045^1046.
[20] E.S. Izraeli, J.W. Harris, O. Navon, Raman barometry ofdiamond formation, Earth Planet. Sci. Lett. 173 (1999)351^360.
[21] P.R.A. Wells, Pyroxene thermometry in simple and com-plex systems, Contrib. Mineral. Petrol. 62 (1977) 129^139.
[22] J. Yamamoto, Investigation of the Subcontinental Mantlebased on Noble Gas Isotopes, Petrological and Spectro-scopic Studies of Siberian Mantle Xenoliths, PhD Thesis,University of Tokyo, Tokyo, 2001.
[23] K.S. Pitzer, S.M. Sterner, Equations of state valid contin-uously from zero to extreme pressures for H2O and CO2,J. Chem. Phys. 101 (1994) 3111^3116.
[24] B. Karp, E.P. Leikov, Geological structure, compositionand evolution of crustal layers of the Japan Sea, Tecto-nophysics 181 (1990) 277^283.
[25] T. Zai-Yi, H. Ping, X. Ke-Ding, The Mesozoic-CenozoicEast China rift system, Tectonophysics 208 (1992) 341^363.
[26] T.J. Ahrens (Ed.), Mineral Physics and Crystallography:A Handbook of Physical Constants, American Geophys-ical Union, Washington, DC, 1995, 354 pp.
[27] S.K. Saxena, N. Chatterjee, Y. Fei, G. Shen, Thermody-namic Data on Oxides and Silicates, Springer-Verlag,New York, 1993, 428 pp.
[28] S.H. Kirby, H.W. Green, Dunite xenoliths from Hualalaivolcano: evidence for mantle diapiric £ow beneath theisland of Hawaii, Am. J. Sci. 280-A (1980) 550^575.
[29] M. Toriumi, S. Karato, Experimental studies on recoveryprocess of deformed olivines and the mechanical state ofthe upper mantle, Tectonophysics 49 (1978) 79^95.
[30] J.-P. Poirier, Creep of Crystals, Cambridge UniversityPress, Cambridge, 1985, 260 pp.
[31] Q. Bai, S.J. Mackwell, D.L. Kohlstedt, High-temperaturecreep of olivine single crystals 1. mechanical results forbu¡ered samples, J. Geophys. Res. 96 (1991) 2441^2463.
[32] S.J. Mackwell, High-temperature rheology of enstatite:implications for creep in the mantle, Geophys. Res.Lett. 18 (1991) 2027^2030.
[33] A. Miyashiro, Oxidation and reduction in the Earth’scrust with special reference to the role of graphite, Geo-chim. Cosmochim. Acta 28 (1964) 717^729.
[34] S. Karato, Plasticity-crystal structure systematics in denseoxides and its implications for the creep strength of theEarth’s deep interior: a preliminary result, Phys. EarthPlanet. Inter. 55 (1989) 234^240.
EPSL 6164 26-4-02
J. Yamamoto et al. / Earth and Planetary Science Letters 198 (2002) 511^519 519