Forest characteristics FINAL - Food and Agriculture ... · PDF fileWhile many countries keep...
16
1 Forest characteristics Background paper to the Kotka V Expert Consultation 1 Introduction The term “forest” encompasses a variety of different kinds of forests, both in terms of species composition, structure and degree of modification caused by humans, animals, diseases and natural disasters. A continuum exists from primary forests with no – or no visible – indications of past or present human activity to intensively managed plantation forests of introduced species, primarily managed for a single product, often on a relatively short rotation. Between these two extremes lies a range of scenarios, and there are no clear cut-off points between possible classes along the continuum. The request for information on forest characteristics for FRA 2005 aimed to provide more detailed information on forests, in terms of their ‘naturalness’ or the intensity of silviculture and management practices. 2 FRA 2005 variables For FRA 2005, countries were asked to characterize their forests and other wooded land according to five classes: primary, modified natural, semi-natural, protective plantation and productive plantation. The use of the five different classes aimed to clarify the extent to which forests are human- made or -modified, while at the same time providing an indication of the intensity of management and the potential for wood production, e.g. for use in global fibre supply models. In regional and ecoregional criteria and indicator processes, as well as in national reports, more-detailed classifications of the forest area are often used, e.g. according to forest or vegetation type, age structure or diameter distribution classes. Because of the varying conditions and classification systems among countries and regions, it was not feasible to report on such classifications at the global level. However, country reports for FRA 2005 contain considerably more detail than is shown in the global tables. Moreover, thematic studies were prepared on planted forests, mangroves and bamboo that provide in-depth knowledge on these forest types and groups of species.
Transcript of Forest characteristics FINAL - Food and Agriculture ... · PDF fileWhile many countries keep...
1
Forest characteristics
Background paper to the Kotka V Expert Consultation
1 Introduction
The term “forest” encompasses a variety of different kinds of forests, both in terms of species
composition, structure and degree of modification caused by humans, animals, diseases and
natural disasters.
A continuum exists from primary forests with no – or no visible – indications of past or
present human activity to intensively managed plantation forests of introduced species,
primarily managed for a single product, often on a relatively short rotation. Between these
two extremes lies a range of scenarios, and there are no clear cut-off points between possible
classes along the continuum.
The request for information on forest characteristics for FRA 2005 aimed to provide more
detailed information on forests, in terms of their ‘naturalness’ or the intensity of silviculture
and management practices.
2 FRA 2005 variables
For FRA 2005, countries were asked to characterize their forests and other wooded land
according to five classes: primary, modified natural, semi-natural, protective plantation
and productive plantation.
The use of the five different classes aimed to clarify the extent to which forests are human-
made or -modified, while at the same time providing an indication of the intensity of
management and the potential for wood production, e.g. for use in global fibre supply models.
In regional and ecoregional criteria and indicator processes, as well as in national reports,
more-detailed classifications of the forest area are often used, e.g. according to forest or
vegetation type, age structure or diameter distribution classes. Because of the varying
conditions and classification systems among countries and regions, it was not feasible to
report on such classifications at the global level. However, country reports for FRA 2005
contain considerably more detail than is shown in the global tables. Moreover, thematic
studies were prepared on planted forests, mangroves and bamboo that provide in-depth
knowledge on these forest types and groups of species.
2
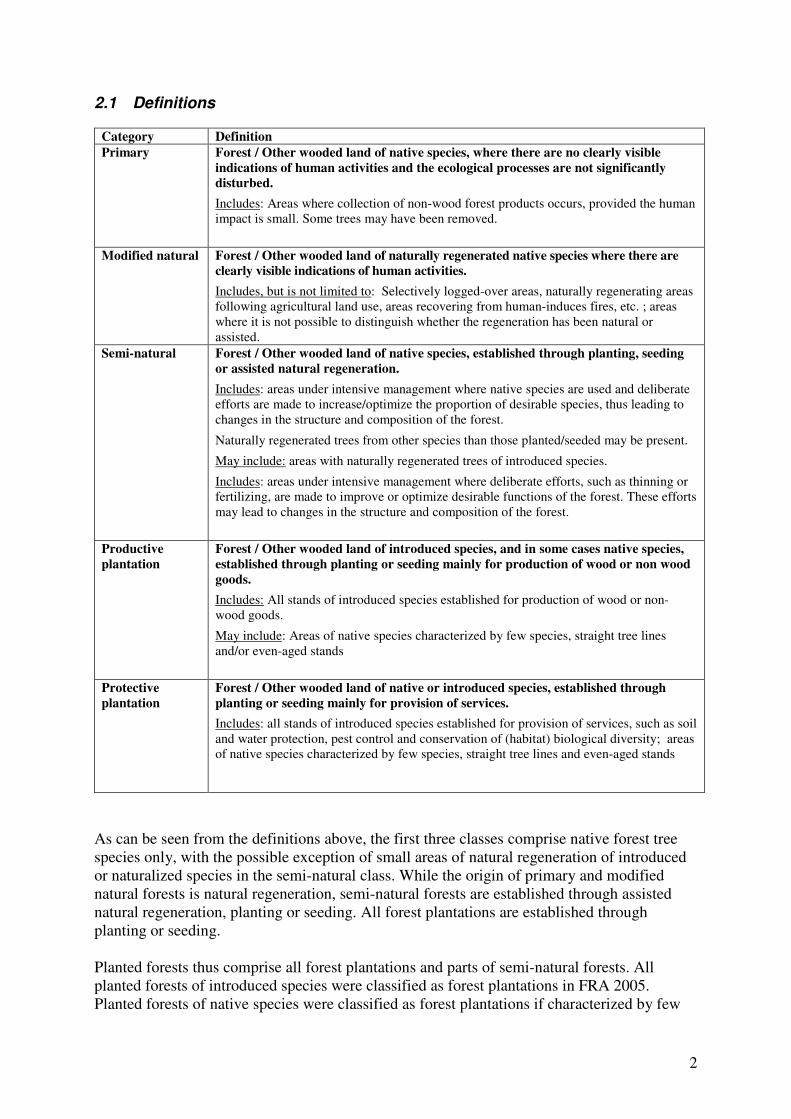
2.1 Definitions
Category Definition
Primary Forest / Other wooded land of native species, where there are no clearly visible
indications of human activities and the ecological processes are not significantly
disturbed.
Includes: Areas where collection of non-wood forest products occurs, provided the human
impact is small. Some trees may have been removed.
Modified natural Forest / Other wooded land of naturally regenerated native species where there are
clearly visible indications of human activities.
Includes, but is not limited to: Selectively logged-over areas, naturally regenerating areas
following agricultural land use, areas recovering from human-induces fires, etc. ; areas
where it is not possible to distinguish whether the regeneration has been natural or
assisted.
Semi-natural Forest / Other wooded land of native species, established through planting, seeding
or assisted natural regeneration.
Includes: areas under intensive management where native species are used and deliberate
efforts are made to increase/optimize the proportion of desirable species, thus leading to
changes in the structure and composition of the forest.
Naturally regenerated trees from other species than those planted/seeded may be present.
May include: areas with naturally regenerated trees of introduced species.
Includes: areas under intensive management where deliberate efforts, such as thinning or
fertilizing, are made to improve or optimize desirable functions of the forest. These efforts
may lead to changes in the structure and composition of the forest.
Productive
plantation
Forest / Other wooded land of introduced species, and in some cases native species,
established through planting or seeding mainly for production of wood or non wood
goods.
Includes: All stands of introduced species established for production of wood or non-
wood goods.
May include: Areas of native species characterized by few species, straight tree lines
and/or even-aged stands
Protective
plantation
Forest / Other wooded land of native or introduced species, established through
planting or seeding mainly for provision of services.
Includes: all stands of introduced species established for provision of services, such as soil
and water protection, pest control and conservation of (habitat) biological diversity; areas
of native species characterized by few species, straight tree lines and even-aged stands
As can be seen from the definitions above, the first three classes comprise native forest tree
species only, with the possible exception of small areas of natural regeneration of introduced
or naturalized species in the semi-natural class. While the origin of primary and modified
natural forests is natural regeneration, semi-natural forests are established through assisted
natural regeneration, planting or seeding. All forest plantations are established through
planting or seeding.
Planted forests thus comprise all forest plantations and parts of semi-natural forests. All
planted forests of introduced species were classified as forest plantations in FRA 2005.
Planted forests of native species were classified as forest plantations if characterized by few
3
species, straight, regularly-spaced rows and/or even-aged stands. If they resembled natural
forests of the same species mix, such as many planted forests in Europe, they were classified
as semi-natural forests.
2.2 Data availability
Of 229 countries and areas reporting, 174 reported on the characteristics of their forests. Their
combined forest area is equivalent to 93 percent of the total forest area of the world. However,
information on all five classes was not always readily available, because countries either did
not collect information or used a different national classification system. Proxy values were
often used, which made a detailed analysis of status and trends difficult. Information was
unavailable for many of the countries in the Congo Basin, the second largest expanse of
tropical forest.
Of the 180 countries providing information on the area of other wooded land, 114 provided
information on the characteristics.
2.3 Data quality
While many countries keep good statistics of the area of forest plantations, few countries had
information on the area of primary forests. Others used the current area of forests in national
parks and other protected areas as a proxy value or provided an expert estimate of the
percentage of natural forests that could be considered primary according to the definition used
for FRA 2005. The data on characteristics of other wooded land and the change estimates for
primary forest are particularly weak.
2.4 Methodologies for data collection
The information on forest characteristics is most frequently collected through forest
inventories and field surveys. Statistics on forest plantations are often kept, whereas
information on primary forest is rarely directly available and most countries used proxy
values such as area of forest in protected area or area of forest over a certain age where no
intervention had been made for a certain number of years.
2.5 Issues related to classifications and definitions
There were inconsistencies in reporting planted forests of native species: some countries
reported these as semi-natural forests, while others preferred to include them as forest
plantations.
Many countries also had difficulties in distinguishing between modified natural forests and
semi-natural forests based on the information available.
The class of modified natural forest spans from natural forests which have been selectively
logged but which retains most of the structure and composition of primary forests to severely
degraded forests and forests naturally expanding e.g. on abandoned agricultural land in
various stages of succession.
4
The current classification system is a combination of regeneration method, origin of species
(native/introduced) and management intensity. While it provided useful information on the
extent to which forests are human-made or –modified, it did not lend itself to an analysis of
all planted forests, since the class semi-natural forest is a combination of those forests
established through planting and those established through assisted natural regeneration.
3 Proposals for FRA 2010
The proposals presented below are based on the responses to the FRA 2005 evaluation
questionnaire sent to all national correspondents, FAO staff, the FRA Advisory Group and
representatives of forest related organisations and reporting processes (Members of the
Collaborative Partnership on Forests, criteria and indicator processes and environmental
NGOs). Feedback received on the release of the Key Findings of FRA 2005 and the Main
Report has also been included where relevant. These proposals have not been prioritised and
are presented for discussion by working group participants.
3.1 Deletions
Delete other wooded land, as information availability/quality is a serious issue.
A suggestion to delete the current table on forest characteristics in its entirety has also been
received.
3.2 Additions
Forest types. Several respondents have suggested including more information on forest by
ecological zones or by forest types. Past attempts to include forest types have focused on
forest cover by ecological zone (see Annex 1), “open” versus “closed” forest types and a
distinction between coniferous and non-coniferous species. Attempts have also been made
to assess the area of bamboo and of mangrove forests and requests have been received to
include these in the main questionnaire.
Planted forests. Planted forests comprise all forest plantations and parts of semi-natural
forests. As interest in planted forests is increasing, a thematic study on planted forests was
prepared within the framework of FRA 2005 and it is foreseen that this will be repeated for
FRA 2010. To facilitate the preparation of this study and the analysis on planted forests, it is
suggested to ask countries to provide information on the total area of forests which are
planted or sown as part of the reporting to FRA 2010.
Forest cover classes. Several respondents suggested that forests should be characterised
according to the degree of crown cover, suggesting 3-4 classes, so as to be able to distinguish
dense forests from more open forests. If spatial information is provided for more than one
point in time, changes in this variable may also help assess levels of forest degradation and
improvement (see below).
Forest degradation and improvement. Information on the extent of forests and their
characteristics provides limited information on changes happening within forests such as
degradation due to overexploitation or improvements through rehabilitation efforts or through
natural regeneration. It has been proposed to include a measure of forest degradation in the
next assessment.
5
3.3 Other changes proposed
The merging of the classes modified natural forest and semi-natural forests has been proposed.
The merging of the two classes of forest plantations and changing the name of the table to
forest naturalness.
Others have proposed that the guidelines for this table be improved to make it easier to
distinguish between the five classes. (Particularly between modified natural and semi-natural
and how to classify planted forests of native species.)
3.4 Proposals for how the information should be obtained
Refer to Annex 1 which describes the initiative to estimate forest cover by ecological zone
for FRA 2000. Participants are asked to evaluate whether the approach could be used for FRA
2010.
Thematic studies on mangroves and on bamboo were included for FRA 2005 and could be
repeated for FRA 2010. Alternatively, information on these (and other) forest types could be
included in the country reporting tables.
Information on the area of planted forests could be obtained through an addition to the
current table on characteristics with additional information obtained through a thematic study.
Information on forest cover classes could be obtained through remote sensing.
One indicator of the level of degradation/improvement is the growing stock per hectare. If
the growing stock per hectare in a given forest area shows a continuous decline over time,
indications are that the wood resources are being overexploited and the ability of the forest to
provide a range of goods and services is impaired. Although this variable does not relate
directly to degradation in terms e.g. of loss of ability to conserve biological diversity, it could
be a first proxy of the degree of forest degradation/improvement. One way to obtain this
information would be to estimate annual rates of change in growing stock from a series of
systematically laid virtual (geo-referenced) sample plots (linked to the grid proposed for the
remote sensing component for FRA 2010) and to statistically blow up the information to sub-
national and national level using pre-identified strata.
Another way would be to ask countries to estimate the percentage of their forest (or
percentage of the area of modified natural forest), which is degraded.
A third option would be to use spatial information on forest cover classes from two or more
points in time and focus on changes in these.
6
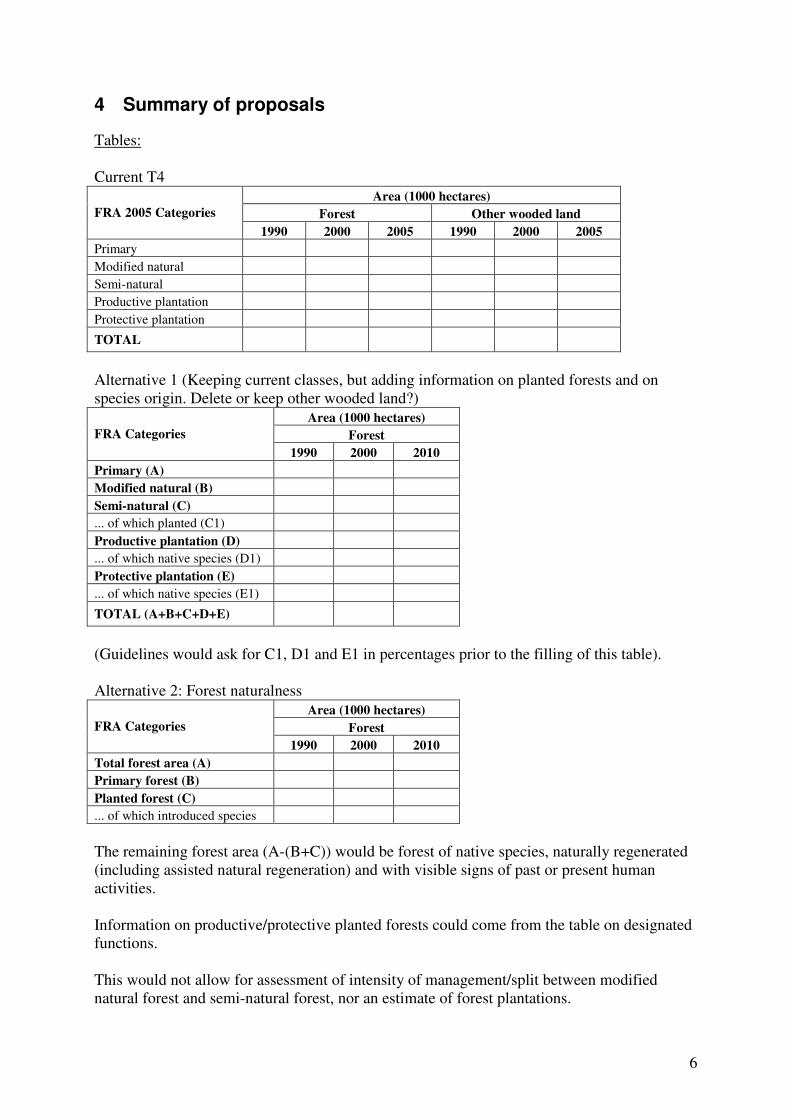
4 Summary of proposals
Tables:
Current T4
Area (1000 hectares)
Forest Other wooded land FRA 2005 Categories
1990 2000 2005 1990 2000 2005
Primary
Modified natural
Semi-natural
Productive plantation
Protective plantation
TOTAL
Alternative 1 (Keeping current classes, but adding information on planted forests and on
species origin. Delete or keep other wooded land?)
Area (1000 hectares)
Forest FRA Categories
1990 2000 2010
Primary (A)
Modified natural (B)
Semi-natural (C)
... of which planted (C1)
Productive plantation (D)
... of which native species (D1)
Protective plantation (E)
... of which native species (E1)
TOTAL (A+B+C+D+E)
(Guidelines would ask for C1, D1 and E1 in percentages prior to the filling of this table).
Alternative 2: Forest naturalness
Area (1000 hectares)
Forest FRA Categories
1990 2000 2010
Total forest area (A)
Primary forest (B)
Planted forest (C)
... of which introduced species
The remaining forest area (A-(B+C)) would be forest of native species, naturally regenerated
(including assisted natural regeneration) and with visible signs of past or present human
activities.
Information on productive/protective planted forests could come from the table on designated
functions.
This would not allow for assessment of intensity of management/split between modified
natural forest and semi-natural forest, nor an estimate of forest plantations.
7
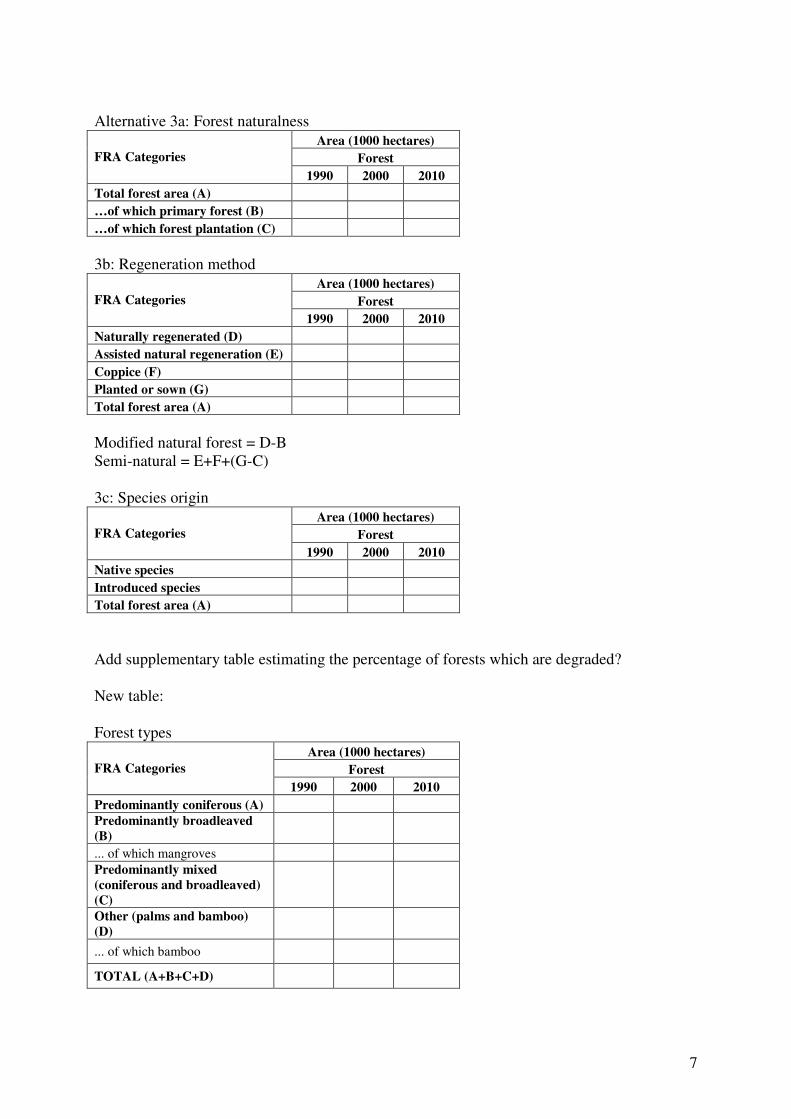
Alternative 3a: Forest naturalness
Area (1000 hectares)
Forest FRA Categories
1990 2000 2010
Total forest area (A)
…of which primary forest (B)
…of which forest plantation (C)
3b: Regeneration method
Area (1000 hectares)
Forest FRA Categories
1990 2000 2010
Naturally regenerated (D)
Assisted natural regeneration (E)
Coppice (F)
Planted or sown (G)
Total forest area (A)
Modified natural forest = D-B
Semi-natural = E+F+(G-C)
3c: Species origin
Area (1000 hectares)
Forest FRA Categories
1990 2000 2010
Native species
Introduced species
Total forest area (A)
Add supplementary table estimating the percentage of forests which are degraded?
New table:
Forest types
Area (1000 hectares)
Forest FRA Categories
1990 2000 2010
Predominantly coniferous (A)
Predominantly broadleaved
(B)
... of which mangroves
Predominantly mixed
(coniferous and broadleaved)
(C)
Other (palms and bamboo)
(D)
... of which bamboo
TOTAL (A+B+C+D)
8
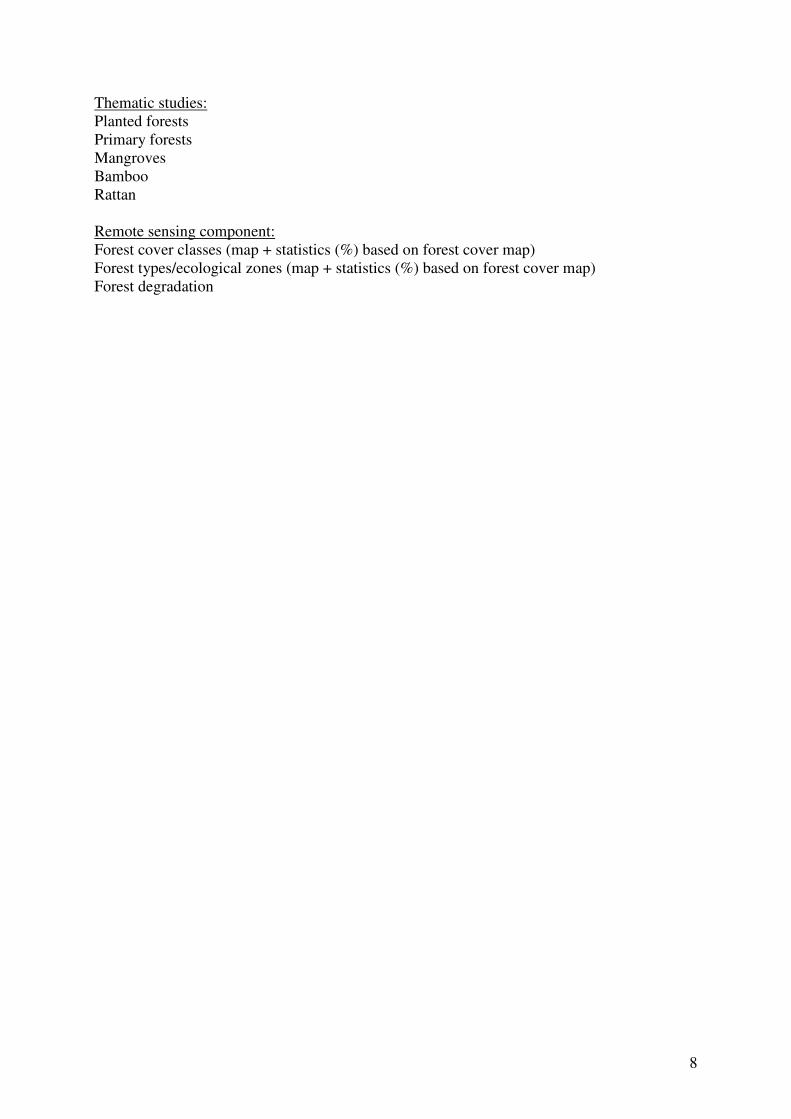
Thematic studies:
Planted forests
Primary forests
Mangroves
Bamboo
Rattan
Remote sensing component:
Forest cover classes (map + statistics (%) based on forest cover map)
Forest types/ecological zones (map + statistics (%) based on forest cover map)
Forest degradation
9
Annex 1: Ecological Zones
Introduction
Many environmental problems are no longer national or regional in character and must be
addressed in a global context. Aggregating information on forest resources by ecological
zones organizes reporting according to the natural characteristics of the vegetation, rather than
along national boundaries, which frequently cut across natural ecosystems. Through reporting
by ecological zones, valuable insight is obtained regarding characteristics of forest resources,
which may serve to identify and resolve issues of importance to many countries, entire
regions or even the planet as a whole.
To achieve meaningful reporting, classes in a global ecological framework must identify and
accurately group broad yet relatively homogenous natural formation of forest vegetation. The
global classification cannot be overly detailed, which would likely confuse reporting by
fragmenting major global ecosystems and risk creating an incomprehensible number of
classes. Conversely, and overly simplistic scheme could degrade the utility of the map by
representing too few classes of forests and aggregating too wide a variety of forests within the
same zone.
Ecological zone map The underlying strategy for the FRA 2000 ecological zoning reflected both the thematic and
technical needs of the map as well as the many operational constraints that were expected in
its development. In terms of ecosystem principles, the map requirements were such that
zones or classes were defined and mapped using a holistic approach. That is, both biotic and
abiotic components of ecosystems were considered in the zoning scheme. Beyond the
thematic content and zoning, practical aspects of digital cartographic production, such as data
availability, currency, scale and the associated reliability of the map inputs, were also taken
into account (Simons 2001).
FAO conducted two preliminary studies to identify specific alternatives and constraints in the
development of a global ecological zone (GEZ) map appropriate for FRA 2000 purposes
(Preto 1998; Zhu 1997). Findings from these studies, experience in the development of the
tropical ecological zone map for FRA 1990, and recommendations from other parties
consulted in the process indicated that FAO could not complete an entirely new global
ecological zoning map by 2000 because of the large amount of scientific, organizational and
financial resources and time required. FAO therefore focused on identifying an existing
scheme that might be used or adapted to the programme’s needs. A Workshop on Global
Ecological Zones Mapping, held in Cambridge, United Kingdom in July 1999, and attended
by experts from 15 countries, helped set the framework.
10
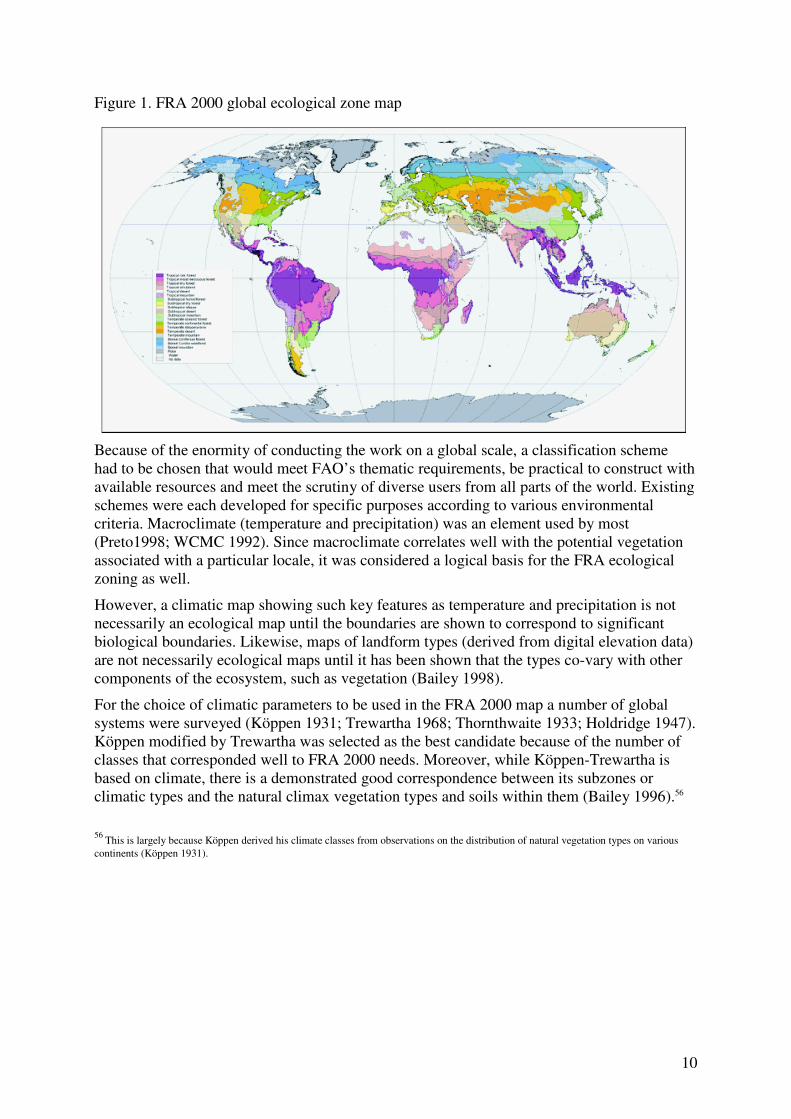
Figure 1. FRA 2000 global ecological zone map
Because of the enormity of conducting the work on a global scale, a classification scheme
had to be chosen that would meet FAO’s thematic requirements, be practical to construct with
available resources and meet the scrutiny of diverse users from all parts of the world. Existing
schemes were each developed for specific purposes according to various environmental
criteria. Macroclimate (temperature and precipitation) was an element used by most
(Preto1998; WCMC 1992). Since macroclimate correlates well with the potential vegetation
associated with a particular locale, it was considered a logical basis for the FRA ecological
zoning as well.
However, a climatic map showing such key features as temperature and precipitation is not
necessarily an ecological map until the boundaries are shown to correspond to significant
biological boundaries. Likewise, maps of landform types (derived from digital elevation data)
are not necessarily ecological maps until it has been shown that the types co-vary with other
components of the ecosystem, such as vegetation (Bailey 1998).
For the choice of climatic parameters to be used in the FRA 2000 map a number of global
systems were surveyed (Köppen 1931; Trewartha 1968; Thornthwaite 1933; Holdridge 1947).
Köppen modified by Trewartha was selected as the best candidate because of the number of
classes that corresponded well to FRA 2000 needs. Moreover, while Köppen-Trewartha is
based on climate, there is a demonstrated good correspondence between its subzones or
climatic types and the natural climax vegetation types and soils within them (Bailey 1996).56
56
This is largely because Köppen derived his climate classes from observations on the distribution of natural vegetation types on various
continents (Köppen 1931).
11
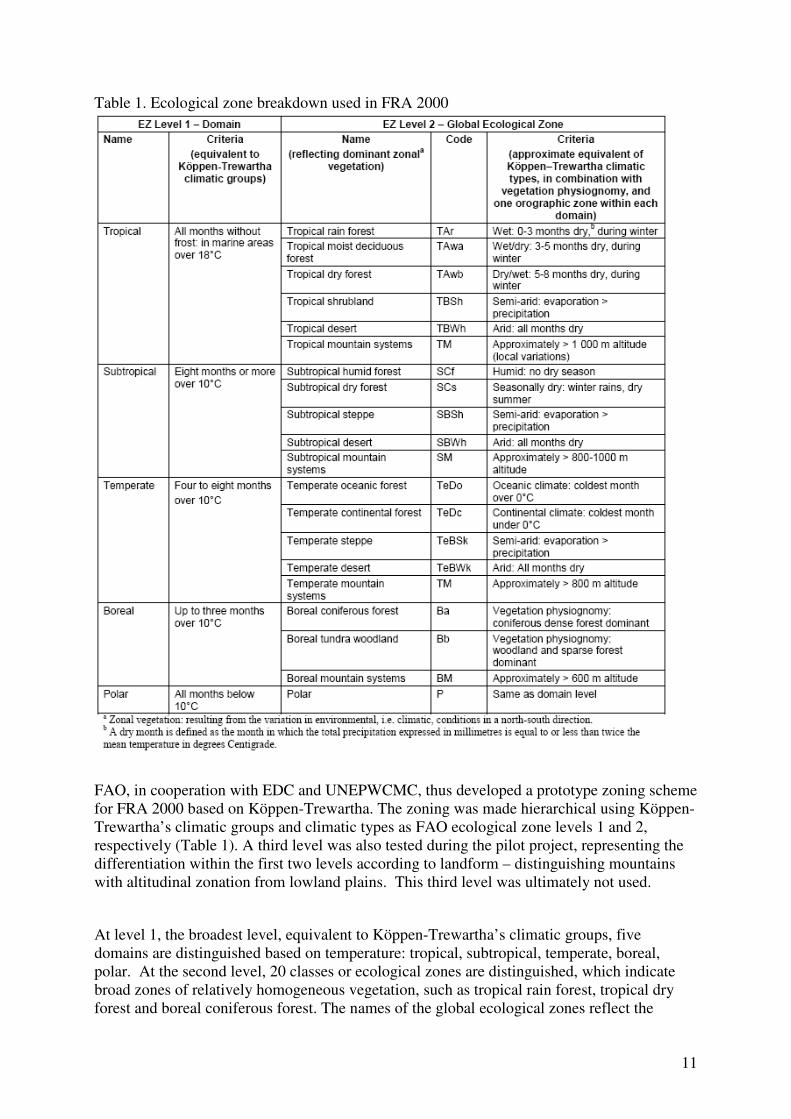
Table 1. Ecological zone breakdown used in FRA 2000
FAO, in cooperation with EDC and UNEPWCMC, thus developed a prototype zoning scheme
for FRA 2000 based on Köppen-Trewartha. The zoning was made hierarchical using Köppen-
Trewartha’s climatic groups and climatic types as FAO ecological zone levels 1 and 2,
respectively (Table 1). A third level was also tested during the pilot project, representing the
differentiation within the first two levels according to landform – distinguishing mountains
with altitudinal zonation from lowland plains. This third level was ultimately not used.
At level 1, the broadest level, equivalent to Köppen-Trewartha’s climatic groups, five
domains are distinguished based on temperature: tropical, subtropical, temperate, boreal,
polar. At the second level, 20 classes or ecological zones are distinguished, which indicate
broad zones of relatively homogeneous vegetation, such as tropical rain forest, tropical dry
forest and boreal coniferous forest. The names of the global ecological zones reflect the
12
dominant zonal vegetation. Typical azonal vegetation types, for instance mangroves, heath
and swamps, are not separately classified and mapped.
Level 2 is the reference or working level for the GEZ mapping. The ecological zones were
delineated by using both macroclimate data and existing climax or potential vegetation maps.
Use of vegetation maps ensured a more precise delineation of the ecological zones. If
generalized climate maps had been used alone, the zones of the final map would probably
have corresponded poorly to boundaries of homogeneous vegetation transitions.
Within each domain (level 1) a zone of mountain systems is distinguished at level 2.
Mountain systems usually contain a variety of vegetation types and include forests, alpine
shrubs, meadows and bare rock. The current global framework cannot address the high,
mostly small-scale diversity of mountain habitats. The polar domain is not further subdivided,
as it is treeless, and only very sparse shrub or grass vegetation occurs locally. Here the second
level is equivalent to the first.
A main principle in delineating the global ecological zones involves aggregating or matching
regional ecological or potential vegetation maps into the global framework. The following
steps can be distinguished:
• identification of Köppen-Trewartha climatic types and mountains occurring in a
region to approximate the level 2 ecological zone class of the FAO scheme;
• establishment of correspondence between regional/national potential vegetation types
and the global ecological zones;
• final definition and delineation of the global ecological zones, using the maps and
source data consulted in the first two steps;
• edge-matching between adjacent maps;
• validation.
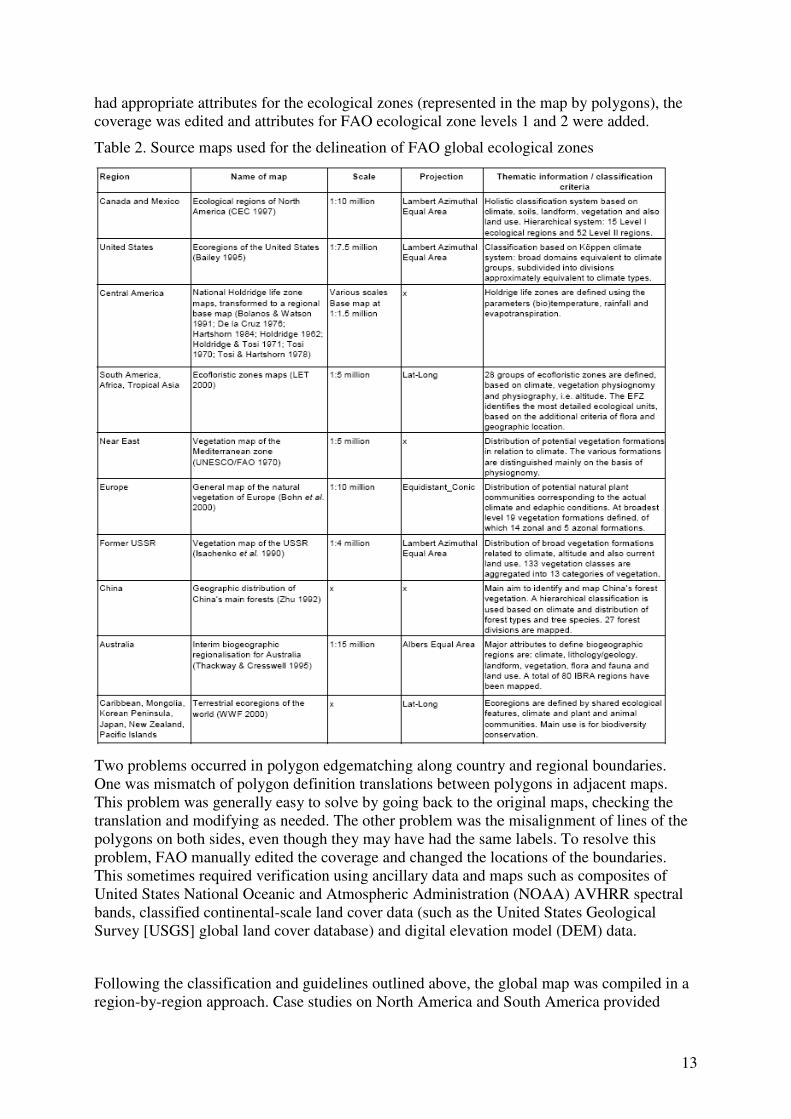
To ensure the best use of regional knowledge and information, existing regional/national
maps on vegetation, biogeography, ecology and climate were used to generate the GEZ map.
In some countries, such as the United States, classification is based on the Köppen-Trewartha
climate system and translation to the FAO scheme was straightforward. In other cases, a more
thorough study of mapping criteria, including physiognomy, phenology, floristics and
dynamics of vegetation types, was needed to establish the correspondence. A benefit of using
the existing country/regional maps is that they could form the basis or provide supporting
information for more detailed regional ecological zoning beyond FRA 2000 (see Table 2).
The country/regional vegetation maps also helped in harmonization of ecological zone
boundaries across countries or regions. The experts who attended the Cambridge workshop
contributed in a major way to definition of the ecological zones of their respective regions as
well as to edge-matching between adjoining geographic regions.
Both the existing FRA 1990 ecofloristic zone map and several existing regional maps were
produced using the ESRI Arc/Info GIS software. Thus, it was convenient for the rest of the
work to be conducted using Arc/Info, or at least to be Arc/Info importable. After study of the
digital map in the Arc/Info coverage environment and confirmation that the digital version
13
had appropriate attributes for the ecological zones (represented in the map by polygons), the
coverage was edited and attributes for FAO ecological zone levels 1 and 2 were added.
Table 2. Source maps used for the delineation of FAO global ecological zones
Two problems occurred in polygon edgematching along country and regional boundaries.
One was mismatch of polygon definition translations between polygons in adjacent maps.
This problem was generally easy to solve by going back to the original maps, checking the
translation and modifying as needed. The other problem was the misalignment of lines of the
polygons on both sides, even though they may have had the same labels. To resolve this
problem, FAO manually edited the coverage and changed the locations of the boundaries.
This sometimes required verification using ancillary data and maps such as composites of
United States National Oceanic and Atmospheric Administration (NOAA) AVHRR spectral
bands, classified continental-scale land cover data (such as the United States Geological
Survey [USGS] global land cover database) and digital elevation model (DEM) data.
Following the classification and guidelines outlined above, the global map was compiled in a
region-by-region approach. Case studies on North America and South America provided
14
useful experiences and guidelines for GEZ mapping in other regions. In the course of the
work regional experts actively participated or were consulted. EDC was responsible for
producing the ecological zone maps for the temperate and boreal regions and jointly with
FAO compiled the global map and database, while LET, Toulouse produced the ecological
zone maps for the tropical regions, i.e. South America, Africa and Asia. FAO provided
overall technical and conceptual guidance. After the Cambridge meeting in July 1999, it took
one year to produce a draft global map. The draft map was reviewed at a meeting in Salt Lake
City, Utah, United States (5-7 July 2000), and the final map and database were completed by
October 2000.
After production of the regional GEZ maps the global GEZ map was composed from all the
regional tiles. Edge-matching was an issue, particularly for the vast area of Europe and Asia,
where a number of different tiles had to be brought together with large bordering areas. The
delineation of ecological zones between bordering areas of Europe and the former Union of
Socialist Soviet Republics (USSR) matched well, with only small adjustments needed. The
same applies to the ecological zone boundaries between Europe and the Near East. More work
was needed to match the tiles for tropical Asia, China and the former USSR; the task was
complicated by the presence of extensive mountain systems on the border areas. After the
edge-matching problems were resolved, the regional tiles were registered to a global base
map, ESRI’s Digital chart of the world, 1st edition, December 1994 (base scale 1:1 000 000).
The GEZ map, together with other global maps produced by FRA 2000, is presented on the
FAO Forestry Web site (www.fao.org/forestry/site/24815/en) under “World maps”.
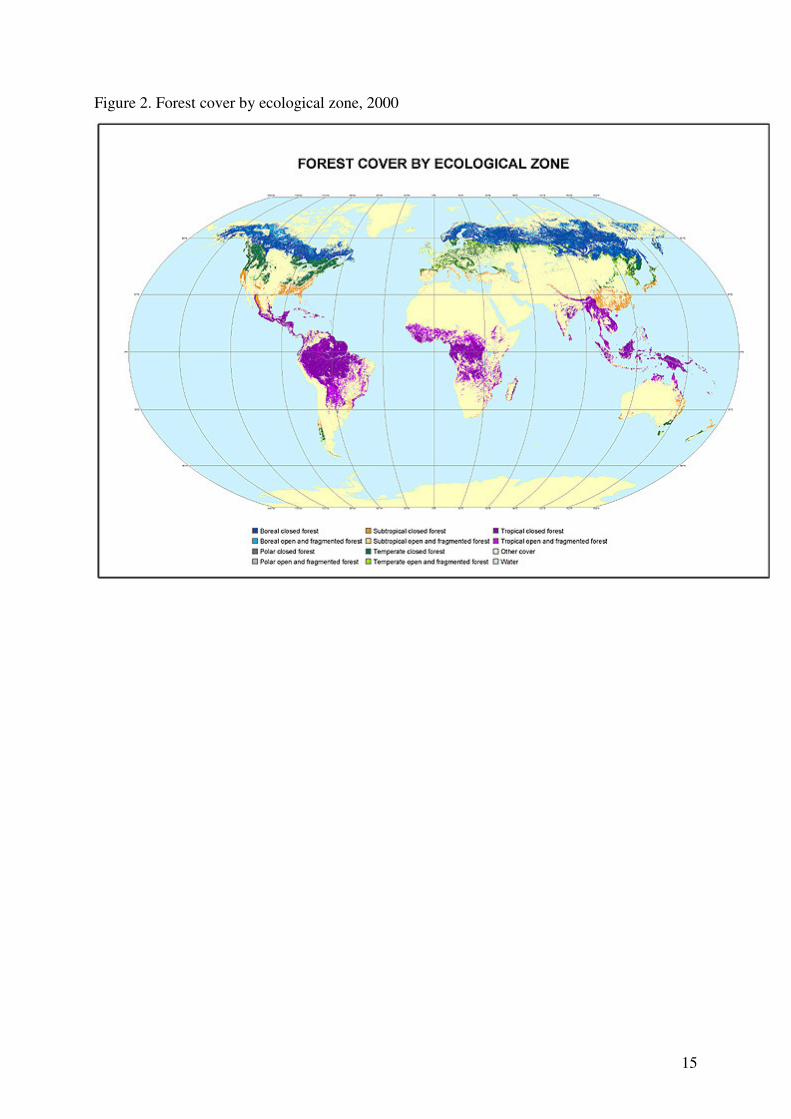
Forest cover by ecological zone
The GEZ map can be used to aggregate information on forest resources by ecological zone.
Consequently, it is now possible to produce reports according to the natural characteristics of
the vegetation rather than by national boundaries, which frequently cut across natural
ecosystems.
This is particularly important today, with the growing awareness that many environmental
problems are not national in character. For example, analysis of global change in climate and
forest resources and of change in regional biological corridors requires information with a
broad geographical context. Through ecological zone mapping, valuable insight is being
obtained about the characteristics of forest resources which may serve to identify and resolve
issues of importance to many countries, entire regions or the planet as a whole. For FRA 2000
reporting purposes, an overlay of the forest cover map with the ecological zoning map was
used to prepare a map of forest cover by ecological zone (Figure 2) and to derive area
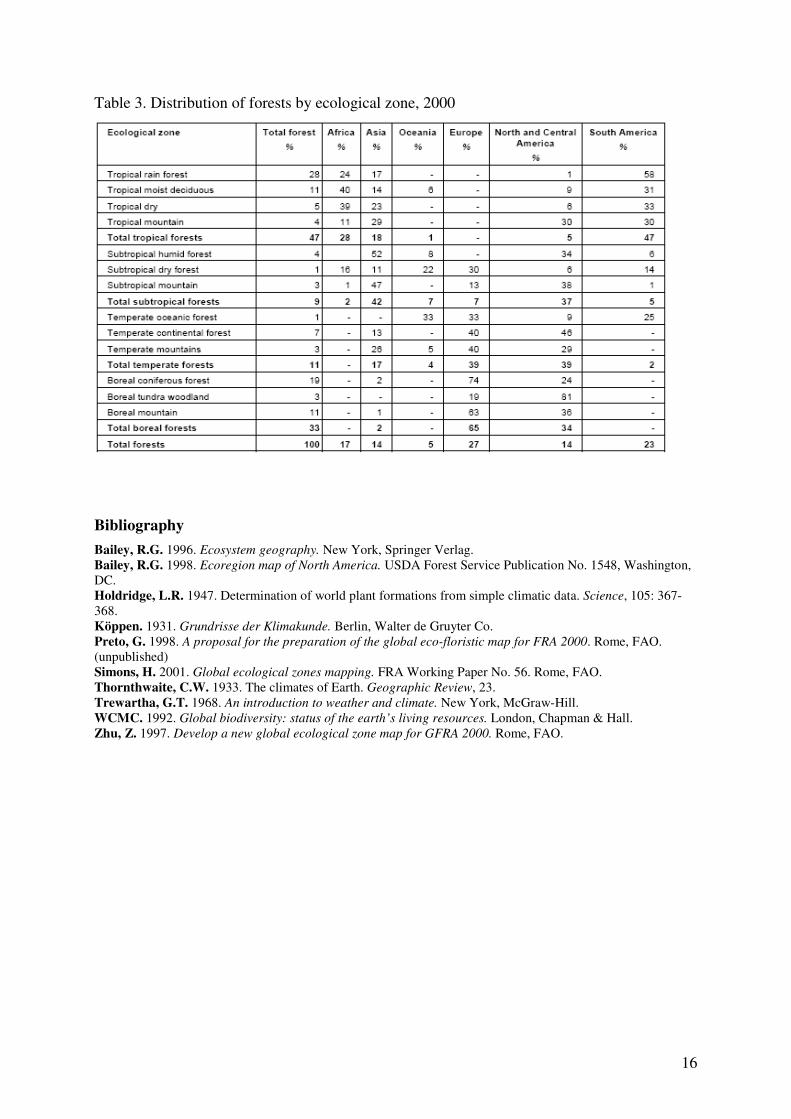
statistics on forests according to ecological zones (Table 3).
15
Figure 2. Forest cover by ecological zone, 2000
16
Table 3. Distribution of forests by ecological zone, 2000
Bibliography
Bailey, R.G. 1996. Ecosystem geography. New York, Springer Verlag.
Bailey, R.G. 1998. Ecoregion map of North America. USDA Forest Service Publication No. 1548, Washington,
DC.
Holdridge, L.R. 1947. Determination of world plant formations from simple climatic data. Science, 105: 367-
368.
Köppen. 1931. Grundrisse der Klimakunde. Berlin, Walter de Gruyter Co.
Preto, G. 1998. A proposal for the preparation of the global eco-floristic map for FRA 2000. Rome, FAO.
(unpublished)
Simons, H. 2001. Global ecological zones mapping. FRA Working Paper No. 56. Rome, FAO.
Thornthwaite, C.W. 1933. The climates of Earth. Geographic Review, 23.
Trewartha, G.T. 1968. An introduction to weather and climate. New York, McGraw-Hill.
WCMC. 1992. Global biodiversity: status of the earth’s living resources. London, Chapman & Hall.
Zhu, Z. 1997. Develop a new global ecological zone map for GFRA 2000. Rome, FAO.