Fish Byproduct Utilization - کمیته فنی کنسرو ... Byproduct Utilization . ... Parts...
31
Peter Bechtel USDA- Agricultural Research Service Fisheries Industrial Technology Center Kodiak Alaska [email protected] Fish Byproduct Utilization
Transcript of Fish Byproduct Utilization - کمیته فنی کنسرو ... Byproduct Utilization . ... Parts...

Peter Bechtel USDA- Agricultural Research Service Fisheries Industrial Technology Center
Kodiak Alaska [email protected]
Fish Byproduct Utilization

World Capture by Species
26% - Small Pelagics (Sardines, Herring, Anchovies, etc)
21% - Large Pelagics (Tunas, Bonitos, Billfishes, misc. Pelagics, etc)
15% - Demersals (Flounders, Halibuts, Soles, Cods, Hakes, Pollock, etc)
7% - Crustaceans (Crabs, Shrimp, Lobsters, etc) 6% - Misc. Coastal Fish
John Messerich, Source FAO, 2002

Alaska Fish Species
Pink salmon
Arrow tooth flounder
Halibut
Pollock
Rockfish
F.H.Sole

General Fish Processing Outline

Fish Processing Line
Harvesting Fish

Seafood Harvest in Alaska
Marine Fin Fish 2000 MT 2005 MTAlaska Pollock 1067738 1414962Salmon 319472 408014Pacific Cod 226709 225341Flat Fish 141530 111357Yellow Fin Flat 87787Atka Mackerel 39986 58423Perch 17077 21002Sabel Fish 13547 14944Rock Fish 10472 13447Pacific Herring 32509 37610Halibut 32686 26016Others 3523 29092
Total 1905249 2447995

Alaska Seafood Harvest (MT)
Marine Shell Fish 2000 2005
Crab 22968 24145Shell Fish 881 1286Squid 333 1183
Total 24182 26614

Alaska Fish Harvest by Region and Sector
Region Largest percentage harvested in Bering Sea ~ 70% Second largest harvest from Gulf of Alaska
Sector Processed in land-based plants ~ 55% Processed at sea ~ 45%

Catfish and other Aquaculture Species
Channel catfish is the fourth-most popular fish product consumed in the United States.
United States production in Alabama, Arkansas, Louisiana, and Mississippi.
Over 272,000 metric tons of catfish produced in 2005

Waste to By-product to Co-product
In the past, “waste” was used for materials that were left over after primary food processing.
However “waste” can be used as the raw materials to make other products, which increase profits and reduce environmental concerns.
There are many examples where yesterdays “waste“ became a valued raw material for further processing.

Fish Byproducts
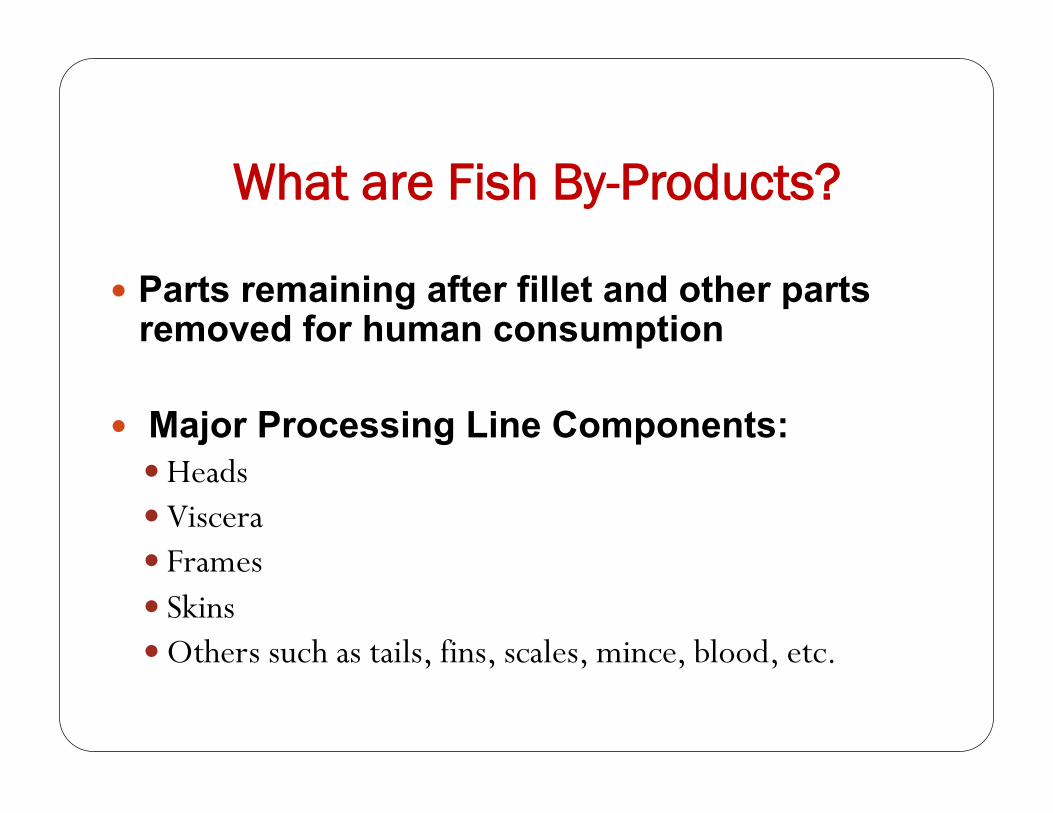
What are Fish By-Products?
Parts remaining after fillet and other parts removed for human consumption
Major Processing Line Components: Heads Viscera Frames Skins Others such as tails, fins, scales, mince, blood, etc.

Byproduct Organs and Tissues from Processing Line Components
Viscera Gonads – milt and roe Livers Stomachs Intestine Others
Heads Snouts Brain Gills Others

Heads
Fish Processing Byproducts Viscera
Frames Skin Roe
,

Battered Fish FramesDeboned Fillets
Packaged Fish Headss
Stomach partsIntestines for proteolytic enzymes Other parts fermented to fertilizerLiver for oil, vit and mineralsScales for special pigments
Intestines for proteolytic enzymes
Stomach parts
Liver for oil, vit and minerals
Scales for special pigments
Other parts fermented to fertilizer
Milkfish Byproduct Utilization

• Hydrolysates • Chitin • Enzymes • Krill Oil • Others
Krill Byproducts

Proximate Analysis of Dried Pollock Processing Byproducts
% H2O % Protein % Fat % Ash
WF 8 10.8
Fillets 8 5.2
Heads 8 19.4
Frames 8 14.5
Viscera 8 3.6
Skin 8 2.8 Bechtel 2003
Bechtel 2003

Alaska Wild Fish Byproduct Advantages
Fish processing byproducts from sustainable fisheries Derived from fish processed for human consumption so are
initially of high quality Large amount of byproduct from white fish (pollock, cod,
flat fish) Cold water marine fish have high levels of 3-omega fatty
acids and high quality protein High quality parts including skin, frames, heads, and viscera
are available in large quantity directly from the processing line

Aquaculture Fish Byproduct Advantages
Smaller and more constant amounts of byproducts available over longer periods of time
Smaller sized equipment needed for processing Derived from fish processed for human consumption so
are initially of high quality High quality parts including skin, frames, heads, and
viscera available directly from the processing line High quality fish protein and oils Often close to an agriculture user (example: raw
byproduct as feed ingredient)

Where Do Most of the Left Over Parts Go ?

Fish Byproduct Uses: Descending Value
Human Supplements, Biochemicals, Proteins and Oils
Human Foods and Ingredients Industrial Ingredients Pet Food Ingredients Aquaculture Ingredients Pig and Chicken Feed Ingredients Fertilizers Fuels

Products from Fish Byproducts
Feed Ingredients for Aquaculture Companion Animals Farm Animals
Fertilizers Natural fertilizers Soil conditioners Compost
Human Ingredients Oils Protein powders Hydrolysates Mineral supplements Pharmaceuticals Gelatin films
Industrial uses Fuels Cosmetics Biodegradable materials

Fish Meals

World Fish Meal
Approximately 6.5 million metric tons/year Most from large scale industrial fisheries such as found in Peru
Alaska produces about 1-2% of the world fish meal from processing byproduct
Only small amounts of meals and oil from aquaculture in the US
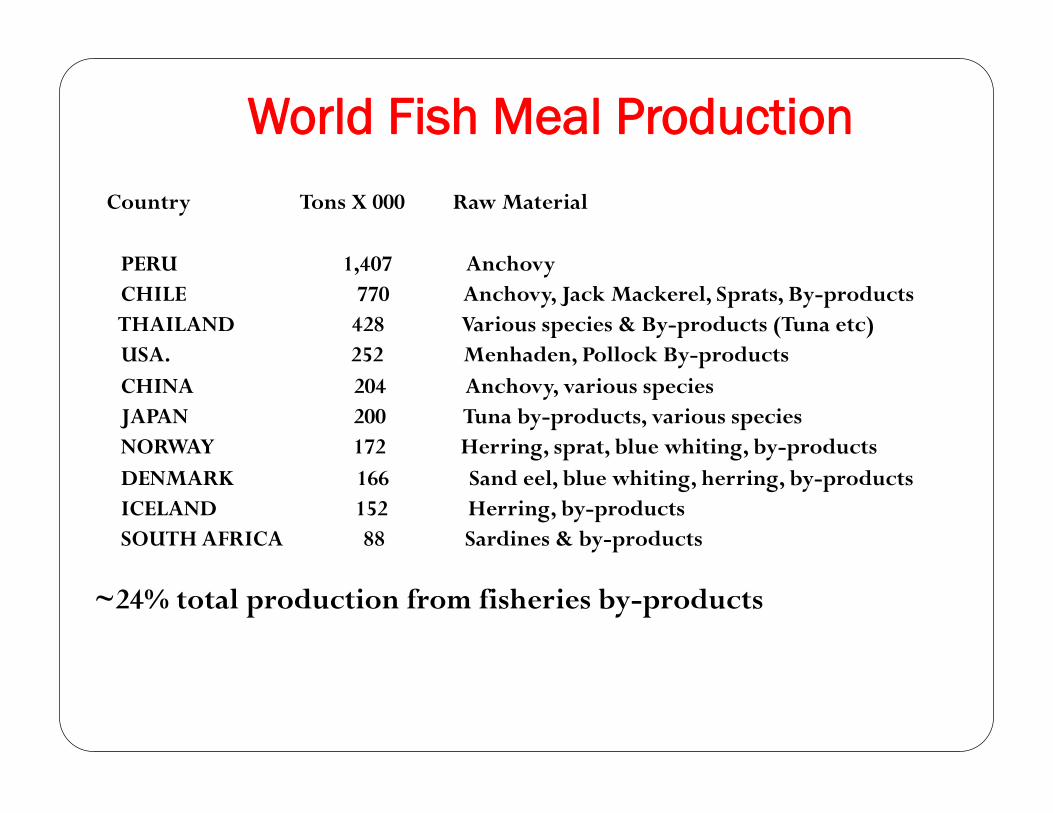
World Fish Meal Production Country Tons X 000 Raw Material
PERU 1,407 Anchovy CHILE 770 Anchovy, Jack Mackerel, Sprats, By-products THAILAND 428 Various species & By-products (Tuna etc) USA. 252 Menhaden, Pollock By-products CHINA 204 Anchovy, various species JAPAN 200 Tuna by-products, various species NORWAY 172 Herring, sprat, blue whiting, by-products DENMARK 166 Sand eel, blue whiting, herring, by-products ICELAND 152 Herring, by-products SOUTH AFRICA 88 Sardines & by-products
~24% total production from fisheries by-products

Approximation of USA Fish Meal Production source John Messerich
0
20000
40000
60000
80000
100000
120000
140000
160000
180000
Menhaden Alaska Catfish Other
20042005

Kodiak Fish Meal Company

Kodiak Alaska 2008: Eagles and Fish Waste

Fish Meal and Fish Oil Processing

Fish Meal Processing Equipment