Fine mapping of autophagy-related proteins during ... · Journal of Cell Science Fine mapping of...
11
Journal of Cell Science Fine mapping of autophagy-related proteins during autophagosome formation in Saccharomyces cerevisiae Kuninori Suzuki 1, *, Manami Akioka 2 , Chika Kondo-Kakuta 2 , Hayashi Yamamoto 2 and Yoshinori Ohsumi 2, * 1 Bioimaging Center, Graduate School of Frontier Sciences, University of Tokyo, FSB-101, 5-1-5 Kashiwanoha, Kashiwa, Chiba 277-8562, Japan 2 Frontier Research Center, Tokyo Institute of Technology, 4259-S2-12 Nagatsuta-cho, Midori-ku, Yokohama, Kanagawa 226-8503, Japan *Authors for correspondence ([email protected]; [email protected]) Accepted 18 March 2013 Journal of Cell Science 126, 2534–2544 ß 2013. Published by The Company of Biologists Ltd doi: 10.1242/jcs.122960 Summary Autophagy is a bulk degradation system mediated by biogenesis of autophagosomes under starvation conditions. In Saccharomyces cerevisiae, a membrane sac called the isolation membrane (IM) is generated from the pre-autophagosomal structure (PAS); ultimately, the IM expands to become a mature autophagosome. Eighteen autophagy-related (Atg) proteins are engaged in autophagosome formation at the PAS. However, the cup-shaped IM was visualized just as a dot by fluorescence microscopy, posing a challenge to further understanding the detailed functions of Atg proteins during IM expansion. In this study, we visualized expanding IMs as cup- shaped structures using fluorescence microscopy by enlarging a selective cargo of autophagosomes, and finely mapped the localizations of Atg proteins. The PAS scaffold proteins (Atg13 and Atg17) and phosphatidylinositol 3-kinase complex I were localized to a position at the junction between the IM and the vacuolar membrane, termed the vacuole–IM contact site (VICS). By contrast, Atg1, Atg8 and the Atg16–Atg12–Atg5 complex were present at both the VICS and the cup-shaped IM. We designate this localization the ‘IM’ pattern. The Atg2–Atg18 complex and Atg9 localized to the edge of the IM, appearing as two or three dots, in close proximity to the endoplasmic reticulum exit sites. Thus, we designate these dots as the ‘IM edge’ pattern. These data suggest that Atg proteins play individual roles at spatially distinct locations during IM expansion. These findings will facilitate detailed investigations of the function of each Atg protein during autophagosome formation. Key words: Autophagy, Autophagosome, Isolation membrane, Autophagy-related genes, ATG, Pre-autophagosomal structure, PAS, Aminopeptidase I, Ape1, Ape1 complex, Starvation, Rapamycin, Endoplasmic reticulum exit sites, ERES, Yeast, Vacuole-isolation membrane contact site, VICS Introduction Macroautophagy, hereafter called simply ‘autophagy,’ is a bulk degradation system widely conserved among eukaryotes from yeast to mammals. When eukaryotic cells are faced with nutrient starvation, they degrade cytoplasmic materials to obtain building blocks that help them adapt to severe environmental conditions. Currently, over 30 autophagy-related (ATG) genes have been identified as necessary for various types of autophagy in yeast. Among them, 18 ATG genes are essential for autophagosome formation upon starvation (Mizushima et al., 2011; Nakatogawa et al., 2009). These Atg proteins are involved in autophagosome formation as components of several discrete functional units, but their interrelationships are not yet well understood. Identification of the pre-autophagosomal structure (PAS) was an important milestone in the identification of the functioning Atg proteins. Using fluorescence microscopy, the PAS was initially found as a juxtavacuolar dot of Atg5 and Atg8 (Suzuki et al., 2001). The PAS was detectable in some atg disruptants, implying that the PAS can be organized regardless of autophagosome formation (Suzuki et al., 2001). The PAS is assembled through hierarchical interactions between Atg proteins. Early in the pathway, the upstream factors Atg11 and Atg17 modulate PAS assembly under nutrient-rich and starvation conditions, respectively (Shintani and Klionsky, 2004; Suzuki et al., 2007). Atg17 is a component of the Atg1–Atg13–Atg17– Atg29–Atg31 complex, which is responsible for recruitment of downstream Atg proteins upon starvation (Kawamata et al., 2008). Atg9 is one of these downstream Atg proteins (Suzuki et al., 2007). Atg9 is a membrane protein that is integrated into Golgi-derived vesicles called Atg9 vesicles (Yamamoto et al., 2012). A few Atg9 vesicles are targeted to the PAS (Yamamoto et al., 2012), suggesting that lipids are components of the PAS. After the PAS is assembled, it acts to generate the isolation membrane (IM), which ultimately becomes a closed autophagosome (Baba et al., 1997). Atg8, one of the most downstream Atg proteins, is localized to the PAS, the IM and the autophagosome, and is subsequently delivered to the vacuole (Kirisako et al., 1999; Suzuki et al., 2001). Thus, Atg8 is used as a marker for all of these autophagic structures. However, two technical issues have obstructed further progress: in Saccharomyces cerevisiae, the IM is not This is an Open Access article distributed under the terms of the Creative Commons Attribution Non-Commercial Share Alike License (http://creativecommons.org/licenses/by-nc-sa/3.0/), which permits unrestricted non-commercial use, distribution and reproduction in any medium provided that the original work is properly cited and all further distributions of the work or adaptation are subject to the same Creative Commons License terms. 2534 Research Article
Transcript of Fine mapping of autophagy-related proteins during ... · Journal of Cell Science Fine mapping of...
Journ
alof
Cell
Scie
nce
Fine mapping of autophagy-related proteins duringautophagosome formation in Saccharomycescerevisiae
Kuninori Suzuki1,*, Manami Akioka2, Chika Kondo-Kakuta2, Hayashi Yamamoto2 and Yoshinori Ohsumi2,*1Bioimaging Center, Graduate School of Frontier Sciences, University of Tokyo, FSB-101, 5-1-5 Kashiwanoha, Kashiwa, Chiba 277-8562, Japan2Frontier Research Center, Tokyo Institute of Technology, 4259-S2-12 Nagatsuta-cho, Midori-ku, Yokohama, Kanagawa 226-8503, Japan
*Authors for correspondence ([email protected]; [email protected])
Accepted 18 March 2013Journal of Cell Science 126, 2534–2544� 2013. Published by The Company of Biologists Ltddoi: 10.1242/jcs.122960
SummaryAutophagy is a bulk degradation system mediated by biogenesis of autophagosomes under starvation conditions. In Saccharomyces
cerevisiae, a membrane sac called the isolation membrane (IM) is generated from the pre-autophagosomal structure (PAS); ultimately,
the IM expands to become a mature autophagosome. Eighteen autophagy-related (Atg) proteins are engaged in autophagosomeformation at the PAS. However, the cup-shaped IM was visualized just as a dot by fluorescence microscopy, posing a challenge tofurther understanding the detailed functions of Atg proteins during IM expansion. In this study, we visualized expanding IMs as cup-
shaped structures using fluorescence microscopy by enlarging a selective cargo of autophagosomes, and finely mapped the localizationsof Atg proteins. The PAS scaffold proteins (Atg13 and Atg17) and phosphatidylinositol 3-kinase complex I were localized to a positionat the junction between the IM and the vacuolar membrane, termed the vacuole–IM contact site (VICS). By contrast, Atg1, Atg8 and the
Atg16–Atg12–Atg5 complex were present at both the VICS and the cup-shaped IM. We designate this localization the ‘IM’ pattern. TheAtg2–Atg18 complex and Atg9 localized to the edge of the IM, appearing as two or three dots, in close proximity to the endoplasmicreticulum exit sites. Thus, we designate these dots as the ‘IM edge’ pattern. These data suggest that Atg proteins play individual roles atspatially distinct locations during IM expansion. These findings will facilitate detailed investigations of the function of each Atg protein
during autophagosome formation.
Key words: Autophagy, Autophagosome, Isolation membrane, Autophagy-related genes, ATG, Pre-autophagosomal structure, PAS,
Aminopeptidase I, Ape1, Ape1 complex, Starvation, Rapamycin, Endoplasmic reticulum exit sites, ERES, Yeast, Vacuole-isolation membrane contact
site, VICS
IntroductionMacroautophagy, hereafter called simply ‘autophagy,’ is a bulk
degradation system widely conserved among eukaryotes from
yeast to mammals. When eukaryotic cells are faced with nutrient
starvation, they degrade cytoplasmic materials to obtain building
blocks that help them adapt to severe environmental conditions.
Currently, over 30 autophagy-related (ATG) genes have been
identified as necessary for various types of autophagy in yeast.
Among them, 18 ATG genes are essential for autophagosome
formation upon starvation (Mizushima et al., 2011; Nakatogawa
et al., 2009). These Atg proteins are involved in autophagosome
formation as components of several discrete functional units, but
their interrelationships are not yet well understood.
Identification of the pre-autophagosomal structure (PAS) was
an important milestone in the identification of the functioning
Atg proteins. Using fluorescence microscopy, the PAS was
initially found as a juxtavacuolar dot of Atg5 and Atg8 (Suzuki
et al., 2001). The PAS was detectable in some atg disruptants,
implying that the PAS can be organized regardless of
autophagosome formation (Suzuki et al., 2001). The PAS is
assembled through hierarchical interactions between Atgproteins. Early in the pathway, the upstream factors Atg11 and
Atg17 modulate PAS assembly under nutrient-rich and starvation
conditions, respectively (Shintani and Klionsky, 2004; Suzukiet al., 2007). Atg17 is a component of the Atg1–Atg13–Atg17–
Atg29–Atg31 complex, which is responsible for recruitment of
downstream Atg proteins upon starvation (Kawamata et al.,2008). Atg9 is one of these downstream Atg proteins (Suzuki
et al., 2007). Atg9 is a membrane protein that is integrated intoGolgi-derived vesicles called Atg9 vesicles (Yamamoto et al.,
2012). A few Atg9 vesicles are targeted to the PAS (Yamamoto
et al., 2012), suggesting that lipids are components of thePAS. After the PAS is assembled, it acts to generate the
isolation membrane (IM), which ultimately becomes a closed
autophagosome (Baba et al., 1997).
Atg8, one of the most downstream Atg proteins, is localized to
the PAS, the IM and the autophagosome, and is subsequentlydelivered to the vacuole (Kirisako et al., 1999; Suzuki et al.,
2001). Thus, Atg8 is used as a marker for all of these autophagicstructures. However, two technical issues have obstructed further
progress: in Saccharomyces cerevisiae, the IM is not
This is an Open Access article distributed under the terms of the Creative Commons AttributionNon-Commercial Share Alike License (http://creativecommons.org/licenses/by-nc-sa/3.0/), whichpermits unrestricted non-commercial use, distribution and reproduction in any medium provided thatthe original work is properly cited and all further distributions of the work or adaptation are subject tothe same Creative Commons License terms.
2534 Research Article
Journ
alof
Cell
Scie
nce
distinguishable from the PAS because of the resolution limit oflight microscopy; moreover, the PAS has not been detected byelectron microscopy. Therefore, in order to investigate thefunction of each Atg protein it was crucial to develop a method
for discriminating the IM and PAS by fluorescence microscopy.
In this study, using Saccharomyces cerevisiae cells, we
visualized the IM as a cup-shaped structure using fluorescencemicroscopy by enlarging a selective cargo of autophagosomes.Using this method, we were able to finely map the localizations
of Atg proteins during IM expansion.
ResultsGiant Ape1 complex enables to visualize isolationmembranesVacuolar aminopeptidase I (Ape1) is synthesized as a proform(prApe1), and assembles into the Ape1 complex, in the cytoplasm
(Shintani et al., 2002). The Ape1 complex associates with a-mannosidase and Ty1 virus–like particles to form the Cvt(cytoplasm-to-vacuole targeting) complex (Lynch-Day and
Klionsky, 2010; Shintani et al., 2002; Suzuki et al., 2011). TheCvt complex is selectively enclosed in Cvt vesicles under nutrient-rich conditions, and in autophagosomes during starvation (Baba
et al., 1997). Core Atg proteins are responsible for the formation ofCvt vesicles and autophagosomes (Xie and Klionsky, 2007). Thesedouble-membrane-bound structures fuse with the vacuole, inwhich prApe1 is processed to mature Ape1 (mApe1) (Klionsky
et al., 1992). When prApe1 is moderately overexpressed, prApe1accumulates under nutrient-rich conditions, but matures to mApe1when cells are starved (Geng et al., 2008), probably because
autophagosomes (,500 nm in diameter) have a larger cargocapacity than Cvt vesicles (,150 nm in diameter).
When prApe1 was highly overexpressed from a multicopyplasmid (supplementary material Fig. S1A), the majority ofApe1 was detected as prApe1 even under autophagy-inducing
conditions (supplementary material Fig. S1B). Thus, overexpressionof prApe1 exceeds the capacity of autophagy, causing prApe1 toaccumulate in the cytoplasm. We examined the localization ofoverexpressed prApe1 in RFP–prApe1-expressing cells, and found
that prApe1 formed a large spherical structure in the cytoplasm thatwas detectable even by bright-field microscopy (arrows in Fig. 1A).The diameter of these structures was ,1.7 mm on average (Fig. 1B).
In these cells, vacuolar lumens were hardly stained with RFP(asterisks in Fig. 1A). Presumably, once the Ape1 complex exceedsa critical size, it becomes too large to be enclosed in an
autophagosome, and instead forms a large structure that remainsin the cytoplasm. We call the enlarged Ape1 complex the ‘giantApe1 complex’ (GAC), hereafter.
In cells containing a GAC (hereafter, GAC cells), membranousstructures were frequently associated with the GAC and thevacuolar membrane (arrowheads in Fig. 1C,D). This localization
prompted us to hypothesize that these membranous structures arerelated to the IM. Therefore, we examined the localization ofGFP–Atg8 in GAC cells. By fluorescence microscopy, we found
that a cup-shaped structure between the GAC and the vacuole isindeed labeled with GFP–Atg8 (Fig. 1E). We measured thefluorescence intensity across the GAC, and confirmed that GFP–
Atg8 is localized along the surface of the GAC (Fig. 1F). Theseresults show that the IM can be visualized in GAC cells byfluorescence microscopy.
We examined the dynamics of IMs by time-lapse fluorescencemicroscopy. In the cell shown in Fig. 1G, a dot of GFP–Atg8
emerged between the GAC and the vacuole (40-seconds panel),then elongated along the surface of the GAC. Eventually, the IMceased to elongate at the maximum size persistently (320–440-
seconds; supplementary material Movie 1). To determinewhether such a paused IM was a dead-end structure or not, acup-shaped IM was examined by time-lapse fluorescence
microscopy (Fig. 1H). The IM (arrowhead) disappeared fromthe surface of a GAC, and a new dot emerged at another sitebetween the vacuole and another GAC (double arrowhead). The
GAC still remained outside the vacuole (arrow). These resultsindicate that the cup-shaped IM is long-lasting at the maximumsize but can be broken down physiologically.
In wild-type cells, the dynamics of GFP–Atg8 are difficult tofollow by fluorescence microscopy, because the PAS moves on
the surface of the vacuolar membrane, and autophagosomeformation is completed within 10 minutes (Geng et al., 2008). InGAC cells, the dynamics of IM expansion can be followed
because the GAC is much less mobile because of its larger mass,and the IM remains for a longer period at its maximum size.Thus, we have established a method for visualizing the maximum
length stationary IMs in GAC cells.
Lengths of the IMs reflect the magnitude of autophagy
To investigate how Atg proteins are involved in IM expansion,we measured the maximum length of GFP–Atg8-labeledstructures, which are localized between the GAC and the
vacuole, under the fluorescence microscope. In wild-type cells,the maximum length of the cup-shaped IMs was ,1.21 mm(Fig. 2A,B). GFP–Atg8 accumulated at the PAS in atg1D, atg2Dand atg18D cells (Suzuki et al., 2007). In these cells, GFP–Atg8was localized at the PAS as an elliptical spot (Fig. 2A). Themajor axis of this elliptical spot was much shorter than the IM
length observed in wild-type cells (Fig. 2B), suggesting that theIM does not expand in these gene disruptants. We conclude thatAtg1, Atg2 and Atg18 are required for IM expansion.
Atg1 is a protein kinase and its kinase activity is essential forautophagy (Kamada et al., 2000; Matsuura et al., 1997). We examined
whether the kinase activity of Atg1 was crucial for IM expansion. Weused atg1K54A and atg1D211A mutants, which are defective inautophagy due to decreased kinase activity (Kamada et al., 2000;
Matsuura et al., 1997). The kinase activity of Atg1 can be estimatedby immunoblot analysis; the slower-migrating band representsautophosphorylated Atg1 (Stephan et al., 2009). Phosphorylated
Atg1 slightly decreased in atg1K54A cells but was not detected inatg1D211A cells (Fig. 2C), suggesting that Atg1 kinase activityremains in atg1K54A cells but not in atg1D211A cells. We measured
the maximum length of the IM in these mutants and found that theIMs in atg1K54A and atg1D211A cells were shorter than those in wild-type cells and that those in atg1D211A cells were shorter than those inatg1K54A cells (Fig. 2B). This result indicates that the length of the IM
correlates with Atg1 kinase activity. Next, we quantified the activityof bulk autophagy using an alkaline phosphatase assay (Noda et al.,1995). Autophagic activity partially persisted in atg1K54A cells but
was completely abrogated in atg1D211A cells (Fig. 2D). Takentogether, these results suggest that the magnitude of bulk autophagycan be estimated from the IM lengths in GAC cells. Probably, the
kinase activity of Atg1 plays a crucial role in IM expansion.
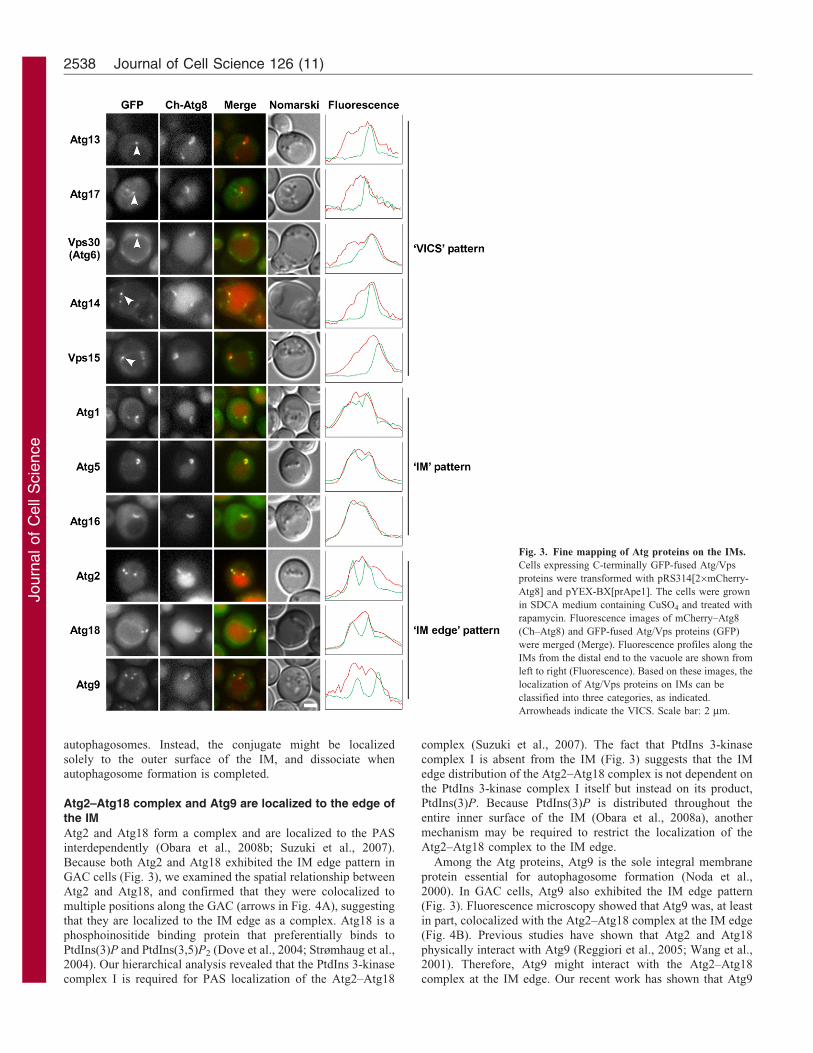
Fine mapping of Atg proteins on the IMs
Among vacuolar protein sorting (Vps) proteins, which areinvolved in sorting of Prc1 (also known as carboxypeptidase Y;
Fine mapping of Atg proteins during autophagosome formation 2535

Journ
alof
Cell
Scie
nce
CPY) to the vacuole (Raymond et al., 1992), Vps15, Vps30 and
Vps34 are essential for autophagosome formation as components
of phosphatidylinositol (PtdIns) 3-kinase complex I (Kametaka
et al., 1998; Kihara et al., 2001; Obara et al., 2008a). We
investigated the localization of representative GFP-fused Atg and
Vps proteins in GAC cells expressing 26mCherry–Atg8 (Ch–
Atg8), and finely mapped the localization of Atg/Vps proteins
during IM expansion. PAS scaffold proteins (Atg13 and Atg17)
and PtdIns 3-kinase complex I were localized to a dot at the
junction between the IM and the vacuolar membrane (arrowheads
in Fig. 3), which we termed the vacuole-IM contact site (VICS).
By contrast, Atg1, Atg8 and the Atg16–Atg12–Atg5 complex
labeled the VICS and the IM (Fig. 3). We measured the
fluorescence intensity along the IM and found that the profiles
of these proteins and Ch–Atg8 overlapped extensively (Fig. 3).
Thus, we designate this localization as the ‘IM’ pattern. The
Atg2–Atg18 complex and Atg9 were distributed as two or three
dots associated with the IM; some of these dots were apparently
distinct from the VICS (Fig. 3). Time-lapse microscopy showedthat Atg2–GFP was initially visualized as a dot and subsequentlyappeared as multiple dots at the edge of the IM (supplementarymaterial Fig. S2). Thus, we designate this localization as the ‘IM
edge’ pattern. These patterns correlate with known functionalunits, with several exceptions, as detailed in the followingsections.
The localization of Atg1 is distinct from that of itsregulators
Upon starvation, Atg1 and Atg13 interact with the Atg17–Atg29–Atg31 complex to form the Atg1–Atg13–Atg17–Atg29–Atg31complex (hereafter, the PAS scaffold complex), in a manner
independent of Atg1 kinase activity (Kabeya et al., 2009;Kamada et al., 2000; Kawamata et al., 2008). We used Atg13and Atg17 as representative components of the PAS scaffold
Fig. 1. GAC enables visualization of IMs. (A) Overexpression of
prApe1 enables visualization of the Ape1 complex under a bright-
field microscope with Nomarski optics. Wild-type cells expressing
RFP–Ape1 at the natural expression level (GYS638) carrying pYEX-
BX[prApe1] were grown in SDCA medium containing CuSO4 and
treated with rapamycin for 5 hours. Arrows indicate the GAC.
Asterisks indicate vacuoles. Scale bar: 2 mm. (B) Histogram of the
diameters of GACs outside the vacuole. Diameters were measured for
cells in A using MetaMorph software. Red dotted line indicates the
average diameter. Cells were treated with rapamycin for 5 hours.
(C,D) Electron micrographs of a GAC. Wild-type cells
overexpressing prApe1 were grown in SDCA medium containing
CuSO4 and treated with rapamycin for 5 hours. A, Ape1 complex; V,
vacuole; N, nucleus. Arrowheads indicate membranous structures.
Scale bar: 500 nm. (E) The GAC enables IM identification under the
fluorescence microscope. Wild-type cells expressing RFP–Ape1 at a
natural expression level and harboring pRS314[GFP-Atg8] and
pYEX-BX[prApe1] were grown in SDCA medium containing CuSO4
and treated with rapamycin for 6 hours. An asterisk and an arrow
indicate the vacuole and the GAC, respectively. Scale bar: 2 mm.
(F) Fluorescence profiles of GFP (green) and RFP (red) measured
along the white line in E. (G,H) Time-lapse images of GFP–Atg8.
Cells were treated with rapamycin for 2–3 hours before observation.
Images were taken every 40 seconds. GFP–Atg8 and RFP–prApe1
are colored green and red, respectively. Arrows, GAC; arrowheads
and double arrowhead, GFP–Atg8; asterisks, vacuoles. Scale bar:
2 mm.
Journal of Cell Science 126 (11)2536

Journ
alof
Cell
Scie
nce
complex; both proteins were localized to the VICS (Fig. 3),
suggesting that Atg13 and Atg17 stay at the VICS during IM
expansion. In contrast, Atg1 exhibited the IM pattern (Fig. 3),
indicating that a substantial proportion of Atg1 dissociates from
the PAS scaffold complex. Atg1 is, at least in part, localized to
the inner surface of the IM, because Atg1 is enclosed in
autophagosomes and subsequently delivered to the vacuole
(Nakatogawa et al., 2012b).
Phosphatidylinositol 3-kinase complex I stays at the VICS
In S. cerevisiae, two distinct PtdIns 3-kinase complexes have
been identified: PtdIns 3-kinase complex I, which is required for
autophagy and consists of Vps15, Vps34, Vps30 and Atg14; and
PtdIns 3-kinase complex II, which is required for the VPS
pathway and contains Vps38 instead of Atg14 (Kihara et al.,
2001). We visualized Vps15–GFP, Vps30–GFP and Atg14–GFP
and showed that PtdIns 3-kinase complex I was localized to the
VICS during IM expansion (Fig. 3). In addition, we showed that
dots labeled with Vps38–GFP did not associate with the IM
(supplementary material Fig. S3), further indicating that PtdIns
complex II is dispensable for autophagosome formation.
Previously, using GFP-26FYVE as a probe, our group showed
that phosphatidylinositol 3-phosphate [PtdIns(3)P], a product of
the PtdIns 3-kinases, is localized to the IM (Obara et al., 2008a).
The fact that the PtdIns 3-kinase complex I is localized to the
VICS during IM expansion suggests that PtdIns(3)P is mainly
produced at the VICS.
Atg16 and the Atg12–Atg5 conjugate exhibit the IM pattern
Localization analysis of Atg5–GFP and Atg16–GFP in GAC cells
revealed that these proteins exhibited the IM pattern (Fig. 3).
Thus, Atg5 and Atg16 are markers for the IM in S. cerevisiae as
well as in mammalian cells (Mizushima et al., 2003; Mizushima
et al., 2001). Association of Atg16 with Atg5 is important for
targeting the Atg12–Atg5 conjugate to the PAS (Matsushita et al.,
2007), suggesting that this interaction is required for their
localization to the IM. Our group has reported that Atg12–Atg5
exerts an E3-like function in the conjugation of Atg8 with
phosphatidylethanolamine (PE) to produce Atg8–PE (Hanada
et al., 2007). IM localization of both the Atg12–Atg5 conjugate
and Atg8 suggests that the Atg12–Atg5 conjugate continuously
generates Atg8–PE on the IM. Because the Atg12–Atg5
conjugate does not label autophagosomes accumulated in the
cytoplasm in ypt7D cells (Suzuki et al., 2001), the conjugate is
not localized to either the outer or the inner membrane of mature
Fig. 2. Lengths of the IMs reflect the magnitude of autophagy. (A) RFP–
prApe1-expressing cells harboring pRS314[GFP-ATG8] and pYEX-
BX[prAPE1] were grown in SDCA medium containing CuSO4 and treated
with rapamycin for 6 hours. Scale bar: 2 mm. (B) Lengths of IMs, estimated
from the images in A. Fluorescence intensities of GFP–Atg8 were measured
using the ‘linescan’ function of the MetaMorph software, and FWHM (full
width at half maximum) was calculated from each graph. Wild-type (n510),
atg1D (n58), atg2D (n517), atg18D (n519), atg1D211A (n512) and atg1K54A
(n513) cells were used. Error bars indicate standard deviations. *P,0.05;
**P,0.001; N.S. (not significant) indicates P.0.05 (two-tailed Student’s t-
test). (C) Autophosphorylation of Atg1. Cells were grown in YEPD medium
and incubated in the presence of rapamycin for 6 hours; cell lysates were
prepared by the alkaline lysis method. Aliquots of cell lysates (0.05 OD600
units) were subjected to immunoblot analysis using an anti-Atg1 antiserum.
The slower-migrating bands represent phosphorylated Atg1 (P-Atg1), and the
faster-migrating bands represent unphosphorylated Atg1 (Atg1). (D) Activity
of bulk autophagy, estimated by the alkaline phosphatase assay. Cells
harboring pTN3 were grown in SDCA medium and transferred to SD(–N)
medium. Collected cells were subjected to the alkaline phosphatase assay
(Noda et al., 1995). **P,0.001; N.S. (not significant) indicates P.0.05 (two-
tailed Student’s t-test).
Fine mapping of Atg proteins during autophagosome formation 2537
Journ
alof
Cell
Scie
nce
autophagosomes. Instead, the conjugate might be localized
solely to the outer surface of the IM, and dissociate whenautophagosome formation is completed.
Atg2–Atg18 complex and Atg9 are localized to the edge ofthe IM
Atg2 and Atg18 form a complex and are localized to the PASinterdependently (Obara et al., 2008b; Suzuki et al., 2007).
Because both Atg2 and Atg18 exhibited the IM edge pattern inGAC cells (Fig. 3), we examined the spatial relationship betweenAtg2 and Atg18, and confirmed that they were colocalized to
multiple positions along the GAC (arrows in Fig. 4A), suggestingthat they are localized to the IM edge as a complex. Atg18 is aphosphoinositide binding protein that preferentially binds to
PtdIns(3)P and PtdIns(3,5)P2 (Dove et al., 2004; Strømhaug et al.,2004). Our hierarchical analysis revealed that the PtdIns 3-kinasecomplex I is required for PAS localization of the Atg2–Atg18
complex (Suzuki et al., 2007). The fact that PtdIns 3-kinase
complex I is absent from the IM (Fig. 3) suggests that the IM
edge distribution of the Atg2–Atg18 complex is not dependent on
the PtdIns 3-kinase complex I itself but instead on its product,PtdIns(3)P. Because PtdIns(3)P is distributed throughout the
entire inner surface of the IM (Obara et al., 2008a), another
mechanism may be required to restrict the localization of the
Atg2–Atg18 complex to the IM edge.
Among the Atg proteins, Atg9 is the sole integral membrane
protein essential for autophagosome formation (Noda et al.,
2000). In GAC cells, Atg9 also exhibited the IM edge pattern(Fig. 3). Fluorescence microscopy showed that Atg9 was, at least
in part, colocalized with the Atg2–Atg18 complex at the IM edge
(Fig. 4B). Previous studies have shown that Atg2 and Atg18
physically interact with Atg9 (Reggiori et al., 2005; Wang et al.,2001). Therefore, Atg9 might interact with the Atg2–Atg18
complex at the IM edge. Our recent work has shown that Atg9
Fig. 3. Fine mapping of Atg proteins on the IMs.
Cells expressing C-terminally GFP-fused Atg/Vps
proteins were transformed with pRS314[26mCherry-
Atg8] and pYEX-BX[prApe1]. The cells were grown
in SDCA medium containing CuSO4 and treated with
rapamycin. Fluorescence images of mCherry–Atg8
(Ch–Atg8) and GFP-fused Atg/Vps proteins (GFP)
were merged (Merge). Fluorescence profiles along the
IMs from the distal end to the vacuole are shown from
left to right (Fluorescence). Based on these images, the
localization of Atg/Vps proteins on IMs can be
classified into three categories, as indicated.
Arrowheads indicate the VICS. Scale bar: 2 mm.
Journal of Cell Science 126 (11)2538

Journ
alof
Cell
Scie
nce
stays at the PAS during a cycle of autophagosome formation
(Yamamoto et al., 2012); in conjunction with that data, we
assume that Atg9 stays at the IM edge during one cycle of
autophagosome formation.
Endoplasmic reticulum is localized adjacent to the IM
In mammalian cells, physical connections between IMs and the
endoplasmic reticulum (ER) have been observed by electron
microscopy (Hayashi-Nishino et al., 2009; Yla-Anttila et al.,
2009). We visualized the ER using Dpm1–GFP and Sec71TMD–
GFP, which are ER transmembrane markers that exhibit a typical
ER pattern, i.e. perinuclear and peripheral-network staining
(Rossanese et al., 2001). We found that the IM was in close
proximity to the ER (Fig. 5A,B). When we labeled the ER lumen
with GFP–HDEL (his-asp-glu-leu) (Okamoto et al., 2006) and
observed cells with three-dimensional fluorescence microscopy,
we found that the IM was associated with the ER at two or three
sites; the IM seemed to be connected with both the perinuclear
and peripheral ER (arrows in Fig. 5C; supplementary material
Fig. S4). Despite close association of IM with the ER, neither ER
transmembrane nor lumenal proteins were ever detected at the IM
(Fig. 5).
The IM is associated with ER exit sites
ER exit sites (ERES), which are subdomains of the ER
specifically responsible for the production of COPII vesicles,
can be labeled by fluorescent-protein-tagged Sec13 or Sec16
(Connerly et al., 2005). We visualized the localization of ERES
in GAC cells by three-dimensional fluorescence microscopy,
using Sec13–GFP as a marker, and found that the IM was located
in close proximity to ERES at two or three sites per cell (Fig. 6A;
supplementary material Fig. S5). The same result was obtained
when Sec16–GFP was used (data not shown). Association of the
IM with ERES labeled with Sec16–GFP was clearly detected in
79% of the cells (38 cells were examined three-dimensionally).
Fig. 5. ER is localized adjacent to the IM. Cells were grown in SDCA
medium containing CuSO4 and treated with rapamycin for the indicated
number of hours. (A) Cells harboring pRS314[26mCherry-Atg8] and pYEX-
BX[prApe1] as well as chromosomally integrated Dpm1-GFP. Asterisks
indicate positions of the GAC. Scale bar: 2 mm. (B) Cells chromosomally
expressing Sec71TMD-GFP harboring pRS314[26mCherry-Atg8] and
pYEX-BX[prApe1]. Asterisks indicate positions of the GAC. Scale bar:
2 mm. (C) Three-dimensional images of cells harboring pMO13 (GFP-HDEL)
and pRS424[PCUP1-prApe1] as well as chromosomally integrated
26mCherry-Atg8 (Ch-Atg8). An asterisk indicates the position of the GAC.
Arrows indicate sites at which the IM and the ER are associated. Scale bar:
1 mm.
Fig. 4. The Atg2–Atg18 complex and Atg9 are colocalized at the edge of
the IM. Cells were grown in SDCA medium containing CuSO4 and treated
with rapamycin for 3 hours. (A) Images of cells harboring pYEX-
BX[prApe1] and chromosomally integrated Atg2-26GFP and Atg18-
36mCherry. Arrows indicate colocalized dots. Asterisks indicate positions of
the GAC. Scale bar: 2 mm. (B) Images of cells harboring pYEX-BX[prApe1]
and chromosomally integrated Atg9-26GFP and Atg18-36mCherry. Arrows
indicate colocalized dots. Asterisks indicate positions of the GAC. Scale bar:
2 mm.
Fine mapping of Atg proteins during autophagosome formation 2539

Journ
alof
Cell
Scie
nce
Sec16, which is essential for ER-to-Golgi transport, is thought to
be involved in organization of ERES as a scaffold (Connerly
et al., 2005). Previously, our group showed that a temperature-
sensitive sec16-2 mutant is defective in autophagy at the non-
permissive temperature (Ishihara et al., 2001). These data suggest
that ERES play important roles in IM expansion.
As mentioned above, IMs are associated with the ER at two or
three sites per cell (Fig. 6A). We also show that the Atg2–Atg18
complex forms dots in two or three places at the edge of the IM
(Fig. 3). These observations prompted us to examine the spatial
relationship between ERES and the Atg2–Atg18 complex. By
three-dimensional fluorescence microscopy, we found that dots
labeled with Atg18 along the GAC were adjacent to ERES
(Fig. 6B; supplementary material Fig. S6). Thus, the Atg2–Atg18
complex (and Atg9) might be involved in IM expansion by
interacting with ERES at the IM edge.
DiscussionWe have used the term PAS for a perivacuolar dot that most Atg
proteins are localized to, and have called the dot detected in some
atg disruptants the PAS, implying that the PAS is not
accompanied by the IM. After the PAS is assembled, it acts to
generate the IM. In S. cerevisiae, the IM has not been
distinguishable from the PAS because of the resolution limit of
light microscopy; thus in previous studies using wild-type cells,
the PAS potentially included the IM.
In this study, taking advantage of the GAC cells, we visualized
IMs by fluorescence microscopy and finely mapped the
localizations of Atg proteins. We found that the PAS scaffold
complex and PtdIns 3-kinase complex I were localized to the
VICS. Atg1, Atg8 and the Atg16–Atg12–Atg5 complex labeled
the VICS and the IM. We also found that the Atg2–Atg18
complex and Atg9 were localized to the IM edge but not to the
VICS. Moreover, we showed that the IM is associated with the
ER at the ERES; the Atg2–Atg18 complex and Atg9 may
function at these junctions. Taken together, our data show that
Atg proteins play individual roles at spatially distinct sites during
IM expansion. These results will facilitate investigations of the
function of each Atg protein in the near future.
Expansion of the IM
In wild-type GAC cells, the maximum length of the IM is
1.21 mm (Fig. 2B). From the surface area of the IM, we can
estimate the maximum diameter of an autophagosome composed
of the same amount of lipids as the IM. When the IM is regarded
as a disc, the maximum length of the IM corresponds to the
diameter. In this case, the area of the IM approximately equals
the surface area of a sphere with a diameter of 0.61 mm
(supplementary material Fig. S7). When the IM is regarded as a
hemisphere, the area of the IM approximately equals the surface
area of a sphere with a diameter of 0.86 mm (supplementary
material Fig. S7). The diameter of an autophagic body, the inner
membrane structure of an autophagosome, is ,0.4–0.9 mm
(Takeshige et al., 1992). Therefore, we believe that an amount
of lipid necessary to form a normal-sized autophagosome is
present at the IM in GAC cells. In atg1K54A cells, the IM length is
,0.80 mm (Fig. 2B). When the IM is regarded as a disc, the area
of the IM approximately equals the surface area of a sphere with
Fig. 6. The IM is associated with ERES. Cells were grown in SDCA
medium containing CuSO4 and treated with rapamycin. (A) Three sets of
three-dimensional images of cells harboring pRS314[26mCherry-Atg8]
and pYEX-BX[prApe1] as well as chromosomally integrated Sec13-
26GFP. ERES labeled with Sec13 were localized in close proximity to
the IM (arrows). Asterisks indicate positions of the GAC. Scale bar:
1 mm. (B) The Atg2–Atg18 complex is closely localized to ERES at the
IM edge. Three sets of three-dimensional images of cells harboring
pYEX-BX[prApe1] as well as chromosomally integrated Atg18-26GFP
and Sec13-26mCherry (Sec13-Ch). ERES labeled with Sec13 were
localized in close proximity to Atg18 at two or three sites per cell
(arrows). Asterisks indicate positions of the GAC. Scale bar: 1 mm.
Journal of Cell Science 126 (11)2540

Journ
alof
Cell
Scie
nce
a diameter of 0.40 mm. When the IM is regarded as a hemisphere,
the area of the IM approximately equals the surface area of a
sphere with a diameter of 0.57 mm. Thus, the volume of an
autophagosome in atg1K54A cells is about 30% of that in wild-
type cells. This value is consistent with the level of bulk
autophagic activity of atg1K54A cells (Fig. 2D).
GFP–Atg8 is targeted to the PAS in atg1D, atg2D and atg18Dcells (Suzuki et al., 2007) but remains as an elliptical spot
(Fig. 2A). This result indicates that both Atg1 and the Atg2–
Atg18 complex are required for expansion of the IM. It has been
reported that the Atg1 kinase activity is not necessary for PAS
scaffold complex organization (Kabeya et al., 2005; Kamada
et al., 2000). In this study, we dissected the contribution of Atg1
kinase activity to autophagosome formation, and found that IM
length correlates with Atg1 kinase activity (Fig. 2). One
explanation for these observations might be that the IM length
is determined by a dynamic equilibrium. It is possible that a
decrease in Atg1 kinase activity would shift this equilibrium
towards a decrease in IM length. Identification of the substrate(s)
of Atg1 will provide the means to definitively test this
hypothesis.
The Atg2–Atg18 complex is the most downstream element in
the hierarchy of PAS assembly (Suzuki et al., 2007); therefore,
we postulated that this complex is involved in a later step of
autophagosome formation, for example, the sealing of the IM.
However, the data presented here clearly show that the Atg2–
Atg18 complex is primarily required for IM expansion
(Fig. 2A,B). It is still possible that the Atg2–Atg18 complex
also functions at a later step of autophagosome formation.
Dynamics of the IM
Under starvation conditions, the fluorescence intensity of the
GFP–Atg8 dot, which includes the PAS and the IM, next to the
vacuole changes periodically. The period of each cycle is about
7–9 minutes; the intensity reaches a plateau within 4–5 minutes
and then gradually decreases (Geng et al., 2008). This suggests
that the formation of one autophagosome takes ,7–9 minutes in
S. cerevisiae. Time-lapse microscopy of GAC cells revealed that
the IM reaches its maximum length 5–6 minutes after its
emergence (Fig. 1G), suggesting that the rate of IM expansion
in GAC cells is comparable to that in wild-type cells.
Interestingly, paused IMs labeled with GFP–Atg8 disappear
rapidly, within 2 minutes (Fig. 1H). Recently, our group has
reported that Atg4 cleaves Atg8–PE exposed to the cytoplasm,
and serves to provide a reservoir of free Atg8 (Nakatogawa et al.,
2012a). Atg4 might be responsible for disintegrating paused IMs
by cleaving Atg8–PE.
Fine mapping of Atg proteins during autophagosomeformation
Based upon the results in this study, we propose a model for the
mechanism of IM expansion (Fig. 7). Upon induction of
autophagy, Atg1 and Atg13 interact with the Atg17–Atg29–
Atg31 complex to form the PAS scaffold complex; this is a
prerequisite step for assembly of downstream Atg proteins at the
PAS (Kabeya et al., 2005; Kamada et al., 2000; Kawamata et al.,
2008). Atg9 is an immediate downstream protein of Atg17 for
PAS assembly (Suzuki et al., 2007). Since Atg9 exists on Atg9
vesicles (Yamamoto et al., 2012), Atg9 might provide lipids
required for assembly of downstream proteins at the PAS.
Subsequently, PtdIns 3-kinase complex I, which produces
PtdIns(3)P at the PAS, is recruited to the PAS (Suzuki et al.,
2007). Presumably, the primary role of PtdIns(3)P produced by
complex I is recruitment of downstream Atg proteins, e.g. the
Atg2–Atg18 complex and the products of two ubiquitin-like
conjugation systems (the Atg16–Atg5–Atg12 complex and Atg8–
PE) to the PAS.
During IM expansion, Atg proteins recruited to the PAS are
distributed to distinct sites (Fig. 7). We showed that the PAS
scaffold complex and the PtdIns 3-kinase complex I stay at the
VICS (Fig. 3), supporting the notion that these proteins provide a
platform for autophagosome formation. Please note that the
Atg2–Atg18 complex and Atg9 are not localized to the VICS
during IM expansion. Among the proteins in the PAS scaffold
complex, only Atg1 is localized to the IM as well as the VICS.
Atg1 kinase activity is essential for IM expansion (Fig. 2),
suggesting that Atg1 phosphorylates target protein(s) at the VICS
and the IM during IM expansion.
The activity of PtdIns 3-kinase complex I is necessary for
autophagic pathways, possibly due to its role in recruitment of
the Atg16–Atg5–Atg12 and Atg2–Atg18 complexes to the
PAS (Suzuki et al., 2007). During autophagosome formation,
Fig. 7. Model for the mechanism of IM expansion. (1) Upon induction of autophagy, the PAS scaffold complex is assembled in an Atg1-kinase-activity-
independent manner. (2) Subsequently, Atg proteins are assembled at the PAS; Atg9 might recruit lipids to the PAS. (3) IM formation is initiated; association of
the PAS with ERES might trigger IM expansion. (4) The IM expands in an Atg1-kinase-activity-dependent manner. Atg proteins that exhibit the IM pattern transit
to the IM. The Atg2–Atg18 complex and Atg9 might be involved in the association of the IM with ERES at the IM edge.
Fine mapping of Atg proteins during autophagosome formation 2541
Journ
alof
Cell
Scie
nce
PtdIns(3)P is localized preferentially to the inner concave surfaceof the IMs, and it is subsequently enclosed in autophagosomes asa component of their inner membranes (Obara et al., 2008a). We
show here that the PtdIns 3-kinase complex I is not localized tothe IM (Fig. 3), suggesting that PtdIns(3)P is produced mainly atthe VICS. PtdIns(3)P may play an important role by binding to an
effector protein(s) at the inner surface of the IM, or it may benecessary to generate a negative membrane curvature at the innersurface of the IM.
The Atg16–Atg5–Atg12 complex, Atg8–PE and the Atg2–Atg18complex act downstream in the PAS assembly pathway (Kawamata
et al., 2008; Suzuki et al., 2007). All of these proteins are localized tothe IM or the IM edge during autophagosome formation (Fig. 3).Because the Atg16–Atg5–Atg12 complex acts as an E3 enzyme in
the generation of Atg8–PE (Hanada et al., 2007), its IM localizationsuggests that it catalyzes Atg8 lipidation on the IM.
Relationship between the Atg2–Atg18 complex and ERES
The Atg2–Atg18 complex is localized to the IM edge as multiple
dots (Fig. 3; supplementary material Fig. S2). These dots areadjacent to ERES, which are subdomains specifically involved inCOPII vesicle formation in the ER (Fig. 6B). These results
suggest a tight relationship between the Atg2–Atg18 complexand ERES. Moreover, Atg9 is colocalized with the Atg2–Atg18complex at the IM edge (Fig. 4B). Because ERES are involved inexit from the ER, the Atg2–Atg18 complex and Atg9 might play
roles in entrance to the IM. Further functional analysis of theAtg2–Atg18 complex and Atg9 will improve our understandingof the mechanisms underlying IM expansion.
To date, the IM has been considered to be distinct from
the endomembrane systems. In mammalian cells, physicalconnections of the IM with the ER have been reported(Hayashi-Nishino et al., 2009; Yla-Anttila et al., 2009). Here,
we show that the IM is associated with the ER at ERES. Ourgroup has shown that the function of Sec16, which acts as ascaffold for ERES (Connerly et al., 2005; Yorimitsu and Sato,2012), is important for autophagy (Ishihara et al., 2001). Sec13 is
a coatomer of COPII vesicles, and is also used as a marker forERES (Connerly et al., 2005). Recently, we have observed thatknockdown of Sec13 results in a severe defect in autophagy
(unpublished data). These results indicate that ERES play animportant role in IM expansion.
Recently, a novel compartment for unconventional proteinsecretion of Acb1 (CUPS) has been reported (Bruns et al., 2011).
Upon starvation, PtdIns(3)P, Grh1, Vps23, Atg8 and Atg9 arerecruited to the one to three CUPS per cell. CUPS is localized nearERES labeled with Sec13 but separated from the ER. Althoughboth CUPS and the IM are induced upon starvation, treatment with
rapamycin alone is insufficient to form CUPS (Bruns et al., 2011).Moreover, Grh1–GFP, a CUPS marker, and Ape1–mCherry do notcolocalize (Bruns et al., 2011). Autophagosome formation is
completely inhibited in atg11Datg17D cells because of a defect inPAS assembly (Suzuki et al., 2007). In contrast, the relocalizationof Grh1–GFP to CUPS is not impaired in atg11Datg17D cells
(Bruns et al., 2011). These facts suggest that CUPS and thePAS/IM are distinct structures. Further morphological analysisby electron microscopy will provide new insights into these
structures.
The absence of ER marker proteins from the IM indicates thatthese proteins do not transit to the IM from the ER (Fig. 5). Thereare two interpretations of this result. It may be that in yeast, the
ER is associated with the IM in an indirect manner, possibly
mediated by COPII vesicles. Alternatively, the ER and the IM of
yeast might be directly connected, as has been demonstrated in
mammalian cells (Hayashi-Nishino et al., 2009; Yla-Anttila et al.,
2009), but there are mechanisms that exclude ER proteins from
the IM. Further studies will be required to clarify the role of the
ER in IM expansion.
Materials and MethodsYeast strains and growth conditions
The yeast strains used in this study are listed in supplementary material Table S1.Standard protocols were used for yeast manipulation (Adams et al., 1998). ThemRFP–prApe1 strains were constructed as previously described (Strømhaug et al.,2004). Cells expressing C-terminally (1–26)GFP- or (2–36)mCherry-fused Atg/Vpsproteins were generated using a PCR-based gene-modification method (Longtineet al., 1998). Cells chromosomally expressing Sec71TMD–GFP (YAM306) weregenerated by transforming wild-type cells with AflII-digested fragments of theplasmid pRS305[SEC71TMD-GFP]. Cells were grown in synthetic defined pluscasamino acid medium (SDCA; 0.17% yeast nitrogen base without amino acids andammonium sulfate, 0.5% casamino acid, 0.5% ammonium sulfate and 2% glucose)with appropriate supplements. To drive the Cu2+-inducible CUP1 promoter, cellswere cultured for 1 day in medium containing 250 mM CuSO4 before use.Autophagy was induced by addition of 0.4 mg/ml rapamycin (Sigma) or by shiftingto nitrogen starvation medium [SD(–N); 0.17% yeast nitrogen base without aminoacids and ammonium sulfate and 2% glucose].
Plasmids
The plasmids used in this study are listed in supplementary material Table S2.pYEX-BX[prApe1] was generated by inserting the BglII cassette of APE1 intopYEX-BX (Clontech) after digesting the plasmid with BamHI. pRS424[PCUP1-prApe1] was generated by inserting the blunted HindIII–SalI fragment of APE1 withthe CUP1 promoter excised from pYEX-BX[prApe1] into pRS424, after digestingthe plasmid with PvuII. pRS305[SEC71TMD-GFP] was generated by inserting theBamHI–XhoI fragment of SEC71TMD-GFP from pRS306[SEC71TMD-GFP] (Satoet al., 2003) into pRS305, after digesting the plasmid with BamHI and XhoI.
Fluorescence microscopy
Fluorescence microscopy was performed using an IX81 TIR-FM system(Olympus, Japan) equipped with a UPlanSApo 1006 oil objective (NA: 1.40)and a CoolSNAP HQ CCD camera (Nippon Roper, Japan) as described previously(Suzuki et al., 2010). Blue (Sapphire 488-20, Coherent, USA) and yellow (85-YCA-010, Melles Griot, USA) lasers were used for excitation of GFP and mRFP/mCherry, respectively. Three-dimensional fluorescence images were acquired andprocessed using the MetaMorph software (Molecular Devices, USA).
Electron microscopy
Electron microscopy was performed by Tokai-EMA, Inc. (Nagoya, Japan) asdescribed previously (Suzuki et al., 2011). Briefly, cells were harvested bycentrifugation and media were removed by aspiration. The pellets weresandwiched with copper grids and rapidly frozen in liquid propane using LeicaEM CPC (Leica, Germany). Cells were freeze-substituted in 2% osmium tetroxidedissolved in acetone. Samples were embedded in Quetol 651.
Immunoblot analysis
Cell lysates were prepared by the alkaline lysis method or by glass bead disruption(Horvath and Riezman, 1994; Suzuki et al., 2004). Primary antisera were anti-Atg1(Matsuura et al., 1997) or anti-Ape1 (Suzuki et al., 2002). Horseradish-peroxidase-conjugated antibodies (Jackson ImmunoResearch, USA) were used as secondaryantibodies. Chemiluminescence signals produced by an ECL reagent(PerkinElmer, Western Lightning Plus-ECL, USA; Wako, ImmunoStar LD,Japan) were detected using a CCD camera system (Fujifilm, LAS4000, Japan).
AcknowledgementsWe thank Dr Ken Sato (Gunma University, Japan) and Dr TakehikoYoko-o (National Institute of Advanced Industrial Science andTechnology, Japan) for strains and plasmids, Dr Hitoshi Nakatogawa(Tokyo Institute of Technology, Japan) for comments on themanuscript, and Ms Mayumi Morimoto for technical assistance.
Author contributionsK.S. designed the project, worked on experiments using afluorescence microscope and wrote the paper. M.A., C.K. and H.Y.
Journal of Cell Science 126 (11)2542

Journ
alof
Cell
Scie
nce
constructed plasmids and strains. H.Y. and Y.O. contributed towriting the paper. Y.O. supervised the entire project.
FundingThis work was supported by the Hamaguchi Foundation for theAdvancement of Biochemistry [grant number H23-3 to K.S.]; theNOVARTIS Foundation (Japan) for the Promotion of Science [grantnumber 11-128 to K.S.]; and by Grants-in-Aids for ScientificResearch from the Ministry of Education, Culture, Sports, Scienceand Technology of Japan [grant numbers 24121707, 24657083,25291040 to K.S.; 24770182 to H.Y.; 23000015 to Y.O.]. Depositedin PMC for immediate release.
Supplementary material available online at
http://jcs.biologists.org/lookup/suppl/doi:10.1242/jcs.122960/-/DC1
ReferencesAdams, A., Gottschling, D. E., Kaiser, C. A. and Stearns, T. (1998). Methods in Yeast
Genetics. Cold Spring Harbor, NY: Cold Spring Harbor Laboratory Press.Baba, M., Osumi, M., Scott, S. V., Klionsky, D. J. and Ohsumi, Y. (1997). Two
distinct pathways for targeting proteins from the cytoplasm to the vacuole/lysosome.J. Cell Biol. 139, 1687-1695.
Bruns, C., McCaffery, J. M., Curwin, A. J., Duran, J. M. and Malhotra, V. (2011).Biogenesis of a novel compartment for autophagosome-mediated unconventionalprotein secretion. J. Cell Biol. 195, 979-992.
Connerly, P. L., Esaki, M., Montegna, E. A., Strongin, D. E., Levi, S., Soderholm,
J. and Glick, B. S. (2005). Sec16 is a determinant of transitional ER organization.Curr. Biol. 15, 1439-1447.
Dove, S. K., Piper, R. C., McEwen, R. K., Yu, J. W., King, M. C., Hughes, D. C.,
Thuring, J., Holmes, A. B., Cooke, F. T., Michell, R. H. et al. (2004). Svp1pdefines a family of phosphatidylinositol 3,5-bisphosphate effectors. EMBO J. 23,1922-1933.
Geng, J., Baba, M., Nair, U. and Klionsky, D. J. (2008). Quantitative analysis ofautophagy-related protein stoichiometry by fluorescence microscopy. J. Cell Biol.
182, 129-140.Hanada, T., Noda, N. N., Satomi, Y., Ichimura, Y., Fujioka, Y., Takao, T., Inagaki,
F. and Ohsumi, Y. (2007). The Atg12-Atg5 conjugate has a novel E3-like activity forprotein lipidation in autophagy. J. Biol. Chem. 282, 37298-37302.
Hayashi-Nishino, M., Fujita, N., Noda, T., Yamaguchi, A., Yoshimori, T. and
Yamamoto, A. (2009). A subdomain of the endoplasmic reticulum forms a cradle forautophagosome formation. Nat. Cell Biol. 11, 1433-1437.
Horvath, A. and Riezman, H. (1994). Rapid protein extraction from Saccharomyces
cerevisiae. Yeast 10, 1305-1310.Ishihara, N., Hamasaki, M., Yokota, S., Suzuki, K., Kamada, Y., Kihara, A.,
Yoshimori, T., Noda, T. and Ohsumi, Y. (2001). Autophagosome requires specificearly Sec proteins for its formation and NSF/SNARE for vacuolar fusion. Mol. Biol.
Cell 12, 3690-3702.Kabeya, Y., Kamada, Y., Baba, M., Takikawa, H., Sasaki, M. and Ohsumi,
Y. (2005). Atg17 functions in cooperation with Atg1 and Atg13 in yeast autophagy.Mol. Biol. Cell 16, 2544-2553.
Kabeya, Y., Noda, N. N., Fujioka, Y., Suzuki, K., Inagaki, F. and Ohsumi, Y. (2009).Characterization of the Atg17-Atg29-Atg31 complex specifically required forstarvation-induced autophagy in Saccharomyces cerevisiae. Biochem. Biophys. Res.
Commun. 389, 612-615.Kamada, Y., Funakoshi, T., Shintani, T., Nagano, K., Ohsumi, M. and Ohsumi,
Y. (2000). Tor-mediated induction of autophagy via an Apg1 protein kinase complex.J. Cell Biol. 150, 1507-1513.
Kamada, Y., Yoshino, K., Kondo, C., Kawamata, T., Oshiro, N., Yonezawa, K. andOhsumi, Y. (2010). Tor directly controls the Atg1 kinase complex to regulateautophagy. Mol. Cell. Biol. 30, 1049-1058.
Kametaka, S., Okano, T., Ohsumi, M. and Ohsumi, Y. (1998). Apg14p and Apg6/Vps30p form a protein complex essential for autophagy in the yeast, Saccharomyces
cerevisiae. J. Biol. Chem. 273, 22284-22291.Kawamata, T., Kamada, Y., Kabeya, Y., Sekito, T. and Ohsumi, Y. (2008).
Organization of the pre-autophagosomal structure responsible for autophagosomeformation. Mol. Biol. Cell 19, 2039-2050.
Kihara, A., Noda, T., Ishihara, N. and Ohsumi, Y. (2001). Two distinct Vps34phosphatidylinositol 3-kinase complexes function in autophagy and carboxypeptidaseY sorting in Saccharomyces cerevisiae. J. Cell Biol. 152, 519-530.
Kirisako, T., Baba, M., Ishihara, N., Miyazawa, K., Ohsumi, M., Yoshimori, T.,
Noda, T. and Ohsumi, Y. (1999). Formation process of autophagosome is tracedwith Apg8/Aut7p in yeast. J. Cell Biol. 147, 435-446.
Klionsky, D. J., Cueva, R. and Yaver, D. S. (1992). Aminopeptidase I ofSaccharomyces cerevisiae is localized to the vacuole independent of the secretorypathway. J. Cell Biol. 119, 287-299.
Longtine, M. S., McKenzie, A., 3rd, Demarini, D. J., Shah, N. G., Wach, A.,
Brachat, A., Philippsen, P. and Pringle, J. R. (1998). Additional modules forversatile and economical PCR-based gene deletion and modification inSaccharomyces cerevisiae. Yeast 14, 953-961.
Lynch-Day, M. A. and Klionsky, D. J. (2010). The Cvt pathway as a model forselective autophagy. FEBS Lett. 584, 1359-1366.
Matsushita, M., Suzuki, N. N., Obara, K., Fujioka, Y., Ohsumi, Y. and Inagaki,
F. (2007). Structure of Atg5?Atg16, a complex essential for autophagy. J. Biol. Chem.
282, 6763-6772.
Matsuura, A., Tsukada, M., Wada, Y. and Ohsumi, Y. (1997). Apg1p, a novel proteinkinase required for the autophagic process in Saccharomyces cerevisiae. Gene 192,245-250.
Mizushima, N., Yamamoto, A., Hatano, M., Kobayashi, Y., Kabeya, Y., Suzuki, K.,Tokuhisa, T., Ohsumi, Y. and Yoshimori, T. (2001). Dissection of autophagosomeformation using Apg5-deficient mouse embryonic stem cells. J. Cell Biol. 152, 657-668.
Mizushima, N., Kuma, A., Kobayashi, Y., Yamamoto, A., Matsubae, M., Takao, T.,
Natsume, T., Ohsumi, Y. and Yoshimori, T. (2003). Mouse Apg16L, a novel WD-repeat protein, targets to the autophagic isolation membrane with the Apg12-Apg5conjugate. J. Cell Sci. 116, 1679-1688.
Mizushima, N., Yoshimori, T. and Ohsumi, Y. (2011). The role of Atg proteins inautophagosome formation. Annu. Rev. Cell Dev. Biol. 27, 107-132.
Nakatogawa, H., Suzuki, K., Kamada, Y. and Ohsumi, Y. (2009). Dynamics anddiversity in autophagy mechanisms: lessons from yeast. Nat. Rev. Mol. Cell Biol. 10,458-467.
Nakatogawa, H., Ishii, J., Asai, E. and Ohsumi, Y. (2012a). Atg4 recyclesinappropriately lipidated Atg8 to promote autophagosome biogenesis. Autophagy 8,177-186.
Nakatogawa, H., Ohbayashi, S., Sakoh-Nakatogawa, M., Kakuta, S., Suzuki, S. W.,
Kirisako, H., Kondo-Kakuta, C., Noda, N. N., Yamamoto, H. and Ohsumi,
Y. (2012b). The autophagy-related protein kinase Atg1 interacts with the ubiquitin-like protein Atg8 via the Atg8 family interacting motif to facilitate autophagosomeformation. J. Biol. Chem. 287, 28503-28507.
Noda, T., Matsuura, A., Wada, Y. and Ohsumi, Y. (1995). Novel system formonitoring autophagy in the yeast Saccharomyces cerevisiae. Biochem. Biophys. Res.
Commun. 210, 126-132.
Noda, T., Kim, J., Huang, W. P., Baba, M., Tokunaga, C., Ohsumi, Y. and Klionsky,
D. J. (2000). Apg9p/Cvt7p is an integral membrane protein required for transportvesicle formation in the Cvt and autophagy pathways. J. Cell Biol. 148, 465-480.
Obara, K., Noda, T., Niimi, K. and Ohsumi, Y. (2008a). Transport of phosphatidylinositol3-phosphate into the vacuole via autophagic membranes in Saccharomyces cerevisiae.Genes Cells 13, 537-547.
Obara, K., Sekito, T., Niimi, K. and Ohsumi, Y. (2008b). The Atg18-Atg2 complex isrecruited to autophagic membranes via phosphatidylinositol 3-phosphate and exertsan essential function. J. Biol. Chem. 283, 23972-23980.
Okamoto, M., Yoko-o, T., Umemura, M., Nakayama, K. and Jigami, Y. (2006).Glycosylphosphatidylinositol-anchored proteins are required for the transport ofdetergent-resistant microdomain-associated membrane proteins Tat2p and Fur4p.J. Biol. Chem. 281, 4013-4023.
Raymond, C. K., Howald-Stevenson, I., Vater, C. A. and Stevens, T. H. (1992).Morphological classification of the yeast vacuolar protein sorting mutants: evidencefor a prevacuolar compartment in class E vps mutants. Mol. Biol. Cell 3, 1389-1402.
Reggiori, F., Shintani, T., Nair, U. and Klionsky, D. J. (2005). Atg9 cycles betweenmitochondria and the pre-autophagosomal structure in yeasts. Autophagy 1, 101-109.
Robinson, J. S., Klionsky, D. J., Banta, L. M. and Emr, S. D. (1988). Protein sortingin Saccharomyces cerevisiae: isolation of mutants defective in the delivery andprocessing of multiple vacuolar hydrolases. Mol. Cell. Biol. 8, 4936-4948.
Rossanese, O. W., Reinke, C. A., Bevis, B. J., Hammond, A. T., Sears, I. B.,
O’Connor, J. and Glick, B. S. (2001). A role for actin, Cdc1p, and Myo2p in theinheritance of late Golgi elements in Saccharomyces cerevisiae. J. Cell Biol. 153, 47-62.
Sato, K., Sato, M. and Nakano, A. (2003). Rer1p, a retrieval receptor for ER membraneproteins, recognizes transmembrane domains in multiple modes. Mol. Biol. Cell 14,3605-3616.
Shintani, T. and Klionsky, D. J. (2004). Cargo proteins facilitate the formation oftransport vesicles in the cytoplasm to vacuole targeting pathway. J. Biol. Chem. 279,29889-29894.
Shintani, T., Huang, W. P., Stromhaug, P. E. and Klionsky, D. J. (2002). Mechanismof cargo selection in the cytoplasm to vacuole targeting pathway. Dev. Cell 3, 825-837.
Sikorski, R. S. and Hieter, P. (1989). A system of shuttle vectors and yeast host strainsdesigned for efficient manipulation of DNA in Saccharomyces cerevisiae. Genetics
122, 19-27.
Stephan, J. S., Yeh, Y. Y., Ramachandran, V., Deminoff, S. J. and Herman, P. K.(2009). The Tor and PKA signaling pathways independently target the Atg1/Atg13protein kinase complex to control autophagy. Proc. Natl. Acad. Sci. USA 106, 17049-17054.
Strømhaug, P. E., Reggiori, F., Guan, J., Wang, C. W. and Klionsky, D. J. (2004).Atg21 is a phosphoinositide binding protein required for efficient lipidation andlocalization of Atg8 during uptake of aminopeptidase I by selective autophagy. Mol.
Biol. Cell 15, 3553-3566.
Suzuki, K., Kirisako, T., Kamada, Y., Mizushima, N., Noda, T. and Ohsumi,
Y. (2001). The pre-autophagosomal structure organized by concerted functions ofAPG genes is essential for autophagosome formation. EMBO J. 20, 5971-5981.
Suzuki, K., Kamada, Y. and Ohsumi, Y. (2002). Studies of cargo delivery to thevacuole mediated by autophagosomes in Saccharomyces cerevisiae. Dev. Cell 3, 815-824.
Fine mapping of Atg proteins during autophagosome formation 2543
Journ
alof
Cell
Scie
nce
Suzuki, K., Noda, T. and Ohsumi, Y. (2004). Interrelationships among Atg proteinsduring autophagy in Saccharomyces cerevisiae. Yeast 21, 1057-1065.
Suzuki, K., Kubota, Y., Sekito, T. and Ohsumi, Y. (2007). Hierarchy of Atg proteinsin pre-autophagosomal structure organization. Genes Cells 12, 209-218.
Suzuki, K., Kondo, C., Morimoto, M. and Ohsumi, Y. (2010). Selective transport ofa-mannosidase by autophagic pathways: identification of a novel receptor, Atg34p.J. Biol. Chem. 285, 30019-30025.
Suzuki, K., Morimoto, M., Kondo, C. and Ohsumi, Y. (2011). Selective autophagyregulates insertional mutagenesis by the Ty1 retrotransposon in Saccharomyces
cerevisiae. Dev. Cell 21, 358-365.Takeshige, K., Baba, M., Tsuboi, S., Noda, T. and Ohsumi, Y. (1992). Autophagy in
yeast demonstrated with proteinase-deficient mutants and conditions for its induction.J. Cell Biol. 119, 301-311.
Wang, C. W., Kim, J., Huang, W. P., Abeliovich, H., Stromhaug, P. E., Dunn, W. A., Jrand Klionsky, D. J. (2001). Apg2 is a novel protein required for the cytoplasm to vacuoletargeting, autophagy, and pexophagy pathways. J. Biol. Chem. 276, 30442-30451.
Xie, Z. and Klionsky, D. J. (2007). Autophagosome formation: core machinery andadaptations. Nat. Cell Biol. 9, 1102-1109.
Yamamoto, H., Kakuta, S., Watanabe, T. M., Kitamura, A., Sekito, T., Kondo-Kakuta, C., Ichikawa, R., Kinjo, M. and Ohsumi, Y. (2012). Atg9 vesicles are animportant membrane source during early steps of autophagosome formation. J. Cell
Biol. 198, 219-233.Yla-Anttila, P., Vihinen, H., Jokitalo, E. and Eskelinen, E. L. (2009). 3D tomography reveals
connections between the phagophore and endoplasmic reticulum. Autophagy 5, 1180-1185.Yorimitsu, T. and Sato, K. (2012). Insights into structural and regulatory roles of Sec16 in
COPII vesicle formation at ER exit sites. Mol. Biol. Cell 23, 2930-2942.
Journal of Cell Science 126 (11)2544