Financial Stability Report for 2006 - Почетна · Financial Stability Report for 2006 July,...
95
NATIONAL BANK OF THE REPUBLIC OF MACEDONIA Banking Regulations Department Financial Stability Report for 2006 July, 2007
Transcript of Financial Stability Report for 2006 - Почетна · Financial Stability Report for 2006 July,...
NATIONAL BANK OF THE REPUBLIC OF MACEDONIA Banking Regulations Department
Financial Stability Report for 2006
July, 2007

1
Contents
Governor's foreword ................................................................................................................. 3
Summary ................................................................................................................................... 5
I. Macroeconomic environment ............................................................................................. 8
1. International conditions ..................................................................................................... 8
1.1. Risks of the global conditions .................................................................................... 8
1.2. Risks typical for the Euro-zone ................................................................................ 10
1.3. International financial markets ................................................................................. 12
2. Macroeconomic environment in the country ................................................................... 14
2.1. Country risk .............................................................................................................. 18
II. Non-financial institutions................................................................................................. 20
1. Household sector ............................................................................................................. 20
1.1. Financial assets and disposable income of households ............................................ 20
1.2. Households' debt....................................................................................................... 22
1.2.1. Debt to the banking sector .................................................................................. 24 2. Corporate sector .............................................................................................................. 27
2.1. Analysis of the developments in the corporate sector .............................................. 27
2.2. Debt of the corporate sector ..................................................................................... 31
2.2.1. Debt to the banking sector .................................................................................. 32 III. Financial institutions ...................................................................................................... 36
1. Structure of the financial system of the Republic of Macedonia..................................... 36
1.2. Ownership structure of the financial system ............................................................ 37
1.3. Connection of the banks with non-deposit financial institutions .............................. 39
2. Domestic financial markets ............................................................................................. 41
2.1. Money and short-term securities market .................................................................. 41
2.2. Capital market .......................................................................................................... 44
2.2.1. Primary capital market ........................................................................................ 44 2.2.2. Secondary capital market .................................................................................... 45
3. Banking system of the Republic of Macedonia ............................................................... 52
3.1. Structure and activities of the banking system ......................................................... 53
3.2. Profitability of banking system ................................................................................ 57
3.3. Credit risk ................................................................................................................. 59
3.3.1. Credit exposure - development and structure ..................................................... 59 3.3.2. Credit exposure quality ....................................................................................... 60
3.3.2.1. Credit exposure quality to households ......................................................... 62 3.3.2.2. Quality of credit exposure to legal entities .................................................. 63
3.4. Exchange rate risk .................................................................................................... 64
3.5. Liquidity risk ............................................................................................................ 65
3.6. Banks' solvency ........................................................................................................ 66
2
3.7. Stress-test analysis for assessment of the banking system resilience to various
shocks .............................................................................................................................. 67
4. Non-deposit financial institutions .................................................................................... 69
4.1. Insurance sector ........................................................................................................ 69
4.1.1. Features and importance of insurance sector in the Republic of Macedonia ..... 70 4.1.2. Insurance sector performances ........................................................................... 72 4.1.3. Primary features, size and development of each type of insurance .................... 76 4.1.4. Connection between the insurance and the banking sector ................................ 77
4.2. Compulsory fully funded pension insurance ............................................................ 78
4.2.1. Investment structure and yield for the pension funds ......................................... 80 4.2.2. Influence of the pension funds on the financial system stability ........................ 81
4.3. Leasing sector ........................................................................................................... 84
4.3.1. Depth and activity on the lease market in the Republic of Macedonia .............. 84 4.3.2. Financial potential and basic indicators for the performances of the lease
companies ..................................................................................................................... 86 IV. Financial infrastructure ................................................................................................. 88
1. Payment systems ............................................................................................................. 88
1.1. Reform of the payment system in the Republic of Macedonia ................................ 88
1.2. Payment infrastructure.............................................................................................. 88
1.3. Volume and structure of the payment operations in the Republic of Macedonia
in 2006 ............................................................................................................................. 89
1.4. Risks in the operations of the payment system of the Republic of Macedonia ........ 90
2. Deposit insurance system ................................................................................................ 91
2.1. Legal framework and functioning of the Deposit Insurance Fund in the Republic
of Macedonia ................................................................................................................... 91
3. Liquidity facilities of last resort ...................................................................................... 93

3
Governor's foreword
Stable financial system is an important prerequisite for the economic wellbeing of all
the citizens in the Republic of Macedonia. The possibility for the citizens and companies to
have their own and dispose of financial products is one of the foundations of market
economy. Encouraging the development of a safe and efficient financial system is part of the
main tasks of the National Bank of the Republic of Macedonia. Despite the dominance of the
banking sector in the total financial sector of the Republic of Macedonia, that responsibility
for the implementation of those tasks is shared with other government institutions.
The Financial Stability Report, which we define as a state of smooth functioning of
all financial system segments, with each of them providing the highest possible level of
flexibility for absorption of possible shocks, is primarily a result of the efforts to identify the
potential risks in the individual segments of the financial system which encompasses a
growing part of the national economy. The covered matter is very subtle and requires
competent staff and hard work. We have decided to face with this challenge and in this
context we intend to increase our capacity for making better analyses and better assessments
of the financial stability. As a result of that, the National Bank of the Republic of Macedonia
joins the club of only around fifty central banks which through this type of reports enable the
market participants to have an overview of the risk management, as a significant part of every
contemporary economy. Here, one of the main preconditions for quality analysis of the
financial system and its stability are the quantitative data. The weaknesses of the Macedonian
data bases inevitably indicate the need of improvement in that area.
Non-financial institutions, financial institutions and financial infrastructure are the
three segments of the financial system covered by this Report. Experiences show that the
mutual interconnection of the influences of each segment on the other and on the entire
system, as well as the influences of the international economy may cause larger problems in
financial intermediation which could later on spill over into the other segments of the
domestic economy. At the same time, the inefficiency in the financial system may lead to
significant costs in a longer run, both for the citizens and for the companies. Therefore, it is
necessary to develop and encourage sound functioning of the institutions, which will enable
the maintaining of financial stability.
To that end, in the preparation of this Report, the National Bank of the Republic of
Macedonia was motivated by the contribution it may give to the robustness of the financial
and especially to the banking sector in the Republic of Macedonia. The Report contains data
related to the monitoring of the system, individual important events, as well as part of the
analyses and the research intended for better informing of the market participants. The
comprehensive approach in this Report emphasizes the strong links among the three segments
of the system.
In this context, the main objective of the Financial Stability Report is to assess the
level of resilience of the financial system, with an accent on the banking system, identifying
the main systemic risks, whose materialization could cause serious disturbances in the
functioning of the financial system. At the same time, the Report summarizes part of the
research work of the National Bank of the Republic of Macedonia employees, pertaining to
the policies and the aspects of the research and the functioning of the financial system and it
encourages public discussions on expert level regarding all the aspects of the financial system
and its interconnection with the other segments of the economy.

4
I am convinced that the regular drawing up of the Financial Stability Report will
contribute to the efforts for a more efficient and more stable financial system, by emphasizing
the important information that broaden the knowledge and the discussion on that topic. Thus,
the National Bank of the Republic of Macedonia will give another impetus for a successful
completion of the economic reforms which are the path that the Republic of Macedonia treads
in order to become a member of the family of developed countries.
Petar Goshev, MSc.
Governor

5
Summary
The resilience of the financial system of the Republic of Macedonia to external shocks and its
ability to manage the potential risks in 2006, could be evaluated as satisfactory. Most of the
risks identified in the Report are within controlled frames and they are not expected to disturb
the financial system stability.
The global financial imbalances, higher oil price, inflation expectations and the restrictive
monetary policy in the USA and in the Euro zone, as well as the continuous increase in the
debt of the household and the corporate sectors primarily in the EU, were the main potential
factors which influenced the stability of the global financial system in 2006.
These potential factors did not influence significantly the stability of the financial system of
the Republic of Macedonia. Despite the significant openness of the Macedonian economy,
only part of these factors had a more significant influence on its developments. Thus, the
increase in the price of oil on the world markets created negative impetus on the Macedonian
economy, whereas the favorable conditions on the metal market had a positive influence
primarily on the domestic exporters, which contributed significantly to the creation of the
value added in the Macedonian economy. The inflationary pressures, i.e. the increase in the
reference interest rates of the central banks in the developed countries during 2006, was a
potential factor of increasing the costs for repayment of the credits to non-residents, having in
mind that a significant portion of the external private and public debt is with variable interest
rate. The problem of the low level of geographic and production diversification of the
country's foreign trade and the potential negative consequences for the Macedonian
economy, in case of possible unfavorable developments in the economies that the main
trading partners of the Republic of Macedonia is contained by the favorable credit rating and
the stable, i.e. positive prospects of these countries.
The favorable macroeconomic environment also contributed to the relatively high level of
stability of the financial system in the Republic of Macedonia during 2006. The
macroeconomic stability, supported by the prudential monetary and fiscal policies were the
main features of 2006. Increased external liquidity position of the country, obtained from the
growth of the gross foreign reserves, low and stable inflation and reduced interest rates were
additional factors that contributed to the increased confidence in the business environment.
However, the relatively lower rate of economic growth, compared with the other countries in
the region, the high unemployment rate, the insufficient foreign and domestic investments, as
well as the high trade deficit, are the main challenges for the macroeconomic policy - makers,
which directly or indirectly reflect on the financial stability of the country.
The risks for the financial stability created by the households have increased in recent years.
However, these risks are within controlled limits and do not have a significant systemic
influence. The most important potential risk for the financial stability is the continuous
upward trend in the household debt. Possible negative shocks, related to the movement of the
interest rates, exchange rate and movement of their disposable income are the most
significant factors which could have an adverse influence on the ability to service their
liabilities to financial institutions. The increased interest of the natural persons in investing in
shares contributes toward increase in the average yield on their financial assets, but at the
same time it acts towards an increase in their exposure to market risks, and towards a
reduction of the average level of liquidity of their financial assets.
The favorable macroeconomic environment and further restructuring and consolidation of the
corporate sector in the recent years had a positive influence on the financial condition of this
sector. Throughout the past years the corporate sector has continuously increased. The
indicators for measuring liquidity and profitability of enterprises registered improvement in
the past years, despite the fact that they are still on a low level.
6
Corporate sector has not caused serious negative consequences for the financial stability. Its
debt to the financial system is on a relatively lower level, compared with the other countries.
Still, one must not overlook the upward trend in the corporate debt, and especially the
currency structure of the debt. The dominance of the debt with currency component increases
the exposure of the corporate sector to a foreign exchange risk, which indirectly influences
the stability of the banking system and the financial system as a whole, by the increase in the
share of the so-called "indirect credit risk" in the risk profile of the financial institutions.
Also, greater attention should be paid to the improvement of the financial discipline among
enterprises and other institutions, which is confirmed by the large share of uncollected
liabilities of the corporate sector, especially to other non-financial entities.
The financial system of the Republic of Macedonia is characterized with a relatively simple
structure from a viewpoint of the types of financial institutions and the variety of products and
services they offer. The reforms in the pension system, the development of the capital market,
as well as the entrance of foreign strategic investors in individual segments of the financial
system, contribute to the increased diversification of the financial system and represent an
incurring factor for stronger competition both among the institutions of the same kind and
among the various financial institutions. However, being dominant among the financial
institutions, banks have a crucial influence on the movements and developments in this sector.
In recent years, and especially in during 2006, the banking sector has significantly increased
in its size, its operational efficiency and profitability. Together with the increased volume of
activities, banks' solvent position remained on a relatively high level. The capital adequacy
ratio remained higher than the prescribed minimum, registering further downward trend, as a
result of the accelerated credit activity.
Banks' risk profile registers continuous improvement. Credit risk plays the dominant role in
the spectrum of risks the banks face with throughout their operations. Increased volume of
lending in foreign currency and in Denars with foreign exchange clause increases the
importance of the indirect credit risk, which arises from the exposure of the borrowers to an
foreign exchange risk. The credit portfolio quality does not show any signs of deterioration.
However, the credit growth in the past few years and the expected increase of the competition
in the banking sector impose an environment for increasing the banks' risk management
capacity, which would ultimately lead towards an improvement of their overall performances.
With the expected deepening of the role and the activities of the other financial institutions,
the increased importance of the financial markets and the launching of new financial
products in a medium and/or long run, the banks should anticipate the risk of possible
shifting of the investors and depositors to other financial institutions and to alternative
investment possibilities. In such an environment the banks will face with the need to develop
into "more inventive" financial institutions and to offer to the investors and depositors
products which will be competitive compared with the alternative investment possibilities.
So far, however, the non-banking financial institutions have a relatively small role in the
financial intermediation and their potential influence on the financial stability is not high.
The insurance sector, as the second largest in the overall financial system still has a small
share in the overall financial system, but according to the nature of the insurance activities, it
is of special importance for the financial stability of the country. In the forthcoming period
further development and increased security of the insurance sector is expected by
improvement of the risk management process by the insurance companies, as well as
strengthening of the supervisory function by establishing an independent Supervision Agency.
Also, in the forthcoming years it is possible to expect increased presence of the non-banking
financial institutions, especially after the completion of the reforms in the pension system and
the emergence of domestic institutional investors, for which the institutional and the
regulatory frameworks are being established.
7
Last year was specific for the significant increase in the turnover, and hence the importance
of the capital market in the framework of the financial system of the Republic of Macedonia.
The increased intensity of trade in shares and bonds on the Macedonian Stock Exchange,
accompanied by an inflow of foreign portfolio investments, caused an increase in the market
capitalization and improvement of the market liquidity. On the other hand, however, the
increased trade in shares and the increase in their prices is simultaneously a new source of
risk for the Macedonian economy. Such market risks would be most evident in case of
creating too high expectations for the future performances of the issuing companies and the
prices of their shares.
Precondition for a stable and efficient banking system is the existence of a safe and efficient
payment and settlement system. The reform of the payment system of the Republic of
Macedonia was one of the more complex reforms in the country. The new payment system
which has been in place for six years, and which was developed on the example of the
payment systems of the countries with developed market economies, provides strong dynamic
and development component of the financial system of the county, creating preconditions for
new banking products, for increasing banks' efficiency and for encouraging new information
and technological tendencies in the banking operations.

8
I. Macroeconomic environment
1. International environment1
Global economic growth
rates registered in the past four years
indicate such an expansion of the
world economy as it has not been
registered in the period after the early
seventies of the previous century.
During 2006, global economy grew at
a rate of 5.4%2, with the fastest
increase being registered during the
first quarter of the year, followed by
certain slowdown in the following
quarters, as a consequence of the high
rise in the price of oil. The positive
trend in the economic activity was present in most of the world economies, while on a global
level mostly it was supported by the growth of the economies of the USA, China, India and
Russia.
According to the
assessment of the
International Monetary
Fund, the global economic
growth is expected to slow
down and to reduce to
4.9% in 2007. This
adjustment is expected to
take place without
significant disturbances of
the global financial
stability. However, the
possible unexpected
change in the global imbalances, as well as the occurrence of a significant global decline of
the investors' "inclination" to accept risk, could cause faster slowdown of the world economy
than expected. Such a correction could lead to a massive adjustment of the asset prices, which
would lead to a disruption of the global financial markets.
1.1. Risks of the global environment
As it was the case in the past years, also in 2006 one of the key global economic risks
were the global imbalances, i.e. their most pronounced aspect - the deficit in the current
account of the USA on the one hand and the surplus in the current accounts of certain Asian
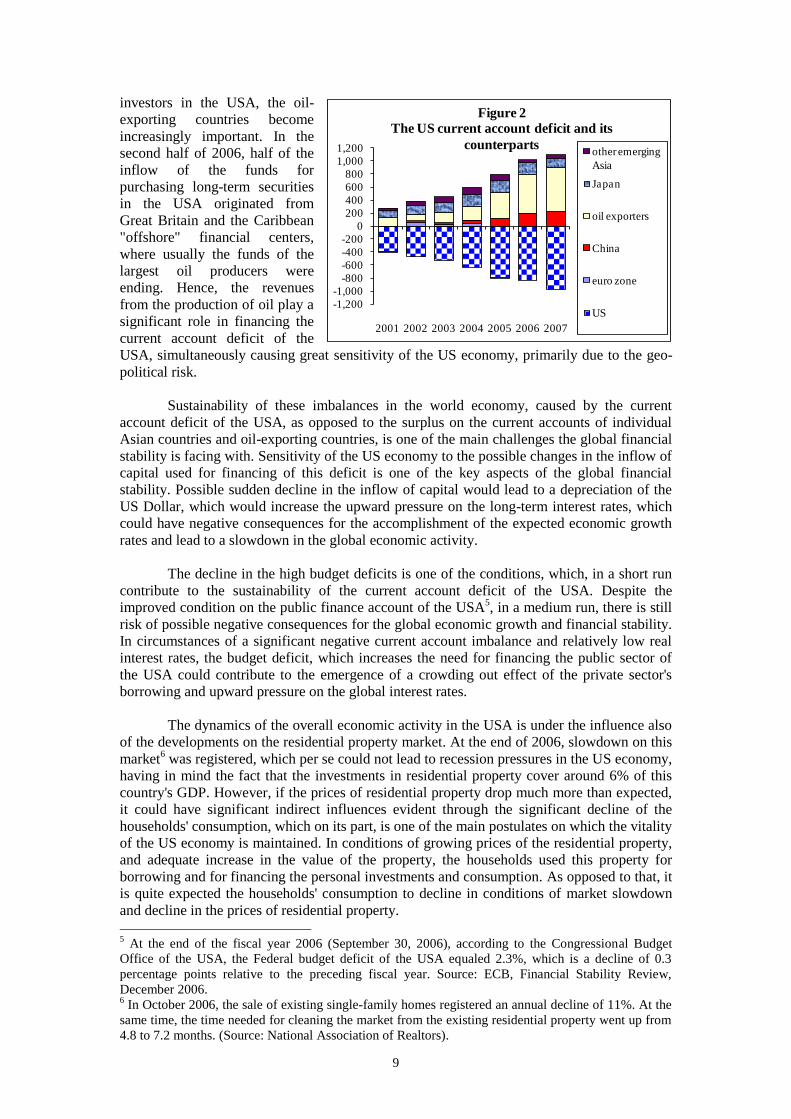
countries and oil-exporting countries on the other. At the end of 2006, the deficit in the
current account of the USA was 6.5% of this country's GDP. Relative to the preceding year,
the deficit went up by 8.2%, i.e. its share in the GDP increased by 0.1 percentage point.3
During 2006, no significant structural changes were registered in the contribution of the
foreign public investors to the financing of the current account deficit of the USA4. However,
despite the fact that China and Japan remain to be the most important individual foreign
1 The analysis is based on data from: IMF World Economic Outlook, April 2007; ECB, Financial
Stability Review, December 2006 and the electronic data service - Bloomberg; 2 Source: IMF World Economic Outlook, April 2007.
3 Source: IMF World Economic Outlook, April 2007.
4 Source: ECB, Financial Stability Review, December 2006.
0.0%
1.0%
2.0%
3.0%
4.0%
5.0%
6.0%
1990 1995 2000 2005
Figure 1
Annual growth rates of the world
GDP
GDP growth average
Table 1
Annual rates of economic growth (in %)
2007 2008
Global 5.3 4.9 5.4 4.9 4.9
euro zone 2.1 1.4 2.6 2.3 2.3
Central and Eastern
Europe6.5 5.5 6 5.5 5.3
US 3.9 3.2 3.3 2.2 2.8
Japan 2.3 1.9 2.2 2.3 1.9
Russia 7.2 6.4 6.7 6.4 5.9
China 10.1 10.4 10.7 10 9.5
India 8 9.2 9.2 8.4 7.8
current projectionsregions and states 2004 2005 2006
9
investors in the USA, the oil-
exporting countries become
increasingly important. In the
second half of 2006, half of the
inflow of the funds for
purchasing long-term securities
in the USA originated from
Great Britain and the Caribbean
"offshore" financial centers,
where usually the funds of the
largest oil producers were
ending. Hence, the revenues
from the production of oil play a
significant role in financing the
current account deficit of the
USA, simultaneously causing great sensitivity of the US economy, primarily due to the geo-
political risk.
Sustainability of these imbalances in the world economy, caused by the current
account deficit of the USA, as opposed to the surplus on the current accounts of individual
Asian countries and oil-exporting countries, is one of the main challenges the global financial
stability is facing with. Sensitivity of the US economy to the possible changes in the inflow of
capital used for financing of this deficit is one of the key aspects of the global financial
stability. Possible sudden decline in the inflow of capital would lead to a depreciation of the
US Dollar, which would increase the upward pressure on the long-term interest rates, which
could have negative consequences for the accomplishment of the expected economic growth
rates and lead to a slowdown in the global economic activity.
The decline in the high budget deficits is one of the conditions, which, in a short run
contribute to the sustainability of the current account deficit of the USA. Despite the
improved condition on the public finance account of the USA5, in a medium run, there is still
risk of possible negative consequences for the global economic growth and financial stability.
In circumstances of a significant negative current account imbalance and relatively low real
interest rates, the budget deficit, which increases the need for financing the public sector of
the USA could contribute to the emergence of a crowding out effect of the private sector's
borrowing and upward pressure on the global interest rates.
The dynamics of the overall economic activity in the USA is under the influence also
of the developments on the residential property market. At the end of 2006, slowdown on this
market6 was registered, which per se could not lead to recession pressures in the US economy,
having in mind the fact that the investments in residential property cover around 6% of this
country's GDP. However, if the prices of residential property drop much more than expected,
it could have significant indirect influences evident through the significant decline of the
households' consumption, which on its part, is one of the main postulates on which the vitality
of the US economy is maintained. In conditions of growing prices of the residential property,
and adequate increase in the value of the property, the households used this property for
borrowing and for financing the personal investments and consumption. As opposed to that, it
is quite expected the households' consumption to decline in conditions of market slowdown
and decline in the prices of residential property.
5 At the end of the fiscal year 2006 (September 30, 2006), according to the Congressional Budget
Office of the USA, the Federal budget deficit of the USA equaled 2.3%, which is a decline of 0.3
percentage points relative to the preceding fiscal year. Source: ECB, Financial Stability Review,
December 2006. 6 In October 2006, the sale of existing single-family homes registered an annual decline of 11%. At the
same time, the time needed for cleaning the market from the existing residential property went up from
4.8 to 7.2 months. (Source: National Association of Realtors).
-1,200
-1,000
-800
-600
-400
-200
0
200
400
600
800
1,000
1,200
2001 2002 2003 2004 2005 2006 2007
Figure 2
The US current account deficit and its
counterpartsother emerging
Asia
Japan
oil exporters
China
euro zone
US
10
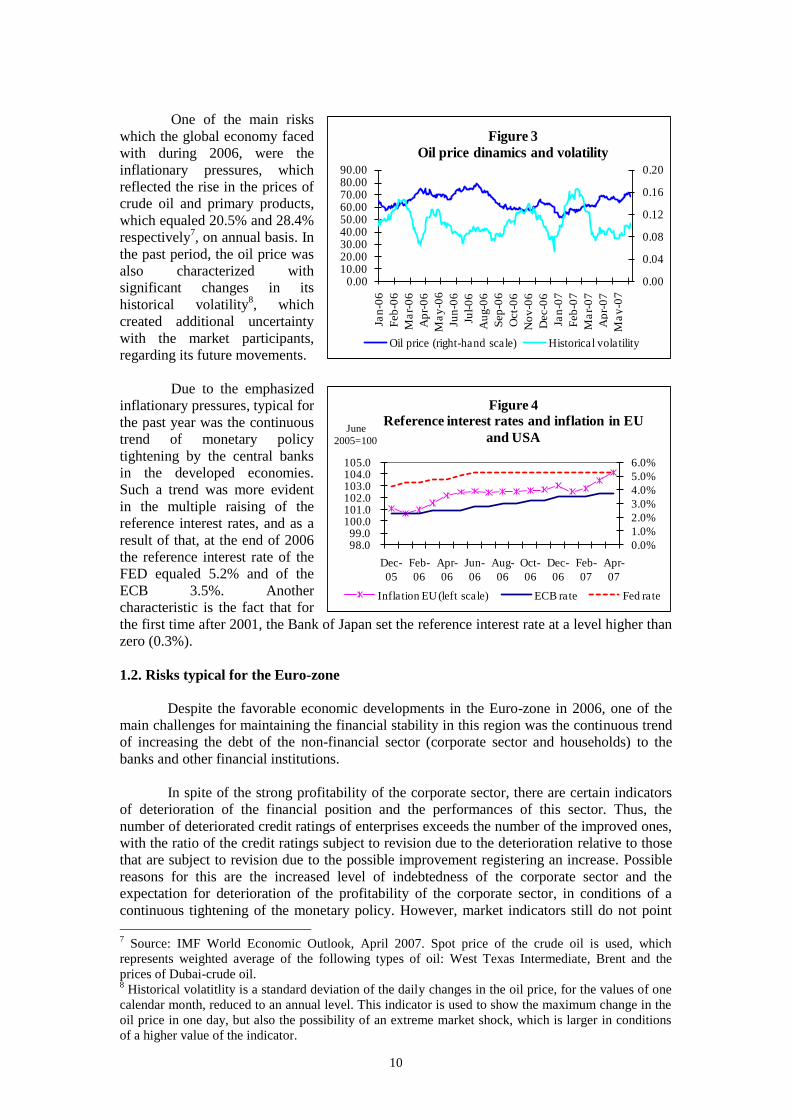
One of the main risks
which the global economy faced
with during 2006, were the
inflationary pressures, which
reflected the rise in the prices of
crude oil and primary products,
which equaled 20.5% and 28.4%
respectively7, on annual basis. In
the past period, the oil price was
also characterized with
significant changes in its
historical volatility8, which
created additional uncertainty
with the market participants,
regarding its future movements.
Due to the emphasized
inflationary pressures, typical for
the past year was the continuous
trend of monetary policy
tightening by the central banks
in the developed economies.
Such a trend was more evident
in the multiple raising of the
reference interest rates, and as a
result of that, at the end of 2006
the reference interest rate of the
FED equaled 5.2% and of the
ECB 3.5%. Another
characteristic is the fact that for
the first time after 2001, the Bank of Japan set the reference interest rate at a level higher than
zero (0.3%).
1.2. Risks typical for the Euro-zone
Despite the favorable economic developments in the Euro-zone in 2006, one of the
main challenges for maintaining the financial stability in this region was the continuous trend
of increasing the debt of the non-financial sector (corporate sector and households) to the
banks and other financial institutions.
In spite of the strong profitability of the corporate sector, there are certain indicators
of deterioration of the financial position and the performances of this sector. Thus, the
number of deteriorated credit ratings of enterprises exceeds the number of the improved ones,
with the ratio of the credit ratings subject to revision due to the deterioration relative to those
that are subject to revision due to the possible improvement registering an increase. Possible
reasons for this are the increased level of indebtedness of the corporate sector and the
expectation for deterioration of the profitability of the corporate sector, in conditions of a
continuous tightening of the monetary policy. However, market indicators still do not point
7 Source: IMF World Economic Outlook, April 2007. Spot price of the crude oil is used, which
represents weighted average of the following types of oil: West Texas Intermediate, Brent and the
prices of Dubai-crude oil. 8 Historical volatitlity is a standard deviation of the daily changes in the oil price, for the values of one
calendar month, reduced to an annual level. This indicator is used to show the maximum change in the
oil price in one day, but also the possibility of an extreme market shock, which is larger in conditions
of a higher value of the indicator.
0.0%
1.0%
2.0%
3.0%
4.0%
5.0%
6.0%
98.0 99.0
100.0 101.0 102.0 103.0 104.0 105.0
Dec-
05
Feb-
06
Apr-
06
Jun-
06
Aug-
06
Oct-
06
Dec-
06
Feb-
07
Apr-
07
June
2005=100
Figure 4
Reference interest rates and inflation in EU
and USA
Inflation EU (left scale) ECB rate Fed rate
0.00
0.04
0.08
0.12
0.16
0.20
0.0010.0020.0030.0040.0050.0060.0070.0080.0090.00
Jan
-06
Feb
-06
Ma
r-0
6
Ap
r-0
6
Ma
y-0
6
Jun
-06
Jul-
06
Au
g-0
6
Sep
-06
Oct-
06
No
v-0
6
Dec-0
6
Jan
-07
Feb
-07
Ma
r-0
7
Ap
r-0
7
Ma
y-0
7
Figure 3
Oil price dinamics and volatility
Oil price (right-hand scale) Historical volatility
11
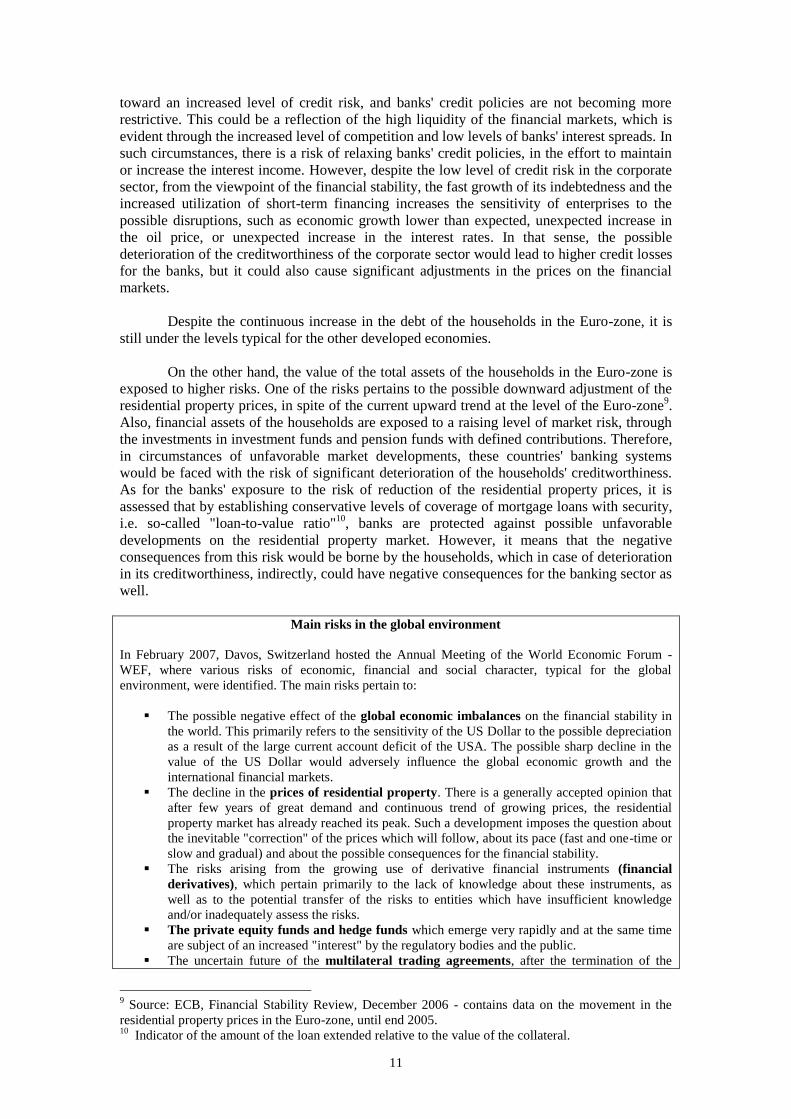
toward an increased level of credit risk, and banks' credit policies are not becoming more
restrictive. This could be a reflection of the high liquidity of the financial markets, which is
evident through the increased level of competition and low levels of banks' interest spreads. In
such circumstances, there is a risk of relaxing banks' credit policies, in the effort to maintain
or increase the interest income. However, despite the low level of credit risk in the corporate
sector, from the viewpoint of the financial stability, the fast growth of its indebtedness and the
increased utilization of short-term financing increases the sensitivity of enterprises to the
possible disruptions, such as economic growth lower than expected, unexpected increase in
the oil price, or unexpected increase in the interest rates. In that sense, the possible
deterioration of the creditworthiness of the corporate sector would lead to higher credit losses
for the banks, but it could also cause significant adjustments in the prices on the financial
markets.
Despite the continuous increase in the debt of the households in the Euro-zone, it is
still under the levels typical for the other developed economies.
On the other hand, the value of the total assets of the households in the Euro-zone is
exposed to higher risks. One of the risks pertains to the possible downward adjustment of the
residential property prices, in spite of the current upward trend at the level of the Euro-zone9.
Also, financial assets of the households are exposed to a raising level of market risk, through
the investments in investment funds and pension funds with defined contributions. Therefore,
in circumstances of unfavorable market developments, these countries' banking systems
would be faced with the risk of significant deterioration of the households' creditworthiness.
As for the banks' exposure to the risk of reduction of the residential property prices, it is
assessed that by establishing conservative levels of coverage of mortgage loans with security,
i.e. so-called "loan-to-value ratio"10
, banks are protected against possible unfavorable
developments on the residential property market. However, it means that the negative
consequences from this risk would be borne by the households, which in case of deterioration
in its creditworthiness, indirectly, could have negative consequences for the banking sector as
well.
Main risks in the global environment
In February 2007, Davos, Switzerland hosted the Annual Meeting of the World Economic Forum -
WEF, where various risks of economic, financial and social character, typical for the global
environment, were identified. The main risks pertain to:
The possible negative effect of the global economic imbalances on the financial stability in
the world. This primarily refers to the sensitivity of the US Dollar to the possible depreciation
as a result of the large current account deficit of the USA. The possible sharp decline in the
value of the US Dollar would adversely influence the global economic growth and the
international financial markets.
The decline in the prices of residential property. There is a generally accepted opinion that
after few years of great demand and continuous trend of growing prices, the residential
property market has already reached its peak. Such a development imposes the question about
the inevitable "correction" of the prices which will follow, about its pace (fast and one-time or
slow and gradual) and about the possible consequences for the financial stability.
The risks arising from the growing use of derivative financial instruments (financial
derivatives), which pertain primarily to the lack of knowledge about these instruments, as
well as to the potential transfer of the risks to entities which have insufficient knowledge
and/or inadequately assess the risks.
The private equity funds and hedge funds which emerge very rapidly and at the same time
are subject of an increased "interest" by the regulatory bodies and the public.
The uncertain future of the multilateral trading agreements, after the termination of the
9 Source: ECB, Financial Stability Review, December 2006 - contains data on the movement in the
residential property prices in the Euro-zone, until end 2005. 10
Indicator of the amount of the loan extended relative to the value of the collateral.

12
multilateral negotiations in Doha in July 2006. The negotiations pertained to the presence of
protectionism in the international trading relations.
Access to oil, in the sense of the future of the oil industry, the possibility for new conflicts, the
role of the producers on the one hand, and the role of the oil consumers on the other, and the
potential influence on the environment.
Global demographic trends. Ageing and decline in the number of the population, especially
in the developed countries could have negative consequences on the economic growth, as well
as on the financing of pension funds in theese countries. In contrast, there is a trend of growth
of the population and of the unemployment rates in the undeveloped countries.
The risks of geopolitical nature, primarily the unstable situation in the Middle East, terrorism
and construction of massive destruction missiles.
The changes in the global climate, which could negatively reflect on the economic growth
and financial markets, for example, by increasing the volatility in the product prices.
1.3. International financial markets
One of the more significant events on the global capital markets during 2006, was the
significant drop in the prices of shares in May and June 2006. At the same time, the emerging
markets faced with outflows of funds and their redirection into government bonds of the G7
countries (so-called safe-
heaven buying). Such
movements were under the
influence of the increase in the
reference interest rates in the
developed economies and of
the re-assessment of the
investors' positions,
supplemented by the expected
slowdown of the economic
growth in the USA, as well as
by the possibility FED to
increase the reference interest
rate more than expected, due
to the inflationary pressures.
Since end-June prices of shares increased again11
, primarily as a result of the reduced
inflationary pressure, after the slowdown in the oil price, of the improved profitability
position of the corporate sector and of the changed perception about the growth of the US
economy. Such movements resulted in positive overall changes in the prices of shares at the
end of 2006. During February 2007, another short-term, increased sale of shares on the global
market occurred, which was triggered by the expected slowdown of the Chinese economy, the
default of part of the claims on the so-called market of sub-prime12
mortgage loans in the
USA, the decreasing interest in conducting the so-called carry-trade13
with the Japanese Yen,
as well as the global geopolitical tensions.
11
The S&P GBL 1200 index reflects the movements in the prices of a package of shares of 1200
issuers worldwide and it is derived from the movement of seven (sub)indices pertaining to the
movements on the markets in the USA, Europe, Japan, Canada, Australia, Asia (Hong Kong, Korea,
Taiwan, Singapore) and Latin America (Argentina, Brazil, Chile, Mexico). S&P 500 is an index of the
movements on the capital market in the USA, which includes 500 leading US companies and covers
around 75% of the US capital market. Movements on the markets in Europe are presented through the
index S&P 350, which covers around 70% of the market capitalization on seventeen stock exchanges in
Europe. The S&P Japan 500 index reflects the movements of 500 Japanese companies quoted on the
stock exchanges in Tokyo, Osaka, or on JASDAQ and covers 88% of the capital market in Japan. 12
„Sub-prime“ lending pertains to extending loans (primarily mortgage loans) to entities without or
with disturbed credit history, and it is supported by the process of securitization and issuing mortgage
backed securities. 13
The so-called „carry-trade“, basically includes indebtedness in a currency with an extremely low,
almost equal to 0% interest rate and simultaneous investment of the funds in high yield placements in
600
800
1,000
1,200
1,400
1,600
1,800
Jan
-05
Apr-
05
Jul-
05
Oct
-05
Jan
-06
Ap
r-0
6
Jul-
06
Oct
-06
Jan
-07
Figure 5
Capital market indices
S&P GBL 1200
S&P500
S&P 350
S&P JAPAN 500

13
On the foreign exchange market depreciation of the US Dollar was registered, which
starting from March
2006 weakened relative
to the Euro and the
British Pound. The
depreciation of the
Dollar was mostly a
result of the slowdown
of the economic growth
in the USA and of the
reduced interest spread
with the other countries
(EU and Great Britain).
The same reasons led
also to weakening of
the Japanese Yen
relative to the Euro and
the British Pound. The indebtedness of the US economy expressed through the high levels of
the fiscal and current account deficits, the continuous upward trend of the interest rates in
other economies, primarily in the Euro-zone, as well as the commenced process of
diversification of the foreign reserves portfolio by certain countries, towards a decline in the
share of the US Dollar, could lead to further weakening of its value and increasing the
instability on the global financial markets.
On the commodities market, in expectation of slower global economic growth, the
"Reuters/Jefferies Commodity Research Bureau (CRB) Index" dropped by 7%. However,
during 2006 the average price of gold went up significantly and reached 604.3 US Dollars per
ounce (444.96 US Dollars per ounce in 2005). Usually the price of gold moves in the same
direction with the oil price, which averaged 65.4 US Dollars in 2006, in contrast to 54.5 US
Dollars per barrel in 200514
.
One of the main development features of the global financial markets during this last
decade, has been the fast increase in the size and the diversity of the products on the markets
of credit derivatives. The development of these markets enables more efficient credit risk
management by the banks and better credit risk distribution within the financial system,
which reflects positively on the stability of the banking and the financial system as a whole.
However, better management and distribution of the credit risk does not mean its
disappearing. On the contrary, banks' efforts to protect themselves against credit risk could
lead to its concentration outside the banking system. One of the dominant risks related to the
transfer of the risk outside the banking system is the growing role of the "hedge" funds. They
have a positive contribution to the development of the financial markets as they actively
monitor the opportunities for arbitrage, which contributes to an efficient price setting and
improves the liquidity of these markets. However, there is a concern regarding the size of the
credit risk undertaken by the "hedge" funds, primarily due to the lack of possibility to identify
the manner in which they and the markets to which credit risk is transferred would react, in
countries with higher interest rates. Such type of transactions bear yield until the moment the currency
in which the loans are used is weak. The increase in the interest rates and the strengthening of the
currency in which the loans are used increase the costs for loan repayment, which could cause a decline
and even disappearing of the positive effect from the differences in the interest rates and massive
withdrawal of the investors from such transactions. Exactly the appreciation of the Yen, which is
evident since the beginning of February 2007, and the gradual increase in the interest rate in Japan are
pointed out as one of the possible explanations for the increased sale of shares and bonds on the
markets with high yields. 14
Source: Bloomberg. The spot price of crude oil is used, which is a weighted average of the following
types of oil: West Texas Intermediate, Brent and the prices of Dubai-crude oil. Source: IMF WEO.
-0.14-0.12
-0.1-0.08-0.06-0.04-0.02
00.020.040.060.08
jan
06
fev
06
mar
06
Ap
r-0
6
Jun
-06
Jul-
06
avg0
6
Sep
-06
No
e0
6
Dek
06
Jan
07
Fev
07
Ap
r-0
7
Figure 6
Exchange rates movements
USD/GBP USD/EUR USD/YEN
14
case of possible deterioration of market conditions. Failing of some significant "hedge" fund
could be understood as lack of possibility to manage and transfer the credit risk. That could
lead to deterioration of the business cycle, as a consequence of the increased precaution of
banks when extending credits, especially if they estimate that it is not possible to transfer the
credit risk to the other market participants.
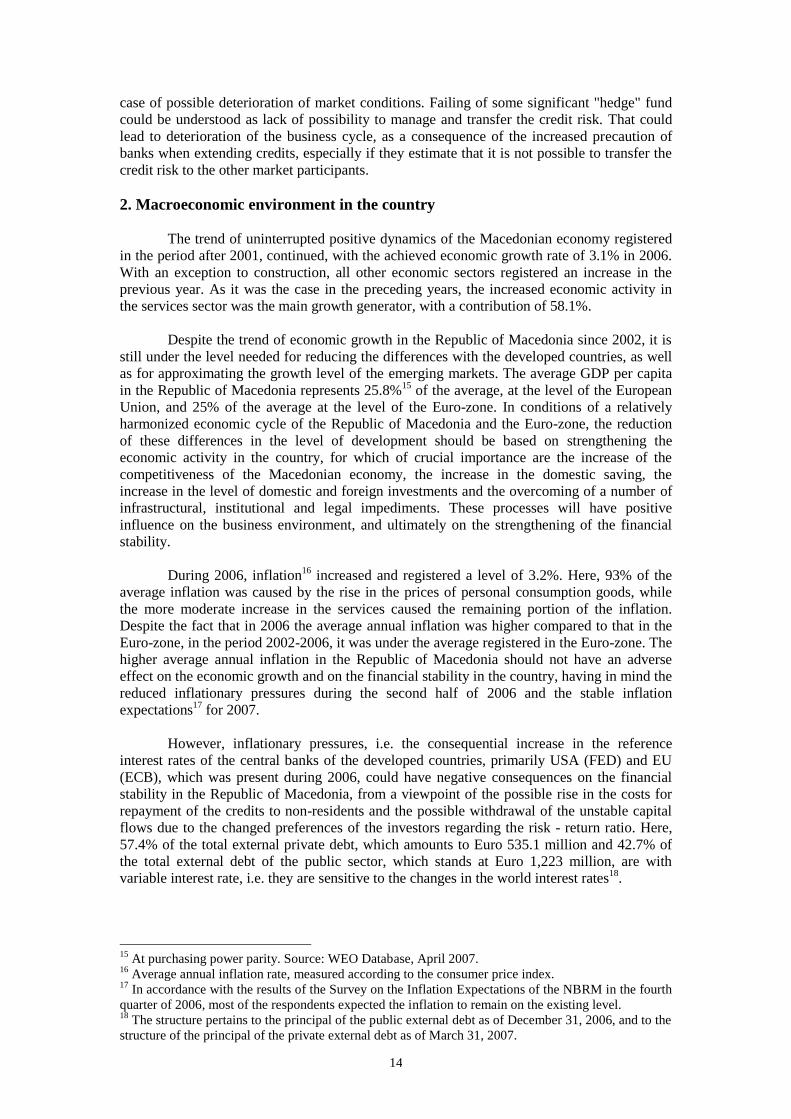
2. Macroeconomic environment in the country
The trend of uninterrupted positive dynamics of the Macedonian economy registered
in the period after 2001, continued, with the achieved economic growth rate of 3.1% in 2006.
With an exception to construction, all other economic sectors registered an increase in the
previous year. As it was the case in the preceding years, the increased economic activity in
the services sector was the main growth generator, with a contribution of 58.1%.
Despite the trend of economic growth in the Republic of Macedonia since 2002, it is
still under the level needed for reducing the differences with the developed countries, as well
as for approximating the growth level of the emerging markets. The average GDP per capita
in the Republic of Macedonia represents 25.8%15
of the average, at the level of the European
Union, and 25% of the average at the level of the Euro-zone. In conditions of a relatively
harmonized economic cycle of the Republic of Macedonia and the Euro-zone, the reduction
of these differences in the level of development should be based on strengthening the
economic activity in the country, for which of crucial importance are the increase of the
competitiveness of the Macedonian economy, the increase in the domestic saving, the
increase in the level of domestic and foreign investments and the overcoming of a number of
infrastructural, institutional and legal impediments. These processes will have positive
influence on the business environment, and ultimately on the strengthening of the financial
stability.
During 2006, inflation16
increased and registered a level of 3.2%. Here, 93% of the
average inflation was caused by the rise in the prices of personal consumption goods, while
the more moderate increase in the services caused the remaining portion of the inflation.
Despite the fact that in 2006 the average annual inflation was higher compared to that in the
Euro-zone, in the period 2002-2006, it was under the average registered in the Euro-zone. The
higher average annual inflation in the Republic of Macedonia should not have an adverse
effect on the economic growth and on the financial stability in the country, having in mind the
reduced inflationary pressures during the second half of 2006 and the stable inflation
expectations17
for 2007.
However, inflationary pressures, i.e. the consequential increase in the reference
interest rates of the central banks of the developed countries, primarily USA (FED) and EU
(ECB), which was present during 2006, could have negative consequences on the financial
stability in the Republic of Macedonia, from a viewpoint of the possible rise in the costs for
repayment of the credits to non-residents and the possible withdrawal of the unstable capital
flows due to the changed preferences of the investors regarding the risk - return ratio. Here,
57.4% of the total external private debt, which amounts to Euro 535.1 million and 42.7% of
the total external debt of the public sector, which stands at Euro 1,223 million, are with
variable interest rate, i.e. they are sensitive to the changes in the world interest rates18
.
15
At purchasing power parity. Source: WEO Database, April 2007. 16
Average annual inflation rate, measured according to the consumer price index. 17
In accordance with the results of the Survey on the Inflation Expectations of the NBRM in the fourth
quarter of 2006, most of the respondents expected the inflation to remain on the existing level. 18
The structure pertains to the principal of the public external debt as of December 31, 2006, and to the
structure of the principal of the private external debt as of March 31, 2007.
15
In circumstances of conducting a policy of stable exchange rate and relatively higher
amounts of foreign exchange inflows in the economy in the last two years, the monetary
policy of the National Bank has been facing a new challenge, i.e. potential risk from
appreciation of the real effective Denar exchange rate. This potential risk could lead to a
decline in the competitiveness of the domestic economy on the world market, and hence to
broadening of the trade deficit. However, the analysis of the movement of the real effective
Denar exchange rate indicates relatively stable movements and maintaining of the
competitiveness of the economy. At the same time, during the past ten years, the central bank
has successfully maintained the Denar exchange rate on a stable level, which significantly
reduces the likelihood of possible materialization of this risk.
The economic growth in the country had a positive reflection also on the labor
market. Thus, in accordance with the Labor Force Survey, at the end of 2006, the
unemployment rate dropped from 37.3% to 36%, compared with the previous year. At the
same time, the employment rate went up by 1.3 percentage points and equaled 35.2%.
However, despite such movements and changes in the legislation towards enabling greater
flexibility on the labor market19
, the high unemployment rate, accompanied by certain
negative structural features20
, is still one of the restrictive factors of development.
During the past two years, significant improvement in the current account balance
was registered by a reduction of the deficit in absolute amounts and by more significant
decline of its share in the GDP. At the end of 2006, the share of the current account deficit
was reduced down to 0.4% of GDP, which is a decline of 0.9 percentage points relative to
2005 and a decline of 7.3 percentage points relative to 2004. However, despite the positive
movements in the current account, the problem with the high trade deficit remains, which in
2006 reached the level of 20.6% of GDP.
Besides the high level of trade deficit, one should also have in mind certain
unfavorable structural features, from a viewpoint of the degree of concentration of foreign
trade and the sources of covering the negative trade balance.
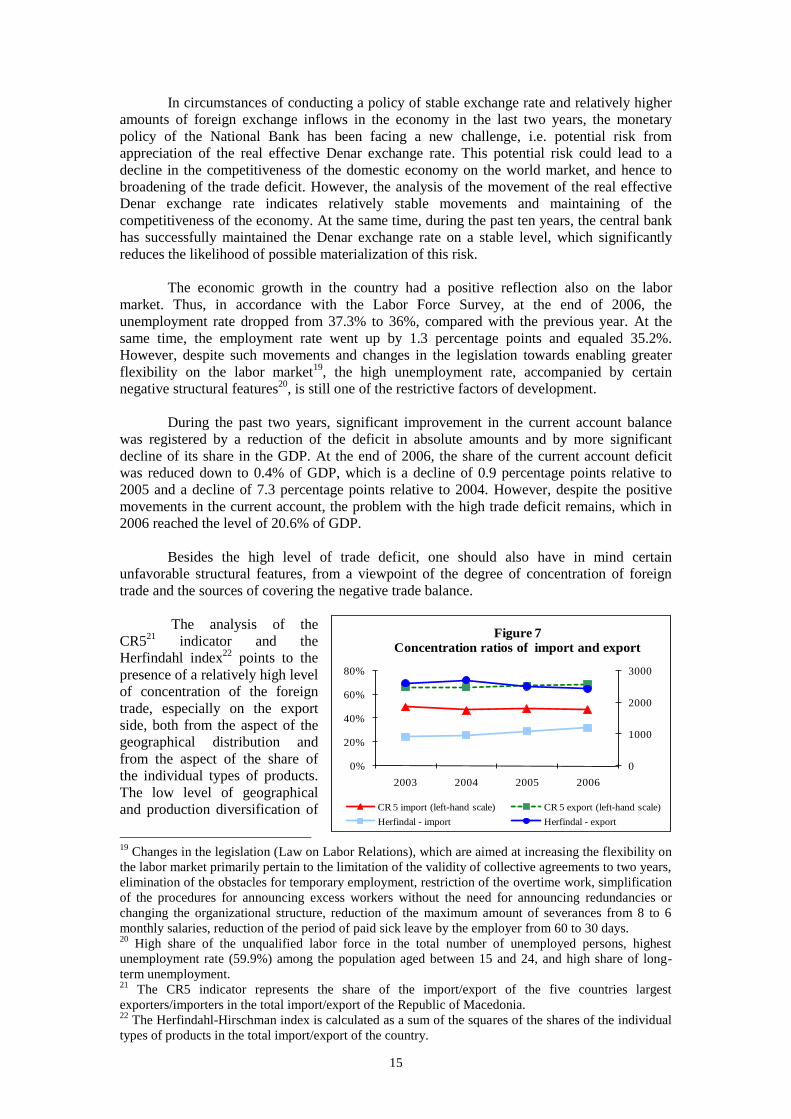
The analysis of the
CR521
indicator and the
Herfindahl index22
points to the
presence of a relatively high level
of concentration of the foreign
trade, especially on the export
side, both from the aspect of the
geographical distribution and
from the aspect of the share of
the individual types of products.
The low level of geographical
and production diversification of
19
Changes in the legislation (Law on Labor Relations), which are aimed at increasing the flexibility on
the labor market primarily pertain to the limitation of the validity of collective agreements to two years,
elimination of the obstacles for temporary employment, restriction of the overtime work, simplification
of the procedures for announcing excess workers without the need for announcing redundancies or
changing the organizational structure, reduction of the maximum amount of severances from 8 to 6
monthly salaries, reduction of the period of paid sick leave by the employer from 60 to 30 days. 20
High share of the unqualified labor force in the total number of unemployed persons, highest
unemployment rate (59.9%) among the population aged between 15 and 24, and high share of long-
term unemployment. 21
The CR5 indicator represents the share of the import/export of the five countries largest
exporters/importers in the total import/export of the Republic of Macedonia. 22
The Herfindahl-Hirschman index is calculated as a sum of the squares of the shares of the individual
types of products in the total import/export of the country.
0
1000
2000
3000
0%
20%
40%
60%
80%
2003 2004 2005 2006
Figure 7
Concentration ratios of import and export
CR 5 import (left-hand scale) CR 5 export (left-hand scale)
Herfindal - import Herfindal - export
16
the foreign trade, in conditions of possible adverse developments in the respective economies
could have negative consequences on the balance of payments and foreign trade position of
the country and it could indirectly lead to disruption of the financial stability in the Republic
of Macedonia. Such a situation is somewhat mitigated with the favorable rating and stable,
i.e. positive prospect of the countries that are dominant in the foreign trade of the country.
Table 2
Rating of the largest foreign trade partners of the Republic of Macedonia
Importers
Share in the
total export of
RM S&P rating Exporters
Share in the
total import of
RM S&P rating
BB- Positive A- Stable*
BB+ Stable BBB+ Stable**
Germany 15.6% AAA Stable Germany 9.8% AAA Stable
Greece 15.0% A Stable Greece 8.5% A Stable
BB- Positive
BB+ Stable
Bulgaria 5.4% BBB+ Stable Bulgaria 6.6% BBB+ Stable
* domestic currency; ** foreign currency;
Serbia and
Montenegro23.2%
Serbia and
MontenegroItaly 9.9% A+ Stable
Russia 15.1%
7.5%
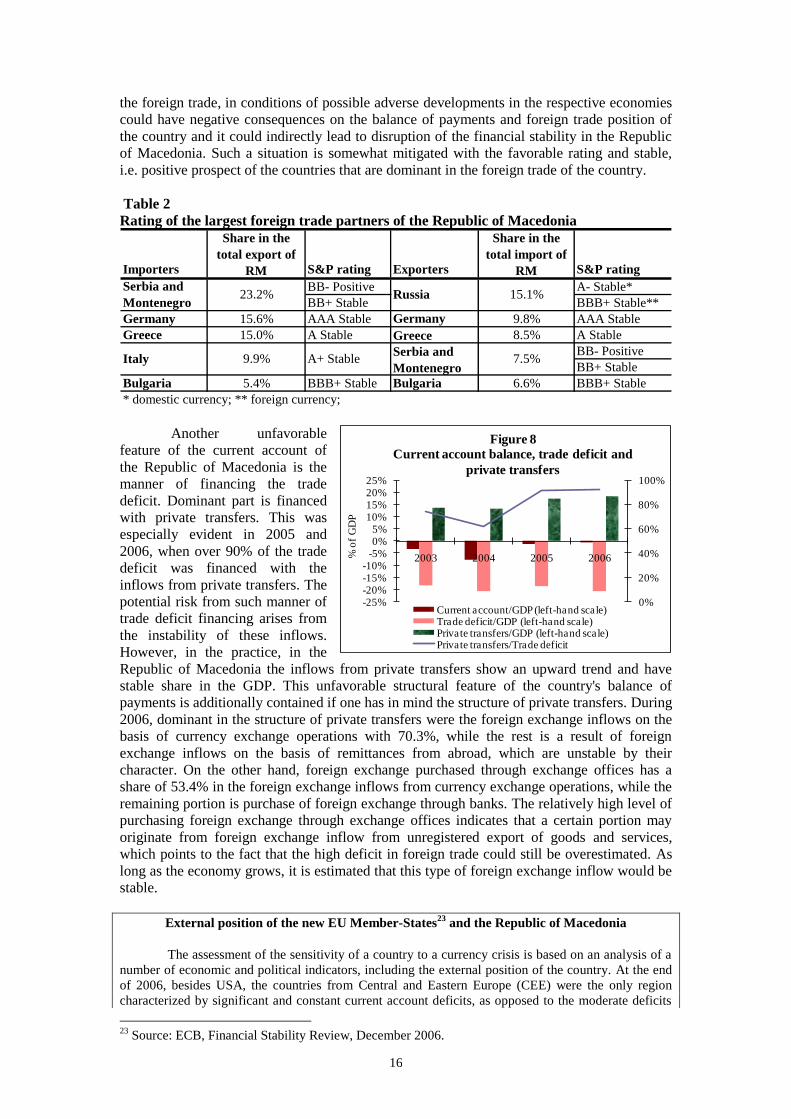
Another unfavorable
feature of the current account of
the Republic of Macedonia is the
manner of financing the trade
deficit. Dominant part is financed
with private transfers. This was
especially evident in 2005 and
2006, when over 90% of the trade
deficit was financed with the
inflows from private transfers. The
potential risk from such manner of
trade deficit financing arises from
the instability of these inflows.
However, in the practice, in the
Republic of Macedonia the inflows from private transfers show an upward trend and have
stable share in the GDP. This unfavorable structural feature of the country's balance of
payments is additionally contained if one has in mind the structure of private transfers. During
2006, dominant in the structure of private transfers were the foreign exchange inflows on the
basis of currency exchange operations with 70.3%, while the rest is a result of foreign
exchange inflows on the basis of remittances from abroad, which are unstable by their
character. On the other hand, foreign exchange purchased through exchange offices has a
share of 53.4% in the foreign exchange inflows from currency exchange operations, while the
remaining portion is purchase of foreign exchange through banks. The relatively high level of
purchasing foreign exchange through exchange offices indicates that a certain portion may
originate from foreign exchange inflow from unregistered export of goods and services,
which points to the fact that the high deficit in foreign trade could still be overestimated. As
long as the economy grows, it is estimated that this type of foreign exchange inflow would be
stable.
External position of the new EU Member-States23
and the Republic of Macedonia
The assessment of the sensitivity of a country to a currency crisis is based on an analysis of a
number of economic and political indicators, including the external position of the country. At the end
of 2006, besides USA, the countries from Central and Eastern Europe (CEE) were the only region
characterized by significant and constant current account deficits, as opposed to the moderate deficits
23
Source: ECB, Financial Stability Review, December 2006.
0%
20%
40%
60%
80%
100%
-25%-20%-15%-10%
-5%0%5%
10%15%20%25%
2003 2004 2005 2006% o
f G
DP
Figure 8
Current account balance, trade deficit and
private transfers
Current account/GDP (left-hand scale)Trade deficit/GDP (left-hand scale)Private transfers/GDP (left-hand scale)Private transfers/Trade deficit

17
or surpluses of the counties in Asia or Latin America. Despite the fact that this region is relatively
small in economic terms, the unfavorable movements on the markets in this region could have an
adverse effect on the global financial stability. For comparison, the Asian crisis, 1997-1998 showed
that the instability in one country
could have negative
consequences for a much larger
economic region, especially in
case of a simultaneous
withdrawal of the investors from
several countries with similar
characteristics. In that sense, the
geographical vicinity of the new
EU Member-States (NMS), as
part of the region of CEE, and the
participation of some of them in
the Exchange Rate Mechanism II,
even further emphasize the
importance of analysis of the
external positions of these
countries, as part of the broader
framework for analyzing
financial stability. Main elements
of such an analysis are the following: analysis of the current account balance, its financing, as well as
the net international investment position (IIP) and the level of the country's external debt.
The analysis of the current account balance points to significant differences in the situation in
the individual NMS. The highest levels of current account deficit in the period 2002-2006 were
registered in Estonia and Latvia, where in this period the negative current account balance averaged
over 10% of GDP. Relatively high current account deficit was registered also in Hungary (7% of GDP
on average), primarily as a result of the high fiscal deficit of the country. As opposed to that, Slovenia
and Poland were countries with the lowest level of current account deficit, which averaged around 2%
of GDP. In the other NMS current account deficit ranged between 4% and 6% of GDP. In the same
period, the current account deficit in the Republic of Macedonia averaged 4.5% of GDP, which is
higher only than in Slovenia and Poland.
Such levels of current account deficit are possible indicator of the cost and price inefficiency
and incompetitiveness of the countries, but in the case of the NMS, they could be triggered also by the
process of convergence of their economies with the EU. The results from the analyses which are
grounded on certain models for estimation of the "excessiveness" of the deficits of the NMS, suggest
that the current account deficits of the NMS are mostly on sustainable levels. However, these models
indicate that there is great possibility the current account deficits which are significantly higher than
10% of GDP (as it is the case with Estonia and Latvia in certain years) to be unsustainable in a medium
run. Also, certain indicators point to "excessiveness" of the negative balance on the current account in
Hungary, especially in the years when it exceeds 8% of GDP.
Financial stability is in correlation also with the structure of financing the current account
deficit. Financing with long-term and more stable sources of funds contributes to the sustainability of
the current account deficit in a longer run. In that sense, emphasis is put on the importance of the
foreign direct investments (FDI) as a source of financing this deficit. In the analyzed period, the net
inflows of FDI, on average, exceeded the current account deficits in the Czech Republic, Poland and
Slovakia. As opposed to that, the net inflows of FDI financed only around half of the current account
deficits of Hungary, Latvia and Lithuania, which reflects the relatively lower level of FDI and the high
amounts of current account deficit. In the same period (2002-2006), the net-inflows of FDI financed,
on average, around 60% of the current account deficit of the Republic of Macedonia. The gap in
financing the current account deficit of Hungary, Latvia and Lithuania, as well as of the Republic of
Macedonia was bridged with the higher inflows, primarily on the basis of the external borrowing and
portfolio investments.
Another important aspect of the analysis of the external position of the countries is the
assessment of their international investment position (IIP). IIP is the difference between the total
international financial assets and liabilities of the country, i.e. it covers all claims and liabilities of the
residents of a country on/to third countries, incurred on the basis of capital and other financial
-120.0%
-100.0%
-80.0%
-60.0%
-40.0%
-20.0%
0.0%
-12.0%
-10.0%
-8.0%
-6.0%
-4.0%
-2.0%
0.0%
CZ EE LV LT HU PL SK SI MK
Figure 9
Current account balance, FDI and international
investment posistion (IIP), as % of GDP
current account balance net FDI IIP (right-hand scale)
Note: Current account balance and FDI are the averages for the period
2002-2006, while the value of IIp is at the end of 2005. The negative
value of FDI represents higher FDI inflows than outflows

18
investments. From a viewpoint of the IIP, especially favorable is the position of the Czech Republic, as
a result of the high inflow of FDI, which reduces the need of covering the current account deficit with
direct borrowing. In Hungary, in conditions of a high fiscal deficit and increased demand of the
corporate sector for foreign currency credits, significant increase was registered in the gross external
debt and the negative value of the IIP. The high level of external debt in Estonia is to a large extent
related to the borrowing of the banks from their parent banks abroad, which from the aspect of the
financial stability, implies lower level of risk. At the end of 2005, the Republic of Macedonia had a
negative IIP of 42.7% of GDP, and it reflects the larger amount of foreign liabilities compared with the
foreign assets of the country. On the part of the country's foreign assets, the official foreign reserves
have a dominant share of 53.9%, while dominant on the part of the liabilities are the trade credits and
loans with a share of 48.2% and the inward direct investments, with a share of 43.6%.
The composite assessment of the external position of the NMS and the Republic of Macedonia
from all three aspects (the level of current account deficit, the structure of its financing and the
international investment position), does not point to a conclusion for their "excessiveness". In most of
the NMS the current account balance seems to reflect the process of convergence of the economies
within the frames of the single EU market. Also, in most countries the current account deficit is mostly
financed with net inflows from FDI, which are less susceptible to sudden outflows of capital. Unlike
them, one of the key prerequisites for improvement of the external position of the Republic of
Macedonia is improvement of the structure of the current account deficit financing. To that end,
especially important is the increase in the inflows on the basis of FDI, which necessarily assumes
improvement of the investment climate. That will contribute to further positive perception of the
Macedonian economy by the foreign investors.
Positive feature of the
Macedonian economy is the
moderate level of indebtedness,
which in the past few years
equals around 40% of GDP. At
the end of 2006, the total
external debt stood at Euro
1,830.5 million and registered a
decline of 5.1%, compared with
the preceding year. Such a trend
of the external debt was to a
large extent caused by the
strategy for its reduction and improvement of the structure. This strategy was applied also
during 2007.24
2.1. Country risk
In July 2004, Republic of Macedonia received its first credit rating BB/B with
positive outlook for foreign currency and BB+/B with positive prospect for domestic
currency, from the "Standard & Poor's" rating agency. The rating was supported by the fast
progress towards political stability and the prospects for EU membership, while the main
risks were a reflection of the structural problems, interethnic relations, inflexible structure of
the costs of the central government and the inefficient social security system.
In the following years country's credit rating continuously improved25
.
24
By January 2007, early repayment of the debt to the Paris Club was made, which comprised 13.7%
of the total external debt. On May 23, 2007, NBRM made full early repayment of the liabilities of the
Republic of Macedonia on the basis of loans from the IMF, in the total amount of SDR 29.2 million, i.e
Euro 32.8 million. On June 11, 2007, the Ministry of Finance made early repayment of part of the
credits taken from the World Bank, in the total amount of Euro 96.1 million, which led to a reduction
of the external public debt to a level of 28% of GDP. (Source: Ministry of Finance and National Bank
of the Republic of Macedonia). 25
Source: Web sites of "Standard&Poor's" and "Fitch".
0%
20%
40%
60%
2001 2002 2003 2004 2005 2006
Figure 10
Dinamics of the total external debt
Total external debt/GDP

19
Table 3
Credit rating of the Republic of Macedonia 2004 2005 2006
foreign currency BB positiv outlook BB+ stable outlook BB+ stable outlook
domestic currency BB+ positiv outlook BBB- stable outlook BBB- stable outlook
foreign currency BB positiv outlook BB+ stable outlook
domestic currency BB positiv outlook BB+ stable outlookFitch
S&P
On May 29, 2007, the "Standard & Poor's" credit rating agency confirmed the credit
rating of the Republic of Macedonia "BB+ with stable outlook" for foreign currency and
"BBB- with stable outlook" for domestic currency. The improvement of the political stability,
the continuity in implementing the reforms, the economic growth, the prudent fiscal policy
and the reduction of public debt, were the main factors which led toward confirmation of the
rating. The positive steps in the field of regulatory guillotine, the continuous implementation
of the Ohrid Agreement and the continuation of the reforms for convergence toward the EU
caused the stable outlook. In the forthcoming period, the rating agency expects continuity in
the reforms and in the conduct of the macroeconomic policy, which would result in
improvement of the current credit rating and classification of the Republic of Macedonia in
the group of countries with an investment rating (BBB).
In
December 2005,
Republic of
Macedonia issued
the first Eurobond,
in the total amount
of Euro 150 million,
with maturity of 10
years (December
2015) and coupon
interest of 4.625%.
After the initial
period of a
downward trend in
the price of this
bond, in the period
after June 2006, there is a trend of continuous strengthening in the price of the Eurobond26
,
which indicates better perception of the investors about the level of risk typical for this
instrument. Such a dynamics may be directly related to the improvement of the country's
credit rating, as well as with the holding of the parliamentary elections in the country.
26
Source: Ministry of Finance.
94
96
98
100
102
104
Dec-0
5
Jan
-06
Feb
-06
Ma
r-0
6
Ap
r-0
6
Ma
y-0
6
Jun
-06
Jul-
06
Au
g-0
6
Sep
-06
Oct-
06
No
v-0
6
Dec-0
6
Jan
-07
Feb
-07
Ma
r-0
7
Figure 11
Price of RM Eurobond

20
II. Non-financial institutions
In the contemporary conditions of functioning of the financial system, risk
management by the individual institutions or sectors is actually distribution of risks within the
framework of the financial system or in other sectors. As a result of that, the various risks that
the banks and other financial institutions manage are transferred, inter alia, also to the
household sector and to the corporate sector. The assessment of the level of exposure of
these sectors to the individual risks and their ability to manage them is a complex, yet very
important aspect when assessing financial stability.
Companies and households are the most important "business partners" of the financial
institutions. Their performances, primarily the financial strength, the ability to generate
regular income in their operations and the level of their indebtedness, directly reflect on the
performances of the financial institutions. The business behavior of the companies, their
habits, households' mentality, the education level and information regarding the operations of
the financial institutions and functioning of the financial markets influence the type of
financial services that the financial institutions offer, and hence on the composition of the
financial system.
1. Household sector
1.1. Financial assets and disposable income of households
When analyzing the developments in the household sector and the effects on the
financial stability, one of the key aspects is the identification and measurement of the
financial assets of the households. It is an important factor in determining the total financial
strength of the households. On the other hand, the decisions and the propensities of the
households related to the structure and management of their assets directly influences the
structure and value of the assets and liabilities of financial institutions and of the corporate
sector.
At the end of 2006, total financial assets of households stood at Denar 154,235
million and registered annual increase of Denar 18,729 million, or 13.8%. This increment was
caused mainly by the increase in the deposits with banks and savings houses, which at the end
of 2006, had the largest share of 46.7% in the total financial assets of the households. One of
the factors behind the increase in this part of the financial assets was the net-sale of
securities27
by the households on the Stock Exchange, during 2006. The increase in private
transfers from abroad is another factor that also influenced the growth of this type of financial
assets at the end of 2006.
Second largest item, participating with 33.4% in the financial assets of the
households, are the shares28
. Having in mind that these calculations use the nominal value of
the shares (at which they are registered in the Central Securities Depositary), as well as the
movements on the Macedonian Stock Exchange, one may assume that the value of this type
of financial assets, its annual increase and its share in the total financial assets of the
households are underestimated. This is especially typical for 2006, in circumstances when the
market value of the largest part of the shares was several times above their nominal value. On
the other hand, the increased participation of the shares means increased exposure to market
risk, i.e. increased sensitivity of the households' assets to the variability of the prices on the
capital market.
27
Households appear as net-sellers of securities. The net-sale is calculated on the basis of the realized
value (not the number) of sold and purchased securities in a certain period. 28
Source: Central Securities Depositary.

21
Table 4
Financial assets of households
Ammount in
millions of
denars
Structure Ammount in
millions of
denars
Structure In millions
of denars
In % In the
structure
(in p.p.)
Share in the
change
Deposits in banks and savingshouses 58,037 42.8% 72,009 46.7% 13,972 24.1% 3.9 74.6%
Cash in circulation* 10,107 7.5% 11,344 7.4% 1,237 12.2% -0.1 6.6%
Shares 46,480 34.3% 51,456 33.4% 4,976 10.7% -0.9 26.6%
Bonds 19,693 14.5% 16,719 10.8% (2,974) -15.1% -3.7 -15.9%
Treasury notes 151 0.1% 127 0.1% (24) -16.0% 0.0 -0.1%
Pension funds' assets 1,242 0.8% 1,242 0.8 6.6%
Life insurance 1,037 0.8% 1,337 0.9% 300 28.9% 0.1 1.6%
TOTAL 135,505 100.0% 154,235 100.0% 18,729 13.8% 100.0%
* For the purpose of the analysis, according to NBRM's estimate, 70% of the cash in circulation (outside of banks) are included in the financial assets of households
31.12.2005 31.12.2006 Annual change
Type of assets
Bonds with a share of 10.8% are the third largest item in the financial assets of the
households. Relative to the end of 2005, they dropped by 15.1% and reduced their share in the
total financial assets by 3.7 percentage points. Having in mind that over 99% of them pertain
to structural bonds (for old foreign exchange saving and denationalization), for which the
government makes repayments during the year, in the forthcoming period this type of
financial assets is expected to continue to lose its significance in the total financial assets of
the households. This is all under the assumption that in the forthcoming period, the interest of
the households in investing in continuous bonds will not change.
At the end of the two analyzed years, currency in circulation had a stable share of
around 7.5% in the total financial assets of the households. At the end of 2006, they registered
an annual increase of 12.2%, which caused 6.6% of the total increase in the financial assets of
the households.
As of December 31, 2006, all other types of financial assets have an individual share
smaller than 1% of the total financial assets. Still, having in mind the expected fast growth of
the assets of pension funds, in the future it could be expected the net-assets of pension funds
to become more important and to increase their share in the total financial assets of the
households. Also, the expected development of the financial markets and financial
instruments will reflect on the volume and the structure of the financial assets of the
households.
Besides on the volume of the financial assets, households' debt repayment ability to a
large extent depends also on its revenues. At the end of 2005, the households' debt to
disposable income ratio29
equaled 21.9%, which despite the increase of 14.3 percentage points
relative to 2004, is still on a lower level compared with the developed countries30
. This points
to the conclusion that there is still room for deepening of the credit support for the household
sector provided by the financial institutions, and hence for an additional increase in the
financial intermediation.
Income from employment has the dominant share of over 50%31
in the households'
disposable income. Income on the basis of pension and social insurance is the second largest
category of disposable income with a share of around 20%. In the past period there was a
trend of certain increase in the share of the income from employment (from 52.9% in 2003 to
55.5% in 2005), at the expense of the income from pension and social insurance (from 22.5%
in 2003 to 21% in 2005) and the remaining sources of funds. It is estimated that the positive
developments on the labor market during 2006, when the employment rate registered annual
increase of 1.3 percentage points and net-wages went up by 7.3% (increase in real terms of
4.1%), had positive influence also on the level and the increase in the households' disposable
29
The latest available data pertains to 2005. 30
For comparison, at the end of 2004, in a number of countries (USA, Japan, Germany, Great Britain,
Canada, Spain, Australia, The Netherlands, Sweden, Switzerland) this indicator exceeded 100%.
Source: BIS, CGFS Paper No.26 - Housing finance in the global financial market, January, 2006. 31
Available data for 2005. Source: Calculations on the basis of data of the State Statistical Office.

22
income in the same period32
. The increase in the disposable income positively reflected on the
households' creditworthiness and indirectly on the level of the credit risk of the banking
sector.
On the other hand, dominant part (over 85%) of the total households' income is used
for personal consumption, and a relatively small part, of below 8% is used for saving33
.
However, it should be emphasized that in the past few years the use of the disposable
income34
experienced an upward trend in the share of saving. Within the personal
consumption structure, more than 3/4 pertain to expenses for essential35
products, and more
than 1/2 to expenses for food and beverages. All these products, especially food and
beverages are characterized with low price elasticity. At the same time, during 2006, the
average value of the consumers' basket for food and beverages equaled 76% of the average
net-wage in the same period. Having this in mind, as well as the fact that in 2006 the changes
in the prices of these essential products caused over 50% of the average inflation, each future
increase in their prices will inevitably lead to an increase in the expenses for households'
personal consumption. This would adversely affect the level of the disposable income
intended for saving, especially in conditions of relatively low employment growth rates. The
decline in saving would, on its part, negatively affect the level of the financial potential of the
financial system, especially of banks, which finance a significant portion of their assets (41%
at the end of 2006) with household deposits.
One of the potential risks to which the household sector is usually exposed, is the
possible decline in the disposable income, which would act towards reducing its
creditworthiness. However, in conditions of a stable macroeconomic environment, positive
trends on the labor market, expected membership in the NATO, positive prospects for starting
the negotiations for EU accession, announcements for more significant FDI in the country,
there is a small chance for this risk to materialize.
1.2. Households' debt
Determining the level of households' debt is a significant indicator of its payment
ability. Excessive debt may reflect negatively on the credit portfolio quality, primarily of
banks, wherefrom the households traditionally borrow. However, one should have in mind
that determining the possible overindebtedness and the so-called sustainable level of
households' debt is a complex issue, due to the lack of adequate data. It is especially difficult
to identify the portion of the population with the highest debt and that to be compared with
the disposable income in order to assess the sustainable debt level.
Table 5
Total households' debt36
Ammount
in million
of denars
Structure Ammount
in million
of denars
Structure In million
of denars
In % In the
structure
(in p.p.)
Share in the
change
Banks 25,857 89.3% 39,738 90.7% 13,881 53.7% 1.4 93.3%
Savinshouses 1,274 4.4% 1,566 3.6% 292 22.9% -0.8 2.0%
Leasing 1,829 6.3% 2,526 5.8% 698 38.1% -0.6 4.7%
TOTAL 28,959 100.0% 43,830 100.0% 14,871 51.4% 100.0%
Type of debt
31.12.2005 31.12.2006 Change
32
The data on the level of the households' disposable income in 2006 were not available at the time of
writing this report. 33
In 2005. Source: State Statistical Office. 34
At the end of 2003, saving accounted for only 0.4% of the households' used funds (this is the term
used by the SSO). 35
Calculations are based on the data for 2005. Essential products include: food, beverages, clothing and
wearing apparel, housing, heating and lighting, and hygiene and health care. 36
Source of data: National Bank of the Republic of Macedonia (for the banks and savings houses) and
Ministry of Finance (for the leasing companies).

23
At the end of 2006, the total debt of the household sector37
stood at Denar 43,830
million which was an increase of Denar 14,871 million, or 51.4% relative to the end of 2005.
Such an increase was primarily a result of the emphasized credit support for the households
provided by the banking sector, which just as at the end of 2005, was the largest creditor of
the household sector, with a share of over 90% in the total debt. At the same time, the
increased debt to this sector caused 93.3% of the growth of the total households' debt. Second
largest creditor, with a share of 5.8% in the total households' debt are the leasing companies.
In spite of the increase of 38.1% in the value of the leasing agreements, at the end of 2006,
the share of this type of debt in the total households' debt dropped relative to 2005. However,
with the growth and the development of the leasing market (primarily the emergence of new
entities and new products on the market), one should expect this source of households' debt to
become increasingly important in the future.
Despite the significant increase in the households' debt, during 2006 debt
accumulation did not exceed the accumulation of the households' financial assets. During
2006, the ratio of the annual increase in the debt to the financial assets was 79.4%, which
means that the accumulation of financial assets provided "coverage" of the debt increase of
125.9%. At the same time, at the end of 2006, the level of coverage of the total households'
debt with financial assets equaled 351.9%. As of the same date, households' net financial
assets, calculated as the difference between the total financial assets and the total households'
debt stood at Denar 110,405 million and registered an annual increase of 3.6%. All this points
to the conclusion that on aggregate level, households are capable of servicing their debt, even
in case of possible decline of their total income. However, the picture could be completely
different at the level of the individual segments of the households or on a micro level, as in
most cases there is a mismatch between the owners of the assets and the borrowers. This is
supported also by the fact that the largest portion of the financial assets is usually
concentrated with the wealthier segments of the population.
At the end of 2006, the
ratio of the total households' debt
to GDP equaled 14.4%, which is
still a relatively low level of
indebtedness, despite the rise of
4.2 percentage points relative to
2005. For comparison, at the end
of June 2006, households' debt
relative to GDP in the Euro zone
was 58.3%, while in USA and in
Great Britain it was around 80%
and 100%, respectively. This
suggests that on aggregate level the households in the Republic of Macedonia may sustain
even higher level of indebtedness. Still, the assessment about the households' debt should be
interpreted with a great amount of precaution, as even a low level of debt may be a potential
risk for the financial stability, especially if there is a concentration of the debt with a
relatively small portion of the households.
37
For the needs of this analysis, the total debt of the household sector consists of: the total debt from
credits taken from banks, debt on the basis of credits and interest to the savings houses and the value of
the active leasing agreements. In the absence of data on the value of the active leasing agreements on
December 31, 2005, for comparison purposes, the amount of the debt on the basis of leasing as of
December 31, 2005 was obtained as an arithmetical mean of the values from the end of 2004 and 2006.
Having in mind the relatively low share of the leasing in the total households' debt, such manner of
calculation should not have major influence on the analysis of the amount and the structure of the
overall debt.
0.0%
5.0%
10.0%
15.0%
20.0%
-
100,000
200,000
300,000
2004 2005 2006in m
illio
ns o
f d
en
ars
Figure 12
Level of households' indebtedness
GDP Total debt Total debt/GDP (right-hand scale)
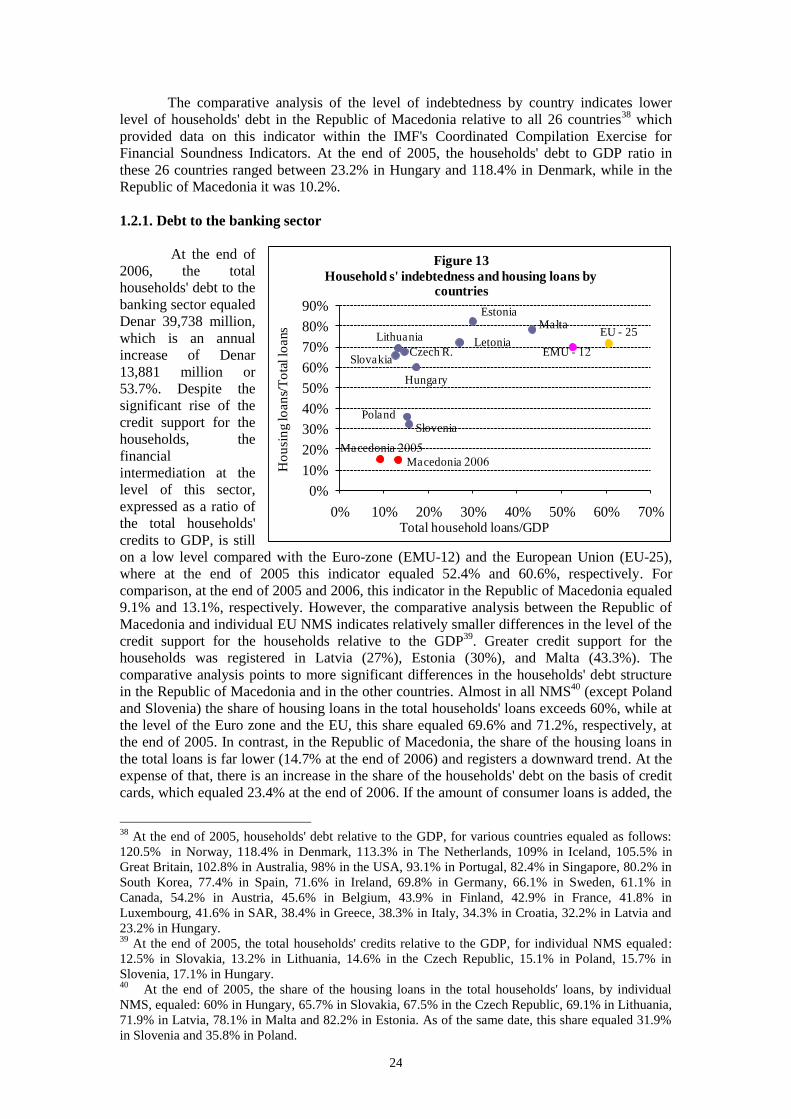
24
The comparative analysis of the level of indebtedness by country indicates lower
level of households' debt in the Republic of Macedonia relative to all 26 countries38
which
provided data on this indicator within the IMF's Coordinated Compilation Exercise for
Financial Soundness Indicators. At the end of 2005, the households' debt to GDP ratio in
these 26 countries ranged between 23.2% in Hungary and 118.4% in Denmark, while in the
Republic of Macedonia it was 10.2%.
1.2.1. Debt to the banking sector
At the end of
2006, the total
households' debt to the
banking sector equaled
Denar 39,738 million,
which is an annual
increase of Denar
13,881 million or
53.7%. Despite the
significant rise of the
credit support for the
households, the
financial
intermediation at the
level of this sector,
expressed as a ratio of
the total households'
credits to GDP, is still
on a low level compared with the Euro-zone (EMU-12) and the European Union (EU-25),
where at the end of 2005 this indicator equaled 52.4% and 60.6%, respectively. For
comparison, at the end of 2005 and 2006, this indicator in the Republic of Macedonia equaled
9.1% and 13.1%, respectively. However, the comparative analysis between the Republic of
Macedonia and individual EU NMS indicates relatively smaller differences in the level of the
credit support for the households relative to the GDP39
. Greater credit support for the
households was registered in Latvia (27%), Estonia (30%), and Malta (43.3%). The
comparative analysis points to more significant differences in the households' debt structure
in the Republic of Macedonia and in the other countries. Almost in all NMS40
(except Poland
and Slovenia) the share of housing loans in the total households' loans exceeds 60%, while at
the level of the Euro zone and the EU, this share equaled 69.6% and 71.2%, respectively, at
the end of 2005. In contrast, in the Republic of Macedonia, the share of the housing loans in
the total loans is far lower (14.7% at the end of 2006) and registers a downward trend. At the
expense of that, there is an increase in the share of the households' debt on the basis of credit
cards, which equaled 23.4% at the end of 2006. If the amount of consumer loans is added, the
38
At the end of 2005, households' debt relative to the GDP, for various countries equaled as follows:
120.5% in Norway, 118.4% in Denmark, 113.3% in The Netherlands, 109% in Iceland, 105.5% in
Great Britain, 102.8% in Australia, 98% in the USA, 93.1% in Portugal, 82.4% in Singapore, 80.2% in
South Korea, 77.4% in Spain, 71.6% in Ireland, 69.8% in Germany, 66.1% in Sweden, 61.1% in
Canada, 54.2% in Austria, 45.6% in Belgium, 43.9% in Finland, 42.9% in France, 41.8% in
Luxembourg, 41.6% in SAR, 38.4% in Greece, 38.3% in Italy, 34.3% in Croatia, 32.2% in Latvia and
23.2% in Hungary. 39
At the end of 2005, the total households' credits relative to the GDP, for individual NMS equaled:
12.5% in Slovakia, 13.2% in Lithuania, 14.6% in the Czech Republic, 15.1% in Poland, 15.7% in
Slovenia, 17.1% in Hungary. 40
At the end of 2005, the share of the housing loans in the total households' loans, by individual
NMS, equaled: 60% in Hungary, 65.7% in Slovakia, 67.5% in the Czech Republic, 69.1% in Lithuania,
71.9% in Latvia, 78.1% in Malta and 82.2% in Estonia. As of the same date, this share equaled 31.9%
in Slovenia and 35.8% in Poland.
0%
10%
20%
30%
40%
50%
60%
70%
80%
90%
0% 10% 20% 30% 40% 50% 60% 70%
Ho
usi
ng lo
an
s/T
ota
l lo
ans
Total household loans/GDP
Figure 13
Household s' indebtedness and housing loans by countries
Macedonia 2006Macedonia 2005
EU - 25
EMU - 12
SloveniaPoland
Hungary
MaltaEstonia
LetoniaCzech R.
Lithuania
Slovakia

25
share of total loans
intended for
consumption purposes
equals 70.8%. Having in
mind the increased use
of payment cards, and
the fact that the
furnishing of homes
with durable goods is at
a low level41
, it is
realistic to expect such
movements in the total
households' debt to
continue also in the
future. Here it should be
emphasized that
consumer loans are characterized with a relatively higher risk degree, in comparison with the
housing loans. Higher risk is due to the fact that consumer loans are mostly not secured,
unlike the housing loans the approval of which, by the rule, is contingent upon placing a
certain type of collateral.
The growing trend of the credit support for the households in the past few years also
influenced the sector structure of the banks' credit exposure. At the end of 2006, the share of
the credit exposure to the households accounted for 22.2% of the banks' total credit exposure,
which is an increase of 3.8 percentage points relative to 2005 and 6.7 percentage points
relative to 2004. Main factors that contributed to the increased lending to households were the
following: favorable macroeconomic environment, need for improved furnishing of homes
with durables, loosening of the banks' lending policies and reduction of the interest rates, as
well as competition among banks for attracting a larger portion of this segment of the market.
From a viewpoint of the maturity and currency structure of the households' debt, two
main features are evident: dominance of the long-term debt and growing trend of the debt
with currency component.
The high share of the long-term in the total loans to households is a source of
potential risks for the banks and the households. The risk for the banks is in the form of a
liquidity risk due to the significant maturity mismatch of the credits and deposits. On the part
of the households, there is a risk of increasing the debt level, as a result of the dispersion of
the debt repayment within a longer period, whereby the amount of the individual periodical
repayments is reduced.42
Another risk to which the households are exposed is the interest rate
41
Source: Statistical Yearbook of the Republic of Macedonia 2006, State Statistical Office. 42
If the amount of the periodical repayment is lower, also its share in the disposable income and the
households' monthly wages are lower, which allows for further borrowing of the households.
17.4%14.8% 14.7%
61.2%55.5%
47.4%
5.8%
16.0%23.4%
0.0%
10.0%
20.0%
30.0%
40.0%
0.0%
50.0%
100.0%
31.12.2004 31.12.2005 31.12.2006
Figure 14
Structure and trend of households debt to
banks
Housing Consumer
Credit cards Other
% of total credit exposure
73%75%
18.4% 19.0%
0%
10%
20%
30%
40%
50%
60%
70%
80%
90%
100%
2003 2004 2005 2006
Figure 15
Term structure of households loans
Long term
Short term
Other
55.9%
50.1%
37.3%44.5%
0%
10%
20%
30%
40%
50%
60%
70%
80%
90%
100%
2003 2004 2005 2006
Figure 16
Term structure of households deposits
Sight
Long term
Short term

26
risk, in circumstances when dominant part of the loans are extended with de facto variable
interest rates43
. The long-term character of the loans even further emphasizes the sensitivity of
the households to this risk. The possible upward trend in the interest rates would imply
increasing of the households' expenses for debt servicing, which could have an adverse effect
on its creditworthiness.
The stability of the exchange rate of the domestic currency, as well as the relatively
lower interest rates on the foreign exchange credits and Denar credits with FX clause, led to
an increase in the share of the households' debt with currency component in the past few
years. During 2006, the total credit exposure with currency component registered an increase
of 80.8%, which primarily reflected the rise of the credit exposure with FX clause, which
reached Denar 8.677 million or 77.9% in the same period. Such developments contributed the
share of the credit exposure with currency component in the banks' total credit exposure to the
households to reach the level of 34.1% at the end of 2006, which is a significant rise of 13.3
percentage points relative to 2003. From a viewpoint of the households, this type of credit
exposure indicates increased sensitivity to a foreign exchange risk.
The analysis of the net foreign exchange position of the households in the banking
sector44
points to the conclusion that on aggregate level, households have "active" or long net
foreign exchange position, which reflects the continuously higher amount of the claims
(deposits) relative to the liabilities (credit exposure) with currency component. Such a
position, on aggregate level, implies risk for the households from possible appreciation of the
domestic currency. The lack of data on the distribution of the claims and liabilities with
currency component by individual borrower or individual segments of the households sector
is the main restrictive factor for a deeper analysis of this aspect of the households' debt. Due
to the probability that the depositors are not simultaneously borrowers in foreign currency and
in Denars with FX clause, the general conclusion prevails that the largest portion of the
households - borrowers are additionally exposed to a foreign exchange risk due to the lower
possibility for hedging against that risk.
As a result of the continuously higher amount of the households' deposits relative to
the credits, in the past few years the households had net-claims on the banking sector on
aggregate level, i.e. the households were the net-creditor of the banking sector, on aggregate
level. At the end of 2006, households' net savings, calculated as a difference between the total
claims (deposits) and total liabilities (credits) of the households stood at Denar 40,566
million, which is an increase of Denar 4,580 million, or 12.7% relative to 2005. This
increment positively reflected also on the relative significance of the households' net-savings
43
Variable depending rather on the bank's policy than on the change in some key interest rate on which
the risk premium would be added when setting the interest rate on the loan. 44
For the needs of this analysis, households' net foreign exchange position is calculated as the
difference between the total claims (deposits) and liabilities (credit exposure) of the households in
foreign exchange and in Denars with FX clause.
Denar
20.8% FX and FX
clause 34.1%
0%
20%
40%
60%
80%
100%
2003 2004 2005 2006
Figure 17
Currency structure of households debt
-20,000
-10,000
0
10,000
20,000
30,000
40,000
50,000
2003 2004 2005 2006
in m
ilio
ns
of
den
ars
Figure 18
Households foreign exchange position
FX liabilities FX assets Net FX position

27
for the total economic
activity in the country. Thus,
at the end of 2006, the ratio
of the households' net
savings to GDP equaled
13.4%, which is an increase
of 0.7 percentage points
relative to 2005. In spite of
the increase, this share is
still on a relatively low level
compared with other
countries45
and represents a
potential restrictive factor of
the economic growth of the country.
The faster relative
annual growth of credits relative
to the deposits in the past few
years reflected with a reduced
level of coverage of the
households' credits with
deposits. Despite such a trend, at
the end of 2006, the indicator of
the ratio of households' deposits
to households' credits equaled
231.5% and points to the
conclusion that there is a room
for further deepening of the
banks' credit support for the
households.
2. Corporate sector
Enterprises are the most significant business partner of the financial institutions. The
exposure of the financial system to the corporate sector directly links the value of the assets
and the sources of the financial institutions with the business decisions and the enterprises'
operations. At the same time, there is a direct link between the corporate sector and the
households. The corporate sector covers around 60% of the total number of employees, thus
directly influencing households' disposable income. On the other hand, the demand for the
products of the corporate sector is directly linked with the households' personal consumption.
Just as in the households' sector, the analysis of the corporate sector focuses primarily
on its exposure to various risks and the ability to manage those risks.
2.1. Analysis of the developments in the corporate sector
The increase in the total activities, capital position, liquidity, profitability, and level
of indebtedness of the corporate sector are the main elements for assessment of its financial
condition.
45
For comparison, in the period 2002-2004 in Slovenia, the share of the households' net savings in the
GDP ranged between 20% and 27.6%.
12.4%
12.1%
12.7%
13.4%
10.0%
10.5%
11.0%
11.5%
12.0%
12.5%
13.0%
13.5%
14.0%
-40,000
-20,000
0
20,000
40,000
60,000
80,000
2003 2004 2005 2006
Figure 19
Households' net-saving and its ratio to GDP
Loans (left-hand scale) Deposits (left-hand scale)
Net-saving (left-hand scale) Net-saving/GDP
0.0%
50.0%
100.0%
150.0%
200.0%
250.0%
300.0%
350.0%
0.0%
10.0%
20.0%
30.0%
40.0%
50.0%
60.0%
70.0%
2004 2005 2006
Figure 20
Growth rates of households' loans and deposits
and trend of the deposits/loans ratio
Loans (left-hand scale) Deposits (left-hand scale)
Deposits/Loans

28
At the end of 2006, the total assets of the corporate sector stood at Denar 912,729
million, which is an annual increase of Denar 80,151 million or 9.6%46
.
Table 6
Balance sheet of the corporate sector
BALANCE SHEET
ASSETS:2005 2006 2005 2006
absolute
ammountin %
share in the
change
Subscribed, but not paid-up capital 552 568 0.1% 0.1% 16 2.9% 0.0%
Fixed assets 453,702 487,171 54.5% 53.4% 33,469 7.4% 41.8%
Current assets 356,638 409,865 42.8% 44.9% 53,228 14.9% 66.4%
Inventories 105,443 118,134 29.6% 28.8% 12,692 12.0% 23.8%
Short-term receivables 197,114 221,345 55.3% 54.0% 24,231 12.3% 45.5%
Short-term financial investments 32,506 41,980 9.1% 10.2% 9,474 29.1% 17.8%
Cash and securities 21,575 28,406 6.0% 6.9% 6,831 31.7% 12.8%
Prepayments and accrued income 21,686 15,124 2.6% 1.7% -6,561 -30.3% -8.2%
TOTAL ASSETS 832,578 912,729 100.0% 100.0% 80,151 9.6% 100.0%
LIABILITIES
Capital and reserves 438,582 457,672 52.7% 50.1% 19,089 4.4% 23.8%
Long term provisions for risks and expences 704 4,124 0.1% 0.5% 3,420 485.9% 4.3%
Long-term and short-term payables 365,392 430,128 43.9% 47.1% 64,736 17.7% 80.8%
Accrued expences and deffered revenue 27,900 20,805 3.4% 2.3% -7,095 -25.4% -8.9%
TOTAL LIABILITIES 832,578 912,729 100.0% 100.0% 80,151 9.6% 100.0%
Ammount in millions of
denarsStructure Annual change
The analysis of the balance sheet of the corporate sector points to a relatively simple
structure of its assets and liabilities. At the end of 2006, somewhat more than half of the total
assets account for the fixed and around 45% for the current assets. Fixed and current assets
caused the largest portion of the annual increment in the enterprises' total assets. Dominant
within current assets are the short-term claims (primarily claims on buyers), with a share of
54%.
On the part of the liabilities, dominant are capital and reserves from which enterprises
financed over 50% of the total assets at the end of 2006. The high share of capital and
reserves in the total sources of funds provides high degree of financial security of the
corporate sector. Such capitalization level contributes to a relatively low sensitivity of the
corporate sector to external shocks which could reduce its payment ability and profitability
and reflect indirectly by deteriorating its creditworthiness. This is especially important for the
financial stability, as the deteriorated creditworthiness of the corporate sector, on its part,
would reflect on the level of credit risk the financial institutions, primarily banks are exposed
to. On the other hand the share of the total credits in the total sources of funds and in the total
liabilities of the corporate sector is relatively low and at the end of 2006 it equaled 7.3%, i.e.
14.6%, respectively. This points to the conclusion that, on aggregate level, there is a room for
increasing the credit support for the corporate sector. At the same time, the increased credit
support would contribute to the improvement of the structure of the liabilities of the corporate
sector and will represent a possibility for better liquidity management and timely settlement
of the other due claims of the companies.
Table 7
Indicators of the operations of the corporate sector47
Ratio 2002 2003 2004 2005 2006 2005* 2006*
1 Equity ratio - equity and reserves/total assets 50.9% 53.1% 51.8% 51.9% 50.1% 53.8% 52.1%
2 Self-financing ratio - capital and reserves+ long-
term provisions/fixed assets+inventories 73.9% 77.1% 75.2% 77.5% 76.3% 86.1% 84.6%
3 Quick ratio (acid test) 0.7 0.7 0.7 0.8 0.8 0.9 0.9
4 Current ratio 1.0 1.0 1.0 1.1 1.1 1.3 1.3
5 Average collection period 157 151 128 130 122 117 107
6 Inventory period 77 75 74 70 65 63 60
7 Average payment period 258 246 227 223 214 179 175
8 Profit margin (net) 0.9% 2.9% 2.9% 6.6% 3.6% 15.3% 14.0%
9 Net profit per employee (in 000 denars) 7.4 25.1 26.9 68.6 44.3 177.0 178.0
10 Return on equity (ROAE) 0.5% 1.7% 1.9% 4.2% 2.7% 9.8% 10.0%
11 Return on assets (ROAA) 0.3% 0.9% 1.0% 2.2% 1.4% 5.3% 5.2%
* The ratios refer only to enterprises working with profit
46
Source: Central Registry of the Republic of Macedonia. The analysis was made on the basis of the
data from the annual statements for 2006. 47
Source: Central Registry of RM and NBRM calculations.
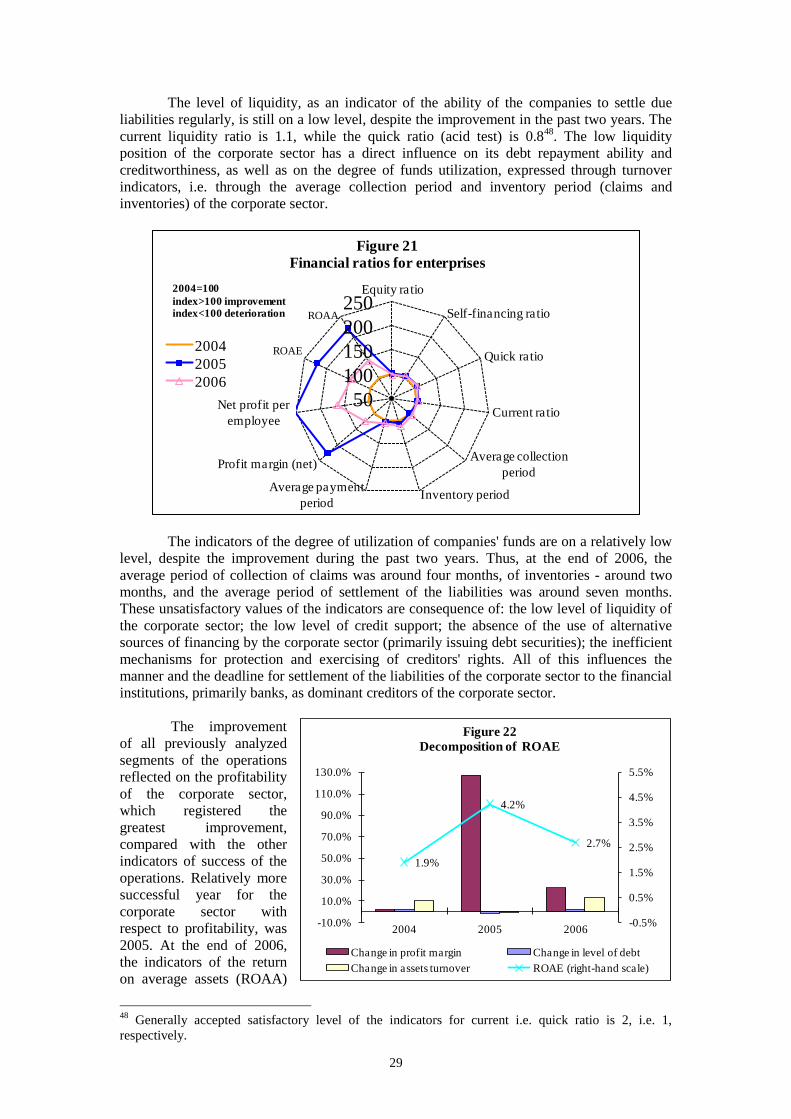
29
The level of liquidity, as an indicator of the ability of the companies to settle due
liabilities regularly, is still on a low level, despite the improvement in the past two years. The
current liquidity ratio is 1.1, while the quick ratio (acid test) is 0.848
. The low liquidity
position of the corporate sector has a direct influence on its debt repayment ability and
creditworthiness, as well as on the degree of funds utilization, expressed through turnover
indicators, i.e. through the average collection period and inventory period (claims and
inventories) of the corporate sector.
The indicators of the degree of utilization of companies' funds are on a relatively low
level, despite the improvement during the past two years. Thus, at the end of 2006, the
average period of collection of claims was around four months, of inventories - around two
months, and the average period of settlement of the liabilities was around seven months.
These unsatisfactory values of the indicators are consequence of: the low level of liquidity of
the corporate sector; the low level of credit support; the absence of the use of alternative
sources of financing by the corporate sector (primarily issuing debt securities); the inefficient
mechanisms for protection and exercising of creditors' rights. All of this influences the
manner and the deadline for settlement of the liabilities of the corporate sector to the financial
institutions, primarily banks, as dominant creditors of the corporate sector.
The improvement
of all previously analyzed
segments of the operations
reflected on the profitability
of the corporate sector,
which registered the
greatest improvement,
compared with the other
indicators of success of the
operations. Relatively more
successful year for the
corporate sector with
respect to profitability, was
2005. At the end of 2006,
the indicators of the return
on average assets (ROAA)
48
Generally accepted satisfactory level of the indicators for current i.e. quick ratio is 2, i.e. 1,
respectively.
50
100
150
200
250Equity ratio
Self-financing ratio
Quick ratio
Current ratio
Average collection
period
Inventory periodAverage payment
period
Profit margin (net)
Net profit per
employee
Figure 21
Financial ratios for enterprises
2004
2005
2006
2004=100
index>100 improvement index<100 deterioration
ROAE
ROAA
1.9%
4.2%
2.7%
-0.5%
0.5%
1.5%
2.5%
3.5%
4.5%
5.5%
-10.0%
10.0%
30.0%
50.0%
70.0%
90.0%
110.0%
130.0%
2004 2005 2006
Figure 22
Decomposition of ROAE
Change in profit margin Change in level of debt
Change in assets turnover ROAE (right-hand scale)

30
and the return on average equity (ROAE) equaled 1.4% and 2.7% respectively, which is a
decline of 0.8 and 1.5 percentage points relative to 2005. The decomposition49
of ROAE
points to the conclusion that in 2006 and especially in 2005, the improved profitability was
almost entirely a result of the improved profitability margin, which on its part was mainly a
result of the increased profit registered by the enterprises.
Survey on the business tendencies in processing industry, construction and retail trade
In April 2001, SSO started to
conduct a Survey on the business
tendencies in manufacturing (on a
monthly basis), and in April 2002
Surveys on the business tendencies
in construction and retail trade (on a
quarterly basis). These Surveys
should produce quality information
obtained from the managers of the
companies concerning their
assessment of the current business
condition and the main economic
indicators of the operations of their
companies, as well as their
expectations about the movement of
the indicators in near future (in the
following 3-4 months). The results
are presented in the form of a
balance (expressed in %), which is
the difference between the positive
and negative answers weighted with
the number of employees and the
realized value of each business
entity.
The results from the Surveys show
that the managers from retail trade
have the most positive assessments
and expectations, which is in line
with the increased turnover and
stable employment in the sector,
during 2005 and 2006. The
assessments and expectations of the
managers in construction are less
positive, which corresponds with the
trend of employment and value
added in this sector. During 2005
and 2006, the construction
registered a continuous trend of
decline in the employed persons,
while the value added at the end of
both years registered negative
growth rates. Most pessimistic
expectations are those of the
managers in the manufacturing,
especially with respect to the
49
ROAE indicator may be presented as follows:
LOAPMCR
A
S
S
S
P
A
A
S
S
CR
PROAE ******
where P=profit, CR=average capital and reserves, S=sale (income from sale), A=average assets,
PM=profit margin, OA=assets turnover and L=leverage or debt.
-15
-10
-5
0
5
10
15
20
25
I.'04 II III IV I.'05 II III IV I.'06 II III IV I.'07
Bal
ance
s in
%
Figure 23
Business tendencies in processing industry
Assesment of the current business condition in the enterprises
Expectations on the volume of production in the following 3 -4 months
Expectations on the number of employess in the following 3 -4 months
0
5
10
15
20
25
30
I.'04 II III IV I.'05 II III IV I.'06 II III IV I.'07
Bal
ance
s in
%
Figure 24
Business tendences in construction
Assesment of the current business condition in the enterprises
Expectations on the total volume of orders (deals) in the following 3 -4 months
Expectations on the number of employess in the following 3 -4 months
0
5
10
15
20
25
I.'04 II III IV I.'05 II III IV I.'06 II III IV I.'07
Bal
ance
s in
%
Figure 25
Business tendencies in retail trade
Assesment of the current business condition in the enterprises
Expectations on the business condition in the following 6 months
Expectations on the number of employess in the following 3-4 months

31
number of employees as a result of which throughout the entire analyzed period (2004-2006), the
balance of this indicator has a negative value. This is a reflection of the continuous decline in the
number of employees in this sector (from around 86 thousand in the beginning of 2004 to around 76
thousand at the end of 2006).
The managers of all three analyzed sectors point to the insufficient demand as the main
restrictive factor impeding the improvement of the business condition of the companies. Increased
competition and lack of qualified labor are most frequently listed as additional restrictive factors.
2.2. Debt of the corporate sector
The degree of indebtedness50
of the corporate sector indicates the level of dependence
of the corporate sector on external sources of financing, as well as its debt servicing ability.
At the end of 2006, the total debt of the corporate sector stood at Denar 103,524 million
which was an increase of Denar 20,806 million, or 25.2% relative to the end of 2005. From a
viewpoint of the creditors, there were no significant structural movements in the total debt.
Such an increase was primarily a result of the emphasized credit support51
provided by the
banking sector, which just as in the end of 2005, was the largest creditor of the corporate
sector, with a share of over 70% in the total debt. At the same time, the increased debt to
banks caused 71.3% of the increase in the total companies' debt.
Table 8
Total debt of the corporate sector
Non-residents were the second largest creditor with a share of 27.9% in the total
companies' debt. At the end of 2006, companies' external debt went up by Denar 5,340
million or by 22.7%, thus causing 25.7% of the total increase in the corporate debt.
In spite of the increase of 38.9% in the value of the leasing agreements, at the end of
2006, the share of this type of debt in the total corporate debt was minimal and equaled 2,2%.
Debt with currency component (in foreign exchange and in Denars with FX clause)
prevails in the currency structure of the total corporate debt with around 65%. At the end of
2006, this debt registered an annual increase of Denar 13,825 million or 26.2%, which caused
68.5% of the increase in the total corporate debt. This could be a signal for larger sensitivity
of the corporate sector to the changes in exchange rates, i.e. its exposure to the foreign
exchange risk.
50
For the needs of this analysis, the total debt of the corporate sector encompasses the total borrowings
from domestic banks, debt on the basis of leasing contracts with domestic leasing companies and the
total borrowings from abroad (from non-residents). The amount of debt on the basis of leasing, at the
end of 2005, was obtained as an arithmetical mean of the values at the end of 2004 and 2006 (there are
available data on the value of the active leasing contracts only for 2004 and 2006). Having in mind the
relatively low share of leasing in the total debt of the corporate sector, such a manner of calculation
does not significantly influence the amount and the structure of the total debt of the corporate sector. 51
Credit support denotes the total credit exposure of the corporate sector, including the extended
credits, guarantees, letters of credit and other claims.
Ammount
in million
of denars
Structure Ammount
in million
of denars
Structure In million
of denars
In % In the
structure
(in p.p.)
Share in
the
change
Banks 57,590 69.6% 72,419 69.9% 14,829 25.7% 0.3 71.3%
Leasing 1,613 2.0% 2,240 2.2% 628 38.9% 0.2 3.0%
External debt 23,515 28.4% 28,865 27.9% 5,349 22.7% -0.5 25.7%
TOTAL 82,718 100.0% 103,524 100.0% 20,806 25.2% 100.0%
31.12.2005 31.12.2006 Change

32
Table 9
Currency structure of the corporate debt52
Ammount
in millions
of denars
Structure Absolute
change
Change in
%
Ammount
in millions
of denars
Structure Absolute
change
Change in
%
Denar 28,429 35.0% -824 -2.8% 34,782 34.3% 6,353 22.3%
FX 45,490 56.1% 10,922 31.6% 56,940 56.2% 11,449 25.2%
FX clause 7,186 8.9% 1,117 18.4% 9,563 9.5% 2,376 33.1%
Total 81,105 100.0% 11,216 16.0% 101,284 100.0% 20,178 24.9%
2005 2006
Type of exposure
From the viewpoint of the maturity of the corporate debt, long-term credits are
dominant, with a share of 64% of the total debt at the end of 2006, which is an increase of 7.3
percentage points relative to the end of 2005. Long-term credits registered the highest growth
rate, relative to the other credits of the corporate sector. Their annual growth rate was 40.1%,
as opposed to 30.7% during 2005. Throughout the past few years the maturity of the corporate
credits increased, which, inter alia, reflects the more appropriate structuring of the credit
arrangements by the banks, which correspond better with the business cycles of the
companies. For comparison, in the beginning of the transition period, in conditions of
insufficient legal security and absence of financial discipline, banks practiced approval of
credits to enterprises with shorter maturities, which due to the inappropriate maturity
structuring were subject to numerous extensions.
Table 10
Term structure of the corporate debt53
Ammount
in millions
of denars
Structure Absolute
change
Change in
%
Ammount
in millions
of denars
Structure Absolute
change
Change in
%
Short-term loans 20,277 28.9% 1,082 5.6% 21,866 25.1% 1,588 7.8%
Long-term loans 39,806 56.7% 9,343 30.7% 55,784 64.0% 15,978 40.1%
Other loans (due and non-performing) 10,116 14.4% 644 6.8% 9,501 10.9% -615 -6.1%
Total 70,199 100.0% 11,070 18.7% 87,151 100.0% 16,951 24.1%
Type of exposure
2005 2006
The high share of the long-term debt in the total debt means longer encumbrance for
the corporate sector with costs for its financing, but also a possibility to distribute the
liabilities over a longer period, thus enabling further borrowing of enterprises.
The long-term character of the debt is reflected also with longer exposure of the
corporate sector to changes in the interest rates. The credit exposure of the corporate sector to
the non-residents is an indicator primarily of the level of exposure of the corporate sector to
the risk of changes in the interest rates on the foreign markets. In conditions of rising interest
rates on the world markets, the burden for the corporate sector rises by increasing its costs for
debt servicing, having in mind that 57.4% of the total private external debt is characterized
with a variable interest rate. The exposure of the corporate sector to the interest rate risk is
even more emphasized, if one takes into consideration that the largest portion of the credits
from the domestic banks are extended at interest rates that vary depending on their policies.
The possible upward trend in the interest rates would imply increasing of the expenses for
debt servicing, which could have an adverse effect on the creditworthiness of the companies.
2.2.1. Debt to the banking sector
The credit support by the domestic banks is the most significant external source of
financing the activities of the corporate sector. At the end of 2006, the total corporate debt to
the banking sector equaled Denar 72,419 million, which is an annual increase of Denar
14,829 million or 25.7%.
52
The calculations do not include debt on the basis of leasing, as there are no data on its currency
structure.
53 Total debt includes: borrowings from the banking sector and the total debt to non-residents.

33
Despite the
increase in the credit
exposure to the
corporate sector,
financial
intermediation, as a
ratio of total corporate
credits to GDP is still
on a low level and
represents 19.2%
(2005: 16.4%). This
indicator is especially
low in comparison
with the countries of
the Euro-zone (EMU-
12) and the European
Union (EU-25), where
at the end of 2005 it
equaled 42.6% and 39.7%, respectively. However, the comparative analysis with individual
EU NMS54
indicates significantly smaller differences, with an exception of Slovenia, Latvia
and Malta, where this indicator equaled 40.3%, 39.9% and 74.4%, respectively.
From a viewpoint of the share of the credit exposure of the corporate sector in the
banks' total credit activity, also there are significant differences between the Republic of
Macedonia and the other countries. The share of the credit support for the corporate sector in
the credit exposure of the banking systems of most NMS (except Slovenia, Lithuania and
Latvia)55
, is lower than 50%, while at the level of the Euro-zone and the EU, this share was
34.5% and 31.6%, respectively, at the end of 2005. On the other hand, the share of the
exposure to the corporate sector in the banks' total credit exposure in the Republic of
Macedonia equaled 64.9% at the end of 2006. The relatively higher share of the exposure to
the corporate sector in the banks' total credit exposure is mostly explained with the restricted
use of alternative ways of financing the activities by the companies in the Republic of
Macedonia. However, in conditions of emphasized orientation of the banks toward lending to
households, the share of the credit exposure to the corporate sector in the banks' total credit
exposure, registered a downward trend.
In the past few
years, on aggregate level,
companies are economic
agents that are net-debtor
against the banking sector.
At the end of 2006, the net
debt of the corporate sector,
calculated as a difference
between the total liabilities
(credits) and total claims
(deposits) of the corporate
sector on the banks stood at
Denar 12,581 million,
which is an increase of
54
At the end of 2005, the indicator by an individual NMS equaled: 13.2% in Poland, 18.8% in
Slovakia, 19.1% in the Czech Republic, 22.5% in Lithuania, 26.2% in Hungary and 30.5% in Estonia. 55
At the end of 2005, the indicator by an individual NMS equaled: 30.4% in Malta, 40% in Estonia,
41.5% in Poland, 46% in the Czech Republic, 48.7% in Slovakia, 50.7% in Hungary, 51.5% in Latvia,
52.7% in Lithuania and 65.3% in Slovenia.
4.1%3.9% 4.3% 4.1%
-6.0%
-4.0%
-2.0%
0.0%
2.0%
4.0%
6.0%
-60,000
-40,000
-20,000
0
20,000
40,000
60,000
2003 2004 2005 2006
in m
illio
ns
of
den
ars
Figure 27
Net-debt of the corporate sector and its ratio to GDP
Loans (left-hand scale) Deposits (left-hand scale)
Net-loans (left-hand scale) Net-loans/GDP
0%
10%
20%
30%
40%
50%
60%
70%
80%
0% 10% 20% 30% 40% 50% 60% 70% 80%
To
tal lo
ans
to c
orp
ora
te s
ecto
r/T
ota
l lo
ans
Total loans to corporate sector/GDP
Figure 26
Corporate sector debt to banks by countries
Macedonia 2006
Macedonia 2005
EU - 25
EMU - 12
Slovenia
Poland
Hungary
Malta
Estonia
Latvia
Czech R.
Lithuania
Slovakia
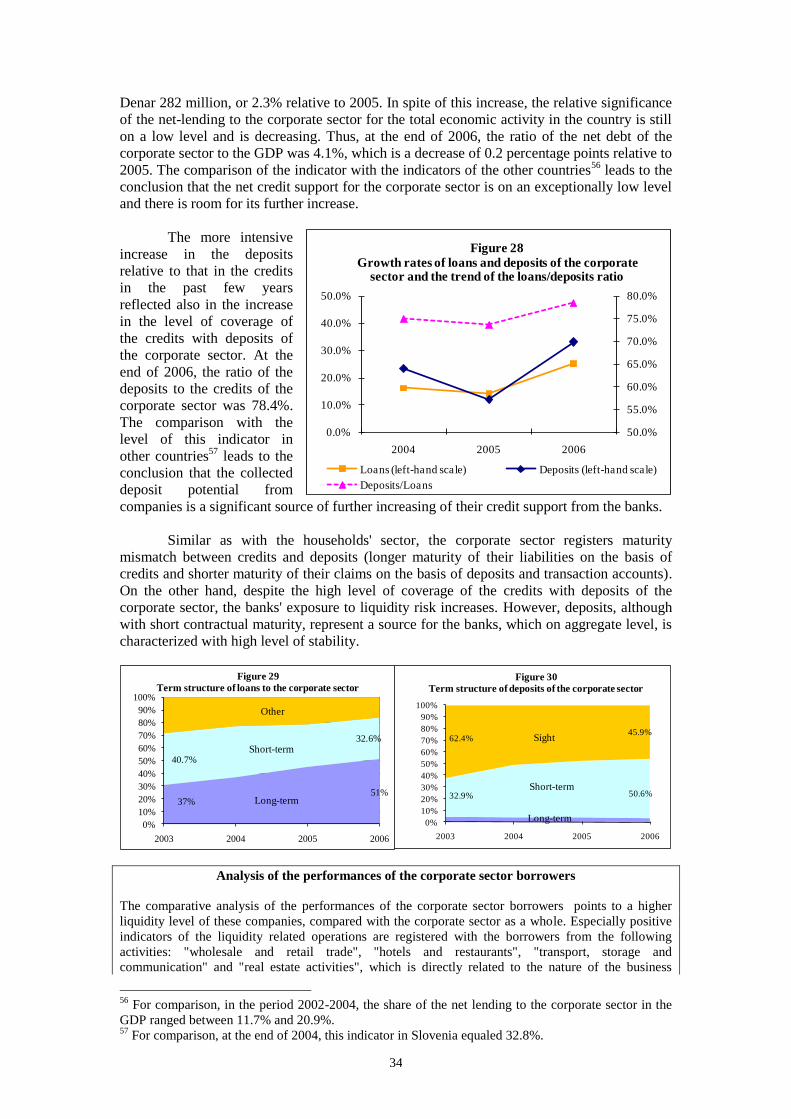
34
Denar 282 million, or 2.3% relative to 2005. In spite of this increase, the relative significance
of the net-lending to the corporate sector for the total economic activity in the country is still
on a low level and is decreasing. Thus, at the end of 2006, the ratio of the net debt of the
corporate sector to the GDP was 4.1%, which is a decrease of 0.2 percentage points relative to
2005. The comparison of the indicator with the indicators of the other countries56
leads to the
conclusion that the net credit support for the corporate sector is on an exceptionally low level
and there is room for its further increase.
The more intensive
increase in the deposits
relative to that in the credits
in the past few years
reflected also in the increase
in the level of coverage of
the credits with deposits of
the corporate sector. At the
end of 2006, the ratio of the
deposits to the credits of the
corporate sector was 78.4%.
The comparison with the
level of this indicator in
other countries57
leads to the
conclusion that the collected
deposit potential from
companies is a significant source of further increasing of their credit support from the banks.
Similar as with the households' sector, the corporate sector registers maturity
mismatch between credits and deposits (longer maturity of their liabilities on the basis of
credits and shorter maturity of their claims on the basis of deposits and transaction accounts).
On the other hand, despite the high level of coverage of the credits with deposits of the
corporate sector, the banks' exposure to liquidity risk increases. However, deposits, although
with short contractual maturity, represent a source for the banks, which on aggregate level, is
characterized with high level of stability.
37%51%
40.7%
32.6%
0%
10%
20%
30%
40%
50%
60%
70%
80%
90%
100%
2003 2004 2005 2006
Figure 29
Term structure of loans to the corporate sector
Long-term
Short-term
Other
32.9% 50.6%
62.4%45.9%
0%
10%
20%
30%
40%
50%
60%
70%
80%
90%
100%
2003 2004 2005 2006
Figure 30
Term structure of deposits of the corporate sector
Sight
Long-term
Short-term
Analysis of the performances of the corporate sector borrowers
The comparative analysis of the performances of the corporate sector borrowers points to a higher
liquidity level of these companies, compared with the corporate sector as a whole. Especially positive
indicators of the liquidity related operations are registered with the borrowers from the following
activities: "wholesale and retail trade", "hotels and restaurants", "transport, storage and
communication" and "real estate activities", which is directly related to the nature of the business
56
For comparison, in the period 2002-2004, the share of the net lending to the corporate sector in the
GDP ranged between 11.7% and 20.9%. 57
For comparison, at the end of 2004, this indicator in Slovenia equaled 32.8%.
50.0%
55.0%
60.0%
65.0%
70.0%
75.0%
80.0%
0.0%
10.0%
20.0%
30.0%
40.0%
50.0%
2004 2005 2006
Figure 28
Growth rates of loans and deposits of the corporate sector and the trend of the loans/deposits ratio
Loans (left-hand scale) Deposits (left-hand scale)
Deposits/Loans

35
activities of the companies from these branches. At the same time, borrowers from "processing
industry" and "wholesale and retail trade" registered improvement in their liquidity, compared with
2005.
Table 11
Indicators of the operations of the borrowers by activity*
Ratio
2005 2006 2005 2006 2005 2006 2005 2006 2005 2006 2005 2006 2005 2006 2005 2006 2005 2006 2005 2006
1
Equity ratio - equity and reserves/total assets 89.7% 89.6% 40.6% 40.6% 62.2% 60.5% 52.3% 49.7% 55.6% 54.7% 28.8% 24.9% 34.1% 36.8% 57.6% 58.7% 64.5% 60.9% 41.2% 47.2%
2
Self-financing ratio - capital and reserves+
long-term provisions/fixed assets+inventories 94.2% 94.1% 68.4% 69.7% 93.8% 85.8% 74.6% 74.5% 105.1% 89.5% 66.4% 66.0% 58.6% 62.2% 72.4% 75.1% 107.0% 110.4% 71.4% 83.9%
3 Quick ratio (acid test) 0.7 0.7 1.6 1.4 0.9 1.0 1.5 1.1 1.0 1.0 1.4 1.5 2.7 2.7 2.2 2.1 3.0 2.3
4 Current ratio 1.2 1.2 2.3 2.0 1.5 1.6 1.7 1.2 1.4 1.3 2.1 2.3 3.1 3.2 2.4 2.2 3.5 2.7
5 Average collection period 139 154 270 251 337 244 116 109 547 155 395 581 141 137 112 105 101 98 278 283
6 Inventory period 130 130 136 129 142 114 95 86 69 17 149 171 85 87 40 61 16 15 66 65
7 Average payment period 239 250 291 227 166 155 392 119 443 643 125 111 108 119 92 120 136 174
8 Profit margin (net) 0.3% 0.3% -0.1% 0.8% 0.4% 1.0% 0.7% 0.5% 0.0% 0.0% 1.0% 0.6% 1.8% 1.9% -1.8% 26.8% 0.8% 0.9% 6.4% 5.9%
9 Return on equity (ROAE) 0.0% 0.0% -0.2% 1.1% 0.2% 0.7% 0.9% 0.8% 0.0% 0.0% 1.5% 0.2% 4.7% 1.2% -0.8% 3.0% 0.9% 0.3% 6.0% 5.3%
10 Return on assets (ROAA) 0.0% 0.0% -0.1% 0.5% 0.1% 0.4% 0.5% 0.4% 0.0% 0.0% 0.4% 0.1% 1.6% 0.4% -0.5% 1.8% 0.6% 0.2% 2.5% 2.4%
11 Share in the total credit exposure of banks 1.5% 1.6% 0.0% 0.0% 0.7% 0.6% 16.1% 15.5% 0.5% 1.1% 4.2% 3.9% 12.5% 12.5% 1.1% 1.2% 2.3% 2.7% 1.9% 1.4%
12Share in the total credit exposure of banks to
enterprises 3.6% 3.9% 0.0% 0.0% 1.7% 1.4% 39.4% 38.3% 1.2% 2.7% 10.4% 9.6% 30.6% 30.8% 20.7% 3.1% 5.6% 6.6% 4.7% 3.5%
Agriculture,
hunting and
forestry
Fishing Mining and
quarrying
Processing
industry
Transport,
storage and
communication
Real estateElectricity, gas
and water
supply
Construction Wholesale and
retail
Hotels and
restaurants
Source: Central Securities Depositary and NBRM calculations. The calculations are on the basis of the annual
statements for 2006.
Especially positive indicators of the profitability are registered with the borrowers from the following
activities: "hotels and restaurants" and "real estate activities" where the profit margin and the ROAE
and ROAA indicators are above the average for the whole corporate sector, at the end of 2006. In
general, as well as on the level of the overall corporate sector, from the viewpoint of profit creation,
2005 was a more successful year for the borrowers from almost all activities. At the end of 2006,
improvement was registered in the profitability indicators of the borrowers from the following
activities: "fishing", "mining and quarrying" and "hotels and restaurants".
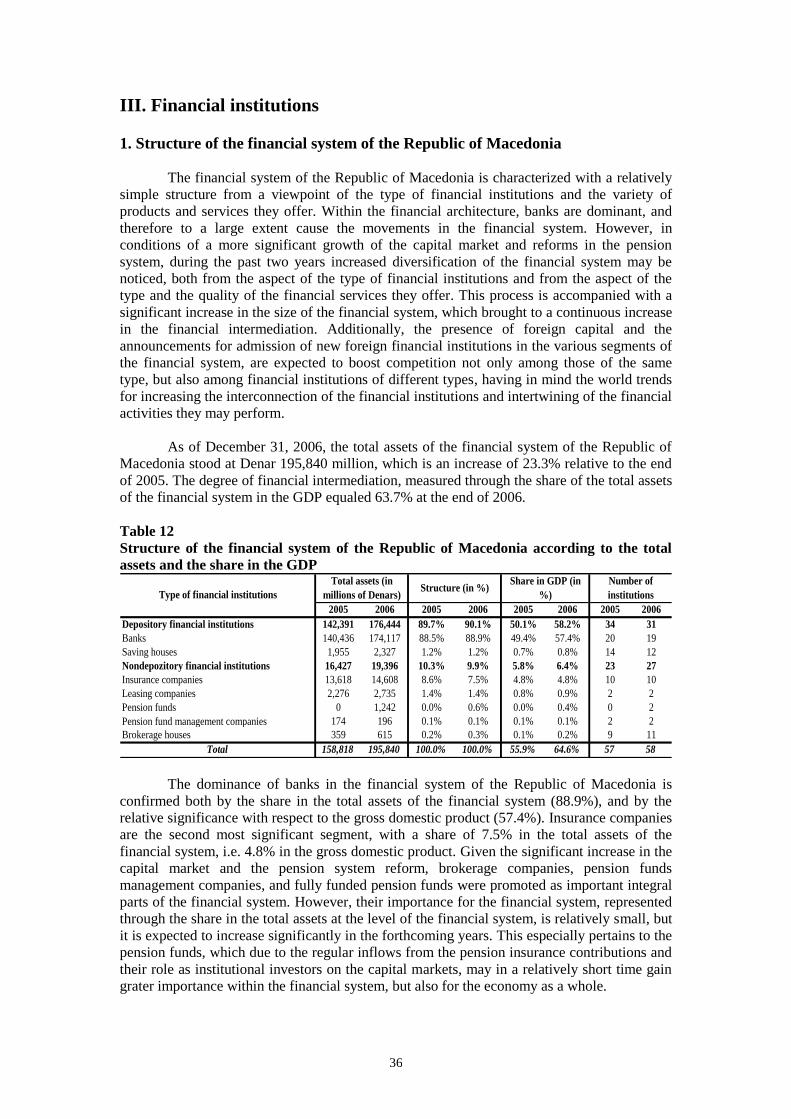
36
III. Financial institutions
1. Structure of the financial system of the Republic of Macedonia
The financial system of the Republic of Macedonia is characterized with a relatively
simple structure from a viewpoint of the type of financial institutions and the variety of
products and services they offer. Within the financial architecture, banks are dominant, and
therefore to a large extent cause the movements in the financial system. However, in
conditions of a more significant growth of the capital market and reforms in the pension
system, during the past two years increased diversification of the financial system may be
noticed, both from the aspect of the type of financial institutions and from the aspect of the
type and the quality of the financial services they offer. This process is accompanied with a
significant increase in the size of the financial system, which brought to a continuous increase
in the financial intermediation. Additionally, the presence of foreign capital and the
announcements for admission of new foreign financial institutions in the various segments of
the financial system, are expected to boost competition not only among those of the same
type, but also among financial institutions of different types, having in mind the world trends
for increasing the interconnection of the financial institutions and intertwining of the financial
activities they may perform.
As of December 31, 2006, the total assets of the financial system of the Republic of
Macedonia stood at Denar 195,840 million, which is an increase of 23.3% relative to the end
of 2005. The degree of financial intermediation, measured through the share of the total assets
of the financial system in the GDP equaled 63.7% at the end of 2006.
Table 12
Structure of the financial system of the Republic of Macedonia according to the total
assets and the share in the GDP
2005 2006 2005 2006 2005 2006 2005 2006
Depository financial institutions 142,391 176,444 89.7% 90.1% 50.1% 58.2% 34 31
Banks 140,436 174,117 88.5% 88.9% 49.4% 57.4% 20 19
Saving houses 1,955 2,327 1.2% 1.2% 0.7% 0.8% 14 12
Nondepozitory financial institutions 16,427 19,396 10.3% 9.9% 5.8% 6.4% 23 27
Insurance companies 13,618 14,608 8.6% 7.5% 4.8% 4.8% 10 10
Leasing companies 2,276 2,735 1.4% 1.4% 0.8% 0.9% 2 2
Pension funds 0 1,242 0.0% 0.6% 0.0% 0.4% 0 2
Pension fund management companies 174 196 0.1% 0.1% 0.1% 0.1% 2 2
Brokerage houses 359 615 0.2% 0.3% 0.1% 0.2% 9 11
Total 158,818 195,840 100.0% 100.0% 55.9% 64.6% 57 58
Number of
institutionsType of financial institutions
Total assets (in
millions of Denars)Structure (in %)
Share in GDP (in
%)
The dominance of banks in the financial system of the Republic of Macedonia is
confirmed both by the share in the total assets of the financial system (88.9%), and by the
relative significance with respect to the gross domestic product (57.4%). Insurance companies
are the second most significant segment, with a share of 7.5% in the total assets of the
financial system, i.e. 4.8% in the gross domestic product. Given the significant increase in the
capital market and the pension system reform, brokerage companies, pension funds
management companies, and fully funded pension funds were promoted as important integral
parts of the financial system. However, their importance for the financial system, represented
through the share in the total assets at the level of the financial system, is relatively small, but
it is expected to increase significantly in the forthcoming years. This especially pertains to the
pension funds, which due to the regular inflows from the pension insurance contributions and
their role as institutional investors on the capital markets, may in a relatively short time gain
grater importance within the financial system, but also for the economy as a whole.
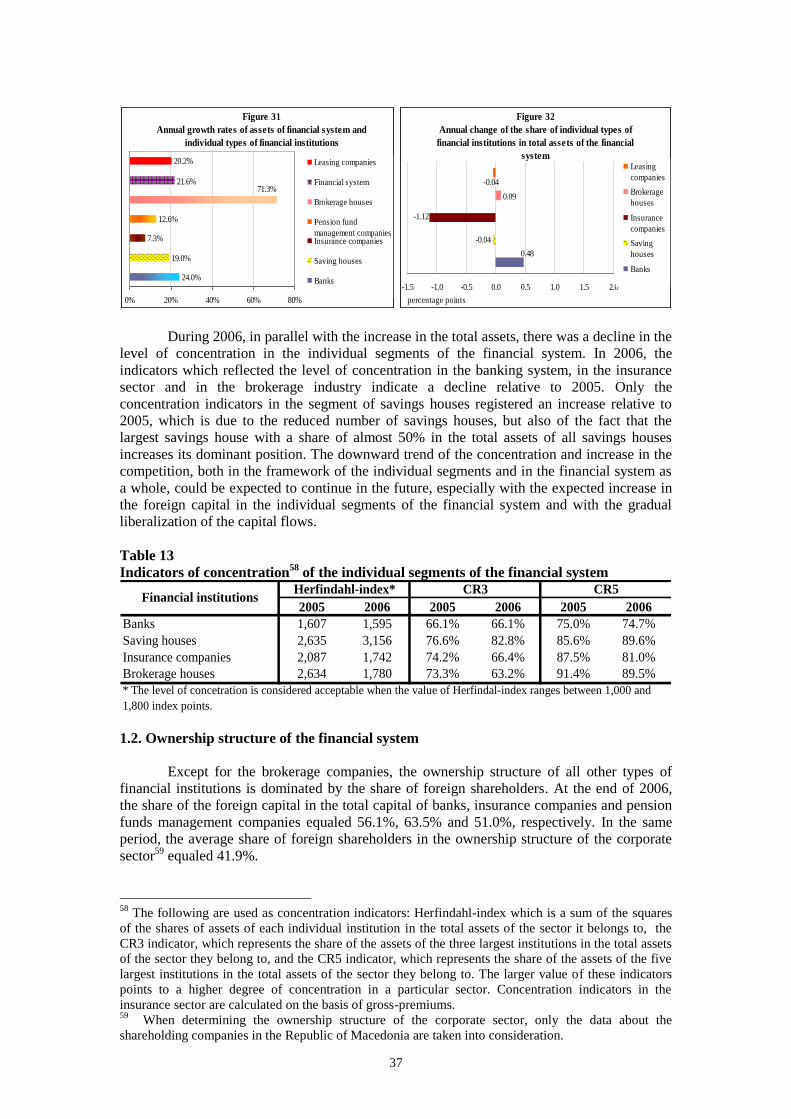
37
During 2006, in parallel with the increase in the total assets, there was a decline in the
level of concentration in the individual segments of the financial system. In 2006, the
indicators which reflected the level of concentration in the banking system, in the insurance
sector and in the brokerage industry indicate a decline relative to 2005. Only the
concentration indicators in the segment of savings houses registered an increase relative to
2005, which is due to the reduced number of savings houses, but also of the fact that the
largest savings house with a share of almost 50% in the total assets of all savings houses
increases its dominant position. The downward trend of the concentration and increase in the
competition, both in the framework of the individual segments and in the financial system as
a whole, could be expected to continue in the future, especially with the expected increase in
the foreign capital in the individual segments of the financial system and with the gradual
liberalization of the capital flows.
Table 13
Indicators of concentration58
of the individual segments of the financial system
2005 2006 2005 2006 2005 2006
Banks 1,607 1,595 66.1% 66.1% 75.0% 74.7%
Saving houses 2,635 3,156 76.6% 82.8% 85.6% 89.6%
Insurance companies 2,087 1,742 74.2% 66.4% 87.5% 81.0%
Brokerage houses 2,634 1,780 73.3% 63.2% 91.4% 89.5%
* The level of concetration is considered acceptable when the value of Herfindal-index ranges between 1,000 and
1,800 index points.
Financial institutionsHerfindahl-index* CR3 CR5
1.2. Ownership structure of the financial system
Except for the brokerage companies, the ownership structure of all other types of
financial institutions is dominated by the share of foreign shareholders. At the end of 2006,
the share of the foreign capital in the total capital of banks, insurance companies and pension
funds management companies equaled 56.1%, 63.5% and 51.0%, respectively. In the same
period, the average share of foreign shareholders in the ownership structure of the corporate
sector59
equaled 41.9%.
58
The following are used as concentration indicators: Herfindahl-index which is a sum of the squares
of the shares of assets of each individual institution in the total assets of the sector it belongs to, the
CR3 indicator, which represents the share of the assets of the three largest institutions in the total assets
of the sector they belong to, and the CR5 indicator, which represents the share of the assets of the five
largest institutions in the total assets of the sector they belong to. The larger value of these indicators
points to a higher degree of concentration in a particular sector. Concentration indicators in the
insurance sector are calculated on the basis of gross-premiums. 59
When determining the ownership structure of the corporate sector, only the data about the
shareholding companies in the Republic of Macedonia are taken into consideration.
Figure 31
Annual growth rates of assets of financial system and
individual types of financial institutions
20.2%
21.6%
12.6%
7.3%
19.0%
24.0%
71.3%
0% 20% 40% 60% 80%
Leasing companies
Financial system
Brokerage houses
Pension fund
management companiesInsurance companies
Saving houses
Banks
Figure 32
Annual change of the share of individual types of
financial institutions in total assets of the financial
system
-0.04
-1.12
0.09
-0.04
0.48
-1.5 -1.0 -0.5 0.0 0.5 1.0 1.5 2.0
percentage points
Leasing
companies
Brokerage
houses
Insurance
companies
Saving
houses
Banks

38
On the other hand, dominant in the structure of the domestic shareholders of financial
institutions were the non-financial legal entities, whose share at the end of 2006 was most
significant in the ownership structure of the brokerage companies with 26.9% and of the
banking sector with 23.4%. In conditions of a lack of domestic institutional investors, the
share of the domestic natural persons as shareholders in the individual institutions within the
financial system, was relatively high and ranged between 9.3% with banks and 15.9% with
the insurance companies. Cross-sector ownership60
among the individual institutions that
make the financial system of the Republic of Macedonia is on a relatively low level. Banks
directly own 49% of the capital of the pension funds management companies and 48.2% of
the capital of the brokerage companies. During 2006, one insurance company became a
dominant owner of a brokerage company61
, which is the first larger integration of the non-
banking financial institutions in the Republic of Macedonia.
Table 14
Ownership structure of the individual financial institutions
Shareholders BanksInsurance
companies
Brokerage
houses
Pension fund
management
companies
Nonfinancial
shareholder
companies
Domestic shareholders 43.9% 36.5% 92.4% 49.0% 58.1%
Nonfinancial legal entities 23.4% 6.7% 26.9% 0.0% 18.0%
Banks 2.9% 4.1% 48.2% 49.0% 0.4%
Insurance companies 0.8% 0.8% 1.4% 0.0% 0.2%
Other financial institutions 0.6% 0.1% 2.7% 0.0% 0.1%
Natural persons 9.3% 15.9% 13.2% 0.0% 28.4%
Public sector 6.9% 8.9% 0.0% 0.0% 11.0%
Foreign shareholders 56.1% 63.5% 7.6% 51.0% 41.9%
Natural persons 3.1% 0.1% 5.3% 0.0% 0.9%
Legal entities 53.0% 63.4% 2.3% 51.0% 41.0%
Total 100.0% 100.0% 100.0% 100.0% 100.0%
As a result of the business strategies of the financial institutions, but also of certain
regulatory restrictions, the share of the financial institutions in the ownership structure of the
corporate sector is quite low (as of December 31, 2006, the share of the financial institutions
in the ownership structure of the domestic non-financial shareholding companies equaled
0.7%).
With the admission of several foreign strategic investors in the financial system of the
Republic of Macedonia, which occurred in the first half of 200762
, the share of foreign capital
in the ownership structure of the financial system, and hence its importance, increased even
further.
As of December 31, 2006, financial institutions which were in dominant ownership of
foreign shareholders63
prevailed in the total number of institutions in the sector "insurance",
the sector of leasing companies and pension funds management companies. Insurance
companies in dominant ownership of foreign shareholders had a relatively larger share in the
total assets and in the total capital at the level of the sector, relative to the same indicators
with banks. As of end 2006, all leasing companies and pension funds management companies
were in dominant ownership of foreign shareholders.
60
Cross-sector ownership denotes ownership holdings of the individual types of financial institutions in
other financial institutions, i.e. in the individual institutional segments of the financial system. 61
The insurance company „Tabak Osiguruvanje“ AD Skopje became the dominant owner of the
brokerage company „Brodil“ AD Skopje. 62
In the first half of 2007, "Societe Generale" became the dominant owner of "Ohridska Banka" AD
Ohrid, while the insurance companies from the Republic of Slovenia - "Sava RE" and "Zavarovalnica
Triglav" became dominant owners of the domestic insurance companies "Tabak Osiguruvanje" AD
Skopje and "Vardar Osiguruvanje“ AD Skopje. Additionally, there were foreign greenfield investments
in the sectors "insurance" and "leasing". 63
Financial institutions in dominant ownership of foreign shareholders are those institutions where
foreign shareholders own over 50% of the shareholders' capital.

39
Table 15
Relative significance of the institutions in dominant ownership of foreign shareholders
in the individual sectors of the financial system
2005 2006 2005 2006 2005 2006
Banks 8 8 51.3% 53.2% 49.1% 50.0%
Insurance companies 6 6 74.2% 72.6% 58.1% 60.9%
Leasing companies 2 2 100.0% 100.0% 100.0% 100.0%
Pension fund management
companies1 2 100.0% 100.0% 100.0% 100.0%
Brokerage houses 1 2 2.0% 3.5% 1.5% 5.1%
Financial institutions
Number of institutions in
dominant foreign ownership
Assets of institutions in dominant
foreign ownership /Total assets
Capital of institutions in dominant
foreign ownership /Total capital
1.3. Connection of the banks with non-deposit financial institutions
The financial system of the Republic of Macedonia is characterized with a relatively
low level of inter-sector connection and low level of cross-sector ownership among the
various sectors. This, on its part, creates a simple market structure free of complex financial
grupations which would simultaneously cover all segments of the financial system with their
services. The low level of connection of the financial system sectors, on the one hand, causes
a level of financial intermediation lower than the potential, absence of cross-selling of
financial products from various sectors and absence of complex financial instruments which
would be used for transferring and distributing the risks among the different sectors of the
financial system. On the other hand, however, the low level of connection among the sectors
decreases the possibility for spillover of the risks inherent to a particular sector to the other
segments of the financial system, thus reducing the possibility for a systemic crisis in the
financial system.
Having in mind the dominant position of the banks in the financial system, they are
also the main driving force of the connection with the other segments of the financial system.
Banks' capital investments are the most significant form of connection of the banking system
with the other segments of the financial system. At the end of 2006, 73.4% of the total value
of the banks' capital investments were in financial institutions from the Republic of
Macedonia, 21.6% were in entities belonging to the corporate sector, while 5.1% of the value
of the capital investments were in foreign entities. At the end of 2006, the largest portion of
the value of banks' capital investments (35.9%) were in other domestic banks, but only one of
those investments exceeded 50% of the capital of the bank in which the investment was
made64
.
Table 16
Banks' capital investments as of December 31, 2006
absolute amount
(in thousands of
Denars)
structure
(in %)
up to 5% of
the capital
5% to 25% of
the capital
25% to 50% of
the capital
50% to 75% of
the capital
over 75% of
the capital
Domestic banks 397,663 35.9% 9 1 - 1 -
Insurance companies 74,428 6.7% 4 - - - -
Brokerage houses 82,088 7.4% - - 2 - 3
Pension fund management companies 92,027 8.3% - - 2 - -
Other financial institutions (stock
exchange, securities depository, cliring
houses)
165,314 14.9% 25 23 - - -
Nonfinancial entities 238,752 21.6% 40 12 4 - -Capital investments in foreign entities 56,018 5.1% 9 - - - -
Total - capital investments 1,106,290 100.0% 87 36 8 1 3
Entities in which the investment was
made
Capital investments of banksNo. of capital investments according to share in capital of the entity in which the
investment was made
According to the share of the banks' capital holding in the capital of the entity in
which the investment was made, two thirds of all capital investments are below 5% of the
64
"Eurostandard Banka" AD Skopje owns 66.6% of the shares of "Postenska Banka" AD Skopje.
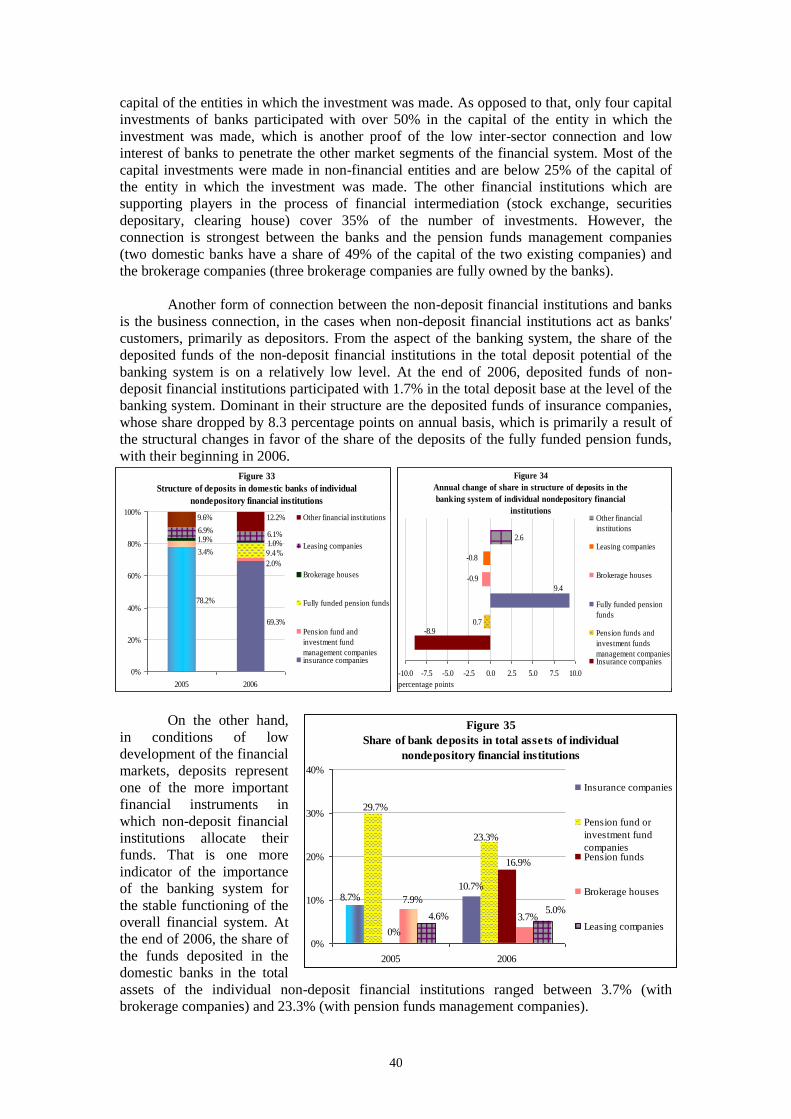
40
capital of the entities in which the investment was made. As opposed to that, only four capital
investments of banks participated with over 50% in the capital of the entity in which the
investment was made, which is another proof of the low inter-sector connection and low
interest of banks to penetrate the other market segments of the financial system. Most of the
capital investments were made in non-financial entities and are below 25% of the capital of
the entity in which the investment was made. The other financial institutions which are
supporting players in the process of financial intermediation (stock exchange, securities
depositary, clearing house) cover 35% of the number of investments. However, the
connection is strongest between the banks and the pension funds management companies
(two domestic banks have a share of 49% of the capital of the two existing companies) and
the brokerage companies (three brokerage companies are fully owned by the banks).
Another form of connection between the non-deposit financial institutions and banks
is the business connection, in the cases when non-deposit financial institutions act as banks'
customers, primarily as depositors. From the aspect of the banking system, the share of the
deposited funds of the non-deposit financial institutions in the total deposit potential of the
banking system is on a relatively low level. At the end of 2006, deposited funds of non-
deposit financial institutions participated with 1.7% in the total deposit base at the level of the
banking system. Dominant in their structure are the deposited funds of insurance companies,
whose share dropped by 8.3 percentage points on annual basis, which is primarily a result of
the structural changes in favor of the share of the deposits of the fully funded pension funds,
with their beginning in 2006.
On the other hand,
in conditions of low
development of the financial
markets, deposits represent
one of the more important
financial instruments in
which non-deposit financial
institutions allocate their
funds. That is one more
indicator of the importance
of the banking system for
the stable functioning of the
overall financial system. At
the end of 2006, the share of
the funds deposited in the
domestic banks in the total
assets of the individual non-deposit financial institutions ranged between 3.7% (with
brokerage companies) and 23.3% (with pension funds management companies).
Figure 33
Structure of deposits in domestic banks of individual
nondepository financial institutions
78.2%
69.3%
3.4%
2.0%
9.4%1.0%
1.9%6.9%
6.1%
9.6% 12.2%
0%
20%
40%
60%
80%
100%
2005 2006
Other financial institutions
Leasing companies
Brokerage houses
Fully funded pension funds
Pension fund and
investment fund
management companiesinsurance companies
Figure 34
Annual change of share in structure of deposits in the
banking system of individual nondepository financial
institutions
-8.90.7
9.4
-0.9
-0.8
2.6
-10.0 -7.5 -5.0 -2.5 0.0 2.5 5.0 7.5 10.0
percentage points
Other financial
institutions
Leasing companies
Brokerage houses
Fully funded pension
funds
Pension funds and
investment funds
management companiesInsurance companies
Figure 35
Share of bank deposits in total assets of individual
nondepository financial institutions
10.7%8.7%
29.7%
23.3%
0%
16.9%
3.7%
7.9%5.0%
4.6%
0%
10%
20%
30%
40%
2005 2006
Insurance companies
Pension fund or
investment fund
companiesPension funds
Brokerage houses
Leasing companies

41
The funds of non-deposit financial institutions deposited in the domestic banking
system are with relatively favorable maturity and currency structure, in which short-term
deposits, i.e. Denar deposits, are dominant. The large share of short-term deposits in the
maturity structure of the deposits of non-deposit financial institutions points to their relatively
good liquidity position. During 2006, the maturity of the assets of non-deposit financial
institutions increased, which was mostly a result of the deposits of the fully funded pension
funds (which account for 63% of the total amount of the long-term deposits of non-deposit
financial institutions). On the other hand, the significant difference between the interest rates
on Denar deposits and the interest rates on foreign currency deposits is one of the main
reasons for the significant share of the Denar deposits in the currency structure of the deposits
of non-deposit financial institutions. However, during 2006, increase in the share of the Denar
deposits with FX clause is evident.
2. Domestic financial markets
2.1. Money and short-term securities market
During 2006, the interest rates on the money and short-term securities market
continued to decline, although with far lower intensity in comparison with the decline which
occurred in the last quarter of 2005 and in the first quarter of 2006. The main driving force
behind the downward trends of interest rates, were the positive balance of payments
developments and the satisfactory liquidity of the banking system, which created favorable
framework for maintaining
the exchange rate stability
as an intermediary
monetary policy target.
During 2006, the CB bills
were issued through market
auctions of the "interest
rate tender" type. Lower
frequency of the CB bills
auctions and the smaller
amount offered, in
conditions of high liquidity
of the banking system,
contributed to an increased
demand for Treasury bills.
This caused a slight
downward trend in the
interest rates on Treasury bills during 2006. The decline in the short-term interest rates is a
process that is expected to continue in the future, inter alia, also as a reflection of the pace and
the dynamics of the integration of the Republic of Macedonia with the European Union.
Source: NBRM
Figure 36
Maturity structure of bank deposits of
nondepository financial institutions
16.2%24.9%
74.8%
72.4%
11.4%0.3%
0%
20%
40%
60%
80%
100%
2005 2006
Sight deposits Short-term deposits Long-term deposits
Figure 37
Currency structure of bank deposits of
nondepository financial institutions
81.1%89.4%
2.9% 11.3%
7.6%7.7%
0%
20%
40%
60%
80%
100%
2005 2006
Denar deposits Denar deposits with FX clause FX deposits
Figure 38
Movement of money market nterest rates in the Republic of
Macedonia on monthly basis
0%
2%
4%
6%
8%
10%
12%
jan
05
marc
h 0
5
may
05
july
05
sep
t 0
5
no
v 0
5
jan
06
marc
h 0
6
may
06
july
06
sep
t 0
6
no
v 0
6
jan
07
marc
h 0
7
Central bank bills Treasury bills (3 months)
Treasury bills (6 months) Interbank interest rate (monthly average)
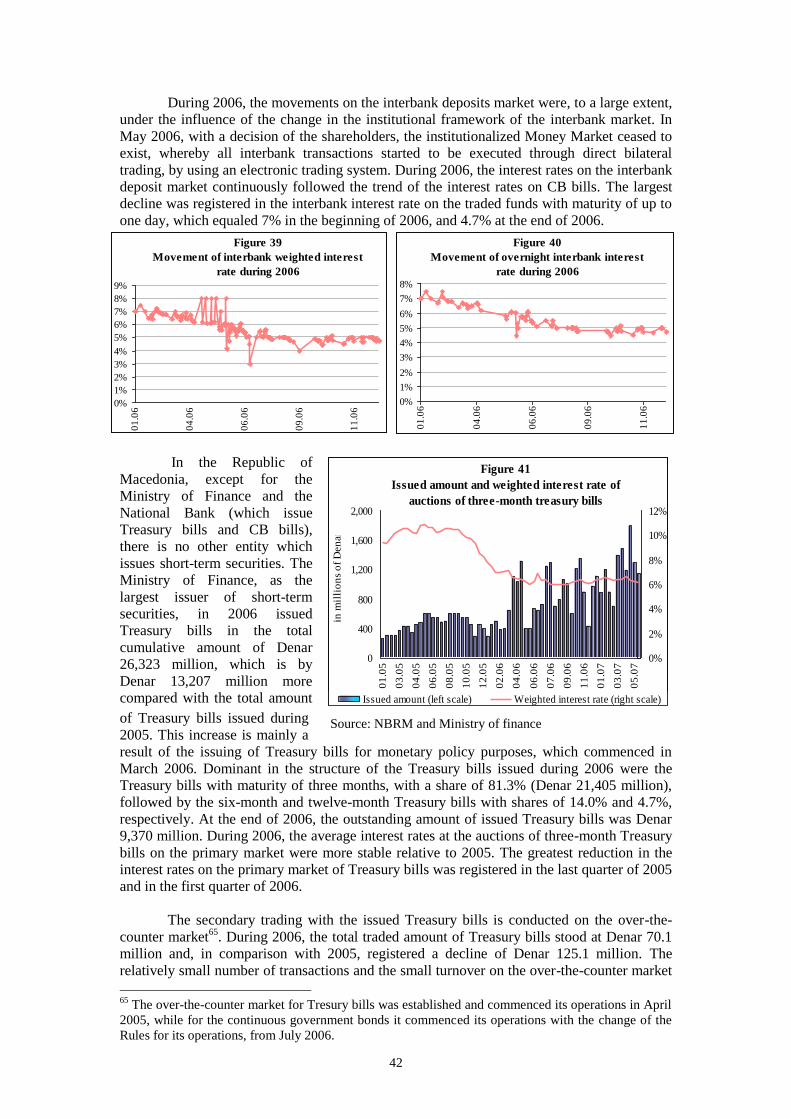
42
During 2006, the movements on the interbank deposits market were, to a large extent,
under the influence of the change in the institutional framework of the interbank market. In
May 2006, with a decision of the shareholders, the institutionalized Money Market ceased to
exist, whereby all interbank transactions started to be executed through direct bilateral
trading, by using an electronic trading system. During 2006, the interest rates on the interbank
deposit market continuously followed the trend of the interest rates on CB bills. The largest
decline was registered in the interbank interest rate on the traded funds with maturity of up to
one day, which equaled 7% in the beginning of 2006, and 4.7% at the end of 2006.
In the Republic of
Macedonia, except for the
Ministry of Finance and the
National Bank (which issue
Treasury bills and CB bills),
there is no other entity which
issues short-term securities. The
Ministry of Finance, as the
largest issuer of short-term
securities, in 2006 issued
Treasury bills in the total
cumulative amount of Denar
26,323 million, which is by
Denar 13,207 million more
compared with the total amount
of Treasury bills issued during
2005. This increase is mainly a
result of the issuing of Treasury bills for monetary policy purposes, which commenced in
March 2006. Dominant in the structure of the Treasury bills issued during 2006 were the
Treasury bills with maturity of three months, with a share of 81.3% (Denar 21,405 million),
followed by the six-month and twelve-month Treasury bills with shares of 14.0% and 4.7%,
respectively. At the end of 2006, the outstanding amount of issued Treasury bills was Denar
9,370 million. During 2006, the average interest rates at the auctions of three-month Treasury
bills on the primary market were more stable relative to 2005. The greatest reduction in the
interest rates on the primary market of Treasury bills was registered in the last quarter of 2005
and in the first quarter of 2006.
The secondary trading with the issued Treasury bills is conducted on the over-the-
counter market65
. During 2006, the total traded amount of Treasury bills stood at Denar 70.1
million and, in comparison with 2005, registered a decline of Denar 125.1 million. The
relatively small number of transactions and the small turnover on the over-the-counter market
65
The over-the-counter market for Tresury bills was established and commenced its operations in April
2005, while for the continuous government bonds it commenced its operations with the change of the
Rules for its operations, from July 2006.
Source: NBRM and Ministry of finance
Figure 39
Movement of interbank weighted interest
rate during 2006
0%
1%
2%
3%
4%
5%
6%
7%
8%
9%
01
.06
04
.06
06
.06
09
.06
11
.06
Figure 40
Movement of overnight interbank interest
rate during 2006
0%
1%
2%
3%
4%
5%
6%
7%
8%
01
.06
04
.06
06
.06
09
.06
11
.06
Figure 41
Issued amount and weighted interest rate of
auctions of three-month treasury bills
0
400
800
1,200
1,600
2,000
01
.05
03
.05
04
.05
06
.05
08
.05
10
.05
12
.05
02
.06
04
.06
06
.06
07
.06
09
.06
11
.06
01
.07
03
.07
05
.07
in m
illi
on
s o
f D
en
ar
0%
2%
4%
6%
8%
10%
12%
Issued amount (left scale) Weighted interest rate (right scale)

43
with Treasury bills, is mostly due to the high level of banks' liquidity, primarily of the high
amount of the foreign exchange component of liquid assets. The banks' inert attitude towards
undertaking market risks in their operations had its influence on the insignificant secondary
trading with government securities. Banks prefer to hold the purchased Treasury bills to
maturity, thus hedging against the risk of change in the interest rates. On the other hand,
however, in conditions of reduced interest rates and short maturity of the Treasury bills, banks
face with reinvestment risk. Besides, the low liquidity on the Treasury bills market prevents
the banks from using the yield achieved in the trading with government securities, as a basis
for setting the interest rates. This, on its part, leads to almost complete absence of the credits
with variable interest rate, set according to the movement of the interest rate on the
government securities.
The development of the money and short-term securities market, accompanied with
its increased depth and emergence of new financial instruments by which the trading on this
market is conducted, is a significant factor for the future development of the financial system
of the Republic of Macedonia and for improvement of its efficiency. The money market
should provide basis for determining the conditions under which the non-financial sectors will
be financed. This market should provide efficient allocation of the excess liquidity among the
various market participants. At the same time, this market should provide mitigation of the
possible more serious liquidity problems in the banking system. Unfortunately, the money
and short-term securities market in the Republic of Macedonia only partially fulfills these
objectives.
Favorable movements of
the short-term interest rates had
positive effects also on the
foreign exchange market during
2006, where implementation of
the strategy of targeting the
nominal exchange rate of the
Denar against the Euro,
continued. During 2006, the net-
purchase of foreign exchange on
the foreign exchange market by
the NBRM stood at Euro 241
million (in 2005 the net-purchase
was Euro 156.9 million), which
is 82.1% of the annual increase
in the official foreign reserves (in
2006 gross foreign reserves went
up by Euro 293.7 million). The
reasons behind the increased net-
purchase relative to 2005, were
the private transfers in the
amount higher than expected in
2006 (mainly accomplished
through the currency exchange
market), then the foreign
exchange inflow from the
privatization of the energy
sector, but also the increased
amount of portfolio investments.
Such movements on the foreign
exchange market contributed the
Denar exchange rate to be
Source: NBRM
Figure 43
Historical volatility of macedonian denar
exchange rate with selected foreign curencies
0.0%
0.5%
1.0%
1.5%
2.0%
2.5%
01
.05
02
.05
04
.05
06
.05
08
.05
10
.05
12
.05
01
.06
03
.06
05
.06
07
.06
09
.06
11
.06
12
.06
02
.07
04
.07
Denar/Euro Denar/USDDenar/CHF Denar/GBP
Figure 42
Movement of official spot exchange rate of
macedonian denar with selected foreign
currencies
35
45
55
65
75
85
95
01
.05
02
.05
04
.05
06
.05
08
.05
09
.05
11
.05
01
.06
03
.06
04
.06
06
.06
08
.06
09
.06
11
.06
01
.07
03
.07
04
.07
61
61.25
61.5
61.75
62
Denar/USD Denar/GBPDenar/CHF Denar/Euro (right scale)

44
characterized with an extremely low and stable historical volatility66
, which is a consequence
of the de facto fixed exchange rate of the Denar against the Euro. The exchange rates of the
Denar against the US Dollar, Swiss Frank and British Pound mostly changed depending on
the changes in the exchange rate of the Euro against these currencies. As a result of the
depreciation of the US Dollar during 2006, the exchange rate of the Denar against the US
Dollar was characterized with the greatest and most unstable volatility, compared with the
historical volatility of the exchange rates of the Denar against the other currencies.
2.2. Capital market
2.2.1. Primary capital market
The primary capital market in the Republic of Macedonia is characterized with a
relatively small number of public offers of securities. In the past few years, the largest issuer
of long-term securities was the government, primarily on the basis of the issued structural
bonds (bonds for old foreign currency saving and denationalization bonds) and of the
continuous government bonds, which started to be issued in 2005. Other debt securities,
including corporate bonds, are not present on the capital market in the Republic of
Macedonia. Only one non-financial legal entity has issued bonds, but by their nature they are
not transferable and cannot be subject to trading67
.
In 2006, the total amount of the new issues of long-term securities in the Republic of
Macedonia was Denar 3,880 million, of which Denar 2,931.8 million are new issues of
bonds68
, and Denar 948.2 million are new issues of shares. Comparison with Bulgaria and
Croatia may be used as an illustration of the minor importance of the primary capital market
in the Republic of Macedonia, where the total value of the long-term bonds issued during
2006, stood at US Dollars 401 and 192 million69
.
Table 17
Number of issuers, issued long-term securities and number of issues of securities Year 2002 2003 2004 2005 2006
No. of issuers registered at CSD 744 766 786 801 n.a.
No. of issued securities registred at CSD 1,121 1,152 1,169 1,216 n.a.
Shares 1,118 1,148 1,163 1,208 n.a.
Debt securities 3 4 6 8 n.a.
No. of quoted companies on official market of Macedonian Stock Exchange45 98 68 57 43
Approved issues of nongovernment securities 24 25 17 14 16
Shares 24 25 16 13 16
Bonds 0 0 1 1 0
Banks 11 11 7 4 7
Other financial institutions 6 6 2 1 5
Nonfinancial companies 7 8 8 9 4
Public offer 10 6 3 0 3
Private offering 14 19 14 14 13
Structure of approved issues of nongovermental securities according to issuer
Structure of approved issues of nongovernment securities according to manner of issuance
*Source: Central Securities Depository and Securities and Exchange Commission
66
Historical volatility is a standard deviation of the daily changes of the exchange rate for the values of
one calendar month, reduced to an annual level. It is used to show the maximum possible change of the
exchange rate in one day of trading, but also the possibility of occurrence of an extreme market shock,
which is larger in conditions of larger volatility. 67
These are bonds issued by a domestic legal entity through a private offer intended for its founder
from abroad. With the Decision on approval of the issuance of these bonds, the Securities and
Exchange Commission restricted their free transfer and they cannot be traded. 68
In the amount of bonds issued during 2006, dominant is the fifth issue of the denationalization bonds,
realized in March 2006, in the amount of Denar 2,091 million (Euro 34 million). 69
Source: ECB, Financial Stability Review, December 2006.

45
In the past two years and in the first quarter of 2007, on behalf of the Republic of
Macedonia, the Ministry of Finance issued six continuous government bonds, four of which,
in the total amount of Denar 900 million, were with contractual maturity of two years, while
two bonds, in the total amount of Denar 507 million, were with contractual maturity of three
years. Besides the continuous bonds, the Ministry of Finance went on with issuing the
denationalization bonds. These bonds are issued once a year, in line with the Law on Issuing
of Denationalization Bonds of the Republic of Macedonia70
, and they are denominated in
Euros. During 2005 and 2006, and in the first quarter of 2007, there were three new issues of
denationalization bonds in the total amount of Euro 110 million. These bonds are quoted on
the official market of the Macedonian Stock Exchange and are among the most traded
securities. In the absence of corporate bonds and other debt securities, their regular issuing in
the past two years was an important impetus for the development of the domestic financial
market and for intensification of the stock exchange trading.
Although there is a relatively large number of shareholding companies in the
Republic of Macedonia, in general they are not oriented toward financing their operations
through the capital market and their acting as issuers of securities is mostly of irregular
character. Confirmation of this is the fact that around 7% of the total number of shareholding
companies are quoted on the official market of the Macedonian Stock Exchange. When the
shareholding companies appear as issuers of securities it is mostly conducted through private
offers in the event of scrip-dividend or recapitalization, generally when the company has a
dominant foreign owner. Additionally, it was often the case that the shareholding companies,
especially banks, would purchase own shares and sell them later by way of private offer.
During 2006, there were 16 issues of shares in the total amount of Denar 942.9 million, of
which shares in the amount of Denar 372.6 million were issued through a public offer, while
shares in the amount of Denar 570.3 million were issued through a private offer.
2.2.2. Secondary capital market
The basic features of
the secondary capital market in
the Republic of Macedonia are
few available investment
opportunities71
and moderate
liquidity, which has register
permanent upward trend in the
last two years. According to the
Securities Law72
, the secondary
trade in long-term securities is
made through stock exchange,
except for the continuous
government securities, which
besides on stock exchange
could also be traded on over the
counter market. The new Securities Law was adopted in November 2005 at the same time
with the beginning of the gradual increase in the trade on the Macedonian Stock Exchange
AD Skopje. Major force driving the increase in the Stock Exchange trade was the trade in
shares, unlike the trade in listed bonds73
that has registered steadier trend. Also, particularly in
2006 and early 2007 witnessed significant increase in the number of concluded transactions,
due to the higher demand of the domestic natural persons for trade in shares. In 2006, the 70
"Official Gazette of RM" No. 37/02. 71
Of the total number of registered joint stock companies in Macedonia, at the end of 2006,
approximately 7% were listed on the official Macedonian Stock Exchange. 72
"Official Gazette of the Republic of Macedonia" no.95/2005 and 25/2007. 73
The so called structural government bonds - the bond for the old foreign currency savings and six
issued denationalization bonds were traded on the official Macedonian Stock Exchange AD Skopje.
Figure 44
Monthly trading turnover and number
of transactions on Macedonian Stock Exchange
0
1,000
2,000
3,000
4,000
12
.02
04
.03
08
.03
12
.03
04
.04
08
.04
12
.04
04
.05
08
.05
12
.05
04
.06
08
.06
12
.06
04
.07
mil
lio
ns
of
Den
ars
0
5,500
11,000
16,500
22,000
Turnover - bondsTurnover - sharesNumber of trading transactions (right scale)

46
number of transactions concluded on the Macedonian Stock Exchange went up by 64.8%,
compared to 2005. In the transaction number structure, 82.7% are transactions in shares, and
the remaining are transactions in bonds. The most traded shares in 2006 were the shares
issued by banks, concluding 22.1% of the total number of transactions.
The growth in the
volume of trade and in the
market capitalization had a
positive effect on the
development of the Stock
Exchange Index MBI-1074
,
which in the last two years
registered remarkable uptrend.
At the end of 2006, its annual
increase equaled 61.5%, and
since March 2007, the annual
return of the MBI-10 has
exceeded 100%. The
development of the CMAX75
indicator is yet another
illustration for the presence of
"bull market" on the
Macedonian Stock Exchange,
particularly in mid-2006 and the
first half of 2007, which in the
past period registered high
values close to the maximum.
This was the most evident in the
first half of 2006 and in the first
quarter of 2007, when its value
constantly shifted around the
maximum, also corresponding
with the periods when the index
registered the fastest growth. In
the periods of stagnation or downtrend of the MBI-10 (November and December 2006,
largely due to the announcement of the failure of the sale procedure of Komercijalna Banka
AD Skopje to strategic investor), the value of the CMAX indicator did not drop below 0.8
points. On the other hand, the historic volatility of MBI-1076
seemed to follow the oscillations
of the index value with high degree of symmetry over the last two years. In other words, the
historic volatility of the MBI-10 was decreasing when the index registered a stagnation or
downtrend, and was relatively increasing when the index registered a growth. However, in
May 2007, the value of MBI-10 was below the historic for the first time ever, and the historic
volatility was increasing and reached the highest value for the last one-year period, implying
higher likelihood for larger fluctuations in the index value and the share market prices.
74
MBI-10 is a price Stock Exchange index, introduced in January 2005, comprised of the ten most
liquid shares listed on the official Macedonian Stock Exchange. In early 2007, the index consisted of
common shares of Komercijalna Banka AD Skopje, Alkaloid AD Skopje, Stopanska Banka AD Bitola,
Ohridska Banka AD Ohrid, Makstil AD Skopje, Toplifikacija AD Skopje, Beton AD Skopje, Granit
AD Skopje, ZK Pelagonija AD Bitola and Makpetrol AD Skopje. 75
The CMAX indicator is a ratio of the current Stock Exchange index value to its maximal value in the
preceding 40 trading days. The maximum value of this indicator is 1, indicating that on the current
date, the index is at its highest level for the previous 40 trading days. 76
Historic volatility is a standard deviation of the daily returns of MBI-10 for the values of 20 trading
days (period that approximately corresponds to one calendar month), on average level. This indicator is
used to illustrate the maximum change in the index value for one trading day.
Source: Macedonian stock exchange
Figure 46
CMAX ratio and historical volatility of MBI-10
0.5
0.6
0.7
0.8
0.9
1
04
.05
05
.05
07
.05
09
.05
11
.05
01
.06
02
.06
04
.06
05
.06
07
.06
08
.06
10
.06
11
.06
01
.07
02
.07
04
.07
05
.07
0
0.02
0.04
0.06
0.08
0.1
0.12
0.14
CMAX ratio (left scale)
historical volatility of MBI-10 (right scale)
Figure 45
Movement and annual return of MBI-10
1,000
3,000
5,000
7,000
9,000
01
.05
02
.05
04
.05
06
.05
08
.05
09
.05
11
.05
01
.06
02
.06
04
.06
05
.06
07
.06
08
.06
10
.06
11
.06
01
.07
02
.07
03
.07
05
.07
0%
50%
100%
150%
200%
250%
MBI-10 (left scale)
annual return of MBI-10 (right scale)

47
Along with the growth in the secondary capital market trade in the last period, the
share prices also registered a permanent growth, and consequently, the total market
capitalization77
of the Macedonian Stock Exchange. In 2006, the average market
capitalization of the shares listed on the official Macedonian Stock Exchange went up by
53.8%, and the average market capitalization of bonds surged annually by 7.4%. The increase
in the market capitalization of the shares on the Macedonian Stock Exchange carried on in the
first four months of 2007, when compared to the end of 2006 it rose by 107.3%. At the end of
2006, the average market capitalization of the official Macedonian Stock Exchange equaled
24.2% of GDP, which is by 4.1 percentage points more compared to the end of 2005.
Table 18
Average market capitalization and turnover on the official market of the Macedonian
Stock Exchange to GDP
Shares Bonds Total Shares Bonds Total
2003 7.1% 8.4% 15.5% 0.3% 0.5% 0.8%
2004 7.0% 8.0% 15.0% 0.5% 0.5% 1.0%
2005 11.7% 8.4% 20.1% 1.6% 0.8% 2.4%
2006 16.8% 7.4% 24.2% 2.8% 0.8% 3.6%
Turnover as % of GDPYear
Market capitalization as % of GDP
Besides the higher
interest in the trade in
securities listed on the
Macedonian Stock
Exchange, the capital market
in the Republic of
Macedonia still
characterizes with under-
liquidity and restricted
market depth. At the end of
2006, the turnover ratio78
of
the Macedonian Stock
Exchange was just above
14%, indicating significantly
restricted liquidity, although
in the last several years it has been registering steep uptrend. Illustratively, the turnover ratio
for 2006 of the Ljubljana Stock Exchange equaled roughly 18%, it exceeded 45% on the
Warsaw Stock Exchange, 88% on the Budapest Stock Exchange, Euronext - above 117%,
174% on the Frankfurt Stock Exchange79
. The under-liquidity on the stock market is a
potential threat of hypothetical situation of individual large investors manipulating,
deliberately or unintentionally, the stock prices, trading in relatively insignificant quantity.
The higher trade resulted in lower stock exchange turnover degree. The turnover in
the ten most traded shares in 2006 accounted for 79.7% of the total annual turnover in shares
listed on the official market, which is by 7.8 percentage points less compared to 2005. The
further development of the financial markets in the Republic of Macedonia, accompanied by
higher trade volume could be expected to continue the downtrend of the turnover
concentration rate. On the other hand, the rise in the stock prices in 2006 brought about higher
concentration of market capitalization of the shares listed on the official market. The average
77
The market capitalization of certain securities portfolio is a sum of the products of the number of
issued securities and the average daily price of each of them. 78
The turnover ratio of the securities is a quotient of the turnover in securities over a certain time
period and the average market capitalization in the same time period. 79
Source of data on the turnover ratios on the exchanges in Europe is the World Federation of
Exchange.
Figure 47
Market capitalization and turnover ratio on official
market of Macedonian Stock Exchange14.1%
12.8%
7.8%
5.0%
0
20,000
40,000
60,000
80,000
2003 2004 2005 2006
mil
ion
s o
f D
enar
s
0%
3%
6%
9%
12%
15%
Market capitalization of quoted bonds (left scale)Market capitalization of quoted shares (left scale)Turnover ratio on official market (right scale)
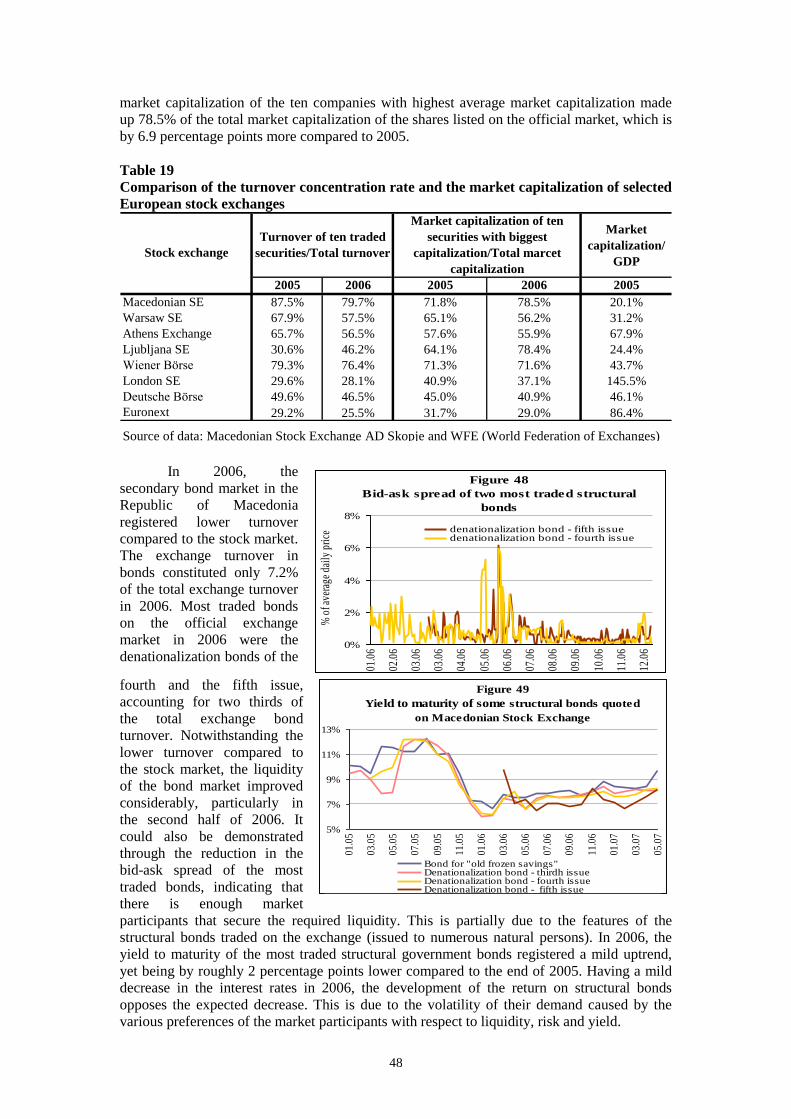
48
market capitalization of the ten companies with highest average market capitalization made
up 78.5% of the total market capitalization of the shares listed on the official market, which is
by 6.9 percentage points more compared to 2005.
Table 19
Comparison of the turnover concentration rate and the market capitalization of selected
European stock exchanges
Market
capitalization/
GDP
2005 2006 2005 2006 2005
Macedonian SE 87.5% 79.7% 71.8% 78.5% 20.1%
Warsaw SE 67.9% 57.5% 65.1% 56.2% 31.2%
Athens Exchange 65.7% 56.5% 57.6% 55.9% 67.9%
Ljubljana SE 30.6% 46.2% 64.1% 78.4% 24.4%
Wiener Börse 79.3% 76.4% 71.3% 71.6% 43.7%
London SE 29.6% 28.1% 40.9% 37.1% 145.5%
Deutsche Börse 49.6% 46.5% 45.0% 40.9% 46.1%
Euronext 29.2% 25.5% 31.7% 29.0% 86.4%
Market capitalization of ten
securities with biggest
capitalization/Total marcet
capitalization
Turnover of ten traded
securities/Total turnoverStock exchange
In 2006, the
secondary bond market in the
Republic of Macedonia
registered lower turnover
compared to the stock market.
The exchange turnover in
bonds constituted only 7.2%
of the total exchange turnover
in 2006. Most traded bonds
on the official exchange
market in 2006 were the
denationalization bonds of the
fourth and the fifth issue,
accounting for two thirds of
the total exchange bond
turnover. Notwithstanding the
lower turnover compared to
the stock market, the liquidity
of the bond market improved
considerably, particularly in
the second half of 2006. It
could also be demonstrated
through the reduction in the
bid-ask spread of the most
traded bonds, indicating that
there is enough market
participants that secure the required liquidity. This is partially due to the features of the
structural bonds traded on the exchange (issued to numerous natural persons). In 2006, the
yield to maturity of the most traded structural government bonds registered a mild uptrend,
yet being by roughly 2 percentage points lower compared to the end of 2005. Having a mild
decrease in the interest rates in 2006, the development of the return on structural bonds
opposes the expected decrease. This is due to the volatility of their demand caused by the
various preferences of the market participants with respect to liquidity, risk and yield.
Source of data: Macedonian Stock Exchange AD Skopje and WFE (World Federation of Exchanges)
Figure 48
Bid-ask spread of two most traded structural
bonds
0%
2%
4%
6%
8%
01.0
6
02.0
6
03.0
6
03.0
6
04.0
6
05.0
6
06.0
6
07.0
6
08.0
6
09.0
6
10.0
6
11.0
6
12.0
6
% o
f ave
rage
dai
ly p
rice
denationalization bond - fifth issuedenationalization bond - fourth issue
Figure 49
Yield to maturity of some structural bonds quoted
on Macedonian Stock Exchange
5%
7%
9%
11%
13%
01.0
5
03.0
5
05.0
5
07.0
5
09.0
5
11.0
5
01.0
6
03.0
6
05.0
6
07.0
6
09.0
6
11.0
6
01.0
7
03.0
7
05.0
7
Bond for "old frozen savings"Denationalization bond - thirdh issueDenationalization bond - fourth issueDenationalization bond - fifth issue

49
Figure 50
Movements on over the counter market for Treasury bonds
with two years residual maturity
0
5,000
10,000
15,000
20,000
25,000
30,000
35,000
40,000
45,000
10.0
7.06
20.0
7.06
31.0
7.06
08.0
8.06
16.0
8.06
01.0
9.06
03.1
1.06
14.1
1.06
21.1
1.06
29.1
1.06
15.0
1.07
23.0
1.07
30.0
1.07
28.0
2.07
09.0
3.07
19.0
3.07
mil
lion
s of
Den
ars
5%
6%
7%
8%
9%
10%
Value of executed transactions Weighted yield to maturity
Although the exchange allows for trading in continuous government bonds, the trade
in these bonds on the official secondary market was minimal. Once the over the counter
market started operating, the overall trade in continuous government bonds took place on this
market. In 2006, the total value of concluded transactions in continuous government bonds on
the over the counter market amounted to Denar 507.7 million, and Denar 34.9 million of these
transactions were concluded on the exchange. The trade on the market of continuous bonds
with two-year residual maturity was more intensive, and the average weighted yield to
maturity was relatively stable in 2006.
The further issuance of continuous government bonds and the increase in their
maturity spectrum, is expected to increase the volume of their secondary trade. This, in turn,
is a prerequisite for constructing yield curve of government securities, particularly those with
longer maturities.
At the end of 2006, there were seventeen members of the Macedonian Stock
Exchange AD Skopje, six of which were banks, and eleven were brokerage houses. The last
two years have witnessed an increase in the membership of the Stock Exchange, thus
reducing the concentration of the total turnover and the turnover of the classical trade. The
lower concentration of the turnover by member was most evident in 2006, when the shares of
the three members with highest turnover and of the five members with the highest turnover in
the total exchange turnover reduced by 12.7 and 13.1 percentage points, respectively.
Table 20
Indicators for the turnover concentration by stock exchange member
2003 2004 2005 2006Change
2006/2005
No. of stock exchange members 14 14 15 17 2
CR3 for stock exchange members
total turnover 66.4% 70.8% 60.5% 47.8% -12.7 p. p.
CR5 for stock exchange members
total turnover82.3% 80.3% 75.3% 62.2% -13.1 p.p.
CR5 for clasical trading turnover 75.8% 67.4% 72.1% 62.4% -9.7 p.p.
The accelerated trade in securities resulted in positive development for the brokerage
industry. At the end of 2006, the total assets of the brokerage houses stood at Denar 615
million, and compared to the end of 2005, it was by 71.3% higher. In 2006, the brokerage
houses significantly improved their performances. The pre-tax gain generated by the
brokerage houses in 2006, totaled Denar 106.3 million, which is by Denar 65.8 million more
compared to the end of 2005. However, the relevance of the brokerage houses to the overall
Source: NBRM

50
financial system is marginal, considering that they make up only 0.3% of the total assets of
the financial system.
On the other hand, the six banks members of the exchange increased their income
from brokerage fees from Denar 60.7 million in 2005, to Denar 89 million in 2006. The
income from the brokerage fees of these six banks at the end of 2006 constituted 4.4% of the
total fee and compensation income. Thus, 47.3% of the income from brokerage fees in 2006
resulted from providing brokerage services to natural persons.
The considerable increase in the exchange turnover resulted from several factors. The
Securities Law, adopted in 2005, provided for relatively larger protection of the shareholder
rights, higher transparency and requirements for the issuers for disclosing the financial
statements, and also higher authorizations of the Securities and Exchange Committee as a
regulator and supervisor of the capital market and securities operations. Other factor that
acted towards enhanced exchange trade was the evident presence of foreign portfolio-
investors, primarily investment funds, investment companies and natural persons from former
Yugoslavia. The higher interest of these investors corresponded with the high annual yields
registered by the exchange indices in this region in 200680
. Moreover, in 2006, the
developments of the exchange indices in the countries of the Balkan region showed high
correlation degree81
.
Table 21
Correlation ratio of the developments of the major exchange indices in some SEE
countries in 2006 stock exchange indices CROBEX SBI20 SOFIX BELEX MBI10
CROBEX - ZAGREB - 0.9632 0.7885 0.8650 0.8753
SBI20 - LJUBLJANA 0.9632 - 0.7655 0.8224 0.8426
SOFIX - SOFIA 0.7885 0.7655 - 0.9462 0.7051
BELEX - BELGRADE 0.8650 0.8224 0.9462 - 0.7394
MBI10 - SKOPJE 0.8753 0.8426 0.7051 0.7394 -
The high share of foreign portfolio-investors in the trade in securities in the Republic
of Macedonia brings about higher correlation of the price development of the Macedonian
capital market with the markets of the countries in the region, thus the domestic stock market
showing similar developments and becoming more sensitive to the price changes on the other
exchanges. This primarily refers to the exchanges in other countries of the Balkan region,
which in the past period also registered positive developments. In 2006, the Macedonian
Stock Exchange Index registered higher degree of correlation with the development of the
major indices of the exchanges in Croatia and Slovenia, compared to the correlation with the
indices in Bulgaria and Serbia.
Eventually, factor that made the stock turnover and prices higher in the last two years
is the relatively understated value of the companies in the past. As a result of myriad of non-
transparent privatization processes and the relatively low trade volume in the previous years,
the stock prices of most of the companies in the last years were understated, when the
increase in the trade made the secondary market play the role of so called "price discovery".
80
The annual increases in the exchange indices in the Balkan countries for 2006 equaled CROBEX
(Zagreb) 35.8%, SBI20 (Ljubljana) 14.2%, BELEX15 (Belgrade) 58.4%, SOFIX (Sofia) 48.4%, and
the annual yields of the major exchange indices in the Central European countries at the end of 2006
equaled WIG (Warsaw) 39.9%, BUX (Budapest) 8.4,% and PX (Prague) 7.9% and SAX (Bratislava)
0.5%. 81
The correlation ratio may range from -1 to 1. The closer the ratio value is to 1, the higher positive
correlation is considered to be present in the development of the both phenomena, and the closer the
ratio value is to -1, the higher negative (inverse) correlation is considered to be present between the two
phenomena.

51
The higher trade in shares and the increase in their prices, besides their positive
influence on the financial system development, also represent a new source of risk for the
Macedonian economy. The risks would primarily come to the light in the case of creating
excessively high expectations for the future performances of the companies - issuers and for
the future price level of their shares, i.e. in the case of speculative "price bubbles". This risk
has been present in the Republic of Macedonia, since the primary capital market failed to
keep up with the higher public interest to trade in securities (absence of new issues of shares,
and most of the listed companies have a high ownership concentration), as well as due to the
high presence of foreign portfolio-investors on the purchase side of the exchange and the high
share of domestic natural persons.
The change in the risk perceptions or the investment strategies by the foreign
portfolio-investors, if any, under the influence of economic82
or non-economic factors83
,
would probably create considerable pressure on the sale side of the exchange. Having a slight
depth and width of the market and due to the lack of resident institutional investors that could
absorb larger stock quantities, the change in the behavior of foreign portfolio-investors could
cause certain adverse changes in the exchange price level. The size of such adverse changes
would be commensurate to the size of volatility of certain shares. Considering that in 2007 the
MBI-10 volatility has been significantly greater, the adverse changes in the price level, if any,
could register noticeable amplitudes. However, the price changes, if any, would not be a
direct market risk for the banks or other institutions of the financial system, primarily due to
their low propensity to trade in shares. On the other hand, the adverse changes in the price
levels would cause serious consequences to the economic power of the household sector, and
indirectly to the financial system, since the exposure of the banks to the household sector over
the last period registered considerable increase. This becomes particularly updated with the
increase in the share of the domestic natural persons in the exchange turnover over the last
several months, which still registers higher share on the sale side rather than on the purchase
side. In addition, the adverse price changes of the shares would also affect other financial
market segments. This particularly refers to the size of trade and the price of listed bonds,
which could also be a source of indirect risk to the financial system.
82
Most important economic factor that could change the investment strategies and reduce the
investments in securities in the countries in transition, including the Balkan countries, is the increase in
the interest rates on the financial markets of the developed countries. 83
One relevant non-economic factor that could change the behavior of the foreign portfolio-investors is
the perception of the political developments, not only domestic, but rather Balkan-wide, mainly since
the portfolio-investors do not perceive the small capital markets, such as the Macedonian, individually,
but rather in a regional context.
Source: Macedonian stock exchange
Figure 51
Share of foreign investors in total stock
exchange turnover
0%
10%
20%
30%
40%
50%
60%
70%
01
.06
03
.06
05
.06
07
.06
09
.06
11
.06
01
.07
03
.07
05
.07
Buying side Selling side
Figure 52
Share of domestic natural persons in total
stock exchange turnover
0%
10%
20%
30%
40%
50%
60%
70%
06
.06
07
.06
08
.06
09
.06
10
.06
11
.06
12
.06
01
.07
02
.07
03
.07
04
.07
05
.07
Buying side Selling side

52
3. Banking system of the Republic of Macedonia84
Regulatory framework
The Banking Law, effective in the period this Report refers to, was adopted in 2000.
It regulated the bank founding in the Republic of Macedonia, the capital requirement for
performing financial activities, the type of financial activities allowed to be performed by the
banks in accordance with the capital amount, the supervisory standards the banks are required
to observe in their operations, the bodies of the bank and bank management, the core
accounting and audit principles, the bank supervision, the corrective actions and bank's
bankruptcy and liquidation. This Law underlay the bylaws of the National Bank,
incorporating the contemporary Basel principles and practices of prudential bank operations,
and the basic supervisory standards, such as calculation of the bank capital adequacy, credit
risk assessment by prescribing a methodology for banks' assets risk classification,
identification, measurement and monitoring the country risk, the exchange rate risk, the credit
concentration risk, etc.
At the beginning of June 2007, the Parliament of the Republic of Macedonia adopted
a new Banking Law, which is qualitative improvement and promotion of the legal framework
that regulates the bank founding and operations in the Republic of Macedonia and the method
of conducting the supervisory function of the National Bank. The new Law ensures
significant compliance of the domestic legislation with the new Basel principles for effective
bank supervision adopted in October 2006, as internationally accepted practice of bank and
supervisory operations. Furthermore, within the efforts of the Republic of Macedonia for
integration to the European Union, this Law shows high degree of approximation to the
European directives concerning banks (32006L0048, 32006L0049 and 32001L0024), and
therefore, the Republic of Macedonia equalizes with the European countries bound to apply
the new bank directives.
Most important innovations in the Banking Law are the strengthening of the bank
corporate management, as a particularly vital segment in the contemporary banking.
Precondition for successful corporate management with the banks is a transparent shareholder
structure which is to underpin the banks' safety, soundness and reputation. The new Law also
specifies a range of criteria which are to be met by bank shareholder, simultaneously
introducing an authorization of the National Bank to revoke an approval for a shareholder
who no longer fulfills the specified requirements. This Law is expected to ensure transparent
and efficient procedure for leaving the banking system of the Republic of Macedonia of
shareholder who enjoy no reputation, integrity and whose work may compromise the safety
and soundness of the bank or impede the performance of the supervisory function of the
National Bank.
The Law also embeds a range of provisions tightening the requirements for
establishing adequate risk management systems and internal control systems, depending on
the volume, the nature and the complexity of the activities performed by the banks. These
provisions are a solid basis for application of the New Basel Capital Accord (so called
BASEL 2) in the next several years. In this context, the provisions authorizing the National
Bank to set a high capital adequacy ratio, depending on the volume, the nature and the
complexity of the activities performed by the bank and the adequacy of its risk management
systems and the internal control system, are of a crucial importance. These provisions are a
key precondition for gradual switch to risk based supervision, which at a bottom line,
underlies the implementation of the second pillar (Supervisory assessment) of the New Basel
Capital Accord.
84
More detailed data on the structure, the performances and the risk profile of the banking system are
included in the Report on Banking System and Bank Supervision in 2006.

53
Also, the Law increased the minimum capital requirement for founding and operating
a bank from Denar equivalent of Euro 3.5 million to Denar equivalent of Euro 5 million, thus
applying the European practice and regulations in this area.
One significant innovation of the new Law is the market liberalization, enabling
foreign banks for perform financial activities by opening branches in the Republic of
Macedonia. This means facilitation of the access of foreign banks to the domestic market of
financial services, which is expected to enhance the competitiveness on the domestic market.
In order to increase the transparency and the banks' market discipline, the Banking
Law strengthens the role of the external auditor, increases the transparency in the
performance of the financial activities and risk management by the banks, and tightens the
accounting standards for the banks.
Significant progress in the Banking Law has been made in the area of corrective
actions undertaken by the National Bank against a bank that showed inconsistencies and
irregularities in its operations. The Law also offers greater transparency in the manner of
imposing measures by the National Bank. Besides the wide range of corrective actions, the
Law also specifies gradation in the imposing of the corrective actions, depending on the
gravity of the irregularity and the responsiveness of the bank.
The relevant bylaws emanating from the new Banking Law will be adopted in 2007,
thus completing the bank regulations required for efficient bank operations and efficient
implementation of the supervisory function of the National Bank.
3.1. Structure and activities of the banking system
One of the basic features of the financial system of the Republic of Macedonia is the
noticeable domination of the banking sector, constituting 90.1% of the financial system
assets. Hence, the developments and the stability of the financial system are primarily
contingent upon the features and the performances of this sector.
Table 22
Number and size of deposit institutions
2001 2002 2003 2004 2005 2006
Number of deposit instutions 38 38 36 36 34 31
banks 21 21 21 21 20 19
saving houses 17 17 15 15 14 12
Total assets of depoit institutions (in million of
Denars)106,309 94,169 106,139 119,539 142,370 176,504
banks 105,633 93,213 104,875 117,985 140,436 174,177
saving houses 676 956 1,264 1,554 1,934 2,327
Structure of deposit institutions assets (as%) 100.0% 100.0% 100.0% 100.0% 100.0% 100.0%
banks 99.4% 99.0% 98.8% 98.7% 98.6% 98.7%
saving houses 0.6% 1.0% 1.2% 1.3% 1.4% 1.3%
Number of mergers and aquisititons 3 0 0 0 1 2
Years
In the last several years, typical for the banking system of the Republic of Macedonia
is the steady decrease in the number of institutions, and simultaneous increase in its size. The
further approximation of the Republic of Macedonia to the European Union could be
expected to strengthen the process of restructuring and the market consolidation of the
banking system of the Republic of Macedonia which is to bring about further deepening of
the financial intermediation and improving, in particular, the type and the quality of financial
services offered by the banks.
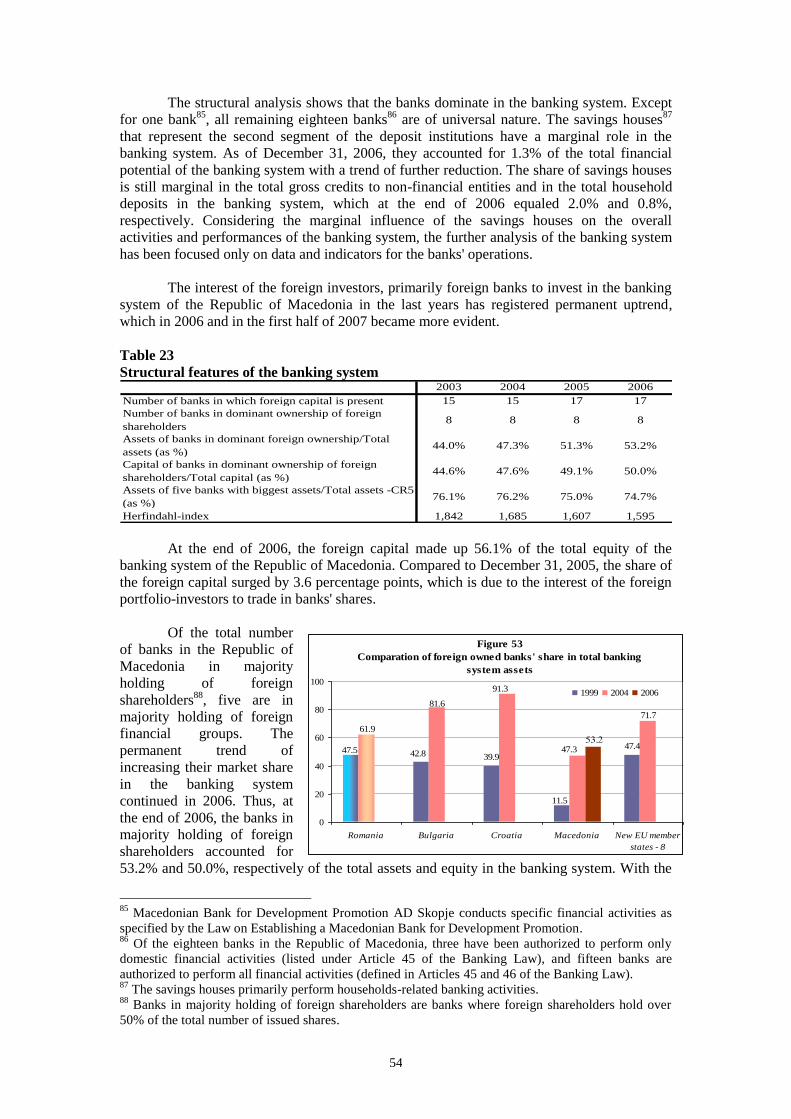
54
The structural analysis shows that the banks dominate in the banking system. Except
for one bank85
, all remaining eighteen banks86
are of universal nature. The savings houses87
that represent the second segment of the deposit institutions have a marginal role in the
banking system. As of December 31, 2006, they accounted for 1.3% of the total financial
potential of the banking system with a trend of further reduction. The share of savings houses
is still marginal in the total gross credits to non-financial entities and in the total household
deposits in the banking system, which at the end of 2006 equaled 2.0% and 0.8%,
respectively. Considering the marginal influence of the savings houses on the overall
activities and performances of the banking system, the further analysis of the banking system
has been focused only on data and indicators for the banks' operations.
The interest of the foreign investors, primarily foreign banks to invest in the banking
system of the Republic of Macedonia in the last years has registered permanent uptrend,
which in 2006 and in the first half of 2007 became more evident.
Table 23
Structural features of the banking system 2003 2004 2005 2006
Number of banks in which foreign capital is present 15 15 17 17
Number of banks in dominant ownership of foreign
shareholders8 8 8 8
Assets of banks in dominant foreign ownership/Total
assets (as %)44.0% 47.3% 51.3% 53.2%
Capital of banks in dominant ownership of foreign
shareholders/Total capital (as %)44.6% 47.6% 49.1% 50.0%
Assets of five banks with biggest assets/Total assets -CR5
(as %)76.1% 76.2% 75.0% 74.7%
Herfindahl-index 1,842 1,685 1,607 1,595
At the end of 2006, the foreign capital made up 56.1% of the total equity of the
banking system of the Republic of Macedonia. Compared to December 31, 2005, the share of
the foreign capital surged by 3.6 percentage points, which is due to the interest of the foreign
portfolio-investors to trade in banks' shares.
Of the total number
of banks in the Republic of
Macedonia in majority
holding of foreign
shareholders88
, five are in
majority holding of foreign
financial groups. The
permanent trend of
increasing their market share
in the banking system
continued in 2006. Thus, at
the end of 2006, the banks in
majority holding of foreign
shareholders accounted for
53.2% and 50.0%, respectively of the total assets and equity in the banking system. With the
85
Macedonian Bank for Development Promotion AD Skopje conducts specific financial activities as
specified by the Law on Establishing a Macedonian Bank for Development Promotion. 86
Of the eighteen banks in the Republic of Macedonia, three have been authorized to perform only
domestic financial activities (listed under Article 45 of the Banking Law), and fifteen banks are
authorized to perform all financial activities (defined in Articles 45 and 46 of the Banking Law). 87
The savings houses primarily perform households-related banking activities. 88
Banks in majority holding of foreign shareholders are banks where foreign shareholders hold over
50% of the total number of issued shares.
Figure 53
Comparation of foreign owned banks' share in total banking
system assets
47.4
11.5
42.847.539.9
71.7
47.3
81.6
61.9
91.3
53.2
0
20
40
60
80
100
Romania Bulgaria Croatia Macedonia New EU member
states - 8
1999 2004 2006

55
acquisition of Ohridska Banka AD Ohrid by Societè Generale s.a. Paris, the domination of the
banks in majority holding of foreign shareholder in the first half of 2007 became more evident
(the share of the banks in majority foreign holding in the total assets as of April 30, 2007
increased to 58.0%). However, the relative significance of the banks in majority holding of
foreign shareholders in the banking system of the Republic of Macedonia was and remains
lower compared to the countries of the region and the countries that joined the European
Union in 2004, due primarily to the larger inflows of foreign capital in these countries during
the privatization processes of their banking systems.
Observing the
countries of origin of the
majority foreign
shareholders, the major
investors in the banking
system of the Republic of
Macedonia come from the
more advanced countries in
the Balkan region - Greece
and Slovenia. These two
countries constitute half of
the banks' capital in the
Republic of Macedonia
which is in majority
holding of foreign
shareholders, since two of
the three largest banks in the Republic of Macedonia are in majority ownership of banking
groups of these countries.
The banking
system of the Republic of
Macedonia is distinguished
by relatively high, but
rather acceptable
concentration rate, which
has registered a permanent
downtrend in the last years.
The highest concentration
rate was registered in the
deposit activity of the
banks which on December
31, 2006, measured by the
Herfindahl-index equaled
1,928. However, in 2006,
this index registered the fastest decrease of 121 index point.
The downtrend of the concentration rate and the increase in the market share of the
banks in majority foreign ownership is expected to be a generator for additional strengthening
of the competitiveness in the banking system and for its further market consolidation. These
developments are also expected to encourage the change in the business strategies of the
smaller banks in order to provide foreign strategic investors, their interconnection or possibly,
acquisition by other domestic banks. Of course, other possible alternative for these banks is to
keep their role in the banking market in the Republic of Macedonia through their
specialization for certain type of activity or targeted client group.
In 2006, one of the basic features of the banking system of the Republic of
Macedonia was the major increase in its size. The total banks' assets on December 31, 2006,
Figure 54
Structure of capital of banks in dominant ownership of foreign
shareholders according to country of shareholders origin
4.35%
7.35%
7.68%
9.62%16.98%
3.51%
3.61%
7.70%
5.74%
33.46%
Grece
Slovenia
Switzerland
International financial
institutionsTurkey
France
Germany
Bulgaria
Domestic shareholders
Other countries
Figure 55
Dynamics of the Herfindahl index of the banking
system
1,607 1,595
1,666 1,670
1,734 1,726
2,0491,928
1,300
1,700
2,100
2,500
12
/20
01
06
/20
02
12
/20
02
06
/20
03
12
/20
03
06
/20
04
12
/20
04
06
/20
05
12
/20
05
06
/20
06
12
/20
06
Total assets Total activities
Total gross credits Total deposits

56
reached Denar 174,117 million,
which is by 24.0% more compared to
December 31, 2005. The increase in
the deposit base of the banks, and the
further process of transformation of
their low interest-bearing assets to
high interest bearing assets were the
core postulates underlying the
financing of the higher volume of
activities by the banks. Compared to
December 31, 2005, the deposits of
non-financial entities surged by
27.9%. The degree of financing the
banks' activities by sources of funds from foreign banks remained almost unchanged
compared to the preceding year. The higher deposit potential had an effect on the assets side
through the faster pace of increase in the credit support of the non-financial entities and
through the noticeable demand of the banks for securities (primarily treasury bills). On annual
level, the credits to non-financial entities went up by 35.2%, and the securities portfolio rose
by 36.0%. The constant downtrend of the low interest-bearing at the expense of the increase
in the interest-bearing component of the assets was primarily demonstrated through the high
share of credits, at the expense of the further decrease in the share of the banks' deposits in
foreign banks.
Table 24
Assets and liabilities structure
31.12.2006 31.12.2005
Cash and balances at NBRM 6.4% 5.7% 39.9% 0.7 9.4%
Securities portfolio 13.9% 12.7% 36.0% 1.2 19.1%
Placements to other banks 27.1% 30.7% 9.4% -3.6 12.0%
Loans to clients (net) 45.7% 41.9% 35.2% 3.8 61.5%
Accrued interest and other assets 2.9% 4.4% -18.1% -1.5 -3.3%
Fixed assets 4.0% 4.6% 6.2% -0.6 1.2%
Nonallocated provisions for potentital losses 0.0% -0.1% -34.7% 0.1 0.1%
Total assets 100.0% 100.0% 24.0% 100.0%
Bank deposits 2.2% 1.9% 43.6% 0.3 3.5%
Deposits of non-financial enteties 71.9% 69.7% 27.9% 2.2 81.2%
Borrowings (shorterm and longterm) 9.0% 94% 19.4% -0.4 7.6%
Other liabilities 3.1% 2.6% 47.5% 0.5 5.2%
Provisions for off-balance sheet items 0.4% 0.5% -9.1% -0.1 -0.2%
Own funds 13.3% 15.9% 4.2% -2.6 2.7%
Total liabilities and equity 100.0% 100.0% 24.0% 100,0%
Contribution
in growth (as
%)
Balance sheet
Structure Annual
change
(as %)
Change of
structural share
(as procentage
points)
The higher volume of
activities of the banks at the same
time implied further deepening of
the degree of financial
intermediation. The degree of
financial intermediation, as a
basic indicator for the relative
significance of the banks'
activities in the total economic
activity in the country preserved
its uptrend, typical for the past
several years. At the end of 2006,
the level of financial
intermediation in the banking
system, measured as a ratio of the total assets, the gross credits and the total deposits of the
non-financial entities - to - GDP equaled 57.4%, 29.6% and 41.3%, respectively.
Figure 56
Annual growth rates of the assets, gross-
loans and deposits
-20%
-10%
0%
10%
20%
30%
40%
2002 2003 2004 2005 2006
Assets Gross-loans Deposits
Figure 57
Degree of financial intermediation
0%
10%
20%
30%
40%
50%
60%
70%
1999
2000
2001
2002
2003
2004
2005
2006
Total assets/GDP (%)Gross-loans/GDP (%)Total deposits/GDP (%)
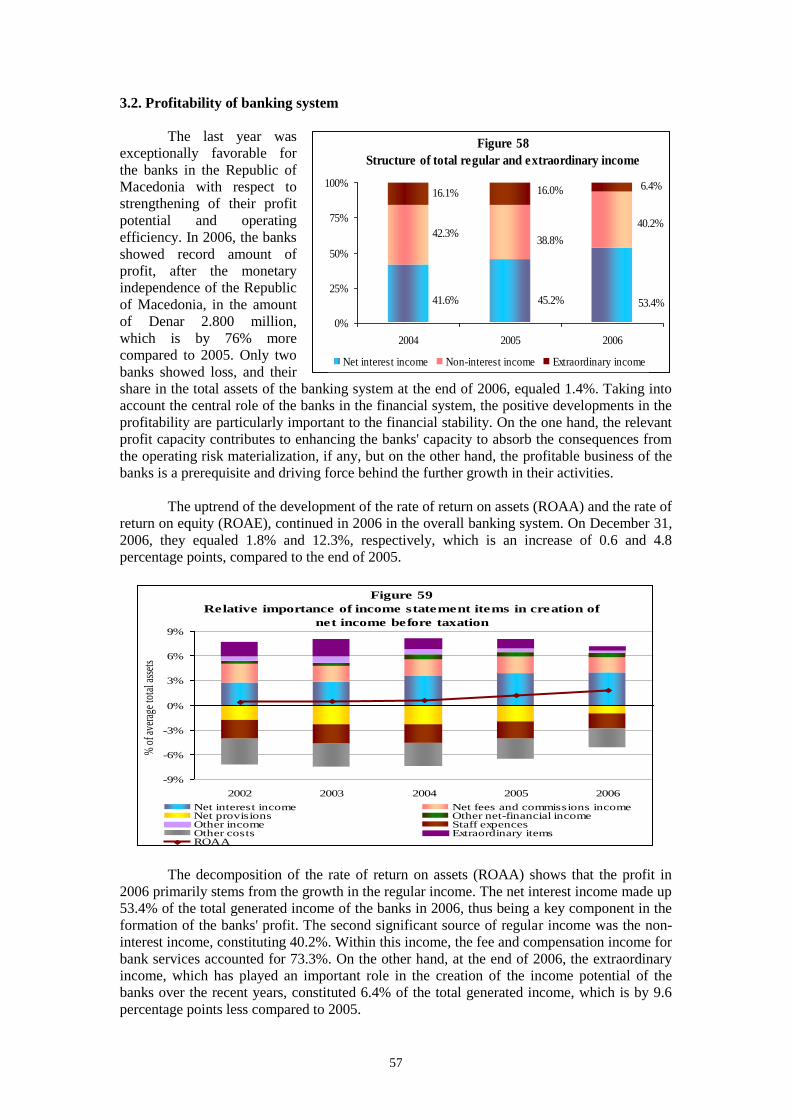
57
3.2. Profitability of banking system
The last year was
exceptionally favorable for
the banks in the Republic of
Macedonia with respect to
strengthening of their profit
potential and operating
efficiency. In 2006, the banks
showed record amount of
profit, after the monetary
independence of the Republic
of Macedonia, in the amount
of Denar 2.800 million,
which is by 76% more
compared to 2005. Only two
banks showed loss, and their
share in the total assets of the banking system at the end of 2006, equaled 1.4%. Taking into
account the central role of the banks in the financial system, the positive developments in the
profitability are particularly important to the financial stability. On the one hand, the relevant
profit capacity contributes to enhancing the banks' capacity to absorb the consequences from
the operating risk materialization, if any, but on the other hand, the profitable business of the
banks is a prerequisite and driving force behind the further growth in their activities.
The uptrend of the development of the rate of return on assets (ROAA) and the rate of
return on equity (ROAE), continued in 2006 in the overall banking system. On December 31,
2006, they equaled 1.8% and 12.3%, respectively, which is an increase of 0.6 and 4.8
percentage points, compared to the end of 2005.
Figure 59
Relative importance of income statement items in creation of
net income before taxation
-9%
-6%
-3%
0%
3%
6%
9%
2002 2003 2004 2005 2006
% o
f ave
rage
tota
l ass
ets
Net interest income Net fees and commissions incomeNet provisions Other net-financial incomeOther income Staff expencesOther costs Extraordinary itemsROAA
The decomposition of the rate of return on assets (ROAA) shows that the profit in
2006 primarily stems from the growth in the regular income. The net interest income made up
53.4% of the total generated income of the banks in 2006, thus being a key component in the
formation of the banks' profit. The second significant source of regular income was the non-
interest income, constituting 40.2%. Within this income, the fee and compensation income for
bank services accounted for 73.3%. On the other hand, at the end of 2006, the extraordinary
income, which has played an important role in the creation of the income potential of the
banks over the recent years, constituted 6.4% of the total generated income, which is by 9.6
percentage points less compared to 2005.
Figure 58
Structure of total regular and extraordinary income
53.4%45.2%41.6%
40.2%
38.8%42.3%
16.1% 16.0% 6.4%
0%
25%
50%
75%
100%
2004 2005 2006
Net interest income Non-interest income Extraordinary income
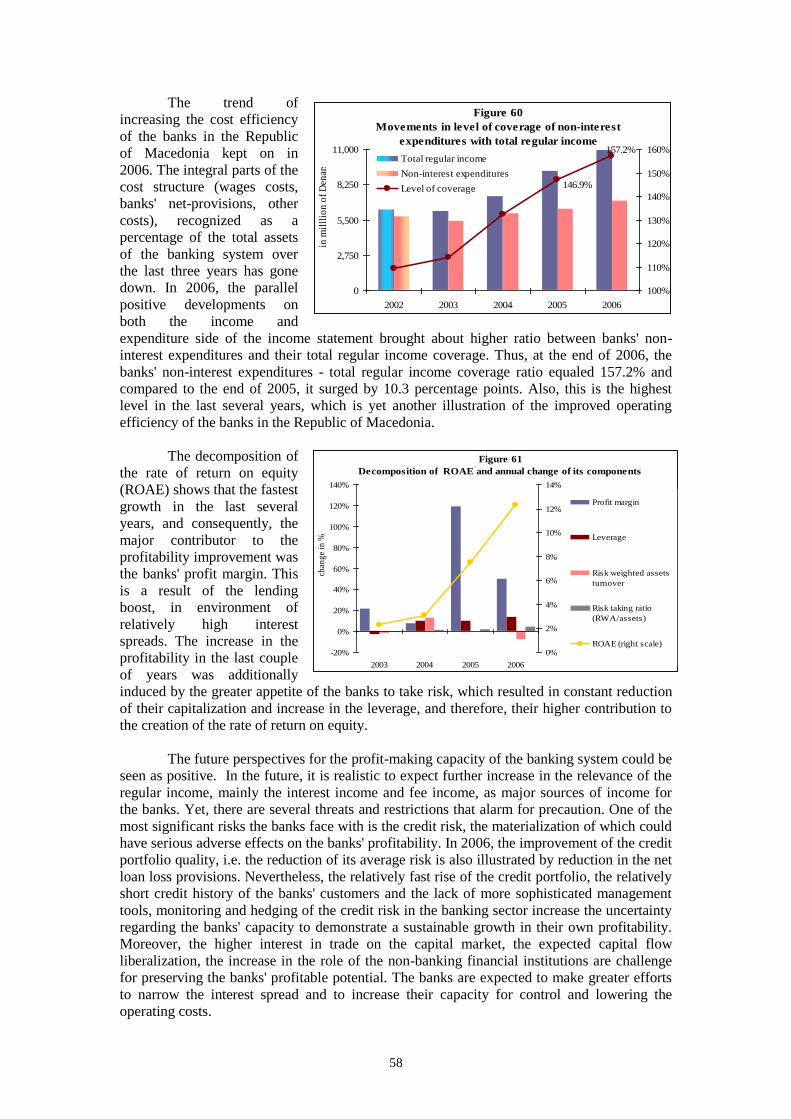
58
The trend of
increasing the cost efficiency
of the banks in the Republic
of Macedonia kept on in
2006. The integral parts of the
cost structure (wages costs,
banks' net-provisions, other
costs), recognized as a
percentage of the total assets
of the banking system over
the last three years has gone
down. In 2006, the parallel
positive developments on
both the income and
expenditure side of the income statement brought about higher ratio between banks' non-
interest expenditures and their total regular income coverage. Thus, at the end of 2006, the
banks' non-interest expenditures - total regular income coverage ratio equaled 157.2% and
compared to the end of 2005, it surged by 10.3 percentage points. Also, this is the highest
level in the last several years, which is yet another illustration of the improved operating
efficiency of the banks in the Republic of Macedonia.
The decomposition of
the rate of return on equity
(ROAE) shows that the fastest
growth in the last several
years, and consequently, the
major contributor to the
profitability improvement was
the banks' profit margin. This
is a result of the lending
boost, in environment of
relatively high interest
spreads. The increase in the
profitability in the last couple
of years was additionally
induced by the greater appetite of the banks to take risk, which resulted in constant reduction
of their capitalization and increase in the leverage, and therefore, their higher contribution to
the creation of the rate of return on equity.
The future perspectives for the profit-making capacity of the banking system could be
seen as positive. In the future, it is realistic to expect further increase in the relevance of the
regular income, mainly the interest income and fee income, as major sources of income for
the banks. Yet, there are several threats and restrictions that alarm for precaution. One of the
most significant risks the banks face with is the credit risk, the materialization of which could
have serious adverse effects on the banks' profitability. In 2006, the improvement of the credit
portfolio quality, i.e. the reduction of its average risk is also illustrated by reduction in the net
loan loss provisions. Nevertheless, the relatively fast rise of the credit portfolio, the relatively
short credit history of the banks' customers and the lack of more sophisticated management
tools, monitoring and hedging of the credit risk in the banking sector increase the uncertainty
regarding the banks' capacity to demonstrate a sustainable growth in their own profitability.
Moreover, the higher interest in trade on the capital market, the expected capital flow
liberalization, the increase in the role of the non-banking financial institutions are challenge
for preserving the banks' profitable potential. The banks are expected to make greater efforts
to narrow the interest spread and to increase their capacity for control and lowering the
operating costs.
Figure 61
Decomposition of ROAE and annual change of its components
-20%
0%
20%
40%
60%
80%
100%
120%
140%
2003 2004 2005 2006
chan
ge
in %
0%
2%
4%
6%
8%
10%
12%
14%
Profit margin
Leverage
Risk weighted assets
turnover
Risk taking ratio
(RWA/assets)
ROAE (right scale)
Figure 60
Movements in level of coverage of non-interest
expenditures with total regular income157.2%
146.9%
0
2,750
5,500
8,250
11,000
2002 2003 2004 2005 2006
in m
illl
ion
of
Den
ars
100%
110%
120%
130%
140%
150%
160%Total regular income
Non-interest expenditures
Level of coverage

59
3.3. Credit risk
3.3.1. Credit exposure - development and structure
On December 31, 2006, the total credit exposure89
of the banking system stood at
Denar 179,188 million, which is by Denar 38,492 million, or by 27.4% more compared to
December 31, 2005. The exposure to legal entities engaged in various economic activities
dominate in the credit exposure with 77.8%, while 22.2% is exposure to the household sector.
In the several recent years, the banks' credit activity has been distinguished by faster
pace of lending to households, and faster increase in the lending in currency component.
Taking into account the low level of financial intermediation (which enables further
increasing in the credit exposure to the household), and particularly the low starting point of
lending to households, it was expected the credit exposure to the households to increase.
In the 2000-2006 period,
the household lending surged by
almost eight times. In the last five
years, the annual growth rate of
the credits to the households
ranged from 40% to 63% (on
December 31, 2000 the credits to
households accounted for 10% of
the total credits, and their share at
the end of 2006 equaled
approximately 35% of the total
credits).
The banks' propensity to lend in currency component was particularly noticeable in
2006, when the foreign
currency indexed credits in
Denars registered a growth
rate of 55.5%, and the
foreign currency credits grew
by 35.4%. The intensive
increase in the lending with
currency component in the
2003-2006 period,
contributed to 4.2 percentage
points higher share of the
foreign currency indexed
loans in Denars in the total
gross credits, i.e. increase in
the share of foreign currency
credits in the gross credits by
10.1 percentage points in the
same period. On the other hand, the share of Denar credits in the total gross credits went
down by 14.3 percentage points.
Fast increase in the credit exposure with currency component denotes higher
exposure to the banking sector to indirect credit risk. Credit denomination in foreign currency
89
The banks credit exposures, besides credits, include claims on other basis (interests, fees, advances,
investments in equities), and non-backed guarantees, L/Cs, and other potential claims of the banks that
show certain level of credit risk.
Figure 62
Movements and growth of the loans to
households
3,71
3
3,99
2
5,85
5 9,39
7 15,3
33 21,5
96
30,8
54
42.9%
40.8%
63.2%60.5%
46.7%
7.5%
42.5%
0
5,000
10,000
15,000
20,000
25,000
30,000
35,000
2000 2001 2002 2003 2004 2005 2006
in m
illio
ns o
f D
enar
s
0%
10%
20%
30%
40%
50%
60%
70%
loans to households (left axis)
annual growth rate of loans to households
Figure 63
Movements and growth of the loans by currency of
denomination
27,851
34,063
42,462
15,2
55
7,3
02
11,4
58
17,4
52
23,6
24
34,953
23,7
19
11,8
46
10,0
33
0
10,000
20,000
30,000
40,000
50,000
2003 2004 2005 2006
in m
illions
of
Den
ars
0%
10%
20%
30%
40%
50%
60%
Denar loans (left axis)
Denar loans with FX clause (left axis)
Foreign currency loans (left axis)
Annual growth rate of denar loans
Annual growth rate of denar loans with FX clause
Annual growth rate of foreign currency loans

60
means hedging of possible exchange rate risk. However, this risk is also transferred to the
borrowers who mostly cannot anticipate and hedge it. In such environment, the exchange rate
risk, the borrowers are exposed to, is demonstrated in a form of indirect credit risk of the
banks, considering that the possible downtrend of the Denar exchange rate could adversely
affect the creditworthiness of the debtors.
3.3.2. Credit exposure quality
The progressive growth in the total credit exposure of the banks in the recent years
undoubtedly means overtaking larger credit risk. Basic feature of the credit portfolio growth
is that most of the new debtors are households and small- and medium-size enterprises (most
of which showing poor credit background). The basic risk for the banks, in such situation, is
the potential deterioration of the financial position of the customer, and consequently, the
capability to repay the credit. Also, the process of credit growth could be accompanied by
loosening the banks' credit policies, which could indirectly mean taking high credit risk by the
banks. Notwithstanding the accelerated lending activity of the banks in 2006, no considerable
loosening of the banks' credit practices has been registered.
The banks' credit
exposure quality shows signs
of deterioration. The
structure of credit exposure
is dominated by regular
credits (67.0%) which rose at
annual rate of 25.2%,
accounting for 62.8% of the
total growth in the credit
exposure. In 2006, the non-
performing credits went
down by 1.9%, leading to
their lower share in the total
credit exposure of the
banking system (from 7.5%
on December 31, 2005 to 5.8% on December 31, 2006). Of course, one should not ignore the
fact that in 2006, the banks wrote off considerable amount of credits in total of Denar 2.1
billion. One bank accounts for approximately 78% of the total amount of write offs in 2006.
Such write offs do not undermine the conclusion for the improved trends in the banks' credit
exposure quality in environment of credit growth, because most of the write offs of this bank
are credit exposure from the preceding years, prior to the accelerated credit growth, i.e. in the
early years of the transitional period.
Credit exposure classified in A
and B risk categories went up by Denar
40,238 million annually, (the credit
exposure in A risk category makes up
86.5% of this growth), so that their
share in the total credit exposure
surged by 3.3 percentage points, and on
December 31, 2006 it equaled 92.4%.
On the other hand, in the same period,
the credit exposure classified in C, D
and E risk categories went down by
Denar 1,746 million, and its share in
the total credit exposure dropped from
10.9% (on December 31, 2005) to
7.6% na December 31, 2006.
Figure 65
Movements of the total absolute amount of
the credit exposure classified in category of
risk ,,C", ,,D" and ,,E"
15,760
13,550
15,29615,74914,860
17,89217,615
0
4,000
8,000
12,000
16,000
20,000
2000 2001 2002 2003 2004 2005 2006
in m
illio
ns
of
Den
ars
Figure 64
Structure of the credit exposure as of 31.12.2006
5.8%0.4%
14.2%
12.6%
67.0%
regular loans non-performing loans
regular interest other claims
off-balance sheet credit exposure

61
Table 25
Credit exposure structure by risk category
As a result of these developments, on December 31, 2006, the average risk level of
the credit exposure in the banking system equaled 6.6% (corresponds to B risk category) and
compared to December 31, 2005, it is by 1.8 percentage points lower.
* Note: The lower value of the indicators as at the end of 2002, compared to the end of 2001, primarily results
from the change in the methodology for classification of on-balance sheet and off-balance sheet asset items, which
extended the term "banks total credit exposure".
The improvement of the banks' credit exposure quality is also demonstrated through
the lower share of non-provisioned amount of credit exposure classified in C, D and E risk
categories (risk exposure reduced by the adequate amount of allocated special reserve) in the
guarantee capital from 26.1% (December 31, 2005) to 19.4% (December 31, 2006). This
means that under assumption of full non-recoverability of the credit exposure classified in C,
D and E risk categories, loss coverage would require less than one fifth of the banks'
guarantee capital. Accordingly, the capital adequacy would reduce from 18.3% to 14.8%,
showing that the solvency of the banking system of the Republic of Macedonia remains stable
even under such extreme scenario.
Along with the improvement
of the aggregate level, the credit
exposure quality improved with respect
to its currency structure demonstrated
through the permanent uptrend of the
indicators for the share of the credit
exposure classified in C, D and E risk
categories in the total credit exposure
by currency (domestic and foreign).
Lowest risk is registered in the foreign
currency credit exposure, partly
Amount (in
millions of
Denars)
Structure
(in %)
Amount (in
millions of
Denars)
Structure
(in %)
A 108,913 77.4% 143,707 80.2% 34,794 31.9% 90.4%
B 16,488 11.7% 21,931 12.2% 5,443 33.0% 14.1%
C 4,473 3.2% 3,807 2.1% -666 -14.9% -1.7%
D 4,420 3.1% 3,435 1.9% -985 -22.3% -2.6%
E 6,403 4.6% 6,308 3.5% -95 -1.5% -0.2%
Total: 140,697 100.0% 179,188 100.0% 38,491 27.4% 100.0%
Risk
category
Credit exposure Change 31.12.2006/31.12.2005
31.12.2005 31.12.2006Amount (in
millions of
Denars)
Rate of
change (in
%)
Share in
the change
(in %)
Figure 66
Indicators of the credit exposure quality
13.2%15.1%15.9%33.7%
10.8%7.6%
9.7%10.3%
8.8%
18.1%
8.4%6.6%
0%
10%
20%
30%
40%
2001 2002 2003 2004 2005 2006
0%
2%
4%
6%
8%
10%
12%
14%
16%
18%
20%
% of C, D and E in total credit exposure (left axis)
average level of risk (right axis)
Figure 67
Indicators of the credit exposure quality
57.4%
71.8%
81.3%81.0%77.7%
95.7%
19.4%
26.1%29.5%
32.5%
41.6%
52.4%
0%
20%
40%
60%
80%
100%
2001 2002 2003 2004 2005 2006
10%
20%
30%
40%
50%
60%
% of C, D and E in regulatory capital (left axis)
% of net C, D and E in regulatory capital (right axis)
Figure 68
Share of credit exposure classified in category of risk
C, D and E in total credit exposure by currency of
denomination
17
.3%
11
.3%
4.5
%
10
.9%
13
.2%
4.7
%
19
.4%
22
.2%
11
.2%
8.2
%
7.6
%
3.1
%
0%
5%
10%
15%
20%
25%
Denar credit
exposure
Denar credit
exposure with
FX clause
Foreign
currency credit
exposure
Total credit
exposure
2004 2005 2006

62
resulting from the fact that the foreign currency lending to residents was liberalized in 2003,
so it is relatively "young" credit portfolio. It is particularly important to emphasize that in
environment of expected growth in the lending in currency component, the National Bank
would tighten the regulatory framework concerning the approval of foreign currency indexed
credits in foreign currency and in Denars.
The credit exposure quality also registered an improvement from the aspect of its
sector structure (to households and to legal entities).
3.3.2.1. Quality of credit exposure to households
The general trend of improving the banks' credit exposure quality also applies to the
credit exposure to households. On December 31, 2006, the share of credit exposure to the
households, classified in risk categories C, D and E, in the total credit exposure to this sector
is 5.4%, which is by 2 percentage points lower compared to December 31, 2005.
At the end of 2006, the average credit exposure classification, measured as a ratio
between the potential losses and the credit exposure to the household sector equaled 4.6%,
which corresponds to the A risk category, and it improved relative to December 31, 2005
(reduction of 0.8 percentage points). The credit exposure quality analysis90
, (measured as a
share of credit exposure classified in C, D and E risk categories in the total credit exposure) as
of December 31, 2005 and December 31, 2006, excluding the effect of the newly extended
credits in 2006, shows that in 2006, the existing credit exposure to natural persons
deteriorated at a faster pace relative to the deterioration of the existing credit exposure to the
non-financial legal entities.
Relatively high concentration rate in the banking system is also manifested in the
banks' lending to households. With respect to the type of banking products offered to the
household sector, there is high concentration of several banks. Even though the Herfindahl-
index dropped in 2006, it is above the acceptable level of all bank products offered to the
90
The analysis has been made by using adequate transitional matrices for natural persons and
customers - non-financial legal entities (companies). The compilation of the transitional matrix for
natural persons takes into account only natural persons - residents whose exposure exceeds Denar
150,000, and the compilation of the transitional matrix for clients - non-financial legal entities
(enterprises) does not take into account the credit exposure of the banks to other domestic banks, to the
legal entities - non-residents (including foreign banks) and to legal entities with total credit exposure
below Denar 500,000).
Figure 69
Share of credit exposure classified in category of risk ,,C", ,,D" and ,,E"
in total credit exposure to households
7.7
%
12
.4%
2.8
%
22
.0%
4.3
%7.8
%
6.5
%
5.2
%
24
.4%
3.8
% 7.4
%
7.4
%
5.3
%
6.6
%
5.1
%
3.2
% 6.5
%
5.4
%
0%
5%
10%
15%
20%
25%
30%
Co
mm
erc
ial
real
est
ate
loan
s
Co
nsu
mer
loan
s
Ov
erd
raft
s
Lo
an
s o
n
the b
asi
s o
f
issu
ed
cre
dit
card
s
Oth
er
loan
s
To
tal
cre
dit
ex
po
sure
to
ho
use
ho
lds
31.12.2004
31.12.2005
31.12.2006

63
household sector. Only in the consumer credits, extended by almost all banks, the Herfindahl-
index is within the acceptable level (1,721 index points on December 31, 2006), which could
be perceived as favorable, considering the largest share of the consumer credits in the
structure of credit exposure to the household sector. The CR-indicators of all analyzed bank
products range above 63% (three, i.e. five banks constitute above 63% of bank products
offered to the household sector). The concentration rate of credits based on issued credit cards
is particularly high, primarily due to the lower number of banks that offer this product (six
banks as of December 31, 2005, i.e. nine banks as of December 31, 2006).
Table 26
Concentration rate by bank product offered to the household sector
The high concentration rate of bank products offered to the household sector also
indicates a high concentration rate of the taken credit risk (at this type of lending) in only
several banks, i.e. its under-dispersion within the banking system.
3.3.2.2. Quality of credit exposure to legal entities
The constant trend of improving the quality of the credit exposure of the banking
system over the past period, also brought about reducing the average risk level of the
exposure to non-financial legal entities and reducing the share of credit exposure classified in
C, D and E risk categories in the total exposure. The average risk level of credit exposure to
non-financial legal entities reduced by 4 percentage points, and on December 31, 2006, it
equaled 10.7%, whereas the credit exposure classified in C, D and E risk categories made up
12.3% of the total credit exposure, which is by 6.8 percentage points less compared to 2005.
Compared to the end of 2005, the industry sector and the agriculture, hunting and forestry
sector registered a decrease in the average risk level by 6.4 and 5.9 percentage points,
respectively, and on December 31, 2006, the average risk level for these sectors equaled
15.1% and 19.3%, respectively. In addition, the share of credit exposure classified in C, D and
E risk categories in the total credit exposure to the agriculture, hunting and forestry sector
also registered a inconsiderable decline of 15.8 percentage points (on December 31, 2006 this
indicator equaled 20.7%). The lowest risk level was registered in the credit exposure to the
transport, storage and communications sector, where the average risk level equaled 8.2%, and
the share of credit exposure classified in C, D and E risk categories in the total credit
exposure to this sector equaled 6.9%. Deterioration of the average risk level was registered at
the end of 2006, only in three sectors (activities related to real estate, leasing and business
activities, other communal, cultural, general and personal service activities and exterritorial
organizations and bodies), constituting 2.4% of the total credit exposure to legal entities.
The lending to legal entities is also characterized by a high concentration rate.
Although the Herfindahl-index, calculated for credits to enterprises shows acceptable (and yet
high) concentration rate, however, the index deteriorated by 29 index points in the last year.
The CR-indicators are also high and exceed 70% (three, i.e. five banks approved above 70%
of the credits to enterprises).
Herfindahl
indexCR3 CR5
Number of banks
which provide the
service
Herfindahl
indexCR3 CR5
Number of banks
which provide the
service
Residential real estate
loans3,183 89.2% 94.1% 13 2,954 84.2% 96.3% 14
Consumer loans 2,171 68.5% 79.7% 18 1,721 63.2% 76.4% 17
Overdrafts 3,300 85.9% 94.1% 15 2,613 83.6% 93.5% 14
Loans on the basis of
issued credit cards5,178 92.9% 100.0% 6 5,485 92.6% 99.1% 9
31.12.2005 31.12.2006
Type of credit exposure
to households

64
0%
20%
40%
60%
80%
0
20,000
40,000
60,000
80,000
100,000
120,000
Dec.2003 June 2004 Dec.2004 June 2005 Dec.2005 June 2006 Dec.2006
Sh
are i
n %
in m
illi
on
s o
f D
en
ars
Figure 70
Trend and share of foreign currency assets and foreign currency liabilities in the total assets and total liabilities
Foreign currency assets(left scale)Foreign currency liabilities(left scale)Foreign currency assets/Total assets(right scale)Foreign currency liabilities/Total liabilities(right scale)
Table 27
Concentration rate in the lending to enterprises
The high concentration rate of lending to legal entities in only several banks points
out a high concentration rate of credit risk, i.e. its under-dispersion within the banking system.
3.4. Exchange rate risk
One of the
specifics of the banking
system of the Republic
of Macedonia is the
noticeable presence of
foreign currency
component in the banks'
balance sheets. On
December 31, 2006, the
share of foreign currency
assets, i.e. foreign
currency liabilities in the
total assets and liabilities
of the banking system
equaled 56.7% and
50.6%, respectively. The annual growth in foreign currency assets and foreign currency
liabilities for 2006 equaled 21.3% and 23.6%, respectively. The major driver of the growth in
the foreign currency component in the balance sheet of the banking system was the increase
in the foreign currency indexed credits in foreign currency and in Denars, and the increase in
the foreign currency deposits, the foreign currency assets of foreign persons and foreign
currency indexed deposits in Denar. Such share of foreign currency component implies
exposure of the banks to exchange rate risk.
In 2006, same as in the previous years, the Euro dominated the currency structure of
the assets and liabilities, and the open currency position91
in Euro made up 82.4% of the total
amount of open currency position in the banking system. This is a result of the relatively high
degree of currency substitution in the Macedonian economy and of the foreign trade structure
dominated by the Eurozone countries. The US Dollar, even though the second most used
currency in the banks operations accounts for only 0.7% of the open currency position of the
banking system.
91
In the analysis of the exchange rate risk, since December 2005, two banks have been excluded from
the banking system. According to the Law on Amending the Law on Establishing Macedonian Bank
for Development Support ("Official Gazette of the Republic of Macedonia" no. 109/05), this bank is
not subject to regulations governing the open currency position. Also, according to the Decision on
determining and calculating banks' open currency positions ("Official Gazette of the Republic of
Macedonia" no. 103/01), one bank is not bound to report on the open currency position because its
foreign currency assets, i.e. foreign currency liabilities are below 20% of the bank's guarantee capital.
Level of concentration 31.12.2005 31.12.2006
Herfindahl- index 1,750 1,779
CR3 70.4% 79.8%
CR5 79.9% 79.3%
Number of banks which perform credit activities to legal entities20 19
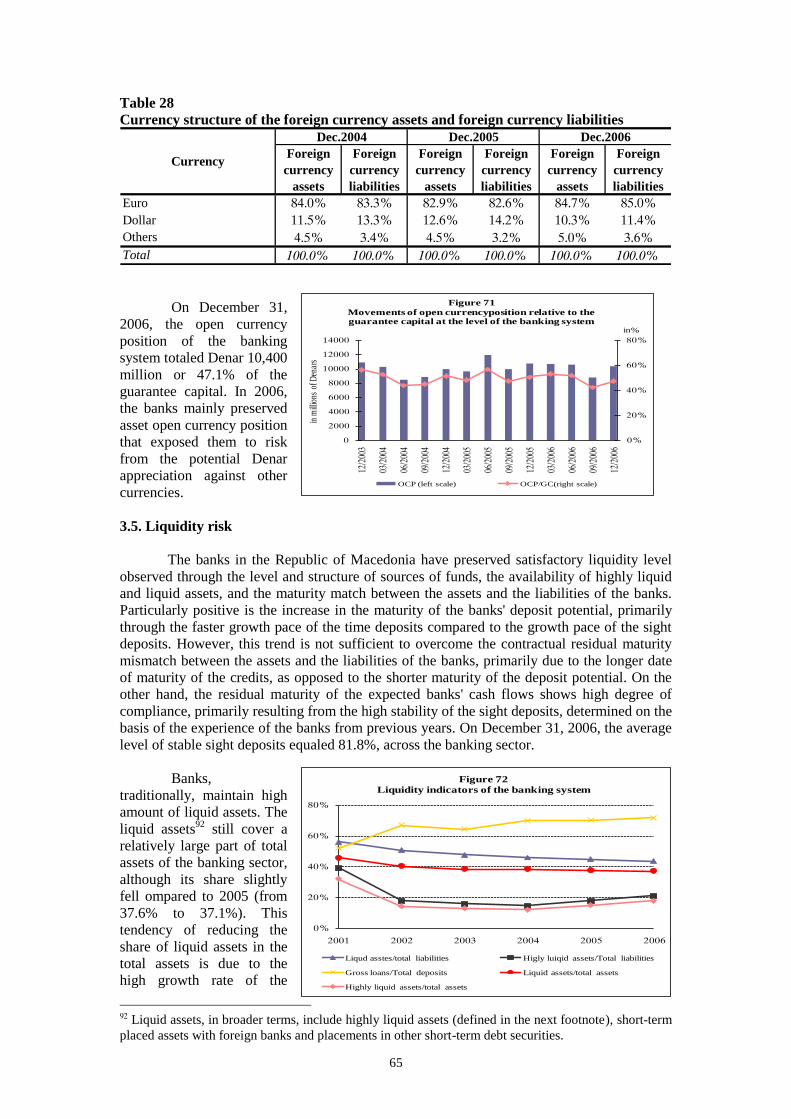
65
0%
20%
40%
60%
80%
0
2000
4000
6000
8000
10000
12000
14000
12/2
003
03/2
004
06/2
004
09/2
004
12/2
004
03/2
005
06/2
005
09/2
005
12/2
005
03/2
006
06/2
006
09/2
006
12/2
006
in%
in m
illio
ns o
f Den
ars
Figure 71
Movements of open currencyposition relative to the guarantee capital at the level of the banking system
OCP (left scale) OCP/GC(right scale)
0%
20%
40%
60%
80%
2001 2002 2003 2004 2005 2006
Figure 72
Liquidity indicators of the banking system
Liqud asstes/total liabilities Higly luiqid assets/Total liabilities
Gross loans/Total deposits Liquid assets/total assets
Highly liquid assets/total assets
Table 28
Currency structure of the foreign currency assets and foreign currency liabilities
Foreign
currency
assets
Foreign
currency
liabilities
Foreign
currency
assets
Foreign
currency
liabilities
Foreign
currency
assets
Foreign
currency
liabilities
Euro 84.0% 83.3% 82.9% 82.6% 84.7% 85.0%
Dollar 11.5% 13.3% 12.6% 14.2% 10.3% 11.4%
Others 4.5% 3.4% 4.5% 3.2% 5.0% 3.6%
Total 100.0% 100.0% 100.0% 100.0% 100.0% 100.0%
Dec.2006
Currency
Dec.2004 Dec.2005
On December 31,
2006, the open currency
position of the banking
system totaled Denar 10,400
million or 47.1% of the
guarantee capital. In 2006,
the banks mainly preserved
asset open currency position
that exposed them to risk
from the potential Denar
appreciation against other
currencies.
3.5. Liquidity risk
The banks in the Republic of Macedonia have preserved satisfactory liquidity level
observed through the level and structure of sources of funds, the availability of highly liquid
and liquid assets, and the maturity match between the assets and the liabilities of the banks.
Particularly positive is the increase in the maturity of the banks' deposit potential, primarily
through the faster growth pace of the time deposits compared to the growth pace of the sight
deposits. However, this trend is not sufficient to overcome the contractual residual maturity
mismatch between the assets and the liabilities of the banks, primarily due to the longer date
of maturity of the credits, as opposed to the shorter maturity of the deposit potential. On the
other hand, the residual maturity of the expected banks' cash flows shows high degree of
compliance, primarily resulting from the high stability of the sight deposits, determined on the
basis of the experience of the banks from previous years. On December 31, 2006, the average
level of stable sight deposits equaled 81.8%, across the banking sector.
Banks,
traditionally, maintain high
amount of liquid assets. The
liquid assets92
still cover a
relatively large part of total
assets of the banking sector,
although its share slightly
fell ompared to 2005 (from
37.6% to 37.1%). This
tendency of reducing the
share of liquid assets in the
total assets is due to the
high growth rate of the
92 Liquid assets, in broader terms, include highly liquid assets (defined in the next footnote), short-term
placed assets with foreign banks and placements in other short-term debt securities.
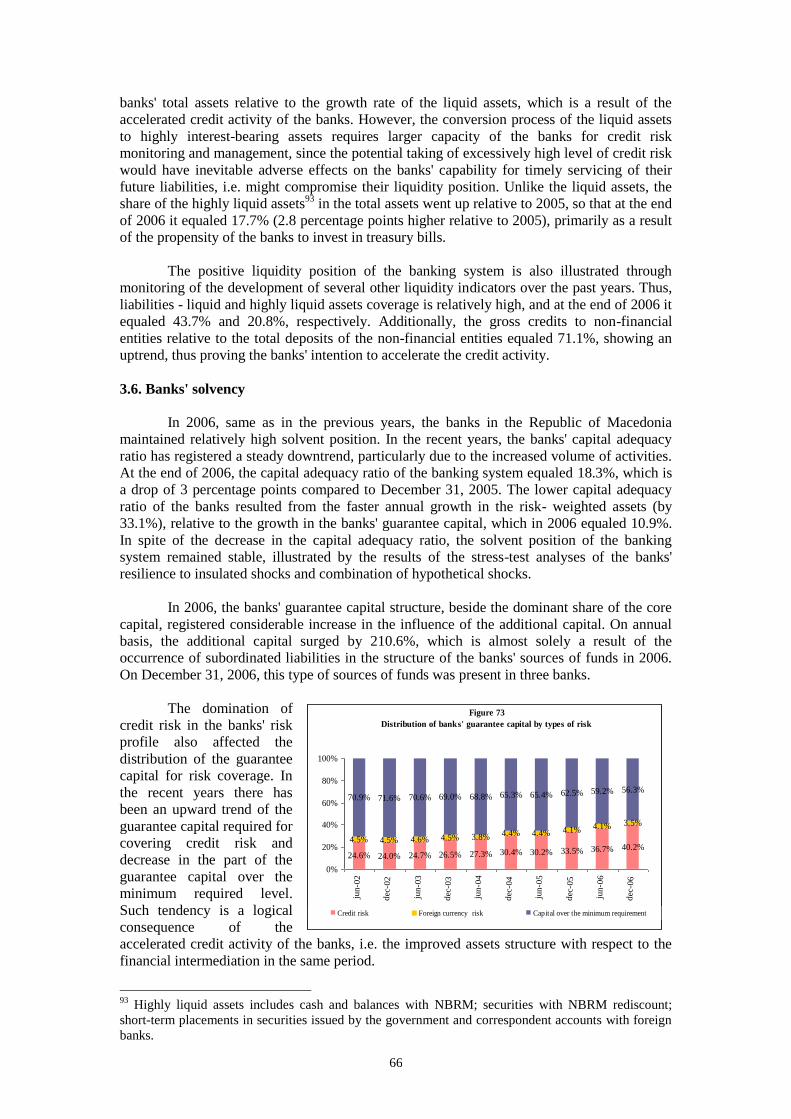
66
banks' total assets relative to the growth rate of the liquid assets, which is a result of the
accelerated credit activity of the banks. However, the conversion process of the liquid assets
to highly interest-bearing assets requires larger capacity of the banks for credit risk
monitoring and management, since the potential taking of excessively high level of credit risk
would have inevitable adverse effects on the banks' capability for timely servicing of their
future liabilities, i.e. might compromise their liquidity position. Unlike the liquid assets, the
share of the highly liquid assets93
in the total assets went up relative to 2005, so that at the end
of 2006 it equaled 17.7% (2.8 percentage points higher relative to 2005), primarily as a result
of the propensity of the banks to invest in treasury bills.
The positive liquidity position of the banking system is also illustrated through
monitoring of the development of several other liquidity indicators over the past years. Thus,
liabilities - liquid and highly liquid assets coverage is relatively high, and at the end of 2006 it
equaled 43.7% and 20.8%, respectively. Additionally, the gross credits to non-financial
entities relative to the total deposits of the non-financial entities equaled 71.1%, showing an
uptrend, thus proving the banks' intention to accelerate the credit activity.
3.6. Banks' solvency
In 2006, same as in the previous years, the banks in the Republic of Macedonia
maintained relatively high solvent position. In the recent years, the banks' capital adequacy
ratio has registered a steady downtrend, particularly due to the increased volume of activities.
At the end of 2006, the capital adequacy ratio of the banking system equaled 18.3%, which is
a drop of 3 percentage points compared to December 31, 2005. The lower capital adequacy
ratio of the banks resulted from the faster annual growth in the risk- weighted assets (by
33.1%), relative to the growth in the banks' guarantee capital, which in 2006 equaled 10.9%.
In spite of the decrease in the capital adequacy ratio, the solvent position of the banking
system remained stable, illustrated by the results of the stress-test analyses of the banks'
resilience to insulated shocks and combination of hypothetical shocks.
In 2006, the banks' guarantee capital structure, beside the dominant share of the core
capital, registered considerable increase in the influence of the additional capital. On annual
basis, the additional capital surged by 210.6%, which is almost solely a result of the
occurrence of subordinated liabilities in the structure of the banks' sources of funds in 2006.
On December 31, 2006, this type of sources of funds was present in three banks.
The domination of
credit risk in the banks' risk
profile also affected the
distribution of the guarantee
capital for risk coverage. In
the recent years there has
been an upward trend of the
guarantee capital required for
covering credit risk and
decrease in the part of the
guarantee capital over the
minimum required level.
Such tendency is a logical
consequence of the
accelerated credit activity of the banks, i.e. the improved assets structure with respect to the
financial intermediation in the same period.
93
Highly liquid assets includes cash and balances with NBRM; securities with NBRM rediscount;
short-term placements in securities issued by the government and correspondent accounts with foreign
banks.
Figure 73
Distribution of banks' guarantee capital by types of risk
24.6% 24.0% 24.7% 26.5% 27.3% 30.4% 30.2% 33.5% 36.7% 40.2%4.5% 4.5% 4.6% 4.5% 3.8% 4.4% 4.4% 4.1% 4.1% 3.5%
71.6% 70.6% 69.0% 68.8% 65.3% 65.4% 62.5% 59.2% 56.3%70.9%
0%
20%
40%
60%
80%
100%
jun-0
2
dec
-02
jun-0
3
dec
-03
jun-0
4
dec
-04
jun-0
5
dec
-05
jun-0
6
dec
-06
Credit risk Foreign currency risk Capital over the minimum requirement

67
As of December 31,
2006, none of the banks
registered capital adequacy
ratio below the minimum
requirement of 8%. In the
last years, along with the
decrease in the capital
adequacy ratio of the
banking system, the relative
importance of assets of the
banks with capital adequacy
ratio below 15% increased.
Thus, in 2006, 69.0% of the
total assets in the banking system were concentrated in banks with capital adequacy ratio
below 15%.
Considering the
sources of further increase in
the capital, the banks in the
Republic of Macedonia
mainly rely upon the
recapitalization by their
parent entities, or upon
internal sources of funds
secured by retaining the
generated gain during its
distribution. The financing
by issuing equity securities
is of relatively restricted
meaning and most often
these issues are intended for known buyers or it is due to the payment of scrip-dividends. In
2006, more than 60% of the total amount of gain generated by the banks were kept in the
banks as undistributed gain, increasing the reserves or covering losses from previous years.
3.7. Stress-test analysis for assessment of the banking system resilience to various shocks
The National Bank has been conducting stress-test analyses of the banking system
resilience to hypothetical shocks since the second half of 2004. In the initial period, the stress-
test analysis was based on FSAP94
methodology and covered an assessment on the sensitivity
of the banking system to insulated credit shock and to the combination of credit, foreign
currency and interest rate shock (so called basic stress-test analysis) by applying the following
hypothetical scenarios:
1. Increase95
of credit exposure classified in C, D and E by 10%;
2. Increase of credit exposure classified in C, D and E by 30%;
3. Increase of credit exposure classified in C, D and E by 50%;
4. Combination of credit shock (increase of the credit exposure classified in C, D
and E by 30%) and increase in the domestic interest rates by 5 percentage points;
5. Combination of credit shock (increase of credit exposure classified in C, D and E
by 50%) and 20% depreciation of the exchange rate of the Denar against the Euro
and the US Dollar and
94 Financial Sector Assessment Program. 95
The increase in credit exposure in C, D and E risk categories stems from the decrease
(reclassification) of the credit exposure classified in the A risk category.
Figure 74
Distribution of banks' assets according to capital
adequacy ratio
0%
10%
20%
30%
40%
50%
60%
70%
80%
2004 2005 2006
shar
e in
ass
ets
(as
%)
below 8% from 8% to 15% from 15% to 20 %
from 20% to 30% from 30% to 50% above 50%
Figure 75
Distribution of banks' profit for 2006
22.5%
38.7%
36.6%
2.1% Dividends
Reserves
Unallocated profit
Covering loss from
previous years

68
6. Above scenario supplemented by interest rate risk (assumption that the domestic
interest rates surge by 5 percentage points).
The analysis of these simulations as of December 31, 2006, indicates that the overall
banking system has been significantly resilient to hypothetical shocks. By applying these
scenarios, there is no evidence of larger disturbance of the banking system solvency. Most
significant decrease in the capital adequacy ratio occurs in the third scenario, when the capital
adequacy ratio drops from 18.3% to 15.4%.
Figure 76
Banks' capital adequacy ratio for the six scenarios of the basic stress-
test analysis
1.1.
1.2.
2.
2.3.
3.3.
4.4.
4.5.
5.
5.6. 6.
6.
0%
5%
10%
15%
20%
25%
2004 2005 2006
Banks' capital adequacy ratio before scenarios
Since September 30, 2005, the National Bank has developed and applied advanced
stress-test, which is a supplement to the basic stress-test analysis. The goal of this stress-test
analysis is to assess the resilience of the banking system to credit and liquidity risk, by
applying five additional hypothetical scenarios. The general conclusion of these quarterly
analyses is that the banking system in the Republic of Macedonia shows greater resilience to
liquidity risk, rather than to the credit risk as a result of the high amount of liquid assets of the
banks.
The first scenario of this stress-test analysis rests on the quantification of the
maximum possible growth of credit activity, without jeopardizing the banks' solvency. The
analysis conducted on December 31, 2006, relying upon the structure and the quality of the
banks' credit portfolio
showed that the gross
credits of the banking
system may surge by
63.2%, without jeopardizing
the solvent position of the
banking system, i.e. without
reducing the capital
adequacy ratio below 8%.
In the application of this
scenario, the assumption
showed that after the
simulation, the currency
structure and the quality of the credit portfolio are identical with the currency structure before
the implementation of the simulation. In spite of the decrease in the maximum possible
growth of credit activity relative to 2005 (when it equaled 77.6%), the banks still have ample
capacity to increase the lending volume. In 2006, the growth rate of the credit portfolio
equaled 30.5%.
The next hypothetical scenario shows the maximum level of deterioration of the
credit portfolio, without jeopardizing the solvency of the banks (without reducing the capital
adequacy ratio below 8%). This scenario shows that not more than 10.6% of the regular
75.4%77.6% 78.2%
70.0%67.5%
63.2%
50%
55%
60%
65%
70%
75%
80%
09/2005 12/2005 03/2006 06/2006 09/2006 12/2006
Figure 77
Quantification of the maximum possible increase of he credit activity without deterioration the bank's solvency position

69
credits could be reclassified to E risk category (14.1% for 2005), without disturbing the banks'
solvency. The probability for this scenario is insignificant considering that the absolute
amount of credits, which would be reclassified into E risk category according to this scenario,
is Denar 12.5 billion, and the total amount of non-performing credits on December 31, 2006
stood at Denar 10 billion.
The last scenario includes the effects on the capital adequacy ratio of the ten largest
borrowers of the banking system in (1) C risk category (2) D risk category and (3) E risk
category. On December 31, 2006, the ten largest credit users borrowed from total of ten banks
(most present in two banks), accounting for 4.4% of the total credit exposure of the banking
sector, i.e. 8.9% of the gross credits to non-financial entities. In the first case of this scenario
(reclassification into C risk category) no considerable effect was registered on the capital
adequacy ratio, observing bank-by-bank and the overall banking system. The capital
adequacy ratio would reduce from 18.3% to 17.2%, which is still well above the minimum
requirement of 8%. In the last two cases of this scenario (reclassification of the ten largest
borrowers into D risk category, i.e. E risk category), although there is certain evident
reduction, the capital adequacy ratio of the banking system still remains above the minimum
requirement of 8% and equaled 15.9% (in reclassification into D risk category), i.e. 13.2% (in
reclassification in E risk category).
The banking system of the Republic of Macedonia is significantly resilient to
liquidity risk, illustrated by the results from the simulations to liquidity shocks and their
consequences. In the simulation of one-time withdrawal of 20% of the household deposits
from the banking system (or Denar 14,284 million), the banking system would preserve its
stability, but it would lead to reduction of the highly liquid assets (by 47%) and the liquid
assets (by 22.4%). It would simultaneously lead to reduction of the share of the highly liquid
assets from 17.7% to 10.3%, and of the liquid assets in the total assets from 37.1% to 31.4%.
On December 31, 2006, the coverage of the liabilities with liquid and highly liquid assets
equaled 43.7% and 20.8%, respectively. This coverage ratio of the total liabilities after the
application of the hypothetical deposit withdrawal would reduce to 33.3%, i.e. to 10.9%,
respectively.
The following simulation lays on the withdrawal of deposits of the twenty largest
deposits by bank, outside the banking system. As of December 31, 2006, the total deposits of
the twenty largest deposits by bank covered 27.4% of the total average deposit base of the
banking system or Denar 32,488 million. Such withdrawal would result in lack of highly
liquid assets in seven banks, and in the remaining banks, the reduction of the highly liquid
assets would range from 0.2% to 99.7%. However, the lack of highly liquid assets could be
compensated by the amount of liquid assets, where only in one bank the liquid assets would
not be enough to cover the outflow of deposits of the twenty largest depositors. The analysis
of the results of this simulation should not ignore the knowledge acquired from the experience
of the development of the banks' deposit base, which indicate that the likelihood of this
hypothetical scenario to become a reality is minimal.
4. Non-deposit financial institutions
4.1. Insurance sector
Term and basic features of the insurance
Insurance is an agreement (insurance policy) bounding one party to indemnify the
counterparty for damages, for a certain compensation (insurance premium). The insurance
companies are an essential source of funds in the developed market economies through which
the natural persons and non-financial legal entities accumulate their savings. As a part of the
financial system of a country, the insurance sector contributes to the economic growth by

70
ensuring financial stability for the natural persons and other entities, absorbing the available
funds from the surplus economic entities, risk dispersion within the economy, etc.
The insurance industry is composed of three segments: life insurance, non-life
insurance and reinsurance.
Life insurance is insurance of persons by cumulating their funds in the form of
savings, for covering the increased risks later in the insurance years. The life insurance
policies may contain not only insurance, but also an investment component, which means that
such policies, as well as other financial instruments are placements of the assets of surplus-
making economic units.
Non-life insurance is an insurance of personal belongings and indemnifies damages
resulting from accident, fire or negligence. Unlike the life insurance policies, the insurance
policies on properties and accidents are of exclusively insurance nature, rather than
investment.
Reinsurance is insurance of the primary insurance company from contingent or high
losses.
The basic legal framework in the Republic of Macedonia that regulates the conditions
and the method of performing insurance and reinsurance activities, supervision of the
insurance companies and insurance - brokerage houses and the method and conditions of
conducting insurance intermediation activities consists of the Law on Insurance Supervision,
Law on Compulsory Transport Insurance, Law on Contracts concerning the insurance
contracts and the Company Law.
4.1.1. Features and importance of insurance sector in the Republic of Macedonia
According to the Law on Insurance Supervision, the Ministry of Finance has been an
authorized regulatory and supervisory body of the insurance industry in the Republic of
Macedonia. Although the law has been applying for five years, the function of supervision of
the insurance sector has not been fully conformed to the Core Insurance Principles, as defined
by the International Association of Insurance Supervisors (IAIS). Weaknesses of the
supervisory body (lack of full independence, understaffing compared to the insurance
companies and their workload, under-transparency) is one of the basic potential risks to the
insurance sector, and hence to the financial stability of the country. For overcoming such
situations, and for increasing the independence of the supervision of insurance industry, in
June 2007, the Law was amended requiring the supervision of insurance sector to be
conducted by an independent Insurance Supervision Agency. The amendments to the Law
include provisions directed towards implementing the risk management process by the
insurance companies.
The insurance sector in the Republic of Macedonia still has a marginal relevance
within the financial market of the country, from the aspect of both the range of services
offered on the market and the quantitative share in the total financial system.
On December 31, 2006, ten insurance companies and insurance brokerage houses
have been registered in the Republic of Macedonia. Compared to December 31, 2005, the
number of insurance companies remained unchanged, whereas the number of insurance
brokerage houses increased by one new company. Only one insurance company offers life
insurance service, while all other nine insurance companies cover non-life insurance. One of
these nine insurance companies ceased providing life insurance services, so that its activities
in the area of life insurance consist solely of servicing the pre-concluded life insurance
agreements. In early 2007, the Ministry of Finance granted two new insurance licenses, one

71
0.0%
2.0%
4.0%
6.0%
8.0%
10.0%
12.0%
14.0%
Ro
ma
nia
Tu
rkey
Ma
ced
on
ia-2
00
6
Bu
lga
ria
Gre
ece
Po
lan
d
Cro
ati
a
Au
stri
a
Ger
ma
ny
Ita
ly
Den
ma
rk
EU
25
Sw
itze
rla
nd
Bel
gu
m
En
gla
nd
Figure 78
Penetration rate od insurance sector in Europe
non-life insurance license and one life insurance license. In the both cases, the only founders
are the foreign insurance companies.
On December 31, 2006, the total assets of the insurance sector stood at Denar 14,608
million, making up 7.5% of the total assets of the financial system. Relative to 2005, the
insurance sector assets increased by Denar 990 million, or by 7.3%, primarily a result of the
growth in the insurance companies' assets in the field of non-life insurance. The share of the
insurance sector in the total assets of the financial system reduced by 1.1 percentage points.
Notwithstanding the marginal share in the financial system assets, the insurance sector is still
important to the stability of the country, due to the nature of the insurance and its influence on
the life and work security of all economic entities in the country.
The insurance sector dominates within the non-deposit financial institutions,
constituting 75.3% of the total assets.
The policy premiums almost solely resulted from the sale of policies through the
agency network of the insurance companies. It should be noted that the sale of automobile
liability insurance policy is mostly made through the stations of technical examination of
motor vehicles. The share of the insurance brokerage houses in the sale of insurance
agreements was marginal, making up 0.53% of the gross policy premiums in 2006.
In 2006,
the total amount of
policy gross-
premiums by the
insurance sector
equaled 1.8% of
GDP of the country
(so called
penetration rate).
This rate is between
the lowest rates in
Europe, but before
the insurance
markets of Turkey
(1.6%) and
Romania (1.1%)96
.
Table 29
Gross policy premiums from insurance companies97
2005 2006 Growth rate
Total gross premium (millions of Denars) 5,105 5,445 6.66%
Structure of premium
Life insurance 2.14% 2.12% 5.88%
Non -life insurance and reinsurance 97.86% 97.88% 6.67%
In 2006, the gross premiums surged by approximately 7%, which is almost solely due
to the increase in the non-life insurance policies, as a dominant category in the gross
premiums. Total of 453,439 insurance policies were sold in 2006, most of which (98.4%) in
the field of non-life insurance98
. The increase in the total gross premiums is mostly (88.6%)
due to the premiums based on motor vehicle liability insurance, as a segment of non-life
96 Source of data: CEA Statistics N
o24 June 2006.
97 Source of data: Ministry of Finance of the Republic of Macedonia.
98 Throughout the text of this part of the Report, the premium amount and the number of policies sold
in the field of non-life insurance also includes the relevant reinsurance amounts.

72
Note: The data on the Republic of Macedonia refer to
2006, and those on all other countries refer to 2005.
0.0%10.0%20.0%30.0%40.0%50.0%60.0%70.0%80.0%90.0%
100.0%
Gre
ece
EU
25
Ita
ly
Bu
lga
ria
Ger
ma
ny
Ma
ced
on
ia-2
00
6
Po
lan
d
Cze
ch R
epu
bli
c
Slo
ven
ia
Figure 79
CR5 for non-life insurance premiums
insurance. The life insurance contributes with modest 1.9% of the total increase in the gross
premiums.
At the end of 2006, the private capital dominates the ownership structure of the
insurance capital with 91.54%. Thus, 63.5%99
of the total capital of the insurance companies
is owned by foreign founders (60.1% - December 31, 2005). The share of foreign capital in
six of ten insurance companies was above 51%, in four of which it equaled 100%. These six
companies account for 72.6% of the total assets (December 31, 2005 - 74.2%), i.e. 60.9% of
the total capital of the insurance sector (December 31, 2005 - 58.1%).
The insurance sector in the Republic of Macedonia is characterized by relatively high
market concentration, from the aspect of overall sector and type of insurance. The
concentration rate shows a downtrend, primarily due to the sharp market competition. The
CR5 indicator, calculated for the total gross premiums100
, at the end of 2006 equaled 81.0%
and, compared to 2005, it dropped by 6.5 percentage points.
The concentration is particularly high in the life insurance, which as of the end of
2006, was offered by only one insurance company, and in the reinsurance, which is also
offered by only by one insurance company.
The CR5 indicator,
calculated for the gross
premiums for non-life
insurance equaled 81.4%. In
spite of the downtrend
(reduction of 6.1 percentage
points relative to the
preceding year), this
concentration rate ranks
among the highest ones
compared to other
European countries.
In the EU member states, the CR5indicator, calculated for the non-life insurance
premiums, increased by 22.4 percentage points in the last ten years, and equaled 58%.
On December 31, 2006, the Herfindahl - index rate, calculated according to the
amount of gross premiums equaled 1,742 showing high, but acceptable concentration rate.
According to this indicator, the concentration in the insurance sector has also decreased by
345 index points relative to 2005.
4.1.2. Insurance sector performances
Solvency margin
At the end of 2006, the total capital of the insurance companies amounted to Denar
2,688 million101
, making up 18.4% of the total assets of the insurance sector (December 31,
2005 - 18.5%). The Law on Insurance Supervision requires the insurance company's capital at
all times to be at least equal to the solvency margin requirement. The insurance sector capital
99
Source of data: CSD. 100
Share of calculated gross premiums of the five largest insurance companies in the total gross
premiums. 101
Source: Ministry of Finance - based on report on the operations of the insurance companies for the
last quarter of 2006.

73
is considerable higher than the solvency margin. At the end of 2006, the solvency margin, as a
key indicator for the assessment of the insurance sector stability, for non-life insurance
equaled Denar 856 million - according to the premium rate method102
(Denar 699 million -
according to the damage rate method). The excess capital of the insurance sector in the field
of non-life insurance, according to the premium rate method stood at Denar 1,645 million, or
192.2% over the solvency margin. On December 31, 2006, only one insurance company, of
the non-life insurance class, failed to meet the solvency margin requirement.
In the life insurance, the solvency margin equals Denar 15 million, so that the capital
surplus over the solvency margin amounts to Denar 172 million, or 1,127.9%. The reason
behind the high surplus is the fact that the mathematical reserve and the total insurance
amount (both parameters that determine the solvency margin in the insurance companies that
provide life insurance services) are low. One life insurance company just launched its
operations (second year), and these parameters of the other company, due to the strategy to
cease providing services in this group of insurance, reduce, based on the due insurance
contracts.
Profitability
At the end of 2006, the insurance sector generated net-gain of Denar 272 million,
which is by 41.8% higher compared to 2005. The increase in the gain resulted from the higher
workload, i.e. higher number of sold policies and insurance policy premiums, and from the
lower damage ratio.
Analyzing the type of insurance, in 2006, the gain generated by non-life insurance
(together with the reinsurance) stood at Denar 286 million, which is by 62.5% higher
compared to the preceding year. The life insurance showed loss for 2006 of Denar 14 million.
The technical result103
for non-life and life insurance is negative. On December 31,
2006, the negative technical result for non-life insurance totaled Denar 73 million (the
technical result for 2005 was negative, equaling -214 millions of denars). This indicates that
although the negative amount of the technical result decreases, there are still certain
weaknesses in the risk management by the insurance companies.
Unlike 2005, when the technical result of the life insurance was positive, 2006
registered negative technical result of Denar 21 million. The negative technical result, same as
the high surplus of capital over the solvency margin of the life insurance companies is due to
the fact that one of the insurance companies provides servicing of already concluded life
insurance agreements, without taking new activities in that area.
The claims ratio, calculated as a ratio between the paid off damages and calculated
premiums in the insurance sector equaled 51.4%, and for the non-life insurance (including the
reinsurance) it equaled 50.4%. These ratios dropped relative to the end of 2005, when they
equaled 56.2%, i.e. 56%, respectively. This indicates that the premiums collected on the basis
of the insurance as a whole, and individually, for non-life insurance, were sufficient for
indemnification of damages.
102
The capital of non-life insurance and/or reinsurance companies should, at all times, be at least equal
to the solvency margin requirement, which is calculated by applying the premium rate method or the
damage rate method, depending on the method which would give higher result. 103
The technical result of the operations of the insurance companies is a result of the performance of
the primary activity - insurance. The other operating income and expenditures represent non-technical
result.

74
Table 30
Claims ratio in the non-life insurance in the Republic of Macedonia
The situation is different in the life insurance segment, where the claims ratio is
considerably higher, and on December 31, 2006 it equaled 94.3% (28.3 percentage points
more compared to 2005). The high rate of claims in the life insurance is also due to the fact
that one of the insurance companies ceased providing life insurance services, and therefore its
inflows from newly concluded life insurance agreements reduced to zero, while the inflows
and payments based on previously concluded life insurance agreements are still active.
At the end of 2006, the return on assets (ROA) and equity (ROE) of the insurance
sector equaled 1.9%, i.e. 10.4%, respectively. The gross income of the insurance sector
investment, (and individually, for non-life and life insurance), generated in 2006, relative to
the net premiums equaled 7.1% (7.0% and 10.0%, respectively), which is almost identical as
in 2005, except for the generated income from the investments in the life insurance, which in
2005 was higher and equaled 26.4%. In 2006, the investments income increased relative to
the investment assets, and on December 31, 2006 it equaled 21.1%, compared to 18.2% on
December 31, 2005.
On December 31, 2006, the investment asset of the insurance companies constituted
11.1% of their total assets (9.7% in 2005).
The assets investment structure that covers the technical reserves of the insurance
companies that provide non-life insurance services, improved compared to 2005. Thus, the
share of the deposits in banks was the largest with 43.1% (2005: 32.8%), followed by
securities issued by the NBRM with 26.2% (2005: 2.7%), securities issued by the Republic of
Macedonia with 17.1% (2005: 19.4%) and investments in other securities with 9.4% (2005:
18.7%).
0.0%
20.0%
40.0%
60.0%
80.0%
100.0%
120.0%
2005 2006
Figure 80
Assets covering technical provisions for non-life insurance
Deposits of banks CB bills
Treasury securities and bonds Investments in other securities
Loans Cash
82%84%86%88%90%92%94%96%98%
100%102%
2005 2006
Figure 81
Assets covering mathematical provisions for life insurance
Deposits of banks Treasury securities Cash
In 2006, the asset structure, that covers the mathematical reserve for the insurance
companies that provide life insurance services, is dominated by deposits in banks with 89%,
followed by the securities issued by the Republic of Macedonia (treasury bills) with 10.7%
2006 2005 Change
Motor-vehicle responsibility 57.9% 63.7% -5.8%
Property insurance against natural disasters, burglary ect. 33.4% 52.2% -18.8%
Air-craft insurance 0.0% 72.4% -72.4%
Accident insurance 62.3% 61.9% 0.3%
Garancies 675.7% 0.0% 675.7%
Financial losses 7.4% 4.7% 2.7%
Travel insurance 48.2% 10.6% 37.6%
Non-life insurnce
Claims ratio
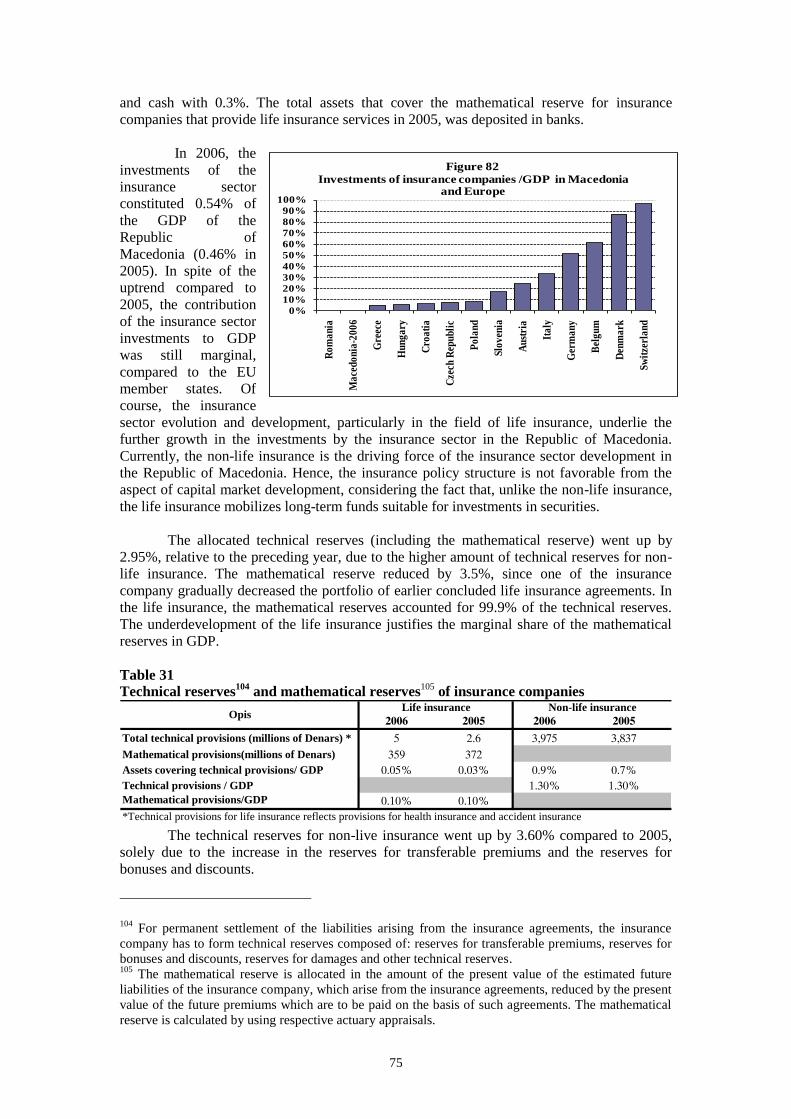
75
0%
10%
20%
30%
40%
50%
60%
70%
80%
90%
100%
Ro
ma
nia
Ma
ced
on
ia-2
00
6
Gre
ece
Hu
ng
ary
Cro
ati
a
Cze
ch R
epu
bli
c
Po
lan
d
Slo
ven
ia
Au
stri
a
Ita
ly
Ger
ma
ny
Bel
gu
m
Den
ma
rk
Sw
itze
rla
nd
Figure 82
Investments of insurance companies /GDP in Macedonia and Europe
and cash with 0.3%. The total assets that cover the mathematical reserve for insurance
companies that provide life insurance services in 2005, was deposited in banks.
In 2006, the
investments of the
insurance sector
constituted 0.54% of
the GDP of the
Republic of
Macedonia (0.46% in
2005). In spite of the
uptrend compared to
2005, the contribution
of the insurance sector
investments to GDP
was still marginal,
compared to the EU
member states. Of
course, the insurance
sector evolution and development, particularly in the field of life insurance, underlie the
further growth in the investments by the insurance sector in the Republic of Macedonia.
Currently, the non-life insurance is the driving force of the insurance sector development in
the Republic of Macedonia. Hence, the insurance policy structure is not favorable from the
aspect of capital market development, considering the fact that, unlike the non-life insurance,
the life insurance mobilizes long-term funds suitable for investments in securities.
The allocated technical reserves (including the mathematical reserve) went up by
2.95%, relative to the preceding year, due to the higher amount of technical reserves for non-
life insurance. The mathematical reserve reduced by 3.5%, since one of the insurance
company gradually decreased the portfolio of earlier concluded life insurance agreements. In
the life insurance, the mathematical reserves accounted for 99.9% of the technical reserves.
The underdevelopment of the life insurance justifies the marginal share of the mathematical
reserves in GDP.
Table 31
Technical reserves104
and mathematical reserves105
of insurance companies
2006 2005 2006 2005
Total technical provisions (millions of Denars) * 5 2.6 3,975 3,837
Mathematical provisions(millions of Denars) 359 372
Assets covering technical provisions/ GDP 0.05% 0.03% 0.9% 0.7%
Technical provisions / GDP 1.30% 1.30%
Mathematical provisions/GDP 0.10% 0.10%
Life insurance Non-life insuranceOpis
*Technical provisions for life insurance reflects provisions for health insurance and accident insurance
The technical reserves for non-live insurance went up by 3.60% compared to 2005,
solely due to the increase in the reserves for transferable premiums and the reserves for
bonuses and discounts.
104
For permanent settlement of the liabilities arising from the insurance agreements, the insurance
company has to form technical reserves composed of: reserves for transferable premiums, reserves for
bonuses and discounts, reserves for damages and other technical reserves. 105
The mathematical reserve is allocated in the amount of the present value of the estimated future
liabilities of the insurance company, which arise from the insurance agreements, reduced by the present
value of the future premiums which are to be paid on the basis of such agreements. The mathematical
reserve is calculated by using respective actuary appraisals.

76
4.1.3. Primary features, size and development of each type of insurance
Life insurance
The life insurance in the Republic of Macedonia is considerably less covered
compared to the other European countries. Thus, in 2006, the gross premiums for life
insurance make up only 2.12% of the total gross premiums in the insurance sector, unlike the
European countries where this percentage ranges from 16% to nearly 70%. Still, considering
the growth in the gross life insurance premium (annual growth of 5.88% in 2006), and the fact
that in early 2007, a license was issued for providing life insurance services, there is still a
room for the expectation for further development of this insurance segment in the Republic of
Macedonia. The low coverage and the minor significance of the life insurance for the
financial system of the Republic of Macedonia are also illustrated by the insignificant share of
gross life insurance premiums in GDP of the country of 0.04%. The above indicates that the
households still do not use the life insurance as an alternative way of saving or savings
investment.
Table 32
Total gross premiums and gross life insurance premiums in the Republic of Macedonia
relative to European countries for 2005
Macedonia-2006 Bulgaria Germany Denmark Croatia Italy Romania Poland Greece Slovenia Czech Republic Hungary
Total gross premium (millions of EUR) 89 457 157,800 16,774 1,023 109,901 890 7,764 3,923 1,640 3,887 2,767
per capita(EUR) 43 57 1,901 3,355 256 1,895 40 204 357 820 389 277
share in GDP 1.80% 2.13% 7.03% 8.06% 3.83% 7.75% 1.12% 3.23% 2.17% 5.99% 3.95% 3.15%
Life insurance premiums (millions of EUR) 2 75 72,597 10,736 265 73,592 235 3,812 1,935 543 1,507 1,218
per capita(EUR) 1 9 875 2,147 66 1,269 11 100 176 272 151 122
share in total premiums 2.12% 16.41% 46.01% 64.00% 25.90% 66.96% 26.40% 49.10% 49.32% 33.11% 38.77% 44.02%
share in GDP 0.04% 0.35% 3.23% 5.16% 0.99% 5.19% 0.30% 1.58% 1.07% 1.98% 1.53% 1.39% Source: CEA Statistics No24 June 2006.
Non-life insurance and reinsurance
Non-life insurance is a dominant group of the insurance in the Republic of
Macedonia. The gross non-life insurance premiums, including the reinsurance premiums,
constitute 1.75% of GDP, a share which is higher than some of the analyzed European
countries (Romania, Turkey, Poland). In 2006, Denar 2,591 per capita on average was paid
based on non-life insurance premiums, which is by 5.63% more compared to 2005.
The growth in the gross non-life insurance and reinsurance premiums is mostly due to
the increase in the insurance of the owners of motor vehicles from liabilities for damages
caused by third parties (automobile liability insurance), contributing with 88.6% of the total
market. Almost half of the gross non-life insurance premiums and the total gross premiums in
the insurance sector arise from motor vehicle liability insurance (48.49%, i.e. 47.46%,
respectively). The motor vehicle insurance premiums went up by 13.04%. This insurance is
compulsory according to the Law on Compulsory Transport Insurance.
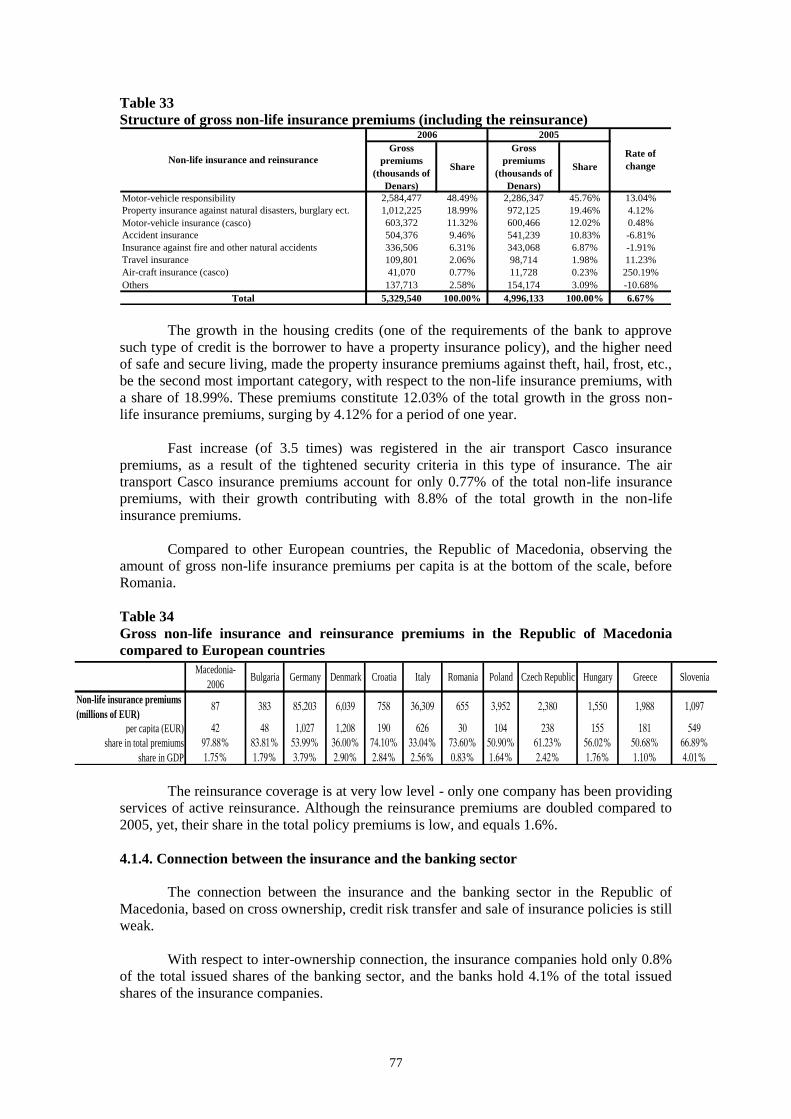
77
Table 33
Structure of gross non-life insurance premiums (including the reinsurance)
Gross
premiums
(thousands of
Denars)
Share
Gross
premiums
(thousands of
Denars)
Share
Motor-vehicle responsibility 2,584,477 48.49% 2,286,347 45.76% 13.04%
Property insurance against natural disasters, burglary ect. 1,012,225 18.99% 972,125 19.46% 4.12%
Motor-vehicle insurance (casco) 603,372 11.32% 600,466 12.02% 0.48%
Accident insurance 504,376 9.46% 541,239 10.83% -6.81%
Insurance against fire and other natural accidents 336,506 6.31% 343,068 6.87% -1.91%
Travel insurance 109,801 2.06% 98,714 1.98% 11.23%
Air-craft insurance (casco) 41,070 0.77% 11,728 0.23% 250.19%
Others 137,713 2.58% 154,174 3.09% -10.68%
Total 5,329,540 100.00% 4,996,133 100.00% 6.67%
Non-life insurance and reinsurance
2006 2005
Rate of
change
The growth in the housing credits (one of the requirements of the bank to approve
such type of credit is the borrower to have a property insurance policy), and the higher need
of safe and secure living, made the property insurance premiums against theft, hail, frost, etc.,
be the second most important category, with respect to the non-life insurance premiums, with
a share of 18.99%. These premiums constitute 12.03% of the total growth in the gross non-
life insurance premiums, surging by 4.12% for a period of one year.
Fast increase (of 3.5 times) was registered in the air transport Casco insurance
premiums, as a result of the tightened security criteria in this type of insurance. The air
transport Casco insurance premiums account for only 0.77% of the total non-life insurance
premiums, with their growth contributing with 8.8% of the total growth in the non-life
insurance premiums.
Compared to other European countries, the Republic of Macedonia, observing the
amount of gross non-life insurance premiums per capita is at the bottom of the scale, before
Romania.
Table 34
Gross non-life insurance and reinsurance premiums in the Republic of Macedonia
compared to European countries
The reinsurance coverage is at very low level - only one company has been providing
services of active reinsurance. Although the reinsurance premiums are doubled compared to
2005, yet, their share in the total policy premiums is low, and equals 1.6%.
4.1.4. Connection between the insurance and the banking sector
The connection between the insurance and the banking sector in the Republic of
Macedonia, based on cross ownership, credit risk transfer and sale of insurance policies is still
weak.
With respect to inter-ownership connection, the insurance companies hold only 0.8%
of the total issued shares of the banking sector, and the banks hold 4.1% of the total issued
shares of the insurance companies.
Macedonia-
2006Bulgaria Germany Denmark Croatia Italy Romania Poland Czech Republic Hungary Greece Slovenia
Non-life insurance premiums
(millions of EUR)87 383 85,203 6,039 758 36,309 655 3,952 2,380 1,550 1,988 1,097
per capita (EUR) 42 48 1,027 1,208 190 626 30 104 238 155 181 549
share in total premiums 97.88% 83.81% 53.99% 36.00% 74.10% 33.04% 73.60% 50.90% 61.23% 56.02% 50.68% 66.89%
share in GDP 1.75% 1.79% 3.79% 2.90% 2.84% 2.56% 0.83% 1.64% 2.42% 1.76% 1.10% 4.01%
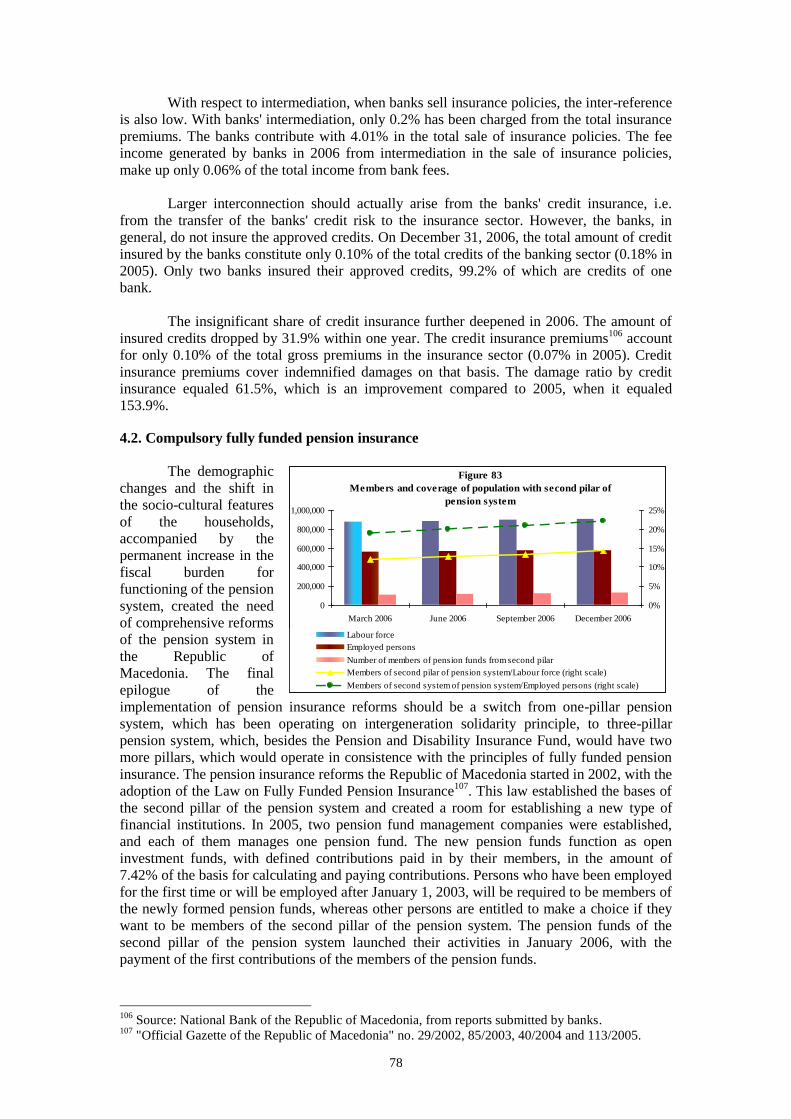
78
With respect to intermediation, when banks sell insurance policies, the inter-reference
is also low. With banks' intermediation, only 0.2% has been charged from the total insurance
premiums. The banks contribute with 4.01% in the total sale of insurance policies. The fee
income generated by banks in 2006 from intermediation in the sale of insurance policies,
make up only 0.06% of the total income from bank fees.
Larger interconnection should actually arise from the banks' credit insurance, i.e.
from the transfer of the banks' credit risk to the insurance sector. However, the banks, in
general, do not insure the approved credits. On December 31, 2006, the total amount of credit
insured by the banks constitute only 0.10% of the total credits of the banking sector (0.18% in
2005). Only two banks insured their approved credits, 99.2% of which are credits of one
bank.
The insignificant share of credit insurance further deepened in 2006. The amount of
insured credits dropped by 31.9% within one year. The credit insurance premiums106
account
for only 0.10% of the total gross premiums in the insurance sector (0.07% in 2005). Credit
insurance premiums cover indemnified damages on that basis. The damage ratio by credit
insurance equaled 61.5%, which is an improvement compared to 2005, when it equaled
153.9%.
4.2. Compulsory fully funded pension insurance
The demographic
changes and the shift in
the socio-cultural features
of the households,
accompanied by the
permanent increase in the
fiscal burden for
functioning of the pension
system, created the need
of comprehensive reforms
of the pension system in
the Republic of
Macedonia. The final
epilogue of the
implementation of pension insurance reforms should be a switch from one-pillar pension
system, which has been operating on intergeneration solidarity principle, to three-pillar
pension system, which, besides the Pension and Disability Insurance Fund, would have two
more pillars, which would operate in consistence with the principles of fully funded pension
insurance. The pension insurance reforms the Republic of Macedonia started in 2002, with the
adoption of the Law on Fully Funded Pension Insurance107
. This law established the bases of
the second pillar of the pension system and created a room for establishing a new type of
financial institutions. In 2005, two pension fund management companies were established,
and each of them manages one pension fund. The new pension funds function as open
investment funds, with defined contributions paid in by their members, in the amount of
7.42% of the basis for calculating and paying contributions. Persons who have been employed
for the first time or will be employed after January 1, 2003, will be required to be members of
the newly formed pension funds, whereas other persons are entitled to make a choice if they
want to be members of the second pillar of the pension system. The pension funds of the
second pillar of the pension system launched their activities in January 2006, with the
payment of the first contributions of the members of the pension funds.
106
Source: National Bank of the Republic of Macedonia, from reports submitted by banks. 107
"Official Gazette of the Republic of Macedonia" no. 29/2002, 85/2003, 40/2004 and 113/2005.
Figure 83
Members and coverage of population with second pilar of
pension system
0
200,000
400,000
600,000
800,000
1,000,000
March 2006 June 2006 September 2006 December 2006
0%
5%
10%
15%
20%
25%
Labour force
Employed persons
Number of members of pension funds from second pilar
Members of second pilar of pension system/Labour force (right scale)
Members of second system of pension system/Employed persons (right scale)

79
At the end of 2006, the pension funds of the second pillar of the pension system had
128,031 members, which is 14.2% of the total active population and 22.1% of the total
employee number. As the employment is expected to increase, the number of pension fund
members is also expected to register an uptrend in the future period. Thus, the expectations
for increase in the number of employees and active population who will be included in the
second pillar of the pension insurance are realistic.
At the end of 2006, the total
net assets in the fully funded pension
funds equaled Denar 1,241.5 million,
constituting only 0.6% of the total
assets in the financial system. In
2006, the members of the fully
funded pension funds paid in
contributions in the amount of Denar
1,325 million, whereas the total
amount of fees108
, charged by the
pension fund management companies
equaled Denar 115.7 million.
Considering the features of the pension funds, and particularly the fact that in the first
several years from their functioning, no large outflows are expected from pension payment, it
is realistic to expect a fast pace of increase in their assets in the forthcoming years.
Consequently, these financial institutions are expected to be given growingly significant role
within the financial system. It is particularly expected to increase their presence as
institutional investors on the capital market, so that they would have greater influence on the
development of the value of domestic securities, and particularly on the interest rates on
treasury bills and government bonds.
Table 35
Fully funded pension insurance indicators
Indicator March 2006 June 2006September
2006
December
2006March 2007
No. of members 105,871 113,275 119,842 128,031 136,204
Total assets of pension funds (thousands of Denars) 168,983 499,385 835,519 1,246,330 1,678,967
Total assets of pension funds as % of GDP 0.06% 0.15% 0.27% 0.41% 0.55%
Share of pension funds in Treasury bills market 0.80% 0.97% 1.86% 1.34% 1.29%
Share of pension funds in Treasury bonds market 0.45% 1.39% 2.30% 3,87% 4.97%
Share of pension funds in market capitalization of quoted
shares on MSE official market0.00% 0.03% 0.05% 0.09% 0.11%
Share of pension funds deposits in total bank deposits 0.02% 0.05% 0.11% 0.16% 0.19%
The potential for
growth of the pension funds
could be understood through
certain structural indicators
for their operations. At the
end of 2006, the total assets of
the pension funds make up
only 0.41% of GDP, whereas
the market value of shares
owned by the pension funds,
compared to the market
capitalization of the official
market of the Macedonian
108
Pension fund management companies charge 8.5% fee of the paid in contributions and monthly
compensation of 0.05% of the value of the net assets of the pension fund under their management.
Figure 85
Relative importance of fully funded pension funds in
Macedonia and some EU member states
Letonia
Lithuania
Slovenia
Slovakia
Estonia
Czesh Republic
Macedonia
Poland
Hungary
New EU member
states
0
200
400
600
800
1,000
0% 2% 4% 6% 8% 10%Total assets of pension funds/GDP (as %)
To
tal
asse
ts o
f p
ensi
on
fu
nd
s
per
cit
izen
(in
eu
ros)
Figure 84
Net assets of pension funds, contributions paid by
members and fees charged by management
companies
0
300
600
900
1200
1500
1800
01.2006 03.2006 05.2006 07.2006 09.2006 11.2006 01.2007 03.2007m
illi
ons
of D
enar
s
0
50
100
150
200
250
mil
lion
s of
Den
ars
Contributions paid by members (right skale)
Fees charged by pension funds management companies (right scale)
Net assets of pension funds (left scale)

80
Stock Exchange AD Skopje equaled 0.09%. As a comparison, at the end of 2005, in the
European Union, the assets in the pension funds accounted for roughly 21% of the average
GDP in EU, i.e. an EU citizen had roughly Euro 4,900, on average, in the fully funded
pension funds. The differences in the significance of the pension funds for the financial
system become more moderate, if the indicators are compared with the countries that became
European Union member states in 2004 (NMS).The assets of the pension funds of these
countries, at the end of 2005, were lower compared to the European average, ranging from
0.4% to 9.2% of GDP, registering considerable differences from one country to another. The
reasons behind the unequal role of the pension funds in the financial systems of some
countries results primarily from the different period of launching the pension system reforms,
the different investment restrictions imposed by the pension funds, and the differences in the
level of development of the national financial markets.
4.2.1. Investment structure and yield for the pension funds
In 2006, the pension fund
management companies conducted
considerably conservative policy in
the investment of the pension funds
assets. In 2006, over three third of
the pension funds assets were
invested in government bonds and
treasury bills issued by the Republic
of Macedonia. At the end of 2006,
second most important instrument
in the pension funds investment
structure were the deposits in domestic banks with a share of 16.9%. The conservative
investment policy mainly results from the regulatory framework, which requires higher
security for the long-term pension savings of the insured, and the relative underdevelopment
of the financial markets in the Republic of Macedonia, which offers drastically less
investment alternatives. Thus at the end of 2006, only 3.8% of the total pension fund assets
were invested in shares issued by domestic issuers. In 2006, the pension funds did not use the
opportunity to invest abroad, even though the Law on Fully Funded Pension Insurance allows
for up to 20% of their assets to be invested in instruments issued by foreign issuers.
Conservative investment
policy bears lower risk of reduction or
short-term fluctuations in the value of
the pension funds assets, but, on the
other hand, decreases the possibility
for generation of larger returns on
assets of the pension funds. Thus, in
the first year of functioning of the two-
pillar pension system, the average
weighted109
nominal rate of return of
the pension funds equaled 6.12%,
which is above the average weighted interest rate on the Denar deposits of the banking
system, which in 2006 ranged from 4.2% to 5.4%110
. In the forthcoming period, the major
challenge of the pension funds is related to the achievement of larger diversification of their
investments, particularly taking into account the restricted supply of investment instruments
and insufficient liquidity on the financial markets in the Republic of Macedonia. The
permanent diversification of the pension funds portfolio by country, by instrument and by
109
Net assets of the pension funds are used as weights in the calculation of the average rate of return. 110
Source of data: NBRM - Review of the weighted interest rates on accepted deposits and approved
credits to the deposit banks in 2006.
Figure 86
Structure of pension funds investments
5.4%3.8%
72.4% 74.1%
4.4%6.9%
15.1%16.9%
1.0%0.1%
0%
20%
40%
60%
80%
100%
03.2006 06.2006 09.2006 12.2006 03.2007
Other assetsDepositstreasury billsTreasury bonds (including struktural bonds)Shares of domestic companies
Figure 87
Rate of return of pension funds for 2006
6.10%
3.20%
6.12%
3.22%
0%
2%
4%
6%
8%
Nominal rate of return - arithmetic averageReal rate of return - arithmetic averageNominal rate of return - weighted averageReal rate of return - weighted average

81
sector of origin of the instrument issuer, has an exceptionally important long-term
significance, since it is likely to be aimed at higher resilience of the pension funds to possible
unfavorable market developments, and consequently, lower volatility of the future return
generated by the pension funds.
4.2.2. Influence of the pension funds on the financial system stability
The design of the second pillar of the pension system limits the possibility for larger
adverse effects on the financial stability and for hazards of systemic nature. The second pillar
of the pension insurance in the Republic of Macedonia has been constructed as a system with
defined contributions, which means that the size of the future pensions paid from the funds
will depend only on the size and the regularity of the contributions paid in by the members,
on the performances of the investment policy of the pension fund management company and
the amount of the compensations, charged by the company on regular basis. This approach
differs from the pension systems where pensions which will be paid in the future are of
predefined size (most frequently, as a certain percentage of the last paid wage). Hence, the
market risk of the funds' invested assets has been concentrated with the fund founder or
manager, which, in environment of larger disruptions of the financial markets, could have
exceptionally adverse effect on the members of such fund. On the other hand, the pension
systems with defined contributions make the systemic risk to be distributed to all insured.
The systemic stability is additionally promoted by establishment of a principle for
separation of the pension fund's assets from the fund management company's assets. In the
case of failure of the pension fund management company, the members of the pension fund
will not use their savings, but their management will be transferred to other company. Thus,
the pension fund members are not exposed to the business risk of the pension fund
management company. Additionally, the announced activities for establishing a third pillar of
the pension system would have positive effects on the social security of the future users of
pension and on the development of the financial system.
82
The Law on Fully Funded Pension Insurance entrusts the role of supervisor and
regulator of the pension funds operations to the Fully Funded Pension Insurance Supervision
Agency (MAPAS). Besides that, the Law also specifies a range of restrictions to the
investment of the pension funds assets with an aim to increase the investment security, and
therefore, to decrease the possibility of losses for the pension funds in the case of unfavorable
market developments, if any.
Draft-design of the third pillar of the pension system of the Republic of Macedonia
The reforms of the pension system of the Republic of Macedonia are to be completed along with
the establishment of the third pension pillar, where the membership would be a choice freely made
by the insured, ensuring higher income after the retirement for those insured in the first and the
second pillar, i.e. would ensure pension for persons who are not included in the compulsory pension
insurance. The activities, related to the design and the establishment of the third pillar of the
pension system, started in the second half of 2006, and are expected to accelerate in 2007, and this
pillar would start operating in 2008.
According to the draft design of the third pillar of the pension system of the Republic of
Macedonia, the structure and the method of establishment of pension funds of the third pillar will
be similar to the pension funds of the second pillar. The pension funds of the third pillar will have
defined contributions, will function as open investment funds and established and managed by
pension fund management company. The pension fund management companies would be joint
stock companies, the founders of which would have to meet certain legal criteria. Each company
could form an individual pension fund and one professional pension fund. The individual pension
funds would be available to all persons with more than eighteen years of age, irrespective of their
employment status, and each person would sign a membership agreement and pay in contributions
to the fund individually. The professional pension funds would be finance by the employers by
paying in contributions for the account of the employees, and the membership would be determined
by a personal statement of the employee. These professional pension funds will be open, which
means that one or more employers will be free to participate. The assets of the pension funds of the
third pillar would be kept separately from the assets of the pension fund management company,
with the banks, instead of the NBRM, playing the role of "custodian" of the assets of the pension
funds of the third pillar, based on the fulfillment of predetermined criteria.
Same as for the second pillar, the third pillar will also abide by some reporting obligations (i.e.
disclosure of information on the operations of the company and the managed funds, on the
investment of the funds, on contributions collected, etc.), and the role of a regulatory and
supervisory body would be played by MAPAS. The payment of pensions of the third pillar would
be more liberal, which means that it would not have to be waited for the legal age of retirement, but
the payment would start ten years prior to the legal age of retirement, at the most, of certain insured.
The payment would be in the form of pension annuities, programmed withdrawal of the funds or
one time payment of the funds. The restrictions to the investment of the assets of the pension funds
of the third pillar would be more flexible. In the initial stage of evolution, some qualitative and
quantitative restrictions are being planned, which would be further gradually abandoned,
introducing the so called "prudent person principle" which is consistent with the EU directives.
Thus, the pension funds of the third pillar would have the opportunity to generate higher rates of
return, and would have greater influence on the financial system.

83
The connection of the fully funded pension funds with other financial institutions in
the Republic of Macedonia currently lies on three bases. The pension fund management
companies that determine and conduct the funds' investment policy are capital-related with
the domestic banks. Also, there is a business relation with some brokerage houses or banks,
based on using brokerage services, and finally, the investment in instruments issued by
domestic financial institution could also be considered a form of investment connection. With
respect to the investment in instruments issued by other financial institutions, the pension
funds' deposits in domestic banks dominate. Hence, the stability of the banking system
directly affects the safety of the pension funds' assets, particularly in the event of their minor
diversification. However, these forms of connection, after the first year of operating of the
pension funds of the second pillar, neither seem to be a significant factor for the stability of
the financial system, nor for the functioning of the pension funds.
Restrictions to the investment of assets of the pension funds of the second pillar of the pension
system
The Law on Fully Funded Pension Insurance and the Regulation for investing pension funds' assets,
adopted on the basis of the above law, contain several restrictions concerning the pension fund assets
investment, as follows:
- Up to 80% of the pension fund assets could be invested in securities issued or guaranteed by
the Republic of Macedonia;
- Up to 60% of the value of the pension funds' assets could be invested as deposits in domestic
banks and in debt securities issued by domestic banks, provided that the bank has a capital of at
least Euro 10 million and capital adequacy ratio of over 10%;
- Up to 40% of the value of the pension funds' assets may be invested in debt securities issued by
domestic trade companies, with defined criteria binding for the trade companies;
- Up to 30% of the value of pension funds' assets may be invested in shares issued by domestic
joint stock companies, provided that they are listed on the official exchange market;
- The investments in foreign instruments are limited to instruments issued by companies having
head offices in the EU, the USA and Japan, enjoying a rating recommendable for investing
according to the international credit agencies and which are traded on regulated secondary
markets;
- Up to 20% of the value of the pension funds' assets may be invested in instruments issued by
foreign issuers, where up to 5% of the value of the pension funds' assets may be invested in
debt securities issued by foreign non-government issuers, i.e. up to 5% of the value of the
pension funds' assets may be invested in shares issued by foreign companies;
- The pension funds' assets may be invested in securities of a same issuer up to 10% of the
nominal value of each security, and this restriction does not apply to government securities;
- Up to 5% of the value of the pension funds' assets may be invested in securities issued by a
same non-government domestic or foreign entity;
- The pension funds' assets must not be invested in real estate, in securities which are not listed
on an official secondary market, derivative financial instruments, securities issued by a
shareholder of the company that manages the pension fund. The pension funds' assets must also
neither be used for approving loans or guarantees, nor be invested by concluding block or cross
transactions.
84
4.3. Leasing sector
4.3.1. Depth and activity on the lease market in the Republic of Macedonia
In the Republic of Macedonia, lessors can be domestic trade companies, subsidiaries
of foreign trade companies and banks111
. Currently, there are eleven legal entities registered to
provide lease services. Five of them are active lease companies, three of which started
operating in 2007. The activities of the leasing companies in the Republic of Macedonia are
mainly focused on providing financial lease services, primarily for movables. Although the
establishment and the operations of the lease companies have been regulated for already five
years, they still have relatively minor importance in the financial system and the overall
domestic economy. On December 31, 2006, the total assets of the active leasing companies
accounted for 0.9% of GDP, 1.4% of the total assets of the financial system and 14.1% of the
total assets of the non-deposit institutions.
Observing the ownership structure, on December 31, 2006, the two active leasing
companies are 100% owned by foreign non-banking financial institutions. As of June 30,
2007, 95.6% of the total capital of the five active leasing companies was owned by foreign
non-banking financial institutions, whereas the remaining 4.4% of the total capital was owned
by domestic limited liability companies and domestic natural persons.
Meaning of the term "lease" and legislation in the Republic of Macedonia
Lessors are specialized financial institutions which offer restricted variety of financial services
to targeted user group. Lease could be defined neither as a rent, nor as a credit, even though it contains
the elements of both categories. The lessor purchases the subject of the agreement and leases it out to
the lessee, for certain compensation and for a specific period. The lease does not require additional
types of guarantees, which is the case with the lending, because the collateral of this type of service is
the title of the subject of lease which belongs to the lessor.
Lease is a special form of long-term financing of the use of land, construction buildings,
equipment, vehicles, etc. The greatest contribution the developed lease market could make to one
economy is its ability to finance small and medium-size enterprises. Thus, the lessors play a central
role in the provision of financial support to the enterprises with poor business and credit history, and
the access of which to the banking sources of financing is hindered. Therefore, it could be concluded
that the lease services are a kind of supplement to the banking services and are of special significance
in economies which need more investments.
There are three types of lease: financial, operational and sale with buy-back lease. The
financial lease is an alternative method of financing, compared to the bank credits, which, inter alia,
enables larger flexibility in the negotiation of the financial lease terms; insignificant engagement of the
user's own funds; opportunity for the user to choose the subject of lease and to agree upon its features;
the procedure for concluding lease agreements is short and simple; once the lease agreement is
executed, the title of the subject of leasing could be transferred to the service user; provides an
opportunity for fast replacement of the equipment and protection against technical and technological
obsolescence. In principle, the operational leasing has three features that distinguish it from the
financial lease: (1) the lessor takes the obligation to maintain the subject under a lease; (2) no
possibility for transfer of ownership at the end of the agreement period and (3) the lease period is
usually shorter than the economic life of the subject of lease. There is a sale with recurrent lease where
the owner of an asset sells such asset to a third party and concludes a lease arrangement. The concluded
lease arrangement specifies that the new owner of the asset plays the role of a lessor, and the former
owner still keeps the asset (for its exploitation over a certain period, under agreed terms) playing the
role of lessee.
The method and terms of providing lease in the Republic of Macedonia are defined by the
Lease Law*. The Law specifies two types of lease: financial and operational.
111
Banks, as specified by the Banking Law, may provide financial lease services.
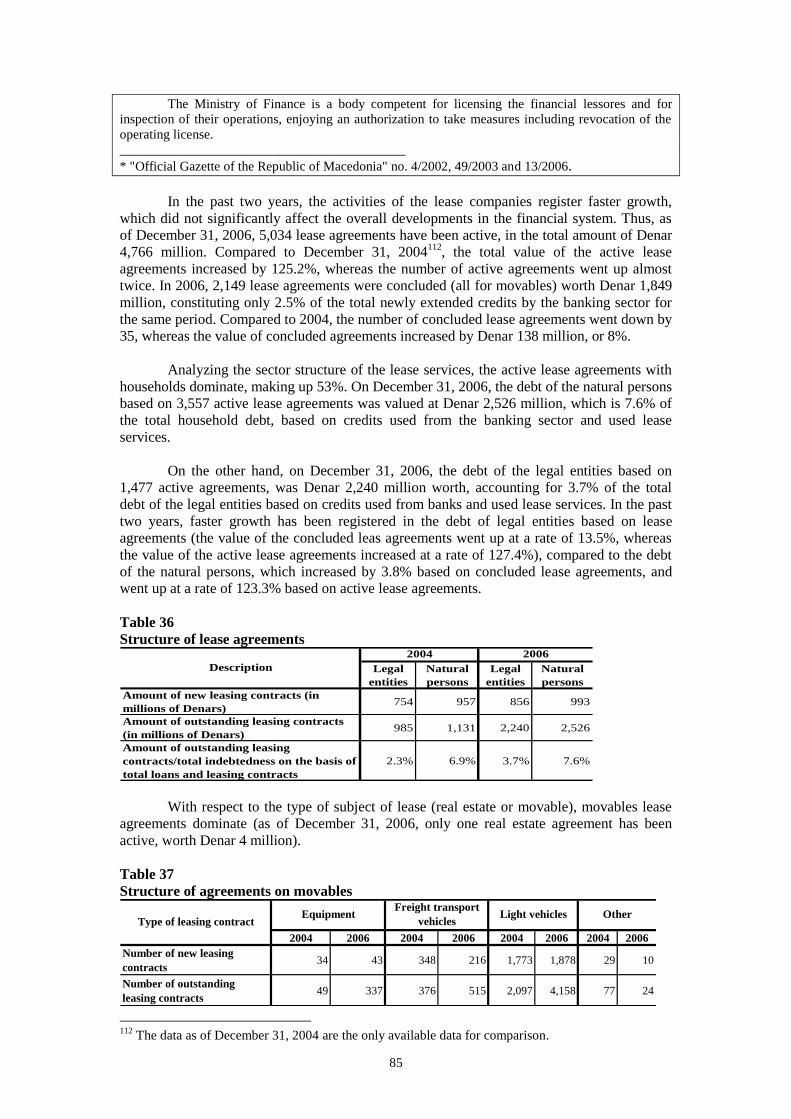
85
The Ministry of Finance is a body competent for licensing the financial lessores and for
inspection of their operations, enjoying an authorization to take measures including revocation of the
operating license.
___________________________________________
* "Official Gazette of the Republic of Macedonia" no. 4/2002, 49/2003 and 13/2006.
In the past two years, the activities of the lease companies register faster growth,
which did not significantly affect the overall developments in the financial system. Thus, as
of December 31, 2006, 5,034 lease agreements have been active, in the total amount of Denar
4,766 million. Compared to December 31, 2004112
, the total value of the active lease
agreements increased by 125.2%, whereas the number of active agreements went up almost
twice. In 2006, 2,149 lease agreements were concluded (all for movables) worth Denar 1,849
million, constituting only 2.5% of the total newly extended credits by the banking sector for
the same period. Compared to 2004, the number of concluded lease agreements went down by
35, whereas the value of concluded agreements increased by Denar 138 million, or 8%.
Analyzing the sector structure of the lease services, the active lease agreements with
households dominate, making up 53%. On December 31, 2006, the debt of the natural persons
based on 3,557 active lease agreements was valued at Denar 2,526 million, which is 7.6% of
the total household debt, based on credits used from the banking sector and used lease
services.
On the other hand, on December 31, 2006, the debt of the legal entities based on
1,477 active agreements, was Denar 2,240 million worth, accounting for 3.7% of the total
debt of the legal entities based on credits used from banks and used lease services. In the past
two years, faster growth has been registered in the debt of legal entities based on lease
agreements (the value of the concluded leas agreements went up at a rate of 13.5%, whereas
the value of the active lease agreements increased at a rate of 127.4%), compared to the debt
of the natural persons, which increased by 3.8% based on concluded lease agreements, and
went up at a rate of 123.3% based on active lease agreements.
Table 36
Structure of lease agreements
Legal
entities
Natural
persons
Legal
entities
Natural
persons
Amount of new leasing contracts (in
millions of Denars)754 957 856 993
Amount of outstanding leasing contracts
(in millions of Denars)985 1,131 2,240 2,526
Amount of outstanding leasing
contracts/total indebtedness on the basis of
total loans and leasing contracts
2.3% 6.9% 3.7% 7.6%
2004 2006
Description
With respect to the type of subject of lease (real estate or movable), movables lease
agreements dominate (as of December 31, 2006, only one real estate agreement has been
active, worth Denar 4 million).
Table 37
Structure of agreements on movables
112
The data as of December 31, 2004 are the only available data for comparison.
2004 2006 2004 2006 2004 2006 2004 2006
Number of new leasing
contracts34 43 348 216 1,773 1,878 29 10
Number of outstanding
leasing contracts49 337 376 515 2,097 4,158 77 24
Light vehicles OtherType of leasing contract
EquipmentFreight transport
vehicles

86
The lease agreements on movables are dominated by lease agreements of passenger
vehicles, which make up 87.4% of the total number of concluded agreements on movables in
2006, i.e. 82.6% of the total number of active agreements on movables as of December 31,
2006. Of the total automobiles sold in 2006, 15.4% were sold by concluding lease agreements
with the interested buyers. In the future, one could expect enhancement of the lease market
for freight vehicles, because in the Republic of Macedonia there is an obsolete rolling stock of
trucks, which do not even meet the minimum required standards to make transport throughout
the European Union. On the other hand, there is a noticeable increase in the number of active
agreements on equipment of almost seven times in the 2004-2006 period.
In 2006, only one bank provided financial leasing. Although this bank concluded only
three lease agreements (on movables, only) as of December 31, 2006, yet their value of Denar
230 million constitute 12.4% of the total value of all lease agreements concluded by the lease
companies in 2006.
The Republic of Macedonia belongs to the group of countries where the lease plays a
marginal role in the financial system. In spite of the noticeable enhanced activity of both lease
companies that operate on the financial lease market, on December 31, 2006, the indicator for
the share of the value of concluded lease agreements in GDP equaled minor 0.5%. In the
European Union, there are also large differences with respect to the importance and the share
of the lease. In the European countries under observation, the share of concluded lease
agreements in GDP ranges from 0.9% (for France) to 5.6% (for Estonia).113
Presently, the major
challenge the lease companies
face with, is the extension of the
list of subjects of lease
agreements (other than lease of
light vehicles), and particularly
the encouragement of the
development of the secondary
market for used equipment,
which would act towards
reducing the risk of the lease
companies in the resale of
equipment. In Europe, the lease
registers higher growth rate
compared to the total economic
growth, which is primarily due to
the growth in the real estate lease
of 25% (in 2005 relative to
2004).
4.3.2. Financial potential and basic indicators for the performances of the lease
companies
On December 31, 2006, the total assets of the lease companies equal Denar 2,735
million, which is by 20.2% more compared to December 31, 2005. Most assets consist of
claims based on concluded lease agreements, whereas the deposits in banks constitute only
5% of the total assets. On December 31, 2006, the total capital of the lease companies equaled
Denar 225 million (an increase of 84.8% compared to December 31, 2005), providing 8.2%
coverage of the total assets. Most of the sources of assets of the lease companies are used
borrowings from foreign persons (mainly from the founders of the lease companies). The
113
Source: Leaseurope - European Federation of Leasing Company Associations, European Central
Bank, SSO - State Statistical Office, Ministry of Finance.
*Note: Data on the value of concluded lease agreements for all
countries refer to the first half of 2006, whereas the GDP data
are as of December 31, 2005.
Figure 88
Share of the new leasing contracts amount in GDP*
0%
1%
2%
3%
4%
5%
6%
Mac
edo
nia
Fra
nce
Po
lan
d
Den
mar
k
B a
nd
H
Fin
lan
d
Ger
man
y
Bu
lgar
ia
Hu
ng
ary
Cze
ch R
epu
bli
c
Ro
man
ia
Slo
ven
ia
Est
on
ia

87
credit support by the banks is seldom used as source of funding the financial lease. Thus, on
December 31, 2005, one of the two lease companies is a borrower of short-term Denar bank
credit in the amount of Denar 10 million, which was fully recovered in the next year. As of
December 31, 2006, the lease companies do not borrow from banks.
The total amount of after taxation gain, generated in 2006 by the two active leasing
companies equaled Denar 114.2 million (an increase by almost nine times compared to 2005).
On December 31, 2006, the rate of return on equity of the lease sector equaled 66%
(improvement of 55.1 percentage points compared to December 31, 2005), whereas the rate
of return on assets equaled 4.6% (improvement of 3.9 percentage points compared to
December 31, 2005).
88
IV. Financial infrastructure
1. Payment systems
1.1. Reform of the payment system in the Republic of Macedonia
The reform of the payment system in the Republic of Macedonia started in early
2001. It was primarily aimed at its modernization and harmonization with the international
standards for safe, sound and efficient payments system.
The previous payment system was non-performing, from both the regulatory and the
operational and institutional aspect, as a result of which the reform required full amendment
to the regulations, reorganization of the institutions included in the payment system and
simultaneous establishment of a new operational national payment system.
During the reform that was completed on December 31, 2001, a new Law on
Payment Operations was adopted defining the responsibilities of the institutions responsible
for conducting payment transactions, the Payment Operations Bureau was abolished, and the
transaction accounts of legal entities were transferred to the commercial banks. Also,
transaction settlement systems were established through the deposit accounts of the
commercial banks with the central bank, as follows: the Macedonian Interbank Payment
System (MIPS) for gross-based transaction settlement and the Clearing Interbank Systems
(KIBS) net-based transaction settlement.
The effects of the reforms in the payment system and the established payment
infrastructure were positively assessed by the World Bank FSAP Mission and the IMF in
2003. This Mission, inter alia, made an assessment of the MIPS compliance with the Core
Principles for Systemically Important Payment Systems of the CPSS (Committee on Payment
and Settlement Systems), and determined that it is highly consistent with these principles.
1.2. Payment infrastructure
MIPS is a real time gross settlement system (RTGS - Real Time Gross Settlement) of
large value payments (above Denar 1 million) and of urgent interbank payments. The MIPS
settlement system is based on permanent settlement and within its frameworks, it takes place
on an ongoing basis, along with the conduct of the transactions. The government payments
are also made through this system. Also, the transactions in securities concluded on the
Macedonian Stock Exchange AD Skopje are conducted through MIPS, which is directly
connected to the Central Securities Depository which enables securities settlement through
the "delivery versus payment" principle, within a period of three days after the conclusion of
the transaction. After the issuance of the first government short-term debt securities in 2004,
and after the establishment of the market for trade in such securities in 2005, MIPS was a
basis for establishment of a platform for settlement of treasury bills and government securities
and CB bills. The settlement is made according to the delivery versus payment principle in
real time.
KIBS (Clearing house) is a system for multilateral differed net settlements of small
values payment (less than Denar 1 million), which is owned by sixteen banks of the Republic
of Macedonia. Most of the payments have been made for the account of banks' clients, and
the balances after being "cleared" are settled at the MIPS, making the payments final and
irrevocable.
Observing the international standards, SWIFT-standard for a type of payment
messages and ISO 9362 for bank identification codes is applied to the National Bank MIPS.
Clearinghouse KIBS AD Skopje has its own standard in place for exchange of payment
messages.

89
Such established payment systems and securities settlement systems helped the
Republic of Macedonia to acquire payment infrastructure typical for modern market
economy, which is an efficient basis for development of the financial infrastructure and
increase in the level of financial intermediation.
Regulatory bodies, in the area of payment systems in the Republic of Macedonia are
the National Bank, the Ministry of Finance and the Securities and Exchange Commission. In
addition, the National Bank plays the role of overseer of the payment systems.
National Payment Systems Council of the Republic of Macedonia was formed in
October 2004. This Council supports the safety, stability and efficiency of the payment
systems and makes sure that they are promoted and developed by encouraging the
cooperation between market participants and the regulatory bodies and takes initiatives for
improvement of the payment infrastructure, the payment instruments and institutional
framework. Also, the National Council promotes regional and international cooperation
among all institutions in the payment systems and securities settlement systems.
1.3. Volume and structure of the payment operations in the Republic of Macedonia in
2006
In 2006, the total payment operations in the Republic of Macedonia were valued at
Denar 1,410 billion, generated through 22 million transactions. In 2006, 47% of the total
payment operations in the Republic of Macedonia, i.e. 54.2% of the total number of
transactions wewe conducted through MIPS and KIBS.
Table 38
Value of the payment operations and number of transactions in 2006 114
The total value of the payment operations registered faster growth compared to the
growth in the transaction number. The annual growth rate of the value of the payment
operations (2006 compared to 2005) equaled 15.7%, compared to the growth rate of the
transaction number of 8.3%. This is mainly due to the lower number of transactions in MIPS,
as opposed to the increase in the average value of one payment order. The average value of
one order in MIPS, in 2006, equaled Denar 322.3 thousand, compared to Denar 203.7
thousand in 2005. The average value of one order in the total payment operations equaled
Denar 63.3 thousand, which is by roughly Denar 4 thousand more relative to 2005.
The value of the payment operations conducted through MIPS and KIBS in 2006,
was by 2.2 times higher than GDP. On average, 115 business days would be needed for the
value of the payment operations conducted through MIPS and KIBS to reach the annual GDP
value.
The payments made through bank accounts by payment instruments in the form of
credit or debit transfers115
accounted for 59.7% of the total transactions and covered around
114
Source: NBRM, Payment Systems Department. 115
Transactions in the payment system could be conducted through:
- credit transfers (transactions executed at the expense of the accounts based on submitted payment
instruments on order of the accountholder),
Trend of the
total payment
turnover
Trend of the
number of
transactions
2006 2005 2006 2005 2006 2005 2006 2005 06/05 06/05
MIPS 514,694 421,901 1,595,081 2,071,005 36.5% 34.6% 7.2% 10.1% 22.0% -23.0%
KIBS 147,905 135,775 10,478,451 9,324,004 10.5% 11.1% 47.0% 45.3% 8.9% 12.4%
Banks' internal payment
turnover 747,703 661,749 10,218,589 9,180,551 53.0% 54.3% 45.8% 44.6% 13.0% 11.3%
Total 1,410,302 1,219,425 22,292,121 20,575,560 100.0% 100.0% 100.0% 100.0% 15.7% 8.3%
Structure of the
number of
transactionsDescription
Amount of total payment
turnover (in millions of
Denars)
Number of transactions Structure of the
total payment
turnover
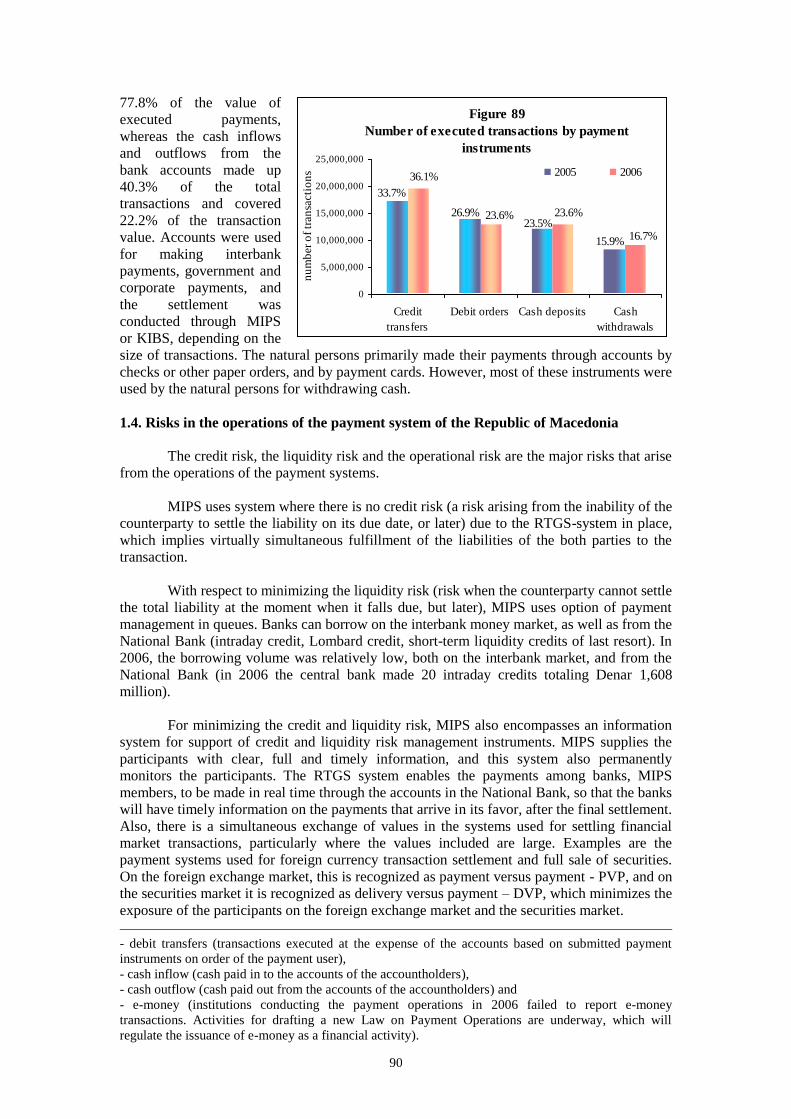
90
77.8% of the value of
executed payments,
whereas the cash inflows
and outflows from the
bank accounts made up
40.3% of the total
transactions and covered
22.2% of the transaction
value. Accounts were used
for making interbank
payments, government and
corporate payments, and
the settlement was
conducted through MIPS
or KIBS, depending on the
size of transactions. The natural persons primarily made their payments through accounts by
checks or other paper orders, and by payment cards. However, most of these instruments were
used by the natural persons for withdrawing cash.
1.4. Risks in the operations of the payment system of the Republic of Macedonia
The credit risk, the liquidity risk and the operational risk are the major risks that arise
from the operations of the payment systems.
MIPS uses system where there is no credit risk (a risk arising from the inability of the
counterparty to settle the liability on its due date, or later) due to the RTGS-system in place,
which implies virtually simultaneous fulfillment of the liabilities of the both parties to the
transaction.
With respect to minimizing the liquidity risk (risk when the counterparty cannot settle
the total liability at the moment when it falls due, but later), MIPS uses option of payment
management in queues. Banks can borrow on the interbank money market, as well as from the
National Bank (intraday credit, Lombard credit, short-term liquidity credits of last resort). In
2006, the borrowing volume was relatively low, both on the interbank market, and from the
National Bank (in 2006 the central bank made 20 intraday credits totaling Denar 1,608
million).
For minimizing the credit and liquidity risk, MIPS also encompasses an information
system for support of credit and liquidity risk management instruments. MIPS supplies the
participants with clear, full and timely information, and this system also permanently
monitors the participants. The RTGS system enables the payments among banks, MIPS
members, to be made in real time through the accounts in the National Bank, so that the banks
will have timely information on the payments that arrive in its favor, after the final settlement.
Also, there is a simultaneous exchange of values in the systems used for settling financial
market transactions, particularly where the values included are large. Examples are the
payment systems used for foreign currency transaction settlement and full sale of securities.
On the foreign exchange market, this is recognized as payment versus payment - PVP, and on
the securities market it is recognized as delivery versus payment – DVP, which minimizes the
exposure of the participants on the foreign exchange market and the securities market.
- debit transfers (transactions executed at the expense of the accounts based on submitted payment
instruments on order of the payment user),
- cash inflow (cash paid in to the accounts of the accountholders),
- cash outflow (cash paid out from the accounts of the accountholders) and
- e-money (institutions conducting the payment operations in 2006 failed to report e-money
transactions. Activities for drafting a new Law on Payment Operations are underway, which will
regulate the issuance of e-money as a financial activity).
Figure 89
Number of executed transactions by payment
instruments
15.9%
23.5% 26.9%
33.7%
16.7%
23.6% 23.6%
36.1%
0
5,000,000
10,000,000
15,000,000
20,000,000
25,000,000
Credit
transfers
Debit orders Cash deposits Cash
withdrawals
nu
mb
er
of
tran
sacti
on
s 2005 2006

91
Major precondition for smooth functioning of the payment system is the control and
minimization of the operating risk in its functioning, which arises from hardware or software
problem, human errors, malicious attack, which may cause system failure or non-
performance, i.e. losses. The system structure and organization should enable minimization of
technical problems, i.e. smooth transaction settlement. The National Bank shall have
opportunities to modify the form and to make the system or the surrounding operational, in
order to remove, reduce or better manage the operating risk.
The growing dependence of the financial sector, including the payment system, on
the information technology and the telecommunication networks increases the exposure to
risk of hardware or software failure. The National Bank activities for implementing the
recommendation of the FSAP mission for full compliance with the seventh core principle for
systemically important payment systems, i.e. for providing conditions for continuity of the
MIPS in contingent cases, through establishment of a back up system on a remote location
were aimed at reducing the operating risk.
2. Deposit insurance system
Efficient deposit insurance system is a basis for several basic objectives:
- systemic risk restriction, i.e. alleviation of the risk of disruption of the banking
system stability, due to possible risk event in one or more banks at the same time,
- bank depositor protection (particularly natural persons), who face the problem of
asymmetry and inaccessibility to information, and insufficient education for proper
assessment of the financial condition of a particular bank,
- additional hedging mechanism which contributes to strengthening of the
confidence in the banking system (minimizing the risks and damages to the banking system
in the case of bank failure), along with the established prudential regulation framework for the
banks.
Besides the evident qualitative advantages, the deposit insurance system incurs costs
for the banks, but also creates a threat of disturbance of the market discipline, i.e. taking
higher risks than usual, which might bring about so called moral hazard.
2.1. Legal framework and functioning of the Deposit Insurance Fund in the Republic of
Macedonia
Disturbed confidence in the banking system in the period after the disintegration of
the former SFRY and “freezing” of the foreign currency savings deposits of the citizens
created the need of undertaking specific measures for establishment of deposit insurance
system in the Republic of Macedonia. The Deposit Insurance Fund AD Skopje was
established in January 1997, followed by amendments to the regulatory framework, primarily,
the adoption of the Law on Deposit Insurance Fund116
, in July 2000. The Fund is in full
ownership of the Republic of Macedonia. It insures deposits117
of natural persons (according
to the current design, the Fund does not cover deposit of legal entities) in the banks and the
savings houses, which are established and operate in the Republic of Macedonia, as follows:
- 100% of the total deposits of a natural person in a bank or a savings house in the
amount of up to Euro 10,000 (denar equivalent) and
116
Law on Deposit Insurance Fund ("Official Gazette of the Republic of Macedonia" no. 63/00, 29/02,
43/02 and 49/03). 117
The Law on Deposit Insurance Fund specifies the deposits of natural persons insured in the Fund.

92
- 90% of the total deposit of a natural person in a bank or a savings house in the
amount from Euro 10,000 to 20,000 but not more than Euro 20,000 (denar equivalent).
The new Banking Law (effective since June 2007) ensured entrance of foreign banks
to the Macedonian market, through branches. The deposits of these branches collected in the
Republic of Macedonia will be insured in the Deposit Insurance Fund.
In the Republic of Macedonia, the Fund plays the role of a cash register that pays off
the insured deposits after the revocation of the license for founding and operating a bank or a
savings house. The release of the guarantee of the Fund starts within three months from the
effectiveness of the decision of the Governor of the National Bank on revoking the license for
founding and operating a bank or savings house.
The monthly premium paid by the banks and the savings houses equals 0.7% on
annual basis of the total deposits of natural persons in a bank, i.e. savings house, irrespective
of whether they are subject to insurance. The Fund may adopt a decision on termination of the
premium payment obligation by the bank and the savings houses, provided that the total
Fund’s assets reach at least 4% of the total deposits of natural persons in the Republic of
Macedonia (as of September 30, 2006, this ratio equaled 3.29%).
On December 31, 2006, eighteen banks118
and twelve savings houses were members
of the Fund. Considering the permanent upward trend of the household deposits, the deposit
insurance premiums paid-in by the banks and the savings houses have registered constant and
significant growth. The share of deposit insurance premiums in the total banks’ income119
, in
the period December 31, 2002-December 31, 2006, ranged from 3% to 3,8%.
Table 39
Annual dynamics of the deposit insurance premiums120
and indicators for their share in
the total income and expenditures
Concentration in the banking system in the Republic of Macedonia is also noticeable
in the paid-in deposit insurance premium, where the three largest banks account for over 75%
of the total paid-in insurance premiums.
118
Macedonian Bank for Development Promotion AD Skopje, which performs specific financial
activities, in line with the Law on establishing the Macedonian Bank for Development Promotion, has
not been a member of the Deposit Insurance Fund. 119
The total income has been calculated as a sum of the interest income, fee and compensation income,
other net financial income (capital gains, dividends, exchange rate differentials, etc.) and other income. 120
The calculations of each table item take into account only banks, because of the marginal share of
the savings houses in the total household deposits, which ranged from 0.6% on December 31, 2002, to
0.8% on December 31, 2006
Description 31/12/2002 31/12/2003 31/12/2004 31/12/2005 31/12/2006
Deposit insurance premium 333 320 306 360 437
Total deposits of households 34,561 40,592 47,506 57,582 71,420
Total income 8,941 8,481 9,894 11,980 14,249
Total expenses 10,206 10,053 9,949 11,549 11,890
Deposit insurance premium/total income 3.7% 3.8% 3.1% 3.0% 3.1%
Deposit insurance premium/total expenses 3.3% 3.2% 3.1% 3.1% 3.7%
in millions of Denars

93
Table 40
Indemnifications by the Fund in the period from its establishment to September 30,
2006 121
*Note: There is no data on the last risk event (revocation of the operating license of one savings house).
Since the establishment of the Fund in 1997, to December 31, 2006 six risk events
happened (in three banks and three savings houses), followed by the payment of insured
deposits. Thus, the total liabilities of the Fund, based on payment of insured deposits, were
valued at Denar 185 million, Denar 174 million of which being realized as of September 30,
2006 (93.8% of the total liabilities). On the other hand, the funds collected in favor of the
Fund from the bankruptcy or liquidation estate of the banks and the savings houses for the
same period, equaled only Denar 10 million.
3. Liquidity facilities of last resort
Short-term liquidity credit of last resort has been defined as a discretionary approval of liquid
assets to a bank (or to the market as a whole) by the central bank, for overcoming liquidity shocks that
cause extraordinary increase in the demand for liquid assts, which may not be satisfied on the money
market.
The legal basis for activating the short-term liquidity credit of last resort, as
instrument of the National Bank, has been introduced with the amendments to the Law on the
National Bank of the Republic of Macedonia and by the Decision on short-term liquidity
credit of last resort adopted in the second half of 2004, specifying that the National Bank, for
the purposes of maintaining the financial system stability, may approve short-term liquidity
credit of last resort to banks, provided that the credit is secured by collateral instruments.
The primary purpose of the liquidity credit of last resort is maintenance of the
financial system stability, i.e. minimizing the possibility for the liquidity problems of a bank
(due to its size or due to the possibility to transfer the crisis to other bank or to the overall
banking system) to disturb the stability of the financial system as a whole.
Liquidity credit is approved to solvent banks, facing liquidity problems, which at that
time are not in a position to secure funds from the interbank market, or in order to impede the
potential fast sale of their assets at unfavorable prices. The National Bank approves such
liquidity credit based on adequate collateral (high quality securities portfolio and liquid assets
that minimize the credit, currency and liquidity risk for the central bank). Such request, on the
one hand, provides security for the placed assets of the central bank, and on the other hand it
makes the banks hold high quality securities in their portfolios, thus making the risk of
improper bank investments lower. If the bank does not hold assets acceptable as collateral for
the liquidity credit, the National Bank sends a request for cooperation with banks that would
approve liquidity credit to the bank facing liquidity problems. The liquidity credit of last
121
Source: Website of the Deposit Insurance Fund of the Republic of Macedonia.
Year
Number of banks
and saving houses
under bankruptcy
or liquidation
Status of the deposits in the
banks and saving houses (in
thousands of Denars)
Total liabilities of the
Fund (in thousands of
Denars)
Realized
indemnification (in
thousands of Denars)
Realized
indemnification as
a % of GDP
1997 0 - - -
1998 0 - - -
1999 1 7,882 5,118 -
2000 1 2,850 1,785 4,791 0.0020%
2001 0 - - 12 0.0000%
2002 0 - - 135 0.0001%
2003 2 113,017 102,378 95,633 0.0380%
2004 0 - - 2,099 0.0008%
2005 1 86,225 76,006 70,543 0.0246%
30.09.2006* 0 - - 578 0.0002%
Total: 5 209,974 185,287 173,791

94
resort is an expensive source of liquidity, approved at interest rate higher than that on the
money market, but in the amount that should not discourage the bank to ask for liquidity
support by the central bank.
The approval of the credit of last resort is usually accompanied by taking certain
corrective measures to that bank, for the purposes of overcoming its situation. These measures
play the role of implicit price of liquidity credit and could be stricter, depending on the bank’s
condition. The liquidity credit falls due in three months, with a possibility to be revolved. The
short term of the credit is aimed at providing the requested liquidity support to the bank,
without making the bank passive or further deteriorates its positions.
Since the adoption of this regulation, there has not been a case of approving short-
term liquidity credit of last resort to bank.