FDS simulation of fire spread Πcomparison of model ...ESPOO 2004 VTT WORKING PAPERS 4 0 1000 2000...
54
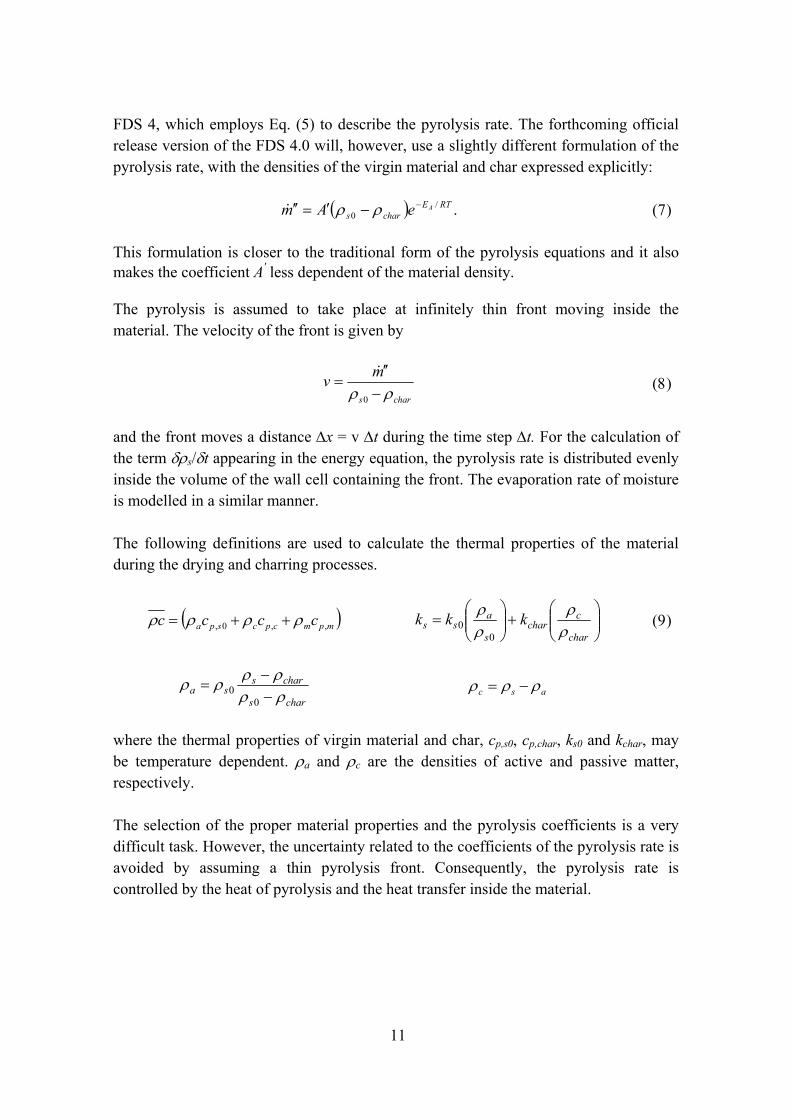
ESPOO 2004 VTT WORKING PAPERS 4 0 1000 2000 3000 0 200 400 600 800 Data FDS4 time from burner ignition (s) RHR (kW) burner off 0 200 400 600 800 1000 1200 0 200 400 600 800 Data FDS4 time from burner ignition (s) G6 ( o C) burner off FDS simulation of fire spread comparison of model results with experimental data Jukka Hietaniemi, Simo Hostikka & Jukka Vaari VTT Building and Transport
Transcript of FDS simulation of fire spread Πcomparison of model ...ESPOO 2004 VTT WORKING PAPERS 4 0 1000 2000...

ESPOO 2004 VTT WORKING PAPERS 4
0
1000
2000
3000
0 200 400 600 800
DataFDS4
time from burner ignition (s)
RH
R (k
W)
burneroff
0
200
400
600
800
1000
1200
0 200 400 600 800
DataFDS4
time from burner ignition (s)
G6
(o C)
burneroff
FDS simulation of fire spread � comparison of model results
with experimental data
Jukka Hietaniemi, Simo Hostikka & Jukka Vaari VTT Building and Transport

ISBN 951�38�6556�8 (URL: http://www.vtt.fi/inf/pdf/) ISSN 1459�7683 (URL: http://www.vtt.fi/inf/pdf/) Copyright © VTT 2004
JULKAISIJA � UTGIVARE � PUBLISHER
VTT, Vuorimiehentie 5, PL 2000, 02044 VTT puh. vaihde (09) 4561, faksi (09) 456 4374
VTT, Bergsmansvägen 5, PB 2000, 02044 VTT tel. växel (09) 4561, fax (09) 456 4374
VTT Technical Research Centre of Finland, Vuorimiehentie 5, P.O.Box 2000, FIN�02044 VTT, Finland phone internat. + 358 9 4561, fax + 358 9 456 4374
VTT Rakennus- ja yhdyskuntatekniikka, Kivimiehentie 4, PL 1803, 02044 VTT puh. vaihde (09) 4561, faksi (09) 456 4815
VTT Bygg och transport, Stenkarlsvägen 4, PB 1803, 02044 VTT tel. växel (09) 4561, fax (09) 456 4815
VTT Building and Transport, Kivimiehentie 4, P.O.Box 1803, FIN�02044 VTT, Finland phone internat. + 358 9 4561, fax + 358 9 456 4815
Technical editing Marja Kettunen

3
Published by
Series title, number and report code of publication
VTT Working Papers 4 VTT�WORK�4
Author(s) Hietaniemi, Jukka, Hostikka, Simo & Vaari, Jukka Title FDS simulation of fire spread � comparison of model results with experimental data Abstract This report presents several case studies in which results obtained by a pre-release version 4.0 of Fire Dynamics Simulator (FDS) (McGrattan et al. 2002, McGrattan et al. 2002b) are compared to experimental data. The objectives of the work are: a) to provide material for the validation of the FDS fire simulation program, especially concerning flame spread modelling; b) to establish eligible material parameter values for engineering use of the FDS and, c) to disentangle needs to direct further development work of the FDS program. The case studies comprise fire experiments of a wide scale ranging from the cone calorimeter (ISO 5660 1 2002) to full-scale fire tests such as the room corner test (ISO 9705 1993). Comparisons are made also between FDS 4 results and data obtained in the SBI euroclassification test method (EN 13823 2002) as well the data obtained in two ad hoc experimental set ups: one is the similar to the room corner test but has only partial linings and the other is the experimental set up used in study of fires in building cavities. In the study concerning upholstered furniture the experimental set ups are the cone calorimeter, furniture calorimeter and the ISO room. In the part concerning modelling of liquid pool fires, comparison is made to data depicting the dependence of the burning rate on the pool size. The burning materials/items include three construction materials, spruce timber, MDF board and PVC, upholstered furniture, cables with plastic sheathing and heptane. Keywords fire simulation, FDS, validation, fire test, fire experiment, cone calorimeter, SBI test, room corner test, ISO room
Activity unit VTT Building and Transport, Kivimiehentie 4, P.O.Box 1803, FIN�02044 VTT, Finland
ISBN Project number 951�38�6556�8 (URL: http://www.vtt.fi/inf/pdf/) R4SU00235
Date Language Pages June 2004 English 45 p. + app. 6 p.
Name of project Commissioned by New simulation methods for fire safety analysis Tekes & VTT
Series title and ISSN Publisher VTT Working Papers 1459�7683 (URL: http://www.vtt.fi/inf/pdf/)
VTT Information Service P.O. Box 2000, FIN�02044 VTT, Finland Phone internat. +358 9 456 4404 Fax +358 9 456 4374

4
Preface This report presents several case studies in which results obtained by a pre-release version 4.0 of the Fire Dynamics Simulator (FDS) (McGrattan et al. 2002, McGrattan et al. 2002b) are compared to experimental data. The motivation of the work is the following:
• Provide material showing the validity of the FDS fire simulation program, especially concerning flame spread modelling.
• Establish eligible material parameter values for engineering use of the FDS.
• Disentangle needs to direct further development work of the FDS program.
The work has been out in the Fire Research group of VTT Building and Transport, Finland. It forms a part of a larger research project launched to develop new tools for fire simulation with the aim set at producing generally acceptable and valid science-based tools to meet the needs of fire safety design and risk assessment within the industry and other stakeholders.
The project is funded by the National Technology Agency of Finland (Tekes) and VTT Building and Transport.

5
Contents
Preface ...............................................................................................................................4
1. Introduction..................................................................................................................7
2. Modelling of pyrolysis and combustion of charring fuels .........................................10
3. Spruce timber .............................................................................................................12 3.1 Cone calorimeter, 10 mm thick spruce board...................................................12 3.2 SBI test, 10 mm thick spruce board..................................................................13 3.3 Room corner test, 10 mm thick spruce board...................................................14 3.4 Room corner test with partial lining, 22 mm thick spruce board .....................14 3.5 6-m long cavity lined with 22 mm thick spruce board.....................................18
4. MDF board, thickness 12 mm....................................................................................22 4.1 Cone calorimeter ..............................................................................................22 4.2 SBI test .............................................................................................................23 4.3 Room corner test...............................................................................................24
5. PVC wall carpet on gypsum board ............................................................................25 5.1 Cone calorimeter ..............................................................................................25 5.2 SBI test .............................................................................................................26 5.3 Room corner test...............................................................................................27
6. Upholstered furniture .................................................................................................28 6.1 Cone calorimeter ..............................................................................................29 6.2 Furniture calorimeter ........................................................................................30 6.3 ISO room ..........................................................................................................31 6.4 Burning enhancement induced by the enclosure ..............................................32
7. Cables with plastic sheathing a 6-m long cavity........................................................33
8. Heptane pool fires ......................................................................................................39
9. Summary ....................................................................................................................41
Acknowledgements .........................................................................................................42
References .......................................................................................................................43
Appendices Appendix A: FDS input data for fuel properties Appendix B: Progress during the whole wooden cavity fire experiment

6

7
1. Introduction As the fire simulation has become a fundamental part of fire engineering, the need for robust and validated fire spread models has been emphasized by the fire engineering community. This report presents several case studies in which results obtained by a pre-release version 4.0 of the Fire Dynamics Simulator (FDS) are compared to experimental data. The code version is based on the previous published version (McGrattan et al. 2002, McGrattan et al. 2002b) but contains some important updates, as explained in the report. The objectives of the work are:
• to validate FDS fire simulation program for applications including flame spread modelling,
• to establish eligible material parameter values for engineering use of the FDS
• to disentangle needs to direct further development work of the FDS program.
The case studies comprise fire experiments of a wide ranging scale from the cone calorimeter (ISO 5660-1 2002) to full-scale fire tests such as the room corner test (ISO 9705 1993). Comparisons are made also between FDS 4 results and data obtained in the SBI euroclassification test method (EN 13823 2002) as well the data obtained in two ad hoc experimental set ups: one is the similar to the room corner test but has only partial linings (Hietaniemi 2001) and the other is the experimental set up used in study of fires in building cavities (Hietaniemi et al. 2002). In the study concerning upholstered furniture, the experimental set ups are the cone calorimeter, furniture calorimeter and the ISO room (Denize 2000, Girgis 2000). In the part concerning modelling of liquid pool fires, comparison is made to data obtained by numerous researchers and presented in the report by Hamins et al. (1999). The burning materials/items include three construction materials, spruce timber, MDF board and PVC1, upholstered furniture (Denize 2000, Girgis 2000), cables with plastic sheathing (Hietaniemi et al. 2002) and heptane. The cases studied are summarised in Table 1.
1 The reader familiar with the SBI test development work will notice that these three construction materials are ones tested in the SBI Round Robin: spruce timber is the product M12, MDF board is product M25 and the PVC on gypsum board is product M10. The cone calorimeter data for these products were kindly provided by Dr. Tsantaridis and Dr. Östman from Trätek, Stockholm, Sweden (Tsantaridis & Östman 1999). The SBI data is from the laboratories no. 7 and 17 of Round Robin exercise (Anon 1997). The room corner test data were measured at DBI, Denmark, LSF, Italy, VTT, Finland and SP, Sweden and they are reported by Sundström et al. (1998).

8
Table 1. Cases studied.
Burning material/item Experimental set up Section in this report
10 mm thick spruce timber • Cone calorimeter
• SBI test
• Room corner test
• 3.1
• 3.2
• 3.3
22 mm thick spruce timber • Modified room corner test with about 50 % less lining material
• 6-m long, 1,1-m wide and 0,5-high cavity lined with spruce timber
• 3.4
• 3.5
12 mm thick MDF board • Cone calorimeter
• SBI test
• Room corner test
• 4.1
• 4.2
• 4.3
PVC wall carpet on gypsum plasterboard (PVC grammage 1500 g/m2)
• Cone calorimeter
• SBI test
• Room corner test
• 5.1
• 5.2
• 0
Upholstered furniture: a chair with PU paddings and PP fabric
• Cone calorimeter
• Furniture calorimeter
• ISO room test
• 6.1
• 6.2
• 6.3
Cables with plastic sheathing
• 6-m long, 1,2-m wide and 0,6-high cavity lined with non-combustible board
• 7
Heptane • Pool fires of various sizes
• 8
In the FDS-vs.-data comparison for three solid construction materials and the upholstered furniture, the idea has been to establish the FDS input parameters governing the pyrolysis and combustion from the small-scale cone calorimeter results. The parameters have been selected according to comparison of the measured and calculated heat release rate (HRR) so that a best fit between data and calculated curve results. The goodness of the agreement between the data and the calculated time series is judged by visual compatibility. The parameter values to describe the fuel (FDS attributes "REAC ID" and "SURF ID") are summarised in Appendix A.

9
The version of the FDS program, version 4, differs from the earlier version in its ability to model burning of charring fuels. Thus, the only feature of the FDS that we give a more detailed look at is the modelling of pyrolysis and combustion of charring fuels in Chapter 2. For any other features of the FDS, the reader may refer to the FDS technical guidance documents and user's manuals (McGrattan et al. 2002, McGrattan et al. 2002b) or to other discussions about fire modelling based on Large-Eddy Simulation (e.g., McGrattan et al. 1998, Novozhilov 2001).
Dependence of results obtained by FDS on the grid resolution is a well-known fact (McGrattan et al. 2002, McGrattan et al. 2002b, Ma & Quintiere 2003, Bounagui et al. 2004). In the studies of the solid fuels where the test methods have different scales, the grid resolution d (length of the cubic computation cell) should be related to the characteristic heat release rate Q& . In this work, d has been selected so that its proportion of the characteristic fire diameter D* given by
52
1100kW
⎟⎟⎠
⎞⎜⎜⎝
⎛≈∗ QD
& (1)
is similar for each experimental set up. The characteristic HRR values, fire diameters and grid sizes d are given in Table 2. In the heptane pool fire studies, the grid resolution was the principal variable.
Table 2. The characteristic HRR values, fire diameters and grid sizes d and used in the studies with the solid fuels.
Test Q& (kW) D* (cm) d (cm)
Cone calorimeter 2 8 2
SBI test 50 30 7,5
Room corner test2 500 73 20
Cavity experiments 100 38 10
2 Also the partially lined version of the room corner test.

10
2. Modelling of pyrolysis and combustion of charring fuels
The heat transfer and pyrolysis inside the charring materials like wood are modelled using a one-dimensional model, which was originally developed by Atreya (1984), and further developed by Ritchie et al. (1997). However, here the pyrolysis is assumed to take place on an infinitely thin front, instead of continuous pyrolysis region. The model describes the conduction of heat inside the material, the evaporation of moisture and the degradation of the virgin material to gaseous fuel and char. The volatile gases are instantaneously released to the gas space. The governing equation for energy is
( )[ ] ( )[ ]00 TTDHt
TTCHtx
Tkxt
Tc evm
pys
s −−∆∂
∂+−−∆
∂∂
+⎟⎠⎞
⎜⎝⎛
∂∂
∂∂
=∂∂ ρρρ (2)
where ρs is the total density of the solid, and ρm is the moisture density. The boundary condition on the surface is due to the convection and radiation
gasgasrad
solids x
TkqxTk
∂∂
−′′=∂∂
− & (3)
where radq ′′& is the net radiative heat flux on the surface and ks and kgas are the solid and gas phase conductivities, respectively. The back side boundary condition is either adiabatic or convection to the back side gas. ∆Hpy and ∆Hev are the heat of pyrolysis and the heat of water evaporation. Coefficient C and D are defined as
gpchars
charpcharsps ccc
C ,0
,0,0 −−
−=
ρρρρ
(4)
gpmp ccD ,, −= (5)
where ρs0, cp,s0, ρchar and cp,char are the densities and specific heats of the virgin material and char, respectively, and cp,g and cp,m are the specific heats of gaseous products and moisture. The overbars in Equations (4) and (5) denote the average of the values at instantaneous temperature T and initial temperature T0. The pyrolysis rate of the material is modelled as a first order Arrhenius reaction
RTEAAem /−=′′& (6)
where A is the pre-exponential factor and EA is the activation energy. The coefficients A and EA are chosen such that the pyrolysis takes place very close to a given pyrolysis temperature. The modelling reported in this text was done using a pre-release version of
11
FDS 4, which employs Eq. (5) to describe the pyrolysis rate. The forthcoming official release version of the FDS 4.0 will, however, use a slightly different formulation of the pyrolysis rate, with the densities of the virgin material and char expressed explicitly:
( ) RTEchars
AeAm /0
−−′=′′ ρρ& . (7)
This formulation is closer to the traditional form of the pyrolysis equations and it also makes the coefficient A' less dependent of the material density.
The pyrolysis is assumed to take place at infinitely thin front moving inside the material. The velocity of the front is given by
chars
mvρρ −′′
=0
& (8)
and the front moves a distance ∆x = v ∆t during the time step ∆t. For the calculation of the term δρs/δt appearing in the energy equation, the pyrolysis rate is distributed evenly inside the volume of the wall cell containing the front. The evaporation rate of moisture is modelled in a similar manner.
The following definitions are used to calculate the thermal properties of the material during the drying and charring processes.
( )mpmcpcspa cccc ,,0, ρρρρ ++= ⎟⎟⎠
⎞⎜⎜⎝
⎛+⎟⎟
⎠
⎞⎜⎜⎝
⎛=
char
cchar
s
ass kkk
ρρ
ρρ
00 (9)
chars
charssa ρρ
ρρρρ−−
=0
0 asc ρρρ −=
where the thermal properties of virgin material and char, cp,s0, cp,char, ks0 and kchar, may be temperature dependent. ρa and ρc are the densities of active and passive matter, respectively.
The selection of the proper material properties and the pyrolysis coefficients is a very difficult task. However, the uncertainty related to the coefficients of the pyrolysis rate is avoided by assuming a thin pyrolysis front. Consequently, the pyrolysis rate is controlled by the heat of pyrolysis and the heat transfer inside the material.

12
3. Spruce timber The fuel in this part of the study is spruce board. The comparison of FDS 4 results with the results of the standard test methods involves spruce timber of thickness 10 mm and with the results obtained in ad hoc experimental set ups involves spruce timber of thickness 22 mm. In the standard tests, the specimens were conditioned to stationary weight at 23 °C and 50 % relative humidity, which corresponds to ca. 10 % wood material moisture content. In the ad hoc tests, the specimens were exposed to the laboratory ambient for ca. 1 night before the experiment and their moisture content was different from that of the specimens' in the standard tests. The wood was drier (moisture ca. 8 %) in the modified room corner test and more wet in the cavity fire test (ca. 12�13 %).
3.1 Cone calorimeter, 10 mm thick spruce board
Figure 1 shows comparison between measured and calculated HRR curves for 10 mm thick spruce timber in a cone calorimeter test. It may be seen that the calculated and measured ignition delay agree well as well the HRR development up to about 3�4 minutes. FDS fails to reproduce the second rise in the HRR curve. This is at least partially due to the lack of surface oxidation model and the FDS results could be improved by adding the surface reactions to the model.
0.0
0.5
1.0
1.5
2.0
2.5
0 60 120 180 240 300 360 420 480
measument 1measurement 2FDS
time (s)
HR
R (k
W)
Figure 1. 10 mm thick spruce timber in the cone calorimeter: comparison of HRR data with the HRR curve calculated using FDS 4.

13
3.2 SBI test, 10 mm thick spruce board
When comparing the FDS 4 results with the SBI test results, there is a problem related to the specimen back side boundary condition. In FDS, one has to select either a perfectly insulated boundary condition or boundary condition corresponding to heat transfer to air at ambient temperature. In the SBI test, the not fire-exposed face of specimen is attached to a calcium-silicate board and the experimental time scale is longer than the in the cone calorimeter. The role of the back side boundary condition is therefore strongly emphasized. This can be seen in the comparison between the measured and the FDS results in Figure 2a, revealing that the boundary condition has a crucial influence on the HRR at times corresponding to the thermal penetration time of the order of 100 s3.
a)
0
20
40
60
80
100
120
0 200 400 600 800 1000 1200
LAB 17/1LAB 17/2LAB 17/3LAB 17, avgLAB 07/1LAB 07/2LAB 07/3LAB 07, avgFDS4 (i)FDS(e)
tim e (s)
HR
R s
ampl
e (k
W)
insulated backing
exposed backing
b)
0
20
40
60
0 60 120 180
LAB 17/1LAB 17/2LAB 17/3LAB 17, avgLAB 07/1LAB 07/2LAB 07/3LAB 07, avgFDS4 (i)FDS(e)
time (s)
HR
R s
ampl
e (k
W)
insulated backing
exposed backing
Figure 2. 10 mm thick spruce timber in the SBI test: comparison of the sample HRR data with the HRR curves calculated using FDS 4: a) the whole test and b) the first 3 minutes.
To achieve better agreement in comparison between FDS results and SBI test results, possibility to model the heat transfer on layered products should be implemented in the
3 The thermal penetration time tp depends on the specimen thickness δ and thermal diffusivity α as tp = δ2/(4α) (Karlsson & Quintiere 2000).

14
FDS. This feature is very important if one wishes to model burning of building products found in our environment as they very often are made of layers of different products.
Despite the problems pointed out, FDS reproduces the reaction-to-fire performance of spruce timber in SBI with very good accuracy, as shown by Figure 2b.
3.3 Room corner test, 10 mm thick spruce board
The room corner test is essentially a reaction-to-fire test that is terminated when the flashover occurs in the test room. In this case, for a thermally thick specimen, the back side boundary conditions have only a minute influence on the test development. Consequently, the HRR curve calculated using the FDS agrees well with the measured HRR curve (Figure 3).
0
1000
2000
3000
4000
5000
0 60 120 180 240 300 360
Measurement
FDS
time (s)
HR
R s
ampl
e (k
W)
test halted, water suppression
Figure 3. 10 mm thick spruce timber in the room corner test: comparison of HRR data with the HRR curve calculated using FDS 4.
3.4 Room corner test with partial lining, 22 mm thick spruce board
The modified room corner experiment studied in this section was carried out at VTT (Hietaniemi 2001). The lining configuration of the experiment is shown in Figure 4. The linings were of 22 mm thick spruce board. The set up was made in order to delay and smoothen the transition to flashover.

15
ca. 14 m2 Ts1Ts2Ts3Ts4Ts5
HF meter
Figure 4. Modified room corner experiment with partially lined walls and ceiling: configuration of the spruce timber linings with total area of ca. 14 m2. There were 5 thermocouples on surface of the rear wall positioned at centreline of the wall at heights 225 cm (Ts1), 195 cm (Ts2), 165 cm (Ts3), 135 cm (Ts4) and 105 cm (Ts5) above the floor. On the floor in its centre there was heat flux meter pointing towards the ceiling.
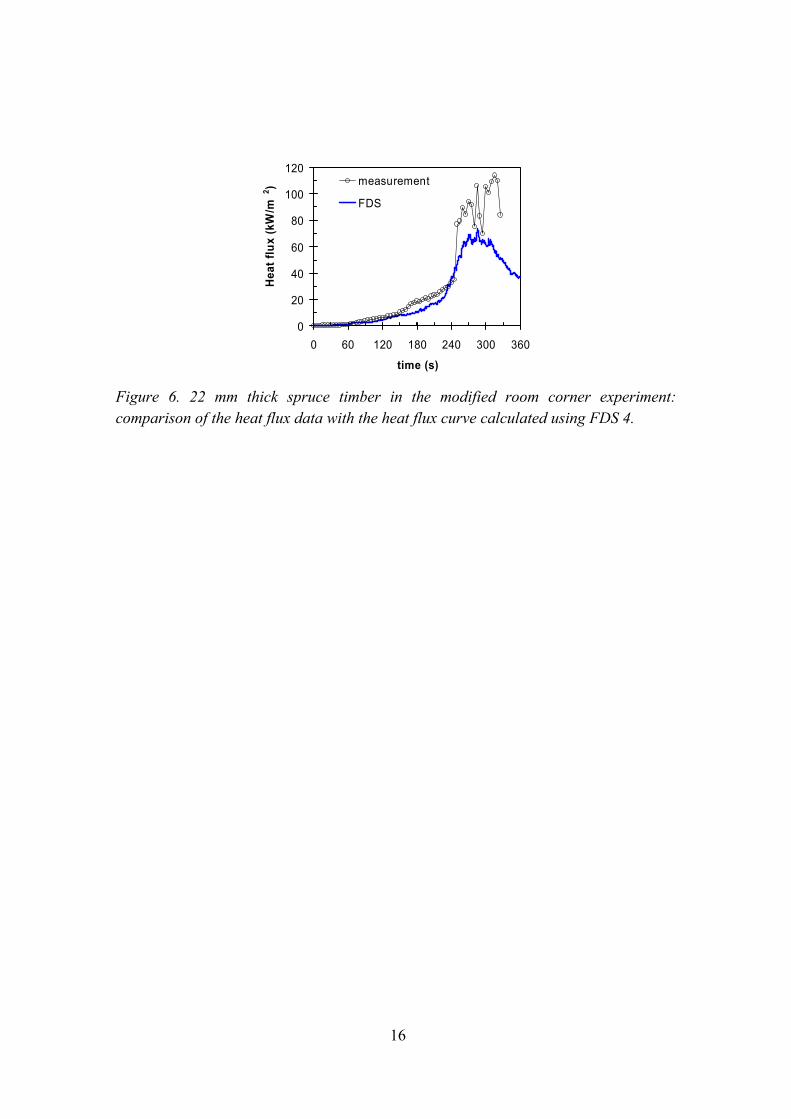
Measured and calculated HRR from the sample are shown in Figure 5, the heat flux results are compared in Figure 6 and the temperature data in Figure 7. The agreement between the HRR curves is good. The measured heat flux to the floor at the room centre is somewhat higher than that predicted by the FDS, but yet the agreement between data and calculated heat flux can be considered as fairly good, taking into account the experimental uncertainty associated with the measurement of such high heat fluxes. FDS reproduces the maximum temperatures very well. The temporal development of the temperature data is predicted with varying accuracy: time history of Ts1 at 15 cm from the ceiling is reproduced worst while for Ts4 and Ts5 the FDS temperature curve follows the data reasonably well. Overall, the agreement between the data and the calculated results is good.
0
500
1000
1500
2000
2500
3000
0 60 120 180 240 300 360
measurement
FDS
time (s)
HR
R s
ampl
e (k
W)
Figure 5. 22 mm thick spruce timber in the modified room corner experiment: comparison of sample HRR data with the HRR curve calculated using FDS 4. The arrow denotes the moment when suppression with water was started.
16
0
20
40
60
80
100
120
0 60 120 180 240 300 360
measurement
FDS
time (s)
Hea
t flu
x (k
W/m
2 )
Figure 6. 22 mm thick spruce timber in the modified room corner experiment: comparison of the heat flux data with the heat flux curve calculated using FDS 4.

17
Ts1
0
200
400
600
800
1000
0 60 120 180 240 300 360
measurementFDS
time (s)
Ts1
(o C)
Ts2
0
200
400
600
800
1000
0 100 200 300 400
measurementFDS
time (s)
Ts2
(o C)
Ts3
0
200
400
600
800
1000
0 100 200 300 400
measurementFDS
time (s)
Ts3
(o C)
Ts4
0
200
400
600
800
1000
0 100 200 300 400
measurementFDS
time (s)
Ts4
(o C)
Ts5
0
200
400
600
800
1000
0 100 200 300 400
measurement
FDS
time (s)
Ts5
(o C)
Figure 7. 22 mm thick spruce timber in the modified room corner experiment: comparison of the temperature data measured with the thermocouples shown in Figure 4 with the thermocouple results calculated using FDS 4.

18
3.5 6-m long cavity lined with 22 mm thick spruce board
The cavity fire experiments were part of a large research project aimed at improving fire safety of building voids and cavities, carried out at VTT 2000�2004 (Hietaniemi et al 2004). The length of the cavity is 6 m, height 0,5 m and width 1,1 m. Its sidewalls and ceiling were lined with 22 mm thick spruce board and its floor was made of 12 mm thick rockwool. The wooden cavity construction was surrounded by cavity made of non-combustible board. The smoke gases generated in the burning were conveyed to the smoke gas analysis and clean up system by a steel pipe making a 90° angle (Figure 8).
a) A B
C
b)
A B C
to smoke gas analysis and exhaust system
burner
6 m
0,5 m1,3 m
Figure 8. The set up in the cavity fire experiments: a) a photograph taken from the rear end of the set up and b) FDS model of the system. A) Front end (fresh air inflow), B) rear end and C) steel pipe line conveying the smoke gases to the smoke collection hood which leads to smoke gas analysis and clean up systems. The length of the cavity is 6 m, height 0,5 m and width 1,10 m.

19
6 m
G2G3
G4G5
G6
0,50 m
HF
1,10 m
1 m
0,5 m
3 m
0,25 m
0,5 m
Figure 9. Instruments included in the FDS model: G2-G5 are thermocouples measuring the gas temperature 5 cm below the cavity ceiling at positions 1,5 m (G2), 2,5 m (G3), 3,5 m (G4), 4,5 m (G5) and 5,5 m (G6). HF is a heat flux gauge mounted flush at the wall opposite to the burner.
a) b) c)
Figure 10. Pictures showing the development of the experiment: a) before ignition, b) 1 min after burner ignition and c) ca. 3:45 after burner ignition.
The instrumentation used in the data-vs.-FDS comparison in shown in Figure 9. The linings were ignited with a burner placed next to one wall of the cavity, at 0,5 m distance from the front end. The burner was burned at 50 kW for 240 s whereafter the burned was switched off because all the combustible surfaces of the cavity had caught fire the fire was spreading fast (Figure 10). However, quite unexpectedly, the fire died out after the burner had been switched off. This ends the 1st phase of the experiment. The 2nd phase of the experiment starts when the burner was reinstalled and reignited. In the 2nd phase, a fully engulfed fire was achieved when the burner output was raised to 100 kW (see Appendix B for more details).
In the comparison between the wooden cavity experiment data and FDS results we concentrate on the 1st phase of the experiment only. Measured and calculated HRR from the sample are shown in Figure 11, the heat flux results are compared in Figure 12

20
and the temperature data in Figure 13. It can be seen that unlike in the experiment, the FDS fire simulation does not exhibit extinguishing after the burner switch off. However, FDS reproduces the initial (first 4 minutes) HRR development well. Also the calculated temporal development of the temperatures in the end of the cavity (G4 & G5) during this time interval is reproduced fairly well by the FDS. Discrepancies between the simulated results and data are most distinct for the heat flux data and the temperature data obtained by thermocouples at the front end of the cavity.
As demonstrated by the abrupt quenching of the fire after the burner switch off, this experimental set up is quite unstable with respect to its flow and heat transfer characteristics. Thus, it is a very challenging object to fire simulation. Regarding this, the agreement between the data and the FDS results should be seen as quite promising.
0
500
1000
1500
0 60 120 180 240 300 360
Time from ignition (s)
HR
R (k
W)
Measured
FDS
Figure 11. 22 mm thick spruce timber as lining in a cavity: comparison of sample HRR data with the HRR curve calculated using FDS 4.
0
20
40
60
80
0 60 120 180 240 300 360
Time from ignition (s)
HF meas
FDS
Hea
t flu
x to
wal
l (kW
/m2 )
Figure 12. 22 mm thick spruce timber as lining in a cavity: comparison of the heat flux data with the heat flux curve calculated using FDS 4.

21
G2
0
200
400
600
800
1000
1200
0 60 120 180 240 300 360Time from ignition (s)
Tgas
(o C
)
G2 meas
G2 FDS
G3
0
200
400
600
800
1000
1200
0 60 120 180 240 300 360
Time from ignition (s)
Tgas
(o C
)
G3 meas
G3 FDS
G4
0
200
400
600
800
1000
1200
0 60 120 180 240 300 360
Time from ignition (s)
Tgas
(o C
)
G4 meas
G4 FDS
G5
0
200
400
600
800
1000
1200
0 60 120 180 240 300 360Time from ignition (s)
Tgas
(o C
)
G5 meas
G5 FDS
G6
0
200
400
600
800
1000
1200
0 60 120 180 240 300 360Time from ignition (s)
Tgas
(o C
)
G6 meas
G6 FDS
Figure 13. 22 mm thick spruce timber as lining in a cavity: comparison of the temperature data measured with the thermocouples shown in Figure 4 with the thermocouple results calculated using FDS 4.

22
4. MDF board, thickness 12 mm We consider the fire performance and its computational reproduction of the 12 mm thick medium-density fibre (MDF) board in three test set ups, the cone calorimeter, the SBI test and the room corner test. The FDS parameters charactering the pyrolysis and combustion are given in Appendix A.
4.1 Cone calorimeter
Figure 14 shows comparison between measured and calculated HRR curves for 12 mm MDF in a cone calorimeter test. It may be seen that the calculated and measured HRR development agree well up to about 6�7 minutes. The calculated ignition delay is about 20 s shorter than the measured value. As for the spruce timber, FDS fails to reproduce the second rise in the HRR curve, which can be traced back to the char surface oxidation model.
0
1
2
3
4
0 120 240 360 480 600 720
DataFDS
tim e (s)
HR
R (k
W)
Figure 14. 12 mm thick MDF board in the cone calorimeter: comparison of HRR data with the HRR curve calculated using FDS 4.
23
4.2 SBI test
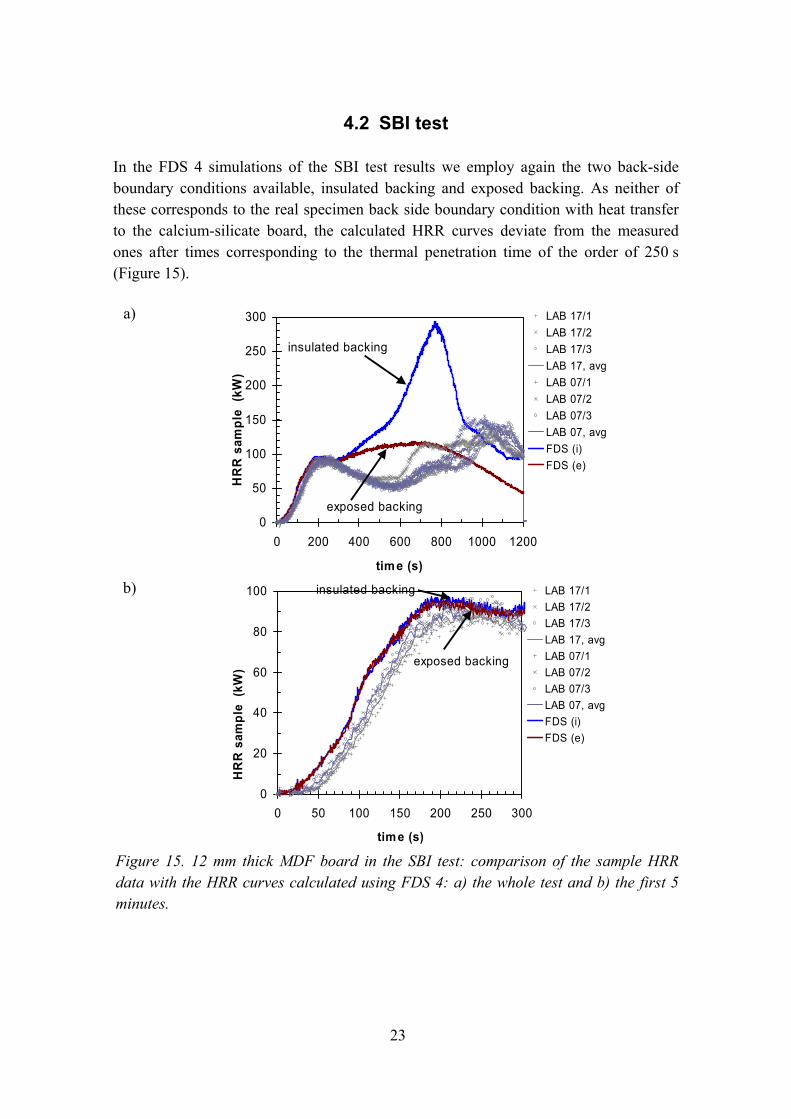
In the FDS 4 simulations of the SBI test results we employ again the two back-side boundary conditions available, insulated backing and exposed backing. As neither of these corresponds to the real specimen back side boundary condition with heat transfer to the calcium-silicate board, the calculated HRR curves deviate from the measured ones after times corresponding to the thermal penetration time of the order of 250 s (Figure 15).
a)
0
50
100
150
200
250
300
0 200 400 600 800 1000 1200
LAB 17/1LAB 17/2LAB 17/3LAB 17, avgLAB 07/1LAB 07/2LAB 07/3LAB 07, avgFDS (i)FDS (e)
time (s)
HR
R s
ampl
e (k
W)
insulated backing
exposed backing
b)
0
20
40
60
80
100
0 50 100 150 200 250 300
LAB 17/1LAB 17/2LAB 17/3LAB 17, avgLAB 07/1LAB 07/2LAB 07/3LAB 07, avgFDS (i)FDS (e)
time (s)
HR
R s
ampl
e (k
W)
insulated backing
exposed backing
Figure 15. 12 mm thick MDF board in the SBI test: comparison of the sample HRR data with the HRR curves calculated using FDS 4: a) the whole test and b) the first 5 minutes.

24
4.3 Room corner test
The room corner HRR data for the 12 mm MDF board is compared to FDS calculation result in Figure 16. The agreement in time of flashover is excellent.
0
500
1000
1500
2000
2500
3000
3500
0 60 120 180 240 300 360
MeasuredFDS
time (s)
HR
R s
ampl
e (k
W) test halted,
water suppression
Figure 16. 12 mm thick MDF board in the room corner test: comparison of HRR data with the HRR curve calculated using FDS 4.

25
5. PVC wall carpet on gypsum board The third construction product consider in this comparison work is PVC wall carpet on gypsum board. The grammage of the PVC covering is 1500 g/m2. As FDS has not (yet) the possibility to model layered products, the product was treated in the FDS simulations as pure PVC layer with the grammage of 1500 g/m2. As the influence of the gypsum board is neglected, deviations between the measured results and the FDS results are expected for cases when, e.g., the effect performance of the gypsum board as a heat sink has influence on the progress of the test.
5.1 Cone calorimeter
Figure 17 shows comparison between measured and calculated HRR curves for 1500 g/m2 PVC layer in a cone calorimeter test. It may be seen that the agreement between the calculated and measured HRR development is reasonably good during the first 3 minutes. After 3 minutes, the calculated HRR drops to zero, while the measured curves still show non-zero readings. This deviation may partially be explained by the fact that in a cone calorimeter experiment, there is smouldering and smoke production in the specimen even if the flames have died out; often this smouldering and smoking gives rise to HRR signal. The calculated ignition agrees reasonably well with the measured value.
0
1
2
0 60 120 180 240 300 360
measurement 1
measurement 2
FDS
time (s)
HR
R (k
W)
Figure 17. PVC layer of grammage 1500 g/m2 in the cone calorimeter: comparison of HRR data with the HRR curve calculated using FDS 4.

26
5.2 SBI test
In the FDS 4 simulations of the SBI test results we employ again the two back-side boundary conditions available, insulated backing and exposed backing. As neither of these corresponds to the real specimen back side boundary condition with heat transfer first to the gypsum board and then to the calcium-silicate board, the calculated HRR curves show some deviations from the measured ones (Figure 18).
a)
0
10
20
30
40
50
60
0 200 400 600 800 1000 1200
LAB 17/1LAB 17/2LAB 17/3LAB 17, avgLAB 07/1LAB 07/2LAB 07/3LAB 07, avgFDS(i)FDS(e)
time (s)
HR
R s
ampl
e (k
W)
insulated backing
exposed backing
b)
0
10
20
30
40
50
60
0 100 200 300 400 500 600
LAB 17/1LAB 17/2LAB 17/3LAB 17, avgLAB 07/1LAB 07/2LAB 07/3LAB 07, avgFDS(i)FDS(e)
time (s)
HR
R s
ampl
e (k
W)
insulated backing
exposed backing
Figure 18. PVC layer of grammage 1500 g/m2 in the SBI test: comparison of the sample HRR data with the HRR curves calculated using FDS 4: a) the whole test and b) the first 10 minutes.

27
5.3 Room corner test
The calculated HRR curve for the 1500-g/m2 PVC layer is compared to the HRR curve measured in the room corner test in Figure 19. It may be seen that FDS predicts well the time when the HRR starts to rise. Thereafter, however, the calculated and measured HRR curves differ notably: FDS predicts that there is a flashover while in the measurement, the HRR rises no higher than to about 300 kW. The times when the burning ends are similar in simulation and in the test.
The reason why FDS predicts a flashover contrary to the test results is evidently the fact that in the FDS model we have only a layer of PVC with its backing exposed to ambient but in the test, the PVC layer is backed to a gypsum board which, when heated up to ca. 100 °C, acts an efficient heat sink. In the simulation the absence of such heat sink leads to rising of the room hot gas layer temperature up to and above the flashover temperature whereas in the tests, the heat absorption by the gypsum board keeps the room hot gas sufficiently cold so that no flashover takes place.
0
100
200
300
400
500
0 60 120 180 240 300 360
MeasurementFDS
time (s)
HR
R s
ampl
e (k
W)
Figure 19. PVC layer of grammage 1500 g/m2 in the room corner test: comparison of HRR data with the HRR curve calculated using FDS 4.
28
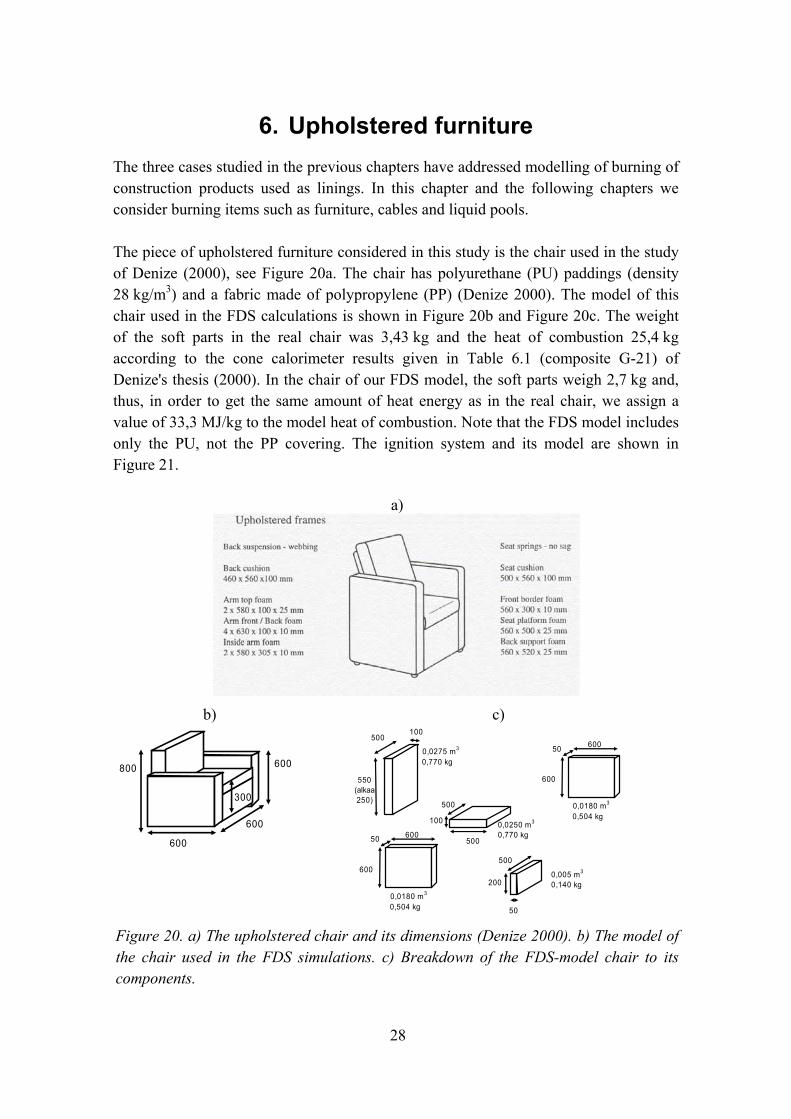
6. Upholstered furniture The three cases studied in the previous chapters have addressed modelling of burning of construction products used as linings. In this chapter and the following chapters we consider burning items such as furniture, cables and liquid pools.
The piece of upholstered furniture considered in this study is the chair used in the study of Denize (2000), see Figure 20a. The chair has polyurethane (PU) paddings (density 28 kg/m3) and a fabric made of polypropylene (PP) (Denize 2000). The model of this chair used in the FDS calculations is shown in Figure 20b and Figure 20c. The weight of the soft parts in the real chair was 3,43 kg and the heat of combustion 25,4 kg according to the cone calorimeter results given in Table 6.1 (composite G-21) of Denize's thesis (2000). In the chair of our FDS model, the soft parts weigh 2,7 kg and, thus, in order to get the same amount of heat energy as in the real chair, we assign a value of 33,3 MJ/kg to the model heat of combustion. Note that the FDS model includes only the PU, not the PP covering. The ignition system and its model are shown in Figure 21.
a)
b)
800 600
600
300
600
c) 500
100
550(alkaa 250)
0,0275 m3
0,770 kg
50 600
600
0,0180 m3
0,504 kg
50 600
600
0,0180 m3
0,504 kg100
500
500
0,0250 m3
0,770 kg
50
500
2000,005 m3
0,140 kg
Figure 20. a) The upholstered chair and its dimensions (Denize 2000). b) The model of the chair used in the FDS simulations. c) Breakdown of the FDS-model chair to its components.

29
a)
b)
Figure 21. Position of the 30-kW ignition in the furniture calorimeter and ISO room experiments: a) actual (Girdis 2000) and b) FDS model (the red area releases heat at a rate of 30 kW).
6.1 Cone calorimeter
Figure 22 shows comparison between measured and calculated HRR curves of a sample of the upholstered chair in a cone calorimeter test. It should be noted that the FDS model includes only the PU part, not the PP covering. This explains why the FDS predicts almost an immediate ignition: the thermal inertia of the PU slab with density of 28 kg/m3 is so low that the PU surface reaches the ignition temperature very quickly. The calculated maximum level of HRR and the duration of the burning agree well with the measured data.
0
1
2
3
4
5
0 50 100 150 200 250 300
time (s)
HR
R (k
W)
FDS
measurements
Figure 22. Sample of the upholstered chair in a in the cone calorimeter: comparison of HRR data with the HRR curve calculated using FDS 4. Note that FDS model does not include PP fabric of the actual sample.

30
6.2 Furniture calorimeter
The furniture calorimeter set up (Girdis 2000) is shown in Figure 23a and its FDS model in Figure 23b. The measured and calculated HRR curves are shown in Figure 24. Similarly to the cone calorimeter simulation, also here the FDS model includes only the fast-igniting PU component. Thus, the FDS prediction on the ignition delay and HRR growth does not follow the measured results very well. However, the duration of burning and the maximum HRR are reproduced fairly well by FDS.
a) b) to the exhaust duct
Figure 23. Furniture calorimeter set up: a) actual (Denize 2000) and b) FDS model.
0.0
0.2
0.4
0.6
0.8
1.0
0 120 240 360 480 600 720
time (s)
HR
R (M
W)
FDSmeasurement
Figure 24. Upholstered chair in a furniture calorimeter experiment: comparison of HRR data (Dennis 2000) with the HRR curve calculated using FDS 4.

31
6.3 ISO room
The ISO room experimental set up (Denize 2000) is shown in Figure 25a and its FDS model in Figure 25b. The experimental and simulated HRR curves are shown in Figure 26. Again, the FDS model predicts faster ignition and HRR growth than what is seen in the experimental data because the FDS model includes only the fast-igniting PU component. The duration of burning and the maximum HRR are reproduced fairly well by FDS.
a)
b)
Figure 25. ISO room experiment set up: a) actual (Girdis 2000) and b) FDS model.
0.00
0.25
0.50
0.75
1.00
1.25
1.50
1.75
2.00
2.25
0 120 240 360 480 600 720 840 960 1080 1200
FDS
time (s)
HR
R (M
W)
Figure 26. Upholstered chair in an ISO room experiment: comparison of HRR data (Girdis 2000) with the HRR curve calculated using FDS 4.

32
6.4 Burning enhancement induced by the enclosure
Heat feedback from the walls and ceiling is the key feature of enclosure fires accelerating the burning and heat release rate. Here we analyse how well FDS reproduces the enhancement in burning observed experimentally by comparing the "free" burning of the upholstered chair in the furniture calorimeter and in the ISO room. The experimental results are shown in Figure 27a and FDS results in Figure 27b. The enhancement in burning may be quantified comparing the maximum HRR obtained in the ISO room (HRRISO.max) to that measured in the furniture calorimeter (HRRFC,max). The measured value for this enhancement factor (HRRISO.max/HRRFC,max) is 2,25 and the value obtained form the FDS results 2,35, i.e., the virtually the same value as the experimental value. Thus, FDS predicts the enclosure effects to the burning of the chair very well.
a)
0.0
0.5
1.0
1.5
0 120 240 360 480 600 720
ISO room
Furniturecalorimeter
time (s)
HR
R (M
W)
b)
0.0
0.5
1.0
1.5
0 120 240 360 480 600 720
ISO room
Furniturecalorimeter
time (s)
HR
R (M
W)
Figure 27. HRR in furniture calorimeter and in ISO room experiment: a) measured values (Denize 2000, Girdis 2000) and b) FDS model results.
33
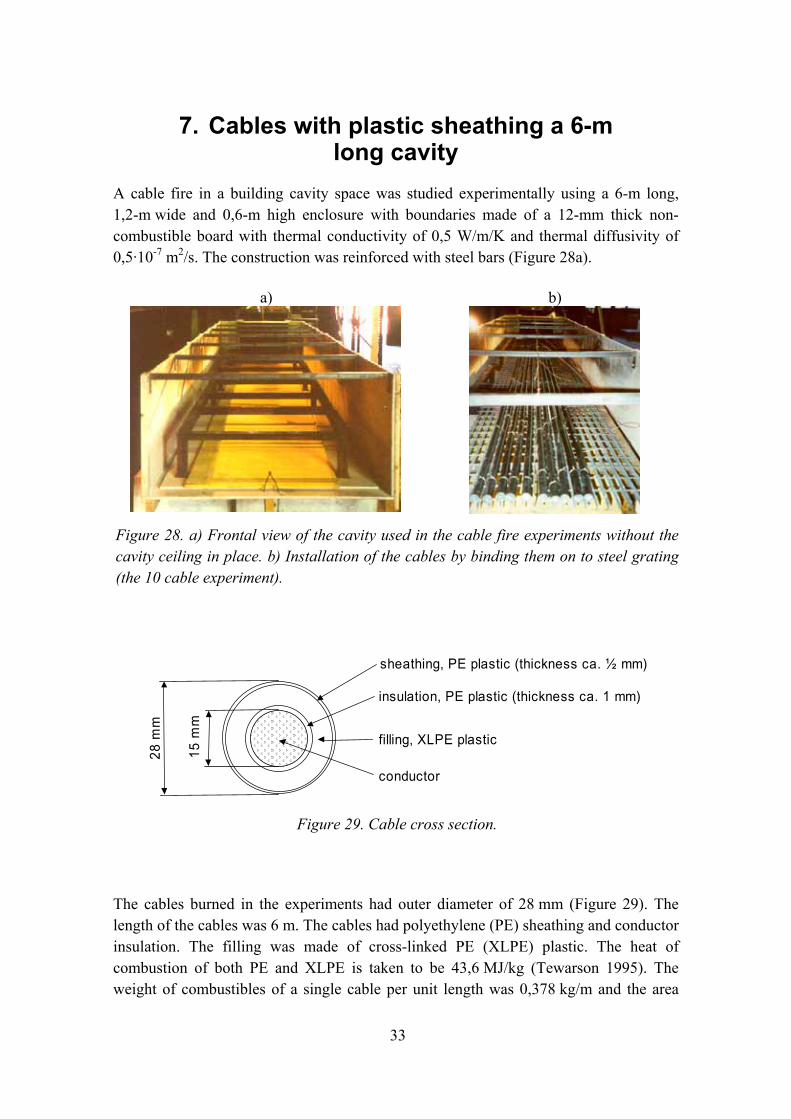
7. Cables with plastic sheathing a 6-m long cavity
A cable fire in a building cavity space was studied experimentally using a 6-m long, 1,2-m wide and 0,6-m high enclosure with boundaries made of a 12-mm thick non-combustible board with thermal conductivity of 0,5 W/m/K and thermal diffusivity of 0,5·10-7 m2/s. The construction was reinforced with steel bars (Figure 28a).
a)
b)
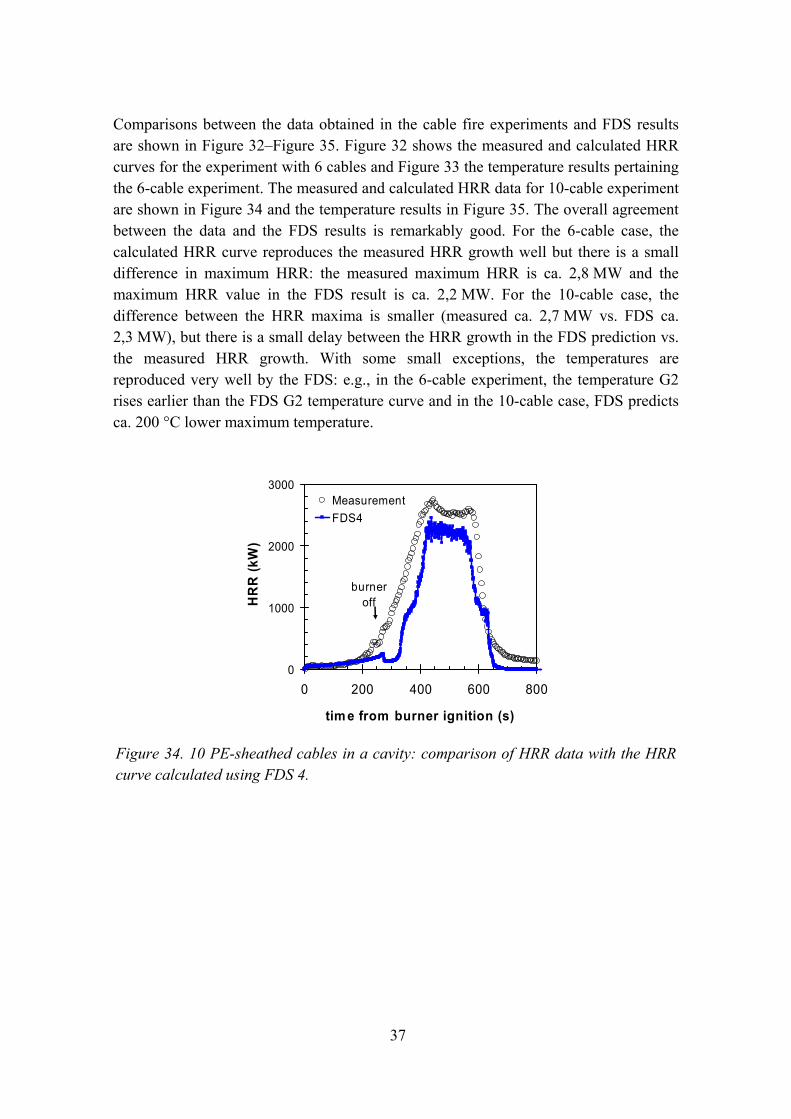
Figure 28. a) Frontal view of the cavity used in the cable fire experiments without the cavity ceiling in place. b) Installation of the cables by binding them on to steel grating (the 10 cable experiment).
filling, XLPE plastic
28 m
m
conductor
sheathing, PE plastic (thickness ca. ½ mm)
insulation, PE plastic (thickness ca. 1 mm)
15 m
m
Figure 29. Cable cross section.
The cables burned in the experiments had outer diameter of 28 mm (Figure 29). The length of the cables was 6 m. The cables had polyethylene (PE) sheathing and conductor insulation. The filling was made of cross-linked PE (XLPE) plastic. The heat of combustion of both PE and XLPE is taken to be 43,6 MJ/kg (Tewarson 1995). The weight of combustibles of a single cable per unit length was 0,378 kg/m and the area

34
exposed to fire is 0,088 m2/m. Here we considered two experiments, one with six cables and one with 10 cables. In the FDS cables are modelled as solid PE objects with length of 6 m and square cross section with dimensions of 5 cm × 5 cm. Only the upper and lower surfaces of the model cables were combustible, the side surfaces were assigned a very ignition temperature and thus, they did not participate in burning. The thickness that FDS uses in the calculations, the parameter DELTA, was assigned a value of 0,01 m. With this thickness and using 920 kg/m3 for the PE density, the mass per unit length of the FDS model cables is 0,46 kg/m. The combustible area exposed to fire of the FDS model cables, however, is calculated using the cross section input data and, thus, its value in the FDS model is 2×0,05 m2/m = 0,1 m2/m.The details of the fire load and its FDS modelling are given in Table 3. It is seen that the FDS model of the cables gives values for the fire load (kg or MJ) and exposed area (m2) which are quite close to those of the experiments.
With respect to instrumentation, the cable cavity experiments were similar to the cavity experiment with wooden linings with the exception that there was no HF gauge in the cable experiments (Figure 30).
The experiment was run so that cables were ignited by a burner positioned under the cables 50 cm from the front end of the cavity (Figure 31a). After ignition, the burner was operated at 50 kW for 240 s where after it was turned off and removed from the cavity. Figure 31b shows an example of the cavity fire in the experiment with 10 cables.
Table 3. The characteristics of the fire load in the two cable fire experiments and their modelling in the FDS program.
6 cable experiment 10 cable experiment
Cable fire load in the experiments
Combustible mass 13,6 kg 22,7 kg
Fire load (using 43,6 MJ/kg) 590 MJ 990 MJ
Area exposed to fire 3,2 m2 5,3 m2
FDS model of the cable fire load
Configuration 5 square-shaped objects
burner
cables (5 cm x 5 cm)
9 square-shaped objects
burner
cables(5 cm x 5 cm)
Combustible mass 13,8 kg 24,8 kg
Fire load (using 43,6 MJ/kg) 600 MJ 1080 MJ
Area exposed to fire 3,0 m2 5,4 m2

35
6 m
G2G3
G4G5
G6
0,6 m
1,2 m
0,5 m
Figure 30. Instruments included in the FDS model: G2-G5 are thermocouples measuring the gas temperature 5 cm below the cavity ceiling at positions 1,5 m (G2), 2,5 m (G3), 3,5 m (G4), 4,5 m (G5) and 5,5 m (G6).
a)
b)
Figure 31. a) Positioning of the burner under the cables. b) View of the burning at ca. 8 minutes after burner ignition (the 10 cable experiment).
0
1000
2000
3000
0 200 400 600 800
MeasurementFDS
tim e from burner ignition (s)
HR
R (k
W)
burneroff
Figure 32. 6 PE-sheathed cables in a cavity: comparison of HRR data with the HRR curve calculated using FDS 4.

36
G2
0
200
400
600
800
1000
1200
0 200 400 600 800
MeasurementFDS4
tim e from burner ignition (s)
G2
(o C)
burneroff
G3
0
200
400
600
800
1000
1200
0 200 400 600 800
MeasurementFDS4
tim e from burner ignition (s)
G3
(o C)
burneroff
G4
0
200
400
600
800
1000
1200
0 200 400 600 800
MeasurementFDS4
tim e from burner ignition (s)
G4
(o C)
burneroff
G5
0
200
400
600
800
1000
1200
0 200 400 600 800
MeasurementFDS4
time from burner ignition (s)
G5
(o C)
burneroff
G6
0
200
400
600
800
1000
1200
0 200 400 600 800
MeasurementFDS4
tim e from burner ignition (s)
G6
(o C)
burneroff
Figure 33. 6 PE-sheathed cables in a cavity: comparison of the temperature data with results calculated using FDS 4.
37
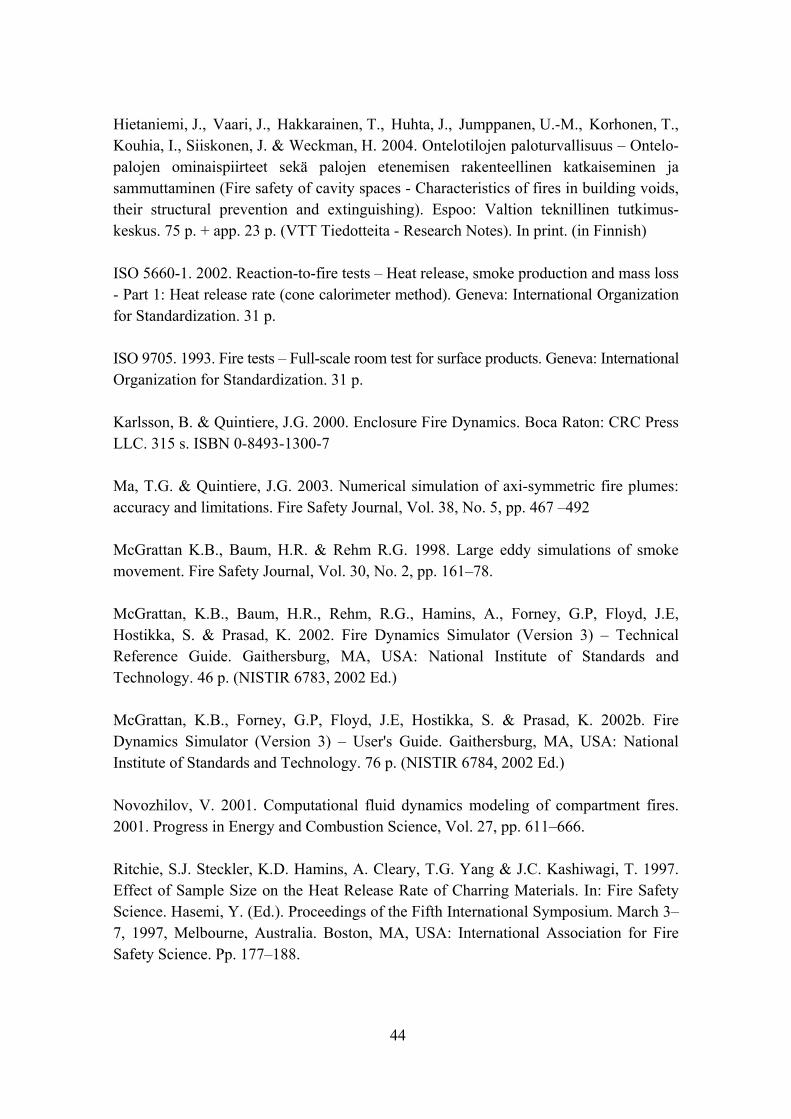
Comparisons between the data obtained in the cable fire experiments and FDS results are shown in Figure 32�Figure 35. Figure 32 shows the measured and calculated HRR curves for the experiment with 6 cables and Figure 33 the temperature results pertaining the 6-cable experiment. The measured and calculated HRR data for 10-cable experiment are shown in Figure 34 and the temperature results in Figure 35. The overall agreement between the data and the FDS results is remarkably good. For the 6-cable case, the calculated HRR curve reproduces the measured HRR growth well but there is a small difference in maximum HRR: the measured maximum HRR is ca. 2,8 MW and the maximum HRR value in the FDS result is ca. 2,2 MW. For the 10-cable case, the difference between the HRR maxima is smaller (measured ca. 2,7 MW vs. FDS ca. 2,3 MW), but there is a small delay between the HRR growth in the FDS prediction vs. the measured HRR growth. With some small exceptions, the temperatures are reproduced very well by the FDS: e.g., in the 6-cable experiment, the temperature G2 rises earlier than the FDS G2 temperature curve and in the 10-cable case, FDS predicts ca. 200 °C lower maximum temperature.
0
1000
2000
3000
0 200 400 600 800
MeasurementFDS4
tim e from burner ignition (s)
HR
R (k
W)
burneroff
Figure 34. 10 PE-sheathed cables in a cavity: comparison of HRR data with the HRR curve calculated using FDS 4.

38
G2
0
200
400
600
800
1000
1200
0 200 400 600 800
MeasurementFDS4
time from burner ignition (s)
G2
(o C)
burneroff
G3
0
200
400
600
800
1000
1200
0 200 400 600 800
MeasurementFDS4
tim e from burner ignition (s)
G3
(o C)
burneroff
G4
0
200
400
600
800
1000
1200
0 200 400 600 800
MeasurementFDS4
tim e from burner ignition (s)
G4
(o C)
burneroff
G5
0
200
400
600
800
1000
1200
0 200 400 600 800
MeasurementFDS4
time from burner ignition (s)
G5
(o C)
burneroff
G6
0
200
400
600
800
1000
1200
0 200 400 600 800
MeasurementFDS4
tim e from burner ignition (s)
G6
(o C)
burneroff
Figure 35. 10 PE-sheathed cables in a cavity: comparison of the temperature data with results calculated using FDS 4.

39
8. Heptane pool fires The burning rate of the heptane pool fire is calculated using the 'LIQUID' type surface model of the FDS (McGrattan et al. 2002). The fuel evaporation rate is a function of the liquid temperature and the concentration of fuel vapour above the pool surface. Equilibrium is reached when the partial pressure of the fuel vapour above the surface pf equals the Clausius-Clapeyron pressure
⎥⎦
⎤⎢⎣
⎡⎟⎟⎠
⎞⎜⎜⎝
⎛−−=
bs
fvcc TTR
Mhpp 11exp0 (10)
where p0 is the background pressure, hv is the heat of vaporization, Mf is the molecular weight, R is the universal gas constant, Ts is the surface temperature and Tb is the boiling temperature of the fuel. Since the Clausius-Clapeyron formula does not provide the actual mass flux of the fuel vapour, the burning rate is updated in an iterative manner towards the equilibrium where pf - pcc = 0. However, the burning rate is not iterated inside the individual time steps, but in course of time. This may limit the accuracy of the fast transients. The liquid fuel itself is treated like a thermally-thick solid for the purpose of computing the heat conduction.
The aim of this study is to establish the requisites for modelling of pool fire burning on the basis of the heat transfer mechanisms only. Achievement of this aim is one stage in the efforts to validate the FDS 4 suppression model by comparing the FDS results with data on suppression of liquid pool fires.
The results of the study are summarised in Figure 36. It shows the dependence of the burning rate per unit area on the heptane pool fire diameter. It is seen that the values obtained with the FDS reproduce the data well. The prerequisite for obtaining the good agreement with the data is that these must be at least 20 computation grid cells within the diameter of the pool.

40
Figure 36. 10 Dependence of the burning rate per unit area on the heptane pool fire diameter (D): comparison of data values (Hamins et al. 1999) with the values calculated using FDS 4.

41
9. Summary This report presents several case studies concerning comparison to experimental data of results calculated using the Fire Dynamics Simulator version 4.
The case studies comprise fire experiments of a wide ranging scale from the cone calorimeter with sample size of 10 cm × 10 cm to full-scale fire tests such as the room corner test where the burning item is made up of linings of a small room. Comparisons are made also between FDS 4 results and data obtained in the SBI euroclassification test method as well the data obtained in two ad hoc experimental set ups: one is the similar to the room corner test but has only partial linings and the other is the experimental set up used in study of fires in building cavities. The products/items studied are the following: spruce timber (thickness 10 mm or 22 mm), 12-mm thick MDF board and PVC carpet on gypsum board, upholstered chair, cables with plastic sheathing and heptane.
The results presented provide material showing the validity of the FDS fire simulation program, especially concerning flame spread modelling. The study has established a set of eligible material parameter values for engineering use of the FDS. These parameters are summarised in Appendix A. The study has unveiled also some discrepancies in the results obtained by the FDS program and the measured results. These findings help to direct the further development work of the FDS program.

42
Acknowledgements The authors gratefully acknowledge the financing to the work by the National Technology Agency of Finland (Tekes) and VTT Building and Transport. We thank Kevin McGrattan from the National Institute of Standards and Technology, USA, for the fruitful discussions and the help we have received from him. We express sincere gratitude to Dr. Tsantaridis and Dr. Östman from Trätek, Stockholm, Sweden for making the cone calorimeter data of the SBI RR products available for us.

43
References Anon. 1997. Development of the Single Burning Item Test. Brussels: CEN Fire Regulators' Group Document RG N115. 12 p. + app. 32 p.
Atreya, A. 1984. Pyrolysis, Ignition and Fire Spread on Horizontal Surfaces of Wood. Gaithersburg, MA, USA: National Bureau of Standards. (Report NBS-GCR-83-449)
Bounagui, A., Bénichou, N., McCartney, C. & Kashef, A. 2004. Grid Optimization for the Full-scale test facility to evaluate the Fire Performance of Houses - Part I - Basement Fires. Ottawa, Canada: Institute for Research in Construction, National Research Council Canada. 30 p. (IRC-RR-149)
Denize, H. 2000. The Combustion Behaviour of Upholstered Furniture Materials in New Zealand. Christchurch, New Zealand: University of Canterbury. 107 p. + app. 28 p. (Master's Thesis)
EN 13823. 2002. Reaction to fire tests for building products - Building products excluding floorings exposed to the thermal attack by a single burning item. Brussels: European Committee of Standardization. 95 p.
Girgis, N. 2000. Full-Scale Compartment Fire Experiments on �Upholstered Furniture�. Christchurch, New Zealand: University of Canterbury. 76 p. + app. 1 p. (Master's Thesis)
Hamins, A., Yang, J. C. & Kashiwagi, T. 1999. Global Model for Predicting the Burning Rates of Liquid Pool Fires. Gaithersburg, MA, USA: National Institute of Standards and Technology. 24 p. (NISTIR 6381)
Hietaniemi, J. 2001. Puun palosuojauksen vaikutus suljetussa tilassa kehittyvään paloon: Kokeellinen todennus ja koetulosten soveltamisesimerkki. (Influence of wood fire retardant treatment on fire development in an enclosed space: experimental verification and an application example). Palontorjuntatekniikka, Vol. 31, No. 3�4, pp. 109�114 (in Finnish)
Hietaniemi, J., Hakkarainen, T., Huhta, J., Korhonen, T., Siiskonen, J. & Vaari, J. 2002. Ontelotilojen paloturvallisuus � Ontelopalojen tutkimus kokeellisesti ja mallintamalla (Fire safety of cavity spaces � Experimental and simulation study of fires in cavities). Espoo: Valtion teknillinen tutkimuskeskus. 125 p. + app. 63 p. (VTT Tiedotteita - Research Notes 2128). ISBN 951�38�5953�3. (in Finnish)
44
Hietaniemi, J., Vaari, J., Hakkarainen, T., Huhta, J., Jumppanen, U.-M., Korhonen, T., Kouhia, I., Siiskonen, J. & Weckman, H. 2004. Ontelotilojen paloturvallisuus � Ontelo-palojen ominaispiirteet sekä palojen etenemisen rakenteellinen katkaiseminen ja sammuttaminen (Fire safety of cavity spaces - Characteristics of fires in building voids, their structural prevention and extinguishing). Espoo: Valtion teknillinen tutkimus-keskus. 75 p. + app. 23 p. (VTT Tiedotteita - Research Notes). In print. (in Finnish)
ISO 5660-1. 2002. Reaction-to-fire tests � Heat release, smoke production and mass loss - Part 1: Heat release rate (cone calorimeter method). Geneva: International Organization for Standardization. 31 p.
ISO 9705. 1993. Fire tests � Full-scale room test for surface products. Geneva: International Organization for Standardization. 31 p.
Karlsson, B. & Quintiere, J.G. 2000. Enclosure Fire Dynamics. Boca Raton: CRC Press LLC. 315 s. ISBN 0-8493-1300-7
Ma, T.G. & Quintiere, J.G. 2003. Numerical simulation of axi-symmetric fire plumes: accuracy and limitations. Fire Safety Journal, Vol. 38, No. 5, pp. 467 �492
McGrattan K.B., Baum, H.R. & Rehm R.G. 1998. Large eddy simulations of smoke movement. Fire Safety Journal, Vol. 30, No. 2, pp. 161�78.
McGrattan, K.B., Baum, H.R., Rehm, R.G., Hamins, A., Forney, G.P, Floyd, J.E, Hostikka, S. & Prasad, K. 2002. Fire Dynamics Simulator (Version 3) � Technical Reference Guide. Gaithersburg, MA, USA: National Institute of Standards and Technology. 46 p. (NISTIR 6783, 2002 Ed.)
McGrattan, K.B., Forney, G.P, Floyd, J.E, Hostikka, S. & Prasad, K. 2002b. Fire Dynamics Simulator (Version 3) � User's Guide. Gaithersburg, MA, USA: National Institute of Standards and Technology. 76 p. (NISTIR 6784, 2002 Ed.)
Novozhilov, V. 2001. Computational fluid dynamics modeling of compartment fires. 2001. Progress in Energy and Combustion Science, Vol. 27, pp. 611�666.
Ritchie, S.J. Steckler, K.D. Hamins, A. Cleary, T.G. Yang & J.C. Kashiwagi, T. 1997. Effect of Sample Size on the Heat Release Rate of Charring Materials. In: Fire Safety Science. Hasemi, Y. (Ed.). Proceedings of the Fifth International Symposium. March 3�7, 1997, Melbourne, Australia. Boston, MA, USA: International Association for Fire Safety Science. Pp. 177�188.

45
Sundström, B., van Hees, P. & Thureson, P. 1998. Results and Analysis From Fire Tests of Building Products in ISO 9705, the Room/Corner Test. The SBI Research Program. Borås, Sweden: Swedish National Testing and Research Institute. 69 p. (SP Report 1998:11)
Tewarson, A. 1995. Generation of Heat and Chemical Compounds in Fires. In: The SFPE Handbook of Fire Protection Engineering (2nd ed.). Quincy, MA: National Fire Protection Association. Pp. 3-53�3-124.
Tsantaridis, L. & Östman, B. 1999. Mass loss, heat and smoke release for the SBI RR products. In: Interflam '99. Proceedings of the 8th International Interflam Conference. June 29�July 1, 1999. Edinburgh, Scotland. London, England: Interscience Communications Ltd. Pp. 1409�1414.


A1
Appendix A: FDS input data for fuel properties This Appendix summarises the input data concerning fuel pyrolysis and combustion used in the FDS runs in this work.
Spruce timber
Parameters used for the 9 mm thick spruce timber in cone calorimeter, SBI test and room corner test simulations
&MISC REACTION='WOOD_1' / &REAC ID='WOOD_1' FYI='Ritchie, et al., 5th IAFSS, C_3.4 H_6.2 O_2.5' SOOT_YIELD = 0.01 NU_O2 = 3.7 NU_CO2 = 3.4 NU_H2O = 3.1 MW_FUEL = 87. EPUMO2 = 11000. / &SURF ID='SPRUCE' PHASE = 'CHAR' MOISTURE_FRACTION = 0.1 DELTA=0.01 A_PYR=2.6E1 MASS_FLUX_CRITICAL=0.012 TMPIGN=320.0 HEAT_OF_VAPORIZATION=400. DENSITY = 450. KS=0.20 C_P = 1.3 CHAR_DENSITY = 150. KS_CHAR=0.12 C_P_CHAR = 1.5 WALL_POINTS = 30 BACKING = 'INSULATED' or 'EXPOSED'/ NB. BACKING='INSULATED' was used with cone calorimeter. With SBI test simulations, both options BACKING = 'INSULATED' or BACKING = 'EXPOSED' were used. In room corner test simulations we used the option BACKING = 'INSULATED'.

A2
Parameters used for the 22 mm thick spruce timber in modified room corner experiment and in a cavity fire experiment simulations
In the modified room corner test simulation, the following parameters differed from those given above: MOISTURE_FRACTION = 0.08, DELTA = 0.022, DENSITY = 420, KS=0.19 and C_P = 1.2. These values are within 10 % of those used for the 9 mm thick spruce timber which is well within the natural variability of properties for a certain wood species.
In the simulation of a fire in a cavity lined with 22 mm thick spruce timber, the following parameters differed from those used for the 9 mm panel in the standard tests: MOISTURE_FRACTION = 0.13, DELTA=0.022, TMPIGN=330.0, KS=0.22 and C_P = 1.4. Again, these values are within 10 % from those used for the 9 mm spruce timber.
Medium density fibre (MDF) board, 12 mm
&MISC REACTION='MDF_1' / &REAC ID='MDF_1' SOOT_YIELD = 0.01 NU_O2 = 3.7 NU_CO2 = 3.4 NU_H2O = 3.1 MW_FUEL = 87. EPUMO2 = 11000. / &SURF ID='MDF' PHASE = 'CHAR' MOISTURE_FRACTION = 0.1 DELTA=0.012 A_PYR=2.6E1 MASS_FLUX_CRITICAL=0.012 TMPIGN=320.0 HEAT_OF_VAPORIZATION=400. DENSITY = 700. KS=0.15 C_P = 1.5 CHAR_DENSITY =80. KS_CHAR=0.20 C_P_CHAR = 2.5 WALL_POINTS = 30 BACKING = 'INSULATED' or 'EXPOSED'/
A3
NB. BACKING='INSULATED' was used with cone calorimeter. With SBI test simulations, both options BACKING = 'INSULATED' or BACKING = 'EXPOSED' were used. In room corner test simulations we used the option BACKING = 'INSULATED'.
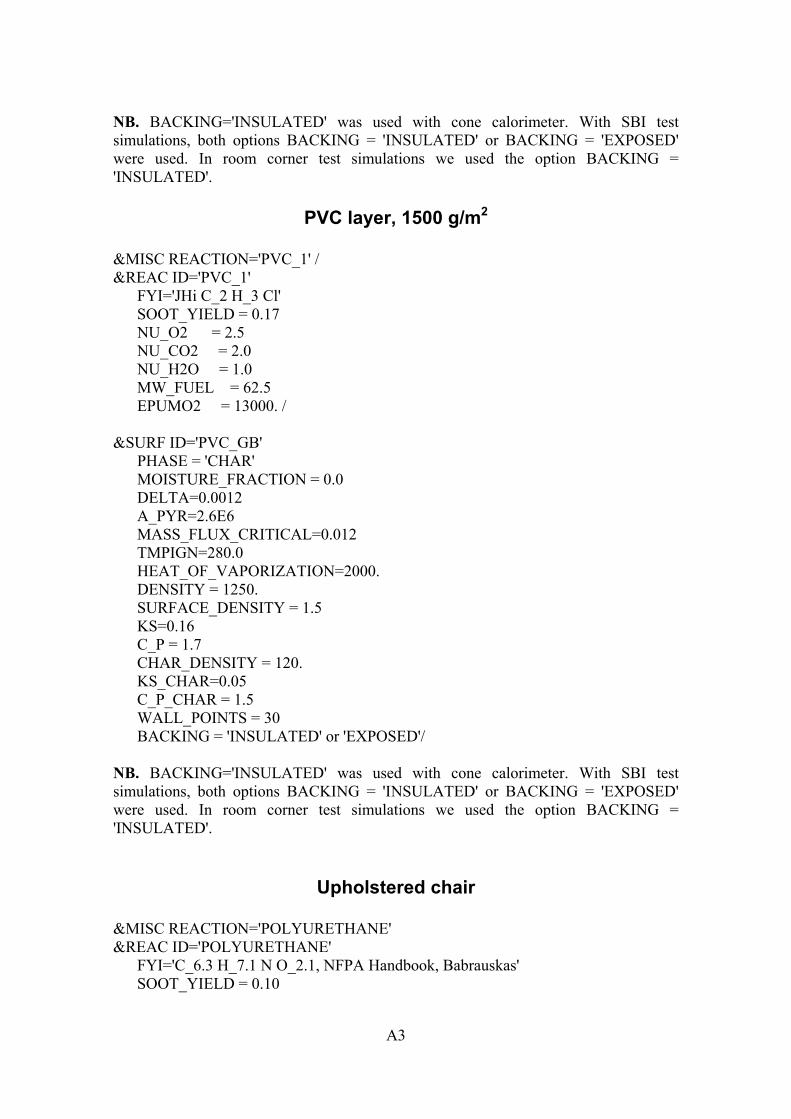
PVC layer, 1500 g/m2
&MISC REACTION='PVC_1' / &REAC ID='PVC_1' FYI='JHi C_2 H_3 Cl' SOOT_YIELD = 0.17 NU_O2 = 2.5 NU_CO2 = 2.0 NU_H2O = 1.0 MW_FUEL = 62.5 EPUMO2 = 13000. / &SURF ID='PVC_GB' PHASE = 'CHAR' MOISTURE_FRACTION = 0.0 DELTA=0.0012 A_PYR=2.6E6 MASS_FLUX_CRITICAL=0.012 TMPIGN=280.0 HEAT_OF_VAPORIZATION=2000. DENSITY = 1250. SURFACE_DENSITY = 1.5 KS=0.16 C_P = 1.7 CHAR_DENSITY = 120. KS_CHAR=0.05 C_P_CHAR = 1.5 WALL_POINTS = 30 BACKING = 'INSULATED' or 'EXPOSED'/ NB. BACKING='INSULATED' was used with cone calorimeter. With SBI test simulations, both options BACKING = 'INSULATED' or BACKING = 'EXPOSED' were used. In room corner test simulations we used the option BACKING = 'INSULATED'.
Upholstered chair
&MISC REACTION='POLYURETHANE' &REAC ID='POLYURETHANE' FYI='C_6.3 H_7.1 N O_2.1, NFPA Handbook, Babrauskas' SOOT_YIELD = 0.10

A4
MW_FUEL = 130.3 FUEL_N2 = 0.5 NU_CO2 = 6.3 NU_H2O = 3.55 NU_O2 = 7.025 / &SURF ID='code_21_G_100mm' MOISTURE_FRACTION = 0.0 DELTA=0.10 BURNING_RATE_MAX = 0.02 TMPIGN=600.0 HEAT_OF_VAPORIZATION=1750. HEAT_OF_COMBUSTION=33280. DENSITY = 28. KS=0.05 C_P = 1.7 WALL_POINTS = 30 BURN_AWAY = .TRUE. BACKING = 'INSULATED'/ &SURF ID='code_21_G_50mm' MOISTURE_FRACTION = 0.0 DELTA=0.05 BURNING_RATE_MAX = 0.02 TMPIGN=600.0 HEAT_OF_VAPORIZATION=1750. HEAT_OF_COMBUSTION=33280. DENSITY = 28. KS=0.05 C_P = 1.7 WALL_POINTS = 30 BURN_AWAY = .TRUE. BACKING = 'INSULATED'/
PE/XLPE cable sheathing and filling material
&MISC REACTION='PE_1' / &REAC ID='PE_1' FYI='C_2 H_4, Drysdale p. 11' SOOT_YIELD = 0.01 NU_O2 = 3.0 NU_CO2 = 2.0 NU_H2O = 2.0 MW_FUEL = 28. EPUMO2 = 13000. / &SURF ID='PE_Cable'

A5
DELTA=0.01 RGB = 0.70,0.10,0.00 HEAT_OF_VAPORIZATION= 1750. HEAT_OF_COMBUSTION= 43600. BURNING_RATE_MAX = 0.031 DENSITY = 920. TMPIGN=370. KS=0.26 C_P=2.1 BACKING = 'EXPOSED' / NB. Only the top and bottom surfaces of the FDS model cables with square cross section were as combustible material using the parameters given above. The side surfaces were taken to be non-combustible by assigning the value of 5000 °C to the ignition temperature.
Heptane
&REAC ID='HEP_1' FYI='HEPU, C_7 H_16' MW_FUEL=100. NU_O2=11. NU_CO2=7. NU_H2O=8. CO_YIELD=0.010 SOOT_YIELD=0.037 RADIATIVE_FRACTION=0.00 / &SURF ID='HEP_1' RGB = 0.40,0.40,0.40 HEAT_OF_VAPORIZATION=316. HEAT_OF_COMBUSTION=46112 BURNING_RATE_MAX=100.0 PHASE='LIQUID' DELTA=0.1 KS=0.16 ALPHA=7.4E-8 TMPIGN=98. /

B1
Appendix B: Progress during the whole wooden cavity fire experiment
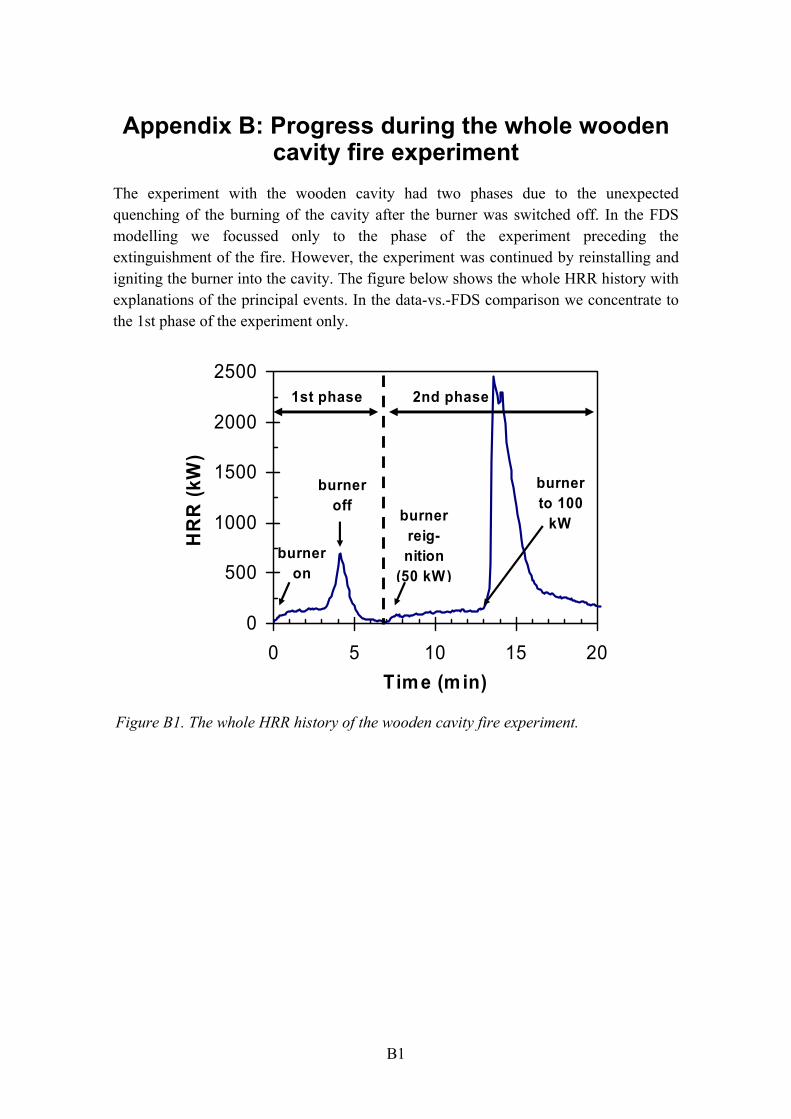
The experiment with the wooden cavity had two phases due to the unexpected quenching of the burning of the cavity after the burner was switched off. In the FDS modelling we focussed only to the phase of the experiment preceding the extinguishment of the fire. However, the experiment was continued by reinstalling and igniting the burner into the cavity. The figure below shows the whole HRR history with explanations of the principal events. In the data-vs.-FDS comparison we concentrate to the 1st phase of the experiment only.
0
500
1000
1500
2000
2500
0 5 10 15 20Time (m in)
HR
R (k
W)
1st phase 2nd phase
burneroff
burneron
burnerreig-nition
(50 kW)
burnerto 100
kW
Figure B1. The whole HRR history of the wooden cavity fire experiment.

ISBN 951�38�6556�8 (URL: http://www.vtt.fi/inf/pdf/) ISSN 1459�7683 (URL: http://www.vtt.fi/inf/pdf/)